- Collection:
- Georgia Government Publications
- Title:
- Trends in pulmonary disease physicians 1996-2006
- Creator:
- Georgia Board for Physician Workforce
- Contributor to Resource:
- Georgia. Department of Community Health. Georgia Board for Physician Workforce
- Publisher:
- Atlanta, Ga. : Georgia Board for Physician Workforce
- Date of Original:
- 2010-02
- Subject:
- Pulmonologists--Supply and demand--Georgia
Pulmonologists--Georgia--Statistics - Location:
- United States, Georgia, 32.75042, -83.50018
- Medium:
- chorochromatic maps
bar graphs
graphs - Type:
- Text
- Format:
- application/pdf
- Description:
- Fact sheet
- External Identifiers:
- Call Number GA C910 .M1 2010 P8
- Metadata URL:
- https://dlg.galileo.usg.edu/id:dlg_ggpd_s-ga-bc910-b-pm1-b2010-bp8-belec-p-btext
- Digital Object URL:
- https://dlg.galileo.usg.edu/do:dlg_ggpd_s-ga-bc910-b-pm1-b2010-bp8-belec-p-btext
- Language:
- eng
- Holding Institution:
- University of Georgia. Map and Government Information Library
- Rights:
-

TRENDS IN PULMONARY DISEASE PHYSICIANS 1996-2006 SPECIALTY FACT SHEET SERIES WINTER 2010 (No. 11 of 12)
GEORGIA BOARD FOR PHYSICIAN WORKFORCE
SUPPLY AND DISTRIBUTION OF PULMONARY DISEASE PHYSICIANS
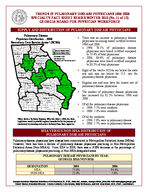
Pulmonary Disease Physician Distribution 2006
Secondary Care Service Areas* (SCSA)
Dade Catoosa
Murray
Fannin
Towns Rabun
Union
Whitfield Walker
Gilmer
White Habersham
Chattooga Gordon
Region 1
0.9
Floyd
Bartow
Pickens
Lumpkin
Region
2
Stephens
1.5 Dawson
Banks Franklin
Hart
Cherokee Forsyth Hall
Jackson Madison Elbert
Below State Rate Above State Rate
GA Rate = 2.9 US Rate = 3.4
Polk Paulding
Haralson
CRobeb gionGw3innett 3D.e8kalb
Barrow Clarke Oglethorpe
Walton Oconee
Region 5
Wilkes
* Physicians per 100,000 population
Lincoln
Carroll
Douglas
Rockdale
Fulton Clayton
Newton
1.5 Morgan Greene Taliaferro
Columbia
McDuffie
Region 7 Coweta
Heard
Henry Fayette
Butts Spalding
Jasper
Warren Putnam
Hancock Glascock
Richmond
Reg2io.0n 4 Region 6 6.6 Troup Meriwether Pike Lamar Monroe
Baldwin Jones
Jefferson Washington
Burke
Harris
Upson
3.0 Bibb
Crawford
Wilkinson
Talbot
Twiggs
Johnson Emanuel
Jenkins
Screven
Taylor
Peach
Muscogee
Bulloch
Region 8 Marion
Houston Bleckley Laurens
Treutlen
Candler
Region 9 Region 12 Chattahoochee
Macon
1.1 Schley
0.7 3.5 Stewart Webster
Sumter
Pulaski Dodge Dooly
Wilcox
Montgomery
Evans
Wheeler
Tatnall Toombs
Effingham Bryan Chatham
Crisp
Telfair
Liberty
Quitman
Terrell Lee
Turner
Ben Hill
Jeff Davis Appling
Long
Randolph
Irwin
Coffee Bacon
Wayne
McIntosh
Clay Calhoun Dougherty Worth
Tift
Region 11
Region 10
Early
Baker
2.5 Mitchell
Miller
Colquitt
Berrien Cook
1.3
Atkinson
Pierce
Ware
Brantley
Glynn
Lanier Clinch
Camden
.
Seminole Decatur
Grady Thomas Brooks Lowndes
Charlton
Echols
.
*State Service Delivery Regions; Effective July 1, 1998, the State Legislature voted to provide regional boundaries for the purpose of consistency in planning and service delivery from State Agencies.
There was an increase in pulmonary disease physicians becoming board certified between 1996 and 2006. o 1996: 78.1% of pulmonary disease
physicians were board certified compared to 73.4% of total physicians. o 2006: 86.6% of pulmonary disease physicians were board certified compared to 83.2% of total physicians.
Eight of the twelve SCSAs are below the state rate and nine are below the U.S. rate for pulmonary disease physicians.
Regions one and nine have the lowest rate of pulmonary disease physicians.
The number of pulmonary disease physicians has increased by 82.2% between 1996 and 2006.
Of all the pulmonary disease physicians: o 1996: 5.5% were residents o 2006: 2.3% were residents
Of all the residents: o 1996: 1.0% were in pulmonary disease o 2006: 1.7% were in pulmonary disease
MSA VERSUS NON-MSA DISTRIBUTION OF PULMONARY DISEASE PHYSICIANS
Pulmonary disease physicians have always been concentrated in Metropolitan Statistical Areas (MSAs). However, there has been a decline of pulmonary disease physicians practicing in Non-Metropolitan Statistical Areas (Non-MSA's). From 2004 to 2006, there was a 16.8% decrease in the percentage of pulmonary disease physicians practicing in Non-MSA designated areas.
PULMONARY DISEASE PHYSICIANS BY YEAR: GEORGIA MSA/NON-MSA
DESIGNATION MSA
NON-MSA
2004 77.6% 22.4%
2006 94.4% 5.6%
Georgia Board for Physician Workforce 1718 Peachtree St., N.W., Suite 683, Atlanta, Georgia 30309, (404) 206-5420 www.gbpw.georgia.gov Cherri Tucker, Executive Director. Colette Caldwell, Carla Graves, Kelly McNamara, and G.E. Alan Dever, M.D., Ph.D., contributors.
DEMOGRAPHICS
Pulmonary Disease Physicians
By Gender
100
93.8%
83.1%
80
Pulmonary Disease Physicians By Race
100 94.7%
80
71.8%
60
60
40
16.9%
20
6.2%
0 Male
Female
1996 2006
40
20
0 White
11.2%
8.5%
8.5%
1.5%
3.0%
0.8%
Black
Asian
1996 2006
Other
Since 1996, there has been a 10.7% increase in the number of female pulmonary disease physicians practicing in Georgia. Additionally, the percentage of black physicians has increased by 9.7%, while the percentage of white pulmonary disease physicians has decreased by 22.9% since 1996.
Percentage of Pulmonary Disease Physicians
and Total Physicians Age 55 and Older
1996 and 2006
30
23.0% 23.5%
26.3% 21.6%
20
The percentage of pulmonary disease
physicians age 55 and older decreased by 1.4% between 1996 and 2006.
10
0 1996
2006
Pulmonary Disease Total Physicians
However, the percentage of total
practicing physicians age 55 and older increased by 2.8% during the same time period.
TRENDS IN THE NUMBER AND RATE OF PULMONARY DISEASE PHYSICIANS
Overall, the NUMBER of pulmonary disease physicians practicing in Georgia has increased from 1996 to 2006. From 1996 to 2006, the total number increased by 120. The RATE for pulmonary disease physicians has increased since 2002. The rate decreased from 1996-2002 and then increased slightly in 2004. Between 2004 and 2006, the rate increased from 1.8 to 2.9.
Total Number
300
266
250
200 146 147 157
150
165 143
100
50
Rate per 100,000 Population 4
3
2.9
2.0
2
1.9 1.9 1.6 1.8
1
0 1996 1998 2000 2002 2004 2006
0 1996 1998 2000 2002 2004 2006