- Collection:
- Georgia Government Publications
- Title:
- Characteristics of resident physicians in training during 1996 & 2006 : fall 2009
- Creator:
- Georgia. Board for Physician Workforce
- Contributor to Resource:
- Georgia. Department of Community Health. Georgia Board for Physician Workforce
- Publisher:
- Atlanta, Ga. : Georgia. Department of Community Health. Georgia Board for Physician Workforce
- Date of Original:
- 2009-09
- Subject:
- Residents (Medicine)--Georgia--Statistics
Medicine--Specialties and specialists--Georgia--Statistics - Location:
- United States, Georgia, 32.75042, -83.50018
- Medium:
- tables (documents)
bar graphs - Type:
- Text
- Format:
- application/pdf
- External Identifiers:
- Call Number GA C910 .M1 2009 C46
- Metadata URL:
- https://dlg.galileo.usg.edu/id:dlg_ggpd_s-ga-bc910-b-pm1-b2009-bc46-belec-p-btext
- Digital Object URL:
- https://dlg.galileo.usg.edu/do:dlg_ggpd_s-ga-bc910-b-pm1-b2009-bc46-belec-p-btext
- Language:
- eng
- Holding Institution:
- University of Georgia. Map and Government Information Library
- Rights:
-

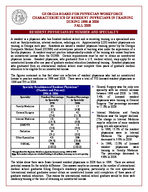
GEORGIA BOARD FOR PHYSICIAN WORKFORCE CHARACTERISTICS OF RESIDENT PHYSICIANS IN TRAINING
DURING 1996 & 2006 FALL 2009
RESIDENT PHYSICIANS BY NUMBER AND SPECIALTY
A resident is a physician who has finished medical school and is receiving training in a specialized area such as: family medicine, internal medicine, radiology, etc. Approximately 2,000 resident physicians are training in Georgia each year. Residents are issued a resident physician training permit by the Georgia Composite Medical Board (GCMB) and actively see patients at teaching sites under the supervision of a faculty physician. A resident may not practice independently outside of the training site unless they have an unrestricted license from the GCMB. Certain requirements must be met to obtain an unrestricted physician license. Resident physicians, who graduated from a U.S. medical school, may apply for an unrestricted license after one year of graduate medical education (residency) training. Resident physicians who graduated from an international medical school must complete three years of graduate medical education to be eligible for an unrestricted license.
The figures contained in this fact sheet are reflective of resident physicians who had an unrestricted license to practice medicine in 1996 and 2006. There were a total of 772 licensed resident physicians in 1996 and 355 in 2006.
Specialty Breakdown of Resident Physicians*
General Surgery was the only core
(Number and Percent)
specialty with an overall increase
1996 & 2006
between 1996 and 2006. In 1996,
Specialty
Number/Percentage Number/Percentage
7.4% of licensed resident
in Specialty
in Specialty
physicians were training in General
1996
2006
Surgery. That percentage increased
Family Medicine
95 (12.3)
17
to 11.3% in 2006.
(4.8)
General Surgery
57
40
Internal Medicine and Family
(7.4)
(11.3)
Medicine saw the largest declines.
Internal Medicine OB/GYN Pediatrics
Other Specialties TOTAL
121 (15.7)
54 (7.0) 24 (3.1) 421 (54.5) 772
21 (5.9) 12 (3.4)
7 (2.0) 258 (72.6) 355
(The change in Internal Medicine may be reflective of more residents going into sub-specialties.) In 1996, 15.7% of the resident
physicians were in Internal Medicine. The percentage decreased to 5.9% in 2006.
In 1996, 12.3% of licensed
(100.0)
(100.0)
resident physicians were
*Georgia Board for Physician Workforce physician licensure survey; 1996 & 2006 Note: Each number and percent calculated looking at all residents, how many are in each specialty.
training in Family Medicine. The percentage decreased to
4.8% in 2006.
The tables show there were fewer licensed resident physicians in 2006 than in 1996. There are several potential reasons for the notable difference. One answer may be an increase in the number of international medical school graduates filling Georgia's residency programs, particularly in the core specialties. International medical graduates cannot obtain an unrestricted license until completion of three years of graduate medical education. This means the international medical school graduate would be done with residency training at the time of obtaining an unrestricted license.
Another possibility may be generational differences among resident physicians. In years past, it was not uncommon for a U.S. medical school graduate to obtain an unrestricted license after one year in order to "moonlight" or work outside the training site for additional money. Today's generation of new physicians seems to be more interested in family time.
The table below looks at the core specialties and what proportion of the licensed physicians are residents.
Proportion of Residents* by Specialty
(Number and Percent)
1996 & 2006
Specialty
Percentage of
Percentage of
Residents in
Residents in
Specialty 1996 Specialty 2006
Family Medicine
95
17
(5.0)
(0.8)
General Surgery
57
40
(8.2)
(6.2)
Internal Medicine
121
21
(7.0)
(0.9)
OB/GYN
54
12
(6.1)
(1.2)
Pediatrics
24
7
(2.5)
(0.5)
Other Specialties
421
258
(3.0)
(1.5)
TOTAL
772
355
(5.6)
(2.0)
*Georgia Board for Physician Workforce physician licensure survey; 1996 & 2006 Note: Number and percentage were calculated by determining how many licensed physicians in each specialty were residents.
The decrease in the number of resident physicians translates into residents representing a smaller proportion of the licensed physicians in their specialty.
For example: In 1996, 5% (95) of physicians licensed in Family Medicine were residents. That percentage and corresponding number decreased to .8% (17) in 2006.
As shown in the previous table, General Surgery was the only core specialty with an increase in resident physicians. However, the overall proportion of General Surgeons in a residency setting followed the same pattern of decline as other core specialties between 1996 and 2006.
DEMOGRAPHICS OF RESIDENT PHYSICIANS
The following table compares the percentage of male and female resident physicians, by specialty, for 1996 and 2006.
Percentage
Percentage of Resident Physicians By Gender, By Specialty 1996 & 2006
100
91.2 75.0 67.9 72.9
76.5 23.5
52.4 47.6
54.2 45.8
57.1 42.9 44.4
55.6 25.0
75.0
90
80
64.2 35.8
64.7 35.3
70
60
50
40
30
20
10
0
Family Medicine
Internal Medicine
Pediatrics
OB/GYN General Surgery Other Specialties
8.8 25.0 32.1 27.1
1996 Male
1996 Female
2006 Male
2006 Female
In 2006, thirty percent (30%) of resident physicians indicated they were black, Asian, or "other" race (up from 20% in 1996).
The most significant increase was found in the "other" race category. The percentage increased by 7.9% between 1996 and 2006 (from 0.9% in 1996 to 8.8% in 2006).
The percentage of black resident physicians remained consistent between 1996 and 2006.
Percentage
Percentage of Resident Physicians by Race All Specialties Combined 1996 & 2006
100
90 80.4
80
70.4
70
60
50
40
30
20
9.8 9.6
9.3 11.2
8.8
10
0.9
0
White
Black
Asian
Other
1996 2006
Percentage
Percentage of Resident Physicians by Age and Specialty 1996 & 2006
70.5 29.5
53.3 46.7
78.5 21.5
87.5 12.5
83.3 16.7
71.4 28.6
88.9 11.1
100
100 90 80 70 60 50 40 30 20 10 0
FM 1996 FM 2006 IM 1996 IM 2006
PEDS 1996
26.8 20.5
26.3 20.8
73.2 79.5
73.7 79.2
PEDS 2006
OB/GYN OB/GYN GS 1996 GS 2006 OTHER OTHER
1996
2006
SPEC SPEC
1996
2006
< 35 > 35
The majority of resident physicians, regardless of specialty, were age 35 and under in 1996 and 2006.
From 1996 to 2006, there was an increase in the percentage of residents age 35 and older in the specialties of Pediatrics and Family Medicine. The percentage of Pediatric residents age 35 and older increased from 16.7% to 28.6% and Family Medicine from 29.5% to 46.7%.
The specialty of Family Medicine had the greatest percentage of residents age 35 or older in both 1996 and 2006.
Georgia Board for Physician Workforce 1718 Peachtree St., N.W., Suite 683, Atlanta, Georgia 30309, (404) 206-5420 www.gbpw.georgia.gov Cherri Tucker, Executive Director. Colette Caldwell, Carla Graves, Kelly McNamara, and G.E. Alan Dever, M.D., Ph.D., contributors.