- Collection:
- Georgia Government Publications
- Title:
- Characteristics, specialty mix, & distribution of the physician workforce : February 2005
- Creator:
- Georgia. Board for Physician Workforce
- Contributor to Resource:
- Georgia. Department of Community Health. Georgia Board for Physician Workforce
- Publisher:
- Atlanta, Ga. : Georgia. Department of Community Health. Georgia Board for Physician Workforce
- Date of Original:
- 2005-02
- Subject:
- Physicians--Georgia--Statistics
Minorities in medicine--Georgia--Statistics
Cultural pluralism--Georgia
Medicine--Specialties and specialists--Georgia - Location:
- United States, Georgia, 32.75042, -83.50018
- Medium:
- tables (documents)
circular graphs - Type:
- Text
- Format:
- application/pdf
- External Identifiers:
- Call Number GA C910 .M1 2005 C45
- Metadata URL:
- https://dlg.galileo.usg.edu/id:dlg_ggpd_s-ga-bc910-b-pm1-b2005-bc45-belec-p-btext
- Digital Object URL:
- https://dlg.galileo.usg.edu/do:dlg_ggpd_s-ga-bc910-b-pm1-b2005-bc45-belec-p-btext
- Language:
- eng
- Holding Institution:
- University of Georgia. Map and Government Information Library
- Rights:
-

Georgia Board for Physician Workforce
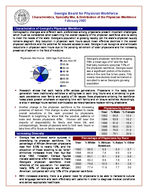
Characteristics, Specialty Mix, & Distribution of the Physician Workforce February 2005
Characteristics of Georgia's Physician Workforce
Demographic changes and different work preferences among physicians present important challenges, which must be considered when examining the overall capacity of the physician workforce and its ability to meet the needs of the state. Georgia's population is growing rapidly, yet the state's physician supply remains stagnant. Any reduction in physician work hours would mean effective declines in the overall physician workforce and the potential for reduced access to care. Georgia must recognize and anticipate reductions in physician work hours due to the pending retirement of older physicians and the increasing presence of women in the field of medicine.
Physician Workforce: 2002 Age Distribution Less than 35
8.6% 6.8%
9.9%
10.2% 14.7%
35-39 40-44 45-49
50-54
14.0%
17.4%
55-59
18.5%
60-64
65+
Georgia's physician workforce is aging. With a mean age of 47 and the fact that baby boomers comprise 75% of the physician workforce, Georgia could see a significant portion of its doctors retire in the next five to ten years. This means new doctors must be trained or recruited to serve Georgia's growing population.
Research shows that work habits differ across generations. Physicians in the baby boom generation have traditionally exhibited a willingness to work long hours and a tendency to give work precedence over family and quality of life issues. New physicians entering the workforce today place greater emphasis on spending time with family and on leisure activities. Accordingly, a drop in average hours worked is anticipated as new physicians replace retiring physicians.
Another change in the physician workforce is the increasing
presence of women. This change is also anticipated to cause overall reductions in the work provided by physicians. Research is beginning to show that the practice patterns of male and female physicians differ. Women still bear the
Physicians by Gender
Year % Male % Female
1992 84.6
15.4
1994 83.8
16.2
majority of responsibility for family and home life, and
1996 81.6
18.4
correspondingly, female physicians tend to limit work hours or
1998 80.0
20.0
take time off to focus on family responsibilities.
2000 79.0
21.0
Increasing Diversity
2002 79.1
20.9
Georgia has achieved some success in diversifying its physician workforce. The percentage of African-American physicians rose from 6.5% to nearly 12%, and the proportion of those reporting to be "other"
Percentage of Physicians by Race
Year 1992
% White % African % Asian % Other American
86.5
6.5
6.3
0.7
ethnicities increased more than four-fold 1994 84.9
7.6
since 1992. However, Census figures 1996 84.1
8.1
indicate additional effort is needed to make 1998
80.2
8.9
Georgia's physician workforce more reflective of the population. For example,
2000
79.0
10.3
nearly 30% of Georgians are African- 2002 77.4
11.9
American, compared with only 12% of the physician workforce.
6.6
0.9
6.9
0.9
7.8
3.1
8.1
2.6
7.7
3.0
With increased diversity, there is a greater need for physicians to be able to transcend cultural and language barriers and work effectively with patients in order to diagnose medical conditions and deliver appropriate healthcare.
Specialty Mix and Distribution of Physicians
Georgia has experienced considerable growth in most primary care specialties over the last decade; however, challenges with the geographic distribution of physicians persist. Physician distribution remains more favorable in urban than rural parts of the state. This issue is of critical importance to Georgians, since the distribution of physicians helps determine access to healthcare.
The rate of physicians in five core specialties varies significantly between Metropolitan Statistical Areas (MSA's) and NonMSA's.
For example, the rate of Pediatricians per 100,000 population is more than 8.7 times greater in Georgia's MSA's than Non-MSA's.
Georgia Physician Workforce 2002 Selected Specialties by MSA/ Non-MSA Designation
Specialty
Family Practice Internal Medicine
Pediatrics OB/GYN General Surgery
MSA
Number Rate*
1,650
19.3
2,167
25.3
1,348
15.7
973
11.4
615
7.2
Non-MSA
Number Rate*
521
6.1
342
4.0
147
1.8
165
1.9
111
1.3
While Georgia's supply of primary care physicians has increased over the last ten years, there have been declines in the per capita rates of other specialties as highlighted in the table below. These declines indicate an emerging shortage for certain specialties, including the core specialty of General Surgery.
Physicians per 100,000 Population for Select Specialties
Specialty Allergy & Immunology
1992-2002
1992 1994 1.02 1.05
1996 0.98
1998 2000 0.83 0.87
Anesthesiology
9.06 10.48 10.22 9.84 9.56
Cardiovascular Diseases
4.94 5.54 5.45 4.83 4.73
Diagnostic Radiology
3.15 3.82 4.16 4.07 3.24
Emergency Medicine
6.31 7.74 7.84 8.41 8.94
Family/General Practice
22.52 25.04 26.27 26.52 26.18
Gastroenterology
2.57 2.77 2.73 2.55 2.65
General Surgery
8.63 9.29 9.59 9.26 9.42
Internal Medicine
18.34 20.08 23.83 25.79 27.66
Nephrology
1.38 1.45 1.51 1.41 1.28
Neurological Surgery
1.59 1.58 1.54 1.53 1.34
Neurology
2.60 2.99 3.37 3.35 3.19
Obstetrics/Gynecology
10.22 11.63 12.25 11.82 12.04
Oncology
1.44 1.74 1.69 1.57 1.58
Orthopedic Surgery
6.32 6.99 7.62 7.20 6.79
Pediatrics
10.61 11.77 13.37 16.75 17.13
Psychiatry
8.49 10.21 11.42 11.04 11.14
Pulmonary Diseases
1.70 2.10 2.03 1.92 1.92
Radiology
4.61 4.85 5.13 4.89 5.86
Rheumatology
0.74 0.92 0.83 0.76 0.75
Thoracic Surgery
0.49 0.59 0.49 0.42 0.43
Urological Surgery
3.32 3.59 3.44 3.42 3.04
Total Rate of Physicians per 100,000 Population in GA
164
182
192
193 192
For more information, please contact the Georgia Board for Physician Workforce at (404) 206-5420 or 1718 Peachtree St, NW, Suite 683, Atlanta, Georgia 30309
2002 1.24 8.93 4.28 3.17 8.81 25.36 2.10 8.48 29.30 1.43 1.39 3.22 13.29 1.75 6.89 17.46 10.45 1.67 5.15 0.60 1.08 3.06 193