- Collection:
- Georgia Government Publications
- Title:
- Inmate statistical profile: active lifers, Nov. 2003
- Creator:
- Georgia. Department of Corrections. Planning and Analysis Section
- Publisher:
- Atlanta, GA. : Georgia Dept. of Corrections, Office of Planning and Analysis, 2003-11
- Date of Original:
- 2003-11
- Subject:
- Prisoners--Georgia
- Location:
- United States, Georgia, 32.75042, -83.50018
- Medium:
- state government records
- Type:
- Text
- Format:
- application/pdf
- External Identifiers:
- Call Number GA R300.P5 P1 L5 2003/11
- Metadata URL:
- https://dlg.galileo.usg.edu/id:dlg_ggpd_i-ga-br300-pp5-bp1-bl5-b2003-s11-belec-p-btext
- Digital Object URL:
- https://dlg.galileo.usg.edu/do:dlg_ggpd_i-ga-br300-pp5-bp1-bl5-b2003-s11-belec-p-btext
- Language:
- eng
- Holding Institution:
- University of Georgia. Map and Government Information Library
- Rights:
-

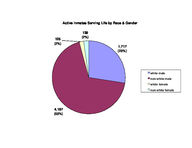
Active Inmates Serving Life by Race & Gender
125 (2%)
139 (2%)
1,717 (28%)
4,197 (68%)
white male non-white male white female non-white female
4000 3500 3000 2500 2000 1500 1000
500 0
3,930 (64%)
zero
Prior Incarcerations by Active Inmates Serving Life
1,127 (18%)
586 (9%)
one
two
329 (5%)
three
129 (2%)
four
77 (1%)
five or more
Active Inmates Serving Life by Crime Type
28 (<1%) 118 (2%)
24 (<1%)
799 (13%)
23 (<1%)
5,186 (84%)
viol/persn property drug sales drug possn sex offend other
Georgia Department of Corrections Page 1 Run 11/18/03 15:08 pm
Office of Planning and Analysis
Inmate statistical profile TABLE OF CONTENTS FOR ACTIVE PRISONERS SERVING LIFE EXCLUDING JAIL
Title
PAGE
-----
----
RACE AND SEX............................ 2
Culture Fair IQ Scores.................. 3
Self-Rpt Socioeconomic Class............ 4
Self-Rpt Environment To Age 16.......... 5
Self-Rpt Education Level................ 6
Functional Reading Level (WRAT Scores).. 7
Functional Math Level (WRAT Scores)..... 8
Functional Spelling Level (WRAT Scores). 9
Self-Rpt Guardian Status To Age 16......10
Self-Rpt Employment Status Before Prison11
Self-Rpt Marital Status At Admission....12
Self-Rpt Number Of Children At Admission13
Self-Rpt Religious Affiliation..........14
Self-Rpt Family Behavior Patterns *.....15
Inmate Diagnostic Behavior Problem *....16
Physical Profile (General Condition)....17
Security Status.........................18
Number Of Sentences.....................19
Number Of Disciplinaries................20
Number Of Escapes.......................21
Number Of Prior Georgia Incarcerations *22
Number Of Transfers.....................23
County Of Conviction....................24
Circ Of Conviction......................29
Home County.............................31
Prison Sentence In Years................36
Probation To Follow Prison..............37
Admission Type..........................38
Release Type............................39
Inst By Group...........................40
Institution.............................41
Misdemeanors And Felonies...............43
Crimes By Group.........................44
Most Serious Offense....................45
Most Serious Crime Type.................47
Page 2 Run 11/18/03 15:08 pm
Georgia Department of Corrections Office of Planning and Analysis
Inmate statistical profile
Sample: ACTIVE PRISONERS SERVING LIFE EXCLUDING JAIL
Requestor: Statistics
Active inmates 11/18/2003
RACE AND SEX by current age & sex
|
MEN
|
WOMEN
|
| Age | Age | Age | Age | Men
| Age | Age | Age | Age |Women
|Grand
RACE AND SEX
|00-21 %|22-39 %|40-54 %|55-99 %|Total % |00-21 %|22-39 %|40-54 %|55-99 %|Total % |Total %
------------------------------------------------------------------------------------------------------------------------------------
WHITE MALE
| 25 21| 632 22| 770 33| 290 49| 1717 29 | 0 0| 0 0| 0 0| 0 0| 0 0 | 1717 28
NON WHITE MALE
| 94 79| 2229 78| 1570 67| 304 51| 4197 71 | 0 0| 0 0| 0 0| 0 0| 0 0 | 4197 68
WHITE FEMALE
| 0 0| 0 0| 0 0| 0 0| 0 0 | 1 11| 51 40| 54 54| 19 66| 125 47 | 125 2
NON WHITE FEMALE | 0 0| 0 0| 0 0| 0 0| 0 0 | 8 89| 75 60| 46 46| 10 34| 139 53 | 139 2
------------------------------------------------------------------------------------------------------------------------------------
Total reported
| 119 100| 2861 100| 2340 100| 594 100| 5914 100 | 9 100| 126 100| 100 100| 29 100| 264 100 | 6178 100
|
|
|
|
|
|
|
|
|
|
|
Percent reported | 100.0| 100.0| 100.0| 100.0| 100.0 | 100.0| 100.0| 100.0| 100.0| 100.0 | 100.0
|
|
|
|
|
|
|
|
|
|
|
|
|
|
|
|
|
|
|
|
|
|
NOT REPORTED
|0|0|0|0|0
|0|0|0|0|0
|0
------------------------------------------------------------------------------------------------------------------------------------
Total
| 119 | 2861 | 2340 | 594 | 5914
| 9 | 126 | 100 | 29 | 264
| 6178
|
|
|
|
|
|
|
|
|
|
|
|
|
|
|
|
|
|
|
|
|
|
|
|
|
|
|
|
|
|
|
|
|
|
|
|
|
|
|
|
|
|
|
|
|
|
|
|
|
|
|
|
|
|
|
AVERAGE AGE
| 20.18 | 31.26 | 46.05 | 60.50 | 39.83 | 20.11 | 31.20 | 46.14 | 62.00 | 39.86 | 39.83
Page 3 Run 11/18/03 15:08 pm
Georgia Department of Corrections Office of Planning and Analysis
Inmate statistical profile
Sample: ACTIVE PRISONERS SERVING LIFE EXCLUDING JAIL
Requestor: Statistics
Active inmates 11/18/2003
Culture Fair IQ Scores by current age & sex
|
MEN
|
WOMEN
|
| Age | Age | Age | Age | Men
| Age | Age | Age | Age |Women
|Grand
IQ Score
|00-21 %|22-39 %|40-54 %|55-99 %|Total % |00-21 %|22-39 %|40-54 %|55-99 %|Total % |Total %
------------------------------------------------------------------------------------------------------------------------------------
LESS THAN 70
| 5 5| 72 3| 158 7| 55 10| 290 5 | 1 13| 10 8| 10 10| 5 21| 26 10 | 316 5
70 AND UP
| 100 95| 2650 97| 2019 93| 482 90| 5251 95 | 7 88| 113 92| 88 90| 19 79| 227 90 | 5478 95
------------------------------------------------------------------------------------------------------------------------------------
Total reported
| 105 100| 2722 100| 2177 100| 537 100| 5541 100 | 8 100| 123 100| 98 100| 24 100| 253 100 | 5794 100
|
|
|
|
|
|
|
|
|
|
|
Percent reported |
88.2|
95.1|
93.0|
90.4|
93.7 |
88.9|
97.6|
98.0|
82.8|
95.8 |
93.8
|
|
|
|
|
|
|
|
|
|
|
|
|
|
|
|
|
|
|
|
|
|
NOT REPORTED
| 14 | 139 | 163 | 57 | 373
| 1 | 3 | 2 | 5 | 11
| 384
------------------------------------------------------------------------------------------------------------------------------------
Total
| 119 | 2861 | 2340 | 594 | 5914
| 9 | 126 | 100 | 29 | 264
| 6178
|
|
|
|
|
|
|
|
|
|
|
|
|
|
|
|
|
|
|
|
|
|
|
|
|
|
|
|
|
|
|
|
|
|
|
|
|
|
|
|
|
|
|
|
|
|
|
|
|
|
|
|
|
|
|
AVERAGE IQ
| 98.39 | 101.33 | 97.81 | 94.63 | 99.24 | 90.25 | 96.83 | 91.22 | 84.00 | 93.23 | 98.98
Page 4 Run 11/18/03 15:08 pm
Georgia Department of Corrections Office of Planning and Analysis
Inmate statistical profile
Sample: ACTIVE PRISONERS SERVING LIFE EXCLUDING JAIL
Requestor: Statistics
Active inmates 11/18/2003
Self-Rpt Socioeconomic Class by current age & sex
|
MEN
|
WOMEN
|
| Age | Age | Age | Age | Men
| Age | Age | Age | Age |Women
|Grand
Socioeconomic Class |00-21 %|22-39 %|40-54 %|55-99 %|Total % |00-21 %|22-39 %|40-54 %|55-99 %|Total % |Total %
------------------------------------------------------------------------------------------------------------------------------------
WELFARE
| 10 9| 299 11| 235 10| 35 6| 579 10 | 2 22| 22 17| 7 7| 0 0| 31 12 | 610 10
OCC EMPLOY
| 5 4| 180 7| 72 3| 13 2| 270 5 | 0 0| 2 2| 1 1| 1 4| 4 2 | 274 5
MINIMUM STD
| 53 47| 1060 38| 933 41| 306 54| 2352 41 | 3 33| 40 32| 27 28| 13 50| 83 32 | 2435 41
MIDDLE
| 41 37| 1194 43| 1008 45| 212 37| 2455 43 | 4 44| 62 49| 59 60| 12 46| 137 53 | 2592 44
OTHER
| 3 3| 23 1| 10 0| 3 1| 39 1 | 0 0| 0 0| 4 4| 0 0| 4 2 | 43 1
------------------------------------------------------------------------------------------------------------------------------------
Total reported
| 112 100| 2756 100| 2258 100| 569 100| 5695 100 | 9 100| 126 100| 98 100| 26 100| 259 100 | 5954 100
|
|
|
|
|
|
|
|
|
|
|
Percent reported |
94.1|
96.3|
96.5|
95.8|
96.3 | 100.0| 100.0|
98.0|
89.7|
98.1 |
96.4
|
|
|
|
|
|
|
|
|
|
|
|
|
|
|
|
|
|
|
|
|
|
NOT RPTD
| 7 | 105 | 82 | 25 | 219
|0|0|2|3|5
| 224
------------------------------------------------------------------------------------------------------------------------------------
Total
| 119 | 2861 | 2340 | 594 | 5914
| 9 | 126 | 100 | 29 | 264
| 6178
Page 5 Run 11/18/03 15:08 pm
Georgia Department of Corrections Office of Planning and Analysis
Inmate statistical profile
Sample: ACTIVE PRISONERS SERVING LIFE EXCLUDING JAIL
Requestor: Statistics
Active inmates 11/18/2003
Self-Rpt Environment To Age 16 by current age & sex
|
MEN
|
WOMEN
|
| Age | Age | Age | Age | Men
| Age | Age | Age | Age |Women
|Grand
Environment
|00-21 %|22-39 %|40-54 %|55-99 %|Total % |00-21 %|22-39 %|40-54 %|55-99 %|Total % |Total %
------------------------------------------------------------------------------------------------------------------------------------
RURAL/FARM
| 3 3| 90 3| 161 7| 105 18| 359 6 | 0 0| 7 6| 6 6| 4 16| 17 7 | 376 6
RURAL/NFARM
| 1 1| 154 5| 182 8| 54 9| 391 7 | 2 22| 11 9| 7 7| 0 0| 20 8 | 411 7
S.M.S.A
| 52 45| 1191 42| 834 37| 167 29| 2244 39 | 2 22| 23 18| 21 21| 7 28| 53 20 | 2297 38
URBAN
| 26 22| 532 19| 427 19| 81 14| 1066 18 | 2 22| 43 34| 26 26| 4 16| 75 29 | 1141 19
SMALL TOWN
| 34 29| 831 30| 650 29| 169 29| 1684 29 | 3 33| 42 33| 37 37| 10 40| 92 36 | 1776 29
OTHER
| 0 0| 15 1| 13 1| 1 0| 29 1 | 0 0| 0 0| 2 2| 0 0| 2 1 | 31 1
------------------------------------------------------------------------------------------------------------------------------------
Total reported
| 116 100| 2813 100| 2267 100| 577 100| 5773 100 | 9 100| 126 100| 99 100| 25 100| 259 100 | 6032 100
|
|
|
|
|
|
|
|
|
|
|
Percent reported |
97.5|
98.3|
96.9|
97.1|
97.6 | 100.0| 100.0|
99.0|
86.2|
98.1 |
97.6
|
|
|
|
|
|
|
|
|
|
|
|
|
|
|
|
|
|
|
|
|
|
NOT RPTD
| 3 | 48 | 73 | 17 | 141
|0|0|1|4|5
| 146
------------------------------------------------------------------------------------------------------------------------------------
Total
| 119 | 2861 | 2340 | 594 | 5914
| 9 | 126 | 100 | 29 | 264
| 6178
Page 6 Run 11/18/03 15:08 pm
Georgia Department of Corrections Office of Planning and Analysis
Inmate statistical profile
Sample: ACTIVE PRISONERS SERVING LIFE EXCLUDING JAIL
Requestor: Statistics
Active inmates 11/18/2003
Self-Rpt Education Level by current age & sex
|
MEN
|
WOMEN
|
| Age | Age | Age | Age | Men
| Age | Age | Age | Age |Women
|Grand
Education Level
|00-21 %|22-39 %|40-54 %|55-99 %|Total % |00-21 %|22-39 %|40-54 %|55-99 %|Total % |Total %
------------------------------------------------------------------------------------------------------------------------------------
LESS THAN GRADE 7 | 3 3| 54 2| 87 4| 98 17| 242 4 | 0 0| 2 2| 3 3| 5 18| 10 4 | 252 4
GRADE 7
| 4 3| 83 3| 62 3| 40 7| 189 3 | 0 0| 6 5| 3 3| 2 7| 11 4 | 200 3
GRADE 8
| 27 23| 287 10| 197 9| 66 11| 577 10 | 1 11| 17 14| 8 8| 2 7| 28 11 | 605 10
GRADE 9
| 33 28| 453 16| 294 13| 48 8| 828 14 | 5 56| 16 13| 5 5| 1 4| 27 10 | 855 14
GRADE 10
| 23 20| 603 21| 335 15| 64 11| 1025 18 | 3 33| 22 18| 11 11| 5 18| 41 16 | 1066 18
GRADE 11
| 22 19| 565 20| 274 12| 43 7| 904 16 | 0 0| 19 15| 7 7| 1 4| 27 10 | 931 15
GRADE 12
| 1 1| 561 20| 763 33| 150 26| 1475 25 | 0 0| 22 18| 35 36| 8 29| 65 25 | 1540 25
MORE THAN GRADE 12 | 3 3| 221 8| 286 12| 74 13| 584 10 | 0 0| 20 16| 26 27| 4 14| 50 19 | 634 10
------------------------------------------------------------------------------------------------------------------------------------
Total reported
| 116 100| 2827 100| 2298 100| 583 100| 5824 100 | 9 100| 124 100| 98 100| 28 100| 259 100 | 6083 100
|
|
|
|
|
|
|
|
|
|
|
Percent reported |
97.5|
98.8|
98.2|
98.1|
98.5 | 100.0|
98.4|
98.0|
96.6|
98.1 |
98.5
|
|
|
|
|
|
|
|
|
|
|
|
|
|
|
|
|
|
|
|
|
|
NOT REPORTED
| 3 | 34 | 42 | 11 | 90
|0|2|2|1|5
| 95
------------------------------------------------------------------------------------------------------------------------------------
Total
| 119 | 2861 | 2340 | 594 | 5914
| 9 | 126 | 100 | 29 | 264
| 6178
|
|
|
|
|
|
|
|
|
|
|
|
|
|
|
|
|
|
|
|
|
|
|
|
|
|
|
|
|
|
|
|
|
|
|
|
|
|
|
|
|
|
|
|
|
|
|
|
|
|
|
|
|
|
|
AVG EDUCATION LEVEL | 9.48 | 10.78 | 11.35 | 10.06 | 10.90 | 9.22 | 11.31 | 12.76 | 10.61 | 11.71 | 10.94
* NOTE: THE FIELD LABLED "LESS THAN GRADE 7" WAS CORRECTED IN MARCH 1989: MISSING DATA FOR INMATES STILL IN DIAGNOSTICS NOW HAS BEEN REMOVED FROM THIS FIELD AND IDENTIFIED AS "NOT REPORTED" INFORMATION.
Page 7 Run 11/18/03 15:08 pm
Georgia Department of Corrections Office of Planning and Analysis
Inmate statistical profile
Sample: ACTIVE PRISONERS SERVING LIFE EXCLUDING JAIL
Requestor: Statistics
Active inmates 11/18/2003
Functional Reading Level (WRAT Scores) by current age & sex
|
MEN
|
WOMEN
|
| Age | Age | Age | Age | Men
| Age | Age | Age | Age |Women
|Grand
WRAT Reading Score |00-21 %|22-39 %|40-54 %|55-99 %|Total % |00-21 %|22-39 %|40-54 %|55-99 %|Total % |Total %
------------------------------------------------------------------------------------------------------------------------------------
LESS THAN GRADE 6 | 45 42| 954 35| 937 45| 239 47| 2175 40 | 3 38| 38 31| 26 27| 11 44| 78 31 | 2253 40
6TH THRU 8TH GRADE | 19 18| 641 24| 454 22| 100 20| 1214 22 | 2 25| 25 20| 21 22| 6 24| 54 21 | 1268 22
GRADE 9
| 9 8| 217 8| 150 7| 31 6| 407 8 | 1 13| 3 2| 6 6| 1 4| 11 4 | 418 7
GRADE 10
| 4 4| 134 5| 72 3| 22 4| 232 4 | 0 0| 5 4| 6 6| 1 4| 12 5 | 244 4
GRADE 11
| 7 7| 123 5| 95 5| 14 3| 239 4 | 0 0| 5 4| 4 4| 1 4| 10 4 | 249 4
GRADE 12
| 16 15| 511 19| 336 16| 91 18| 954 18 | 0 0| 10 8| 6 6| 1 4| 17 7 | 971 17
MORE THAN GRADE 12 | 6 6| 144 5| 43 2| 9 2| 202 4 | 2 25| 37 30| 27 28| 4 16| 70 28 | 272 5
------------------------------------------------------------------------------------------------------------------------------------
Total reported
| 106 100| 2724 100| 2087 100| 506 100| 5423 100 | 8 100| 123 100| 96 100| 25 100| 252 100 | 5675 100
|
|
|
|
|
|
|
|
|
|
|
Percent reported |
89.1|
95.2|
89.2|
85.2|
91.7 |
88.9|
97.6|
96.0|
86.2|
95.5 |
91.9
|
|
|
|
|
|
|
|
|
|
|
|
|
|
|
|
|
|
|
|
|
|
NOT REPORTED
| 13 | 137 | 253 | 88 | 491
| 1 | 3 | 4 | 4 | 12
| 503
------------------------------------------------------------------------------------------------------------------------------------
Total
| 119 | 2861 | 2340 | 594 | 5914
| 9 | 126 | 100 | 29 | 264
| 6178
|
|
|
|
|
|
|
|
|
|
|
|
|
|
|
|
|
|
|
|
|
|
|
|
|
|
|
|
|
|
|
|
|
|
|
|
|
|
|
|
|
|
|
|
|
|
|
|
|
|
|
|
|
|
|
AVG READING SCORE | 7.59 | 8.00 | 7.13 | 6.99 | 7.56 | 8.14 | 8.83 | 8.75 | 7.10 | 8.60 | 7.61
Page 8 Run 11/18/03 15:08 pm
Georgia Department of Corrections Office of Planning and Analysis
Inmate statistical profile
Sample: ACTIVE PRISONERS SERVING LIFE EXCLUDING JAIL
Requestor: Statistics
Active inmates 11/18/2003
Functional Math Level (WRAT Scores) by current age & sex
|
MEN
|
WOMEN
|
| Age | Age | Age | Age | Men
| Age | Age | Age | Age |Women
|Grand
WRAT Math Score
|00-21 %|22-39 %|40-54 %|55-99 %|Total % |00-21 %|22-39 %|40-54 %|55-99 %|Total % |Total %
------------------------------------------------------------------------------------------------------------------------------------
LESS THAN GRADE 6 | 42 40| 764 28| 874 42| 233 46| 1913 35 | 5 63| 33 27| 40 41| 11 44| 89 35 | 2002 35
6TH THRU 8TH GRADE | 47 44| 1397 51| 817 39| 153 30| 2414 44 | 3 38| 59 48| 30 31| 9 36| 101 40 | 2515 44
GRADE 9
| 6 6| 223 8| 148 7| 36 7| 413 8 | 0 0| 17 14| 7 7| 2 8| 26 10 | 439 8
GRADE 10
| 6 6| 137 5| 114 5| 30 6| 287 5 | 0 0| 6 5| 8 8| 1 4| 15 6 | 302 5
GRADE 11
| 3 3| 91 3| 58 3| 22 4| 174 3 | 0 0| 1 1| 4 4| 1 4| 6 2 | 180 3
GRADE 12
| 2 2| 91 3| 77 4| 30 6| 200 4 | 0 0| 1 1| 3 3| 0 0| 4 2 | 204 4
MORE THAN GRADE 12 | 0 0| 23 1| 4 0| 3 1| 30 1 | 0 0| 6 5| 5 5| 1 4| 12 5 | 42 1
------------------------------------------------------------------------------------------------------------------------------------
Total reported
| 106 100| 2726 100| 2092 100| 507 100| 5431 100 | 8 100| 123 100| 97 100| 25 100| 253 100 | 5684 100
|
|
|
|
|
|
|
|
|
|
|
Percent reported |
89.1|
95.3|
89.4|
85.4|
91.8 |
88.9|
97.6|
97.0|
86.2|
95.8 |
92.0
|
|
|
|
|
|
|
|
|
|
|
|
|
|
|
|
|
|
|
|
|
|
NOT REPORTED
| 13 | 135 | 248 | 87 | 483
| 1 | 3 | 3 | 4 | 11
| 494
------------------------------------------------------------------------------------------------------------------------------------
Total
| 119 | 2861 | 2340 | 594 | 5914
| 9 | 126 | 100 | 29 | 264
| 6178
|
|
|
|
|
|
|
|
|
|
|
|
|
|
|
|
|
|
|
|
|
|
|
|
|
|
|
|
|
|
|
|
|
|
|
|
|
|
|
|
|
|
|
|
|
|
|
|
|
|
|
|
|
|
|
AVG MATH SCORE
| 6.67 | 7.20 | 6.65 | 6.60 | 6.92 | 5.96 | 7.37 | 7.24 | 6.19 | 7.16 | 6.93
Page 9 Run 11/18/03 15:08 pm
Georgia Department of Corrections Office of Planning and Analysis
Inmate statistical profile
Sample: ACTIVE PRISONERS SERVING LIFE EXCLUDING JAIL
Requestor: Statistics
Active inmates 11/18/2003
Functional Spelling Level (WRAT Scores) by current age & sex
|
MEN
|
WOMEN
|
| Age | Age | Age | Age | Men
| Age | Age | Age | Age |Women
|Grand
WRAT Spelling Score |00-21 %|22-39 %|40-54 %|55-99 %|Total % |00-21 %|22-39 %|40-54 %|55-99 %|Total % |Total %
------------------------------------------------------------------------------------------------------------------------------------
LESS THAN GRADE 6 | 50 47| 1080 40| 1176 56| 293 58| 2599 48 | 1 13| 33 27| 32 33| 13 52| 79 31 | 2678 47
6TH THRU 8TH GRADE | 22 21| 795 29| 450 22| 98 19| 1365 25 | 4 50| 34 28| 21 22| 5 20| 64 25 | 1429 25
GRADE 9
| 15 14| 197 7| 112 5| 18 4| 342 6 | 2 25| 12 10| 4 4| 1 4| 19 8 | 361 6
GRADE 10
| 4 4| 194 7| 84 4| 21 4| 303 6 | 0 0| 10 8| 5 5| 1 4| 16 6 | 319 6
GRADE 11
| 4 4| 126 5| 60 3| 11 2| 201 4 | 1 13| 4 3| 6 6| 3 12| 14 6 | 215 4
GRADE 12
| 5 5| 266 10| 189 9| 60 12| 520 10 | 0 0| 12 10| 6 6| 0 0| 18 7 | 538 9
MORE THAN GRADE 12 | 6 6| 65 2| 17 1| 6 1| 94 2 | 0 0| 18 15| 23 24| 2 8| 43 17 | 137 2
------------------------------------------------------------------------------------------------------------------------------------
Total reported
| 106 100| 2723 100| 2088 100| 507 100| 5424 100 | 8 100| 123 100| 97 100| 25 100| 253 100 | 5677 100
|
|
|
|
|
|
|
|
|
|
|
Percent reported |
89.1|
95.2|
89.2|
85.4|
91.7 |
88.9|
97.6|
97.0|
86.2|
95.8 |
91.9
|
|
|
|
|
|
|
|
|
|
|
|
|
|
|
|
|
|
|
|
|
|
NOT REPORTED
| 13 | 138 | 252 | 87 | 490
| 1 | 3 | 3 | 4 | 11
| 501
------------------------------------------------------------------------------------------------------------------------------------
Total
| 119 | 2861 | 2340 | 594 | 5914
| 9 | 126 | 100 | 29 | 264
| 6178
|
|
|
|
|
|
|
|
|
|
|
|
|
|
|
|
|
|
|
|
|
|
|
|
|
|
|
|
|
|
|
|
|
|
|
|
|
|
|
|
|
|
|
|
|
|
|
|
|
|
|
|
|
|
|
AVG SPELLING SCORE | 7.05 | 7.20 | 6.13 | 6.05 | 6.68 | 8.30 | 8.49 | 8.36 | 6.30 | 8.22 | 6.75
Page 10 Run 11/18/03 15:08 pm
Georgia Department of Corrections Office of Planning and Analysis
Inmate statistical profile
Sample: ACTIVE PRISONERS SERVING LIFE EXCLUDING JAIL
Requestor: Statistics
Active inmates 11/18/2003
Self-Rpt Guardian Status To Age 16 by current age & sex
|
MEN
|
WOMEN
|
| Age | Age | Age | Age | Men
| Age | Age | Age | Age |Women
|Grand
Guardian Status
|00-21 %|22-39 %|40-54 %|55-99 %|Total % |00-21 %|22-39 %|40-54 %|55-99 %|Total % |Total %
------------------------------------------------------------------------------------------------------------------------------------
ORPHANAGE
| 0 0| 2 0| 6 0| 1 0| 9 0 | 0 0| 0 0| 0 0| 0 0| 0 0 | 9 0
FATHER ONLY
| 2 2| 87 3| 66 3| 8 1| 163 3 | 0 0| 2 2| 2 2| 1 4| 5 2 | 168 3
FTR MTR HD
| 6 5| 129 5| 86 4| 11 2| 232 4 | 0 0| 3 2| 6 6| 0 0| 9 3 | 241 4
MOTHER ONLY
| 61 54| 1383 49| 756 33| 172 30| 2372 41 | 6 67| 47 37| 23 24| 10 37| 86 33 | 2458 41
MTR FTR HD
| 28 25| 798 28| 1059 46| 310 53| 2195 38 | 2 22| 48 38| 55 57| 15 56| 120 46 | 2315 38
OTH FEMALE
| 2 2| 46 2| 51 2| 18 3| 117 2 | 0 0| 3 2| 3 3| 0 0| 6 2 | 123 2
OTH MALE
| 1 1| 7 0| 11 0| 2 0| 21 0 | 0 0| 0 0| 2 2| 0 0| 2 1 | 23 0
STEP-PARNTS
| 2 2| 49 2| 30 1| 8 1| 89 2 | 0 0| 0 0| 0 0| 0 0| 0 0 | 89 1
FOSTER HOME
| 1 1| 30 1| 31 1| 9 2| 71 1 | 0 0| 1 1| 2 2| 0 0| 3 1 | 74 1
GRAND PRNTS
| 10 9| 227 8| 148 6| 35 6| 420 7 | 1 11| 19 15| 4 4| 1 4| 25 10 | 445 7
OTHER
| 1 1| 66 2| 38 2| 7 1| 112 2 | 0 0| 3 2| 0 0| 0 0| 3 1 | 115 2
------------------------------------------------------------------------------------------------------------------------------------
Total reported
| 114 100| 2824 100| 2282 100| 581 100| 5801 100 | 9 100| 126 100| 97 100| 27 100| 259 100 | 6060 100
|
|
|
|
|
|
|
|
|
|
|
Percent reported |
95.8|
98.7|
97.5|
97.8|
98.1 | 100.0| 100.0|
97.0|
93.1|
98.1 |
98.1
|
|
|
|
|
|
|
|
|
|
|
|
|
|
|
|
|
|
|
|
|
|
NOT RPTD
| 5 | 37 | 58 | 13 | 113
|0|0|3|2|5
| 118
------------------------------------------------------------------------------------------------------------------------------------
Total
| 119 | 2861 | 2340 | 594 | 5914
| 9 | 126 | 100 | 29 | 264
| 6178
Page 11 Run 11/18/03 15:08 pm
Georgia Department of Corrections Office of Planning and Analysis
Inmate statistical profile
Sample: ACTIVE PRISONERS SERVING LIFE EXCLUDING JAIL
Requestor: Statistics
Active inmates 11/18/2003
Self-Rpt Employment Status Before Prison by current age & sex
|
MEN
|
WOMEN
|
| Age | Age | Age | Age | Men
| Age | Age | Age | Age |Women
|Grand
Employment
|00-21 %|22-39 %|40-54 %|55-99 %|Total % |00-21 %|22-39 %|40-54 %|55-99 %|Total % |Total %
------------------------------------------------------------------------------------------------------------------------------------
FULL TIME
| 24 22| 956 36| 884 40| 220 39| 2084 37 | 1 14| 34 31| 18 19| 5 19| 58 25 | 2142 37
PART TIME
| 14 13| 228 8| 109 5| 33 6| 384 7 | 0 0| 5 5| 3 3| 0 0| 8 3 | 392 7
UNEMPL < 6M
| 6 6| 389 14| 352 16| 97 17| 844 15 | 1 14| 18 16| 21 23| 6 23| 46 19 | 890 15
UNEMPL > 6M
| 13 12| 707 26| 770 35| 165 30| 1655 30 | 1 14| 26 24| 42 45| 11 42| 80 34 | 1735 30
NEVER WORKD
| 46 42| 337 13| 31 1| 5 1| 419 8 | 1 14| 23 21| 5 5| 0 0| 29 12 | 448 8
STUDENT
| 6 6| 48 2| 8 0| 1 0| 63 1 | 2 29| 3 3| 1 1| 0 0| 6 3 | 69 1
INCAPABLE
| 0 0| 24 1| 64 3| 37 7| 125 2 | 1 14| 1 1| 3 3| 4 15| 9 4 | 134 2
OTHER
| 0 0| 0 0| 0 0| 0 0| 0 0 | 0 0| 0 0| 0 0| 0 0| 0 0 | 0 0
------------------------------------------------------------------------------------------------------------------------------------
Total reported
| 109 100| 2689 100| 2218 100| 558 100| 5574 100 | 7 100| 110 100| 93 100| 26 100| 236 100 | 5810 100
|
|
|
|
|
|
|
|
|
|
|
Percent reported |
91.6|
94.0|
94.8|
93.9|
94.3 |
77.8|
87.3|
93.0|
89.7|
89.4 |
94.0
|
|
|
|
|
|
|
|
|
|
|
|
|
|
|
|
|
|
|
|
|
|
NOT RPTD
| 10 | 172 | 122 | 36 | 340
| 2 | 16 | 7 | 3 | 28
| 368
------------------------------------------------------------------------------------------------------------------------------------
Total
| 119 | 2861 | 2340 | 594 | 5914
| 9 | 126 | 100 | 29 | 264
| 6178
* NOTE: THE FIELD LABELD "OTHER" WAS CORRECTED IN APRIL 1989; INMATES CODED "PRE-OTIS NOT REPORTED" NOW HAVE BEEN REMOVED FROM THIS FIELD AND IDENTIFIED AS "NOT REPORTED".
Page 12 Run 11/18/03 15:08 pm
Georgia Department of Corrections Office of Planning and Analysis
Inmate statistical profile
Sample: ACTIVE PRISONERS SERVING LIFE EXCLUDING JAIL
Requestor: Statistics
Active inmates 11/18/2003
Self-Rpt Marital Status At Admission by current age & sex
|
MEN
|
WOMEN
|
| Age | Age | Age | Age | Men
| Age | Age | Age | Age |Women
|Grand
Marital Status
|00-21 %|22-39 %|40-54 %|55-99 %|Total % |00-21 %|22-39 %|40-54 %|55-99 %|Total % |Total %
------------------------------------------------------------------------------------------------------------------------------------
SINGLE
| 112 97| 2067 73| 886 39| 96 17| 3161 54 | 8 89| 79 63| 21 21| 4 15| 112 43 | 3273 54
MARRIED
| 1 1| 190 7| 407 18| 143 25| 741 13 | 0 0| 11 9| 18 18| 3 11| 32 12 | 773 13
SEPARATED
| 0 0| 79 3| 164 7| 59 10| 302 5 | 0 0| 10 8| 13 13| 2 7| 25 10 | 327 5
DIVORCED
| 0 0| 112 4| 363 16| 137 24| 612 11 | 1 11| 8 6| 17 17| 6 22| 32 12 | 644 11
WIDOWED
| 1 1| 39 1| 101 4| 65 11| 206 4 | 0 0| 6 5| 18 18| 12 44| 36 14 | 242 4
COMMON LAW
| 1 1| 338 12| 368 16| 81 14| 788 14 | 0 0| 12 10| 12 12| 0 0| 24 9 | 812 13
OTHER
| 0 0| 3 0| 2 0| 0 0| 5 0 | 0 0| 0 0| 0 0| 0 0| 0 0 | 5 0
------------------------------------------------------------------------------------------------------------------------------------
Total reported
| 115 100| 2828 100| 2291 100| 581 100| 5815 100 | 9 100| 126 100| 99 100| 27 100| 261 100 | 6076 100
|
|
|
|
|
|
|
|
|
|
|
Percent reported |
96.6|
98.8|
97.9|
97.8|
98.3 | 100.0| 100.0|
99.0|
93.1|
98.9 |
98.3
|
|
|
|
|
|
|
|
|
|
|
|
|
|
|
|
|
|
|
|
|
|
NOT RPTD
| 4 | 33 | 49 | 13 | 99
|0|0|1|2|3
| 102
------------------------------------------------------------------------------------------------------------------------------------
Total
| 119 | 2861 | 2340 | 594 | 5914
| 9 | 126 | 100 | 29 | 264
| 6178
Page 13 Run 11/18/03 15:08 pm
Georgia Department of Corrections Office of Planning and Analysis
Inmate statistical profile
Sample: ACTIVE PRISONERS SERVING LIFE EXCLUDING JAIL
Requestor: Statistics
Active inmates 11/18/2003
Self-Rpt Number Of Children At Admission by current age & sex
|
MEN
|
WOMEN
|
| Age | Age | Age | Age | Men
| Age | Age | Age | Age |Women
|Grand
Number Of Children |00-21 %|22-39 %|40-54 %|55-99 %|Total % |00-21 %|22-39 %|40-54 %|55-99 %|Total % |Total %
------------------------------------------------------------------------------------------------------------------------------------
NO CHILDREN
| 0 0| 312 18| 325 18| 56 11| 693 17 | 0 0| 1 1| 3 3| 1 4| 5 2 | 698 16
ONE CHILD
| 19 70| 702 40| 536 30| 89 18| 1346 33 | 1 50| 32 37| 25 28| 2 7| 60 29 | 1406 33
TWO CHILDREN
| 4 15| 392 22| 409 23| 112 23| 917 23 | 1 50| 27 31| 29 33| 6 22| 63 31 | 980 23
THREE CHILDREN
| 4 15| 212 12| 252 14| 102 21| 570 14 | 0 0| 16 18| 17 19| 9 33| 42 20 | 612 14
FOUR CHILDREN
| 0 0| 80 5| 119 7| 60 12| 259 6 | 0 0| 5 6| 9 10| 6 22| 20 10 | 279 7
FIVE CHILDREN
| 0 0| 35 2| 65 4| 27 6| 127 3 | 0 0| 3 3| 1 1| 1 4| 5 2 | 132 3
MORE THAN 5 CHILDREN| 0 0| 33 2| 56 3| 43 9| 132 3 | 0 0| 3 3| 5 6| 2 7| 10 5 | 142 3
------------------------------------------------------------------------------------------------------------------------------------
Total reported
| 27 100| 1766 100| 1762 100| 489 100| 4044 100 | 2 100| 87 100| 89 100| 27 100| 205 100 | 4249 100
|
|
|
|
|
|
|
|
|
|
|
Percent reported |
22.7|
61.7|
75.3|
82.3|
68.4 |
22.2|
69.0|
89.0|
93.1|
77.7 |
68.8
|
|
|
|
|
|
|
|
|
|
|
|
|
|
|
|
|
|
|
|
|
|
NOT REPORTED
| 92 | 1095 | 578 | 105 | 1870
| 7 | 39 | 11 | 2 | 59
| 1929
------------------------------------------------------------------------------------------------------------------------------------
Total
| 119 | 2861 | 2340 | 594 | 5914
| 9 | 126 | 100 | 29 | 264
| 6178
|
|
|
|
|
|
|
|
|
|
|
|
|
|
|
|
|
|
|
|
|
|
|
|
|
|
|
|
|
|
|
|
|
|
|
|
|
|
|
|
|
|
|
|
|
|
|
|
|
|
|
|
|
|
|
AVG NUM CHILDREN | 1.44 | 1.72 | 1.90 | 2.67 | 1.91 | 1.50 | 2.15 | 2.38 | 3.07 | 2.37 | 1.93
* NOTE: THE FIELD LABLED "NO CHILDREN" WAS CORRECTED IN MARCH 1989: MISSING DATA FOR INMATES STILL IN DIAGNOSTICS NOW HAS BEEN REMOVED FROM THIS FIELD AND IDENTIFIED AS "NOT REPORTED" INFORMATION.
Page 14 Run 11/18/03 15:08 pm
Georgia Department of Corrections Office of Planning and Analysis
Inmate statistical profile
Sample: ACTIVE PRISONERS SERVING LIFE EXCLUDING JAIL
Requestor: Statistics
Active inmates 11/18/2003
Self-Rpt Religious Affiliation by current age & sex
|
MEN
|
WOMEN
|
| Age | Age | Age | Age | Men
| Age | Age | Age | Age |Women
|Grand
Religion
|00-21 %|22-39 %|40-54 %|55-99 %|Total % |00-21 %|22-39 %|40-54 %|55-99 %|Total % |Total %
------------------------------------------------------------------------------------------------------------------------------------
ISLAM
| 3 3| 146 5| 80 4| 11 2| 240 4 | 0 0| 2 2| 0 0| 0 0| 2 1 | 242 4
CATHOLIC
| 5 4| 83 3| 81 4| 20 4| 189 3 | 1 11| 7 6| 3 3| 1 4| 12 5 | 201 3
BAPTIST
| 42 38| 1255 46| 1301 61| 345 63| 2943 53 | 3 33| 68 55| 51 53| 16 64| 138 54 | 3081 53
METHODIST
| 1 1| 60 2| 76 4| 29 5| 166 3 | 0 0| 3 2| 8 8| 0 0| 11 4 | 177 3
EPISCOPLN
| 0 0| 4 0| 4 0| 3 1| 11 0 | 0 0| 1 1| 2 2| 0 0| 3 1 | 14 0
PRESBYTRN
| 0 0| 5 0| 9 0| 4 1| 18 0 | 0 0| 0 0| 0 0| 2 8| 2 1 | 20 0
CHC OF GOD
| 0 0| 32 1| 27 1| 13 2| 72 1 | 0 0| 2 2| 3 3| 0 0| 5 2 | 77 1
HOLINESS
| 2 2| 107 4| 116 5| 29 5| 254 5 | 1 11| 13 10| 11 11| 2 8| 27 11 | 281 5
JEWISH
| 0 0| 0 0| 4 0| 1 0| 5 0 | 0 0| 0 0| 0 0| 0 0| 0 0 | 5 0
ANGLICAN
| 0 0| 0 0| 0 0| 0 0| 0 0 | 0 0| 1 1| 0 0| 0 0| 1 0 | 1 0
GRK ORTHDX
| 0 0| 0 0| 0 0| 0 0| 0 0 | 0 0| 0 0| 0 0| 0 0| 0 0 | 0 0
HINDU
| 0 0| 1 0| 0 0| 0 0| 1 0 | 0 0| 0 0| 0 0| 0 0| 0 0 | 1 0
BUDDHIST
| 0 0| 5 0| 1 0| 1 0| 7 0 | 0 0| 0 0| 0 0| 0 0| 0 0 | 7 0
TAOIST
| 0 0| 0 0| 0 0| 0 0| 0 0 | 0 0| 0 0| 0 0| 0 0| 0 0 | 0 0
SHINTOIST
| 0 0| 0 0| 0 0| 0 0| 0 0 | 0 0| 0 0| 0 0| 0 0| 0 0 | 0 0
SEVEN D AD
| 0 0| 6 0| 4 0| 2 0| 12 0 | 0 0| 0 0| 0 0| 0 0| 0 0 | 12 0
JEHOVAH WT
| 0 0| 25 1| 15 1| 2 0| 42 1 | 0 0| 1 1| 1 1| 0 0| 2 1 | 44 1
LATR DAY S
| 0 0| 2 0| 1 0| 0 0| 3 0 | 0 0| 0 0| 0 0| 0 0| 0 0 | 3 0
QUAKER
| 0 0| 0 0| 0 0| 0 0| 0 0 | 0 0| 0 0| 0 0| 0 0| 0 0 | 0 0
OTHER PROD
| 21 19| 277 10| 84 4| 23 4| 405 7 | 4 44| 13 10| 8 8| 1 4| 26 10 | 431 7
NONE
| 26 23| 474 17| 163 8| 26 5| 689 12 | 0 0| 7 6| 3 3| 0 0| 10 4 | 699 12
OTHER
| 12 11| 245 9| 181 8| 43 8| 481 9 | 0 0| 6 5| 6 6| 3 12| 15 6 | 496 9
------------------------------------------------------------------------------------------------------------------------------------
Total reported
| 112 100| 2727 100| 2147 100| 552 100| 5538 100 | 9 100| 124 100| 96 100| 25 100| 254 100 | 5792 100
|
|
|
|
|
|
|
|
|
|
|
Percent reported |
94.1|
95.3|
91.8|
92.9|
93.6 | 100.0|
98.4|
96.0|
86.2|
96.2 |
93.8
|
|
|
|
|
|
|
|
|
|
|
|
|
|
|
|
|
|
|
|
|
|
NOT RPTD
| 7 | 134 | 193 | 42 | 376
| 0 | 2 | 4 | 4 | 10
| 386
------------------------------------------------------------------------------------------------------------------------------------
Total
| 119 | 2861 | 2340 | 594 | 5914
| 9 | 126 | 100 | 29 | 264
| 6178
Page 15 Run 11/18/03 15:08 pm
Georgia Department of Corrections Office of Planning and Analysis
Inmate statistical profile
Sample: ACTIVE PRISONERS SERVING LIFE EXCLUDING JAIL
Requestor: Statistics
Active inmates 11/18/2003
Self-Rpt Family Behavior Patterns * by current age & sex
|
MEN
|
WOMEN
|
| Age | Age | Age | Age | Men
| Age | Age | Age | Age |Women
|Grand
Family Behavior
|00-21 %|22-39 %|40-54 %|55-99 %|Total % |00-21 %|22-39 %|40-54 %|55-99 %|Total % |Total %
------------------------------------------------------------------------------------------------------------------------------------
CRIMINLTY
| 35 21| 763 23| 584 28| 119 27| 1501 25 | 5 25| 43 18| 19 20| 5 16| 72 19 | 1573 24
ALCOHOLISM
| 16 9| 342 10| 326 15| 67 15| 751 12 | 5 25| 29 12| 18 19| 6 19| 58 15 | 809 12
DRUG ABUSE
| 19 11| 204 6| 91 4| 12 3| 326 5 | 0 0| 27 11| 7 7| 2 6| 36 9 | 362 6
DOMINERING
| 0 0| 11 0| 15 1| 0 0| 26 0 | 1 5| 18 8| 8 8| 3 10| 30 8 | 56 1
MIGRANT
| 0 0| 39 1| 45 2| 3 1| 87 1 | 1 5| 2 1| 2 2| 0 0| 5 1 | 92 1
INFL BTGS
| 6 4| 134 4| 101 5| 20 4| 261 4 | 0 0| 24 10| 11 12| 3 10| 38 10 | 299 5
PERMISSIVE
| 1 1| 5 0| 15 1| 4 1| 25 0 | 1 5| 8 3| 1 1| 1 3| 11 3 | 36 1
FATH ABSNT
| 75 44| 1523 45| 744 35| 180 40| 2522 41 | 6 30| 55 23| 18 19| 7 23| 86 22 | 2608 40
MOTH ABSNT
| 17 10| 314 9| 177 8| 38 9| 546 9 | 1 5| 19 8| 4 4| 2 6| 26 7 | 572 9
NONE
| 1 1| 36 1| 18 1| 4 1| 59 1 | 0 0| 15 6| 7 7| 2 6| 24 6 | 83 1
------------------------------------------------------------------------------------------------------------------------------------
Total reported
| 170 100| 3371 100| 2116 100| 447 100| 6104 100 | 20 100| 240 100| 95 100| 31 100| 386 100 | 6490 100
|
|
|
|
|
|
|
|
|
|
|
Percent reported |
73.1|
73.3|
60.4|
53.7|
66.2 |
88.9|
77.8|
53.0|
55.2|
66.3 |
66.2
|
|
|
|
|
|
|
|
|
|
|
|
|
|
|
|
|
|
|
|
|
|
OTHER
| 32 | 763 | 927 | 275 | 1997
| 1 | 28 | 47 | 13 | 89
| 2086
------------------------------------------------------------------------------------------------------------------------------------
Total
| 119 | 2861 | 2340 | 594 | 5914
| 9 | 126 | 100 | 29 | 264
| 6178
* NOTE: SINCE THERE CAN BE UP TO FIVE BEHAVIOR CODES PER INMATE, THE NUMBER OF CASES REPORTED IN THE DETAIL LINES AND THE TOTAL REPORTED LINE MAY EXCEED THE TOTAL NUMBER OF CASES. IN SHORT, THIS TABLE COUNTS THE NUMBER OF BEHAVIOR PROBLEMS, NOT INMATES.
Page 16 Run 11/18/03 15:08 pm
Georgia Department of Corrections Office of Planning and Analysis
Inmate statistical profile
Sample: ACTIVE PRISONERS SERVING LIFE EXCLUDING JAIL
Requestor: Statistics
Active inmates 11/18/2003
Inmate Diagnostic Behavior Problem * by current age & sex
|
MEN
|
WOMEN
|
| Age | Age | Age | Age | Men
| Age | Age | Age | Age |Women
|Grand
Diagnostic Problem |00-21 %|22-39 %|40-54 %|55-99 %|Total % |00-21 %|22-39 %|40-54 %|55-99 %|Total % |Total %
------------------------------------------------------------------------------------------------------------------------------------
ALCOHOLIC
| 4 2| 121 2| 148 3| 59 6| 332 3 | 0 0| 3 1| 14 8| 1 3| 18 4 | 350 3
ALCOH ABSE
| 34 13| 784 15| 737 17| 158 16| 1713 16 | 1 5| 20 9| 16 9| 5 14| 42 9 | 1755 15
DRUG EXP
| 25 9| 818 15| 452 10| 63 7| 1358 12 | 1 5| 20 9| 18 11| 1 3| 40 9 | 1398 12
DRUG ABSE
| 60 23| 891 16| 766 18| 79 8| 1796 16 | 1 5| 39 18| 31 18| 1 3| 72 16 | 1868 16
NARC ADDCT
| 2 1| 75 1| 100 2| 14 1| 191 2 | 0 0| 1 0| 5 3| 0 0| 6 1 | 197 2
EPILEPTIC
| 1 0| 29 1| 25 1| 7 1| 62 1 | 1 5| 0 0| 2 1| 0 0| 3 1 | 65 1
MANIPULTVE
| 30 11| 356 7| 180 4| 32 3| 598 5 | 0 0| 6 3| 0 0| 1 3| 7 2 | 605 5
ASSAULTIVE
| 92 35| 1578 29| 1081 25| 273 28| 3024 28 | 9 45| 71 32| 39 23| 9 24| 128 29 | 3152 28
ESCPE TEND
| 4 2| 101 2| 196 5| 75 8| 376 3 | 0 0| 1 0| 4 2| 0 0| 5 1 | 381 3
SUICIDAL
| 7 3| 139 3| 138 3| 21 2| 305 3 | 3 15| 20 9| 7 4| 3 8| 33 7 | 338 3
WITHDRAWN
| 2 1| 33 1| 26 1| 9 1| 70 1 | 2 10| 6 3| 4 2| 1 3| 13 3 | 83 1
PR RLTY CT
| 1 0| 31 1| 55 1| 19 2| 106 1 | 2 10| 4 2| 4 2| 1 3| 11 2 | 117 1
HOMOSEXUAL
| 0 0| 11 0| 13 0| 6 1| 30 0 | 0 0| 5 2| 5 3| 0 0| 10 2 | 40 0
NONE
| 0 0| 208 4| 249 6| 97 10| 554 5 | 0 0| 8 4| 15 9| 7 19| 30 7 | 584 5
OTHER
| 0 0| 64 1| 68 2| 27 3| 159 1 | 0 0| 0 0| 0 0| 3 8| 3 1 | 162 1
NOT RPTD
| 3 1| 161 3| 76 2| 25 3| 265 2 | 0 0| 17 8| 6 4| 4 11| 27 6 | 292 3
------------------------------------------------------------------------------------------------------------------------------------
Total reported
| 265 100| 5405 100| 4311 100| 964 100|10945 100 | 20 100| 221 100| 171 100| 37 100| 449 100 |11394 100
|
|
|
|
|
|
|
|
|
|
|
Percent reported | 100.0|
99.8| 100.0| 100.0|
99.9 | 100.0| 100.0|
99.0| 100.0|
99.6 |
99.9
|
|
|
|
|
|
|
|
|
|
|
|
|
|
|
|
|
|
|
|
|
|
UNKNOWN
|0|5|1|0|6
|0|0|1|0|1
|7
------------------------------------------------------------------------------------------------------------------------------------
Total
| 119 | 2861 | 2340 | 594 | 5914
| 9 | 126 | 100 | 29 | 264
| 6178
* NOTE: SINCE THERE CAN BE UP TO FIVE BEHAVIOR CODES PER INMATE, THE NUMBER OF CASES REPORTED IN THE DETAIL LINES AND THE TOTAL REPORTED LINE MAY EXCEED THE TOTAL NUMBER OF CASES. IN SHORT, THIS TABLE COUNTS THE NUMBER OF BEHAVIOR PROBLEMS, NOT INMATES.
Page 17 Run 11/18/03 15:08 pm
Georgia Department of Corrections Office of Planning and Analysis
Inmate statistical profile
Sample: ACTIVE PRISONERS SERVING LIFE EXCLUDING JAIL
Requestor: Statistics
Active inmates 11/18/2003
Physical Profile (General Condition) by current age & sex
|
MEN
|
WOMEN
|
| Age | Age | Age | Age | Men
| Age | Age | Age | Age |Women
|Grand
Physical Profile |00-21 %|22-39 %|40-54 %|55-99 %|Total % |00-21 %|22-39 %|40-54 %|55-99 %|Total % |Total %
------------------------------------------------------------------------------------------------------------------------------------
NO LIMITATION
| 105 91| 2154 76| 1246 53| 133 23| 3638 62 | 8 100| 94 77| 43 44| 1 4| 146 57 | 3784 62
DEFECT NO MAJOR LIMT| 6 5| 389 14| 589 25| 172 29| 1156 20 | 0 0| 18 15| 39 40| 9 33| 66 26 | 1222 20
DEFECT MAJOR LIMIT | 4 3| 298 10| 476 20| 239 40| 1017 17 | 0 0| 10 8| 16 16| 13 48| 39 15 | 1056 17
VERY MAJOR DEFECT | 0 0| 4 0| 19 1| 47 8| 70 1 | 0 0| 0 0| 0 0| 4 15| 4 2 | 74 1
------------------------------------------------------------------------------------------------------------------------------------
Total reported
| 115 100| 2845 100| 2330 100| 591 100| 5881 100 | 8 100| 122 100| 98 100| 27 100| 255 100 | 6136 100
|
|
|
|
|
|
|
|
|
|
|
Percent reported |
96.6|
99.4|
99.6|
99.5|
99.4 |
88.9|
96.8|
98.0|
93.1|
96.6 |
99.3
|
|
|
|
|
|
|
|
|
|
|
|
|
|
|
|
|
|
|
|
|
|
NOT REPORTED
| 4 | 16 | 10 | 3 | 33
|1|4|2|2|9
| 42
------------------------------------------------------------------------------------------------------------------------------------
Total
| 119 | 2861 | 2340 | 594 | 5914
| 9 | 126 | 100 | 29 | 264
| 6178
Page 18 Run 11/18/03 15:08 pm
Georgia Department of Corrections Office of Planning and Analysis
Inmate statistical profile
Sample: ACTIVE PRISONERS SERVING LIFE EXCLUDING JAIL
Requestor: Statistics
Active inmates 11/18/2003
Security Status by current age & sex
|
MEN
|
WOMEN
|
| Age | Age | Age | Age | Men
| Age | Age | Age | Age |Women
|Grand
Security
|00-21 %|22-39 %|40-54 %|55-99 %|Total % |00-21 %|22-39 %|40-54 %|55-99 %|Total % |Total %
------------------------------------------------------------------------------------------------------------------------------------
DIAG INCOM
| 0 0| 0 0| 0 0| 0 0| 0 0 | 0 0| 0 0| 0 0| 0 0| 0 0 | 0 0
WRK RELEAS
| 0 0| 0 0| 0 0| 0 0| 0 0 | 0 0| 0 0| 0 0| 0 0| 0 0 | 0 0
TRUSTY
| 0 0| 6 0| 15 1| 3 1| 24 0 | 0 0| 1 1| 2 2| 0 0| 3 1 | 27 0
MINIMUM
| 1 1| 431 15| 607 26| 185 31| 1224 21 | 1 11| 39 31| 56 56| 22 76| 118 45 | 1342 22
MEDIUM
| 11 9| 1258 44| 1288 55| 331 56| 2888 49 | 1 11| 46 37| 33 33| 7 24| 87 33 | 2975 48
CLOSE
| 93 78| 1031 36| 364 16| 70 12| 1558 26 | 6 67| 39 31| 8 8| 0 0| 53 20 | 1611 26
MAXIMUM
| 7 6| 109 4| 54 2| 3 1| 173 3 | 0 0| 0 0| 1 1| 0 0| 1 0 | 174 3
DIAGNOSTIC
| 7 6| 26 1| 12 1| 2 0| 47 1 | 1 11| 1 1| 0 0| 0 0| 2 1 | 49 1
------------------------------------------------------------------------------------------------------------------------------------
Total reported
| 119 100| 2861 100| 2340 100| 594 100| 5914 100 | 9 100| 126 100| 100 100| 29 100| 264 100 | 6178 100
|
|
|
|
|
|
|
|
|
|
|
Percent reported | 100.0| 100.0| 100.0| 100.0| 100.0 | 100.0| 100.0| 100.0| 100.0| 100.0 | 100.0
|
|
|
|
|
|
|
|
|
|
|
|
|
|
|
|
|
|
|
|
|
|
NOT RPTD
|0|0|0|0|0
|0|0|0|0|0
|0
------------------------------------------------------------------------------------------------------------------------------------
Total
| 119 | 2861 | 2340 | 594 | 5914
| 9 | 126 | 100 | 29 | 264
| 6178
* NOTE: BEGINNING IN JULY 1987, THE FACILITIES DIVISION NO LONGER CODED INMATES AS BEING WORK RELEASE
Page 19 Run 11/18/03 15:08 pm
Georgia Department of Corrections Office of Planning and Analysis
Inmate statistical profile
Sample: ACTIVE PRISONERS SERVING LIFE EXCLUDING JAIL
Requestor: Statistics
Active inmates 11/18/2003
Number Of Sentences by current age & sex
|
MEN
|
WOMEN
|
| Age | Age | Age | Age | Men
| Age | Age | Age | Age |Women
|Grand
Number Of Sentences |00-21 %|22-39 %|40-54 %|55-99 %|Total % |00-21 %|22-39 %|40-54 %|55-99 %|Total % |Total %
------------------------------------------------------------------------------------------------------------------------------------
ONE
| 29 24| 711 25| 579 25| 194 33| 1513 26 | 5 56| 39 31| 53 53| 14 48| 111 42 | 1624 26
TWO
| 34 29| 674 24| 559 24| 144 24| 1411 24 | 2 22| 44 35| 23 23| 9 31| 78 30 | 1489 24
THREE
| 19 16| 485 17| 414 18| 87 15| 1005 17 | 1 11| 24 19| 11 11| 4 14| 40 15 | 1045 17
FOUR
| 18 15| 317 11| 270 12| 56 9| 661 11 | 0 0| 8 6| 4 4| 1 3| 13 5 | 674 11
FIVE
| 3 3| 223 8| 167 7| 33 6| 426 7 | 1 11| 6 5| 5 5| 1 3| 13 5 | 439 7
MORE THAN FIVE
| 16 13| 451 16| 351 15| 80 13| 898 15 | 0 0| 5 4| 4 4| 0 0| 9 3 | 907 15
------------------------------------------------------------------------------------------------------------------------------------
Total reported
| 119 100| 2861 100| 2340 100| 594 100| 5914 100 | 9 100| 126 100| 100 100| 29 100| 264 100 | 6178 100
|
|
|
|
|
|
|
|
|
|
|
Percent reported | 100.0| 100.0| 100.0| 100.0| 100.0 | 100.0| 100.0| 100.0| 100.0| 100.0 | 100.0
|
|
|
|
|
|
|
|
|
|
|
|
|
|
|
|
|
|
|
|
|
|
NOT REPORTED
|0|0|0|0|0
|0|0|0|0|0
|0
------------------------------------------------------------------------------------------------------------------------------------
Total
| 119 | 2861 | 2340 | 594 | 5914
| 9 | 126 | 100 | 29 | 264
| 6178
|
|
|
|
|
|
|
|
|
|
|
|
|
|
|
|
|
|
|
|
|
|
|
|
|
|
|
|
|
|
|
|
|
|
|
|
|
|
|
|
|
|
|
|
|
|
|
|
|
|
|
|
|
|
|
AVG NUM SENTENCES | 3.02 | 3.39 | 3.38 | 3.03 | 3.34 | 1.89 | 2.43 | 2.03 | 1.83 | 2.19 | 3.29
Page 20 Run 11/18/03 15:08 pm
Georgia Department of Corrections Office of Planning and Analysis
Inmate statistical profile
Sample: ACTIVE PRISONERS SERVING LIFE EXCLUDING JAIL
Requestor: Statistics
Active inmates 11/18/2003
Number Of Disciplinaries by current age & sex
|
MEN
|
WOMEN
|
| Age | Age | Age | Age | Men
| Age | Age | Age | Age |Women
|Grand
Disciplinaries
|00-21 %|22-39 %|40-54 %|55-99 %|Total % |00-21 %|22-39 %|40-54 %|55-99 %|Total % |Total %
------------------------------------------------------------------------------------------------------------------------------------
ZERO
| 29 24| 344 12| 344 15| 132 22| 849 14 | 3 33| 24 19| 25 25| 12 41| 64 24 | 913 15
ONE
| 15 13| 240 8| 252 11| 91 15| 598 10 | 0 0| 16 13| 12 12| 7 24| 35 13 | 633 10
TWO
| 6 5| 205 7| 194 8| 64 11| 469 8 | 2 22| 12 10| 10 10| 3 10| 27 10 | 496 8
THREE
| 5 4| 173 6| 145 6| 45 8| 368 6 | 0 0| 9 7| 13 13| 2 7| 24 9 | 392 6
FOUR
| 6 5| 153 5| 133 6| 40 7| 332 6 | 0 0| 7 6| 7 7| 1 3| 15 6 | 347 6
FIVE
| 3 3| 126 4| 105 4| 24 4| 258 4 | 1 11| 8 6| 3 3| 0 0| 12 5 | 270 4
MORE THAN FIVE
| 55 46| 1620 57| 1167 50| 198 33| 3040 51 | 3 33| 50 40| 30 30| 4 14| 87 33 | 3127 51
------------------------------------------------------------------------------------------------------------------------------------
Total reported
| 119 100| 2861 100| 2340 100| 594 100| 5914 100 | 9 100| 126 100| 100 100| 29 100| 264 100 | 6178 100
|
|
|
|
|
|
|
|
|
|
|
Percent reported | 100.0| 100.0| 100.0| 100.0| 100.0 | 100.0| 100.0| 100.0| 100.0| 100.0 | 100.0
|
|
|
|
|
|
|
|
|
|
|
|
|
|
|
|
|
|
|
|
|
|
NOT REPORTED
|0|0|0|0|0
|0|0|0|0|0
|0
------------------------------------------------------------------------------------------------------------------------------------
Total
| 119 | 2861 | 2340 | 594 | 5914
| 9 | 126 | 100 | 29 | 264
| 6178
|
|
|
|
|
|
|
|
|
|
|
|
|
|
|
|
|
|
|
|
|
|
|
|
|
|
|
|
|
|
|
|
|
|
|
|
|
|
|
|
|
|
|
|
|
|
|
|
|
|
|
|
|
|
|
AVG NUM DISCIP
| 9.06 | 12.68 | 11.83 | 6.89 | 11.69 | 4.11 | 8.51 | 7.37 | 2.24 | 7.24 | 11.50
Page 21 Run 11/18/03 15:08 pm
Georgia Department of Corrections Office of Planning and Analysis
Inmate statistical profile
Sample: ACTIVE PRISONERS SERVING LIFE EXCLUDING JAIL
Requestor: Statistics
Active inmates 11/18/2003
Number Of Escapes by current age & sex
|
MEN
|
WOMEN
|
| Age | Age | Age | Age | Men
| Age | Age | Age | Age |Women
|Grand
Escapes
|00-21 %|22-39 %|40-54 %|55-99 %|Total % |00-21 %|22-39 %|40-54 %|55-99 %|Total % |Total %
------------------------------------------------------------------------------------------------------------------------------------
ZERO
| 119 100| 2840 99| 2254 96| 565 95| 5778 98 | 9 100| 126 100| 99 99| 29 100| 263 100 | 6041 98
ONE
| 0 0| 20 1| 72 3| 20 3| 112 2 | 0 0| 0 0| 1 1| 0 0| 1 0 | 113 2
TWO
| 0 0| 1 0| 12 1| 5 1| 18 0 | 0 0| 0 0| 0 0| 0 0| 0 0 | 18 0
THREE
| 0 0| 0 0| 2 0| 3 1| 5 0 | 0 0| 0 0| 0 0| 0 0| 0 0 | 5 0
FOUR
| 0 0| 0 0| 0 0| 1 0| 1 0 | 0 0| 0 0| 0 0| 0 0| 0 0 | 1 0
FIVE
| 0 0| 0 0| 0 0| 0 0| 0 0 | 0 0| 0 0| 0 0| 0 0| 0 0 | 0 0
MORE THAN FIVE
| 0 0| 0 0| 0 0| 0 0| 0 0 | 0 0| 0 0| 0 0| 0 0| 0 0 | 0 0
------------------------------------------------------------------------------------------------------------------------------------
Total reported
| 119 100| 2861 100| 2340 100| 594 100| 5914 100 | 9 100| 126 100| 100 100| 29 100| 264 100 | 6178 100
|
|
|
|
|
|
|
|
|
|
|
Percent reported | 100.0| 100.0| 100.0| 100.0| 100.0 | 100.0| 100.0| 100.0| 100.0| 100.0 | 100.0
|
|
|
|
|
|
|
|
|
|
|
|
|
|
|
|
|
|
|
|
|
|
NOT REPORTED
|0|0|0|0|0
|0|0|0|0|0
|0
------------------------------------------------------------------------------------------------------------------------------------
Total
| 119 | 2861 | 2340 | 594 | 5914
| 9 | 126 | 100 | 29 | 264
| 6178
|
|
|
|
|
|
|
|
|
|
|
|
|
|
|
|
|
|
|
|
|
|
|
|
|
|
|
|
|
|
|
|
|
|
|
|
|
|
|
|
|
|
|
|
|
|
|
|
|
|
|
|
|
|
|
AVG NUM ESCAPES
| .00 | .01 | .04 | .07 | .03 | .00 | .00 | .01 | .00 | .00 | .03
Page 22 Run 11/18/03 15:08 pm
Georgia Department of Corrections Office of Planning and Analysis
Inmate statistical profile
Sample: ACTIVE PRISONERS SERVING LIFE EXCLUDING JAIL
Requestor: Statistics
Active inmates 11/18/2003
Number Of Prior Georgia Incarcerations * by current age & sex
|
MEN
|
WOMEN
|
| Age | Age | Age | Age | Men
| Age | Age | Age | Age |Women
|Grand
Prior Incarcerations|00-21 %|22-39 %|40-54 %|55-99 %|Total % |00-21 %|22-39 %|40-54 %|55-99 %|Total % |Total %
------------------------------------------------------------------------------------------------------------------------------------
ZERO
| 116 97| 2132 75| 1138 49| 310 52| 3696 62 | 9 100| 115 91| 83 83| 27 93| 234 89 | 3930 64
ONE
| 3 3| 420 15| 550 24| 135 23| 1108 19 | 0 0| 7 6| 11 11| 1 3| 19 7 | 1127 18
TWO
| 0 0| 171 6| 325 14| 82 14| 578 10 | 0 0| 2 2| 5 5| 1 3| 8 3 | 586 9
THREE
| 0 0| 92 3| 189 8| 45 8| 326 6 | 0 0| 2 2| 1 1| 0 0| 3 1 | 329 5
FOUR
| 0 0| 34 1| 78 3| 17 3| 129 2 | 0 0| 0 0| 0 0| 0 0| 0 0 | 129 2
FIVE
| 0 0| 7 0| 39 2| 1 0| 47 1 | 0 0| 0 0| 0 0| 0 0| 0 0 | 47 1
MORE THAN FIVE
| 0 0| 5 0| 21 1| 4 1| 30 1 | 0 0| 0 0| 0 0| 0 0| 0 0 | 30 0
------------------------------------------------------------------------------------------------------------------------------------
Total reported
| 119 100| 2861 100| 2340 100| 594 100| 5914 100 | 9 100| 126 100| 100 100| 29 100| 264 100 | 6178 100
|
|
|
|
|
|
|
|
|
|
|
Percent reported | 100.0| 100.0| 100.0| 100.0| 100.0 | 100.0| 100.0| 100.0| 100.0| 100.0 | 100.0
|
|
|
|
|
|
|
|
|
|
|
|
|
|
|
|
|
|
|
|
|
|
NOT REPORTED
|0|0|0|0|0
|0|0|0|0|0
|0
------------------------------------------------------------------------------------------------------------------------------------
Total
| 119 | 2861 | 2340 | 594 | 5914
| 9 | 126 | 100 | 29 | 264
| 6178
|
|
|
|
|
|
|
|
|
|
|
|
|
|
|
|
|
|
|
|
|
|
|
|
|
|
|
|
|
|
|
|
|
|
|
|
|
|
|
|
|
|
|
|
|
|
|
|
|
|
|
|
|
|
|
AVG # INCARCERATIONS| .03 | .43 | 1.03 | .90 | .71 | .00 | .13 | .24 | .10 | .17 | .69
* This data counts a parole revocation on an existing sentenCE AS A prior incarceration. Also, this data counts, for any cohort of inmates, the total number of Georgia incarcerations the inmate has had during his entire criminal career. For example, if an inmate was admitted to prison first in FY72, and then re-admitted in FY79 and FY85, he had two prior incarcerations before the FY85 admission. This inmate's records show two prior incarcerations in all three of his records since he has had two prior incarcerations in his criminal career. If the cohort of FY72 admissions is selected for analysis, two
prior incarcerations will be listed for this inmate even though in FY72, he had no prior incarcerations.
Page 23 Run 11/18/03 15:08 pm
Georgia Department of Corrections Office of Planning and Analysis
Inmate statistical profile
Sample: ACTIVE PRISONERS SERVING LIFE EXCLUDING JAIL
Requestor: Statistics
Active inmates 11/18/2003
Number Of Transfers by current age & sex
|
MEN
|
WOMEN
|
| Age | Age | Age | Age | Men
| Age | Age | Age | Age |Women
|Grand
Transfers
|00-21 %|22-39 %|40-54 %|55-99 %|Total % |00-21 %|22-39 %|40-54 %|55-99 %|Total % |Total %
------------------------------------------------------------------------------------------------------------------------------------
ZERO
| 34 29| 89 3| 24 1| 5 1| 152 3 | 2 22| 6 5| 5 5| 3 10| 16 6 | 168 3
ONE
| 60 50| 772 27| 376 16| 94 16| 1302 22 | 7 78| 50 40| 27 27| 7 24| 91 34 | 1393 23
TWO
| 20 17| 627 22| 359 15| 98 16| 1104 19 | 0 0| 34 27| 20 20| 5 17| 59 22 | 1163 19
THREE
| 5 4| 462 16| 315 13| 83 14| 865 15 | 0 0| 16 13| 14 14| 7 24| 37 14 | 902 15
FOUR
| 0 0| 298 10| 263 11| 68 11| 629 11 | 0 0| 13 10| 15 15| 2 7| 30 11 | 659 11
FIVE
| 0 0| 193 7| 216 9| 56 9| 465 8 | 0 0| 1 1| 7 7| 3 10| 11 4 | 476 8
MORE THAN FIVE
| 0 0| 420 15| 787 34| 190 32| 1397 24 | 0 0| 6 5| 12 12| 2 7| 20 8 | 1417 23
------------------------------------------------------------------------------------------------------------------------------------
Total reported
| 119 100| 2861 100| 2340 100| 594 100| 5914 100 | 9 100| 126 100| 100 100| 29 100| 264 100 | 6178 100
|
|
|
|
|
|
|
|
|
|
|
Percent reported | 100.0| 100.0| 100.0| 100.0| 100.0 | 100.0| 100.0| 100.0| 100.0| 100.0 | 100.0
|
|
|
|
|
|
|
|
|
|
|
|
|
|
|
|
|
|
|
|
|
|
NOT REPORTED
|0|0|0|0|0
|0|0|0|0|0
|0
------------------------------------------------------------------------------------------------------------------------------------
Total
| 119 | 2861 | 2340 | 594 | 5914
| 9 | 126 | 100 | 29 | 264
| 6178
|
|
|
|
|
|
|
|
|
|
|
|
|
|
|
|
|
|
|
|
|
|
|
|
|
|
|
|
|
|
|
|
|
|
|
|
|
|
|
|
|
|
|
|
|
|
|
|
|
|
|
|
|
|
|
AVG NUM TRANSFERS | .97 | 3.15 | 4.92 | 4.84 | 3.98 | .78 | 2.11 | 2.89 | 2.59 | 2.41 | 3.91
Page 24 Run 11/18/03 15:08 pm
Georgia Department of Corrections Office of Planning and Analysis
Inmate statistical profile
Sample: ACTIVE PRISONERS SERVING LIFE EXCLUDING JAIL
Requestor: Statistics
Active inmates 11/18/2003
County Of Conviction by current age & sex
|
MEN
|
WOMEN
|
| Age | Age | Age | Age | Men
| Age | Age | Age | Age |Women
|Grand
County Of Conviction|00-21 %|22-39 %|40-54 %|55-99 %|Total % |00-21 %|22-39 %|40-54 %|55-99 %|Total % |Total %
------------------------------------------------------------------------------------------------------------------------------------
Appling
| 0 0| 4 0| 4 0| 2 0| 10 0 | 0 0| 0 0| 0 0| 0 0| 0 0 | 10 0
Atkinson
| 0 0| 1 0| 3 0| 2 0| 6 0 | 0 0| 0 0| 1 1| 0 0| 1 0 | 7 0
Bacon
| 0 0| 4 0| 5 0| 0 0| 9 0 | 0 0| 0 0| 0 0| 0 0| 0 0 | 9 0
Baker
| 0 0| 1 0| 1 0| 0 0| 2 0 | 0 0| 0 0| 0 0| 0 0| 0 0 | 2 0
Baldwin
| 1 1| 16 1| 10 0| 4 1| 31 1 | 0 0| 1 1| 0 0| 0 0| 1 0 | 32 1
Banks
| 0 0| 0 0| 7 0| 5 1| 12 0 | 0 0| 0 0| 0 0| 0 0| 0 0 | 12 0
Barrow
| 0 0| 3 0| 10 0| 4 1| 17 0 | 0 0| 0 0| 0 0| 1 3| 1 0 | 18 0
Bartow
| 0 0| 23 1| 22 1| 5 1| 50 1 | 0 0| 1 1| 0 0| 0 0| 1 0 | 51 1
Ben Hill
| 0 0| 5 0| 10 0| 3 1| 18 0 | 1 11| 0 0| 0 0| 0 0| 1 0 | 19 0
Berrien
| 0 0| 3 0| 2 0| 0 0| 5 0 | 0 0| 0 0| 0 0| 0 0| 0 0 | 5 0
Bibb
| 7 6| 78 3| 99 4| 22 4| 206 3 | 1 11| 0 0| 4 4| 1 3| 6 2 | 212 3
Bleckley
| 0 0| 5 0| 4 0| 1 0| 10 0 | 0 0| 0 0| 1 1| 0 0| 1 0 | 11 0
Brantley
| 1 1| 1 0| 2 0| 4 1| 8 0 | 0 0| 0 0| 0 0| 0 0| 0 0 | 8 0
Brooks
| 0 0| 5 0| 2 0| 3 1| 10 0 | 0 0| 0 0| 0 0| 0 0| 0 0 | 10 0
Bryan
| 0 0| 7 0| 4 0| 3 1| 14 0 | 0 0| 0 0| 0 0| 1 3| 1 0 | 15 0
Bulloch
| 0 0| 18 1| 12 1| 5 1| 35 1 | 0 0| 1 1| 1 1| 2 7| 4 2 | 39 1
Burke
| 2 2| 12 0| 16 1| 1 0| 31 1 | 0 0| 0 0| 0 0| 0 0| 0 0 | 31 1
Butts
| 0 0| 15 1| 10 0| 3 1| 28 0 | 0 0| 0 0| 1 1| 0 0| 1 0 | 29 0
Calhoun
| 0 0| 2 0| 3 0| 1 0| 6 0 | 0 0| 0 0| 0 0| 0 0| 0 0 | 6 0
Camden
| 0 0| 15 1| 9 0| 0 0| 24 0 | 0 0| 0 0| 1 1| 0 0| 1 0 | 25 0
Candler
| 0 0| 1 0| 1 0| 0 0| 2 0 | 0 0| 0 0| 0 0| 0 0| 0 0 | 2 0
Carroll
| 1 1| 18 1| 17 1| 4 1| 40 1 | 0 0| 3 2| 1 1| 0 0| 4 2 | 44 1
Catoosa
| 0 0| 5 0| 9 0| 0 0| 14 0 | 0 0| 0 0| 0 0| 0 0| 0 0 | 14 0
Charlton
| 0 0| 0 0| 1 0| 0 0| 1 0 | 0 0| 2 2| 0 0| 0 0| 2 1 | 3 0
Chatham
| 10 8| 165 6| 124 5| 27 5| 326 6 | 0 0| 2 2| 2 2| 0 0| 4 2 | 330 5
Chattahoochee
| 0 0| 0 0| 3 0| 0 0| 3 0 | 0 0| 0 0| 0 0| 0 0| 0 0 | 3 0
Chattooga
| 0 0| 6 0| 7 0| 3 1| 16 0 | 0 0| 0 0| 1 1| 1 3| 2 1 | 18 0
Cherokee
| 1 1| 6 0| 20 1| 5 1| 32 1 | 0 0| 3 2| 0 0| 0 0| 3 1 | 35 1
Clarke
| 0 0| 37 1| 28 1| 9 2| 74 1 | 0 0| 4 3| 0 0| 1 3| 5 2 | 79 1
Clay
| 0 0| 1 0| 2 0| 0 0| 3 0 | 0 0| 0 0| 0 0| 0 0| 0 0 | 3 0
Clayton
| 5 4| 67 2| 60 3| 11 2| 143 2 | 0 0| 4 3| 2 2| 0 0| 6 2 | 149 2
Clinch
| 0 0| 1 0| 3 0| 1 0| 5 0 | 0 0| 0 0| 0 0| 0 0| 0 0 | 5 0
Cobb
| 5 4| 108 4| 84 4| 18 3| 215 4 | 1 11| 4 3| 7 7| 1 3| 13 5 | 228 4
Coffee
| 0 0| 8 0| 9 0| 3 1| 20 0 | 0 0| 3 2| 1 1| 0 0| 4 2 | 24 0
Colquit
| 2 2| 33 1| 28 1| 5 1| 68 1 | 0 0| 0 0| 1 1| 1 3| 2 1 | 70 1
Columbia
| 0 0| 9 0| 12 1| 1 0| 22 0 | 0 0| 1 1| 1 1| 0 0| 2 1 | 24 0
------------------------------------------------------------------------------------------------------------------------------------
(continued)
Page 25 Run 11/18/03 15:08 pm
Georgia Department of Corrections Office of Planning and Analysis
Inmate statistical profile
Sample: ACTIVE PRISONERS SERVING LIFE EXCLUDING JAIL
Requestor:
Active inmates 11/18/2003
County Of Conviction by current age & sex
Statistics (continued)
|
MEN
|
WOMEN
|
| Age | Age | Age | Age | Men
| Age | Age | Age | Age |Women
|Grand
County Of Conviction|00-21 %|22-39 %|40-54 %|55-99 %|Total % |00-21 %|22-39 %|40-54 %|55-99 %|Total % |Total %
------------------------------------------------------------------------------------------------------------------------------------
Cook
| 0 0| 5 0| 3 0| 2 0| 10 0 | 0 0| 0 0| 1 1| 0 0| 1 0 | 11 0
Coweta
| 0 0| 24 1| 16 1| 3 1| 43 1 | 0 0| 2 2| 1 1| 0 0| 3 1 | 46 1
Crawford
| 0 0| 3 0| 0 0| 0 0| 3 0 | 0 0| 0 0| 1 1| 0 0| 1 0 | 4 0
Crisp
| 1 1| 15 1| 12 1| 4 1| 32 1 | 0 0| 2 2| 1 1| 1 3| 4 2 | 36 1
Dade
| 0 0| 7 0| 5 0| 3 1| 15 0 | 0 0| 0 0| 0 0| 0 0| 0 0 | 15 0
Dawson
| 0 0| 2 0| 4 0| 0 0| 6 0 | 0 0| 0 0| 0 0| 0 0| 0 0 | 6 0
Decatur
| 0 0| 19 1| 8 0| 2 0| 29 0 | 0 0| 1 1| 0 0| 0 0| 1 0 | 30 0
DeKalb
| 9 8| 258 9| 190 8| 32 5| 489 8 | 1 11| 6 5| 3 3| 1 3| 11 4 | 500 8
Dodge
| 0 0| 6 0| 6 0| 1 0| 13 0 | 0 0| 0 0| 0 0| 0 0| 0 0 | 13 0
Dooly
| 0 0| 9 0| 7 0| 1 0| 17 0 | 0 0| 0 0| 0 0| 0 0| 0 0 | 17 0
Dougherty
| 2 2| 71 2| 43 2| 9 2| 125 2 | 0 0| 3 2| 3 3| 0 0| 6 2 | 131 2
Douglas
| 1 1| 54 2| 22 1| 8 1| 85 1 | 0 0| 1 1| 1 1| 0 0| 2 1 | 87 1
Early
| 0 0| 11 0| 5 0| 2 0| 18 0 | 0 0| 0 0| 0 0| 0 0| 0 0 | 18 0
Effingham
| 1 1| 6 0| 3 0| 1 0| 11 0 | 0 0| 0 0| 1 1| 0 0| 1 0 | 12 0
Elbert
| 0 0| 6 0| 18 1| 0 0| 24 0 | 0 0| 1 1| 0 0| 0 0| 1 0 | 25 0
Emanuel
| 0 0| 7 0| 9 0| 3 1| 19 0 | 0 0| 0 0| 1 1| 0 0| 1 0 | 20 0
Evans
| 0 0| 5 0| 1 0| 1 0| 7 0 | 0 0| 0 0| 0 0| 0 0| 0 0 | 7 0
Fannin
| 0 0| 5 0| 4 0| 2 0| 11 0 | 0 0| 0 0| 0 0| 0 0| 0 0 | 11 0
Fayette
| 0 0| 12 0| 5 0| 1 0| 18 0 | 0 0| 0 0| 0 0| 0 0| 0 0 | 18 0
Floyd
| 1 1| 22 1| 24 1| 8 1| 55 1 | 0 0| 4 3| 2 2| 1 3| 7 3 | 62 1
Forsyth
| 0 0| 3 0| 8 0| 8 1| 19 0 | 0 0| 1 1| 1 1| 0 0| 2 1 | 21 0
Franklin
| 0 0| 2 0| 4 0| 0 0| 6 0 | 0 0| 0 0| 2 2| 0 0| 2 1 | 8 0
Fulton
| 15 13| 467 16| 346 15| 93 16| 921 16 | 0 0| 14 11| 9 9| 5 17| 28 11 | 949 15
Gilmer
| 0 0| 2 0| 2 0| 3 1| 7 0 | 0 0| 0 0| 0 0| 0 0| 0 0 | 7 0
Glascock
| 0 0| 0 0| 0 0| 1 0| 1 0 | 0 0| 0 0| 0 0| 0 0| 0 0 | 1 0
Glynn
| 0 0| 34 1| 27 1| 9 2| 70 1 | 0 0| 2 2| 0 0| 0 0| 2 1 | 72 1
Gordon
| 0 0| 15 1| 14 1| 3 1| 32 1 | 0 0| 0 0| 1 1| 0 0| 1 0 | 33 1
Grady
| 3 3| 24 1| 9 0| 1 0| 37 1 | 0 0| 0 0| 0 0| 0 0| 0 0 | 37 1
Greene
| 0 0| 4 0| 4 0| 2 0| 10 0 | 0 0| 0 0| 0 0| 0 0| 0 0 | 10 0
Gwinnett
| 5 4| 70 2| 46 2| 12 2| 133 2 | 0 0| 3 2| 5 5| 1 3| 9 3 | 142 2
Habersham
| 0 0| 10 0| 13 1| 0 0| 23 0 | 0 0| 0 0| 0 0| 0 0| 0 0 | 23 0
Hall
| 3 3| 31 1| 41 2| 12 2| 87 1 | 1 11| 3 2| 3 3| 1 3| 8 3 | 95 2
Hancock
| 0 0| 3 0| 1 0| 0 0| 4 0 | 0 0| 0 0| 1 1| 0 0| 1 0 | 5 0
Haralson
| 0 0| 3 0| 2 0| 0 0| 5 0 | 0 0| 0 0| 0 0| 0 0| 0 0 | 5 0
Harris
| 0 0| 8 0| 3 0| 0 0| 11 0 | 0 0| 0 0| 0 0| 0 0| 0 0 | 11 0
------------------------------------------------------------------------------------------------------------------------------------
(continued)
Page 26 Run 11/18/03 15:08 pm
Georgia Department of Corrections Office of Planning and Analysis
Inmate statistical profile
Sample: ACTIVE PRISONERS SERVING LIFE EXCLUDING JAIL
Requestor:
Active inmates 11/18/2003
County Of Conviction by current age & sex
Statistics (continued)
|
MEN
|
WOMEN
|
| Age | Age | Age | Age | Men
| Age | Age | Age | Age |Women
|Grand
County Of Conviction|00-21 %|22-39 %|40-54 %|55-99 %|Total % |00-21 %|22-39 %|40-54 %|55-99 %|Total % |Total %
------------------------------------------------------------------------------------------------------------------------------------
Hart
| 0 0| 5 0| 3 0| 1 0| 9 0 | 0 0| 0 0| 0 0| 0 0| 0 0 | 9 0
Heard
| 0 0| 3 0| 0 0| 3 1| 6 0 | 0 0| 0 0| 0 0| 0 0| 0 0 | 6 0
Henry
| 1 1| 19 1| 11 0| 3 1| 34 1 | 0 0| 2 2| 0 0| 0 0| 2 1 | 36 1
Houston
| 1 1| 32 1| 21 1| 2 0| 56 1 | 0 0| 3 2| 2 2| 1 3| 6 2 | 62 1
Irwin
| 1 1| 3 0| 2 0| 1 0| 7 0 | 0 0| 0 0| 0 0| 0 0| 0 0 | 7 0
Jackson
| 1 1| 9 0| 10 0| 4 1| 24 0 | 0 0| 1 1| 0 0| 0 0| 1 0 | 25 0
Jasper
| 0 0| 4 0| 2 0| 0 0| 6 0 | 0 0| 0 0| 1 1| 0 0| 1 0 | 7 0
Jeff Davis
| 0 0| 3 0| 4 0| 1 0| 8 0 | 0 0| 0 0| 0 0| 0 0| 0 0 | 8 0
Jefferson
| 0 0| 5 0| 8 0| 4 1| 17 0 | 0 0| 0 0| 0 0| 0 0| 0 0 | 17 0
Jenkins
| 0 0| 1 0| 4 0| 1 0| 6 0 | 0 0| 0 0| 0 0| 0 0| 0 0 | 6 0
Johnson
| 0 0| 7 0| 4 0| 1 0| 12 0 | 0 0| 1 1| 0 0| 0 0| 1 0 | 13 0
Jones
| 0 0| 2 0| 7 0| 2 0| 11 0 | 0 0| 1 1| 0 0| 0 0| 1 0 | 12 0
Lamar
| 0 0| 6 0| 7 0| 3 1| 16 0 | 0 0| 0 0| 1 1| 0 0| 1 0 | 17 0
Lanier
| 0 0| 1 0| 0 0| 0 0| 1 0 | 0 0| 0 0| 0 0| 0 0| 0 0 | 1 0
Laurens
| 0 0| 10 0| 11 0| 1 0| 22 0 | 0 0| 1 1| 1 1| 0 0| 2 1 | 24 0
Lee
| 0 0| 1 0| 1 0| 0 0| 2 0 | 0 0| 1 1| 0 0| 0 0| 1 0 | 3 0
Liberty
| 0 0| 19 1| 8 0| 5 1| 32 1 | 0 0| 0 0| 2 2| 0 0| 2 1 | 34 1
Lincoln
| 1 1| 3 0| 0 0| 2 0| 6 0 | 0 0| 0 0| 0 0| 0 0| 0 0 | 6 0
Long
| 1 1| 7 0| 3 0| 0 0| 11 0 | 0 0| 2 2| 0 0| 0 0| 2 1 | 13 0
Lowndes
| 0 0| 37 1| 32 1| 4 1| 73 1 | 0 0| 0 0| 1 1| 1 3| 2 1 | 75 1
Lumpkin
| 0 0| 4 0| 1 0| 2 0| 7 0 | 0 0| 0 0| 0 0| 0 0| 0 0 | 7 0
Macon
| 0 0| 14 0| 8 0| 1 0| 23 0 | 0 0| 0 0| 0 0| 0 0| 0 0 | 23 0
Madison
| 0 0| 7 0| 4 0| 1 0| 12 0 | 0 0| 2 2| 1 1| 0 0| 3 1 | 15 0
Marion
| 0 0| 2 0| 1 0| 0 0| 3 0 | 0 0| 0 0| 0 0| 1 3| 1 0 | 4 0
McDuffie
| 1 1| 18 1| 16 1| 4 1| 39 1 | 0 0| 1 1| 0 0| 0 0| 1 0 | 40 1
McIntosh
| 1 1| 5 0| 9 0| 1 0| 16 0 | 0 0| 0 0| 0 0| 0 0| 0 0 | 16 0
Meriwether
| 1 1| 7 0| 9 0| 5 1| 22 0 | 0 0| 1 1| 1 1| 1 3| 3 1 | 25 0
Miller
| 0 0| 2 0| 1 0| 0 0| 3 0 | 0 0| 0 0| 0 0| 0 0| 0 0 | 3 0
Mitchell
| 0 0| 10 0| 11 0| 4 1| 25 0 | 0 0| 2 2| 0 0| 0 0| 2 1 | 27 0
Monroe
| 0 0| 9 0| 9 0| 3 1| 21 0 | 0 0| 2 2| 0 0| 0 0| 2 1 | 23 0
Montgomery
| 0 0| 0 0| 3 0| 0 0| 3 0 | 0 0| 0 0| 0 0| 0 0| 0 0 | 3 0
Morgan
| 0 0| 12 0| 3 0| 0 0| 15 0 | 0 0| 2 2| 0 0| 0 0| 2 1 | 17 0
Murray
| 0 0| 7 0| 4 0| 7 1| 18 0 | 0 0| 0 0| 0 0| 0 0| 0 0 | 18 0
Muscogee
| 5 4| 86 3| 81 3| 15 3| 187 3 | 0 0| 3 2| 3 3| 0 0| 6 2 | 193 3
Newton
| 0 0| 42 1| 18 1| 4 1| 64 1 | 0 0| 1 1| 0 0| 0 0| 1 0 | 65 1
------------------------------------------------------------------------------------------------------------------------------------
(continued)
Page 27 Run 11/18/03 15:08 pm
Georgia Department of Corrections Office of Planning and Analysis
Inmate statistical profile
Sample: ACTIVE PRISONERS SERVING LIFE EXCLUDING JAIL
Requestor:
Active inmates 11/18/2003
County Of Conviction by current age & sex
Statistics (continued)
|
MEN
|
WOMEN
|
| Age | Age | Age | Age | Men
| Age | Age | Age | Age |Women
|Grand
County Of Conviction|00-21 %|22-39 %|40-54 %|55-99 %|Total % |00-21 %|22-39 %|40-54 %|55-99 %|Total % |Total %
------------------------------------------------------------------------------------------------------------------------------------
Oconee
| 0 0| 8 0| 4 0| 0 0| 12 0 | 0 0| 0 0| 0 0| 0 0| 0 0 | 12 0
Oglethorpe
| 0 0| 3 0| 5 0| 2 0| 10 0 | 0 0| 0 0| 0 0| 0 0| 0 0 | 10 0
Paulding
| 3 3| 3 0| 8 0| 2 0| 16 0 | 0 0| 1 1| 0 0| 0 0| 1 0 | 17 0
Peach
| 0 0| 5 0| 3 0| 0 0| 8 0 | 0 0| 0 0| 1 1| 0 0| 1 0 | 9 0
Pickens
| 0 0| 2 0| 3 0| 1 0| 6 0 | 0 0| 0 0| 0 0| 0 0| 0 0 | 6 0
Pierce
| 1 1| 4 0| 4 0| 1 0| 10 0 | 0 0| 0 0| 0 0| 0 0| 0 0 | 10 0
Pike
| 0 0| 3 0| 1 0| 1 0| 5 0 | 0 0| 0 0| 0 0| 0 0| 0 0 | 5 0
Polk
| 0 0| 16 1| 5 0| 4 1| 25 0 | 0 0| 0 0| 0 0| 0 0| 0 0 | 25 0
Pulaski
| 0 0| 6 0| 1 0| 0 0| 7 0 | 0 0| 1 1| 0 0| 0 0| 1 0 | 8 0
Putnam
| 0 0| 14 0| 12 1| 4 1| 30 1 | 0 0| 0 0| 0 0| 0 0| 0 0 | 30 0
Quitman
| 0 0| 4 0| 0 0| 0 0| 4 0 | 0 0| 0 0| 0 0| 0 0| 0 0 | 4 0
Rabun
| 0 0| 4 0| 3 0| 0 0| 7 0 | 0 0| 0 0| 0 0| 0 0| 0 0 | 7 0
Randolph
| 0 0| 2 0| 6 0| 2 0| 10 0 | 0 0| 0 0| 0 0| 0 0| 0 0 | 10 0
Richmond
| 7 6| 160 6| 96 4| 21 4| 284 5 | 0 0| 10 8| 5 5| 2 7| 17 6 | 301 5
Rockdale
| 0 0| 4 0| 17 1| 5 1| 26 0 | 0 0| 1 1| 0 0| 0 0| 1 0 | 27 0
Schley
| 0 0| 3 0| 1 0| 0 0| 4 0 | 0 0| 0 0| 0 0| 0 0| 0 0 | 4 0
Screven
| 0 0| 3 0| 5 0| 3 1| 11 0 | 0 0| 0 0| 0 0| 0 0| 0 0 | 11 0
Seminole
| 0 0| 4 0| 4 0| 3 1| 11 0 | 0 0| 2 2| 0 0| 0 0| 2 1 | 13 0
Spalding
| 3 3| 38 1| 24 1| 10 2| 75 1 | 1 11| 2 2| 1 1| 1 3| 5 2 | 80 1
Stephens
| 0 0| 5 0| 3 0| 4 1| 12 0 | 0 0| 0 0| 0 0| 0 0| 0 0 | 12 0
Stewart
| 0 0| 2 0| 1 0| 0 0| 3 0 | 0 0| 0 0| 2 2| 0 0| 2 1 | 5 0
Sumter
| 1 1| 5 0| 11 0| 3 1| 20 0 | 0 0| 0 0| 0 0| 0 0| 0 0 | 20 0
Talbot
| 0 0| 8 0| 2 0| 0 0| 10 0 | 0 0| 0 0| 1 1| 0 0| 1 0 | 11 0
Taliaferro
| 0 0| 0 0| 3 0| 0 0| 3 0 | 0 0| 0 0| 0 0| 0 0| 0 0 | 3 0
Tattnall
| 0 0| 11 0| 11 0| 3 1| 25 0 | 0 0| 0 0| 1 1| 0 0| 1 0 | 26 0
Taylor
| 2 2| 9 0| 6 0| 0 0| 17 0 | 0 0| 0 0| 0 0| 0 0| 0 0 | 17 0
Telfair
| 1 1| 7 0| 2 0| 0 0| 10 0 | 0 0| 0 0| 1 1| 0 0| 1 0 | 11 0
Terrell
| 0 0| 11 0| 3 0| 2 0| 16 0 | 0 0| 0 0| 0 0| 0 0| 0 0 | 16 0
Thomas
| 1 1| 16 1| 21 1| 5 1| 43 1 | 0 0| 1 1| 2 2| 0 0| 3 1 | 46 1
Tift
| 3 3| 30 1| 29 1| 4 1| 66 1 | 0 0| 0 0| 2 2| 1 3| 3 1 | 69 1
Toombs
| 1 1| 25 1| 10 0| 1 0| 37 1 | 0 0| 1 1| 1 1| 0 0| 2 1 | 39 1
Towns
| 0 0| 0 0| 2 0| 0 0| 2 0 | 0 0| 0 0| 0 0| 0 0| 0 0 | 2 0
Treutlen
| 0 0| 4 0| 4 0| 0 0| 8 0 | 0 0| 0 0| 0 0| 0 0| 0 0 | 8 0
Troup
| 2 2| 20 1| 32 1| 6 1| 60 1 | 0 0| 1 1| 2 2| 0 0| 3 1 | 63 1
Turner
| 0 0| 6 0| 4 0| 3 1| 13 0 | 0 0| 0 0| 0 0| 0 0| 0 0 | 13 0
------------------------------------------------------------------------------------------------------------------------------------
(continued)
Page 28 Run 11/18/03 15:08 pm
Georgia Department of Corrections Office of Planning and Analysis
Inmate statistical profile
Sample: ACTIVE PRISONERS SERVING LIFE EXCLUDING JAIL
Requestor:
Active inmates 11/18/2003
County Of Conviction by current age & sex
Statistics (continued)
|
MEN
|
WOMEN
|
| Age | Age | Age | Age | Men
| Age | Age | Age | Age |Women
|Grand
County Of Conviction|00-21 %|22-39 %|40-54 %|55-99 %|Total % |00-21 %|22-39 %|40-54 %|55-99 %|Total % |Total %
------------------------------------------------------------------------------------------------------------------------------------
Twiggs
| 0 0| 1 0| 5 0| 1 0| 7 0 | 0 0| 0 0| 0 0| 0 0| 0 0 | 7 0
Union
| 0 0| 0 0| 1 0| 0 0| 1 0 | 0 0| 0 0| 0 0| 0 0| 0 0 | 1 0
Upson
| 2 2| 7 0| 5 0| 2 0| 16 0 | 0 0| 0 0| 1 1| 0 0| 1 0 | 17 0
Walker
| 0 0| 11 0| 12 1| 5 1| 28 0 | 0 0| 1 1| 2 2| 0 0| 3 1 | 31 1
Walton
| 2 2| 19 1| 24 1| 1 0| 46 1 | 0 0| 1 1| 0 0| 1 3| 2 1 | 48 1
Ware
| 0 0| 8 0| 10 0| 6 1| 24 0 | 0 0| 0 0| 0 0| 0 0| 0 0 | 24 0
Warren
| 0 0| 3 0| 4 0| 2 0| 9 0 | 0 0| 0 0| 0 0| 0 0| 0 0 | 9 0
Washington
| 0 0| 3 0| 7 0| 2 0| 12 0 | 0 0| 2 2| 0 0| 0 0| 2 1 | 14 0
Wayne
| 0 0| 5 0| 8 0| 2 0| 15 0 | 1 11| 1 1| 0 0| 0 0| 2 1 | 17 0
Webster
| 0 0| 1 0| 0 0| 0 0| 1 0 | 0 0| 0 0| 0 0| 0 0| 0 0 | 1 0
Wheeler
| 0 0| 2 0| 3 0| 2 0| 7 0 | 0 0| 0 0| 0 0| 1 3| 1 0 | 8 0
White
| 0 0| 1 0| 3 0| 0 0| 4 0 | 0 0| 0 0| 0 0| 0 0| 0 0 | 4 0
Whitfield
| 0 0| 23 1| 28 1| 9 2| 60 1 | 0 0| 3 2| 3 3| 0 0| 6 2 | 66 1
Wilcox
| 0 0| 1 0| 5 0| 1 0| 7 0 | 1 11| 0 0| 0 0| 0 0| 1 0 | 8 0
Wilkes
| 0 0| 5 0| 5 0| 2 0| 12 0 | 1 11| 0 0| 0 0| 0 0| 1 0 | 13 0
Wilkinson
| 0 0| 6 0| 3 0| 0 0| 9 0 | 0 0| 0 0| 0 0| 0 0| 0 0 | 9 0
Worth
| 0 0| 12 0| 7 0| 2 0| 21 0 | 0 0| 0 0| 0 0| 0 0| 0 0 | 21 0
------------------------------------------------------------------------------------------------------------------------------------
Total reported
| 119 100| 2861 100| 2340 100| 594 100| 5914 100 | 9 100| 126 100| 100 100| 29 100| 264 100 | 6178 100
|
|
|
|
|
|
|
|
|
|
|
Percent reported | 100.0| 100.0| 100.0| 100.0| 100.0 | 100.0| 100.0| 100.0| 100.0| 100.0 | 100.0
|
|
|
|
|
|
|
|
|
|
|
|
|
|
|
|
|
|
|
|
|
|
Not reported
|0|0|0|0|0
|0|0|0|0|0
|0
------------------------------------------------------------------------------------------------------------------------------------
Total
| 119 | 2861 | 2340 | 594 | 5914
| 9 | 126 | 100 | 29 | 264
| 6178
Page 29 Run 11/18/03 15:08 pm
Georgia Department of Corrections Office of Planning and Analysis
Inmate statistical profile
Sample: ACTIVE PRISONERS SERVING LIFE EXCLUDING JAIL
Requestor: Statistics
Active inmates 11/18/2003
Circ Of Conviction by current age & sex
|
MEN
|
WOMEN
|
| Age | Age | Age | Age | Men
| Age | Age | Age | Age |Women
|Grand
Circ Of Conviction |00-21 %|22-39 %|40-54 %|55-99 %|Total % |00-21 %|22-39 %|40-54 %|55-99 %|Total % |Total %
------------------------------------------------------------------------------------------------------------------------------------
Alapaha
| 0 0| 11 0| 11 0| 5 1| 27 0 | 0 0| 0 0| 2 2| 0 0| 2 1 | 29 0
Alcovy
| 2 2| 61 2| 42 2| 5 1| 110 2 | 0 0| 2 2| 0 0| 1 3| 3 1 | 113 2
Atlanta
| 15 13| 467 16| 346 15| 93 16| 921 16 | 0 0| 14 11| 9 9| 5 17| 28 11 | 949 15
Atlantic
| 2 2| 54 2| 36 2| 13 2| 105 2 | 0 0| 2 2| 3 3| 1 3| 6 2 | 111 2
Augusta
| 9 8| 181 6| 124 5| 23 4| 337 6 | 0 0| 11 9| 6 6| 2 7| 19 7 | 356 6
Blue Ridge
| 1 1| 6 0| 20 1| 5 1| 32 1 | 0 0| 3 2| 0 0| 0 0| 3 1 | 35 1
Brunswick
| 0 0| 61 2| 52 2| 14 2| 127 2 | 1 11| 3 2| 1 1| 0 0| 5 2 | 132 2
Chattahoochee
| 7 6| 113 4| 96 4| 15 3| 231 4 | 0 0| 3 2| 4 4| 1 3| 8 3 | 239 4
Cherokee
| 0 0| 38 1| 36 2| 8 1| 82 1 | 0 0| 1 1| 1 1| 0 0| 2 1 | 84 1
Clayton
| 5 4| 67 2| 60 3| 11 2| 143 2 | 0 0| 4 3| 2 2| 0 0| 6 2 | 149 2
Cobb
| 5 4| 108 4| 84 4| 18 3| 215 4 | 1 11| 4 3| 7 7| 1 3| 13 5 | 228 4
Conasauga
| 0 0| 30 1| 32 1| 16 3| 78 1 | 0 0| 3 2| 3 3| 0 0| 6 2 | 84 1
Cordele
| 1 1| 30 1| 34 1| 9 2| 74 1 | 2 22| 2 2| 1 1| 1 3| 6 2 | 80 1
Coweta
| 4 3| 72 3| 74 3| 21 4| 171 3 | 0 0| 7 6| 5 5| 1 3| 13 5 | 184 3
Dougherty
| 2 2| 71 2| 43 2| 9 2| 125 2 | 0 0| 3 2| 3 3| 0 0| 6 2 | 131 2
Dublin
| 0 0| 22 1| 24 1| 3 1| 49 1 | 0 0| 2 2| 1 1| 0 0| 3 1 | 52 1
Eastern
| 10 8| 165 6| 124 5| 27 5| 326 6 | 0 0| 2 2| 2 2| 0 0| 4 2 | 330 5
Flint
| 1 1| 19 1| 11 0| 3 1| 34 1 | 0 0| 2 2| 0 0| 0 0| 2 1 | 36 1
Griffin
| 5 4| 60 2| 35 1| 14 2| 114 2 | 1 11| 2 2| 2 2| 1 3| 6 2 | 120 2
Gwinnett
| 5 4| 70 2| 46 2| 12 2| 133 2 | 0 0| 3 2| 5 5| 1 3| 9 3 | 142 2
Houston
| 1 1| 32 1| 21 1| 2 0| 56 1 | 0 0| 3 2| 2 2| 1 3| 6 2 | 62 1
Lookout Mountain | 0 0| 29 1| 33 1| 11 2| 73 1 | 0 0| 1 1| 3 3| 1 3| 5 2 | 78 1
Macon
| 7 6| 86 3| 102 4| 22 4| 217 4 | 1 11| 0 0| 6 6| 1 3| 8 3 | 225 4
Middle
| 1 1| 41 1| 35 1| 10 2| 87 1 | 0 0| 3 2| 2 2| 0 0| 5 2 | 92 1
Mountain
| 0 0| 19 1| 19 1| 4 1| 42 1 | 0 0| 0 0| 0 0| 0 0| 0 0 | 42 1
Northeastern
| 3 3| 33 1| 45 2| 12 2| 93 2 | 1 11| 3 2| 3 3| 1 3| 8 3 | 101 2
Northern
| 0 0| 23 1| 34 1| 4 1| 61 1 | 0 0| 3 2| 3 3| 0 0| 6 2 | 67 1
Ocmulgee
| 1 1| 61 2| 42 2| 12 2| 116 2 | 0 0| 4 3| 2 2| 0 0| 6 2 | 122 2
Oconee
| 1 1| 26 1| 19 1| 4 1| 50 1 | 0 0| 1 1| 2 2| 1 3| 4 2 | 54 1
Ogeechee
| 1 1| 28 1| 24 1| 10 2| 63 1 | 0 0| 1 1| 2 2| 2 7| 5 2 | 68 1
Pataula
| 0 0| 35 1| 21 1| 9 2| 65 1 | 0 0| 2 2| 0 0| 0 0| 2 1 | 67 1
Piedmont
| 1 1| 12 0| 27 1| 13 2| 53 1 | 0 0| 1 1| 0 0| 1 3| 2 1 | 55 1
Rome
| 1 1| 22 1| 24 1| 8 1| 55 1 | 0 0| 4 3| 2 2| 1 3| 7 3 | 62 1
South Georgia
| 3 3| 56 2| 32 1| 8 1| 99 2 | 0 0| 3 2| 0 0| 0 0| 3 1 | 102 2
Southern
| 3 3| 91 3| 83 4| 17 3| 194 3 | 0 0| 1 1| 4 4| 2 7| 7 3 | 201 3
Southwestern
| 1 1| 26 1| 22 1| 4 1| 53 1 | 0 0| 1 1| 2 2| 0 0| 3 1 | 56 1
------------------------------------------------------------------------------------------------------------------------------------
(continued)
Page 30 Run 11/18/03 15:08 pm
Georgia Department of Corrections Office of Planning and Analysis
Inmate statistical profile
Sample: ACTIVE PRISONERS SERVING LIFE EXCLUDING JAIL
Requestor:
Active inmates 11/18/2003
Circ Of Conviction by current age & sex
Statistics (continued)
|
MEN
|
WOMEN
|
| Age | Age | Age | Age | Men
| Age | Age | Age | Age |Women
|Grand
Circ Of Conviction |00-21 %|22-39 %|40-54 %|55-99 %|Total % |00-21 %|22-39 %|40-54 %|55-99 %|Total % |Total %
------------------------------------------------------------------------------------------------------------------------------------
Stone Mountain
| 9 8| 258 9| 190 8| 32 5| 489 8 | 1 11| 6 5| 3 3| 1 3| 11 4 | 500 8
Tallapoosa
| 0 0| 19 1| 7 0| 4 1| 30 1 | 0 0| 0 0| 0 0| 0 0| 0 0 | 30 0
Tifton
| 4 3| 51 2| 42 2| 10 2| 107 2 | 0 0| 0 0| 2 2| 1 3| 3 1 | 110 2
Toombs
| 2 2| 29 1| 28 1| 11 2| 70 1 | 1 11| 1 1| 0 0| 0 0| 2 1 | 72 1
Waycross
| 2 2| 25 1| 31 1| 14 2| 72 1 | 0 0| 5 4| 1 1| 0 0| 6 2 | 78 1
Western
| 0 0| 45 2| 32 1| 9 2| 86 1 | 0 0| 4 3| 0 0| 1 3| 5 2 | 91 1
Rockdale
| 0 0| 4 0| 17 1| 5 1| 26 0 | 0 0| 1 1| 0 0| 0 0| 1 0 | 27 0
Douglas
| 1 1| 54 2| 22 1| 8 1| 85 1 | 0 0| 1 1| 1 1| 0 0| 2 1 | 87 1
Appalachian
| 0 0| 9 0| 9 0| 6 1| 24 0 | 0 0| 0 0| 0 0| 0 0| 0 0 | 24 0
Enotah
| 0 0| 5 0| 7 0| 2 0| 14 0 | 0 0| 0 0| 0 0| 0 0| 0 0 | 14 0
Bell-Forsyth
| 0 0| 3 0| 8 0| 8 1| 19 0 | 0 0| 1 1| 1 1| 0 0| 2 1 | 21 0
Towaliga
| 0 0| 30 1| 26 1| 9 2| 65 1 | 0 0| 2 2| 2 2| 0 0| 4 2 | 69 1
Paulding
| 3 3| 3 0| 8 0| 2 0| 16 0 | 0 0| 1 1| 0 0| 0 0| 1 0 | 17 0
------------------------------------------------------------------------------------------------------------------------------------
Total reported
| 119 100| 2861 100| 2340 100| 594 100| 5914 100 | 9 100| 126 100| 100 100| 29 100| 264 100 | 6178 100
|
|
|
|
|
|
|
|
|
|
|
Percent reported | 100.0| 100.0| 100.0| 100.0| 100.0 | 100.0| 100.0| 100.0| 100.0| 100.0 | 100.0
|
|
|
|
|
|
|
|
|
|
|
|
|
|
|
|
|
|
|
|
|
|
Not reported
|0|0|0|0|0
|0|0|0|0|0
|0
------------------------------------------------------------------------------------------------------------------------------------
Total
| 119 | 2861 | 2340 | 594 | 5914
| 9 | 126 | 100 | 29 | 264
| 6178
Page 31 Run 11/18/03 15:08 pm
Georgia Department of Corrections Office of Planning and Analysis
Inmate statistical profile
Sample: ACTIVE PRISONERS SERVING LIFE EXCLUDING JAIL
Requestor: Statistics
Active inmates 11/18/2003
Home County by current age & sex
|
MEN
|
WOMEN
|
| Age | Age | Age | Age | Men
| Age | Age | Age | Age |Women
|Grand
Home County
|00-21 %|22-39 %|40-54 %|55-99 %|Total % |00-21 %|22-39 %|40-54 %|55-99 %|Total % |Total %
------------------------------------------------------------------------------------------------------------------------------------
Appling
| 0 0| 4 0| 4 0| 1 0| 9 0 | 0 0| 0 0| 0 0| 0 0| 0 0 | 9 0
Atkinson
| 0 0| 1 0| 2 0| 2 0| 5 0 | 0 0| 0 0| 0 0| 0 0| 0 0 | 5 0
Bacon
| 0 0| 3 0| 6 0| 1 0| 10 0 | 0 0| 0 0| 0 0| 0 0| 0 0 | 10 0
Baker
| 0 0| 1 0| 2 0| 0 0| 3 0 | 0 0| 0 0| 0 0| 0 0| 0 0 | 3 0
Baldwin
| 1 1| 14 1| 9 0| 0 0| 24 0 | 0 0| 1 1| 0 0| 1 4| 2 1 | 26 0
Banks
| 0 0| 1 0| 4 0| 2 0| 7 0 | 0 0| 1 1| 0 0| 0 0| 1 0 | 8 0
Barrow
| 0 0| 4 0| 8 0| 5 1| 17 0 | 0 0| 0 0| 1 1| 0 0| 1 0 | 18 0
Bartow
| 0 0| 12 0| 18 1| 8 2| 38 1 | 0 0| 2 2| 1 1| 0 0| 3 1 | 41 1
Ben Hill
| 0 0| 3 0| 8 0| 3 1| 14 0 | 1 13| 0 0| 1 1| 0 0| 2 1 | 16 0
Berrien
| 0 0| 5 0| 1 0| 2 0| 8 0 | 0 0| 0 0| 0 0| 0 0| 0 0 | 8 0
Bibb
| 7 7| 75 3| 87 4| 20 4| 189 4 | 1 13| 2 2| 5 5| 0 0| 8 3 | 197 4
Bleckley
| 0 0| 6 0| 4 0| 1 0| 11 0 | 0 0| 0 0| 1 1| 0 0| 1 0 | 12 0
Brantley
| 0 0| 2 0| 1 0| 1 0| 4 0 | 0 0| 0 0| 0 0| 0 0| 0 0 | 4 0
Brooks
| 0 0| 6 0| 2 0| 2 0| 10 0 | 0 0| 0 0| 0 0| 0 0| 0 0 | 10 0
Bryan
| 0 0| 7 0| 3 0| 3 1| 13 0 | 0 0| 0 0| 0 0| 0 0| 0 0 | 13 0
Bulloch
| 0 0| 12 0| 9 0| 2 0| 23 0 | 0 0| 0 0| 1 1| 2 7| 3 1 | 26 0
Burke
| 1 1| 6 0| 10 0| 2 0| 19 0 | 0 0| 0 0| 0 0| 0 0| 0 0 | 19 0
Butts
| 0 0| 15 1| 9 0| 2 0| 26 0 | 0 0| 0 0| 0 0| 0 0| 0 0 | 26 0
Calhoun
| 0 0| 4 0| 2 0| 1 0| 7 0 | 0 0| 0 0| 0 0| 0 0| 0 0 | 7 0
Camden
| 0 0| 12 0| 5 0| 0 0| 17 0 | 0 0| 0 0| 1 1| 0 0| 1 0 | 18 0
Candler
| 0 0| 2 0| 1 0| 0 0| 3 0 | 0 0| 0 0| 0 0| 0 0| 0 0 | 3 0
Carroll
| 0 0| 19 1| 15 1| 7 1| 41 1 | 0 0| 2 2| 1 1| 0 0| 3 1 | 44 1
Catoosa
| 0 0| 2 0| 7 0| 1 0| 10 0 | 0 0| 0 0| 0 0| 0 0| 0 0 | 10 0
Charlton
| 0 0| 0 0| 1 0| 0 0| 1 0 | 0 0| 1 1| 0 0| 0 0| 1 0 | 2 0
Chatham
| 11 10| 148 6| 110 5| 27 5| 296 6 | 0 0| 2 2| 2 2| 1 4| 5 2 | 301 5
Chattahoochee
| 0 0| 0 0| 2 0| 0 0| 2 0 | 0 0| 0 0| 0 0| 0 0| 0 0 | 2 0
Chattooga
| 0 0| 4 0| 5 0| 2 0| 11 0 | 0 0| 0 0| 1 1| 1 4| 2 1 | 13 0
Cherokee
| 1 1| 9 0| 14 1| 3 1| 27 1 | 0 0| 2 2| 0 0| 0 0| 2 1 | 29 1
Clarke
| 0 0| 42 2| 24 1| 3 1| 69 1 | 0 0| 5 4| 0 0| 2 7| 7 3 | 76 1
Clay
| 0 0| 2 0| 1 0| 0 0| 3 0 | 0 0| 0 0| 0 0| 0 0| 0 0 | 3 0
Clayton
| 5 5| 61 2| 55 3| 11 2| 132 2 | 0 0| 5 4| 0 0| 0 0| 5 2 | 137 2
Clinch
| 0 0| 1 0| 1 0| 0 0| 2 0 | 0 0| 0 0| 0 0| 0 0| 0 0 | 2 0
Cobb
| 4 4| 86 3| 84 4| 13 3| 187 4 | 1 13| 3 3| 4 4| 0 0| 8 3 | 195 4
Coffee
| 0 0| 9 0| 7 0| 3 1| 19 0 | 0 0| 3 3| 2 2| 1 4| 6 2 | 25 0
Colquit
| 3 3| 27 1| 21 1| 2 0| 53 1 | 0 0| 0 0| 1 1| 0 0| 1 0 | 54 1
Columbia
| 0 0| 12 0| 8 0| 0 0| 20 0 | 0 0| 0 0| 2 2| 0 0| 2 1 | 22 0
------------------------------------------------------------------------------------------------------------------------------------
(continued)
Page 32 Run 11/18/03 15:08 pm
Georgia Department of Corrections Office of Planning and Analysis
Inmate statistical profile
Sample: ACTIVE PRISONERS SERVING LIFE EXCLUDING JAIL
Requestor: Statistics
Active inmates 11/18/2003
Home County by current age & sex
(continued)
|
MEN
|
WOMEN
|
| Age | Age | Age | Age | Men
| Age | Age | Age | Age |Women
|Grand
Home County
|00-21 %|22-39 %|40-54 %|55-99 %|Total % |00-21 %|22-39 %|40-54 %|55-99 %|Total % |Total %
------------------------------------------------------------------------------------------------------------------------------------
Cook
| 0 0| 3 0| 5 0| 2 0| 10 0 | 0 0| 0 0| 1 1| 0 0| 1 0 | 11 0
Coweta
| 0 0| 21 1| 11 1| 3 1| 35 1 | 0 0| 2 2| 1 1| 1 4| 4 2 | 39 1
Crawford
| 0 0| 1 0| 1 0| 0 0| 2 0 | 0 0| 0 0| 1 1| 0 0| 1 0 | 3 0
Crisp
| 1 1| 15 1| 6 0| 4 1| 26 0 | 0 0| 2 2| 1 1| 0 0| 3 1 | 29 1
Dade
| 0 0| 4 0| 2 0| 3 1| 9 0 | 0 0| 0 0| 0 0| 0 0| 0 0 | 9 0
Dawson
| 0 0| 2 0| 1 0| 0 0| 3 0 | 0 0| 0 0| 0 0| 0 0| 0 0 | 3 0
Decatur
| 0 0| 16 1| 7 0| 1 0| 24 0 | 0 0| 1 1| 0 0| 0 0| 1 0 | 25 0
DeKalb
| 8 7| 213 8| 147 7| 35 7| 403 8 | 0 0| 5 4| 2 2| 2 7| 9 4 | 412 7
Dodge
| 0 0| 8 0| 7 0| 0 0| 15 0 | 0 0| 0 0| 0 0| 0 0| 0 0 | 15 0
Dooly
| 0 0| 9 0| 4 0| 0 0| 13 0 | 0 0| 0 0| 0 0| 0 0| 0 0 | 13 0
Dougherty
| 2 2| 66 3| 43 2| 4 1| 115 2 | 0 0| 5 4| 1 1| 2 7| 8 3 | 123 2
Douglas
| 1 1| 19 1| 14 1| 4 1| 38 1 | 0 0| 1 1| 1 1| 0 0| 2 1 | 40 1
Early
| 0 0| 7 0| 4 0| 1 0| 12 0 | 0 0| 0 0| 0 0| 0 0| 0 0 | 12 0
Effingham
| 0 0| 5 0| 1 0| 2 0| 8 0 | 0 0| 0 0| 1 1| 0 0| 1 0 | 9 0
Elbert
| 0 0| 5 0| 16 1| 0 0| 21 0 | 0 0| 1 1| 0 0| 0 0| 1 0 | 22 0
Emanuel
| 0 0| 8 0| 7 0| 2 0| 17 0 | 0 0| 0 0| 1 1| 0 0| 1 0 | 18 0
Evans
| 0 0| 6 0| 1 0| 0 0| 7 0 | 0 0| 0 0| 0 0| 0 0| 0 0 | 7 0
Fannin
| 0 0| 6 0| 3 0| 1 0| 10 0 | 0 0| 0 0| 0 0| 0 0| 0 0 | 10 0
Fayette
| 0 0| 2 0| 5 0| 1 0| 8 0 | 0 0| 0 0| 0 0| 0 0| 0 0 | 8 0
Floyd
| 1 1| 22 1| 24 1| 6 1| 53 1 | 0 0| 3 3| 2 2| 1 4| 6 2 | 59 1
Forsyth
| 0 0| 5 0| 5 0| 3 1| 13 0 | 0 0| 0 0| 1 1| 0 0| 1 0 | 14 0
Franklin
| 0 0| 0 0| 5 0| 1 0| 6 0 | 0 0| 0 0| 0 0| 0 0| 0 0 | 6 0
Fulton
| 14 13| 511 20| 386 18| 95 18| 1006 19 | 1 13| 17 15| 12 13| 3 11| 33 14 | 1039 19
Gilmer
| 0 0| 1 0| 3 0| 2 0| 6 0 | 0 0| 0 0| 0 0| 0 0| 0 0 | 6 0
Glascock
| 0 0| 1 0| 1 0| 0 0| 2 0 | 0 0| 0 0| 0 0| 0 0| 0 0 | 2 0
Glynn
| 0 0| 30 1| 26 1| 6 1| 62 1 | 0 0| 1 1| 0 0| 0 0| 1 0 | 63 1
Gordon
| 0 0| 17 1| 11 1| 2 0| 30 1 | 0 0| 0 0| 1 1| 0 0| 1 0 | 31 1
Grady
| 3 3| 19 1| 8 0| 0 0| 30 1 | 0 0| 0 0| 0 0| 0 0| 0 0 | 30 1
Greene
| 0 0| 4 0| 1 0| 2 0| 7 0 | 0 0| 0 0| 1 1| 0 0| 1 0 | 8 0
Gwinnett
| 5 5| 70 3| 46 2| 12 2| 133 3 | 0 0| 4 3| 2 2| 0 0| 6 2 | 139 3
Habersham
| 0 0| 7 0| 10 0| 0 0| 17 0 | 0 0| 0 0| 0 0| 0 0| 0 0 | 17 0
Hall
| 1 1| 18 1| 41 2| 9 2| 69 1 | 1 13| 2 2| 3 3| 1 4| 7 3 | 76 1
Hancock
| 0 0| 3 0| 2 0| 0 0| 5 0 | 0 0| 0 0| 1 1| 0 0| 1 0 | 6 0
Haralson
| 0 0| 2 0| 1 0| 0 0| 3 0 | 0 0| 1 1| 0 0| 0 0| 1 0 | 4 0
Harris
| 0 0| 6 0| 3 0| 0 0| 9 0 | 0 0| 0 0| 0 0| 0 0| 0 0 | 9 0
------------------------------------------------------------------------------------------------------------------------------------
(continued)
Page 33 Run 11/18/03 15:08 pm
Georgia Department of Corrections Office of Planning and Analysis
Inmate statistical profile
Sample: ACTIVE PRISONERS SERVING LIFE EXCLUDING JAIL
Requestor: Statistics
Active inmates 11/18/2003
Home County by current age & sex
(continued)
|
MEN
|
WOMEN
|
| Age | Age | Age | Age | Men
| Age | Age | Age | Age |Women
|Grand
Home County
|00-21 %|22-39 %|40-54 %|55-99 %|Total % |00-21 %|22-39 %|40-54 %|55-99 %|Total % |Total %
------------------------------------------------------------------------------------------------------------------------------------
Hart
| 0 0| 0 0| 5 0| 1 0| 6 0 | 0 0| 0 0| 1 1| 0 0| 1 0 | 7 0
Heard
| 0 0| 1 0| 1 0| 2 0| 4 0 | 0 0| 0 0| 0 0| 0 0| 0 0 | 4 0
Henry
| 1 1| 21 1| 12 1| 6 1| 40 1 | 0 0| 2 2| 2 2| 0 0| 4 2 | 44 1
Houston
| 0 0| 31 1| 22 1| 6 1| 59 1 | 0 0| 2 2| 3 3| 0 0| 5 2 | 64 1
Irwin
| 1 1| 4 0| 3 0| 1 0| 9 0 | 0 0| 0 0| 0 0| 0 0| 0 0 | 9 0
Jackson
| 0 0| 13 1| 5 0| 11 2| 29 1 | 0 0| 0 0| 0 0| 0 0| 0 0 | 29 1
Jasper
| 0 0| 6 0| 2 0| 1 0| 9 0 | 0 0| 0 0| 0 0| 0 0| 0 0 | 9 0
Jeff Davis
| 0 0| 5 0| 2 0| 0 0| 7 0 | 0 0| 0 0| 0 0| 0 0| 0 0 | 7 0
Jefferson
| 0 0| 3 0| 3 0| 2 0| 8 0 | 0 0| 1 1| 0 0| 0 0| 1 0 | 9 0
Jenkins
| 0 0| 1 0| 5 0| 0 0| 6 0 | 0 0| 0 0| 0 0| 0 0| 0 0 | 6 0
Johnson
| 0 0| 3 0| 2 0| 0 0| 5 0 | 0 0| 0 0| 0 0| 0 0| 0 0 | 5 0
Jones
| 0 0| 1 0| 5 0| 0 0| 6 0 | 0 0| 0 0| 0 0| 0 0| 0 0 | 6 0
Lamar
| 0 0| 4 0| 6 0| 2 0| 12 0 | 0 0| 0 0| 1 1| 0 0| 1 0 | 13 0
Laurens
| 0 0| 10 0| 13 1| 2 0| 25 0 | 0 0| 1 1| 1 1| 0 0| 2 1 | 27 0
Lee
| 0 0| 4 0| 0 0| 0 0| 4 0 | 0 0| 0 0| 0 0| 0 0| 0 0 | 4 0
Liberty
| 0 0| 22 1| 7 0| 5 1| 34 1 | 0 0| 0 0| 2 2| 0 0| 2 1 | 36 1
Lincoln
| 1 1| 2 0| 2 0| 1 0| 6 0 | 0 0| 0 0| 0 0| 0 0| 0 0 | 6 0
Long
| 0 0| 2 0| 3 0| 0 0| 5 0 | 0 0| 2 2| 0 0| 0 0| 2 1 | 7 0
Lowndes
| 0 0| 30 1| 26 1| 7 1| 63 1 | 0 0| 0 0| 1 1| 1 4| 2 1 | 65 1
Lumpkin
| 0 0| 6 0| 5 0| 1 0| 12 0 | 0 0| 0 0| 0 0| 0 0| 0 0 | 12 0
Macon
| 0 0| 10 0| 6 0| 1 0| 17 0 | 0 0| 0 0| 1 1| 0 0| 1 0 | 18 0
Madison
| 0 0| 6 0| 6 0| 0 0| 12 0 | 0 0| 1 1| 1 1| 0 0| 2 1 | 14 0
Marion
| 0 0| 2 0| 1 0| 0 0| 3 0 | 0 0| 1 1| 0 0| 0 0| 1 0 | 4 0
McDuffie
| 1 1| 14 1| 14 1| 5 1| 34 1 | 0 0| 1 1| 0 0| 0 0| 1 0 | 35 1
McIntosh
| 1 1| 4 0| 4 0| 0 0| 9 0 | 0 0| 0 0| 0 0| 0 0| 0 0 | 9 0
Meriwether
| 1 1| 7 0| 6 0| 4 1| 18 0 | 0 0| 1 1| 0 0| 1 4| 2 1 | 20 0
Miller
| 0 0| 3 0| 1 0| 1 0| 5 0 | 0 0| 0 0| 0 0| 0 0| 0 0 | 5 0
Mitchell
| 0 0| 10 0| 10 0| 5 1| 25 0 | 0 0| 1 1| 0 0| 0 0| 1 0 | 26 0
Monroe
| 0 0| 8 0| 5 0| 1 0| 14 0 | 0 0| 0 0| 0 0| 0 0| 0 0 | 14 0
Montgomery
| 0 0| 0 0| 0 0| 0 0| 0 0 | 0 0| 0 0| 1 1| 0 0| 1 0 | 1 0
Morgan
| 0 0| 6 0| 3 0| 0 0| 9 0 | 0 0| 0 0| 0 0| 0 0| 0 0 | 9 0
Murray
| 0 0| 9 0| 3 0| 4 1| 16 0 | 0 0| 1 1| 0 0| 0 0| 1 0 | 17 0
Muscogee
| 5 5| 77 3| 63 3| 14 3| 159 3 | 0 0| 2 2| 4 4| 1 4| 7 3 | 166 3
Newton
| 0 0| 34 1| 12 1| 4 1| 50 1 | 0 0| 1 1| 0 0| 1 4| 2 1 | 52 1
Oconee
| 0 0| 4 0| 2 0| 0 0| 6 0 | 0 0| 0 0| 1 1| 0 0| 1 0 | 7 0
------------------------------------------------------------------------------------------------------------------------------------
(continued)
Page 34 Run 11/18/03 15:08 pm
Georgia Department of Corrections Office of Planning and Analysis
Inmate statistical profile
Sample: ACTIVE PRISONERS SERVING LIFE EXCLUDING JAIL
Requestor: Statistics
Active inmates 11/18/2003
Home County by current age & sex
(continued)
|
MEN
|
WOMEN
|
| Age | Age | Age | Age | Men
| Age | Age | Age | Age |Women
|Grand
Home County
|00-21 %|22-39 %|40-54 %|55-99 %|Total % |00-21 %|22-39 %|40-54 %|55-99 %|Total % |Total %
------------------------------------------------------------------------------------------------------------------------------------
Oglethorpe
| 0 0| 2 0| 4 0| 0 0| 6 0 | 0 0| 1 1| 0 0| 0 0| 1 0 | 7 0
Paulding
| 3 3| 4 0| 7 0| 2 0| 16 0 | 0 0| 0 0| 1 1| 1 4| 2 1 | 18 0
Peach
| 0 0| 7 0| 3 0| 0 0| 10 0 | 0 0| 1 1| 0 0| 0 0| 1 0 | 11 0
Pickens
| 0 0| 2 0| 3 0| 0 0| 5 0 | 0 0| 0 0| 0 0| 0 0| 0 0 | 5 0
Pierce
| 1 1| 3 0| 1 0| 1 0| 6 0 | 0 0| 0 0| 0 0| 0 0| 0 0 | 6 0
Pike
| 1 1| 1 0| 0 0| 0 0| 2 0 | 0 0| 0 0| 0 0| 0 0| 0 0 | 2 0
Polk
| 0 0| 19 1| 4 0| 3 1| 26 0 | 0 0| 0 0| 0 0| 0 0| 0 0 | 26 0
Pulaski
| 0 0| 3 0| 3 0| 0 0| 6 0 | 0 0| 1 1| 0 0| 0 0| 1 0 | 7 0
Putnam
| 0 0| 6 0| 13 1| 3 1| 22 0 | 0 0| 0 0| 0 0| 0 0| 0 0 | 22 0
Quitman
| 0 0| 2 0| 0 0| 0 0| 2 0 | 0 0| 0 0| 0 0| 0 0| 0 0 | 2 0
Rabun
| 0 0| 4 0| 3 0| 0 0| 7 0 | 0 0| 0 0| 0 0| 0 0| 0 0 | 7 0
Randolph
| 0 0| 2 0| 4 0| 2 0| 8 0 | 0 0| 0 0| 0 0| 0 0| 0 0 | 8 0
Richmond
| 7 7| 144 6| 88 4| 14 3| 253 5 | 0 0| 11 9| 3 3| 2 7| 16 7 | 269 5
Rockdale
| 0 0| 5 0| 13 1| 3 1| 21 0 | 0 0| 1 1| 0 0| 0 0| 1 0 | 22 0
Schley
| 0 0| 2 0| 1 0| 0 0| 3 0 | 0 0| 0 0| 0 0| 0 0| 0 0 | 3 0
Screven
| 0 0| 2 0| 2 0| 3 1| 7 0 | 0 0| 0 0| 0 0| 0 0| 0 0 | 7 0
Seminole
| 0 0| 5 0| 4 0| 1 0| 10 0 | 0 0| 1 1| 0 0| 0 0| 1 0 | 11 0
Spalding
| 2 2| 35 1| 25 1| 7 1| 69 1 | 1 13| 2 2| 0 0| 1 4| 4 2 | 73 1
Stephens
| 0 0| 4 0| 3 0| 5 1| 12 0 | 0 0| 0 0| 0 0| 0 0| 0 0 | 12 0
Stewart
| 0 0| 2 0| 1 0| 0 0| 3 0 | 0 0| 0 0| 0 0| 0 0| 0 0 | 3 0
Sumter
| 1 1| 3 0| 13 1| 4 1| 21 0 | 0 0| 0 0| 0 0| 0 0| 0 0 | 21 0
Talbot
| 0 0| 7 0| 1 0| 0 0| 8 0 | 0 0| 0 0| 1 1| 0 0| 1 0 | 9 0
Taliaferro
| 0 0| 0 0| 1 0| 0 0| 1 0 | 0 0| 0 0| 0 0| 0 0| 0 0 | 1 0
Tattnall
| 0 0| 11 0| 3 0| 0 0| 14 0 | 0 0| 0 0| 1 1| 0 0| 1 0 | 15 0
Taylor
| 1 1| 11 0| 5 0| 1 0| 18 0 | 0 0| 0 0| 0 0| 0 0| 0 0 | 18 0
Telfair
| 1 1| 6 0| 2 0| 1 0| 10 0 | 0 0| 0 0| 1 1| 0 0| 1 0 | 11 0
Terrell
| 0 0| 12 0| 2 0| 0 0| 14 0 | 0 0| 0 0| 0 0| 0 0| 0 0 | 14 0
Thomas
| 1 1| 14 1| 15 1| 6 1| 36 1 | 0 0| 0 0| 2 2| 0 0| 2 1 | 38 1
Tift
| 2 2| 24 1| 23 1| 6 1| 55 1 | 0 0| 0 0| 0 0| 1 4| 1 0 | 56 1
Toombs
| 0 0| 14 1| 12 1| 0 0| 26 0 | 0 0| 1 1| 0 0| 0 0| 1 0 | 27 0
Treutlen
| 0 0| 3 0| 3 0| 0 0| 6 0 | 0 0| 0 0| 0 0| 0 0| 0 0 | 6 0
Troup
| 3 3| 15 1| 25 1| 4 1| 47 1 | 0 0| 1 1| 1 1| 0 0| 2 1 | 49 1
Turner
| 0 0| 7 0| 5 0| 0 0| 12 0 | 0 0| 0 0| 0 0| 0 0| 0 0 | 12 0
Twiggs
| 0 0| 2 0| 5 0| 0 0| 7 0 | 0 0| 0 0| 0 0| 0 0| 0 0 | 7 0
Upson
| 2 2| 7 0| 5 0| 1 0| 15 0 | 0 0| 0 0| 1 1| 0 0| 1 0 | 16 0
------------------------------------------------------------------------------------------------------------------------------------
(continued)
Page 35 Run 11/18/03 15:08 pm
Georgia Department of Corrections Office of Planning and Analysis
Inmate statistical profile
Sample: ACTIVE PRISONERS SERVING LIFE EXCLUDING JAIL
Requestor: Statistics
Active inmates 11/18/2003
Home County by current age & sex
(continued)
|
MEN
|
WOMEN
|
| Age | Age | Age | Age | Men
| Age | Age | Age | Age |Women
|Grand
Home County
|00-21 %|22-39 %|40-54 %|55-99 %|Total % |00-21 %|22-39 %|40-54 %|55-99 %|Total % |Total %
------------------------------------------------------------------------------------------------------------------------------------
Walker
| 0 0| 11 0| 11 1| 3 1| 25 0 | 0 0| 1 1| 2 2| 0 0| 3 1 | 28 1
Walton
| 2 2| 16 1| 19 1| 2 0| 39 1 | 0 0| 0 0| 0 0| 1 4| 1 0 | 40 1
Ware
| 0 0| 9 0| 12 1| 7 1| 28 1 | 0 0| 0 0| 0 0| 0 0| 0 0 | 28 1
Warren
| 0 0| 2 0| 4 0| 2 0| 8 0 | 0 0| 0 0| 0 0| 0 0| 0 0 | 8 0
Washington
| 0 0| 8 0| 9 0| 1 0| 18 0 | 0 0| 2 2| 0 0| 0 0| 2 1 | 20 0
Wayne
| 0 0| 5 0| 11 1| 3 1| 19 0 | 1 13| 1 1| 0 0| 0 0| 2 1 | 21 0
Webster
| 0 0| 2 0| 1 0| 0 0| 3 0 | 0 0| 0 0| 0 0| 0 0| 0 0 | 3 0
Wheeler
| 0 0| 1 0| 2 0| 1 0| 4 0 | 0 0| 0 0| 0 0| 0 0| 0 0 | 4 0
White
| 0 0| 1 0| 5 0| 0 0| 6 0 | 0 0| 0 0| 0 0| 0 0| 0 0 | 6 0
Whitfield
| 0 0| 10 0| 25 1| 10 2| 45 1 | 0 0| 1 1| 1 1| 0 0| 2 1 | 47 1
Wilcox
| 0 0| 0 0| 4 0| 1 0| 5 0 | 1 13| 0 0| 0 0| 0 0| 1 0 | 6 0
Wilkes
| 0 0| 3 0| 3 0| 3 1| 9 0 | 0 0| 0 0| 0 0| 0 0| 0 0 | 9 0
Wilkinson
| 0 0| 6 0| 4 0| 0 0| 10 0 | 0 0| 0 0| 0 0| 0 0| 0 0 | 10 0
Worth
| 0 0| 9 0| 8 0| 2 0| 19 0 | 0 0| 1 1| 1 1| 0 0| 2 1 | 21 0
------------------------------------------------------------------------------------------------------------------------------------
Total reported
| 107 100| 2585 100| 2093 100| 520 100| 5305 100 | 8 100| 117 100| 91 100| 28 100| 244 100 | 5549 100
|
|
|
|
|
|
|
|
|
|
|
Percent reported |
89.9|
90.4|
89.4|
87.5|
89.7 |
88.9|
92.9|
91.0|
96.6|
92.4 |
89.8
|
|
|
|
|
|
|
|
|
|
|
|
|
|
|
|
|
|
|
|
|
|
Not reported
| 12 | 276 | 247 | 74 | 609
| 1 | 9 | 9 | 1 | 20
| 629
------------------------------------------------------------------------------------------------------------------------------------
Total
| 119 | 2861 | 2340 | 594 | 5914
| 9 | 126 | 100 | 29 | 264
| 6178
Georgia Department of Corrections
Page 36 Run 11/18/03 15:08 pm
Office of Planning and Analysis
Inmate statistical profile
Sample: ACTIVE PRISONERS SERVING LIFE EXCLUDING JAIL
Requestor: Statistics
Active inmates 11/18/2003
Prison Sentence In Years by current age & sex
|
MEN
|
WOMEN
|
| Age | Age | Age | Age | Men
| Age | Age | Age | Age |Women
|Grand
Sentence In Years |00-21 %|22-39 %|40-54 %|55-99 %|Total % |00-21 %|22-39 %|40-54 %|55-99 %|Total % |Total %
------------------------------------------------------------------------------------------------------------------------------------
0-1
| 0 0| 0 0| 0 0| 0 0| 0 0 | 0 0| 0 0| 0 0| 0 0| 0 0 | 0 0
1.1-2
| 0 0| 0 0| 0 0| 0 0| 0 0 | 0 0| 0 0| 0 0| 0 0| 0 0 | 0 0
2.1-3
| 0 0| 0 0| 0 0| 0 0| 0 0 | 0 0| 0 0| 0 0| 0 0| 0 0 | 0 0
3.1-4
| 0 0| 0 0| 0 0| 0 0| 0 0 | 0 0| 0 0| 0 0| 0 0| 0 0 | 0 0
4.1-5
| 0 0| 0 0| 0 0| 0 0| 0 0 | 0 0| 0 0| 0 0| 0 0| 0 0 | 0 0
5.1-6
| 0 0| 0 0| 0 0| 0 0| 0 0 | 0 0| 0 0| 0 0| 0 0| 0 0 | 0 0
6.1-7
| 0 0| 0 0| 0 0| 0 0| 0 0 | 0 0| 0 0| 0 0| 0 0| 0 0 | 0 0
7.1-8
| 0 0| 0 0| 0 0| 0 0| 0 0 | 0 0| 0 0| 0 0| 0 0| 0 0 | 0 0
8.1-9
| 0 0| 0 0| 0 0| 0 0| 0 0 | 0 0| 0 0| 0 0| 0 0| 0 0 | 0 0
9.1-10
| 0 0| 0 0| 0 0| 0 0| 0 0 | 0 0| 0 0| 0 0| 0 0| 0 0 | 0 0
10.1-12
| 0 0| 0 0| 0 0| 0 0| 0 0 | 0 0| 0 0| 0 0| 0 0| 0 0 | 0 0
12.1-15
| 0 0| 0 0| 0 0| 0 0| 0 0 | 0 0| 0 0| 0 0| 0 0| 0 0 | 0 0
15.1-20
| 0 0| 0 0| 0 0| 0 0| 0 0 | 0 0| 0 0| 0 0| 0 0| 0 0 | 0 0
20.1-OVER
| 0 0| 0 0| 0 0| 0 0| 0 0 | 0 0| 0 0| 0 0| 0 0| 0 0 | 0 0
LIFE
| 119 100| 2861 100| 2340 100| 594 100| 5914 100 | 9 100| 126 100| 100 100| 29 100| 264 100 | 6178 100
DEATH
| 0 0| 0 0| 0 0| 0 0| 0 0 | 0 0| 0 0| 0 0| 0 0| 0 0 | 0 0
LIFE W/O PAROLE
| 0 0| 0 0| 0 0| 0 0| 0 0 | 0 0| 0 0| 0 0| 0 0| 0 0 | 0 0
YOUTHFUL OFFENDERS | 0 0| 0 0| 0 0| 0 0| 0 0 | 0 0| 0 0| 0 0| 0 0| 0 0 | 0 0
------------------------------------------------------------------------------------------------------------------------------------
Total reported
| 119 100| 2861 100| 2340 100| 594 100| 5914 100 | 9 100| 126 100| 100 100| 29 100| 264 100 | 6178 100
|
|
|
|
|
|
|
|
|
|
|
Percent reported | 100.0| 100.0| 100.0| 100.0| 100.0 | 100.0| 100.0| 100.0| 100.0| 100.0 | 100.0
|
|
|
|
|
|
|
|
|
|
|
|
|
|
|
|
|
|
|
|
|
|
NOT REPORTED
|0|0|0|0|0
|0|0|0|0|0
|0
------------------------------------------------------------------------------------------------------------------------------------
Total
| 119 | 2861 | 2340 | 594 | 5914
| 9 | 126 | 100 | 29 | 264
| 6178
|
|
|
|
|
|
|
|
|
|
|
|
|
|
|
|
|
|
|
|
|
|
|
|
|
|
|
|
|
|
|
|
|
|
|
|
|
|
|
|
|
|
|
|
|
|
|
|
|
|
|
|
|
|
|
AVG EXCLUDING
|
|
|
|
|
|
|
|
|
|
|
LIFE, DEATH, YO
| .00 | .00 | .00 | .00 | .00 | .00 | .00 | .00 | .00 | .00 | .00
|
|
|
|
|
|
|
|
|
|
|
|
|
|
|
|
|
|
|
|
|
|
|
|
|
|
|
|
|
|
|
|
|
|
|
|
|
|
|
|
|
|
|
|
|
|
|
|
|
|
|
|
|
|
|
AVG INCLUDING
|
|
|
|
|
|
|
|
|
|
|
LIFE=21, YO=3 YRS | 21.00 | 21.00 | 21.00 | 21.00 | 21.00 | 21.00 | 21.00 | 21.00 | 21.00 | 21.00 | 21.00
Page 37 Run 11/18/03 15:08 pm
Georgia Department of Corrections Office of Planning and Analysis
Inmate statistical profile
Sample: ACTIVE PRISONERS SERVING LIFE EXCLUDING JAIL
Requestor: Statistics
Active inmates 11/18/2003
Probation To Follow Prison by current age & sex
|
MEN
|
WOMEN
|
| Age | Age | Age | Age | Men
| Age | Age | Age | Age |Women
|Grand
Prob After Prison |00-21 %|22-39 %|40-54 %|55-99 %|Total % |00-21 %|22-39 %|40-54 %|55-99 %|Total % |Total %
------------------------------------------------------------------------------------------------------------------------------------
PROBATION TO FOLLOW | 3 3| 206 7| 203 9| 51 9| 463 8 | 1 11| 3 2| 7 7| 1 3| 12 5 | 475 8
NO PROBATION
| 116 97| 2655 93| 2137 91| 544 92| 5452 92 | 8 89| 123 98| 93 93| 28 97| 252 95 | 5704 92
------------------------------------------------------------------------------------------------------------------------------------
Total reported
| 119 100| 2861 100| 2340 100| 595 100| 5915 100 | 9 100| 126 100| 100 100| 29 100| 264 100 | 6179 100
|
|
|
|
|
|
|
|
|
|
|
Percent reported | 100.0| 100.0| 100.0| 100.0| 100.0 | 100.0| 100.0| 100.0| 100.0| 100.0 | 100.0
|
|
|
|
|
|
|
|
|
|
|
|
|
|
|
|
|
|
|
|
|
|
NOT REPORTED
|0|0|0|0|0
|0|0|0|0|0
|0
------------------------------------------------------------------------------------------------------------------------------------
Total
| 119 | 2861 | 2340 | 594 | 5914
| 9 | 126 | 100 | 29 | 264
| 6178
Page 38 Run 11/18/03 15:08 pm
Georgia Department of Corrections Office of Planning and Analysis
Inmate statistical profile
Sample: ACTIVE PRISONERS SERVING LIFE EXCLUDING JAIL
Requestor: Statistics
Active inmates 11/18/2003
Admission Type by current age & sex
|
MEN
|
WOMEN
|
| Age | Age | Age | Age | Men
| Age | Age | Age | Age |Women
|Grand
Admission Type
|00-21 %|22-39 %|40-54 %|55-99 %|Total % |00-21 %|22-39 %|40-54 %|55-99 %|Total % |Total %
------------------------------------------------------------------------------------------------------------------------------------
COMMITTED FROM COURT| 116 97| 2484 87| 1788 76| 430 72| 4818 81 | 9 100| 120 95| 92 92| 27 93| 248 94 | 5066 82
RETURN APPEAL/BOND | 0 0| 2 0| 1 0| 0 0| 3 0 | 0 0| 0 0| 0 0| 0 0| 0 0 | 3 0
PAROLE REV/NEW SENT | 0 0| 221 8| 314 13| 98 16| 633 11 | 0 0| 3 2| 7 7| 0 0| 10 4 | 643 10
PAR REV/NO NEW SENT | 0 0| 16 1| 72 3| 23 4| 111 2 | 0 0| 1 1| 1 1| 0 0| 2 1 | 113 2
PROB VIOL/TOTAL REV | 0 0| 0 0| 0 0| 0 0| 0 0 | 0 0| 0 0| 0 0| 0 0| 0 0 | 0 0
PROB VIOL/PARTIAL | 0 0| 18 1| 46 2| 6 1| 70 1 | 0 0| 0 0| 0 0| 0 0| 0 0 | 70 1
ADMIT FM OTHER CUST | 0 0| 2 0| 1 0| 5 1| 8 0 | 0 0| 0 0| 0 0| 0 0| 0 0 | 8 0
SHOCK INCARCERATION | 0 0| 0 0| 0 0| 0 0| 0 0 | 0 0| 0 0| 0 0| 0 0| 0 0 | 0 0
PROB REV/REMAINDER | 3 3| 101 4| 55 2| 3 1| 162 3 | 0 0| 2 2| 0 0| 2 7| 4 2 | 166 3
NEW SENT/PAR REV PND| 0 0| 2 0| 3 0| 2 0| 7 0 | 0 0| 0 0| 0 0| 0 0| 0 0 | 7 0
LIFE W/O PAROLE
| 0 0| 7 0| 4 0| 0 0| 11 0 | 0 0| 0 0| 0 0| 0 0| 0 0 | 11 0
PAROLE REV BOOT CAMP| 0 0| 0 0| 0 0| 0 0| 0 0 | 0 0| 0 0| 0 0| 0 0| 0 0 | 0 0
PAR REV/RSN UNKNOWN | 0 0| 4 0| 38 2| 27 5| 69 1 | 0 0| 0 0| 0 0| 0 0| 0 0 | 69 1
PROBATION/PAROLE REV| 0 0| 0 0| 0 0| 0 0| 0 0 | 0 0| 0 0| 0 0| 0 0| 0 0 | 0 0
PB PAROLE RESCINDED | 0 0| 0 0| 0 0| 0 0| 0 0 | 0 0| 0 0| 0 0| 0 0| 0 0 | 0 0
PROB REVOC/SPEC COND| 0 0| 0 0| 0 0| 0 0| 0 0 | 0 0| 0 0| 0 0| 0 0| 0 0 | 0 0
PAR REV/REVOC CENTER| 0 0| 3 0| 16 1| 0 0| 19 0 | 0 0| 0 0| 0 0| 0 0| 0 0 | 19 0
INFORMATION ONLY | 0 0| 0 0| 0 0| 0 0| 0 0 | 0 0| 0 0| 0 0| 0 0| 0 0 | 0 0
INCOMPLETE SENT PKG | 0 0| 0 0| 0 0| 0 0| 0 0 | 0 0| 0 0| 0 0| 0 0| 0 0 | 0 0
HANCOCK REVOC CENTER| 0 0| 0 0| 0 0| 0 0| 0 0 | 0 0| 0 0| 0 0| 0 0| 0 0 | 0 0
WHITWORTH DETENTION | 0 0| 0 0| 2 0| 0 0| 2 0 | 0 0| 0 0| 0 0| 0 0| 0 0 | 2 0
DCYS AT RISK
| 0 0| 0 0| 0 0| 0 0| 0 0 | 0 0| 0 0| 0 0| 0 0| 0 0 | 0 0
OTHER
| 0 0| 0 0| 0 0| 0 0| 0 0 | 0 0| 0 0| 0 0| 0 0| 0 0 | 0 0
------------------------------------------------------------------------------------------------------------------------------------
Total reported
| 119 100| 2860 100| 2340 100| 594 100| 5913 100 | 9 100| 126 100| 100 100| 29 100| 264 100 | 6177 100
|
|
|
|
|
|
|
|
|
|
|
Percent reported | 100.0| 100.0| 100.0| 100.0| 100.0 | 100.0| 100.0| 100.0| 100.0| 100.0 | 100.0
|
|
|
|
|
|
|
|
|
|
|
|
|
|
|
|
|
|
|
|
|
|
UNKNOWN
|0|1|0|0|1
|0|0|0|0|0
|1
------------------------------------------------------------------------------------------------------------------------------------
Total
| 119 | 2861 | 2340 | 594 | 5914
| 9 | 126 | 100 | 29 | 264
| 6178
Page 39 Run 11/18/03 15:08 pm
Georgia Department of Corrections Office of Planning and Analysis
Inmate statistical profile
Sample: ACTIVE PRISONERS SERVING LIFE EXCLUDING JAIL
Requestor: Statistics
Active inmates 11/18/2003
Release Type by current age & sex
|
MEN
|
WOMEN
|
| Age | Age | Age | Age | Men
| Age | Age | Age | Age |Women
|Grand
Release Type
|00-21 %|22-39 %|40-54 %|55-99 %|Total % |00-21 %|22-39 %|40-54 %|55-99 %|Total % |Total %
------------------------------------------------------------------------------------------------------------------------------------
PAROLE
| 0 0| 1 0| 0 0| 0 0| 1 0 | 0 0| 0 0| 0 0| 0 0| 0 0 | 1 0
Active
| 119 100| 2861 100| 2340 100| 594 100| 5914 100 | 9 100| 126 100| 100 100| 29 100| 264 100 | 6178 100
------------------------------------------------------------------------------------------------------------------------------------
Total
| 119 | 2861 | 2340 | 594 | 5914
| 9 | 126 | 100 | 29 | 264
| 6178
Page 40 Run 11/18/03 15:08 pm
Georgia Department of Corrections Office of Planning and Analysis
Inmate statistical profile
Sample: ACTIVE PRISONERS SERVING LIFE EXCLUDING JAIL
Requestor: Statistics
Active inmates 11/18/2003
Inst By Group by current age & sex
|
MEN
|
WOMEN
|
| Age | Age | Age | Age | Men
| Age | Age | Age | Age |Women
|Grand
Inst By Group
|00-21 %|22-39 %|40-54 %|55-99 %|Total % |00-21 %|22-39 %|40-54 %|55-99 %|Total % |Total %
------------------------------------------------------------------------------------------------------------------------------------
County jails
| 0 0| 0 0| 0 0| 0 0| 0 0 | 0 0| 0 0| 0 0| 0 0| 0 0 | 0 0
Transitional centers| 0 0| 8 0| 18 1| 5 1| 31 1 | 0 0| 0 0| 0 0| 0 0| 0 0 | 31 1
County camps
| 0 0| 1 0| 7 0| 1 0| 9 0 | 0 0| 0 0| 0 0| 0 0| 0 0 | 9 0
Inmate boot camps | 0 0| 0 0| 0 0| 0 0| 0 0 | 0 0| 0 0| 0 0| 0 0| 0 0 | 0 0
State prisons
| 119 100| 2715 95| 2178 93| 564 95| 5576 94 | 9 100| 126 100| 100 100| 29 100| 264 100 | 5840 95
Private prisons
| 0 0| 136 5| 136 6| 23 4| 295 5 | 0 0| 0 0| 0 0| 0 0| 0 0 | 295 5
Other
| 0 0| 0 0| 1 0| 1 0| 2 0 | 0 0| 0 0| 0 0| 0 0| 0 0 | 2 0
------------------------------------------------------------------------------------------------------------------------------------
Total reported
| 119 100| 2860 100| 2340 100| 594 100| 5913 100 | 9 100| 126 100| 100 100| 29 100| 264 100 | 6177 100
|
|
|
|
|
|
|
|
|
|
|
Percent reported | 100.0| 100.0| 100.0| 100.0| 100.0 | 100.0| 100.0| 100.0| 100.0| 100.0 | 100.0
|
|
|
|
|
|
|
|
|
|
|
|
|
|
|
|
|
|
|
|
|
|
Not reported
|0|0|0|0|0
|0|0|0|0|0
|0
------------------------------------------------------------------------------------------------------------------------------------
Total
| 119 | 2861 | 2340 | 594 | 5914
| 9 | 126 | 100 | 29 | 264
| 6178
Page 41 Run 11/18/03 15:08 pm
Georgia Department of Corrections Office of Planning and Analysis
Inmate statistical profile
Sample: ACTIVE PRISONERS SERVING LIFE EXCLUDING JAIL
Requestor: Statistics
Active inmates 11/18/2003
Institution by current age & sex
|
MEN
|
WOMEN
|
| Age | Age | Age | Age | Men
| Age | Age | Age | Age |Women
|Grand
Institution
|00-21 %|22-39 %|40-54 %|55-99 %|Total % |00-21 %|22-39 %|40-54 %|55-99 %|Total % |Total %
------------------------------------------------------------------------------------------------------------------------------------
Albany Trans Ctr | 0 0| 1 0| 3 0| 0 0| 4 0 | 0 0| 0 0| 0 0| 0 0| 0 0 | 4 0
Atlanta Trans Ctr(M)| 0 0| 4 0| 14 1| 3 1| 21 0 | 0 0| 0 0| 0 0| 0 0| 0 0 | 21 0
Macon Trans Ctr
| 0 0| 3 0| 1 0| 0 0| 4 0 | 0 0| 0 0| 0 0| 0 0| 0 0 | 4 0
Savannah Mens TC | 0 0| 0 0| 0 0| 1 0| 1 0 | 0 0| 0 0| 0 0| 0 0| 0 0 | 1 0
Augusta Trans Ctr | 0 0| 1 0| 0 0| 0 0| 1 0 | 0 0| 0 0| 0 0| 0 0| 0 0 | 1 0
Lagrange Trans Ctr | 0 0| 0 0| 0 0| 1 0| 1 0 | 0 0| 0 0| 0 0| 0 0| 0 0 | 1 0
Central State Hosp | 0 0| 0 0| 1 0| 1 0| 2 0 | 0 0| 0 0| 0 0| 0 0| 0 0 | 2 0
Coweta County
| 0 0| 0 0| 1 0| 0 0| 1 0 | 0 0| 0 0| 0 0| 0 0| 0 0 | 1 0
Jackson County
| 0 0| 0 0| 0 0| 1 0| 1 0 | 0 0| 0 0| 0 0| 0 0| 0 0 | 1 0
Jefferson County | 0 0| 0 0| 2 0| 0 0| 2 0 | 0 0| 0 0| 0 0| 0 0| 0 0 | 2 0
Mitchell County
| 0 0| 0 0| 1 0| 0 0| 1 0 | 0 0| 0 0| 0 0| 0 0| 0 0 | 1 0
Screven County
| 0 0| 0 0| 1 0| 0 0| 1 0 | 0 0| 0 0| 0 0| 0 0| 0 0 | 1 0
Spalding County
| 0 0| 1 0| 0 0| 0 0| 1 0 | 0 0| 0 0| 0 0| 0 0| 0 0 | 1 0
Terrell County
| 0 0| 0 0| 1 0| 0 0| 1 0 | 0 0| 0 0| 0 0| 0 0| 0 0 | 1 0
Clayton County
| 0 0| 0 0| 1 0| 0 0| 1 0 | 0 0| 0 0| 0 0| 0 0| 0 0 | 1 0
Ware Prison
| 5 4| 153 6| 99 4| 15 3| 272 5 | 0 0| 0 0| 0 0| 0 0| 0 0 | 272 5
Lowndes Prison
| 0 0| 1 0| 6 0| 0 0| 7 0 | 0 0| 0 0| 0 0| 0 0| 0 0 | 7 0
Dodge Prison
| 0 0| 50 2| 73 3| 12 2| 135 2 | 0 0| 0 0| 0 0| 0 0| 0 0 | 135 2
Phillips Prison
| 3 3| 90 3| 96 4| 25 4| 214 4 | 0 0| 0 0| 0 0| 0 0| 0 0 | 214 4
Walker Prison
| 0 0| 13 0| 29 1| 7 1| 49 1 | 0 0| 0 0| 0 0| 0 0| 0 0 | 49 1
Wayne Prison
| 0 0| 1 0| 3 0| 0 0| 4 0 | 0 0| 0 0| 0 0| 0 0| 0 0 | 4 0
Arrendale Prison | 25 22| 113 4| 43 2| 5 1| 186 3 | 0 0| 0 0| 0 0| 0 0| 0 0 | 186 3
Montgomery Prison | 0 0| 1 0| 4 0| 1 0| 6 0 | 0 0| 0 0| 0 0| 0 0| 0 0 | 6 0
Lee Prison
| 0 0| 27 1| 35 2| 4 1| 66 1 | 0 0| 0 0| 0 0| 0 0| 0 0 | 66 1
Georgia State Prison| 6 5| 230 9| 199 9| 29 5| 464 8 | 0 0| 0 0| 0 0| 0 0| 0 0 | 464 8
Mens Prison
| 0 0| 9 0| 34 2| 74 13| 117 2 | 0 0| 0 0| 0 0| 0 0| 0 0 | 117 2
Jackson Prison-Diag | 7 6| 23 1| 9 0| 2 0| 41 1 | 0 0| 0 0| 0 0| 0 0| 0 0 | 41 1
Jackson Prison-Perm | 0 0| 1 0| 1 0| 0 0| 2 0 | 0 0| 0 0| 0 0| 0 0| 0 0 | 2 0
Coastal Prison
| 8 7| 45 2| 19 1| 4 1| 76 1 | 0 0| 0 0| 0 0| 0 0| 0 0 | 76 1
Scott Prison
| 0 0| 57 2| 58 3| 11 2| 126 2 | 0 0| 0 0| 0 0| 0 0| 0 0 | 126 2
Rivers Prison
| 0 0| 77 3| 105 5| 17 3| 199 4 | 0 0| 0 0| 0 0| 0 0| 0 0 | 199 3
Rutledge Prison
| 0 0| 36 1| 49 2| 19 3| 104 2 | 0 0| 0 0| 0 0| 0 0| 0 0 | 104 2
Central Prison
| 0 0| 69 3| 112 5| 33 6| 214 4 | 0 0| 0 0| 0 0| 0 0| 0 0 | 214 4
Augusta Med Prison | 7 6| 119 4| 102 5| 36 6| 264 5 | 0 0| 0 0| 0 0| 0 0| 0 0 | 264 5
Rogers Prison
| 0 0| 6 0| 12 1| 1 0| 19 0 | 0 0| 0 0| 0 0| 0 0| 0 0 | 19 0
Burruss Prison
| 0 0| 1 0| 8 0| 3 1| 12 0 | 0 0| 0 0| 0 0| 0 0| 0 0 | 12 0
------------------------------------------------------------------------------------------------------------------------------------
(continued)
Page 42 Run 11/18/03 15:08 pm
Georgia Department of Corrections Office of Planning and Analysis
Inmate statistical profile
Sample: ACTIVE PRISONERS SERVING LIFE EXCLUDING JAIL
Requestor:
Active inmates 11/18/2003
Institution by current age & sex
Statistics (CONTINUED)
|
MEN
|
WOMEN
|
| Age | Age | Age | Age | Men
| Age | Age | Age | Age |Women
|Grand
Institution
|00-21 %|22-39 %|40-54 %|55-99 %|Total % |00-21 %|22-39 %|40-54 %|55-99 %|Total % |Total %
------------------------------------------------------------------------------------------------------------------------------------
Bostick Prison
| 0 0| 10 0| 37 2| 30 5| 77 1 | 0 0| 0 0| 0 0| 0 0| 0 0 | 77 1
Valdosta Prison
| 3 3| 109 4| 96 4| 24 4| 232 4 | 0 0| 0 0| 0 0| 0 0| 0 0 | 232 4
Hays Prison
| 4 4| 139 5| 97 4| 16 3| 256 5 | 0 0| 0 0| 0 0| 0 0| 0 0 | 256 4
Hancock Prison
| 6 5| 228 9| 154 7| 34 6| 422 8 | 0 0| 0 0| 0 0| 0 0| 0 0 | 422 7
Telfair Prison
| 8 7| 174 7| 101 5| 16 3| 299 5 | 0 0| 0 0| 0 0| 0 0| 0 0 | 299 5
Autry Prison
| 11 10| 146 5| 97 4| 25 4| 279 5 | 0 0| 0 0| 0 0| 0 0| 0 0 | 279 5
Johnson Prison
| 0 0| 42 2| 40 2| 10 2| 92 2 | 0 0| 0 0| 0 0| 0 0| 0 0 | 92 2
Wilcox Prison
| 0 0| 56 2| 66 3| 13 2| 135 2 | 0 0| 0 0| 0 0| 0 0| 0 0 | 135 2
Calhoun Prison
| 10 9| 116 4| 62 3| 18 3| 206 4 | 0 0| 0 0| 0 0| 0 0| 0 0 | 206 4
Dooly Prison
| 0 0| 55 2| 74 3| 16 3| 145 3 | 0 0| 0 0| 0 0| 0 0| 0 0 | 145 2
Macon Prison
| 3 3| 300 11| 135 6| 37 6| 475 9 | 0 0| 0 0| 0 0| 0 0| 0 0 | 475 8
Smith Prison
| 12 11| 195 7| 91 4| 19 3| 317 6 | 0 0| 0 0| 0 0| 0 0| 0 0 | 317 5
Homerville Prison | 0 0| 1 0| 7 0| 0 0| 8 0 | 0 0| 0 0| 0 0| 0 0| 0 0 | 8 0
Washingtn Women Pris| 0 0| 0 0| 0 0| 0 0| 0 0 | 3 33| 42 35| 38 39| 12 41| 95 37 | 95 2
Baldwin Prison
| 1 1| 16 1| 17 1| 6 1| 40 1 | 0 0| 0 0| 0 0| 0 0| 0 0 | 40 1
Metro Womens Prison | 0 0| 0 0| 0 0| 0 0| 0 0 | 2 22| 28 23| 31 32| 7 24| 68 27 | 68 1
Pulaski Womens Pris | 0 0| 0 0| 0 0| 0 0| 0 0 | 4 44| 56 46| 31 32| 10 34| 101 39 | 101 2
Pelham PreTrans Unit| 0 0| 6 0| 8 0| 2 0| 16 0 | 0 0| 0 0| 0 0| 0 0| 0 0 | 16 0
D Ray James Prison | 0 0| 42 2| 28 1| 3 1| 73 1 | 0 0| 0 0| 0 0| 0 0| 0 0 | 73 1
Coffee Corr Facility| 0 0| 45 2| 42 2| 9 2| 96 2 | 0 0| 0 0| 0 0| 0 0| 0 0 | 96 2
Wheeler Corr Facilty| 0 0| 49 2| 66 3| 11 2| 126 2 | 0 0| 0 0| 0 0| 0 0| 0 0 | 126 2
Baldwin BC
| 89 79| 1976 74| 1413 64| 437 76| 3915 70 | 8 89| 114 94| 90 93| 28 97| 240 94 | 4155 71
------------------------------------------------------------------------------------------------------------------------------------
Total reported
| 208 100| 4837 100| 3753 100| 1031 100| 9829 100 | 17 100| 240 100| 190 100| 57 100| 504 100 |10333 100
|
|
|
|
|
|
|
|
|
|
|
Percent reported |
94.1|
93.3|
94.4|
96.6|
94.1 | 100.0|
96.0|
97.0| 100.0|
97.0 |
94.2
|
|
|
|
|
|
|
|
|
|
|
|
|
|
|
|
|
|
|
|
|
|
Not Reported
| 7 | 193 | 130 | 20 | 350
|0|5|3|0|8
| 358
------------------------------------------------------------------------------------------------------------------------------------
Total
| 119 | 2861 | 2340 | 594 | 5914
| 9 | 126 | 100 | 29 | 264
| 6178
Page 43 Run 11/18/03 15:08 pm
Georgia Department of Corrections Office of Planning and Analysis
Inmate statistical profile
Sample: ACTIVE PRISONERS SERVING LIFE EXCLUDING JAIL
Requestor: Statistics
Active inmates 11/18/2003
Misdemeanors And Felonies by current age & sex
|
MEN
|
WOMEN
|
| Age | Age | Age | Age | Men
| Age | Age | Age | Age |Women
|Grand
Crime Type
|00-21 %|22-39 %|40-54 %|55-99 %|Total % |00-21 %|22-39 %|40-54 %|55-99 %|Total % |Total %
------------------------------------------------------------------------------------------------------------------------------------
MISDEMEANOR
| 0 0| 0 0| 0 0| 0 0| 0 0 | 0 0| 0 0| 0 0| 0 0| 0 0 | 0 0
FELONY
| 119 100| 2861 100| 2340 100| 594 100| 5914 100 | 9 100| 126 100| 100 100| 29 100| 264 100 | 6178 100
------------------------------------------------------------------------------------------------------------------------------------
Total reported
| 119 100| 2861 100| 2340 100| 594 100| 5914 100 | 9 100| 126 100| 100 100| 29 100| 264 100 | 6178 100
|
|
|
|
|
|
|
|
|
|
|
Percent reported | 100.0| 100.0| 100.0| 100.0| 100.0 | 100.0| 100.0| 100.0| 100.0| 100.0 | 100.0
|
|
|
|
|
|
|
|
|
|
|
|
|
|
|
|
|
|
|
|
|
|
NOT REPORTED
|0|0|0|0|0
|0|0|0|0|0
|0
------------------------------------------------------------------------------------------------------------------------------------
Total
| 119 | 2861 | 2340 | 594 | 5914
| 9 | 126 | 100 | 29 | 264
| 6178
Page 44 Run 11/18/03 15:08 pm
Georgia Department of Corrections Office of Planning and Analysis
Inmate statistical profile
Sample: ACTIVE PRISONERS SERVING LIFE EXCLUDING JAIL
Requestor: Statistics
Active inmates 11/18/2003
Crimes By Group by current age & sex
|
MEN
|
WOMEN
|
| Age | Age | Age | Age | Men
| Age | Age | Age | Age |Women
|Grand
Crimes By Group
|00-21 %|22-39 %|40-54 %|55-99 %|Total % |00-21 %|22-39 %|40-54 %|55-99 %|Total % |Total %
------------------------------------------------------------------------------------------------------------------------------------
HOMICIDE
| 89 75| 1976 69| 1413 60| 437 74| 3915 66 | 8 89| 114 90| 90 90| 28 97| 240 91 | 4155 67
ABORTION
| 0 0| 0 0| 0 0| 0 0| 0 0 | 0 0| 0 0| 0 0| 0 0| 0 0 | 0 0
BODILY INJRY&REL OFF| 7 6| 193 7| 130 6| 20 3| 350 6 | 0 0| 5 4| 3 3| 0 0| 8 3 | 358 6
ARSON & REL OFF
| 0 0| 1 0| 0 0| 0 0| 1 0 | 0 0| 0 0| 0 0| 0 0| 0 0 | 1 0
DAMAGE OF PROPERTY | 0 0| 0 0| 0 0| 0 0| 0 0 | 0 0| 0 0| 0 0| 0 0| 0 0 | 0 0
BURGLARY & REL OFF | 0 0| 7 0| 4 0| 0 0| 11 0 | 0 0| 0 0| 1 1| 0 0| 1 0 | 12 0
FORGERY & REL OFF | 0 0| 2 0| 6 0| 1 0| 9 0 | 0 0| 0 0| 0 0| 0 0| 0 0 | 9 0
THEFT
| 0 0| 0 0| 2 0| 0 0| 2 0 | 0 0| 0 0| 0 0| 0 0| 0 0 | 2 0
ROBBERY
| 13 11| 327 11| 275 12| 43 7| 658 11 | 1 11| 3 2| 2 2| 0 0| 6 2 | 664 11
SEXUAL OFFENSES
| 9 8| 268 9| 433 19| 87 15| 797 13 | 0 0| 0 0| 2 2| 0 0| 2 1 | 799 13
OBSCENITY CRIMES | 0 0| 0 0| 0 0| 0 0| 0 0 | 0 0| 0 0| 0 0| 0 0| 0 0 | 0 0
TREASON & REL OFF | 0 0| 0 0| 0 0| 0 0| 0 0 | 0 0| 0 0| 0 0| 0 0| 0 0 | 0 0
CRIMES INVOLVNG GOVT| 0 0| 1 0| 1 0| 1 0| 3 0 | 0 0| 0 0| 0 0| 0 0| 0 0 | 3 0
FALSIFICATIONS
| 0 0| 0 0| 0 0| 0 0| 0 0 | 0 0| 0 0| 0 0| 0 0| 0 0 | 0 0
OBSTRUCT LAW ENFORCE| 0 0| 0 0| 1 0| 0 0| 1 0 | 0 0| 0 0| 0 0| 0 0| 0 0 | 1 0
DISORDERLY CONDUCT | 0 0| 0 0| 0 0| 0 0| 0 0 | 0 0| 0 0| 0 0| 0 0| 0 0 | 0 0
GAMBLING & REL OFF | 0 0| 0 0| 0 0| 0 0| 0 0 | 0 0| 0 0| 0 0| 0 0| 0 0 | 0 0
CRUELTY TO CHILDREN | 0 0| 0 0| 0 0| 0 0| 0 0 | 0 0| 0 0| 0 0| 0 0| 0 0 | 0 0
CRIMES WITH GUNS | 0 0| 8 0| 7 0| 2 0| 17 0 | 0 0| 1 1| 0 0| 0 0| 1 0 | 18 0
INVASION PRIVACY | 0 0| 0 0| 0 0| 0 0| 0 0 | 0 0| 0 0| 0 0| 0 0| 0 0 | 0 0
RACKETEERING
| 0 0| 0 0| 0 0| 0 0| 0 0 | 0 0| 0 0| 0 0| 0 0| 0 0 | 0 0
DRUG ABUSE OFFENSES | 0 0| 66 2| 64 3| 2 0| 132 2 | 0 0| 3 2| 2 2| 1 3| 6 2 | 138 2
DRUG TRAFFICKING | 0 0| 5 0| 3 0| 0 0| 8 0 | 0 0| 0 0| 0 0| 0 0| 0 0 | 8 0
AUTO CRIMES
| 0 0| 0 0| 0 0| 0 0| 0 0 | 0 0| 0 0| 0 0| 0 0| 0 0 | 0 0
REVENUE & CONTRABAND| 0 0| 0 0| 0 0| 0 0| 0 0 | 0 0| 0 0| 0 0| 0 0| 0 0 | 0 0
CRIMES OF OTH STATES| 0 0| 0 0| 0 0| 0 0| 0 0 | 0 0| 0 0| 0 0| 0 0| 0 0 | 0 0
MISC. FELONIES
| 0 0| 0 0| 0 0| 1 0| 1 0 | 0 0| 0 0| 0 0| 0 0| 0 0 | 1 0
MISDEMEANORS
| 0 0| 0 0| 0 0| 0 0| 0 0 | 0 0| 0 0| 0 0| 0 0| 0 0 | 0 0
------------------------------------------------------------------------------------------------------------------------------------
Total reported
| 118 100| 2854 100| 2339 100| 594 100| 5905 100 | 9 100| 126 100| 100 100| 29 100| 264 100 | 6169 100
|
|
|
|
|
|
|
|
|
|
|
Percent reported |
99.2|
99.8| 100.0| 100.0|
99.8 | 100.0| 100.0| 100.0| 100.0| 100.0 |
99.9
|
|
|
|
|
|
|
|
|
|
|
|
|
|
|
|
|
|
|
|
|
|
NOT REPORTED
|1|7|1|0|9
|0|0|0|0|0
|9
------------------------------------------------------------------------------------------------------------------------------------
Total
| 119 | 2861 | 2340 | 594 | 5914
| 9 | 126 | 100 | 29 | 264
| 6178
Page 45 Run 11/18/03 15:08 pm
Georgia Department of Corrections Office of Planning and Analysis
Inmate statistical profile
Sample: ACTIVE PRISONERS SERVING LIFE EXCLUDING JAIL
Requestor: Statistics
Active inmates 11/18/2003
Most Serious Offense by current age & sex
|
MEN
|
WOMEN
|
| Age | Age | Age | Age | Men
| Age | Age | Age | Age |Women
|Grand
Most Serious Offense|00-21 %|22-39 %|40-54 %|55-99 %|Total % |00-21 %|22-39 %|40-54 %|55-99 %|Total % |Total %
------------------------------------------------------------------------------------------------------------------------------------
NOTE: In the table below, misdemeanors come first, and are in lower-case letters. AFTER THAT COME FELONIES, IN UPPER-CASE LETTERS.
------------------------------------------------------------------------------------------------------------------------------------
MISC HOMICIDE OFFENS| 1 1| 7 0| 1 0| 0 0| 9 0 | 0 0| 0 0| 0 0| 0 0| 0 0 | 9 0
MURDER
| 89 75| 1974 69| 1413 60| 436 73| 3912 66 | 8 89| 114 90| 90 90| 28 97| 240 91 | 4152 67
VOLUNTARY MANSLAUGHT| 0 0| 1 0| 0 0| 1 0| 2 0 | 0 0| 0 0| 0 0| 0 0| 0 0 | 2 0
INVOLUNTARY MANSLAUG| 0 0| 1 0| 0 0| 0 0| 1 0 | 0 0| 0 0| 0 0| 0 0| 0 0 | 1 0
AGGRAV ASSAULT
| 0 0| 5 0| 6 0| 1 0| 12 0 | 0 0| 0 0| 0 0| 0 0| 0 0 | 12 0
AGGRAV BATTERY
| 0 0| 1 0| 0 0| 0 0| 1 0 | 0 0| 0 0| 0 0| 0 0| 0 0 | 1 0
TERRORIST THREATS & | 0 0| 1 0| 0 0| 0 0| 1 0 | 0 0| 0 0| 0 0| 0 0| 0 0 | 1 0
FALSE IMPRISONMENT | 0 0| 1 0| 0 0| 0 0| 1 0 | 0 0| 0 0| 0 0| 0 0| 0 0 | 1 0
KIDNAPPING
| 7 6| 185 6| 123 5| 18 3| 333 6 | 0 0| 5 4| 3 3| 0 0| 8 3 | 341 6
AGGRAV ASSAULT POLCE| 0 0| 0 0| 1 0| 1 0| 2 0 | 0 0| 0 0| 0 0| 0 0| 0 0 | 2 0
ARSON 2ND DEGREE | 0 0| 1 0| 0 0| 0 0| 1 0 | 0 0| 0 0| 0 0| 0 0| 0 0 | 1 0
BURGLARY
| 0 0| 7 0| 4 0| 0 0| 11 0 | 0 0| 0 0| 1 1| 0 0| 1 0 | 12 0
FORGERY 1ST DEGREE | 0 0| 2 0| 6 0| 1 0| 9 0 | 0 0| 0 0| 0 0| 0 0| 0 0 | 9 0
THEFT BY TAKING
| 0 0| 0 0| 2 0| 0 0| 2 0 | 0 0| 0 0| 0 0| 0 0| 0 0 | 2 0
ROBBERY
| 0 0| 4 0| 2 0| 2 0| 8 0 | 0 0| 0 0| 0 0| 0 0| 0 0 | 8 0
ARMED ROBBERY
| 13 11| 323 11| 273 12| 41 7| 650 11 | 1 11| 3 2| 2 2| 0 0| 6 2 | 656 11
RAPE
| 9 8| 254 9| 392 17| 70 12| 725 12 | 0 0| 0 0| 2 2| 0 0| 2 1 | 727 12
AGGRAV SODOMY
| 0 0| 9 0| 25 1| 11 2| 45 1 | 0 0| 0 0| 0 0| 0 0| 0 0 | 45 1
CHILD MOLESTATION | 0 0| 2 0| 4 0| 1 0| 7 0 | 0 0| 0 0| 0 0| 0 0| 0 0 | 7 0
AGGRAV CHILD MOLESTA| 0 0| 3 0| 12 1| 5 1| 20 0 | 0 0| 0 0| 0 0| 0 0| 0 0 | 20 0
OBSTR OF LAW ENF OFF| 0 0| 1 0| 1 0| 1 0| 3 0 | 0 0| 0 0| 0 0| 0 0| 0 0 | 3 0
ESCAPE
| 0 0| 0 0| 1 0| 0 0| 1 0 | 0 0| 0 0| 0 0| 0 0| 0 0 | 1 0
POSS OF FIREARM DUR | 0 0| 3 0| 2 0| 1 0| 6 0 | 0 0| 0 0| 0 0| 0 0| 0 0 | 6 0
POSS OF CERTAIN WEAP| 0 0| 0 0| 1 0| 0 0| 1 0 | 0 0| 0 0| 0 0| 0 0| 0 0 | 1 0
POSS FIREARM CONVCT | 0 0| 5 0| 4 0| 1 0| 10 0 | 0 0| 1 1| 0 0| 0 0| 1 0 | 11 0
S/D NARCOTICS OPIATE| 0 0| 7 0| 7 0| 1 0| 15 0 | 0 0| 0 0| 0 0| 0 0| 0 0 | 15 0
S/D DEP STIM CNTRF D| 0 0| 1 0| 0 0| 0 0| 1 0 | 0 0| 0 0| 0 0| 0 0| 0 0 | 1 0
S/D OF MARIJUANA | 0 0| 2 0| 5 0| 0 0| 7 0 | 0 0| 0 0| 0 0| 0 0| 0 0 | 7 0
POSS NARCOTICS OPIAT| 0 0| 0 0| 2 0| 0 0| 2 0 | 0 0| 0 0| 0 0| 0 0| 0 0 | 2 0
POSS DEP STIM CNTRF | 0 0| 0 0| 1 0| 0 0| 1 0 | 0 0| 0 0| 0 0| 0 0| 0 0 | 1 0
VIOL GA CNTRL SBST A| 0 0| 2 0| 3 0| 0 0| 5 0 | 0 0| 1 1| 0 0| 0 0| 1 0 | 6 0
S/D CONT SUB PUBLIC | 0 0| 2 0| 0 0| 0 0| 2 0 | 0 0| 0 0| 0 0| 0 0| 0 0 | 2 0
S/D CONT SUB SCHOOL | 0 0| 1 0| 0 0| 0 0| 1 0 | 0 0| 0 0| 0 0| 0 0| 0 0 | 1 0
------------------------------------------------------------------------------------------------------------------------------------
(continued)
Page 46 Run 11/18/03 15:08 pm
Georgia Department of Corrections Office of Planning and Analysis
Inmate statistical profile
Sample: ACTIVE PRISONERS SERVING LIFE EXCLUDING JAIL
Requestor:
Active inmates 11/18/2003
Most Serious Offense by current age & sex
Statistics (CONTINUED)
|
MEN
|
WOMEN
|
| Age | Age | Age | Age | Men
| Age | Age | Age | Age |Women
|Grand
Most Serious Offense|00-21 %|22-39 %|40-54 %|55-99 %|Total % |00-21 %|22-39 %|40-54 %|55-99 %|Total % |Total %
------------------------------------------------------------------------------------------------------------------------------------
S/D COCAINE
| 0 0| 39 1| 40 2| 0 0| 79 1 | 0 0| 2 2| 2 2| 1 3| 5 2 | 84 1
POSS OF COCAINE
| 0 0| 12 0| 6 0| 1 0| 19 0 | 0 0| 0 0| 0 0| 0 0| 0 0 | 19 0
TRAF COCAINE LESS 20| 0 0| 5 0| 3 0| 0 0| 8 0 | 0 0| 0 0| 0 0| 0 0| 0 0 | 8 0
CRMNL ATMPT
| 3 3| 206 7| 203 9| 51 9| 463 8 | 1 11| 3 2| 7 7| 1 3| 12 5 | 475 8
AIRCRAFT HIJACKING | 116 97| 2655 93| 2137 91| 544 92| 5452 92 | 8 89| 123 98| 93 93| 28 97| 252 95 | 5704 92
------------------------------------------------------------------------------------------------------------------------------------
Total
| 119 | 2861 | 2340 | 594 | 5914
| 9 | 126 | 100 | 29 | 264
| 6178
Page 47 Run 11/18/03 15:08 pm
Georgia Department of Corrections Office of Planning and Analysis
Inmate statistical profile
Sample: ACTIVE PRISONERS SERVING LIFE EXCLUDING JAIL
Requestor: Statistics
Active inmates 11/18/2003
Most Serious Crime Type by current age & sex
|
MEN
|
WOMEN
|
| Age | Age | Age | Age | Men
| Age | Age | Age | Age |Women
|Grand
Crime Type
|00-21 %|22-39 %|40-54 %|55-99 %|Total % |00-21 %|22-39 %|40-54 %|55-99 %|Total % |Total %
------------------------------------------------------------------------------------------------------------------------------------
VIOL/PERSN
| 110 92| 2503 88| 1819 78| 500 84| 4932 83 | 9 100| 122 97| 95 95| 28 97| 254 96 | 5186 84
NVIOL/PERS
| 0 0| 3 0| 2 0| 1 0| 6 0 | 0 0| 0 0| 0 0| 0 0| 0 0 | 6 0
PROPERTY
| 0 0| 10 0| 12 1| 1 0| 23 0 | 0 0| 0 0| 1 1| 0 0| 1 0 | 24 0
DRUG SALES
| 0 0| 57 2| 55 2| 1 0| 113 2 | 0 0| 2 2| 2 2| 1 3| 5 2 | 118 2
DRUG POSSN
| 0 0| 14 0| 12 1| 1 0| 27 0 | 0 0| 1 1| 0 0| 0 0| 1 0 | 28 0
ALCOHOL
| 0 0| 0 0| 0 0| 0 0| 0 0 | 0 0| 0 0| 0 0| 0 0| 0 0 | 0 0
HABIT/DUI
| 0 0| 0 0| 0 0| 0 0| 0 0 | 0 0| 0 0| 0 0| 0 0| 0 0 | 0 0
SEX OFFEND
| 9 8| 268 9| 433 19| 87 15| 797 13 | 0 0| 0 0| 2 2| 0 0| 2 1 | 799 13
OTHER
| 0 0| 6 0| 7 0| 3 1| 16 0 | 0 0| 1 1| 0 0| 0 0| 1 0 | 17 0
------------------------------------------------------------------------------------------------------------------------------------
Total
| 119 | 2861 | 2340 | 594 | 5914
| 9 | 126 | 100 | 29 | 264
| 6178