- Collection:
- Georgia Government Publications
- Title:
- Inmate statistical profile: active lifers, 2001-07-01
- Creator:
- Georgia. Department of Corrections. Planning and Analysis Section
- Publisher:
- Atlanta, GA. : Georgia Dept. of Corrections, Office of Planning and Analysis, 2001-07-01
- Date of Original:
- 2001-07-01
- Subject:
- Prisoners--Georgia
- Location:
- United States, Georgia, 32.75042, -83.50018
- Medium:
- state government records
- Type:
- Text
- Format:
- application/pdf
- External Identifiers:
- Call Number GA R300.P5 P1 L5 2001/7
- Metadata URL:
- https://dlg.galileo.usg.edu/id:dlg_ggpd_i-ga-br300-pp5-bp1-bl5-b2001-s7-belec-p-btext
- Digital Object URL:
- https://dlg.galileo.usg.edu/do:dlg_ggpd_i-ga-br300-pp5-bp1-bl5-b2001-s7-belec-p-btext
- Language:
- eng
- Holding Institution:
- University of Georgia. Map and Government Information Library
- Rights:
-

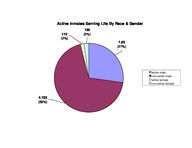
Active Inmates Serving Life By Race & Gender
112 (2%)
130 (2%)
1,63 (27%)
4,133 (69%)
white male non-white male white female non-white female
Prior Incarcerations of Active Inmates Serving A Life Sentence
4000
3,608
(60%)
3500
3000
Number of Inmates
2500
2000 1500 1000
500 0
zero
1,222 (20%)
one
632 (11%)
333 (6%)
two
three
Priors
136 (2%)
four
77 (1%)
five or more
Active Inmates Serving Life By Crime Type
69 (1%)
763 (13%)
17 (<1%)
283 (5%)
47 (1%)
4,829 (80%)
viol/persn
property
drug sales
drug possn
sex offend
other
Georgia Department of Corrections
Page 1 Run 07/26/01
Office of Planning and Analysis
Inmate statistical profile TABLE OF CONTENTS FOR ACTIVE PRISONERS SERVING LIFE EXCLUDING JAIL
Title
PAGE
-----
----
RACE AND SEX............................ 2
Culture Fair IQ Scores.................. 3
Self-Rpt Socioeconomic Class............ 4
Self-Rpt Environment To Age 16.......... 5
Self-Rpt Education Level................ 6
Functional Reading Level (WRAT Scores).. 7
Functional Math Level (WRAT Scores)..... 8
Functional Spelling Level (WRAT Scores). 9
Self-Rpt Guardian Status To Age 16......10
Self-Rpt Employment Status Before Prison11
Self-Rpt Marital Status At Admission....12
Self-Rpt Number Of Children At Admission13
Self-Rpt Religious Affiliation..........14
Self-Rpt Family Behavior Patterns *.....15
Inmate Diagnostic Behavior Problem *....16
Physical Profile (General Condition)....17
Security Status.........................18
Number Of Sentences.....................19
Number Of Disciplinaries................20
Number Of Escapes.......................21
Number Of Prior Georgia Incarcerations *22
Number Of Transfers.....................23
County Of Conviction....................24
Circ Of Conviction......................29
Home County.............................31
Prison Sentence In Years................36
Probation To Follow Prison..............37
Admission Type..........................38
Release Type............................39
Inst By Group...........................40
Institution.............................41
Misdemeanors And Felonies...............43
Crimes By Group.........................44
Most Serious Offense....................45
Most Serious Crime Type.................47
Georgia Department of Corrections
Page 2 Run 07/26/01
Office of Planning and Analysis
Inmate statistical profile
Sample: ACTIVE PRISONERS SERVING LIFE EXCLUDING JAIL
Requestor: Statistics
Active inmates 07/26/2001
RACE AND SEX by current age & sex
|
MEN
|
WOMEN
|
| Age | Age | Age | Age | Men
| Age | Age | Age | Age |Women
|Grand
RACE AND SEX
|00-21 %|22-39 %|40-54 %|55-99 %|Total % |00-21 %|22-39 %|40-54 %|55-99 %|Total % |Total %
------------------------------------------------------------------------------------------------------------------------------------
WHITE MALE
| 30 17| 666 22| 715 33| 222 50| 1633 28 | 0 0| 0 0| 0 0| 0 0| 0 0 | 1633 27
NON WHITE MALE
| 147 83| 2339 78| 1428 67| 219 50| 4133 72 | 0 0| 0 0| 0 0| 0 0| 0 0 | 4133 69
WHITE FEMALE
| 0 0| 0 0| 0 0| 0 0| 0 0 | 4 44| 44 36| 46 53| 18 72| 112 46 | 112 2
NON WHITE FEMALE | 0 0| 0 0| 0 0| 0 0| 0 0 | 5 56| 77 64| 41 47| 7 28| 130 54 | 130 2
------------------------------------------------------------------------------------------------------------------------------------
Total reported
| 177 100| 3005 100| 2143 100| 441 100| 5766 100 | 9 100| 121 100| 87 100| 25 100| 242 100 | 6008 100
|
|
|
|
|
|
|
|
|
|
|
Percent reported | 100.0| 100.0| 100.0| 100.0| 100.0 | 100.0| 100.0| 100.0| 100.0| 100.0 | 100.0
|
|
|
|
|
|
|
|
|
|
|
|
|
|
|
|
|
|
|
|
|
|
NOT REPORTED
|0|0|0|0|0
|0|0|0|0|0
|0
------------------------------------------------------------------------------------------------------------------------------------
Total
| 177 | 3005 | 2143 | 441 | 5766
| 9 | 121 | 87 | 25 | 242
| 6008
|
|
|
|
|
|
|
|
|
|
|
|
|
|
|
|
|
|
|
|
|
|
|
|
|
|
|
|
|
|
|
|
|
|
|
|
|
|
|
|
|
|
|
|
|
|
|
|
|
|
|
|
|
|
|
AVERAGE AGE
| 19.95 | 31.20 | 45.83 | 61.01 | 38.57 | 19.78 | 31.29 | 45.23 | 61.36 | 38.98 | 38.59
Page 3 Run 07/26/01
Georgia Department of Corrections Office of Planning and Analysis
Inmate statistical profile
Sample: ACTIVE PRISONERS SERVING LIFE EXCLUDING JAIL
Requestor: Statistics
Active inmates 07/26/2001
Culture Fair IQ Scores by current age & sex
|
MEN
|
WOMEN
|
| Age | Age | Age | Age | Men
| Age | Age | Age | Age |Women
|Grand
IQ Score
|00-21 %|22-39 %|40-54 %|55-99 %|Total % |00-21 %|22-39 %|40-54 %|55-99 %|Total % |Total %
------------------------------------------------------------------------------------------------------------------------------------
LESS THAN 70
| 4 2| 77 3| 153 8| 42 11| 276 5 | 0 0| 9 8| 8 10| 2 9| 19 8 | 295 5
70 AND UP
| 166 98| 2798 97| 1842 92| 354 89| 5160 95 | 8 100| 109 92| 76 90| 20 91| 213 92 | 5373 95
------------------------------------------------------------------------------------------------------------------------------------
Total reported
| 170 100| 2875 100| 1995 100| 396 100| 5436 100 | 8 100| 118 100| 84 100| 22 100| 232 100 | 5668 100
|
|
|
|
|
|
|
|
|
|
|
Percent reported |
96.0|
95.7|
93.1|
89.8|
94.3 |
88.9|
97.5|
96.6|
88.0|
95.9 |
94.3
|
|
|
|
|
|
|
|
|
|
|
|
|
|
|
|
|
|
|
|
|
|
NOT REPORTED
| 7 | 130 | 148 | 45 | 330
| 1 | 3 | 3 | 3 | 10
| 340
------------------------------------------------------------------------------------------------------------------------------------
Total
| 177 | 3005 | 2143 | 441 | 5766
| 9 | 121 | 87 | 25 | 242
| 6008
|
|
|
|
|
|
|
|
|
|
|
|
|
|
|
|
|
|
|
|
|
|
|
|
|
|
|
|
|
|
|
|
|
|
|
|
|
|
|
|
|
|
|
|
|
|
|
|
|
|
|
|
|
|
|
AVERAGE IQ
| 99.51 | 101.43 | 97.28 | 93.70 | 99.28 | 99.38 | 96.41 | 91.87 | 88.36 | 94.10 | 99.07
Page 4 Run 07/26/01
Georgia Department of Corrections Office of Planning and Analysis
Inmate statistical profile
Sample: ACTIVE PRISONERS SERVING LIFE EXCLUDING JAIL
Requestor: Statistics
Active inmates 07/26/2001
Self-Rpt Socioeconomic Class by current age & sex
|
MEN
|
WOMEN
|
| Age | Age | Age | Age | Men
| Age | Age | Age | Age |Women
|Grand
Socioeconomic Class |00-21 %|22-39 %|40-54 %|55-99 %|Total % |00-21 %|22-39 %|40-54 %|55-99 %|Total % |Total %
------------------------------------------------------------------------------------------------------------------------------------
WELFARE
| 15 9| 342 12| 206 10| 25 6| 588 11 | 0 0| 23 19| 7 8| 0 0| 30 13 | 618 11
OCC EMPLOY
| 11 7| 196 7| 64 3| 7 2| 278 5 | 0 0| 3 3| 0 0| 1 5| 4 2 | 282 5
MINIMUM STD
| 72 44| 1034 36| 893 43| 231 55| 2230 40 | 5 56| 39 33| 26 30| 8 36| 78 33 | 2308 40
MIDDLE
| 63 39| 1294 45| 904 44| 154 37| 2415 44 | 4 44| 53 45| 51 59| 12 55| 120 51 | 2535 44
OTHER
| 1 1| 26 1| 7 0| 3 1| 37 1 | 0 0| 1 1| 3 3| 1 5| 5 2 | 42 1
------------------------------------------------------------------------------------------------------------------------------------
Total reported
| 162 100| 2892 100| 2074 100| 420 100| 5548 100 | 9 100| 119 100| 87 100| 22 100| 237 100 | 5785 100
|
|
|
|
|
|
|
|
|
|
|
Percent reported |
91.5|
96.2|
96.8|
95.2|
96.2 | 100.0|
98.3| 100.0|
88.0|
97.9 |
96.3
|
|
|
|
|
|
|
|
|
|
|
|
|
|
|
|
|
|
|
|
|
|
NOT RPTD
| 15 | 113 | 69 | 21 | 218
|0|2|0|3|5
| 223
------------------------------------------------------------------------------------------------------------------------------------
Total
| 177 | 3005 | 2143 | 441 | 5766
| 9 | 121 | 87 | 25 | 242
| 6008
Page 5 Run 07/26/01
Georgia Department of Corrections Office of Planning and Analysis
Inmate statistical profile
Sample: ACTIVE PRISONERS SERVING LIFE EXCLUDING JAIL
Requestor: Statistics
Active inmates 07/26/2001
Self-Rpt Environment To Age 16 by current age & sex
|
MEN
|
WOMEN
|
| Age | Age | Age | Age | Men
| Age | Age | Age | Age |Women
|Grand
Environment
|00-21 %|22-39 %|40-54 %|55-99 %|Total % |00-21 %|22-39 %|40-54 %|55-99 %|Total % |Total %
------------------------------------------------------------------------------------------------------------------------------------
RURAL/FARM
| 1 1| 103 3| 177 8| 90 21| 371 7 | 0 0| 8 7| 4 5| 3 14| 15 6 | 386 7
RURAL/NFARM
| 4 2| 197 7| 179 9| 39 9| 419 7 | 0 0| 7 6| 3 3| 0 0| 10 4 | 429 7
S.M.S.A
| 77 44| 1233 42| 746 36| 112 26| 2168 39 | 2 22| 24 20| 22 25| 6 29| 54 23 | 2222 38
URBAN
| 33 19| 518 18| 379 18| 60 14| 990 18 | 4 44| 34 28| 24 28| 2 10| 64 27 | 1054 18
SMALL TOWN
| 60 34| 877 30| 593 28| 126 30| 1656 29 | 3 33| 47 39| 32 37| 9 43| 91 38 | 1747 30
OTHER
| 0 0| 15 1| 10 0| 0 0| 25 0 | 0 0| 0 0| 2 2| 1 5| 3 1 | 28 0
------------------------------------------------------------------------------------------------------------------------------------
Total reported
| 175 100| 2943 100| 2084 100| 427 100| 5629 100 | 9 100| 120 100| 87 100| 21 100| 237 100 | 5866 100
|
|
|
|
|
|
|
|
|
|
|
Percent reported |
98.9|
97.9|
97.2|
96.8|
97.6 | 100.0|
99.2| 100.0|
84.0|
97.9 |
97.6
|
|
|
|
|
|
|
|
|
|
|
|
|
|
|
|
|
|
|
|
|
|
NOT RPTD
| 2 | 62 | 59 | 14 | 137
|0|1|0|4|5
| 142
------------------------------------------------------------------------------------------------------------------------------------
Total
| 177 | 3005 | 2143 | 441 | 5766
| 9 | 121 | 87 | 25 | 242
| 6008
Page 6 Run 07/26/01
Georgia Department of Corrections Office of Planning and Analysis
Inmate statistical profile
Sample: ACTIVE PRISONERS SERVING LIFE EXCLUDING JAIL
Requestor: Statistics
Active inmates 07/26/2001
Self-Rpt Education Level by current age & sex
|
MEN
|
WOMEN
|
| Age | Age | Age | Age | Men
| Age | Age | Age | Age |Women
|Grand
Education Level
|00-21 %|22-39 %|40-54 %|55-99 %|Total % |00-21 %|22-39 %|40-54 %|55-99 %|Total % |Total %
------------------------------------------------------------------------------------------------------------------------------------
LESS THAN GRADE 7 | 6 3| 50 2| 107 5| 86 20| 249 4 | 0 0| 1 1| 2 2| 5 21| 8 3 | 257 4
GRADE 7
| 7 4| 84 3| 64 3| 35 8| 190 3 | 0 0| 5 4| 4 5| 1 4| 10 4 | 200 3
GRADE 8
| 44 25| 264 9| 202 10| 45 10| 555 10 | 3 33| 16 14| 7 8| 1 4| 27 11 | 582 10
GRADE 9
| 44 25| 461 16| 252 12| 39 9| 796 14 | 3 33| 16 14| 5 6| 0 0| 24 10 | 820 14
GRADE 10
| 34 20| 604 20| 307 15| 40 9| 985 17 | 1 11| 19 16| 12 14| 3 13| 35 15 | 1020 17
GRADE 11
| 34 20| 558 19| 238 11| 30 7| 860 15 | 1 11| 17 14| 5 6| 1 4| 24 10 | 884 15
GRADE 12
| 3 2| 705 24| 674 32| 108 25| 1490 26 | 1 11| 26 22| 31 36| 9 38| 67 28 | 1557 26
MORE THAN GRADE 12 | 1 1| 240 8| 270 13| 51 12| 562 10 | 0 0| 18 15| 21 24| 4 17| 43 18 | 605 10
------------------------------------------------------------------------------------------------------------------------------------
Total reported
| 173 100| 2966 100| 2114 100| 434 100| 5687 100 | 9 100| 118 100| 87 100| 24 100| 238 100 | 5925 100
|
|
|
|
|
|
|
|
|
|
|
Percent reported |
97.7|
98.7|
98.6|
98.4|
98.6 | 100.0|
97.5| 100.0|
96.0|
98.3 |
98.6
|
|
|
|
|
|
|
|
|
|
|
|
|
|
|
|
|
|
|
|
|
|
NOT REPORTED
| 4 | 39 | 29 | 7 | 79
|0|3|0|1|4
| 83
------------------------------------------------------------------------------------------------------------------------------------
Total
| 177 | 3005 | 2143 | 441 | 5766
| 9 | 121 | 87 | 25 | 242
| 6008
|
|
|
|
|
|
|
|
|
|
|
|
|
|
|
|
|
|
|
|
|
|
|
|
|
|
|
|
|
|
|
|
|
|
|
|
|
|
|
|
|
|
|
|
|
|
|
|
|
|
|
|
|
|
|
AVG EDUCATION LEVEL | 9.23 | 10.95 | 11.25 | 9.85 | 10.93 | 9.33 | 11.42 | 12.08 | 11.13 | 11.55 | 10.95
* NOTE: THE FIELD LABLED "LESS THAN GRADE 7" WAS CORRECTED IN MARCH 1989: MISSING DATA FOR INMATES STILL IN DIAGNOSTICS NOW HAS BEEN REMOVED FROM THIS FIELD AND IDENTIFIED AS "NOT REPORTED" INFORMATION.
Page 7 Run 07/26/01
Georgia Department of Corrections Office of Planning and Analysis
Inmate statistical profile
Sample: ACTIVE PRISONERS SERVING LIFE EXCLUDING JAIL
Requestor: Statistics
Active inmates 07/26/2001
Functional Reading Level (WRAT Scores) by current age & sex
|
MEN
|
WOMEN
|
| Age | Age | Age | Age | Men
| Age | Age | Age | Age |Women
|Grand
WRAT Reading Score |00-21 %|22-39 %|40-54 %|55-99 %|Total % |00-21 %|22-39 %|40-54 %|55-99 %|Total % |Total %
------------------------------------------------------------------------------------------------------------------------------------
LESS THAN GRADE 6 | 71 42| 1094 38| 872 46| 180 49| 2217 42 | 1 13| 45 38| 21 26| 10 43| 77 33 | 2294 41
6TH THRU 8TH GRADE | 33 19| 681 24| 416 22| 64 17| 1194 22 | 2 25| 27 23| 21 26| 4 17| 54 23 | 1248 22
GRADE 9
| 11 6| 212 7| 116 6| 26 7| 365 7 | 1 13| 2 2| 7 9| 2 9| 12 5 | 377 7
GRADE 10
| 9 5| 136 5| 76 4| 14 4| 235 4 | 1 13| 2 2| 6 7| 1 4| 10 4 | 245 4
GRADE 11
| 6 4| 118 4| 88 5| 9 2| 221 4 | 0 0| 4 3| 5 6| 1 4| 10 4 | 231 4
GRADE 12
| 29 17| 523 18| 303 16| 71 19| 926 17 | 3 38| 7 6| 2 2| 1 4| 13 6 | 939 17
MORE THAN GRADE 12 | 12 7| 114 4| 30 2| 5 1| 161 3 | 0 0| 31 26| 20 24| 4 17| 55 24 | 216 4
------------------------------------------------------------------------------------------------------------------------------------
Total reported
| 171 100| 2878 100| 1901 100| 369 100| 5319 100 | 8 100| 118 100| 82 100| 23 100| 231 100 | 5550 100
|
|
|
|
|
|
|
|
|
|
|
Percent reported |
96.6|
95.8|
88.7|
83.7|
92.2 |
88.9|
97.5|
94.3|
92.0|
95.5 |
92.4
|
|
|
|
|
|
|
|
|
|
|
|
|
|
|
|
|
|
|
|
|
|
NOT REPORTED
| 6 | 127 | 242 | 72 | 447
| 1 | 3 | 5 | 2 | 11
| 458
------------------------------------------------------------------------------------------------------------------------------------
Total
| 177 | 3005 | 2143 | 441 | 5766
| 9 | 121 | 87 | 25 | 242
| 6008
|
|
|
|
|
|
|
|
|
|
|
|
|
|
|
|
|
|
|
|
|
|
|
|
|
|
|
|
|
|
|
|
|
|
|
|
|
|
|
|
|
|
|
|
|
|
|
|
|
|
|
|
|
|
|
AVG READING SCORE | 7.77 | 7.74 | 7.04 | 6.90 | 7.43 | 9.35 | 8.10 | 8.46 | 7.36 | 8.20 | 7.46
Page 8 Run 07/26/01
Georgia Department of Corrections Office of Planning and Analysis
Inmate statistical profile
Sample: ACTIVE PRISONERS SERVING LIFE EXCLUDING JAIL
Requestor: Statistics
Active inmates 07/26/2001
Functional Math Level (WRAT Scores) by current age & sex
|
MEN
|
WOMEN
|
| Age | Age | Age | Age | Men
| Age | Age | Age | Age |Women
|Grand
WRAT Math Score
|00-21 %|22-39 %|40-54 %|55-99 %|Total % |00-21 %|22-39 %|40-54 %|55-99 %|Total % |Total %
------------------------------------------------------------------------------------------------------------------------------------
LESS THAN GRADE 6 | 69 40| 846 29| 825 43| 182 49| 1922 36 | 2 25| 40 34| 30 36| 10 43| 82 35 | 2004 36
6TH THRU 8TH GRADE | 69 40| 1468 51| 709 37| 101 27| 2347 44 | 5 63| 51 43| 33 40| 8 35| 97 42 | 2444 44
GRADE 9
| 11 6| 228 8| 132 7| 27 7| 398 7 | 1 13| 13 11| 6 7| 2 9| 22 9 | 420 8
GRADE 10
| 14 8| 132 5| 101 5| 21 6| 268 5 | 0 0| 7 6| 3 4| 1 4| 11 5 | 279 5
GRADE 11
| 4 2| 90 3| 53 3| 15 4| 162 3 | 0 0| 0 0| 3 4| 2 9| 5 2 | 167 3
GRADE 12
| 2 1| 98 3| 83 4| 20 5| 203 4 | 0 0| 2 2| 3 4| 0 0| 5 2 | 208 4
MORE THAN GRADE 12 | 2 1| 19 1| 3 0| 3 1| 27 1 | 0 0| 5 4| 5 6| 0 0| 10 4 | 37 1
------------------------------------------------------------------------------------------------------------------------------------
Total reported
| 171 100| 2881 100| 1906 100| 369 100| 5327 100 | 8 100| 118 100| 83 100| 23 100| 232 100 | 5559 100
|
|
|
|
|
|
|
|
|
|
|
Percent reported |
96.6|
95.9|
88.9|
83.7|
92.4 |
88.9|
97.5|
95.4|
92.0|
95.9 |
92.5
|
|
|
|
|
|
|
|
|
|
|
|
|
|
|
|
|
|
|
|
|
|
NOT REPORTED
| 6 | 124 | 237 | 72 | 439
| 1 | 3 | 4 | 2 | 10
| 449
------------------------------------------------------------------------------------------------------------------------------------
Total
| 177 | 3005 | 2143 | 441 | 5766
| 9 | 121 | 87 | 25 | 242
| 6008
|
|
|
|
|
|
|
|
|
|
|
|
|
|
|
|
|
|
|
|
|
|
|
|
|
|
|
|
|
|
|
|
|
|
|
|
|
|
|
|
|
|
|
|
|
|
|
|
|
|
|
|
|
|
|
AVG MATH SCORE
| 6.75 | 7.12 | 6.60 | 6.45 | 6.88 | 6.83 | 7.20 | 7.27 | 6.17 | 7.11 | 6.89
Page 9 Run 07/26/01
Georgia Department of Corrections Office of Planning and Analysis
Inmate statistical profile
Sample: ACTIVE PRISONERS SERVING LIFE EXCLUDING JAIL
Requestor: Statistics
Active inmates 07/26/2001
Functional Spelling Level (WRAT Scores) by current age & sex
|
MEN
|
WOMEN
|
| Age | Age | Age | Age | Men
| Age | Age | Age | Age |Women
|Grand
WRAT Spelling Score |00-21 %|22-39 %|40-54 %|55-99 %|Total % |00-21 %|22-39 %|40-54 %|55-99 %|Total % |Total %
------------------------------------------------------------------------------------------------------------------------------------
LESS THAN GRADE 6 | 66 39| 1263 44| 1087 57| 218 59| 2634 50 | 2 25| 40 34| 27 33| 12 52| 81 35 | 2715 49
6TH THRU 8TH GRADE | 54 32| 787 27| 393 21| 73 20| 1307 25 | 3 38| 30 25| 20 24| 3 13| 56 24 | 1363 25
GRADE 9
| 11 6| 182 6| 111 6| 14 4| 318 6 | 1 13| 8 7| 3 4| 2 9| 14 6 | 332 6
GRADE 10
| 17 10| 184 6| 70 4| 14 4| 285 5 | 1 13| 9 8| 7 8| 0 0| 17 7 | 302 5
GRADE 11
| 4 2| 134 5| 51 3| 6 2| 195 4 | 1 13| 4 3| 5 6| 2 9| 12 5 | 207 4
GRADE 12
| 10 6| 285 10| 176 9| 41 11| 512 10 | 0 0| 10 8| 5 6| 0 0| 15 6 | 527 9
MORE THAN GRADE 12 | 9 5| 43 1| 14 1| 3 1| 69 1 | 0 0| 17 14| 16 19| 4 17| 37 16 | 106 2
------------------------------------------------------------------------------------------------------------------------------------
Total reported
| 171 100| 2878 100| 1902 100| 369 100| 5320 100 | 8 100| 118 100| 83 100| 23 100| 232 100 | 5552 100
|
|
|
|
|
|
|
|
|
|
|
Percent reported |
96.6|
95.8|
88.8|
83.7|
92.3 |
88.9|
97.5|
95.4|
92.0|
95.9 |
92.4
|
|
|
|
|
|
|
|
|
|
|
|
|
|
|
|
|
|
|
|
|
|
NOT REPORTED
| 6 | 127 | 241 | 72 | 446
| 1 | 3 | 4 | 2 | 10
| 456
------------------------------------------------------------------------------------------------------------------------------------
Total
| 177 | 3005 | 2143 | 441 | 5766
| 9 | 121 | 87 | 25 | 242
| 6008
|
|
|
|
|
|
|
|
|
|
|
|
|
|
|
|
|
|
|
|
|
|
|
|
|
|
|
|
|
|
|
|
|
|
|
|
|
|
|
|
|
|
|
|
|
|
|
|
|
|
|
|
|
|
|
AVG SPELLING SCORE | 7.21 | 6.96 | 6.07 | 5.86 | 6.58 | 7.91 | 8.03 | 8.21 | 6.70 | 7.96 | 6.63
Page 10 Run 07/26/01
Georgia Department of Corrections Office of Planning and Analysis
Inmate statistical profile
Sample: ACTIVE PRISONERS SERVING LIFE EXCLUDING JAIL
Requestor: Statistics
Active inmates 07/26/2001
Self-Rpt Guardian Status To Age 16 by current age & sex
|
MEN
|
WOMEN
|
| Age | Age | Age | Age | Men
| Age | Age | Age | Age |Women
|Grand
Guardian Status
|00-21 %|22-39 %|40-54 %|55-99 %|Total % |00-21 %|22-39 %|40-54 %|55-99 %|Total % |Total %
------------------------------------------------------------------------------------------------------------------------------------
ORPHANAGE
| 0 0| 4 0| 4 0| 3 1| 11 0 | 0 0| 0 0| 0 0| 0 0| 0 0 | 11 0
FATHER ONLY
| 6 3| 85 3| 60 3| 6 1| 157 3 | 0 0| 2 2| 2 2| 1 4| 5 2 | 162 3
FTR MTR HD
| 13 8| 121 4| 71 3| 7 2| 212 4 | 0 0| 2 2| 5 6| 0 0| 7 3 | 219 4
MOTHER ONLY
| 89 51| 1406 48| 685 33| 113 26| 2293 41 | 5 56| 45 38| 26 31| 8 35| 84 36 | 2377 40
MTR FTR HD
| 38 22| 901 30| 997 48| 236 55| 2172 38 | 4 44| 45 38| 44 52| 13 57| 106 45 | 2278 39
OTH FEMALE
| 2 1| 54 2| 50 2| 16 4| 122 2 | 0 0| 4 3| 2 2| 0 0| 6 3 | 128 2
OTH MALE
| 2 1| 6 0| 13 1| 1 0| 22 0 | 0 0| 0 0| 2 2| 0 0| 2 1 | 24 0
STEP-PARNTS
| 3 2| 52 2| 26 1| 7 2| 88 2 | 0 0| 0 0| 0 0| 0 0| 0 0 | 88 1
FOSTER HOME
| 3 2| 28 1| 30 1| 8 2| 69 1 | 0 0| 2 2| 0 0| 0 0| 2 1 | 71 1
GRAND PRNTS
| 14 8| 239 8| 133 6| 27 6| 413 7 | 0 0| 16 13| 4 5| 1 4| 21 9 | 434 7
OTHER
| 3 2| 63 2| 29 1| 6 1| 101 2 | 0 0| 3 3| 0 0| 0 0| 3 1 | 104 2
------------------------------------------------------------------------------------------------------------------------------------
Total reported
| 173 100| 2959 100| 2098 100| 430 100| 5660 100 | 9 100| 119 100| 85 100| 23 100| 236 100 | 5896 100
|
|
|
|
|
|
|
|
|
|
|
Percent reported |
97.7|
98.5|
97.9|
97.5|
98.2 | 100.0|
98.3|
97.7|
92.0|
97.5 |
98.1
|
|
|
|
|
|
|
|
|
|
|
|
|
|
|
|
|
|
|
|
|
|
NOT RPTD
| 4 | 46 | 45 | 11 | 106
|0|2|2|2|6
| 112
------------------------------------------------------------------------------------------------------------------------------------
Total
| 177 | 3005 | 2143 | 441 | 5766
| 9 | 121 | 87 | 25 | 242
| 6008
Page 11 Run 07/26/01
Georgia Department of Corrections Office of Planning and Analysis
Inmate statistical profile
Sample: ACTIVE PRISONERS SERVING LIFE EXCLUDING JAIL
Requestor: Statistics
Active inmates 07/26/2001
Self-Rpt Employment Status Before Prison by current age & sex
|
MEN
|
WOMEN
|
| Age | Age | Age | Age | Men
| Age | Age | Age | Age |Women
|Grand
Employment
|00-21 %|22-39 %|40-54 %|55-99 %|Total % |00-21 %|22-39 %|40-54 %|55-99 %|Total % |Total %
------------------------------------------------------------------------------------------------------------------------------------
FULL TIME
| 27 17| 977 34| 779 38| 178 43| 1961 36 | 1 11| 31 27| 14 17| 5 23| 51 22 | 2012 35
PART TIME
| 7 4| 234 8| 114 6| 21 5| 376 7 | 0 0| 6 5| 3 4| 0 0| 9 4 | 385 7
UNEMPL < 6M
| 17 10| 456 16| 340 17| 59 14| 872 16 | 0 0| 22 19| 22 26| 4 18| 48 21 | 920 16
UNEMPL > 6M
| 19 12| 857 30| 728 36| 115 28| 1719 31 | 2 22| 32 28| 36 43| 11 50| 81 35 | 1800 32
NEVER WORKD
| 74 45| 263 9| 22 1| 3 1| 362 7 | 3 33| 22 19| 4 5| 0 0| 29 13 | 391 7
STUDENT
| 18 11| 34 1| 6 0| 1 0| 59 1 | 3 33| 1 1| 2 2| 0 0| 6 3 | 65 1
INCAPABLE
| 1 1| 31 1| 50 2| 34 8| 116 2 | 0 0| 0 0| 3 4| 2 9| 5 2 | 121 2
OTHER
| 0 0| 0 0| 0 0| 0 0| 0 0 | 0 0| 0 0| 0 0| 0 0| 0 0 | 0 0
------------------------------------------------------------------------------------------------------------------------------------
Total reported
| 163 100| 2852 100| 2039 100| 411 100| 5465 100 | 9 100| 114 100| 84 100| 22 100| 229 100 | 5694 100
|
|
|
|
|
|
|
|
|
|
|
Percent reported |
92.1|
94.9|
95.1|
93.2|
94.8 | 100.0|
94.2|
96.6|
88.0|
94.6 |
94.8
|
|
|
|
|
|
|
|
|
|
|
|
|
|
|
|
|
|
|
|
|
|
NOT RPTD
| 14 | 153 | 104 | 30 | 301
| 0 | 7 | 3 | 3 | 13
| 314
------------------------------------------------------------------------------------------------------------------------------------
Total
| 177 | 3005 | 2143 | 441 | 5766
| 9 | 121 | 87 | 25 | 242
| 6008
* NOTE: THE FIELD LABELD "OTHER" WAS CORRECTED IN APRIL 1989; INMATES CODED "PRE-OTIS NOT REPORTED" NOW HAVE BEEN REMOVED FROM THIS FIELD AND IDENTIFIED AS "NOT REPORTED".
Page 12 Run 07/26/01
Georgia Department of Corrections Office of Planning and Analysis
Inmate statistical profile
Sample: ACTIVE PRISONERS SERVING LIFE EXCLUDING JAIL
Requestor: Statistics
Active inmates 07/26/2001
Self-Rpt Marital Status At Admission by current age & sex
|
MEN
|
WOMEN
|
| Age | Age | Age | Age | Men
| Age | Age | Age | Age |Women
|Grand
Marital Status
|00-21 %|22-39 %|40-54 %|55-99 %|Total % |00-21 %|22-39 %|40-54 %|55-99 %|Total % |Total %
------------------------------------------------------------------------------------------------------------------------------------
SINGLE
| 164 94| 2063 70| 738 35| 59 14| 3024 53 | 9 100| 71 59| 15 17| 2 9| 97 41 | 3121 53
MARRIED
| 0 0| 221 7| 399 19| 120 28| 740 13 | 0 0| 12 10| 17 20| 3 13| 32 13 | 772 13
SEPARATED
| 0 0| 96 3| 171 8| 44 10| 311 5 | 0 0| 12 10| 8 9| 2 9| 22 9 | 333 6
DIVORCED
| 0 0| 133 4| 357 17| 100 23| 590 10 | 0 0| 9 8| 14 16| 6 26| 29 12 | 619 10
WIDOWED
| 2 1| 44 1| 93 4| 54 13| 193 3 | 0 0| 5 4| 20 23| 9 39| 34 14 | 227 4
COMMON LAW
| 8 5| 400 14| 346 16| 54 13| 808 14 | 0 0| 11 9| 12 14| 1 4| 24 10 | 832 14
OTHER
| 0 0| 2 0| 2 0| 0 0| 4 0 | 0 0| 0 0| 0 0| 0 0| 0 0 | 4 0
------------------------------------------------------------------------------------------------------------------------------------
Total reported
| 174 100| 2959 100| 2106 100| 431 100| 5670 100 | 9 100| 120 100| 86 100| 23 100| 238 100 | 5908 100
|
|
|
|
|
|
|
|
|
|
|
Percent reported |
98.3|
98.5|
98.3|
97.7|
98.3 | 100.0|
99.2|
98.9|
92.0|
98.3 |
98.3
|
|
|
|
|
|
|
|
|
|
|
|
|
|
|
|
|
|
|
|
|
|
NOT RPTD
| 3 | 46 | 37 | 10 | 96
|0|1|1|2|4
| 100
------------------------------------------------------------------------------------------------------------------------------------
Total
| 177 | 3005 | 2143 | 441 | 5766
| 9 | 121 | 87 | 25 | 242
| 6008
Page 13 Run 07/26/01
Georgia Department of Corrections Office of Planning and Analysis
Inmate statistical profile
Sample: ACTIVE PRISONERS SERVING LIFE EXCLUDING JAIL
Requestor: Statistics
Active inmates 07/26/2001
Self-Rpt Number Of Children At Admission by current age & sex
|
MEN
|
WOMEN
|
| Age | Age | Age | Age | Men
| Age | Age | Age | Age |Women
|Grand
Number Of Children |00-21 %|22-39 %|40-54 %|55-99 %|Total % |00-21 %|22-39 %|40-54 %|55-99 %|Total % |Total %
------------------------------------------------------------------------------------------------------------------------------------
NO CHILDREN
| 0 0| 409 21| 288 17| 40 11| 737 18 | 0 0| 3 3| 3 4| 1 4| 7 4 | 744 18
ONE CHILD
| 33 72| 747 38| 492 30| 65 17| 1337 33 | 1 100| 29 32| 18 23| 1 4| 49 26 | 1386 33
TWO CHILDREN
| 7 15| 416 21| 382 23| 83 22| 888 22 | 0 0| 34 38| 21 27| 9 39| 64 34 | 952 23
THREE CHILDREN
| 5 11| 237 12| 240 15| 76 20| 558 14 | 0 0| 14 16| 16 21| 7 30| 37 19 | 595 14
FOUR CHILDREN
| 0 0| 85 4| 119 7| 47 12| 251 6 | 0 0| 5 6| 11 14| 3 13| 19 10 | 270 6
FIVE CHILDREN
| 1 2| 35 2| 65 4| 25 7| 126 3 | 0 0| 4 4| 2 3| 1 4| 7 4 | 133 3
MORE THAN 5 CHILDREN| 0 0| 32 2| 61 4| 42 11| 135 3 | 0 0| 1 1| 6 8| 1 4| 8 4 | 143 3
------------------------------------------------------------------------------------------------------------------------------------
Total reported
| 46 100| 1961 100| 1647 100| 378 100| 4032 100 | 1 100| 90 100| 77 100| 23 100| 191 100 | 4223 100
|
|
|
|
|
|
|
|
|
|
|
Percent reported |
26.0|
65.3|
76.9|
85.7|
69.9 |
11.1|
74.4|
88.5|
92.0|
78.9 |
70.3
|
|
|
|
|
|
|
|
|
|
|
|
|
|
|
|
|
|
|
|
|
|
NOT REPORTED
| 131 | 1044 | 496 | 63 | 1734
| 8 | 31 | 10 | 2 | 51
| 1785
------------------------------------------------------------------------------------------------------------------------------------
Total
| 177 | 3005 | 2143 | 441 | 5766
| 9 | 121 | 87 | 25 | 242
| 6008
|
|
|
|
|
|
|
|
|
|
|
|
|
|
|
|
|
|
|
|
|
|
|
|
|
|
|
|
|
|
|
|
|
|
|
|
|
|
|
|
|
|
|
|
|
|
|
|
|
|
|
|
|
|
|
AVG NUM CHILDREN | 1.46 | 1.64 | 2.03 | 2.85 | 1.91 | 1.00 | 2.06 | 2.61 | 2.78 | 2.36 | 1.93
* NOTE: THE FIELD LABLED "NO CHILDREN" WAS CORRECTED IN MARCH 1989: MISSING DATA FOR INMATES STILL IN DIAGNOSTICS NOW HAS BEEN REMOVED FROM THIS FIELD AND IDENTIFIED AS "NOT REPORTED" INFORMATION.
Page 14 Run 07/26/01
Georgia Department of Corrections Office of Planning and Analysis
Inmate statistical profile
Sample: ACTIVE PRISONERS SERVING LIFE EXCLUDING JAIL
Requestor: Statistics
Active inmates 07/26/2001
Self-Rpt Religious Affiliation by current age & sex
|
MEN
|
WOMEN
|
| Age | Age | Age | Age | Men
| Age | Age | Age | Age |Women
|Grand
Religion
|00-21 %|22-39 %|40-54 %|55-99 %|Total % |00-21 %|22-39 %|40-54 %|55-99 %|Total % |Total %
------------------------------------------------------------------------------------------------------------------------------------
ISLAM
| 3 2| 148 5| 77 4| 10 2| 238 4 | 0 0| 2 2| 0 0| 0 0| 2 1 | 240 4
CATHOLIC
| 4 2| 85 3| 70 4| 19 5| 178 3 | 0 0| 7 6| 3 4| 1 5| 11 5 | 189 3
BAPTIST
| 73 43| 1443 51| 1212 62| 247 60| 2975 55 | 5 56| 63 54| 45 54| 15 68| 128 56 | 3103 55
METHODIST
| 2 1| 68 2| 85 4| 28 7| 183 3 | 0 0| 3 3| 7 8| 1 5| 11 5 | 194 3
EPISCOPLN
| 0 0| 5 0| 4 0| 2 0| 11 0 | 0 0| 1 1| 2 2| 0 0| 3 1 | 14 0
PRESBYTRN
| 0 0| 7 0| 9 0| 3 1| 19 0 | 0 0| 0 0| 0 0| 2 9| 2 1 | 21 0
CHC OF GOD
| 0 0| 33 1| 24 1| 9 2| 66 1 | 0 0| 4 3| 1 1| 0 0| 5 2 | 71 1
HOLINESS
| 5 3| 131 5| 92 5| 26 6| 254 5 | 2 22| 13 11| 12 14| 0 0| 27 12 | 281 5
JEWISH
| 0 0| 1 0| 3 0| 1 0| 5 0 | 0 0| 0 0| 0 0| 0 0| 0 0 | 5 0
ANGLICAN
| 0 0| 0 0| 0 0| 0 0| 0 0 | 0 0| 1 1| 0 0| 0 0| 1 0 | 1 0
GRK ORTHDX
| 0 0| 0 0| 0 0| 0 0| 0 0 | 0 0| 0 0| 0 0| 0 0| 0 0 | 0 0
HINDU
| 0 0| 0 0| 0 0| 0 0| 0 0 | 0 0| 0 0| 0 0| 0 0| 0 0 | 0 0
BUDDHIST
| 2 1| 2 0| 1 0| 0 0| 5 0 | 0 0| 0 0| 0 0| 0 0| 0 0 | 5 0
TAOIST
| 0 0| 0 0| 0 0| 0 0| 0 0 | 0 0| 0 0| 0 0| 0 0| 0 0 | 0 0
SHINTOIST
| 0 0| 0 0| 0 0| 0 0| 0 0 | 0 0| 0 0| 0 0| 0 0| 0 0 | 0 0
SEVEN D AD
| 0 0| 6 0| 4 0| 1 0| 11 0 | 0 0| 0 0| 0 0| 0 0| 0 0 | 11 0
JEHOVAH WT
| 1 1| 23 1| 13 1| 1 0| 38 1 | 0 0| 1 1| 0 0| 0 0| 1 0 | 39 1
LATR DAY S
| 0 0| 2 0| 1 0| 0 0| 3 0 | 0 0| 0 0| 0 0| 0 0| 0 0 | 3 0
QUAKER
| 0 0| 0 0| 0 0| 0 0| 0 0 | 0 0| 0 0| 0 0| 0 0| 0 0 | 0 0
OTHER PROD
| 21 12| 228 8| 71 4| 17 4| 337 6 | 0 0| 8 7| 6 7| 1 5| 15 7 | 352 6
NONE
| 46 27| 442 16| 144 7| 17 4| 649 12 | 1 11| 6 5| 1 1| 0 0| 8 3 | 657 12
OTHER
| 12 7| 216 8| 151 8| 34 8| 413 8 | 1 11| 7 6| 6 7| 2 9| 16 7 | 429 8
------------------------------------------------------------------------------------------------------------------------------------
Total reported
| 169 100| 2840 100| 1961 100| 415 100| 5385 100 | 9 100| 116 100| 83 100| 22 100| 230 100 | 5615 100
|
|
|
|
|
|
|
|
|
|
|
Percent reported |
95.5|
94.5|
91.5|
94.1|
93.4 | 100.0|
95.9|
95.4|
88.0|
95.0 |
93.5
|
|
|
|
|
|
|
|
|
|
|
|
|
|
|
|
|
|
|
|
|
|
NOT RPTD
| 8 | 165 | 182 | 26 | 381
| 0 | 5 | 4 | 3 | 12
| 393
------------------------------------------------------------------------------------------------------------------------------------
Total
| 177 | 3005 | 2143 | 441 | 5766
| 9 | 121 | 87 | 25 | 242
| 6008
Page 15 Run 07/26/01
Georgia Department of Corrections Office of Planning and Analysis
Inmate statistical profile
Sample: ACTIVE PRISONERS SERVING LIFE EXCLUDING JAIL
Requestor: Statistics
Active inmates 07/26/2001
Self-Rpt Family Behavior Patterns * by current age & sex
|
MEN
|
WOMEN
|
| Age | Age | Age | Age | Men
| Age | Age | Age | Age |Women
|Grand
Family Behavior
|00-21 %|22-39 %|40-54 %|55-99 %|Total % |00-21 %|22-39 %|40-54 %|55-99 %|Total % |Total %
------------------------------------------------------------------------------------------------------------------------------------
CRIMINLTY
| 53 21| 797 24| 533 28| 83 26| 1466 25 | 4 15| 33 17| 16 21| 2 12| 55 18 | 1521 25
ALCOHOLISM
| 19 8| 319 10| 294 16| 47 15| 679 12 | 2 7| 25 13| 16 21| 2 12| 45 14 | 724 12
DRUG ABUSE
| 28 11| 183 5| 72 4| 8 3| 291 5 | 2 7| 21 11| 4 5| 0 0| 27 9 | 318 5
DOMINERING
| 2 1| 13 0| 13 1| 0 0| 28 0 | 6 22| 13 7| 5 6| 2 12| 26 8 | 54 1
MIGRANT
| 1 0| 46 1| 42 2| 1 0| 90 2 | 1 4| 1 1| 2 3| 0 0| 4 1 | 94 2
INFL BTGS
| 8 3| 139 4| 70 4| 16 5| 233 4 | 3 11| 20 11| 6 8| 2 12| 31 10 | 264 4
PERMISSIVE
| 1 0| 7 0| 15 1| 2 1| 25 0 | 1 4| 5 3| 2 3| 0 0| 8 3 | 33 1
FATH ABSNT
| 109 43| 1497 45| 668 36| 127 40| 2401 41 | 5 19| 48 25| 17 22| 7 41| 77 25 | 2478 41
MOTH ABSNT
| 28 11| 310 9| 149 8| 32 10| 519 9 | 1 4| 15 8| 3 4| 1 6| 20 6 | 539 9
NONE
| 3 1| 37 1| 16 1| 2 1| 58 1 | 2 7| 9 5| 7 9| 1 6| 19 6 | 77 1
------------------------------------------------------------------------------------------------------------------------------------
Total reported
| 252 100| 3348 100| 1872 100| 318 100| 5790 100 | 27 100| 190 100| 78 100| 17 100| 312 100 | 6102 100
|
|
|
|
|
|
|
|
|
|
|
Percent reported |
77.4|
70.6|
60.3|
51.0|
65.5 | 100.0|
68.6|
57.5|
48.0|
63.6 |
65.4
|
|
|
|
|
|
|
|
|
|
|
|
|
|
|
|
|
|
|
|
|
|
OTHER
| 40 | 884 | 850 | 216 | 1990
| 0 | 38 | 37 | 13 | 88
| 2078
------------------------------------------------------------------------------------------------------------------------------------
Total
| 177 | 3005 | 2143 | 441 | 5766
| 9 | 121 | 87 | 25 | 242
| 6008
* NOTE: SINCE THERE CAN BE UP TO FIVE BEHAVIOR CODES PER INMATE, THE NUMBER OF CASES REPORTED IN THE DETAIL LINES AND THE TOTAL REPORTED LINE MAY EXCEED THE TOTAL NUMBER OF CASES. IN SHORT, THIS TABLE COUNTS THE NUMBER OF BEHAVIOR PROBLEMS, NOT INMATES.
Page 16 Run 07/26/01
Georgia Department of Corrections Office of Planning and Analysis
Inmate statistical profile
Sample: ACTIVE PRISONERS SERVING LIFE EXCLUDING JAIL
Requestor: Statistics
Active inmates 07/26/2001
Inmate Diagnostic Behavior Problem * by current age & sex
|
MEN
|
WOMEN
|
| Age | Age | Age | Age | Men
| Age | Age | Age | Age |Women
|Grand
Diagnostic Problem |00-21 %|22-39 %|40-54 %|55-99 %|Total % |00-21 %|22-39 %|40-54 %|55-99 %|Total % |Total %
------------------------------------------------------------------------------------------------------------------------------------
ALCOHOLIC
| 3 1| 131 2| 144 4| 40 6| 318 3 | 1 4| 3 1| 12 8| 2 7| 18 4 | 336 3
ALCOH ABSE
| 40 11| 864 16| 660 17| 115 17| 1679 16 | 1 4| 26 13| 16 11| 5 17| 48 12 | 1727 16
DRUG EXP
| 61 17| 786 15| 384 10| 43 6| 1274 12 | 2 8| 21 10| 16 11| 0 0| 39 10 | 1313 12
DRUG ABSE
| 72 20| 960 18| 678 18| 49 7| 1759 17 | 4 16| 39 19| 24 16| 0 0| 67 17 | 1826 17
NARC ADDCT
| 1 0| 95 2| 94 2| 7 1| 197 2 | 0 0| 3 1| 3 2| 0 0| 6 1 | 203 2
EPILEPTIC
| 0 0| 26 0| 23 1| 6 1| 55 1 | 0 0| 0 0| 2 1| 0 0| 2 0 | 57 1
MANIPULTVE
| 35 10| 267 5| 119 3| 22 3| 443 4 | 1 4| 3 1| 0 0| 1 3| 5 1 | 448 4
ASSAULTIVE
| 123 34| 1382 26| 966 25| 190 28| 2661 26 | 7 28| 57 28| 30 21| 5 17| 99 25 | 2760 26
ESCPE TEND
| 5 1| 110 2| 214 6| 47 7| 376 4 | 0 0| 2 1| 4 3| 0 0| 6 1 | 382 4
SUICIDAL
| 8 2| 141 3| 112 3| 16 2| 277 3 | 4 16| 14 7| 7 5| 2 7| 27 7 | 304 3
WITHDRAWN
| 0 0| 33 1| 22 1| 7 1| 62 1 | 2 8| 2 1| 3 2| 0 0| 7 2 | 69 1
PR RLTY CT
| 1 0| 34 1| 49 1| 13 2| 97 1 | 1 4| 1 0| 3 2| 1 3| 6 1 | 103 1
HOMOSEXUAL
| 1 0| 12 0| 10 0| 5 1| 28 0 | 2 8| 4 2| 3 2| 0 0| 9 2 | 37 0
NONE
| 0 0| 274 5| 242 6| 75 11| 591 6 | 0 0| 9 4| 15 10| 9 30| 33 8 | 624 6
OTHER
| 1 0| 72 1| 60 2| 24 3| 157 2 | 0 0| 0 0| 0 0| 3 10| 3 1 | 160 1
NOT RPTD
| 16 4| 187 3| 67 2| 27 4| 297 3 | 0 0| 17 8| 7 5| 2 7| 26 6 | 323 3
------------------------------------------------------------------------------------------------------------------------------------
Total reported
| 367 100| 5383 100| 3845 100| 687 100|10282 100 | 25 100| 201 100| 146 100| 30 100| 402 100 |10684 100
|
|
|
|
|
|
|
|
|
|
|
Percent reported | 100.0|
99.7| 100.0|
99.8|
99.8 | 100.0| 100.0|
98.9| 100.0|
99.6 |
99.8
|
|
|
|
|
|
|
|
|
|
|
|
|
|
|
|
|
|
|
|
|
|
UNKNOWN
| 0 | 9 | 1 | 1 | 11
|0|0|1|0|1
| 12
------------------------------------------------------------------------------------------------------------------------------------
Total
| 177 | 3005 | 2143 | 441 | 5766
| 9 | 121 | 87 | 25 | 242
| 6008
* NOTE: SINCE THERE CAN BE UP TO FIVE BEHAVIOR CODES PER INMATE, THE NUMBER OF CASES REPORTED IN THE DETAIL LINES AND THE TOTAL REPORTED LINE MAY EXCEED THE TOTAL NUMBER OF CASES. IN SHORT, THIS TABLE COUNTS THE NUMBER OF BEHAVIOR PROBLEMS, NOT INMATES.
Page 17 Run 07/26/01
Georgia Department of Corrections Office of Planning and Analysis
Inmate statistical profile
Sample: ACTIVE PRISONERS SERVING LIFE EXCLUDING JAIL
Requestor: Statistics
Active inmates 07/26/2001
Physical Profile (General Condition) by current age & sex
|
MEN
|
WOMEN
|
| Age | Age | Age | Age | Men
| Age | Age | Age | Age |Women
|Grand
Physical Profile |00-21 %|22-39 %|40-54 %|55-99 %|Total % |00-21 %|22-39 %|40-54 %|55-99 %|Total % |Total %
------------------------------------------------------------------------------------------------------------------------------------
NO LIMITATION
| 157 90| 2161 73| 1051 49| 82 19| 3451 60 | 9 100| 88 75| 41 48| 1 5| 139 59 | 3590 60
DEFECT NO MAJOR LIMT| 10 6| 400 13| 448 21| 93 21| 951 17 | 0 0| 4 3| 13 15| 5 23| 22 9 | 973 16
DEFECT MAJOR LIMIT | 8 5| 415 14| 620 29| 237 54| 1280 22 | 0 0| 26 22| 31 36| 14 64| 71 30 | 1351 23
VERY MAJOR DEFECT | 0 0| 3 0| 13 1| 26 6| 42 1 | 0 0| 0 0| 1 1| 2 9| 3 1 | 45 1
------------------------------------------------------------------------------------------------------------------------------------
Total reported
| 175 100| 2979 100| 2132 100| 438 100| 5724 100 | 9 100| 118 100| 86 100| 22 100| 235 100 | 5959 100
|
|
|
|
|
|
|
|
|
|
|
Percent reported |
98.9|
99.1|
99.5|
99.3|
99.3 | 100.0|
97.5|
98.9|
88.0|
97.1 |
99.2
|
|
|
|
|
|
|
|
|
|
|
|
|
|
|
|
|
|
|
|
|
|
NOT REPORTED
| 2 | 26 | 11 | 3 | 42
|0|3|1|3|7
| 49
------------------------------------------------------------------------------------------------------------------------------------
Total
| 177 | 3005 | 2143 | 441 | 5766
| 9 | 121 | 87 | 25 | 242
| 6008
Page 18 Run 07/26/01
Georgia Department of Corrections Office of Planning and Analysis
Inmate statistical profile
Sample: ACTIVE PRISONERS SERVING LIFE EXCLUDING JAIL
Requestor: Statistics
Active inmates 07/26/2001
Security Status by current age & sex
|
MEN
|
WOMEN
|
| Age | Age | Age | Age | Men
| Age | Age | Age | Age |Women
|Grand
Security
|00-21 %|22-39 %|40-54 %|55-99 %|Total % |00-21 %|22-39 %|40-54 %|55-99 %|Total % |Total %
------------------------------------------------------------------------------------------------------------------------------------
DIAG INCOM
| 0 0| 1 0| 0 0| 1 0| 2 0 | 0 0| 0 0| 0 0| 0 0| 0 0 | 2 0
WRK RELEAS
| 0 0| 0 0| 0 0| 0 0| 0 0 | 0 0| 0 0| 0 0| 0 0| 0 0 | 0 0
TRUSTY
| 0 0| 55 2| 41 2| 3 1| 99 2 | 0 0| 0 0| 3 3| 1 4| 4 2 | 103 2
MINIMUM
| 0 0| 374 12| 465 22| 103 23| 942 16 | 0 0| 41 34| 35 40| 17 68| 93 38 | 1035 17
MEDIUM
| 18 10| 1269 42| 1138 53| 259 59| 2684 47 | 0 0| 48 40| 36 41| 7 28| 91 38 | 2775 46
CLOSE
| 143 81| 1159 39| 414 19| 68 15| 1784 31 | 9 100| 32 26| 12 14| 0 0| 53 22 | 1837 31
MAXIMUM
| 4 2| 135 4| 80 4| 6 1| 225 4 | 0 0| 0 0| 1 1| 0 0| 1 0 | 226 4
DIAGNOSTIC
| 12 7| 12 0| 5 0| 1 0| 30 1 | 0 0| 0 0| 0 0| 0 0| 0 0 | 30 0
------------------------------------------------------------------------------------------------------------------------------------
Total reported
| 177 100| 3005 100| 2143 100| 441 100| 5766 100 | 9 100| 121 100| 87 100| 25 100| 242 100 | 6008 100
|
|
|
|
|
|
|
|
|
|
|
Percent reported | 100.0| 100.0| 100.0| 100.0| 100.0 | 100.0| 100.0| 100.0| 100.0| 100.0 | 100.0
|
|
|
|
|
|
|
|
|
|
|
|
|
|
|
|
|
|
|
|
|
|
NOT RPTD
|0|0|0|0|0
|0|0|0|0|0
|0
------------------------------------------------------------------------------------------------------------------------------------
Total
| 177 | 3005 | 2143 | 441 | 5766
| 9 | 121 | 87 | 25 | 242
| 6008
* NOTE: BEGINNING IN JULY 1987, THE FACILITIES DIVISION NO LONGER CODED INMATES AS BEING WORK RELEASE
Page 19 Run 07/26/01
Georgia Department of Corrections Office of Planning and Analysis
Inmate statistical profile
Sample: ACTIVE PRISONERS SERVING LIFE EXCLUDING JAIL
Requestor: Statistics
Active inmates 07/26/2001
Number Of Sentences by current age & sex
|
MEN
|
WOMEN
|
| Age | Age | Age | Age | Men
| Age | Age | Age | Age |Women
|Grand
Number Of Sentences |00-21 %|22-39 %|40-54 %|55-99 %|Total % |00-21 %|22-39 %|40-54 %|55-99 %|Total % |Total %
------------------------------------------------------------------------------------------------------------------------------------
ONE
| 56 32| 733 24| 537 25| 152 34| 1478 26 | 3 33| 44 36| 40 46| 12 48| 99 41 | 1577 26
TWO
| 50 28| 705 23| 503 23| 108 24| 1366 24 | 2 22| 39 32| 23 26| 8 32| 72 30 | 1438 24
THREE
| 21 12| 522 17| 379 18| 68 15| 990 17 | 2 22| 20 17| 10 11| 5 20| 37 15 | 1027 17
FOUR
| 22 12| 330 11| 247 12| 38 9| 637 11 | 1 11| 9 7| 4 5| 0 0| 14 6 | 651 11
FIVE
| 8 5| 233 8| 153 7| 21 5| 415 7 | 1 11| 4 3| 4 5| 0 0| 9 4 | 424 7
MORE THAN FIVE
| 20 11| 482 16| 324 15| 54 12| 880 15 | 0 0| 5 4| 6 7| 0 0| 11 5 | 891 15
------------------------------------------------------------------------------------------------------------------------------------
Total reported
| 177 100| 3005 100| 2143 100| 441 100| 5766 100 | 9 100| 121 100| 87 100| 25 100| 242 100 | 6008 100
|
|
|
|
|
|
|
|
|
|
|
Percent reported | 100.0| 100.0| 100.0| 100.0| 100.0 | 100.0| 100.0| 100.0| 100.0| 100.0 | 100.0
|
|
|
|
|
|
|
|
|
|
|
|
|
|
|
|
|
|
|
|
|
|
NOT REPORTED
|0|0|0|0|0
|0|0|0|0|0
|0
------------------------------------------------------------------------------------------------------------------------------------
Total
| 177 | 3005 | 2143 | 441 | 5766
| 9 | 121 | 87 | 25 | 242
| 6008
|
|
|
|
|
|
|
|
|
|
|
|
|
|
|
|
|
|
|
|
|
|
|
|
|
|
|
|
|
|
|
|
|
|
|
|
|
|
|
|
|
|
|
|
|
|
|
|
|
|
|
|
|
|
|
AVG NUM SENTENCES | 2.80 | 3.42 | 3.35 | 2.91 | 3.34 | 2.44 | 2.34 | 2.26 | 1.72 | 2.25 | 3.29
Page 20 Run 07/26/01
Georgia Department of Corrections Office of Planning and Analysis
Inmate statistical profile
Sample: ACTIVE PRISONERS SERVING LIFE EXCLUDING JAIL
Requestor: Statistics
Active inmates 07/26/2001
Number Of Disciplinaries by current age & sex
|
MEN
|
WOMEN
|
| Age | Age | Age | Age | Men
| Age | Age | Age | Age |Women
|Grand
Disciplinaries
|00-21 %|22-39 %|40-54 %|55-99 %|Total % |00-21 %|22-39 %|40-54 %|55-99 %|Total % |Total %
------------------------------------------------------------------------------------------------------------------------------------
ZERO
| 34 19| 422 14| 347 16| 117 27| 920 16 | 1 11| 22 18| 21 24| 13 52| 57 24 | 977 16
ONE
| 21 12| 296 10| 265 12| 68 15| 650 11 | 2 22| 17 14| 18 21| 6 24| 43 18 | 693 12
TWO
| 18 10| 255 8| 185 9| 54 12| 512 9 | 0 0| 13 11| 8 9| 1 4| 22 9 | 534 9
THREE
| 10 6| 180 6| 151 7| 39 9| 380 7 | 1 11| 11 9| 10 11| 1 4| 23 10 | 403 7
FOUR
| 9 5| 167 6| 121 6| 27 6| 324 6 | 0 0| 3 2| 6 7| 1 4| 10 4 | 334 6
FIVE
| 9 5| 147 5| 95 4| 15 3| 266 5 | 0 0| 4 3| 0 0| 0 0| 4 2 | 270 4
MORE THAN FIVE
| 76 43| 1538 51| 978 46| 121 27| 2713 47 | 5 56| 51 42| 24 28| 3 12| 83 34 | 2796 47
------------------------------------------------------------------------------------------------------------------------------------
Total reported
| 177 100| 3005 100| 2142 100| 441 100| 5765 100 | 9 100| 121 100| 87 100| 25 100| 242 100 | 6007 100
|
|
|
|
|
|
|
|
|
|
|
Percent reported | 100.0| 100.0| 100.0| 100.0| 100.0 | 100.0| 100.0| 100.0| 100.0| 100.0 | 100.0
|
|
|
|
|
|
|
|
|
|
|
|
|
|
|
|
|
|
|
|
|
|
NOT REPORTED
|0|0|1|0|1
|0|0|0|0|0
|1
------------------------------------------------------------------------------------------------------------------------------------
Total
| 177 | 3005 | 2143 | 441 | 5766
| 9 | 121 | 87 | 25 | 242
| 6008
|
|
|
|
|
|
|
|
|
|
|
|
|
|
|
|
|
|
|
|
|
|
|
|
|
|
|
|
|
|
|
|
|
|
|
|
|
|
|
|
|
|
|
|
|
|
|
|
|
|
|
|
|
|
|
AVG NUM DISCIP
| 9.79 | 11.08 | 10.47 | 5.50 | 10.39 | 5.89 | 8.34 | 5.97 | 1.68 | 6.71 | 10.24
Page 21 Run 07/26/01
Georgia Department of Corrections Office of Planning and Analysis
Inmate statistical profile
Sample: ACTIVE PRISONERS SERVING LIFE EXCLUDING JAIL
Requestor: Statistics
Active inmates 07/26/2001
Number Of Escapes by current age & sex
|
MEN
|
WOMEN
|
| Age | Age | Age | Age | Men
| Age | Age | Age | Age |Women
|Grand
Escapes
|00-21 %|22-39 %|40-54 %|55-99 %|Total % |00-21 %|22-39 %|40-54 %|55-99 %|Total % |Total %
------------------------------------------------------------------------------------------------------------------------------------
ZERO
| 177 100| 2973 99| 2055 96| 423 96| 5628 98 | 9 100| 121 100| 85 98| 25 100| 240 99 | 5868 98
ONE
| 0 0| 31 1| 70 3| 12 3| 113 2 | 0 0| 0 0| 2 2| 0 0| 2 1 | 115 2
TWO
| 0 0| 1 0| 14 1| 4 1| 19 0 | 0 0| 0 0| 0 0| 0 0| 0 0 | 19 0
THREE
| 0 0| 0 0| 3 0| 2 0| 5 0 | 0 0| 0 0| 0 0| 0 0| 0 0 | 5 0
FOUR
| 0 0| 0 0| 1 0| 0 0| 1 0 | 0 0| 0 0| 0 0| 0 0| 0 0 | 1 0
FIVE
| 0 0| 0 0| 0 0| 0 0| 0 0 | 0 0| 0 0| 0 0| 0 0| 0 0 | 0 0
MORE THAN FIVE
| 0 0| 0 0| 0 0| 0 0| 0 0 | 0 0| 0 0| 0 0| 0 0| 0 0 | 0 0
------------------------------------------------------------------------------------------------------------------------------------
Total reported
| 177 100| 3005 100| 2143 100| 441 100| 5766 100 | 9 100| 121 100| 87 100| 25 100| 242 100 | 6008 100
|
|
|
|
|
|
|
|
|
|
|
Percent reported | 100.0| 100.0| 100.0| 100.0| 100.0 | 100.0| 100.0| 100.0| 100.0| 100.0 | 100.0
|
|
|
|
|
|
|
|
|
|
|
|
|
|
|
|
|
|
|
|
|
|
NOT REPORTED
|0|0|0|0|0
|0|0|0|0|0
|0
------------------------------------------------------------------------------------------------------------------------------------
Total
| 177 | 3005 | 2143 | 441 | 5766
| 9 | 121 | 87 | 25 | 242
| 6008
|
|
|
|
|
|
|
|
|
|
|
|
|
|
|
|
|
|
|
|
|
|
|
|
|
|
|
|
|
|
|
|
|
|
|
|
|
|
|
|
|
|
|
|
|
|
|
|
|
|
|
|
|
|
|
AVG NUM ESCAPES
| .00 | .01 | .05 | .06 | .03 | .00 | .00 | .02 | .00 | .01 | .03
Page 22 Run 07/26/01
Georgia Department of Corrections Office of Planning and Analysis
Inmate statistical profile
Sample: ACTIVE PRISONERS SERVING LIFE EXCLUDING JAIL
Requestor: Statistics
Active inmates 07/26/2001
Number Of Prior Georgia Incarcerations * by current age & sex
|
MEN
|
WOMEN
|
| Age | Age | Age | Age | Men
| Age | Age | Age | Age |Women
|Grand
Prior Incarcerations|00-21 %|22-39 %|40-54 %|55-99 %|Total % |00-21 %|22-39 %|40-54 %|55-99 %|Total % |Total %
------------------------------------------------------------------------------------------------------------------------------------
ZERO
| 168 95| 2020 67| 970 45| 246 56| 3404 59 | 9 100| 104 86| 68 78| 23 92| 204 84 | 3608 60
ONE
| 8 5| 562 19| 522 24| 103 23| 1195 21 | 0 0| 13 11| 13 15| 1 4| 27 11 | 1222 20
TWO
| 1 1| 232 8| 344 16| 46 10| 623 11 | 0 0| 3 2| 5 6| 1 4| 9 4 | 632 11
THREE
| 0 0| 128 4| 174 8| 31 7| 333 6 | 0 0| 0 0| 0 0| 0 0| 0 0 | 333 6
FOUR
| 0 0| 50 2| 74 3| 11 2| 135 2 | 0 0| 1 1| 0 0| 0 0| 1 0 | 136 2
FIVE
| 0 0| 10 0| 37 2| 2 0| 49 1 | 0 0| 0 0| 0 0| 0 0| 0 0 | 49 1
MORE THAN FIVE
| 0 0| 3 0| 22 1| 2 0| 27 0 | 0 0| 0 0| 1 1| 0 0| 1 0 | 28 0
------------------------------------------------------------------------------------------------------------------------------------
Total reported
| 177 100| 3005 100| 2143 100| 441 100| 5766 100 | 9 100| 121 100| 87 100| 25 100| 242 100 | 6008 100
|
|
|
|
|
|
|
|
|
|
|
Percent reported | 100.0| 100.0| 100.0| 100.0| 100.0 | 100.0| 100.0| 100.0| 100.0| 100.0 | 100.0
|
|
|
|
|
|
|
|
|
|
|
|
|
|
|
|
|
|
|
|
|
|
NOT REPORTED
|0|0|0|0|0
|0|0|0|0|0
|0
------------------------------------------------------------------------------------------------------------------------------------
Total
| 177 | 3005 | 2143 | 441 | 5766
| 9 | 121 | 87 | 25 | 242
| 6008
|
|
|
|
|
|
|
|
|
|
|
|
|
|
|
|
|
|
|
|
|
|
|
|
|
|
|
|
|
|
|
|
|
|
|
|
|
|
|
|
|
|
|
|
|
|
|
|
|
|
|
|
|
|
|
AVG # INCARCERATIONS| .06 | .56 | 1.10 | .81 | .76 | .00 | .19 | .36 | .12 | .24 | .74
* This data counts a parole revocation on an existing sentenCE AS A prior incarceration. Also, this data counts, for any cohort of inmates, the total number of Georgia incarcerations the inmate has had during his entire criminal career. For example, if an inmate was admitted to prison first in FY72, and then re-admitted in FY79 and FY85, he had two prior incarcerations before the FY85 admission. This inmate's records show two prior incarcerations in all three of his records since he has had two prior incarcerations in his criminal career. If the cohort of FY72 admissions is selected for analysis, two prior incarcerations will be listed for this inmate even though in FY72, he had no prior incarcerations.
Page 23 Run 07/26/01
Georgia Department of Corrections Office of Planning and Analysis
Inmate statistical profile
Sample: ACTIVE PRISONERS SERVING LIFE EXCLUDING JAIL
Requestor: Statistics
Active inmates 07/26/2001
Number Of Transfers by current age & sex
|
MEN
|
WOMEN
|
| Age | Age | Age | Age | Men
| Age | Age | Age | Age |Women
|Grand
Transfers
|00-21 %|22-39 %|40-54 %|55-99 %|Total % |00-21 %|22-39 %|40-54 %|55-99 %|Total % |Total %
------------------------------------------------------------------------------------------------------------------------------------
ZERO
| 64 36| 96 3| 16 1| 7 2| 183 3 | 0 0| 3 2| 5 6| 0 0| 8 3 | 191 3
ONE
| 75 42| 846 28| 396 18| 97 22| 1414 25 | 8 89| 36 30| 27 31| 5 20| 76 31 | 1490 25
TWO
| 26 15| 674 22| 352 16| 65 15| 1117 19 | 0 0| 41 34| 17 20| 5 20| 63 26 | 1180 20
THREE
| 9 5| 461 15| 300 14| 72 16| 842 15 | 1 11| 17 14| 16 18| 7 28| 41 17 | 883 15
FOUR
| 1 1| 310 10| 239 11| 43 10| 593 10 | 0 0| 12 10| 9 10| 3 12| 24 10 | 617 10
FIVE
| 2 1| 217 7| 190 9| 34 8| 443 8 | 0 0| 6 5| 5 6| 3 12| 14 6 | 457 8
MORE THAN FIVE
| 0 0| 401 13| 650 30| 123 28| 1174 20 | 0 0| 6 5| 8 9| 2 8| 16 7 | 1190 20
------------------------------------------------------------------------------------------------------------------------------------
Total reported
| 177 100| 3005 100| 2143 100| 441 100| 5766 100 | 9 100| 121 100| 87 100| 25 100| 242 100 | 6008 100
|
|
|
|
|
|
|
|
|
|
|
Percent reported | 100.0| 100.0| 100.0| 100.0| 100.0 | 100.0| 100.0| 100.0| 100.0| 100.0 | 100.0
|
|
|
|
|
|
|
|
|
|
|
|
|
|
|
|
|
|
|
|
|
|
NOT REPORTED
|0|0|0|0|0
|0|0|0|0|0
|0
------------------------------------------------------------------------------------------------------------------------------------
Total
| 177 | 3005 | 2143 | 441 | 5766
| 9 | 121 | 87 | 25 | 242
| 6008
|
|
|
|
|
|
|
|
|
|
|
|
|
|
|
|
|
|
|
|
|
|
|
|
|
|
|
|
|
|
|
|
|
|
|
|
|
|
|
|
|
|
|
|
|
|
|
|
|
|
|
|
|
|
|
AVG NUM TRANSFERS | .95 | 3.03 | 4.62 | 4.34 | 3.66 | 1.22 | 2.40 | 2.66 | 3.08 | 2.52 | 3.61
Page 24 Run 07/26/01
Georgia Department of Corrections Office of Planning and Analysis
Inmate statistical profile
Sample: ACTIVE PRISONERS SERVING LIFE EXCLUDING JAIL
Requestor: Statistics
Active inmates 07/26/2001
County Of Conviction by current age & sex
|
MEN
|
WOMEN
|
| Age | Age | Age | Age | Men
| Age | Age | Age | Age |Women
|Grand
County Of Conviction|00-21 %|22-39 %|40-54 %|55-99 %|Total % |00-21 %|22-39 %|40-54 %|55-99 %|Total % |Total %
------------------------------------------------------------------------------------------------------------------------------------
Appling
| 0 0| 4 0| 4 0| 1 0| 9 0 | 0 0| 0 0| 0 0| 0 0| 0 0 | 9 0
Atkinson
| 0 0| 1 0| 2 0| 2 0| 5 0 | 0 0| 0 0| 1 1| 0 0| 1 0 | 6 0
Bacon
| 0 0| 6 0| 3 0| 0 0| 9 0 | 0 0| 0 0| 0 0| 0 0| 0 0 | 9 0
Baker
| 0 0| 1 0| 1 0| 0 0| 2 0 | 0 0| 0 0| 0 0| 0 0| 0 0 | 2 0
Baldwin
| 0 0| 17 1| 12 1| 1 0| 30 1 | 0 0| 1 1| 0 0| 0 0| 1 0 | 31 1
Banks
| 0 0| 3 0| 9 0| 2 0| 14 0 | 0 0| 0 0| 0 0| 0 0| 0 0 | 14 0
Barrow
| 0 0| 3 0| 9 0| 4 1| 16 0 | 0 0| 0 0| 1 1| 0 0| 1 0 | 17 0
Bartow
| 1 1| 26 1| 21 1| 2 0| 50 1 | 0 0| 2 2| 0 0| 0 0| 2 1 | 52 1
Ben Hill
| 0 0| 6 0| 9 0| 3 1| 18 0 | 0 0| 0 0| 0 0| 0 0| 0 0 | 18 0
Berrien
| 0 0| 4 0| 1 0| 0 0| 5 0 | 0 0| 0 0| 0 0| 0 0| 0 0 | 5 0
Bibb
| 4 2| 90 3| 84 4| 18 4| 196 3 | 1 11| 1 1| 2 2| 1 4| 5 2 | 201 3
Bleckley
| 0 0| 7 0| 4 0| 1 0| 12 0 | 0 0| 0 0| 1 1| 0 0| 1 0 | 13 0
Brantley
| 0 0| 1 0| 4 0| 2 0| 7 0 | 0 0| 0 0| 0 0| 0 0| 0 0 | 7 0
Brooks
| 0 0| 5 0| 4 0| 2 0| 11 0 | 0 0| 0 0| 0 0| 0 0| 0 0 | 11 0
Bryan
| 0 0| 9 0| 5 0| 1 0| 15 0 | 0 0| 0 0| 0 0| 1 4| 1 0 | 16 0
Bulloch
| 1 1| 16 1| 15 1| 0 0| 32 1 | 0 0| 1 1| 1 1| 1 4| 3 1 | 35 1
Burke
| 2 1| 15 0| 12 1| 2 0| 31 1 | 0 0| 0 0| 0 0| 0 0| 0 0 | 31 1
Butts
| 2 1| 20 1| 11 1| 2 0| 35 1 | 0 0| 1 1| 0 0| 0 0| 1 0 | 36 1
Calhoun
| 0 0| 2 0| 4 0| 1 0| 7 0 | 0 0| 0 0| 0 0| 0 0| 0 0 | 7 0
Camden
| 1 1| 20 1| 8 0| 0 0| 29 1 | 0 0| 0 0| 1 1| 0 0| 1 0 | 30 0
Candler
| 0 0| 1 0| 1 0| 0 0| 2 0 | 0 0| 0 0| 0 0| 0 0| 0 0 | 2 0
Carroll
| 1 1| 19 1| 13 1| 5 1| 38 1 | 0 0| 3 2| 1 1| 0 0| 4 2 | 42 1
Catoosa
| 0 0| 5 0| 8 0| 0 0| 13 0 | 0 0| 0 0| 0 0| 0 0| 0 0 | 13 0
Charlton
| 0 0| 0 0| 1 0| 0 0| 1 0 | 0 0| 2 2| 0 0| 0 0| 2 1 | 3 0
Chatham
| 8 5| 162 5| 115 5| 16 4| 301 5 | 0 0| 2 2| 1 1| 0 0| 3 1 | 304 5
Chattahoochee
| 0 0| 1 0| 2 0| 0 0| 3 0 | 0 0| 0 0| 0 0| 0 0| 0 0 | 3 0
Chatooga
| 0 0| 5 0| 6 0| 2 0| 13 0 | 0 0| 0 0| 1 1| 1 4| 2 1 | 15 0
Cherokee
| 0 0| 7 0| 23 1| 2 0| 32 1 | 0 0| 3 2| 0 0| 0 0| 3 1 | 35 1
Clarke
| 2 1| 39 1| 22 1| 8 2| 71 1 | 0 0| 2 2| 0 0| 1 4| 3 1 | 74 1
Clay
| 0 0| 1 0| 1 0| 0 0| 2 0 | 0 0| 0 0| 0 0| 0 0| 0 0 | 2 0
Clayton
| 6 3| 74 2| 39 2| 11 2| 130 2 | 1 11| 2 2| 2 2| 1 4| 6 2 | 136 2
Clinch
| 0 0| 1 0| 3 0| 0 0| 4 0 | 0 0| 0 0| 0 0| 0 0| 0 0 | 4 0
Cobb
| 9 5| 108 4| 76 4| 14 3| 207 4 | 0 0| 6 5| 3 3| 1 4| 10 4 | 217 4
Coffee
| 0 0| 8 0| 9 0| 2 0| 19 0 | 0 0| 1 1| 1 1| 0 0| 2 1 | 21 0
Colquit
| 3 2| 36 1| 24 1| 5 1| 68 1 | 0 0| 0 0| 1 1| 1 4| 2 1 | 70 1
Columbia
| 1 1| 6 0| 11 1| 1 0| 19 0 | 0 0| 0 0| 1 1| 0 0| 1 0 | 20 0
------------------------------------------------------------------------------------------------------------------------------------
(continued)
Page 25 Run 07/26/01
Georgia Department of Corrections Office of Planning and Analysis
Inmate statistical profile
Sample: ACTIVE PRISONERS SERVING LIFE EXCLUDING JAIL
Requestor:
Active inmates 07/26/2001
County Of Conviction by current age & sex
Statistics (continued)
|
MEN
|
WOMEN
|
| Age | Age | Age | Age | Men
| Age | Age | Age | Age |Women
|Grand
County Of Conviction|00-21 %|22-39 %|40-54 %|55-99 %|Total % |00-21 %|22-39 %|40-54 %|55-99 %|Total % |Total %
------------------------------------------------------------------------------------------------------------------------------------
Cook
| 0 0| 7 0| 3 0| 0 0| 10 0 | 0 0| 1 1| 0 0| 0 0| 1 0 | 11 0
Coweta
| 3 2| 24 1| 10 0| 3 1| 40 1 | 0 0| 2 2| 1 1| 0 0| 3 1 | 43 1
Crawford
| 0 0| 3 0| 0 0| 0 0| 3 0 | 0 0| 0 0| 0 0| 0 0| 0 0 | 3 0
Crisp
| 4 2| 14 0| 11 1| 2 0| 31 1 | 0 0| 3 2| 0 0| 1 4| 4 2 | 35 1
Dade
| 2 1| 6 0| 5 0| 3 1| 16 0 | 0 0| 0 0| 0 0| 0 0| 0 0 | 16 0
Dawson
| 0 0| 2 0| 4 0| 0 0| 6 0 | 0 0| 0 0| 0 0| 0 0| 0 0 | 6 0
Decatur
| 1 1| 21 1| 6 0| 1 0| 29 1 | 0 0| 1 1| 0 0| 0 0| 1 0 | 30 0
DeKalb
| 14 8| 246 8| 169 8| 24 5| 453 8 | 1 11| 3 2| 4 5| 1 4| 9 4 | 462 8
Dodge
| 0 0| 6 0| 4 0| 1 0| 11 0 | 0 0| 0 0| 0 0| 0 0| 0 0 | 11 0
Dooly
| 2 1| 8 0| 7 0| 0 0| 17 0 | 0 0| 0 0| 0 0| 0 0| 0 0 | 17 0
Dougherty
| 4 2| 74 2| 41 2| 5 1| 124 2 | 0 0| 4 3| 1 1| 0 0| 5 2 | 129 2
Douglas
| 2 1| 51 2| 19 1| 6 1| 78 1 | 0 0| 1 1| 1 1| 0 0| 2 1 | 80 1
Early
| 0 0| 10 0| 5 0| 2 0| 17 0 | 0 0| 0 0| 0 0| 0 0| 0 0 | 17 0
Effingham
| 0 0| 5 0| 4 0| 0 0| 9 0 | 0 0| 0 0| 0 0| 0 0| 0 0 | 9 0
Elbert
| 0 0| 12 0| 10 0| 1 0| 23 0 | 0 0| 1 1| 0 0| 0 0| 1 0 | 24 0
Emanuel
| 0 0| 8 0| 10 0| 3 1| 21 0 | 0 0| 0 0| 1 1| 0 0| 1 0 | 22 0
Evans
| 0 0| 7 0| 3 0| 2 0| 12 0 | 0 0| 0 0| 0 0| 0 0| 0 0 | 12 0
Fannin
| 0 0| 4 0| 5 0| 1 0| 10 0 | 0 0| 0 0| 0 0| 0 0| 0 0 | 10 0
Fayette
| 1 1| 10 0| 5 0| 0 0| 16 0 | 0 0| 0 0| 0 0| 0 0| 0 0 | 16 0
Floyd
| 2 1| 25 1| 28 1| 6 1| 61 1 | 2 22| 3 2| 2 2| 1 4| 8 3 | 69 1
Forsyth
| 0 0| 5 0| 9 0| 4 1| 18 0 | 0 0| 1 1| 1 1| 0 0| 2 1 | 20 0
Franklin
| 1 1| 2 0| 4 0| 1 0| 8 0 | 0 0| 0 0| 2 2| 1 4| 3 1 | 11 0
Fulton
| 29 16| 469 16| 314 15| 67 15| 879 15 | 0 0| 15 12| 8 9| 4 16| 27 11 | 906 15
Gilmer
| 0 0| 1 0| 2 0| 3 1| 6 0 | 0 0| 0 0| 0 0| 0 0| 0 0 | 6 0
Glynn
| 6 3| 32 1| 29 1| 4 1| 71 1 | 0 0| 2 2| 1 1| 0 0| 3 1 | 74 1
Gordon
| 0 0| 21 1| 13 1| 2 0| 36 1 | 0 0| 0 0| 1 1| 0 0| 1 0 | 37 1
Grady
| 5 3| 18 1| 9 0| 1 0| 33 1 | 0 0| 0 0| 0 0| 0 0| 0 0 | 33 1
Greene
| 0 0| 3 0| 5 0| 1 0| 9 0 | 0 0| 0 0| 0 0| 0 0| 0 0 | 9 0
Gwinnett
| 0 0| 66 2| 44 2| 9 2| 119 2 | 0 0| 2 2| 5 6| 1 4| 8 3 | 127 2
Habersham
| 1 1| 12 0| 10 0| 0 0| 23 0 | 0 0| 0 0| 0 0| 0 0| 0 0 | 23 0
Hall
| 3 2| 38 1| 41 2| 10 2| 92 2 | 1 11| 2 2| 2 2| 1 4| 6 2 | 98 2
Hancock
| 0 0| 3 0| 1 0| 0 0| 4 0 | 0 0| 0 0| 1 1| 0 0| 1 0 | 5 0
Haralson
| 0 0| 3 0| 2 0| 1 0| 6 0 | 0 0| 0 0| 0 0| 0 0| 0 0 | 6 0
Harris
| 1 1| 8 0| 3 0| 0 0| 12 0 | 0 0| 0 0| 0 0| 0 0| 0 0 | 12 0
Hart
| 0 0| 2 0| 3 0| 0 0| 5 0 | 0 0| 0 0| 0 0| 0 0| 0 0 | 5 0
------------------------------------------------------------------------------------------------------------------------------------
(continued)
Page 26 Run 07/26/01
Georgia Department of Corrections Office of Planning and Analysis
Inmate statistical profile
Sample: ACTIVE PRISONERS SERVING LIFE EXCLUDING JAIL
Requestor:
Active inmates 07/26/2001
County Of Conviction by current age & sex
Statistics (continued)
|
MEN
|
WOMEN
|
| Age | Age | Age | Age | Men
| Age | Age | Age | Age |Women
|Grand
County Of Conviction|00-21 %|22-39 %|40-54 %|55-99 %|Total % |00-21 %|22-39 %|40-54 %|55-99 %|Total % |Total %
------------------------------------------------------------------------------------------------------------------------------------
Heard
| 0 0| 2 0| 0 0| 3 1| 5 0 | 0 0| 0 0| 0 0| 0 0| 0 0 | 5 0
Henry
| 1 1| 23 1| 10 0| 1 0| 35 1 | 0 0| 1 1| 0 0| 0 0| 1 0 | 36 1
Houston
| 1 1| 38 1| 20 1| 3 1| 62 1 | 0 0| 3 2| 3 3| 1 4| 7 3 | 69 1
Irwin
| 0 0| 2 0| 2 0| 1 0| 5 0 | 0 0| 0 0| 0 0| 0 0| 0 0 | 5 0
Jackson
| 1 1| 6 0| 13 1| 1 0| 21 0 | 0 0| 1 1| 0 0| 0 0| 1 0 | 22 0
Jasper
| 0 0| 6 0| 3 0| 0 0| 9 0 | 0 0| 0 0| 1 1| 0 0| 1 0 | 10 0
Jeff Davis
| 0 0| 4 0| 4 0| 2 0| 10 0 | 0 0| 0 0| 0 0| 0 0| 0 0 | 10 0
Jefferson
| 0 0| 7 0| 7 0| 4 1| 18 0 | 0 0| 0 0| 0 0| 0 0| 0 0 | 18 0
Jenkins
| 0 0| 2 0| 4 0| 0 0| 6 0 | 0 0| 0 0| 0 0| 0 0| 0 0 | 6 0
Johnson
| 0 0| 9 0| 2 0| 1 0| 12 0 | 0 0| 1 1| 0 0| 0 0| 1 0 | 13 0
Jones
| 0 0| 1 0| 8 0| 3 1| 12 0 | 0 0| 0 0| 0 0| 0 0| 0 0 | 12 0
Lamar
| 1 1| 10 0| 9 0| 3 1| 23 0 | 0 0| 0 0| 1 1| 0 0| 1 0 | 24 0
Lanier
| 0 0| 1 0| 0 0| 0 0| 1 0 | 0 0| 0 0| 0 0| 0 0| 0 0 | 1 0
Laurens
| 1 1| 12 0| 8 0| 1 0| 22 0 | 0 0| 1 1| 2 2| 0 0| 3 1 | 25 0
Lee
| 0 0| 2 0| 0 0| 0 0| 2 0 | 1 11| 0 0| 0 0| 0 0| 1 0 | 3 0
Liberty
| 1 1| 19 1| 10 0| 4 1| 34 1 | 0 0| 1 1| 0 0| 0 0| 1 0 | 35 1
Lincoln
| 0 0| 3 0| 2 0| 0 0| 5 0 | 0 0| 0 0| 0 0| 0 0| 0 0 | 5 0
Long
| 3 2| 5 0| 4 0| 2 0| 14 0 | 0 0| 2 2| 0 0| 0 0| 2 1 | 16 0
Lowndes
| 0 0| 42 1| 27 1| 2 0| 71 1 | 0 0| 0 0| 2 2| 1 4| 3 1 | 74 1
Lumpkins
| 1 1| 3 0| 0 0| 2 0| 6 0 | 0 0| 0 0| 0 0| 0 0| 0 0 | 6 0
Macon
| 0 0| 16 1| 8 0| 0 0| 24 0 | 0 0| 0 0| 0 0| 0 0| 0 0 | 24 0
Madison
| 0 0| 9 0| 5 0| 2 0| 16 0 | 0 0| 2 2| 0 0| 0 0| 2 1 | 18 0
Marion
| 0 0| 2 0| 1 0| 0 0| 3 0 | 0 0| 0 0| 1 1| 0 0| 1 0 | 4 0
McDuffie
| 0 0| 26 1| 13 1| 4 1| 43 1 | 1 11| 0 0| 0 0| 0 0| 1 0 | 44 1
McIntosh
| 1 1| 8 0| 8 0| 0 0| 17 0 | 0 0| 0 0| 0 0| 0 0| 0 0 | 17 0
Meriwether
| 0 0| 10 0| 9 0| 4 1| 23 0 | 0 0| 2 2| 0 0| 1 4| 3 1 | 26 0
Miller
| 0 0| 1 0| 2 0| 0 0| 3 0 | 0 0| 0 0| 0 0| 0 0| 0 0 | 3 0
Mitchell
| 0 0| 12 0| 10 0| 2 0| 24 0 | 0 0| 2 2| 0 0| 0 0| 2 1 | 26 0
Monroe
| 0 0| 11 0| 9 0| 2 0| 22 0 | 0 0| 1 1| 0 0| 0 0| 1 0 | 23 0
Montgomery
| 0 0| 0 0| 3 0| 0 0| 3 0 | 0 0| 0 0| 0 0| 0 0| 0 0 | 3 0
Morgan
| 0 0| 11 0| 3 0| 0 0| 14 0 | 0 0| 1 1| 0 0| 0 0| 1 0 | 15 0
Murray
| 1 1| 4 0| 6 0| 5 1| 16 0 | 0 0| 0 0| 0 0| 0 0| 0 0 | 16 0
Muscogee
| 2 1| 88 3| 76 4| 12 3| 178 3 | 0 0| 4 3| 2 2| 0 0| 6 2 | 184 3
Newton
| 1 1| 44 1| 15 1| 4 1| 64 1 | 0 0| 2 2| 0 0| 0 0| 2 1 | 66 1
Oconee
| 0 0| 8 0| 4 0| 0 0| 12 0 | 0 0| 0 0| 0 0| 0 0| 0 0 | 12 0
------------------------------------------------------------------------------------------------------------------------------------
(continued)
Page 27 Run 07/26/01
Georgia Department of Corrections Office of Planning and Analysis
Inmate statistical profile
Sample: ACTIVE PRISONERS SERVING LIFE EXCLUDING JAIL
Requestor:
Active inmates 07/26/2001
County Of Conviction by current age & sex
Statistics (continued)
|
MEN
|
WOMEN
|
| Age | Age | Age | Age | Men
| Age | Age | Age | Age |Women
|Grand
County Of Conviction|00-21 %|22-39 %|40-54 %|55-99 %|Total % |00-21 %|22-39 %|40-54 %|55-99 %|Total % |Total %
------------------------------------------------------------------------------------------------------------------------------------
Oglethrope
| 0 0| 4 0| 4 0| 1 0| 9 0 | 0 0| 0 0| 0 0| 0 0| 0 0 | 9 0
Paulding
| 0 0| 4 0| 6 0| 2 0| 12 0 | 0 0| 1 1| 0 0| 0 0| 1 0 | 13 0
Peach
| 0 0| 6 0| 3 0| 0 0| 9 0 | 0 0| 0 0| 1 1| 0 0| 1 0 | 10 0
Pickens
| 0 0| 2 0| 2 0| 1 0| 5 0 | 0 0| 0 0| 1 1| 0 0| 1 0 | 6 0
Pierce
| 3 2| 2 0| 4 0| 1 0| 10 0 | 0 0| 0 0| 0 0| 0 0| 0 0 | 10 0
Pike
| 0 0| 1 0| 1 0| 0 0| 2 0 | 0 0| 0 0| 0 0| 0 0| 0 0 | 2 0
Polk
| 1 1| 14 0| 6 0| 3 1| 24 0 | 0 0| 0 0| 0 0| 0 0| 0 0 | 24 0
Pulaski
| 0 0| 7 0| 1 0| 0 0| 8 0 | 0 0| 1 1| 0 0| 0 0| 1 0 | 9 0
Putnam
| 0 0| 20 1| 14 1| 3 1| 37 1 | 0 0| 0 0| 0 0| 0 0| 0 0 | 37 1
Quitman
| 0 0| 4 0| 0 0| 0 0| 4 0 | 0 0| 0 0| 0 0| 0 0| 0 0 | 4 0
Rabun
| 0 0| 6 0| 3 0| 0 0| 9 0 | 0 0| 0 0| 0 0| 0 0| 0 0 | 9 0
Randolph
| 0 0| 3 0| 2 0| 2 0| 7 0 | 0 0| 0 0| 0 0| 0 0| 0 0 | 7 0
Richmond
| 9 5| 158 5| 75 3| 15 3| 257 4 | 0 0| 8 7| 8 9| 1 4| 17 7 | 274 5
Rockdale
| 1 1| 10 0| 12 1| 5 1| 28 0 | 0 0| 1 1| 0 0| 0 0| 1 0 | 29 0
Schely
| 0 0| 3 0| 2 0| 0 0| 5 0 | 0 0| 0 0| 0 0| 0 0| 0 0 | 5 0
Screven
| 0 0| 5 0| 4 0| 3 1| 12 0 | 0 0| 0 0| 0 0| 0 0| 0 0 | 12 0
Seminole
| 0 0| 5 0| 4 0| 2 0| 11 0 | 0 0| 1 1| 0 0| 0 0| 1 0 | 12 0
Spalding
| 2 1| 41 1| 24 1| 6 1| 73 1 | 1 11| 2 2| 2 2| 1 4| 6 2 | 79 1
Stephens
| 0 0| 3 0| 4 0| 3 1| 10 0 | 0 0| 0 0| 0 0| 0 0| 0 0 | 10 0
Stewart
| 0 0| 2 0| 1 0| 0 0| 3 0 | 0 0| 0 0| 2 2| 0 0| 2 1 | 5 0
Sumter
| 0 0| 5 0| 13 1| 1 0| 19 0 | 0 0| 0 0| 1 1| 0 0| 1 0 | 20 0
Talbot
| 2 1| 4 0| 1 0| 0 0| 7 0 | 0 0| 0 0| 1 1| 0 0| 1 0 | 8 0
Taliaferro
| 0 0| 0 0| 3 0| 0 0| 3 0 | 0 0| 0 0| 0 0| 0 0| 0 0 | 3 0
Tattnall
| 0 0| 17 1| 13 1| 2 0| 32 1 | 0 0| 0 0| 1 1| 0 0| 1 0 | 33 1
Taylor
| 2 1| 10 0| 5 0| 0 0| 17 0 | 0 0| 0 0| 0 0| 0 0| 0 0 | 17 0
Telfair
| 1 1| 6 0| 2 0| 0 0| 9 0 | 0 0| 0 0| 1 1| 0 0| 1 0 | 10 0
Terrell
| 1 1| 12 0| 2 0| 2 0| 17 0 | 0 0| 0 0| 0 0| 0 0| 0 0 | 17 0
Thomas
| 1 1| 16 1| 22 1| 3 1| 42 1 | 0 0| 1 1| 1 1| 0 0| 2 1 | 44 1
Tift
| 6 3| 32 1| 23 1| 4 1| 65 1 | 0 0| 0 0| 2 2| 1 4| 3 1 | 68 1
Toombs
| 4 2| 20 1| 10 0| 2 0| 36 1 | 0 0| 2 2| 0 0| 0 0| 2 1 | 38 1
Towns
| 0 0| 1 0| 1 0| 0 0| 2 0 | 0 0| 0 0| 0 0| 0 0| 0 0 | 2 0
Treutlen
| 0 0| 3 0| 4 0| 0 0| 7 0 | 0 0| 0 0| 0 0| 0 0| 0 0 | 7 0
Troup
| 2 1| 25 1| 27 1| 6 1| 60 1 | 0 0| 2 2| 1 1| 0 0| 3 1 | 63 1
Turner
| 0 0| 7 0| 7 0| 1 0| 15 0 | 0 0| 0 0| 0 0| 0 0| 0 0 | 15 0
Twiggs
| 0 0| 3 0| 5 0| 1 0| 9 0 | 0 0| 0 0| 0 0| 0 0| 0 0 | 9 0
------------------------------------------------------------------------------------------------------------------------------------
(continued)
Page 28 Run 07/26/01
Georgia Department of Corrections Office of Planning and Analysis
Inmate statistical profile
Sample: ACTIVE PRISONERS SERVING LIFE EXCLUDING JAIL
Requestor:
Active inmates 07/26/2001
County Of Conviction by current age & sex
Statistics (continued)
|
MEN
|
WOMEN
|
| Age | Age | Age | Age | Men
| Age | Age | Age | Age |Women
|Grand
County Of Conviction|00-21 %|22-39 %|40-54 %|55-99 %|Total % |00-21 %|22-39 %|40-54 %|55-99 %|Total % |Total %
------------------------------------------------------------------------------------------------------------------------------------
Union
| 0 0| 0 0| 1 0| 0 0| 1 0 | 0 0| 0 0| 0 0| 0 0| 0 0 | 1 0
Upson
| 1 1| 7 0| 4 0| 1 0| 13 0 | 0 0| 0 0| 1 1| 0 0| 1 0 | 14 0
Walker
| 0 0| 14 0| 11 1| 4 1| 29 1 | 0 0| 1 1| 1 1| 0 0| 2 1 | 31 1
Walton
| 3 2| 29 1| 20 1| 4 1| 56 1 | 0 0| 1 1| 0 0| 0 0| 1 0 | 57 1
Ware
| 0 0| 13 0| 12 1| 3 1| 28 0 | 0 0| 0 0| 1 1| 0 0| 1 0 | 29 0
Warren
| 0 0| 4 0| 6 0| 1 0| 11 0 | 0 0| 0 0| 0 0| 0 0| 0 0 | 11 0
Washington
| 0 0| 7 0| 6 0| 2 0| 15 0 | 0 0| 2 2| 0 0| 0 0| 2 1 | 17 0
Wayne
| 0 0| 8 0| 8 0| 2 0| 18 0 | 0 0| 1 1| 0 0| 0 0| 1 0 | 19 0
Webster
| 0 0| 1 0| 0 0| 0 0| 1 0 | 0 0| 0 0| 0 0| 0 0| 0 0 | 1 0
Wheeler
| 0 0| 3 0| 3 0| 1 0| 7 0 | 0 0| 0 0| 0 0| 1 4| 1 0 | 8 0
White
| 0 0| 3 0| 1 0| 1 0| 5 0 | 0 0| 0 0| 0 0| 0 0| 0 0 | 5 0
Whitfield
| 1 1| 24 1| 23 1| 8 2| 56 1 | 0 0| 5 4| 1 1| 0 0| 6 2 | 62 1
Wilcox
| 0 0| 1 0| 6 0| 1 0| 8 0 | 0 0| 0 0| 0 0| 0 0| 0 0 | 8 0
Wilkes
| 0 0| 6 0| 6 0| 1 0| 13 0 | 0 0| 0 0| 0 0| 0 0| 0 0 | 13 0
Wilkinson
| 0 0| 6 0| 2 0| 0 0| 8 0 | 0 0| 0 0| 0 0| 0 0| 0 0 | 8 0
Worth
| 0 0| 16 1| 5 0| 2 0| 23 0 | 0 0| 0 0| 0 0| 0 0| 0 0 | 23 0
------------------------------------------------------------------------------------------------------------------------------------
Total reported
| 177 100| 3005 100| 2143 100| 441 100| 5766 100 | 9 100| 121 100| 87 100| 25 100| 242 100 | 6008 100
|
|
|
|
|
|
|
|
|
|
|
Percent reported | 100.0| 100.0| 100.0| 100.0| 100.0 | 100.0| 100.0| 100.0| 100.0| 100.0 | 100.0
|
|
|
|
|
|
|
|
|
|
|
|
|
|
|
|
|
|
|
|
|
|
Not reported
|0|0|0|0|0
|0|0|0|0|0
|0
------------------------------------------------------------------------------------------------------------------------------------
Total
| 177 | 3005 | 2143 | 441 | 5766
| 9 | 121 | 87 | 25 | 242
| 6008
Page 29 Run 07/26/01
Georgia Department of Corrections Office of Planning and Analysis
Inmate statistical profile
Sample: ACTIVE PRISONERS SERVING LIFE EXCLUDING JAIL
Requestor: Statistics
Active inmates 07/26/2001
Circ Of Conviction by current age & sex
|
MEN
|
WOMEN
|
| Age | Age | Age | Age | Men
| Age | Age | Age | Age |Women
|Grand
Circ Of Conviction |00-21 %|22-39 %|40-54 %|55-99 %|Total % |00-21 %|22-39 %|40-54 %|55-99 %|Total % |Total %
------------------------------------------------------------------------------------------------------------------------------------
Alapaha
| 0 0| 14 0| 9 0| 2 0| 25 0 | 0 0| 1 1| 1 1| 0 0| 2 1 | 27 0
Alcovy
| 4 2| 73 2| 35 2| 8 2| 120 2 | 0 0| 3 2| 0 0| 0 0| 3 1 | 123 2
Atlanta
| 29 16| 469 16| 314 15| 67 15| 879 15 | 0 0| 15 12| 8 9| 4 16| 27 11 | 906 15
Atlantic
| 5 3| 65 2| 43 2| 11 2| 124 2 | 0 0| 3 2| 1 1| 1 4| 5 2 | 129 2
Augusta
| 12 7| 179 6| 98 5| 18 4| 307 5 | 0 0| 8 7| 9 10| 1 4| 18 7 | 325 5
Blue Ridge
| 0 0| 7 0| 23 1| 2 0| 32 1 | 0 0| 3 2| 0 0| 0 0| 3 1 | 35 1
Brunswick
| 7 4| 68 2| 53 2| 9 2| 137 2 | 0 0| 3 2| 2 2| 0 0| 5 2 | 142 2
Chattahoochee
| 7 4| 113 4| 88 4| 12 3| 220 4 | 0 0| 4 3| 4 5| 0 0| 8 3 | 228 4
Cherokee
| 1 1| 47 2| 34 2| 4 1| 86 1 | 0 0| 2 2| 1 1| 0 0| 3 1 | 89 1
Clayton
| 6 3| 74 2| 39 2| 11 2| 130 2 | 1 11| 2 2| 2 2| 1 4| 6 2 | 136 2
Cobb
| 9 5| 108 4| 76 4| 14 3| 207 4 | 0 0| 6 5| 3 3| 1 4| 10 4 | 217 4
Conasauga
| 2 1| 28 1| 29 1| 13 3| 72 1 | 0 0| 5 4| 1 1| 0 0| 6 2 | 78 1
Cordele
| 6 3| 29 1| 33 2| 6 1| 74 1 | 0 0| 3 2| 0 0| 1 4| 4 2 | 78 1
Coweta
| 6 3| 80 3| 59 3| 21 5| 166 3 | 0 0| 9 7| 3 3| 1 4| 13 5 | 179 3
Dougherty
| 4 2| 74 2| 41 2| 5 1| 124 2 | 0 0| 4 3| 1 1| 0 0| 5 2 | 129 2
Dublin
| 1 1| 27 1| 19 1| 3 1| 50 1 | 0 0| 2 2| 2 2| 0 0| 4 2 | 54 1
Eastern
| 8 5| 162 5| 115 5| 16 4| 301 5 | 0 0| 2 2| 1 1| 0 0| 3 1 | 304 5
Flint
| 1 1| 23 1| 10 0| 1 0| 35 1 | 0 0| 1 1| 0 0| 0 0| 1 0 | 36 1
Griffin
| 4 2| 59 2| 34 2| 7 2| 104 2 | 1 11| 2 2| 3 3| 1 4| 7 3 | 111 2
Gwinnett
| 0 0| 66 2| 44 2| 9 2| 119 2 | 0 0| 2 2| 5 6| 1 4| 8 3 | 127 2
Houston
| 1 1| 38 1| 20 1| 3 1| 62 1 | 0 0| 3 2| 3 3| 1 4| 7 3 | 69 1
Lookout Mountain | 2 1| 30 1| 30 1| 9 2| 71 1 | 0 0| 1 1| 2 2| 1 4| 4 2 | 75 1
Macon
| 4 2| 99 3| 87 4| 18 4| 208 4 | 1 11| 1 1| 3 3| 1 4| 6 2 | 214 4
Middle
| 4 2| 43 1| 34 2| 11 2| 92 2 | 0 0| 4 3| 1 1| 0 0| 5 2 | 97 2
Mountain
| 1 1| 21 1| 17 1| 3 1| 42 1 | 0 0| 0 0| 0 0| 0 0| 0 0 | 42 1
Northeastern
| 3 2| 40 1| 45 2| 10 2| 98 2 | 1 11| 2 2| 2 2| 1 4| 6 2 | 104 2
Northern
| 1 1| 29 1| 26 1| 5 1| 61 1 | 0 0| 3 2| 2 2| 1 4| 6 2 | 67 1
Ocmulgee
| 0 0| 67 2| 48 2| 8 2| 123 2 | 0 0| 2 2| 2 2| 0 0| 4 2 | 127 2
Oconee
| 1 1| 29 1| 17 1| 3 1| 50 1 | 0 0| 1 1| 2 2| 1 4| 4 2 | 54 1
Ogeechee
| 1 1| 28 1| 27 1| 3 1| 59 1 | 0 0| 1 1| 1 1| 1 4| 3 1 | 62 1
Pataula
| 1 1| 36 1| 16 1| 8 2| 61 1 | 0 0| 1 1| 0 0| 0 0| 1 0 | 62 1
Piedmont
| 1 1| 12 0| 31 1| 7 2| 51 1 | 0 0| 1 1| 1 1| 0 0| 2 1 | 53 1
Rome
| 2 1| 25 1| 28 1| 6 1| 61 1 | 2 22| 3 2| 2 2| 1 4| 8 3 | 69 1
South Georgia
| 6 3| 54 2| 30 1| 5 1| 95 2 | 0 0| 3 2| 0 0| 0 0| 3 1 | 98 2
Southern
| 4 2| 99 3| 77 4| 12 3| 192 3 | 0 0| 1 1| 4 5| 2 8| 7 3 | 199 3
Southwestern
| 0 0| 29 1| 24 1| 1 0| 54 1 | 1 11| 0 0| 3 3| 0 0| 4 2 | 58 1
------------------------------------------------------------------------------------------------------------------------------------
(continued)
Page 30 Run 07/26/01
Georgia Department of Corrections Office of Planning and Analysis
Inmate statistical profile
Sample: ACTIVE PRISONERS SERVING LIFE EXCLUDING JAIL
Requestor:
Active inmates 07/26/2001
Circ Of Conviction by current age & sex
Statistics (continued)
|
MEN
|
WOMEN
|
| Age | Age | Age | Age | Men
| Age | Age | Age | Age |Women
|Grand
Circ Of Conviction |00-21 %|22-39 %|40-54 %|55-99 %|Total % |00-21 %|22-39 %|40-54 %|55-99 %|Total % |Total %
------------------------------------------------------------------------------------------------------------------------------------
Stone Mountain
| 14 8| 246 8| 169 8| 24 5| 453 8 | 1 11| 3 2| 4 5| 1 4| 9 4 | 462 8
Tallapoosa
| 1 1| 21 1| 14 1| 6 1| 42 1 | 0 0| 1 1| 0 0| 0 0| 1 0 | 43 1
Tifton
| 6 3| 57 2| 37 2| 8 2| 108 2 | 0 0| 0 0| 2 2| 1 4| 3 1 | 111 2
Toombs
| 0 0| 39 1| 30 1| 6 1| 75 1 | 1 11| 0 0| 0 0| 0 0| 1 0 | 76 1
Waycross
| 3 2| 30 1| 33 2| 8 2| 74 1 | 0 0| 3 2| 2 2| 0 0| 5 2 | 79 1
Western
| 2 1| 47 2| 26 1| 8 2| 83 1 | 0 0| 2 2| 0 0| 1 4| 3 1 | 86 1
Rockdale
| 1 1| 10 0| 12 1| 5 1| 28 0 | 0 0| 1 1| 0 0| 0 0| 1 0 | 29 0
Douglas
| 2 1| 51 2| 19 1| 6 1| 78 1 | 0 0| 1 1| 1 1| 0 0| 2 1 | 80 1
Appalachian
| 0 0| 7 0| 9 0| 5 1| 21 0 | 0 0| 0 0| 1 1| 0 0| 1 0 | 22 0
Enotah
| 1 1| 7 0| 3 0| 3 1| 14 0 | 0 0| 0 0| 0 0| 0 0| 0 0 | 14 0
Forsyth-Bell
| 0 0| 5 0| 9 0| 4 1| 18 0 | 0 0| 1 1| 1 1| 0 0| 2 1 | 20 0
Towaliga
| 3 2| 41 1| 29 1| 7 2| 80 1 | 0 0| 2 2| 1 1| 0 0| 3 1 | 83 1
------------------------------------------------------------------------------------------------------------------------------------
Total reported
| 177 100| 3005 100| 2143 100| 441 100| 5766 100 | 9 100| 121 100| 87 100| 25 100| 242 100 | 6008 100
|
|
|
|
|
|
|
|
|
|
|
Percent reported | 100.0| 100.0| 100.0| 100.0| 100.0 | 100.0| 100.0| 100.0| 100.0| 100.0 | 100.0
|
|
|
|
|
|
|
|
|
|
|
|
|
|
|
|
|
|
|
|
|
|
Not reported
|0|0|0|0|0
|0|0|0|0|0
|0
------------------------------------------------------------------------------------------------------------------------------------
Total
| 177 | 3005 | 2143 | 441 | 5766
| 9 | 121 | 87 | 25 | 242
| 6008
Page 31 Run 07/26/01
Georgia Department of Corrections Office of Planning and Analysis
Inmate statistical profile
Sample: ACTIVE PRISONERS SERVING LIFE EXCLUDING JAIL
Requestor: Statistics
Active inmates 07/26/2001
Home County by current age & sex
|
MEN
|
WOMEN
|
| Age | Age | Age | Age | Men
| Age | Age | Age | Age |Women
|Grand
Home County
|00-21 %|22-39 %|40-54 %|55-99 %|Total % |00-21 %|22-39 %|40-54 %|55-99 %|Total % |Total %
------------------------------------------------------------------------------------------------------------------------------------
Appling
| 0 0| 4 0| 5 0| 1 0| 10 0 | 0 0| 0 0| 0 0| 0 0| 0 0 | 10 0
Atkinson
| 0 0| 1 0| 1 0| 3 1| 5 0 | 0 0| 0 0| 0 0| 0 0| 0 0 | 5 0
Bacon
| 0 0| 5 0| 5 0| 1 0| 11 0 | 0 0| 0 0| 0 0| 0 0| 0 0 | 11 0
Baker
| 0 0| 1 0| 2 0| 0 0| 3 0 | 0 0| 0 0| 0 0| 0 0| 0 0 | 3 0
Baldwin
| 0 0| 15 1| 8 0| 0 0| 23 0 | 0 0| 1 1| 0 0| 1 4| 2 1 | 25 0
Banks
| 0 0| 2 0| 4 0| 1 0| 7 0 | 0 0| 1 1| 0 0| 0 0| 1 0 | 8 0
Barrow
| 0 0| 6 0| 8 0| 2 1| 16 0 | 0 0| 0 0| 1 1| 0 0| 1 0 | 17 0
Bartow
| 1 1| 18 1| 16 1| 5 1| 40 1 | 1 13| 3 3| 0 0| 0 0| 4 2 | 44 1
Ben Hill
| 0 0| 4 0| 7 0| 3 1| 14 0 | 0 0| 0 0| 1 1| 0 0| 1 0 | 15 0
Berrien
| 0 0| 4 0| 1 0| 1 0| 6 0 | 0 0| 0 0| 0 0| 0 0| 0 0 | 6 0
Bibb
| 4 2| 82 3| 78 4| 20 5| 184 4 | 1 13| 4 4| 3 4| 0 0| 8 4 | 192 4
Bleckley
| 0 0| 8 0| 4 0| 1 0| 13 0 | 0 0| 0 0| 1 1| 0 0| 1 0 | 14 0
Brantley
| 0 0| 2 0| 2 0| 0 0| 4 0 | 0 0| 0 0| 0 0| 0 0| 0 0 | 4 0
Brooks
| 0 0| 7 0| 2 0| 1 0| 10 0 | 0 0| 0 0| 0 0| 0 0| 0 0 | 10 0
Bryan
| 1 1| 7 0| 4 0| 1 0| 13 0 | 0 0| 0 0| 0 0| 0 0| 0 0 | 13 0
Bulloch
| 1 1| 11 0| 10 1| 0 0| 22 0 | 0 0| 0 0| 1 1| 1 4| 2 1 | 24 0
Burke
| 1 1| 9 0| 7 0| 3 1| 20 0 | 0 0| 0 0| 0 0| 0 0| 0 0 | 20 0
Butts
| 0 0| 22 1| 7 0| 2 1| 31 1 | 0 0| 0 0| 0 0| 0 0| 0 0 | 31 1
Calhoun
| 0 0| 4 0| 3 0| 1 0| 8 0 | 0 0| 0 0| 0 0| 0 0| 0 0 | 8 0
Camden
| 1 1| 17 1| 6 0| 0 0| 24 0 | 0 0| 0 0| 1 1| 0 0| 1 0 | 25 0
Candler
| 0 0| 2 0| 1 0| 0 0| 3 0 | 0 0| 0 0| 0 0| 0 0| 0 0 | 3 0
Carroll
| 0 0| 22 1| 10 1| 8 2| 40 1 | 0 0| 2 2| 1 1| 0 0| 3 1 | 43 1
Catoosa
| 0 0| 2 0| 6 0| 1 0| 9 0 | 0 0| 0 0| 0 0| 0 0| 0 0 | 9 0
Charlton
| 0 0| 0 0| 1 0| 0 0| 1 0 | 0 0| 1 1| 0 0| 0 0| 1 0 | 2 0
Chatham
| 9 5| 153 6| 102 5| 15 4| 279 5 | 0 0| 2 2| 1 1| 1 4| 4 2 | 283 5
Chattahoochee
| 0 0| 1 0| 1 0| 0 0| 2 0 | 0 0| 0 0| 0 0| 0 0| 0 0 | 2 0
Chatooga
| 0 0| 3 0| 5 0| 1 0| 9 0 | 0 0| 0 0| 1 1| 1 4| 2 1 | 11 0
Cherokee
| 0 0| 8 0| 17 1| 1 0| 26 0 | 0 0| 2 2| 0 0| 0 0| 2 1 | 28 1
Clarke
| 3 2| 43 2| 20 1| 3 1| 69 1 | 0 0| 2 2| 0 0| 2 8| 4 2 | 73 1
Clay
| 0 0| 1 0| 1 0| 0 0| 2 0 | 0 0| 0 0| 0 0| 0 0| 0 0 | 2 0
Clayton
| 6 4| 62 2| 46 2| 8 2| 122 2 | 1 13| 3 3| 1 1| 1 4| 6 3 | 128 2
Clinch
| 0 0| 1 0| 1 0| 0 0| 2 0 | 0 0| 0 0| 0 0| 0 0| 0 0 | 2 0
Cobb
| 7 4| 89 3| 72 4| 8 2| 176 3 | 0 0| 5 4| 1 1| 0 0| 6 3 | 182 3
Coffee
| 0 0| 11 0| 3 0| 3 1| 17 0 | 0 0| 1 1| 2 3| 1 4| 4 2 | 21 0
Colquit
| 5 3| 26 1| 18 1| 3 1| 52 1 | 0 0| 0 0| 1 1| 0 0| 1 0 | 53 1
Columbia
| 0 0| 9 0| 8 0| 0 0| 17 0 | 0 0| 0 0| 2 3| 0 0| 2 1 | 19 0
------------------------------------------------------------------------------------------------------------------------------------
(continued)
Page 32 Run 07/26/01
Georgia Department of Corrections Office of Planning and Analysis
Inmate statistical profile
Sample: ACTIVE PRISONERS SERVING LIFE EXCLUDING JAIL
Requestor:
Active inmates 07/26/2001
Home County by current age & sex
Statistics (continued)
|
MEN
|
WOMEN
|
| Age | Age | Age | Age | Men
| Age | Age | Age | Age |Women
|Grand
Home County
|00-21 %|22-39 %|40-54 %|55-99 %|Total % |00-21 %|22-39 %|40-54 %|55-99 %|Total % |Total %
------------------------------------------------------------------------------------------------------------------------------------
Cook
| 0 0| 6 0| 3 0| 1 0| 10 0 | 0 0| 1 1| 0 0| 0 0| 1 0 | 11 0
Coweta
| 3 2| 19 1| 10 1| 1 0| 33 1 | 0 0| 2 2| 1 1| 0 0| 3 1 | 36 1
Crawford
| 0 0| 1 0| 1 0| 0 0| 2 0 | 0 0| 0 0| 0 0| 0 0| 0 0 | 2 0
Crisp
| 4 2| 13 0| 7 0| 2 1| 26 0 | 0 0| 3 3| 0 0| 0 0| 3 1 | 29 1
Dade
| 1 1| 3 0| 2 0| 3 1| 9 0 | 0 0| 0 0| 0 0| 0 0| 0 0 | 9 0
Dawson
| 0 0| 2 0| 1 0| 0 0| 3 0 | 0 0| 0 0| 0 0| 0 0| 0 0 | 3 0
Decatur
| 3 2| 13 0| 5 0| 0 0| 21 0 | 0 0| 0 0| 0 0| 0 0| 0 0 | 21 0
DeKalb
| 14 9| 220 8| 130 7| 26 7| 390 7 | 1 13| 4 4| 2 3| 2 8| 9 4 | 399 7
Dodge
| 0 0| 7 0| 6 0| 0 0| 13 0 | 0 0| 0 0| 0 0| 0 0| 0 0 | 13 0
Dooly
| 2 1| 7 0| 4 0| 0 0| 13 0 | 0 0| 0 0| 0 0| 0 0| 0 0 | 13 0
Dougherty
| 4 2| 69 3| 43 2| 2 1| 118 2 | 0 0| 5 4| 1 1| 1 4| 7 3 | 125 2
Douglas
| 1 1| 20 1| 12 1| 3 1| 36 1 | 0 0| 1 1| 1 1| 0 0| 2 1 | 38 1
Early
| 0 0| 7 0| 5 0| 1 0| 13 0 | 0 0| 0 0| 0 0| 0 0| 0 0 | 13 0
Effingham
| 0 0| 5 0| 3 0| 0 0| 8 0 | 0 0| 0 0| 0 0| 0 0| 0 0 | 8 0
Elbert
| 0 0| 10 0| 10 1| 1 0| 21 0 | 0 0| 1 1| 0 0| 0 0| 1 0 | 22 0
Emanuel
| 0 0| 9 0| 6 0| 2 1| 17 0 | 0 0| 0 0| 1 1| 0 0| 1 0 | 18 0
Evans
| 0 0| 8 0| 3 0| 1 0| 12 0 | 0 0| 0 0| 0 0| 0 0| 0 0 | 12 0
Fannin
| 0 0| 5 0| 3 0| 1 0| 9 0 | 0 0| 0 0| 0 0| 0 0| 0 0 | 9 0
Fayette
| 0 0| 3 0| 3 0| 0 0| 6 0 | 0 0| 0 0| 0 0| 0 0| 0 0 | 6 0
Floyd
| 1 1| 28 1| 25 1| 3 1| 57 1 | 1 13| 3 3| 2 3| 1 4| 7 3 | 64 1
Forsyth
| 0 0| 6 0| 4 0| 2 1| 12 0 | 0 0| 0 0| 1 1| 0 0| 1 0 | 13 0
Franklin
| 0 0| 2 0| 5 0| 0 0| 7 0 | 0 0| 0 0| 0 0| 1 4| 1 0 | 8 0
Fulton
| 29 18| 508 19| 359 19| 61 16| 957 18 | 0 0| 17 15| 9 12| 3 13| 29 13 | 986 18
Gilmer
| 0 0| 1 0| 3 0| 2 1| 6 0 | 0 0| 0 0| 0 0| 0 0| 0 0 | 6 0
Glascock
| 0 0| 0 0| 1 0| 0 0| 1 0 | 0 0| 0 0| 0 0| 0 0| 0 0 | 1 0
Glynn
| 4 2| 29 1| 27 1| 4 1| 64 1 | 0 0| 1 1| 1 1| 0 0| 2 1 | 66 1
Gordon
| 0 0| 20 1| 11 1| 2 1| 33 1 | 0 0| 0 0| 1 1| 0 0| 1 0 | 34 1
Grady
| 3 2| 14 1| 8 0| 0 0| 25 0 | 0 0| 0 0| 0 0| 0 0| 0 0 | 25 0
Greene
| 0 0| 4 0| 3 0| 1 0| 8 0 | 0 0| 0 0| 1 1| 0 0| 1 0 | 9 0
Gwinnett
| 1 1| 64 2| 42 2| 12 3| 119 2 | 0 0| 3 3| 2 3| 0 0| 5 2 | 124 2
Habersham
| 0 0| 7 0| 9 0| 0 0| 16 0 | 0 0| 0 0| 0 0| 0 0| 0 0 | 16 0
Hall
| 2 1| 26 1| 39 2| 10 3| 77 1 | 1 13| 1 1| 2 3| 1 4| 5 2 | 82 2
Hancock
| 1 1| 2 0| 2 0| 1 0| 6 0 | 0 0| 0 0| 1 1| 0 0| 1 0 | 7 0
Haralson
| 0 0| 1 0| 1 0| 1 0| 3 0 | 0 0| 1 1| 0 0| 0 0| 1 0 | 4 0
Harris
| 1 1| 6 0| 2 0| 0 0| 9 0 | 0 0| 0 0| 0 0| 0 0| 0 0 | 9 0
------------------------------------------------------------------------------------------------------------------------------------
(continued)
Page 33 Run 07/26/01
Georgia Department of Corrections Office of Planning and Analysis
Inmate statistical profile
Sample: ACTIVE PRISONERS SERVING LIFE EXCLUDING JAIL
Requestor:
Active inmates 07/26/2001
Home County by current age & sex
Statistics (continued)
|
MEN
|
WOMEN
|
| Age | Age | Age | Age | Men
| Age | Age | Age | Age |Women
|Grand
Home County
|00-21 %|22-39 %|40-54 %|55-99 %|Total % |00-21 %|22-39 %|40-54 %|55-99 %|Total % |Total %
------------------------------------------------------------------------------------------------------------------------------------
Hart
| 0 0| 1 0| 3 0| 0 0| 4 0 | 0 0| 0 0| 1 1| 0 0| 1 0 | 5 0
Heard
| 0 0| 1 0| 1 0| 2 1| 4 0 | 0 0| 0 0| 0 0| 0 0| 0 0 | 4 0
Henry
| 2 1| 20 1| 10 1| 5 1| 37 1 | 0 0| 1 1| 2 3| 0 0| 3 1 | 40 1
Houston
| 1 1| 39 1| 23 1| 5 1| 68 1 | 0 0| 2 2| 4 5| 0 0| 6 3 | 74 1
Irwin
| 0 0| 5 0| 4 0| 0 0| 9 0 | 0 0| 0 0| 0 0| 0 0| 0 0 | 9 0
Jackson
| 1 1| 9 0| 9 0| 7 2| 26 0 | 0 0| 0 0| 0 0| 0 0| 0 0 | 26 0
Jasper
| 0 0| 8 0| 3 0| 1 0| 12 0 | 0 0| 0 0| 0 0| 0 0| 0 0 | 12 0
Jeff Davis
| 1 1| 5 0| 2 0| 1 0| 9 0 | 0 0| 0 0| 0 0| 0 0| 0 0 | 9 0
Jefferson
| 0 0| 4 0| 3 0| 2 1| 9 0 | 0 0| 1 1| 0 0| 0 0| 1 0 | 10 0
Jenkins
| 0 0| 0 0| 6 0| 0 0| 6 0 | 0 0| 0 0| 0 0| 0 0| 0 0 | 6 0
Johnson
| 0 0| 3 0| 2 0| 0 0| 5 0 | 0 0| 0 0| 0 0| 0 0| 0 0 | 5 0
Jones
| 0 0| 0 0| 5 0| 1 0| 6 0 | 0 0| 1 1| 0 0| 0 0| 1 0 | 7 0
Lamar
| 0 0| 8 0| 8 0| 3 1| 19 0 | 0 0| 0 0| 1 1| 0 0| 1 0 | 20 0
Laurens
| 1 1| 14 1| 8 0| 2 1| 25 0 | 0 0| 1 1| 1 1| 0 0| 2 1 | 27 0
Lee
| 0 0| 3 0| 0 0| 0 0| 3 0 | 0 0| 0 0| 0 0| 0 0| 0 0 | 3 0
Liberty
| 0 0| 21 1| 9 0| 4 1| 34 1 | 0 0| 1 1| 0 0| 0 0| 1 0 | 35 1
Lincoln
| 0 0| 2 0| 3 0| 0 0| 5 0 | 0 0| 0 0| 0 0| 0 0| 0 0 | 5 0
Long
| 0 0| 4 0| 3 0| 1 0| 8 0 | 0 0| 1 1| 0 0| 0 0| 1 0 | 9 0
Lowndes
| 0 0| 35 1| 23 1| 3 1| 61 1 | 0 0| 0 0| 2 3| 1 4| 3 1 | 64 1
Lumpkins
| 2 1| 5 0| 4 0| 1 0| 12 0 | 0 0| 0 0| 0 0| 0 0| 0 0 | 12 0
Macon
| 0 0| 12 0| 5 0| 0 0| 17 0 | 0 0| 0 0| 1 1| 0 0| 1 0 | 18 0
Madison
| 0 0| 7 0| 6 0| 1 0| 14 0 | 0 0| 2 2| 0 0| 0 0| 2 1 | 16 0
Marion
| 0 0| 2 0| 1 0| 0 0| 3 0 | 0 0| 0 0| 0 0| 0 0| 0 0 | 3 0
McDuffie
| 0 0| 21 1| 12 1| 3 1| 36 1 | 1 13| 0 0| 0 0| 0 0| 1 0 | 37 1
McIntosh
| 1 1| 5 0| 3 0| 0 0| 9 0 | 0 0| 0 0| 0 0| 0 0| 0 0 | 9 0
Meriwether
| 1 1| 8 0| 7 0| 3 1| 19 0 | 0 0| 1 1| 0 0| 1 4| 2 1 | 21 0
Miller
| 0 0| 2 0| 3 0| 0 0| 5 0 | 0 0| 0 0| 0 0| 0 0| 0 0 | 5 0
Mitchell
| 0 0| 13 0| 10 1| 3 1| 26 0 | 0 0| 1 1| 0 0| 0 0| 1 0 | 27 0
Monroe
| 0 0| 10 0| 4 0| 0 0| 14 0 | 0 0| 0 0| 0 0| 0 0| 0 0 | 14 0
Montgomery
| 0 0| 0 0| 0 0| 0 0| 0 0 | 0 0| 1 1| 0 0| 0 0| 1 0 | 1 0
Morgan
| 0 0| 7 0| 3 0| 1 0| 11 0 | 0 0| 0 0| 0 0| 0 0| 0 0 | 11 0
Murray
| 1 1| 6 0| 4 0| 4 1| 15 0 | 0 0| 1 1| 0 0| 0 0| 1 0 | 16 0
Muscogee
| 2 1| 78 3| 57 3| 10 3| 147 3 | 0 0| 3 3| 3 4| 0 0| 6 3 | 153 3
Newton
| 1 1| 34 1| 11 1| 3 1| 49 1 | 0 0| 2 2| 0 0| 1 4| 3 1 | 52 1
Oconee
| 0 0| 3 0| 2 0| 0 0| 5 0 | 0 0| 0 0| 1 1| 0 0| 1 0 | 6 0
------------------------------------------------------------------------------------------------------------------------------------
(continued)
Page 34 Run 07/26/01
Georgia Department of Corrections Office of Planning and Analysis
Inmate statistical profile
Sample: ACTIVE PRISONERS SERVING LIFE EXCLUDING JAIL
Requestor:
Active inmates 07/26/2001
Home County by current age & sex
Statistics (continued)
|
MEN
|
WOMEN
|
| Age | Age | Age | Age | Men
| Age | Age | Age | Age |Women
|Grand
Home County
|00-21 %|22-39 %|40-54 %|55-99 %|Total % |00-21 %|22-39 %|40-54 %|55-99 %|Total % |Total %
------------------------------------------------------------------------------------------------------------------------------------
Oglethrope
| 0 0| 3 0| 1 0| 1 0| 5 0 | 0 0| 0 0| 0 0| 0 0| 0 0 | 5 0
Paulding
| 0 0| 6 0| 5 0| 2 1| 13 0 | 0 0| 0 0| 1 1| 1 4| 2 1 | 15 0
Peach
| 0 0| 7 0| 3 0| 0 0| 10 0 | 0 0| 1 1| 0 0| 0 0| 1 0 | 11 0
Pickens
| 0 0| 1 0| 2 0| 0 0| 3 0 | 0 0| 0 0| 1 1| 0 0| 1 0 | 4 0
Pierce
| 2 1| 2 0| 2 0| 0 0| 6 0 | 0 0| 0 0| 0 0| 0 0| 0 0 | 6 0
Pike
| 0 0| 1 0| 0 0| 0 0| 1 0 | 0 0| 0 0| 0 0| 0 0| 0 0 | 1 0
Polk
| 1 1| 15 1| 4 0| 4 1| 24 0 | 0 0| 0 0| 0 0| 0 0| 0 0 | 24 0
Pulaski
| 0 0| 4 0| 3 0| 0 0| 7 0 | 0 0| 1 1| 0 0| 0 0| 1 0 | 8 0
Putnam
| 0 0| 13 0| 13 1| 2 1| 28 1 | 0 0| 0 0| 0 0| 0 0| 0 0 | 28 1
Quitman
| 0 0| 2 0| 0 0| 0 0| 2 0 | 0 0| 0 0| 0 0| 0 0| 0 0 | 2 0
Rabun
| 0 0| 5 0| 3 0| 0 0| 8 0 | 0 0| 0 0| 0 0| 0 0| 0 0 | 8 0
Randolph
| 0 0| 3 0| 2 0| 1 0| 6 0 | 0 0| 0 0| 0 0| 0 0| 0 0 | 6 0
Richmond
| 10 6| 143 5| 71 4| 9 2| 233 4 | 0 0| 8 7| 7 9| 1 4| 16 7 | 249 5
Rockdale
| 1 1| 9 0| 8 0| 4 1| 22 0 | 0 0| 1 1| 0 0| 0 0| 1 0 | 23 0
Schely
| 0 0| 2 0| 2 0| 0 0| 4 0 | 0 0| 0 0| 0 0| 0 0| 0 0 | 4 0
Screven
| 0 0| 3 0| 2 0| 2 1| 7 0 | 0 0| 0 0| 0 0| 0 0| 0 0 | 7 0
Seminole
| 0 0| 6 0| 5 0| 1 0| 12 0 | 0 0| 1 1| 0 0| 0 0| 1 0 | 13 0
Spalding
| 4 2| 37 1| 23 1| 5 1| 69 1 | 1 13| 2 2| 1 1| 1 4| 5 2 | 74 1
Stephens
| 0 0| 5 0| 5 0| 4 1| 14 0 | 0 0| 0 0| 0 0| 0 0| 0 0 | 14 0
Stewart
| 0 0| 2 0| 2 0| 0 0| 4 0 | 0 0| 0 0| 0 0| 0 0| 0 0 | 4 0
Sumter
| 0 0| 3 0| 16 1| 2 1| 21 0 | 0 0| 0 0| 1 1| 0 0| 1 0 | 22 0
Talbot
| 2 1| 3 0| 1 0| 0 0| 6 0 | 0 0| 0 0| 1 1| 0 0| 1 0 | 7 0
Taliaferro
| 0 0| 0 0| 1 0| 0 0| 1 0 | 0 0| 0 0| 0 0| 0 0| 0 0 | 1 0
Tattnall
| 0 0| 16 1| 4 0| 0 0| 20 0 | 0 0| 0 0| 1 1| 0 0| 1 0 | 21 0
Taylor
| 1 1| 10 0| 4 0| 1 0| 16 0 | 0 0| 0 0| 0 0| 0 0| 0 0 | 16 0
Telfair
| 1 1| 6 0| 3 0| 0 0| 10 0 | 0 0| 0 0| 1 1| 0 0| 1 0 | 11 0
Terrell
| 2 1| 11 0| 1 0| 0 0| 14 0 | 0 0| 0 0| 0 0| 0 0| 0 0 | 14 0
Thomas
| 1 1| 14 1| 16 1| 4 1| 35 1 | 0 0| 1 1| 1 1| 0 0| 2 1 | 37 1
Tift
| 3 2| 27 1| 21 1| 3 1| 54 1 | 0 0| 0 0| 0 0| 1 4| 1 0 | 55 1
Toombs
| 2 1| 11 0| 12 1| 0 0| 25 0 | 0 0| 1 1| 0 0| 0 0| 1 0 | 26 0
Treutlen
| 0 0| 2 0| 3 0| 0 0| 5 0 | 0 0| 0 0| 0 0| 0 0| 0 0 | 5 0
Troup
| 2 1| 20 1| 20 1| 4 1| 46 1 | 0 0| 1 1| 1 1| 0 0| 2 1 | 48 1
Turner
| 0 0| 8 0| 5 0| 0 0| 13 0 | 0 0| 0 0| 0 0| 0 0| 0 0 | 13 0
Twiggs
| 0 0| 6 0| 4 0| 0 0| 10 0 | 0 0| 0 0| 0 0| 0 0| 0 0 | 10 0
Upson
| 1 1| 7 0| 4 0| 0 0| 12 0 | 0 0| 0 0| 1 1| 0 0| 1 0 | 13 0
------------------------------------------------------------------------------------------------------------------------------------
(continued)
Page 35 Run 07/26/01
Georgia Department of Corrections Office of Planning and Analysis
Inmate statistical profile
Sample: ACTIVE PRISONERS SERVING LIFE EXCLUDING JAIL
Requestor:
Active inmates 07/26/2001
Home County by current age & sex
Statistics (continued)
|
MEN
|
WOMEN
|
| Age | Age | Age | Age | Men
| Age | Age | Age | Age |Women
|Grand
Home County
|00-21 %|22-39 %|40-54 %|55-99 %|Total % |00-21 %|22-39 %|40-54 %|55-99 %|Total % |Total %
------------------------------------------------------------------------------------------------------------------------------------
Walker
| 1 1| 14 1| 7 0| 3 1| 25 0 | 0 0| 1 1| 1 1| 0 0| 2 1 | 27 0
Walton
| 1 1| 25 1| 18 1| 4 1| 48 1 | 0 0| 0 0| 0 0| 0 0| 0 0 | 48 1
Ware
| 1 1| 13 0| 14 1| 4 1| 32 1 | 0 0| 0 0| 0 0| 0 0| 0 0 | 32 1
Warren
| 0 0| 3 0| 5 0| 1 0| 9 0 | 0 0| 0 0| 0 0| 0 0| 0 0 | 9 0
Washington
| 0 0| 12 0| 8 0| 1 0| 21 0 | 0 0| 2 2| 0 0| 0 0| 2 1 | 23 0
Wayne
| 0 0| 6 0| 12 1| 3 1| 21 0 | 0 0| 1 1| 0 0| 0 0| 1 0 | 22 0
Webster
| 0 0| 3 0| 0 0| 0 0| 3 0 | 0 0| 0 0| 0 0| 0 0| 0 0 | 3 0
Wheeler
| 0 0| 1 0| 2 0| 2 1| 5 0 | 0 0| 0 0| 0 0| 0 0| 0 0 | 5 0
White
| 0 0| 3 0| 2 0| 2 1| 7 0 | 0 0| 0 0| 0 0| 0 0| 0 0 | 7 0
Whitfield
| 1 1| 11 0| 23 1| 7 2| 42 1 | 0 0| 2 2| 0 0| 0 0| 2 1 | 44 1
Wilcox
| 0 0| 0 0| 5 0| 1 0| 6 0 | 0 0| 0 0| 0 0| 0 0| 0 0 | 6 0
Wilkes
| 0 0| 2 0| 4 0| 2 1| 8 0 | 0 0| 0 0| 0 0| 0 0| 0 0 | 8 0
Wilkinson
| 0 0| 6 0| 3 0| 0 0| 9 0 | 0 0| 0 0| 0 0| 0 0| 0 0 | 9 0
Worth
| 0 0| 12 0| 4 0| 1 0| 17 0 | 0 0| 1 1| 0 0| 0 0| 1 0 | 18 0
------------------------------------------------------------------------------------------------------------------------------------
Total reported
| 164 100| 2726 100| 1925 100| 386 100| 5201 100 | 8 100| 113 100| 78 100| 24 100| 223 100 | 5424 100
|
|
|
|
|
|
|
|
|
|
|
Percent reported |
92.7|
90.7|
89.8|
87.5|
90.2 |
88.9|
93.4|
89.7|
96.0|
92.1 |
90.3
|
|
|
|
|
|
|
|
|
|
|
|
|
|
|
|
|
|
|
|
|
|
Not reported
| 13 | 279 | 218 | 55 | 565
| 1 | 8 | 9 | 1 | 19
| 584
------------------------------------------------------------------------------------------------------------------------------------
Total
| 177 | 3005 | 2143 | 441 | 5766
| 9 | 121 | 87 | 25 | 242
| 6008
Georgia Department of Corrections
Page 36 Run 07/26/01
Office of Planning and Analysis
Inmate statistical profile
Sample: ACTIVE PRISONERS SERVING LIFE EXCLUDING JAIL
Requestor: Statistics
Active inmates 07/26/2001
Prison Sentence In Years by current age & sex
|
MEN
|
WOMEN
|
| Age | Age | Age | Age | Men
| Age | Age | Age | Age |Women
|Grand
Sentence In Years |00-21 %|22-39 %|40-54 %|55-99 %|Total % |00-21 %|22-39 %|40-54 %|55-99 %|Total % |Total %
------------------------------------------------------------------------------------------------------------------------------------
0-1
| 0 0| 0 0| 0 0| 0 0| 0 0 | 0 0| 0 0| 0 0| 0 0| 0 0 | 0 0
1.1-2
| 0 0| 0 0| 0 0| 0 0| 0 0 | 0 0| 0 0| 0 0| 0 0| 0 0 | 0 0
2.1-3
| 0 0| 0 0| 0 0| 0 0| 0 0 | 0 0| 0 0| 0 0| 0 0| 0 0 | 0 0
3.1-4
| 0 0| 0 0| 0 0| 0 0| 0 0 | 0 0| 0 0| 0 0| 0 0| 0 0 | 0 0
4.1-5
| 0 0| 0 0| 0 0| 0 0| 0 0 | 0 0| 0 0| 0 0| 0 0| 0 0 | 0 0
5.1-6
| 0 0| 0 0| 0 0| 0 0| 0 0 | 0 0| 0 0| 0 0| 0 0| 0 0 | 0 0
6.1-7
| 0 0| 0 0| 0 0| 0 0| 0 0 | 0 0| 0 0| 0 0| 0 0| 0 0 | 0 0
7.1-8
| 0 0| 0 0| 0 0| 0 0| 0 0 | 0 0| 0 0| 0 0| 0 0| 0 0 | 0 0
8.1-9
| 0 0| 0 0| 0 0| 0 0| 0 0 | 0 0| 0 0| 0 0| 0 0| 0 0 | 0 0
9.1-10
| 0 0| 0 0| 0 0| 0 0| 0 0 | 0 0| 0 0| 0 0| 0 0| 0 0 | 0 0
10.1-12
| 0 0| 0 0| 0 0| 0 0| 0 0 | 0 0| 0 0| 0 0| 0 0| 0 0 | 0 0
12.1-15
| 0 0| 0 0| 0 0| 0 0| 0 0 | 0 0| 0 0| 0 0| 0 0| 0 0 | 0 0
15.1-20
| 0 0| 0 0| 0 0| 0 0| 0 0 | 0 0| 0 0| 0 0| 0 0| 0 0 | 0 0
20.1-OVER
| 0 0| 0 0| 0 0| 0 0| 0 0 | 0 0| 0 0| 0 0| 0 0| 0 0 | 0 0
LIFE
| 177 100| 3005 100| 2143 100| 441 100| 5766 100 | 9 100| 121 100| 87 100| 25 100| 242 100 | 6008 100
DEATH
| 0 0| 0 0| 0 0| 0 0| 0 0 | 0 0| 0 0| 0 0| 0 0| 0 0 | 0 0
LIFE W/O PAROLE
| 0 0| 0 0| 0 0| 0 0| 0 0 | 0 0| 0 0| 0 0| 0 0| 0 0 | 0 0
YOUTHFUL OFFENDERS | 0 0| 0 0| 0 0| 0 0| 0 0 | 0 0| 0 0| 0 0| 0 0| 0 0 | 0 0
------------------------------------------------------------------------------------------------------------------------------------
Total reported
| 177 100| 3005 100| 2143 100| 441 100| 5766 100 | 9 100| 121 100| 87 100| 25 100| 242 100 | 6008 100
|
|
|
|
|
|
|
|
|
|
|
Percent reported | 100.0| 100.0| 100.0| 100.0| 100.0 | 100.0| 100.0| 100.0| 100.0| 100.0 | 100.0
|
|
|
|
|
|
|
|
|
|
|
|
|
|
|
|
|
|
|
|
|
|
NOT REPORTED
|0|0|0|0|0
|0|0|0|0|0
|0
------------------------------------------------------------------------------------------------------------------------------------
Total
| 177 | 3005 | 2143 | 441 | 5766
| 9 | 121 | 87 | 25 | 242
| 6008
|
|
|
|
|
|
|
|
|
|
|
|
|
|
|
|
|
|
|
|
|
|
|
|
|
|
|
|
|
|
|
|
|
|
|
|
|
|
|
|
|
|
|
|
|
|
|
|
|
|
|
|
|
|
|
AVG EXCLUDING
|
|
|
|
|
|
|
|
|
|
|
LIFE, DEATH, YO
| .00 | .00 | .00 | .00 | .00 | .00 | .00 | .00 | .00 | .00 | .00
|
|
|
|
|
|
|
|
|
|
|
|
|
|
|
|
|
|
|
|
|
|
|
|
|
|
|
|
|
|
|
|
|
|
|
|
|
|
|
|
|
|
|
|
|
|
|
|
|
|
|
|
|
|
|
AVG INCLUDING
|
|
|
|
|
|
|
|
|
|
|
LIFE=21, YO=3 YRS | 21.00 | 21.00 | 21.00 | 21.00 | 21.00 | 21.00 | 21.00 | 21.00 | 21.00 | 21.00 | 21.00
Page 37 Run 07/26/01
Georgia Department of Corrections Office of Planning and Analysis
Inmate statistical profile
Sample: ACTIVE PRISONERS SERVING LIFE EXCLUDING JAIL
Requestor: Statistics
Active inmates 07/26/2001
Probation To Follow Prison by current age & sex
|
MEN
|
WOMEN
|
| Age | Age | Age | Age | Men
| Age | Age | Age | Age |Women
|Grand
Prob After Prison |00-21 %|22-39 %|40-54 %|55-99 %|Total % |00-21 %|22-39 %|40-54 %|55-99 %|Total % |Total %
------------------------------------------------------------------------------------------------------------------------------------
PROBATION TO FOLLOW | 7 4| 95 3| 63 3| 6 1| 171 3 | 0 0| 3 2| 3 3| 1 4| 7 3 | 178 3
NO PROBATION
| 170 96| 2910 97| 2080 97| 435 99| 5595 97 | 9 100| 118 98| 84 97| 24 96| 235 97 | 5830 97
------------------------------------------------------------------------------------------------------------------------------------
Total reported
| 177 100| 3005 100| 2143 100| 441 100| 5766 100 | 9 100| 121 100| 87 100| 25 100| 242 100 | 6008 100
|
|
|
|
|
|
|
|
|
|
|
Percent reported | 100.0| 100.0| 100.0| 100.0| 100.0 | 100.0| 100.0| 100.0| 100.0| 100.0 | 100.0
|
|
|
|
|
|
|
|
|
|
|
|
|
|
|
|
|
|
|
|
|
|
NOT REPORTED
|0|0|0|0|0
|0|0|0|0|0
|0
------------------------------------------------------------------------------------------------------------------------------------
Total
| 177 | 3005 | 2143 | 441 | 5766
| 9 | 121 | 87 | 25 | 242
| 6008
Page 38 Run 07/26/01
Georgia Department of Corrections Office of Planning and Analysis
Inmate statistical profile
Sample: ACTIVE PRISONERS SERVING LIFE EXCLUDING JAIL
Requestor: Statistics
Active inmates 07/26/2001
Admission Type by current age & sex
|
MEN
|
WOMEN
|
| Age | Age | Age | Age | Men
| Age | Age | Age | Age |Women
|Grand
Admission Type
|00-21 %|22-39 %|40-54 %|55-99 %|Total % |00-21 %|22-39 %|40-54 %|55-99 %|Total % |Total %
------------------------------------------------------------------------------------------------------------------------------------
COMMITTED FROM COURT| 173 98| 2470 82| 1589 74| 316 72| 4548 79 | 9 100| 114 94| 76 87| 25 100| 224 93 | 4772 79
RETURN APPEAL/BOND | 0 0| 1 0| 1 0| 0 0| 2 0 | 0 0| 0 0| 0 0| 0 0| 0 0 | 2 0
PAROLE REV/NEW SENT | 1 1| 337 11| 333 16| 81 18| 752 13 | 0 0| 5 4| 7 8| 0 0| 12 5 | 764 13
PAR REV/NO NEW SENT | 0 0| 19 1| 66 3| 11 2| 96 2 | 0 0| 1 1| 1 1| 0 0| 2 1 | 98 2
PROB VIOL/TOTAL REV | 0 0| 0 0| 0 0| 0 0| 0 0 | 0 0| 0 0| 0 0| 0 0| 0 0 | 0 0
PROB VIOL/PARTIAL | 0 0| 32 1| 44 2| 3 1| 79 1 | 0 0| 0 0| 1 1| 0 0| 1 0 | 80 1
ADMIT FM OTHER CUST | 0 0| 1 0| 1 0| 5 1| 7 0 | 0 0| 0 0| 0 0| 0 0| 0 0 | 7 0
SHOCK INCARCERATION | 0 0| 0 0| 0 0| 0 0| 0 0 | 0 0| 0 0| 0 0| 0 0| 0 0 | 0 0
PROB REV/REMAINDER | 2 1| 112 4| 46 2| 5 1| 165 3 | 0 0| 1 1| 2 2| 0 0| 3 1 | 168 3
NEW SENT/PAR REV PND| 0 0| 2 0| 4 0| 1 0| 7 0 | 0 0| 0 0| 0 0| 0 0| 0 0 | 7 0
LIFE W/O PAROLE
| 1 1| 9 0| 3 0| 0 0| 13 0 | 0 0| 0 0| 0 0| 0 0| 0 0 | 13 0
PAROLE REV BOOT CAMP| 0 0| 2 0| 1 0| 0 0| 3 0 | 0 0| 0 0| 0 0| 0 0| 0 0 | 3 0
PAR REV/RSN UNKNOWN | 0 0| 14 0| 41 2| 19 4| 74 1 | 0 0| 0 0| 0 0| 0 0| 0 0 | 74 1
PROBATION/PAROLE REV| 0 0| 0 0| 0 0| 0 0| 0 0 | 0 0| 0 0| 0 0| 0 0| 0 0 | 0 0
PB PAROLE RESCINDED | 0 0| 0 0| 0 0| 0 0| 0 0 | 0 0| 0 0| 0 0| 0 0| 0 0 | 0 0
PROB REVOC/SPEC COND| 0 0| 0 0| 0 0| 0 0| 0 0 | 0 0| 0 0| 0 0| 0 0| 0 0 | 0 0
PAR REV/REVOC CENTER| 0 0| 5 0| 13 1| 0 0| 18 0 | 0 0| 0 0| 0 0| 0 0| 0 0 | 18 0
INFORMATION ONLY | 0 0| 0 0| 0 0| 0 0| 0 0 | 0 0| 0 0| 0 0| 0 0| 0 0 | 0 0
INCOMPLETE SENT PKG | 0 0| 0 0| 0 0| 0 0| 0 0 | 0 0| 0 0| 0 0| 0 0| 0 0 | 0 0
HANCOCK REVOC CENTER| 0 0| 0 0| 0 0| 0 0| 0 0 | 0 0| 0 0| 0 0| 0 0| 0 0 | 0 0
WHITWORTH DETENTION | 0 0| 0 0| 1 0| 0 0| 1 0 | 0 0| 0 0| 0 0| 0 0| 0 0 | 1 0
DCYS AT RISK
| 0 0| 0 0| 0 0| 0 0| 0 0 | 0 0| 0 0| 0 0| 0 0| 0 0 | 0 0
OTHER
| 0 0| 0 0| 0 0| 0 0| 0 0 | 0 0| 0 0| 0 0| 0 0| 0 0 | 0 0
------------------------------------------------------------------------------------------------------------------------------------
Total reported
| 177 100| 3004 100| 2143 100| 441 100| 5765 100 | 9 100| 121 100| 87 100| 25 100| 242 100 | 6007 100
|
|
|
|
|
|
|
|
|
|
|
Percent reported | 100.0| 100.0| 100.0| 100.0| 100.0 | 100.0| 100.0| 100.0| 100.0| 100.0 | 100.0
|
|
|
|
|
|
|
|
|
|
|
|
|
|
|
|
|
|
|
|
|
|
UNKNOWN
|0|1|0|0|1
|0|0|0|0|0
|1
------------------------------------------------------------------------------------------------------------------------------------
Total
| 177 | 3005 | 2143 | 441 | 5766
| 9 | 121 | 87 | 25 | 242
| 6008
Page 39 Run 07/26/01
Georgia Department of Corrections Office of Planning and Analysis
Inmate statistical profile
Sample: ACTIVE PRISONERS SERVING LIFE EXCLUDING JAIL
Requestor: Statistics
Active inmates 07/26/2001
Release Type by current age & sex
|
MEN
|
WOMEN
|
| Age | Age | Age | Age | Men
| Age | Age | Age | Age |Women
|Grand
Release Type
|00-21 %|22-39 %|40-54 %|55-99 %|Total % |00-21 %|22-39 %|40-54 %|55-99 %|Total % |Total %
------------------------------------------------------------------------------------------------------------------------------------
PAROLE
| 0 0| 1 0| 0 0| 0 0| 1 0 | 0 0| 0 0| 0 0| 0 0| 0 0 | 1 0
Active
| 177 100| 3005 100| 2143 100| 441 100| 5766 100 | 9 100| 121 100| 87 100| 25 100| 242 100 | 6008 100
------------------------------------------------------------------------------------------------------------------------------------
Total
| 177 | 3005 | 2143 | 441 | 5766
| 9 | 121 | 87 | 25 | 242
| 6008
Page 40 Run 07/26/01
Georgia Department of Corrections Office of Planning and Analysis
Inmate statistical profile
Sample: ACTIVE PRISONERS SERVING LIFE EXCLUDING JAIL
Requestor: Statistics
Active inmates 07/26/2001
Inst By Group by current age & sex
|
MEN
|
WOMEN
|
| Age | Age | Age | Age | Men
| Age | Age | Age | Age |Women
|Grand
Inst By Group
|00-21 %|22-39 %|40-54 %|55-99 %|Total % |00-21 %|22-39 %|40-54 %|55-99 %|Total % |Total %
------------------------------------------------------------------------------------------------------------------------------------
County jails
| 0 0| 0 0| 0 0| 0 0| 0 0 | 0 0| 0 0| 0 0| 0 0| 0 0 | 0 0
Transitional centers| 0 0| 15 0| 15 1| 3 1| 33 1 | 0 0| 1 1| 1 1| 1 4| 3 1 | 36 1
County camps
| 0 0| 10 0| 10 0| 2 0| 22 0 | 0 0| 0 0| 0 0| 0 0| 0 0 | 22 0
Inmate boot camps | 0 0| 0 0| 0 0| 0 0| 0 0 | 0 0| 0 0| 0 0| 0 0| 0 0 | 0 0
State prisons
| 177 100| 2870 96| 2034 95| 421 95| 5502 95 | 9 100| 120 99| 86 99| 24 96| 239 99 | 5741 96
Private prisons
| 0 0| 109 4| 84 4| 14 3| 207 4 | 0 0| 0 0| 0 0| 0 0| 0 0 | 207 3
Other
| 0 0| 0 0| 0 0| 1 0| 1 0 | 0 0| 0 0| 0 0| 0 0| 0 0 | 1 0
------------------------------------------------------------------------------------------------------------------------------------
Total reported
| 177 100| 3004 100| 2143 100| 441 100| 5765 100 | 9 100| 121 100| 87 100| 25 100| 242 100 | 6007 100
|
|
|
|
|
|
|
|
|
|
|
Percent reported | 100.0| 100.0| 100.0| 100.0| 100.0 | 100.0| 100.0| 100.0| 100.0| 100.0 | 100.0
|
|
|
|
|
|
|
|
|
|
|
|
|
|
|
|
|
|
|
|
|
|
Not reported
|0|1|0|0|1
|0|0|0|0|0
|1
------------------------------------------------------------------------------------------------------------------------------------
Total
| 177 | 3005 | 2143 | 441 | 5766
| 9 | 121 | 87 | 25 | 242
| 6008
Page 41 Run 07/26/01
Georgia Department of Corrections Office of Planning and Analysis
Inmate statistical profile
Sample: ACTIVE PRISONERS SERVING LIFE EXCLUDING JAIL
Requestor: Statistics
Active inmates 07/26/2001
Institution by current age & sex
|
MEN
|
WOMEN
|
| Age | Age | Age | Age | Men
| Age | Age | Age | Age |Women
|Grand
Institution
|00-21 %|22-39 %|40-54 %|55-99 %|Total % |00-21 %|22-39 %|40-54 %|55-99 %|Total % |Total %
------------------------------------------------------------------------------------------------------------------------------------
Atlanta Trans Ctr(M)| 0 0| 10 0| 12 1| 3 1| 25 0 | 0 0| 0 0| 0 0| 0 0| 0 0 | 25 0
Macon Trans Ctr
| 0 0| 3 0| 1 0| 0 0| 4 0 | 0 0| 0 0| 0 0| 0 0| 0 0 | 4 0
Metro Trans Ctr (W) | 0 0| 0 0| 0 0| 0 0| 0 0 | 0 0| 1 1| 1 1| 1 4| 3 1 | 3 0
Savannah Trans Ctr | 0 0| 2 0| 2 0| 0 0| 4 0 | 0 0| 0 0| 0 0| 0 0| 0 0 | 4 0
Central State Hosp | 0 0| 0 0| 0 0| 1 0| 1 0 | 0 0| 0 0| 0 0| 0 0| 0 0 | 1 0
Clarke County
| 0 0| 1 0| 0 0| 0 0| 1 0 | 0 0| 0 0| 0 0| 0 0| 0 0 | 1 0
Colquitt County
| 0 0| 0 0| 1 0| 0 0| 1 0 | 0 0| 0 0| 0 0| 0 0| 0 0 | 1 0
Coweta County
| 0 0| 0 0| 1 0| 0 0| 1 0 | 0 0| 0 0| 0 0| 0 0| 0 0 | 1 0
Floyd County
| 0 0| 1 0| 1 0| 0 0| 2 0 | 0 0| 0 0| 0 0| 0 0| 0 0 | 2 0
Gwinnett County
| 0 0| 1 0| 0 0| 0 0| 1 0 | 0 0| 0 0| 0 0| 0 0| 0 0 | 1 0
Hall County
| 0 0| 2 0| 1 0| 0 0| 3 0 | 0 0| 0 0| 0 0| 0 0| 0 0 | 3 0
Jackson County
| 0 0| 1 0| 2 0| 1 0| 4 0 | 0 0| 0 0| 0 0| 0 0| 0 0 | 4 0
Jefferson County | 0 0| 1 0| 1 0| 0 0| 2 0 | 0 0| 0 0| 0 0| 0 0| 0 0 | 2 0
Mitchell County
| 0 0| 0 0| 1 0| 0 0| 1 0 | 0 0| 0 0| 0 0| 0 0| 0 0 | 1 0
Muscogee County
| 0 0| 0 0| 1 0| 0 0| 1 0 | 0 0| 0 0| 0 0| 0 0| 0 0 | 1 0
Screven County
| 0 0| 1 0| 1 0| 0 0| 2 0 | 0 0| 0 0| 0 0| 0 0| 0 0 | 2 0
Terrell County
| 0 0| 1 0| 0 0| 1 0| 2 0 | 0 0| 0 0| 0 0| 0 0| 0 0 | 2 0
Clayton County
| 0 0| 1 0| 0 0| 0 0| 1 0 | 0 0| 0 0| 0 0| 0 0| 0 0 | 1 0
Ware Prison
| 12 7| 201 7| 103 5| 11 2| 327 6 | 0 0| 0 0| 0 0| 0 0| 0 0 | 327 5
Lowndes Prison
| 0 0| 6 0| 10 0| 2 0| 18 0 | 0 0| 0 0| 0 0| 0 0| 0 0 | 18 0
Dodge Prison
| 0 0| 56 2| 73 3| 8 2| 137 2 | 0 0| 0 0| 0 0| 0 0| 0 0 | 137 2
Phillips Prison
| 4 2| 126 4| 97 5| 18 4| 245 4 | 0 0| 0 0| 0 0| 0 0| 0 0 | 245 4
Walker Prison
| 0 0| 22 1| 22 1| 6 1| 50 1 | 0 0| 0 0| 0 0| 0 0| 0 0 | 50 1
Wayne Prison
| 0 0| 2 0| 5 0| 0 0| 7 0 | 0 0| 0 0| 0 0| 0 0| 0 0 | 7 0
Arrendale Prison | 42 24| 107 4| 35 2| 2 0| 186 3 | 0 0| 0 0| 0 0| 0 0| 0 0 | 186 3
Montgomery Prison | 0 0| 15 0| 8 0| 3 1| 26 0 | 0 0| 0 0| 0 0| 0 0| 0 0 | 26 0
Lee Prison
| 1 1| 24 1| 20 1| 2 0| 47 1 | 0 0| 0 0| 0 0| 0 0| 0 0 | 47 1
Putnam Prison
| 0 0| 5 0| 0 0| 0 0| 5 0 | 0 0| 0 0| 0 0| 0 0| 0 0 | 5 0
Georgia State Prison| 4 2| 259 9| 205 10| 18 4| 486 8 | 0 0| 0 0| 0 0| 0 0| 0 0 | 486 8
Mens Prison
| 0 0| 10 0| 34 2| 73 17| 117 2 | 0 0| 0 0| 0 0| 0 0| 0 0 | 117 2
Jackson Prison-Diag | 10 6| 21 1| 11 1| 5 1| 47 1 | 0 0| 0 0| 0 0| 0 0| 0 0 | 47 1
Jackson Prison-Perm | 0 0| 3 0| 1 0| 1 0| 5 0 | 0 0| 0 0| 0 0| 0 0| 0 0 | 5 0
Coastal Prison
| 15 8| 45 1| 13 1| 3 1| 76 1 | 0 0| 0 0| 0 0| 0 0| 0 0 | 76 1
Scott Prison
| 0 0| 67 2| 56 3| 9 2| 132 2 | 0 0| 0 0| 0 0| 0 0| 0 0 | 132 2
Rivers Prison
| 0 0| 71 2| 69 3| 12 3| 152 3 | 0 0| 0 0| 0 0| 0 0| 0 0 | 152 3
Rutledge Prison
| 0 0| 32 1| 45 2| 15 3| 92 2 | 0 0| 0 0| 0 0| 0 0| 0 0 | 92 2
------------------------------------------------------------------------------------------------------------------------------------
(continued)
Page 42 Run 07/26/01
Georgia Department of Corrections Office of Planning and Analysis
Inmate statistical profile
Sample: ACTIVE PRISONERS SERVING LIFE EXCLUDING JAIL
Requestor:
Active inmates 07/26/2001
Institution by current age & sex
Statistics (CONTINUED)
|
MEN
|
WOMEN
|
| Age | Age | Age | Age | Men
| Age | Age | Age | Age |Women
|Grand
Institution
|00-21 %|22-39 %|40-54 %|55-99 %|Total % |00-21 %|22-39 %|40-54 %|55-99 %|Total % |Total %
------------------------------------------------------------------------------------------------------------------------------------
Central Prison
| 0 0| 82 3| 122 6| 17 4| 221 4 | 0 0| 0 0| 0 0| 0 0| 0 0 | 221 4
Augusta Med Prison | 2 1| 96 3| 85 4| 33 7| 216 4 | 0 0| 0 0| 0 0| 0 0| 0 0 | 216 4
Rogers Prison
| 0 0| 21 1| 20 1| 0 0| 41 1 | 0 0| 0 0| 0 0| 0 0| 0 0 | 41 1
Burruss Prison
| 0 0| 5 0| 11 1| 2 0| 18 0 | 0 0| 0 0| 0 0| 0 0| 0 0 | 18 0
Bostick Prison
| 0 0| 11 0| 30 1| 28 6| 69 1 | 0 0| 0 0| 0 0| 0 0| 0 0 | 69 1
Valdosta Prison
| 9 5| 142 5| 105 5| 18 4| 274 5 | 0 0| 0 0| 0 0| 0 0| 0 0 | 274 5
Hays Prison
| 5 3| 150 5| 110 5| 18 4| 283 5 | 0 0| 0 0| 0 0| 0 0| 0 0 | 283 5
Hancock Prison
| 7 4| 215 7| 141 7| 22 5| 385 7 | 0 0| 0 0| 0 0| 0 0| 0 0 | 385 6
Telfair Prison
| 10 6| 217 7| 95 4| 10 2| 332 6 | 0 0| 0 0| 0 0| 0 0| 0 0 | 332 6
Autry Prison
| 12 7| 131 4| 113 5| 21 5| 277 5 | 0 0| 0 0| 0 0| 0 0| 0 0 | 277 5
Wilcox Prison
| 0 0| 63 2| 65 3| 6 1| 134 2 | 0 0| 0 0| 0 0| 0 0| 0 0 | 134 2
Calhoun Prison
| 11 6| 88 3| 61 3| 7 2| 167 3 | 0 0| 0 0| 0 0| 0 0| 0 0 | 167 3
Dooly Prison
| 0 0| 50 2| 68 3| 5 1| 123 2 | 0 0| 0 0| 0 0| 0 0| 0 0 | 123 2
Macon Prison
| 16 9| 287 10| 98 5| 29 7| 430 7 | 0 0| 0 0| 0 0| 0 0| 0 0 | 430 7
Smith Prison
| 14 8| 203 7| 66 3| 14 3| 297 5 | 0 0| 0 0| 0 0| 0 0| 0 0 | 297 5
Homerville Prison | 0 0| 3 0| 6 0| 0 0| 9 0 | 0 0| 0 0| 0 0| 0 0| 0 0 | 9 0
Washingtn Women Pris| 0 0| 0 0| 0 0| 0 0| 0 0 | 3 33| 27 22| 26 30| 9 36| 65 27 | 65 1
Baldwin Prison
| 3 2| 16 1| 21 1| 3 1| 43 1 | 0 0| 0 0| 0 0| 0 0| 0 0 | 43 1
Metro Womens Prison | 0 0| 0 0| 0 0| 0 0| 0 0 | 0 0| 31 26| 30 34| 7 28| 68 28 | 68 1
Pulaski Womens Pris | 0 0| 0 0| 0 0| 0 0| 0 0 | 6 67| 62 51| 30 34| 8 32| 106 44 | 106 2
Pelham PreTrans Unit| 0 0| 15 0| 10 0| 0 0| 25 0 | 0 0| 0 0| 0 0| 0 0| 0 0 | 25 0
West Central Prison | 0 0| 3 0| 0 0| 0 0| 3 0 | 0 0| 0 0| 0 0| 0 0| 0 0 | 3 0
D Ray James Prison | 0 0| 35 1| 26 1| 3 1| 64 1 | 0 0| 0 0| 0 0| 0 0| 0 0 | 64 1
Coffee Corr Facility| 0 0| 33 1| 23 1| 6 1| 62 1 | 0 0| 0 0| 0 0| 0 0| 0 0 | 62 1
Wheeler Corr Facilty| 0 0| 41 1| 35 2| 5 1| 81 1 | 0 0| 0 0| 0 0| 0 0| 0 0 | 81 1
------------------------------------------------------------------------------------------------------------------------------------
Total reported
| 177 100| 3004 100| 2143 100| 441 100| 5765 100 | 9 100| 121 100| 87 100| 25 100| 242 100 | 6007 100
|
|
|
|
|
|
|
|
|
|
|
Percent reported | 100.0| 100.0| 100.0| 100.0| 100.0 | 100.0| 100.0| 100.0| 100.0| 100.0 | 100.0
|
|
|
|
|
|
|
|
|
|
|
|
|
|
|
|
|
|
|
|
|
|
Not Reported
|0|1|0|0|1
|0|0|0|0|0
|1
------------------------------------------------------------------------------------------------------------------------------------
Total
| 177 | 3005 | 2143 | 441 | 5766
| 9 | 121 | 87 | 25 | 242
| 6008
Page 43 Run 07/26/01
Georgia Department of Corrections Office of Planning and Analysis
Inmate statistical profile
Sample: ACTIVE PRISONERS SERVING LIFE EXCLUDING JAIL
Requestor: Statistics
Active inmates 07/26/2001
Misdemeanors And Felonies by current age & sex
|
MEN
|
WOMEN
|
| Age | Age | Age | Age | Men
| Age | Age | Age | Age |Women
|Grand
Crime Type
|00-21 %|22-39 %|40-54 %|55-99 %|Total % |00-21 %|22-39 %|40-54 %|55-99 %|Total % |Total %
------------------------------------------------------------------------------------------------------------------------------------
MISDEMEANOR
| 0 0| 0 0| 0 0| 0 0| 0 0 | 0 0| 0 0| 0 0| 0 0| 0 0 | 0 0
FELONY
| 177 100| 3005 100| 2143 100| 441 100| 5766 100 | 9 100| 121 100| 87 100| 25 100| 242 100 | 6008 100
------------------------------------------------------------------------------------------------------------------------------------
Total reported
| 177 100| 3005 100| 2143 100| 441 100| 5766 100 | 9 100| 121 100| 87 100| 25 100| 242 100 | 6008 100
|
|
|
|
|
|
|
|
|
|
|
Percent reported | 100.0| 100.0| 100.0| 100.0| 100.0 | 100.0| 100.0| 100.0| 100.0| 100.0 | 100.0
|
|
|
|
|
|
|
|
|
|
|
|
|
|
|
|
|
|
|
|
|
|
NOT REPORTED
|0|0|0|0|0
|0|0|0|0|0
|0
------------------------------------------------------------------------------------------------------------------------------------
Total
| 177 | 3005 | 2143 | 441 | 5766
| 9 | 121 | 87 | 25 | 242
| 6008
Page 44 Run 07/26/01
Georgia Department of Corrections Office of Planning and Analysis
Inmate statistical profile
Sample: ACTIVE PRISONERS SERVING LIFE EXCLUDING JAIL
Requestor: Statistics
Active inmates 07/26/2001
Crimes By Group by current age & sex
|
MEN
|
WOMEN
|
| Age | Age | Age | Age | Men
| Age | Age | Age | Age |Women
|Grand
Crimes By Group
|00-21 %|22-39 %|40-54 %|55-99 %|Total % |00-21 %|22-39 %|40-54 %|55-99 %|Total % |Total %
------------------------------------------------------------------------------------------------------------------------------------
HOMICIDE
| 130 74| 1908 64| 1254 59| 333 76| 3625 63 | 9 100| 110 91| 73 84| 25 100| 217 90 | 3842 64
ABORTION
| 0 0| 0 0| 0 0| 0 0| 0 0 | 0 0| 0 0| 0 0| 0 0| 0 0 | 0 0
BODILY INJRY&REL OFF| 16 9| 183 6| 115 5| 5 1| 319 6 | 0 0| 2 2| 5 6| 0 0| 7 3 | 326 5
ARSON & REL OFF
| 0 0| 1 0| 0 0| 0 0| 1 0 | 0 0| 0 0| 0 0| 0 0| 0 0 | 1 0
DAMAGE OF PROPERTY | 0 0| 1 0| 0 0| 0 0| 1 0 | 0 0| 0 0| 0 0| 0 0| 0 0 | 1 0
BURGLARY & REL OFF | 0 0| 15 0| 8 0| 0 0| 23 0 | 0 0| 0 0| 1 1| 0 0| 1 0 | 24 0
FORGERY & REL OFF | 0 0| 6 0| 4 0| 0 0| 10 0 | 0 0| 0 0| 0 0| 0 0| 0 0 | 10 0
THEFT
| 0 0| 6 0| 5 0| 0 0| 11 0 | 0 0| 0 0| 0 0| 0 0| 0 0 | 11 0
ROBBERY
| 18 10| 353 12| 246 11| 34 8| 651 11 | 0 0| 2 2| 1 1| 0 0| 3 1 | 654 11
SEXUAL OFFENSES
| 10 6| 313 10| 381 18| 57 13| 761 13 | 0 0| 0 0| 2 2| 0 0| 2 1 | 763 13
OBSCENITY CRIMES | 0 0| 0 0| 0 0| 0 0| 0 0 | 0 0| 0 0| 0 0| 0 0| 0 0 | 0 0
TREASON & REL OFF | 0 0| 0 0| 0 0| 0 0| 0 0 | 0 0| 0 0| 0 0| 0 0| 0 0 | 0 0
CRIMES INVOLVNG GOVT| 0 0| 5 0| 6 0| 1 0| 12 0 | 0 0| 0 0| 0 0| 0 0| 0 0 | 12 0
FALSIFICATIONS
| 0 0| 0 0| 0 0| 0 0| 0 0 | 0 0| 0 0| 0 0| 0 0| 0 0 | 0 0
OBSTRUCT LAW ENFORCE| 0 0| 0 0| 2 0| 0 0| 2 0 | 0 0| 0 0| 0 0| 0 0| 0 0 | 2 0
DISORDERLY CONDUCT | 0 0| 0 0| 0 0| 0 0| 0 0 | 0 0| 0 0| 0 0| 0 0| 0 0 | 0 0
GAMBLING & REL OFF | 0 0| 0 0| 0 0| 0 0| 0 0 | 0 0| 0 0| 0 0| 0 0| 0 0 | 0 0
CRUELTY TO CHILDREN | 0 0| 0 0| 0 0| 0 0| 0 0 | 0 0| 0 0| 0 0| 0 0| 0 0 | 0 0
CRIMES WITH GUNS | 0 0| 0 0| 1 0| 0 0| 1 0 | 0 0| 0 0| 0 0| 0 0| 0 0 | 1 0
INVASION PRIVACY | 0 0| 0 0| 0 0| 0 0| 0 0 | 0 0| 0 0| 0 0| 0 0| 0 0 | 0 0
RACKETEERING
| 0 0| 0 0| 0 0| 0 0| 0 0 | 0 0| 0 0| 0 0| 0 0| 0 0 | 0 0
DRUG ABUSE OFFENSES | 1 1| 194 6| 114 5| 9 2| 318 6 | 0 0| 7 6| 5 6| 0 0| 12 5 | 330 5
DRUG TRAFFICKING | 0 0| 15 0| 6 0| 1 0| 22 0 | 0 0| 0 0| 0 0| 0 0| 0 0 | 22 0
AUTO CRIMES
| 0 0| 0 0| 0 0| 0 0| 0 0 | 0 0| 0 0| 0 0| 0 0| 0 0 | 0 0
REVENUE & CONTRABAND| 0 0| 0 0| 0 0| 0 0| 0 0 | 0 0| 0 0| 0 0| 0 0| 0 0 | 0 0
CRIMES OF OTH STATES| 0 0| 0 0| 0 0| 0 0| 0 0 | 0 0| 0 0| 0 0| 0 0| 0 0 | 0 0
MISC. FELONIES
| 0 0| 1 0| 0 0| 1 0| 2 0 | 0 0| 0 0| 0 0| 0 0| 0 0 | 2 0
MISDEMEANORS
| 0 0| 0 0| 0 0| 0 0| 0 0 | 0 0| 0 0| 0 0| 0 0| 0 0 | 0 0
------------------------------------------------------------------------------------------------------------------------------------
Total reported
| 175 100| 3001 100| 2142 100| 441 100| 5759 100 | 9 100| 121 100| 87 100| 25 100| 242 100 | 6001 100
|
|
|
|
|
|
|
|
|
|
|
Percent reported |
98.9|
99.9| 100.0| 100.0|
99.9 | 100.0| 100.0| 100.0| 100.0| 100.0 |
99.9
|
|
|
|
|
|
|
|
|
|
|
|
|
|
|
|
|
|
|
|
|
|
NOT REPORTED
|2|4|1|0|7
|0|0|0|0|0
|7
------------------------------------------------------------------------------------------------------------------------------------
Total
| 177 | 3005 | 2143 | 441 | 5766
| 9 | 121 | 87 | 25 | 242
| 6008
Page 45 Run 07/26/01
Georgia Department of Corrections Office of Planning and Analysis
Inmate statistical profile
Sample: ACTIVE PRISONERS SERVING LIFE EXCLUDING JAIL
Requestor: Statistics
Active inmates 07/26/2001
Most Serious Offense by current age & sex
|
MEN
|
WOMEN
|
| Age | Age | Age | Age | Men
| Age | Age | Age | Age |Women
|Grand
Most Serious Offense|00-21 %|22-39 %|40-54 %|55-99 %|Total % |00-21 %|22-39 %|40-54 %|55-99 %|Total % |Total %
------------------------------------------------------------------------------------------------------------------------------------
Misdemeanors
|
|
|
------------------------------------------------------------------------------------------------------------------------------------
------------------------------------------------------------------------------------------------------------------------------------
------------------------------------------------------------------------------------------------------------------------------------
FELONIES
|
|
|
------------------------------------------------------------------------------------------------------------------------------------
------------------------------------------------------------------------------------------------------------------------------------
MISC. HOMICIDE OFFEN| 2 1| 4 0| 1 0| 0 0| 7 0 | 0 0| 0 0| 0 0| 0 0| 0 0 | 7 0
MURDER
| 130 73| 1907 63| 1254 59| 332 75| 3623 63 | 9 100| 110 91| 73 84| 25 100| 217 90 | 3840 64
VOLUNTARY MANSLAUGHT| 0 0| 1 0| 0 0| 1 0| 2 0 | 0 0| 0 0| 0 0| 0 0| 0 0 | 2 0
AGGRAVATED ASSAULT | 0 0| 7 0| 2 0| 0 0| 9 0 | 0 0| 0 0| 0 0| 0 0| 0 0 | 9 0
AGGRAVATED BATTERY | 0 0| 1 0| 0 0| 0 0| 1 0 | 0 0| 0 0| 0 0| 0 0| 0 0 | 1 0
KIDNAPPING
| 16 9| 175 6| 111 5| 5 1| 307 5 | 0 0| 2 2| 5 6| 0 0| 7 3 | 314 5
AGG ASSLT ON POLICE | 0 0| 0 0| 2 0| 0 0| 2 0 | 0 0| 0 0| 0 0| 0 0| 0 0 | 2 0
SECOND DEGREE ARSON | 0 0| 1 0| 0 0| 0 0| 1 0 | 0 0| 0 0| 0 0| 0 0| 0 0 | 1 0
CRIM. DAMAGE 2ND DEG| 0 0| 1 0| 0 0| 0 0| 1 0 | 0 0| 0 0| 0 0| 0 0| 0 0 | 1 0
BURGLARY
| 0 0| 15 0| 8 0| 0 0| 23 0 | 0 0| 0 0| 1 1| 0 0| 1 0 | 24 0
FORGERY 1ST DEGREE | 0 0| 6 0| 4 0| 0 0| 10 0 | 0 0| 0 0| 0 0| 0 0| 0 0 | 10 0
THEFT BY TAKING
| 0 0| 2 0| 3 0| 0 0| 5 0 | 0 0| 0 0| 0 0| 0 0| 0 0 | 5 0
THEFT BY REC STOLEN | 0 0| 2 0| 1 0| 0 0| 3 0 | 0 0| 0 0| 0 0| 0 0| 0 0 | 3 0
THEFT BY CONVERSION | 0 0| 1 0| 1 0| 0 0| 2 0 | 0 0| 0 0| 0 0| 0 0| 0 0 | 2 0
THEFT OF MOTOR VEH, | 0 0| 1 0| 0 0| 0 0| 1 0 | 0 0| 0 0| 0 0| 0 0| 0 0 | 1 0
ROBBERY
| 0 0| 5 0| 4 0| 4 1| 13 0 | 0 0| 0 0| 0 0| 0 0| 0 0 | 13 0
ARMED ROBBERY
| 17 10| 348 12| 242 11| 30 7| 637 11 | 0 0| 2 2| 1 1| 0 0| 3 1 | 640 11
CRMNL ATMPT ARMED RO| 1 1| 0 0| 0 0| 0 0| 1 0 | 0 0| 0 0| 0 0| 0 0| 0 0 | 1 0
MISC. SEXUAL
| 0 0| 1 0| 0 0| 0 0| 1 0 | 0 0| 0 0| 0 0| 0 0| 0 0 | 1 0
RAPE
| 10 6| 293 10| 346 16| 45 10| 694 12 | 0 0| 0 0| 2 2| 0 0| 2 1 | 696 12
AGGRAVATED SODOMY | 0 0| 14 0| 21 1| 9 2| 44 1 | 0 0| 0 0| 0 0| 0 0| 0 0 | 44 1
CHILD MOLESTATION | 0 0| 1 0| 4 0| 1 0| 6 0 | 0 0| 0 0| 0 0| 0 0| 0 0 | 6 0
AGGRAV. CHILD MOLEST| 0 0| 4 0| 10 0| 2 0| 16 0 | 0 0| 0 0| 0 0| 0 0| 0 0 | 16 0
OBSTR OF LAW ENF OFF| 0 0| 5 0| 6 0| 1 0| 12 0 | 0 0| 0 0| 0 0| 0 0| 0 0 | 12 0
ESCAPE
| 0 0| 0 0| 2 0| 0 0| 2 0 | 0 0| 0 0| 0 0| 0 0| 0 0 | 2 0
POSS OF CERTAIN WEAP| 0 0| 0 0| 1 0| 0 0| 1 0 | 0 0| 0 0| 0 0| 0 0| 0 0 | 1 0
S/D NARCOTICS, OPIAT| 0 0| 11 0| 11 1| 2 0| 24 0 | 0 0| 0 0| 1 1| 0 0| 1 0 | 25 0
S/D DEP,STIM,CNTRF D| 0 0| 4 0| 2 0| 0 0| 6 0 | 0 0| 0 0| 0 0| 0 0| 0 0 | 6 0
SALE/DIST OF MARIJUA| 0 0| 4 0| 5 0| 1 0| 10 0 | 0 0| 0 0| 0 0| 0 0| 0 0 | 10 0
------------------------------------------------------------------------------------------------------------------------------------
(continued)
Page 46 Run 07/26/01
Georgia Department of Corrections Office of Planning and Analysis
Inmate statistical profile
Sample: ACTIVE PRISONERS SERVING LIFE EXCLUDING JAIL
Requestor:
Active inmates 07/26/2001
Most Serious Offense by current age & sex
Statistics (CONTINUED)
|
MEN
|
WOMEN
|
| Age | Age | Age | Age | Men
| Age | Age | Age | Age |Women
|Grand
Most Serious Offense|00-21 %|22-39 %|40-54 %|55-99 %|Total % |00-21 %|22-39 %|40-54 %|55-99 %|Total % |Total %
------------------------------------------------------------------------------------------------------------------------------------
POSS NARCOTICS, OPIA| 0 0| 3 0| 3 0| 0 0| 6 0 | 0 0| 0 0| 0 0| 0 0| 0 0 | 6 0
POSS DEP,STIM,CNTRF | 0 0| 0 0| 1 0| 0 0| 1 0 | 0 0| 0 0| 0 0| 0 0| 0 0 | 1 0
VIOLATE GA CNTRL SBS| 0 0| 14 0| 5 0| 0 0| 19 0 | 0 0| 1 1| 1 1| 0 0| 2 1 | 21 0
UNLWFL MFG/DEL/DIST | 0 0| 5 0| 1 0| 0 0| 6 0 | 0 0| 0 0| 0 0| 0 0| 0 0 | 6 0
SALE/DIST CONT SUB P| 0 0| 2 0| 0 0| 0 0| 2 0 | 0 0| 0 0| 0 0| 0 0| 0 0 | 2 0
SALE/DIST CONT SUB S| 0 0| 1 0| 0 0| 0 0| 1 0 | 0 0| 0 0| 0 0| 0 0| 0 0 | 1 0
SALE/DISTRIBUTION CO| 1 1| 127 4| 70 3| 4 1| 202 4 | 0 0| 6 5| 3 3| 0 0| 9 4 | 211 4
POSSESSION OF COCAIN| 0 0| 23 1| 16 1| 2 0| 41 1 | 0 0| 0 0| 0 0| 0 0| 0 0 | 41 1
COCAINE LESS 200 GRA| 0 0| 10 0| 5 0| 1 0| 16 0 | 0 0| 0 0| 0 0| 0 0| 0 0 | 16 0
COCAINE 401 OR MORE | 0 0| 4 0| 1 0| 0 0| 5 0 | 0 0| 0 0| 0 0| 0 0| 0 0 | 5 0
ATT/CONSPRCY COMMT C| 0 0| 1 0| 0 0| 0 0| 1 0 | 0 0| 0 0| 0 0| 0 0| 0 0 | 1 0
CONSPIRACY
| 0 0| 1 0| 0 0| 0 0| 1 0 | 0 0| 0 0| 0 0| 0 0| 0 0 | 1 0
CRIMINAL ATTEMPT | 0 0| 0 0| 0 0| 1 0| 1 0 | 0 0| 0 0| 0 0| 0 0| 0 0 | 1 0
------------------------------------------------------------------------------------------------------------------------------------
Total reported
| 177 100| 3005 100| 2143 100| 441 100| 5766 100 | 9 100| 121 100| 87 100| 25 100| 242 100 | 6008 100
|
|
|
|
|
|
|
|
|
|
|
Percent reported | 100.0| 100.0| 100.0| 100.0| 100.0 | 100.0| 100.0| 100.0| 100.0| 100.0 | 100.0
|
|
|
|
|
|
|
|
|
|
|
|
|
|
|
|
|
|
|
|
|
|
NOT REPORTED
|0|0|0|0|0
|0|0|0|0|0
|0
------------------------------------------------------------------------------------------------------------------------------------
Total
| 177 | 3005 | 2143 | 441 | 5766
| 9 | 121 | 87 | 25 | 242
| 6008
Page 47 Run 07/26/01
Georgia Department of Corrections Office of Planning and Analysis
Inmate statistical profile
Sample: ACTIVE PRISONERS SERVING LIFE EXCLUDING JAIL
Requestor: Statistics
Active inmates 07/26/2001
Most Serious Crime Type by current age & sex
|
MEN
|
WOMEN
|
| Age | Age | Age | Age | Men
| Age | Age | Age | Age |Women
|Grand
Crime Type
|00-21 %|22-39 %|40-54 %|55-99 %|Total % |00-21 %|22-39 %|40-54 %|55-99 %|Total % |Total %
------------------------------------------------------------------------------------------------------------------------------------
VIOL/PERSN
| 166 94| 2448 81| 1616 75| 372 84| 4602 80 | 9 100| 114 94| 79 91| 25 100| 227 94 | 4829 80
NVIOL/PERS
| 0 0| 0 0| 0 0| 0 0| 0 0 | 0 0| 0 0| 0 0| 0 0| 0 0 | 0 0
PROPERTY
| 0 0| 29 1| 17 1| 0 0| 46 1 | 0 0| 0 0| 1 1| 0 0| 1 0 | 47 1
DRUG SALES
| 1 1| 169 6| 95 4| 8 2| 273 5 | 0 0| 6 5| 4 5| 0 0| 10 4 | 283 5
DRUG POSSN
| 0 0| 40 1| 25 1| 2 0| 67 1 | 0 0| 1 1| 1 1| 0 0| 2 1 | 69 1
ALCOHOL
| 0 0| 0 0| 0 0| 0 0| 0 0 | 0 0| 0 0| 0 0| 0 0| 0 0 | 0 0
HABIT/DUI
| 0 0| 0 0| 0 0| 0 0| 0 0 | 0 0| 0 0| 0 0| 0 0| 0 0 | 0 0
SEX OFFEND
| 10 6| 313 10| 381 18| 57 13| 761 13 | 0 0| 0 0| 2 2| 0 0| 2 1 | 763 13
OTHER
| 0 0| 6 0| 9 0| 2 0| 17 0 | 0 0| 0 0| 0 0| 0 0| 0 0 | 17 0
------------------------------------------------------------------------------------------------------------------------------------
Total reported
| 177 100| 3005 100| 2143 100| 441 100| 5766 100 | 9 100| 121 100| 87 100| 25 100| 242 100 | 6008 100
|
|
|
|
|
|
|
|
|
|
|
Percent reported | 100.0| 100.0| 100.0| 100.0| 100.0 | 100.0| 100.0| 100.0| 100.0| 100.0 | 100.0
|
|
|
|
|
|
|
|
|
|
|
|
|
|
|
|
|
|
|
|
|
|
NOT REPORTED
|0|0|0|0|0
|0|0|0|0|0
|0
------------------------------------------------------------------------------------------------------------------------------------
Total
| 177 | 3005 | 2143 | 441 | 5766
| 9 | 121 | 87 | 25 | 242
| 6008