- Collection:
- Georgia Government Publications
- Title:
- Inmate statistical profile: active lifers, 2001-06-01
- Creator:
- Georgia. Department of Corrections. Planning and Analysis Section
- Publisher:
- Atlanta, GA. : Georgia Dept. of Corrections, Office of Planning and Analysis, 2001-06-01
- Date of Original:
- 2001-06-01
- Subject:
- Prisoners--Georgia
- Location:
- United States, Georgia, 32.75042, -83.50018
- Medium:
- state government records
- Type:
- Text
- Format:
- application/pdf
- External Identifiers:
- Call Number GA R300.P5 P1 L5 2001/6
- Metadata URL:
- https://dlg.galileo.usg.edu/id:dlg_ggpd_i-ga-br300-pp5-bp1-bl5-b2001-s6-belec-p-btext
- Digital Object URL:
- https://dlg.galileo.usg.edu/do:dlg_ggpd_i-ga-br300-pp5-bp1-bl5-b2001-s6-belec-p-btext
- Language:
- eng
- Holding Institution:
- University of Georgia. Map and Government Information Library
- Rights:
-

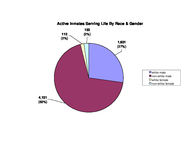
Active Inmates Serving Life By Race & Gender
112 (2%)
133 (2%)
1,631 (27%)
4,131 (69%)
white male non-white male white female non-white female
Prior Incarcerations of Active Inmates Serving A Life Sentence
4000
3,601
(60%)
3500
3000
Number of Inmates
2500
2000 1500 1000
500 0
zero
1,224 (20%)
one
632 (11%)
335 (6%)
two
three
Priors
137 (2%)
four
78 (1%)
five or more
Active Inmates Serving Life By Crime Type
70 (1%)
761 (13%)
17 (<1%)
288 (5%)
47 (1%)
4,824 (80%)
viol/persn
property
drug sales
drug possn
sex offend
other
Georgia Department of Corrections
Page 1 Run 06/18/01
Office of Planning and Analysis
Inmate statistical profile TABLE OF CONTENTS FOR ACTIVE PRISONERS SERVING LIFE EXCLUDING JAIL
Title
PAGE
-----
----
RACE AND SEX............................ 2
Culture Fair IQ Scores.................. 3
Self-Rpt Socioeconomic Class............ 4
Self-Rpt Environment To Age 16.......... 5
Self-Rpt Education Level................ 6
Functional Reading Level (WRAT Scores).. 7
Functional Math Level (WRAT Scores)..... 8
Functional Spelling Level (WRAT Scores). 9
Self-Rpt Guardian Status To Age 16......10
Self-Rpt Employment Status Before Prison11
Self-Rpt Marital Status At Admission....12
Self-Rpt Number Of Children At Admission13
Self-Rpt Religious Affiliation..........14
Self-Rpt Family Behavior Patterns *.....15
Inmate Diagnostic Behavior Problem *....16
Physical Profile (General Condition)....17
Security Status.........................18
Number Of Sentences.....................19
Number Of Disciplinaries................20
Number Of Escapes.......................21
Number Of Prior Georgia Incarcerations *22
Number Of Transfers.....................23
County Of Conviction....................24
Circ Of Conviction......................29
Home County.............................31
Prison Sentence In Years................36
Probation To Follow Prison..............37
Admission Type..........................38
Release Type............................39
Inst By Group...........................40
Institution.............................41
Misdemeanors And Felonies...............43
Crimes By Group.........................44
Most Serious Offense....................45
Most Serious Crime Type.................47
Georgia Department of Corrections
Page 2 Run 06/18/01
Office of Planning and Analysis
Inmate statistical profile
Sample: ACTIVE PRISONERS SERVING LIFE EXCLUDING JAIL
Requestor: Statistics
Active inmates 06/18/2001
RACE AND SEX by current age & sex
|
MEN
|
WOMEN
|
| Age | Age | Age | Age | Men
| Age | Age | Age | Age |Women
|Grand
RACE AND SEX
|00-21 %|22-39 %|40-54 %|55-99 %|Total % |00-21 %|22-39 %|40-54 %|55-99 %|Total % |Total %
------------------------------------------------------------------------------------------------------------------------------------
WHITE MALE
| 31 17| 671 22| 707 33| 222 50| 1631 28 | 0 0| 0 0| 0 0| 0 0| 0 0 | 1631 27
NON WHITE MALE
| 149 83| 2341 78| 1423 67| 218 50| 4131 72 | 0 0| 0 0| 0 0| 0 0| 0 0 | 4131 69
WHITE FEMALE
| 0 0| 0 0| 0 0| 0 0| 0 0 | 4 44| 44 36| 46 52| 18 72| 112 46 | 112 2
NON WHITE FEMALE | 0 0| 0 0| 0 0| 0 0| 0 0 | 5 56| 79 64| 42 48| 7 28| 133 54 | 133 2
------------------------------------------------------------------------------------------------------------------------------------
Total reported
| 180 100| 3012 100| 2130 100| 440 100| 5762 100 | 9 100| 123 100| 88 100| 25 100| 245 100 | 6007 100
|
|
|
|
|
|
|
|
|
|
|
Percent reported | 100.0| 100.0| 100.0| 100.0| 100.0 | 100.0| 100.0| 100.0| 100.0| 100.0 | 100.0
|
|
|
|
|
|
|
|
|
|
|
|
|
|
|
|
|
|
|
|
|
|
NOT REPORTED
|0|0|0|0|0
|0|0|0|0|0
|0
------------------------------------------------------------------------------------------------------------------------------------
Total
| 180 | 3012 | 2130 | 440 | 5762
| 9 | 123 | 88 | 25 | 245
| 6007
|
|
|
|
|
|
|
|
|
|
|
|
|
|
|
|
|
|
|
|
|
|
|
|
|
|
|
|
|
|
|
|
|
|
|
|
|
|
|
|
|
|
|
|
|
|
|
|
|
|
|
|
|
|
|
AVERAGE AGE
| 19.97 | 31.19 | 45.80 | 61.01 | 38.52 | 19.78 | 31.19 | 45.07 | 61.32 | 38.83 | 38.53
Page 3 Run 06/18/01
Georgia Department of Corrections Office of Planning and Analysis
Inmate statistical profile
Sample: ACTIVE PRISONERS SERVING LIFE EXCLUDING JAIL
Requestor: Statistics
Active inmates 06/18/2001
Culture Fair IQ Scores by current age & sex
|
MEN
|
WOMEN
|
| Age | Age | Age | Age | Men
| Age | Age | Age | Age |Women
|Grand
IQ Score
|00-21 %|22-39 %|40-54 %|55-99 %|Total % |00-21 %|22-39 %|40-54 %|55-99 %|Total % |Total %
------------------------------------------------------------------------------------------------------------------------------------
LESS THAN 70
| 4 2| 77 3| 153 8| 42 11| 276 5 | 0 0| 9 8| 9 11| 2 9| 20 9 | 296 5
70 AND UP
| 168 98| 2806 97| 1830 92| 353 89| 5157 95 | 8 100| 111 93| 76 89| 20 91| 215 91 | 5372 95
------------------------------------------------------------------------------------------------------------------------------------
Total reported
| 172 100| 2883 100| 1983 100| 395 100| 5433 100 | 8 100| 120 100| 85 100| 22 100| 235 100 | 5668 100
|
|
|
|
|
|
|
|
|
|
|
Percent reported |
95.6|
95.7|
93.1|
89.8|
94.3 |
88.9|
97.6|
96.6|
88.0|
95.9 |
94.4
|
|
|
|
|
|
|
|
|
|
|
|
|
|
|
|
|
|
|
|
|
|
NOT REPORTED
| 8 | 129 | 147 | 45 | 329
| 1 | 3 | 3 | 3 | 10
| 339
------------------------------------------------------------------------------------------------------------------------------------
Total
| 180 | 3012 | 2130 | 440 | 5762
| 9 | 123 | 88 | 25 | 245
| 6007
|
|
|
|
|
|
|
|
|
|
|
|
|
|
|
|
|
|
|
|
|
|
|
|
|
|
|
|
|
|
|
|
|
|
|
|
|
|
|
|
|
|
|
|
|
|
|
|
|
|
|
|
|
|
|
AVERAGE IQ
| 99.88 | 101.43 | 97.18 | 93.80 | 99.27 | 99.38 | 96.28 | 91.49 | 88.36 | 93.91 | 99.05
Page 4 Run 06/18/01
Georgia Department of Corrections Office of Planning and Analysis
Inmate statistical profile
Sample: ACTIVE PRISONERS SERVING LIFE EXCLUDING JAIL
Requestor: Statistics
Active inmates 06/18/2001
Self-Rpt Socioeconomic Class by current age & sex
|
MEN
|
WOMEN
|
| Age | Age | Age | Age | Men
| Age | Age | Age | Age |Women
|Grand
Socioeconomic Class |00-21 %|22-39 %|40-54 %|55-99 %|Total % |00-21 %|22-39 %|40-54 %|55-99 %|Total % |Total %
------------------------------------------------------------------------------------------------------------------------------------
WELFARE
| 15 9| 344 12| 205 10| 25 6| 589 11 | 0 0| 23 19| 7 8| 0 0| 30 13 | 619 11
OCC EMPLOY
| 12 7| 194 7| 65 3| 7 2| 278 5 | 0 0| 3 2| 0 0| 1 5| 4 2 | 282 5
MINIMUM STD
| 72 44| 1033 36| 890 43| 230 55| 2225 40 | 5 56| 40 33| 27 31| 8 36| 80 33 | 2305 40
MIDDLE
| 64 39| 1301 45| 894 43| 152 36| 2411 44 | 4 44| 54 45| 51 58| 12 55| 121 50 | 2532 44
OTHER
| 1 1| 26 1| 7 0| 3 1| 37 1 | 0 0| 1 1| 3 3| 1 5| 5 2 | 42 1
------------------------------------------------------------------------------------------------------------------------------------
Total reported
| 164 100| 2898 100| 2061 100| 417 100| 5540 100 | 9 100| 121 100| 88 100| 22 100| 240 100 | 5780 100
|
|
|
|
|
|
|
|
|
|
|
Percent reported |
91.1|
96.2|
96.8|
94.8|
96.1 | 100.0|
98.4| 100.0|
88.0|
98.0 |
96.2
|
|
|
|
|
|
|
|
|
|
|
|
|
|
|
|
|
|
|
|
|
|
NOT RPTD
| 16 | 114 | 69 | 23 | 222
|0|2|0|3|5
| 227
------------------------------------------------------------------------------------------------------------------------------------
Total
| 180 | 3012 | 2130 | 440 | 5762
| 9 | 123 | 88 | 25 | 245
| 6007
Page 5 Run 06/18/01
Georgia Department of Corrections Office of Planning and Analysis
Inmate statistical profile
Sample: ACTIVE PRISONERS SERVING LIFE EXCLUDING JAIL
Requestor: Statistics
Active inmates 06/18/2001
Self-Rpt Environment To Age 16 by current age & sex
|
MEN
|
WOMEN
|
| Age | Age | Age | Age | Men
| Age | Age | Age | Age |Women
|Grand
Environment
|00-21 %|22-39 %|40-54 %|55-99 %|Total % |00-21 %|22-39 %|40-54 %|55-99 %|Total % |Total %
------------------------------------------------------------------------------------------------------------------------------------
RURAL/FARM
| 1 1| 104 4| 177 9| 92 22| 374 7 | 0 0| 8 7| 4 5| 3 14| 15 6 | 389 7
RURAL/NFARM
| 4 2| 199 7| 177 9| 39 9| 419 7 | 0 0| 7 6| 3 3| 0 0| 10 4 | 429 7
S.M.S.A
| 79 45| 1228 42| 745 36| 108 25| 2160 38 | 2 22| 24 20| 22 25| 6 29| 54 23 | 2214 38
URBAN
| 32 18| 518 18| 377 18| 59 14| 986 18 | 4 44| 34 28| 24 27| 2 10| 64 27 | 1050 18
SMALL TOWN
| 61 34| 884 30| 586 28| 127 30| 1658 29 | 3 33| 48 40| 33 38| 9 43| 93 39 | 1751 30
OTHER
| 0 0| 16 1| 9 0| 0 0| 25 0 | 0 0| 0 0| 2 2| 1 5| 3 1 | 28 0
------------------------------------------------------------------------------------------------------------------------------------
Total reported
| 177 100| 2949 100| 2071 100| 425 100| 5622 100 | 9 100| 121 100| 88 100| 21 100| 239 100 | 5861 100
|
|
|
|
|
|
|
|
|
|
|
Percent reported |
98.3|
97.9|
97.2|
96.6|
97.6 | 100.0|
98.4| 100.0|
84.0|
97.6 |
97.6
|
|
|
|
|
|
|
|
|
|
|
|
|
|
|
|
|
|
|
|
|
|
NOT RPTD
| 3 | 63 | 59 | 15 | 140
|0|2|0|4|6
| 146
------------------------------------------------------------------------------------------------------------------------------------
Total
| 180 | 3012 | 2130 | 440 | 5762
| 9 | 123 | 88 | 25 | 245
| 6007
Page 6 Run 06/18/01
Georgia Department of Corrections Office of Planning and Analysis
Inmate statistical profile
Sample: ACTIVE PRISONERS SERVING LIFE EXCLUDING JAIL
Requestor: Statistics
Active inmates 06/18/2001
Self-Rpt Education Level by current age & sex
|
MEN
|
WOMEN
|
| Age | Age | Age | Age | Men
| Age | Age | Age | Age |Women
|Grand
Education Level
|00-21 %|22-39 %|40-54 %|55-99 %|Total % |00-21 %|22-39 %|40-54 %|55-99 %|Total % |Total %
------------------------------------------------------------------------------------------------------------------------------------
LESS THAN GRADE 7 | 6 3| 51 2| 106 5| 85 20| 248 4 | 0 0| 1 1| 2 2| 5 21| 8 3 | 256 4
GRADE 7
| 7 4| 84 3| 64 3| 36 8| 191 3 | 0 0| 5 4| 4 5| 1 4| 10 4 | 201 3
GRADE 8
| 42 24| 266 9| 200 10| 44 10| 552 10 | 3 33| 16 13| 7 8| 1 4| 27 11 | 579 10
GRADE 9
| 43 25| 459 15| 253 12| 39 9| 794 14 | 3 33| 17 14| 6 7| 0 0| 26 11 | 820 14
GRADE 10
| 35 20| 601 20| 307 15| 38 9| 981 17 | 1 11| 20 17| 12 14| 3 13| 36 15 | 1017 17
GRADE 11
| 36 21| 554 19| 237 11| 30 7| 857 15 | 1 11| 17 14| 5 6| 1 4| 24 10 | 881 15
GRADE 12
| 4 2| 715 24| 668 32| 108 25| 1495 26 | 1 11| 26 22| 31 35| 9 38| 67 28 | 1562 26
MORE THAN GRADE 12 | 2 1| 241 8| 267 13| 52 12| 562 10 | 0 0| 18 15| 21 24| 4 17| 43 18 | 605 10
------------------------------------------------------------------------------------------------------------------------------------
Total reported
| 175 100| 2971 100| 2102 100| 432 100| 5680 100 | 9 100| 120 100| 88 100| 24 100| 241 100 | 5921 100
|
|
|
|
|
|
|
|
|
|
|
Percent reported |
97.2|
98.6|
98.7|
98.2|
98.6 | 100.0|
97.6| 100.0|
96.0|
98.4 |
98.6
|
|
|
|
|
|
|
|
|
|
|
|
|
|
|
|
|
|
|
|
|
|
NOT REPORTED
| 5 | 41 | 28 | 8 | 82
|0|3|0|1|4
| 86
------------------------------------------------------------------------------------------------------------------------------------
Total
| 180 | 3012 | 2130 | 440 | 5762
| 9 | 123 | 88 | 25 | 245
| 6007
|
|
|
|
|
|
|
|
|
|
|
|
|
|
|
|
|
|
|
|
|
|
|
|
|
|
|
|
|
|
|
|
|
|
|
|
|
|
|
|
|
|
|
|
|
|
|
|
|
|
|
|
|
|
|
AVG EDUCATION LEVEL | 9.30 | 10.97 | 11.23 | 9.85 | 10.93 | 9.33 | 11.39 | 12.05 | 11.13 | 11.53 | 10.95
* NOTE: THE FIELD LABLED "LESS THAN GRADE 7" WAS CORRECTED IN MARCH 1989: MISSING DATA FOR INMATES STILL IN DIAGNOSTICS NOW HAS BEEN REMOVED FROM THIS FIELD AND IDENTIFIED AS "NOT REPORTED" INFORMATION.
Page 7 Run 06/18/01
Georgia Department of Corrections Office of Planning and Analysis
Inmate statistical profile
Sample: ACTIVE PRISONERS SERVING LIFE EXCLUDING JAIL
Requestor: Statistics
Active inmates 06/18/2001
Functional Reading Level (WRAT Scores) by current age & sex
|
MEN
|
WOMEN
|
| Age | Age | Age | Age | Men
| Age | Age | Age | Age |Women
|Grand
WRAT Reading Score |00-21 %|22-39 %|40-54 %|55-99 %|Total % |00-21 %|22-39 %|40-54 %|55-99 %|Total % |Total %
------------------------------------------------------------------------------------------------------------------------------------
LESS THAN GRADE 6 | 70 40| 1099 38| 867 46| 182 49| 2218 42 | 1 13| 45 38| 22 27| 10 43| 78 33 | 2296 41
6TH THRU 8TH GRADE | 34 20| 681 24| 413 22| 65 18| 1193 22 | 2 25| 28 23| 21 25| 4 17| 55 24 | 1248 22
GRADE 9
| 11 6| 214 7| 116 6| 24 6| 365 7 | 1 13| 3 3| 7 8| 2 9| 13 6 | 378 7
GRADE 10
| 11 6| 136 5| 74 4| 14 4| 235 4 | 1 13| 2 2| 6 7| 1 4| 10 4 | 245 4
GRADE 11
| 6 3| 117 4| 87 5| 9 2| 219 4 | 0 0| 4 3| 5 6| 1 4| 10 4 | 229 4
GRADE 12
| 29 17| 525 18| 300 16| 71 19| 925 17 | 3 38| 7 6| 2 2| 1 4| 13 6 | 938 17
MORE THAN GRADE 12 | 12 7| 113 4| 30 2| 5 1| 160 3 | 0 0| 31 26| 20 24| 4 17| 55 24 | 215 4
------------------------------------------------------------------------------------------------------------------------------------
Total reported
| 173 100| 2885 100| 1887 100| 370 100| 5315 100 | 8 100| 120 100| 83 100| 23 100| 234 100 | 5549 100
|
|
|
|
|
|
|
|
|
|
|
Percent reported |
96.1|
95.8|
88.6|
84.1|
92.2 |
88.9|
97.6|
94.3|
92.0|
95.5 |
92.4
|
|
|
|
|
|
|
|
|
|
|
|
|
|
|
|
|
|
|
|
|
|
NOT REPORTED
| 7 | 127 | 243 | 70 | 447
| 1 | 3 | 5 | 2 | 11
| 458
------------------------------------------------------------------------------------------------------------------------------------
Total
| 180 | 3012 | 2130 | 440 | 5762
| 9 | 123 | 88 | 25 | 245
| 6007
|
|
|
|
|
|
|
|
|
|
|
|
|
|
|
|
|
|
|
|
|
|
|
|
|
|
|
|
|
|
|
|
|
|
|
|
|
|
|
|
|
|
|
|
|
|
|
|
|
|
|
|
|
|
|
AVG READING SCORE | 7.79 | 7.73 | 7.04 | 6.87 | 7.43 | 9.35 | 8.11 | 8.41 | 7.36 | 8.18 | 7.46
Page 8 Run 06/18/01
Georgia Department of Corrections Office of Planning and Analysis
Inmate statistical profile
Sample: ACTIVE PRISONERS SERVING LIFE EXCLUDING JAIL
Requestor: Statistics
Active inmates 06/18/2001
Functional Math Level (WRAT Scores) by current age & sex
|
MEN
|
WOMEN
|
| Age | Age | Age | Age | Men
| Age | Age | Age | Age |Women
|Grand
WRAT Math Score
|00-21 %|22-39 %|40-54 %|55-99 %|Total % |00-21 %|22-39 %|40-54 %|55-99 %|Total % |Total %
------------------------------------------------------------------------------------------------------------------------------------
LESS THAN GRADE 6 | 69 40| 850 29| 825 44| 183 49| 1927 36 | 2 25| 41 34| 30 36| 10 43| 83 35 | 2010 36
6TH THRU 8TH GRADE | 72 42| 1468 51| 701 37| 101 27| 2342 44 | 5 63| 52 43| 34 40| 8 35| 99 42 | 2441 44
GRADE 9
| 9 5| 229 8| 130 7| 27 7| 395 7 | 1 13| 13 11| 6 7| 2 9| 22 9 | 417 8
GRADE 10
| 15 9| 135 5| 98 5| 21 6| 269 5 | 0 0| 7 6| 3 4| 1 4| 11 5 | 280 5
GRADE 11
| 4 2| 90 3| 52 3| 15 4| 161 3 | 0 0| 0 0| 3 4| 2 9| 5 2 | 166 3
GRADE 12
| 2 1| 98 3| 83 4| 20 5| 203 4 | 0 0| 2 2| 3 4| 0 0| 5 2 | 208 4
MORE THAN GRADE 12 | 2 1| 19 1| 3 0| 3 1| 27 1 | 0 0| 5 4| 5 6| 0 0| 10 4 | 37 1
------------------------------------------------------------------------------------------------------------------------------------
Total reported
| 173 100| 2889 100| 1892 100| 370 100| 5324 100 | 8 100| 120 100| 84 100| 23 100| 235 100 | 5559 100
|
|
|
|
|
|
|
|
|
|
|
Percent reported |
96.1|
95.9|
88.8|
84.1|
92.4 |
88.9|
97.6|
95.5|
92.0|
95.9 |
92.5
|
|
|
|
|
|
|
|
|
|
|
|
|
|
|
|
|
|
|
|
|
|
NOT REPORTED
| 7 | 123 | 238 | 70 | 438
| 1 | 3 | 4 | 2 | 10
| 448
------------------------------------------------------------------------------------------------------------------------------------
Total
| 180 | 3012 | 2130 | 440 | 5762
| 9 | 123 | 88 | 25 | 245
| 6007
|
|
|
|
|
|
|
|
|
|
|
|
|
|
|
|
|
|
|
|
|
|
|
|
|
|
|
|
|
|
|
|
|
|
|
|
|
|
|
|
|
|
|
|
|
|
|
|
|
|
|
|
|
|
|
AVG MATH SCORE
| 6.73 | 7.13 | 6.59 | 6.44 | 6.87 | 6.83 | 7.17 | 7.26 | 6.17 | 7.09 | 6.88
Page 9 Run 06/18/01
Georgia Department of Corrections Office of Planning and Analysis
Inmate statistical profile
Sample: ACTIVE PRISONERS SERVING LIFE EXCLUDING JAIL
Requestor: Statistics
Active inmates 06/18/2001
Functional Spelling Level (WRAT Scores) by current age & sex
|
MEN
|
WOMEN
|
| Age | Age | Age | Age | Men
| Age | Age | Age | Age |Women
|Grand
WRAT Spelling Score |00-21 %|22-39 %|40-54 %|55-99 %|Total % |00-21 %|22-39 %|40-54 %|55-99 %|Total % |Total %
------------------------------------------------------------------------------------------------------------------------------------
LESS THAN GRADE 6 | 64 37| 1272 44| 1083 57| 218 59| 2637 50 | 2 25| 40 33| 28 33| 12 52| 82 35 | 2719 49
6TH THRU 8TH GRADE | 57 33| 787 27| 387 20| 73 20| 1304 25 | 3 38| 32 27| 20 24| 3 13| 58 25 | 1362 25
GRADE 9
| 12 7| 182 6| 110 6| 14 4| 318 6 | 1 13| 8 7| 3 4| 2 9| 14 6 | 332 6
GRADE 10
| 18 10| 183 6| 69 4| 15 4| 285 5 | 1 13| 9 8| 7 8| 0 0| 17 7 | 302 5
GRADE 11
| 4 2| 134 5| 51 3| 6 2| 195 4 | 1 13| 4 3| 5 6| 2 9| 12 5 | 207 4
GRADE 12
| 9 5| 286 10| 174 9| 41 11| 510 10 | 0 0| 10 8| 5 6| 0 0| 15 6 | 525 9
MORE THAN GRADE 12 | 9 5| 42 1| 14 1| 3 1| 68 1 | 0 0| 17 14| 16 19| 4 17| 37 16 | 105 2
------------------------------------------------------------------------------------------------------------------------------------
Total reported
| 173 100| 2886 100| 1888 100| 370 100| 5317 100 | 8 100| 120 100| 84 100| 23 100| 235 100 | 5552 100
|
|
|
|
|
|
|
|
|
|
|
Percent reported |
96.1|
95.8|
88.6|
84.1|
92.3 |
88.9|
97.6|
95.5|
92.0|
95.9 |
92.4
|
|
|
|
|
|
|
|
|
|
|
|
|
|
|
|
|
|
|
|
|
|
NOT REPORTED
| 7 | 126 | 242 | 70 | 445
| 1 | 3 | 4 | 2 | 10
| 455
------------------------------------------------------------------------------------------------------------------------------------
Total
| 180 | 3012 | 2130 | 440 | 5762
| 9 | 123 | 88 | 25 | 245
| 6007
|
|
|
|
|
|
|
|
|
|
|
|
|
|
|
|
|
|
|
|
|
|
|
|
|
|
|
|
|
|
|
|
|
|
|
|
|
|
|
|
|
|
|
|
|
|
|
|
|
|
|
|
|
|
|
AVG SPELLING SCORE | 7.22 | 6.95 | 6.07 | 5.86 | 6.57 | 7.91 | 8.01 | 8.16 | 6.70 | 7.93 | 6.63
Page 10 Run 06/18/01
Georgia Department of Corrections Office of Planning and Analysis
Inmate statistical profile
Sample: ACTIVE PRISONERS SERVING LIFE EXCLUDING JAIL
Requestor: Statistics
Active inmates 06/18/2001
Self-Rpt Guardian Status To Age 16 by current age & sex
|
MEN
|
WOMEN
|
| Age | Age | Age | Age | Men
| Age | Age | Age | Age |Women
|Grand
Guardian Status
|00-21 %|22-39 %|40-54 %|55-99 %|Total % |00-21 %|22-39 %|40-54 %|55-99 %|Total % |Total %
------------------------------------------------------------------------------------------------------------------------------------
ORPHANAGE
| 0 0| 4 0| 4 0| 3 1| 11 0 | 0 0| 0 0| 0 0| 0 0| 0 0 | 11 0
FATHER ONLY
| 7 4| 83 3| 60 3| 7 2| 157 3 | 0 0| 2 2| 2 2| 1 4| 5 2 | 162 3
FTR MTR HD
| 12 7| 122 4| 70 3| 7 2| 211 4 | 0 0| 2 2| 5 6| 0 0| 7 3 | 218 4
MOTHER ONLY
| 88 50| 1407 47| 680 33| 110 26| 2285 40 | 5 56| 46 38| 26 30| 8 35| 85 36 | 2370 40
MTR FTR HD
| 38 22| 908 31| 990 47| 237 55| 2173 38 | 4 44| 45 37| 45 52| 13 57| 107 45 | 2280 39
OTH FEMALE
| 2 1| 55 2| 49 2| 16 4| 122 2 | 0 0| 4 3| 2 2| 0 0| 6 3 | 128 2
OTH MALE
| 2 1| 6 0| 13 1| 1 0| 22 0 | 0 0| 1 1| 2 2| 0 0| 3 1 | 25 0
STEP-PARNTS
| 3 2| 52 2| 26 1| 7 2| 88 2 | 0 0| 0 0| 0 0| 0 0| 0 0 | 88 1
FOSTER HOME
| 4 2| 27 1| 31 1| 7 2| 69 1 | 0 0| 2 2| 0 0| 0 0| 2 1 | 71 1
GRAND PRNTS
| 15 9| 239 8| 134 6| 27 6| 415 7 | 0 0| 16 13| 4 5| 1 4| 21 9 | 436 7
OTHER
| 4 2| 62 2| 28 1| 6 1| 100 2 | 0 0| 3 2| 0 0| 0 0| 3 1 | 103 2
------------------------------------------------------------------------------------------------------------------------------------
Total reported
| 175 100| 2965 100| 2085 100| 428 100| 5653 100 | 9 100| 121 100| 86 100| 23 100| 239 100 | 5892 100
|
|
|
|
|
|
|
|
|
|
|
Percent reported |
97.2|
98.4|
97.9|
97.3|
98.1 | 100.0|
98.4|
97.7|
92.0|
97.6 |
98.1
|
|
|
|
|
|
|
|
|
|
|
|
|
|
|
|
|
|
|
|
|
|
NOT RPTD
| 5 | 47 | 45 | 12 | 109
|0|2|2|2|6
| 115
------------------------------------------------------------------------------------------------------------------------------------
Total
| 180 | 3012 | 2130 | 440 | 5762
| 9 | 123 | 88 | 25 | 245
| 6007
Page 11 Run 06/18/01
Georgia Department of Corrections Office of Planning and Analysis
Inmate statistical profile
Sample: ACTIVE PRISONERS SERVING LIFE EXCLUDING JAIL
Requestor: Statistics
Active inmates 06/18/2001
Self-Rpt Employment Status Before Prison by current age & sex
|
MEN
|
WOMEN
|
| Age | Age | Age | Age | Men
| Age | Age | Age | Age |Women
|Grand
Employment
|00-21 %|22-39 %|40-54 %|55-99 %|Total % |00-21 %|22-39 %|40-54 %|55-99 %|Total % |Total %
------------------------------------------------------------------------------------------------------------------------------------
FULL TIME
| 33 20| 973 34| 777 38| 176 43| 1959 36 | 1 11| 31 27| 14 16| 5 23| 51 22 | 2010 35
PART TIME
| 6 4| 234 8| 112 6| 21 5| 373 7 | 0 0| 6 5| 3 4| 0 0| 9 4 | 382 7
UNEMPL < 6M
| 16 10| 459 16| 337 17| 60 15| 872 16 | 0 0| 22 19| 22 26| 4 18| 48 21 | 920 16
UNEMPL > 6M
| 18 11| 867 30| 723 36| 113 28| 1721 32 | 2 22| 33 28| 37 44| 11 50| 83 36 | 1804 32
NEVER WORKD
| 73 44| 261 9| 22 1| 3 1| 359 7 | 3 33| 23 20| 4 5| 0 0| 30 13 | 389 7
STUDENT
| 18 11| 34 1| 6 0| 1 0| 59 1 | 3 33| 1 1| 2 2| 0 0| 6 3 | 65 1
INCAPABLE
| 1 1| 32 1| 49 2| 34 8| 116 2 | 0 0| 0 0| 3 4| 2 9| 5 2 | 121 2
OTHER
| 0 0| 0 0| 0 0| 0 0| 0 0 | 0 0| 0 0| 0 0| 0 0| 0 0 | 0 0
------------------------------------------------------------------------------------------------------------------------------------
Total reported
| 165 100| 2860 100| 2026 100| 408 100| 5459 100 | 9 100| 116 100| 85 100| 22 100| 232 100 | 5691 100
|
|
|
|
|
|
|
|
|
|
|
Percent reported |
91.7|
95.0|
95.1|
92.7|
94.7 | 100.0|
94.3|
96.6|
88.0|
94.7 |
94.7
|
|
|
|
|
|
|
|
|
|
|
|
|
|
|
|
|
|
|
|
|
|
NOT RPTD
| 15 | 152 | 104 | 32 | 303
| 0 | 7 | 3 | 3 | 13
| 316
------------------------------------------------------------------------------------------------------------------------------------
Total
| 180 | 3012 | 2130 | 440 | 5762
| 9 | 123 | 88 | 25 | 245
| 6007
* NOTE: THE FIELD LABELD "OTHER" WAS CORRECTED IN APRIL 1989; INMATES CODED "PRE-OTIS NOT REPORTED" NOW HAVE BEEN REMOVED FROM THIS FIELD AND IDENTIFIED AS "NOT REPORTED".
Page 12 Run 06/18/01
Georgia Department of Corrections Office of Planning and Analysis
Inmate statistical profile
Sample: ACTIVE PRISONERS SERVING LIFE EXCLUDING JAIL
Requestor: Statistics
Active inmates 06/18/2001
Self-Rpt Marital Status At Admission by current age & sex
|
MEN
|
WOMEN
|
| Age | Age | Age | Age | Men
| Age | Age | Age | Age |Women
|Grand
Marital Status
|00-21 %|22-39 %|40-54 %|55-99 %|Total % |00-21 %|22-39 %|40-54 %|55-99 %|Total % |Total %
------------------------------------------------------------------------------------------------------------------------------------
SINGLE
| 162 92| 2062 70| 734 35| 57 13| 3015 53 | 9 100| 72 59| 16 18| 2 9| 99 41 | 3114 53
MARRIED
| 1 1| 227 8| 393 19| 121 28| 742 13 | 0 0| 12 10| 17 20| 3 13| 32 13 | 774 13
SEPARATED
| 0 0| 96 3| 170 8| 44 10| 310 5 | 0 0| 13 11| 8 9| 2 9| 23 10 | 333 6
DIVORCED
| 0 0| 133 4| 358 17| 99 23| 590 10 | 0 0| 9 7| 14 16| 6 26| 29 12 | 619 10
WIDOWED
| 2 1| 43 1| 93 4| 55 13| 193 3 | 0 0| 5 4| 20 23| 9 39| 34 14 | 227 4
COMMON LAW
| 11 6| 401 14| 344 16| 53 12| 809 14 | 0 0| 11 9| 12 14| 1 4| 24 10 | 833 14
OTHER
| 0 0| 2 0| 2 0| 0 0| 4 0 | 0 0| 0 0| 0 0| 0 0| 0 0 | 4 0
------------------------------------------------------------------------------------------------------------------------------------
Total reported
| 176 100| 2964 100| 2094 100| 429 100| 5663 100 | 9 100| 122 100| 87 100| 23 100| 241 100 | 5904 100
|
|
|
|
|
|
|
|
|
|
|
Percent reported |
97.8|
98.4|
98.3|
97.5|
98.3 | 100.0|
99.2|
98.9|
92.0|
98.4 |
98.3
|
|
|
|
|
|
|
|
|
|
|
|
|
|
|
|
|
|
|
|
|
|
NOT RPTD
| 4 | 48 | 36 | 11 | 99
|0|1|1|2|4
| 103
------------------------------------------------------------------------------------------------------------------------------------
Total
| 180 | 3012 | 2130 | 440 | 5762
| 9 | 123 | 88 | 25 | 245
| 6007
Page 13 Run 06/18/01
Georgia Department of Corrections Office of Planning and Analysis
Inmate statistical profile
Sample: ACTIVE PRISONERS SERVING LIFE EXCLUDING JAIL
Requestor: Statistics
Active inmates 06/18/2001
Self-Rpt Number Of Children At Admission by current age & sex
|
MEN
|
WOMEN
|
| Age | Age | Age | Age | Men
| Age | Age | Age | Age |Women
|Grand
Number Of Children |00-21 %|22-39 %|40-54 %|55-99 %|Total % |00-21 %|22-39 %|40-54 %|55-99 %|Total % |Total %
------------------------------------------------------------------------------------------------------------------------------------
NO CHILDREN
| 0 0| 417 21| 284 17| 38 10| 739 18 | 0 0| 3 3| 3 4| 1 4| 7 4 | 746 18
ONE CHILD
| 39 76| 745 38| 488 30| 65 17| 1337 33 | 1 100| 30 33| 18 23| 1 4| 50 26 | 1387 33
TWO CHILDREN
| 6 12| 420 21| 382 23| 83 22| 891 22 | 0 0| 34 37| 22 28| 9 39| 65 34 | 956 23
THREE CHILDREN
| 5 10| 238 12| 239 15| 74 20| 556 14 | 0 0| 14 15| 16 21| 7 30| 37 19 | 593 14
FOUR CHILDREN
| 0 0| 85 4| 118 7| 47 13| 250 6 | 0 0| 6 7| 11 14| 3 13| 20 10 | 270 6
FIVE CHILDREN
| 1 2| 34 2| 64 4| 25 7| 124 3 | 0 0| 4 4| 2 3| 1 4| 7 4 | 131 3
MORE THAN 5 CHILDREN| 0 0| 32 2| 61 4| 42 11| 135 3 | 0 0| 1 1| 6 8| 1 4| 8 4 | 143 3
------------------------------------------------------------------------------------------------------------------------------------
Total reported
| 51 100| 1971 100| 1636 100| 374 100| 4032 100 | 1 100| 92 100| 78 100| 23 100| 194 100 | 4226 100
|
|
|
|
|
|
|
|
|
|
|
Percent reported |
28.3|
65.4|
76.8|
85.0|
70.0 |
11.1|
74.8|
88.6|
92.0|
79.2 |
70.4
|
|
|
|
|
|
|
|
|
|
|
|
|
|
|
|
|
|
|
|
|
|
NOT REPORTED
| 129 | 1041 | 494 | 66 | 1730
| 8 | 31 | 10 | 2 | 51
| 1781
------------------------------------------------------------------------------------------------------------------------------------
Total
| 180 | 3012 | 2130 | 440 | 5762
| 9 | 123 | 88 | 25 | 245
| 6007
|
|
|
|
|
|
|
|
|
|
|
|
|
|
|
|
|
|
|
|
|
|
|
|
|
|
|
|
|
|
|
|
|
|
|
|
|
|
|
|
|
|
|
|
|
|
|
|
|
|
|
|
|
|
|
AVG NUM CHILDREN | 1.39 | 1.63 | 2.03 | 2.87 | 1.91 | 1.00 | 2.07 | 2.60 | 2.78 | 2.36 | 1.93
* NOTE: THE FIELD LABLED "NO CHILDREN" WAS CORRECTED IN MARCH 1989: MISSING DATA FOR INMATES STILL IN DIAGNOSTICS NOW HAS BEEN REMOVED FROM THIS FIELD AND IDENTIFIED AS "NOT REPORTED" INFORMATION.
Page 14 Run 06/18/01
Georgia Department of Corrections Office of Planning and Analysis
Inmate statistical profile
Sample: ACTIVE PRISONERS SERVING LIFE EXCLUDING JAIL
Requestor: Statistics
Active inmates 06/18/2001
Self-Rpt Religious Affiliation by current age & sex
|
MEN
|
WOMEN
|
| Age | Age | Age | Age | Men
| Age | Age | Age | Age |Women
|Grand
Religion
|00-21 %|22-39 %|40-54 %|55-99 %|Total % |00-21 %|22-39 %|40-54 %|55-99 %|Total % |Total %
------------------------------------------------------------------------------------------------------------------------------------
ISLAM
| 3 2| 148 5| 77 4| 10 2| 238 4 | 0 0| 2 2| 0 0| 0 0| 2 1 | 240 4
CATHOLIC
| 4 2| 86 3| 69 4| 19 5| 178 3 | 0 0| 7 6| 3 4| 1 5| 11 5 | 189 3
BAPTIST
| 71 41| 1451 51| 1205 62| 245 59| 2972 55 | 5 56| 64 54| 45 54| 15 68| 129 55 | 3101 55
METHODIST
| 2 1| 68 2| 86 4| 28 7| 184 3 | 0 0| 3 3| 8 10| 1 5| 12 5 | 196 3
EPISCOPLN
| 0 0| 5 0| 4 0| 2 0| 11 0 | 0 0| 1 1| 2 2| 0 0| 3 1 | 14 0
PRESBYTRN
| 0 0| 7 0| 9 0| 3 1| 19 0 | 0 0| 0 0| 0 0| 2 9| 2 1 | 21 0
CHC OF GOD
| 0 0| 33 1| 24 1| 9 2| 66 1 | 0 0| 4 3| 1 1| 0 0| 5 2 | 71 1
HOLINESS
| 5 3| 131 5| 92 5| 26 6| 254 5 | 2 22| 14 12| 12 14| 0 0| 28 12 | 282 5
JEWISH
| 0 0| 1 0| 3 0| 1 0| 5 0 | 0 0| 0 0| 0 0| 0 0| 0 0 | 5 0
ANGLICAN
| 0 0| 0 0| 0 0| 0 0| 0 0 | 0 0| 1 1| 0 0| 0 0| 1 0 | 1 0
GRK ORTHDX
| 0 0| 0 0| 0 0| 0 0| 0 0 | 0 0| 0 0| 0 0| 0 0| 0 0 | 0 0
HINDU
| 0 0| 0 0| 0 0| 0 0| 0 0 | 0 0| 0 0| 0 0| 0 0| 0 0 | 0 0
BUDDHIST
| 2 1| 2 0| 1 0| 0 0| 5 0 | 0 0| 0 0| 0 0| 0 0| 0 0 | 5 0
TAOIST
| 0 0| 0 0| 0 0| 0 0| 0 0 | 0 0| 0 0| 0 0| 0 0| 0 0 | 0 0
SHINTOIST
| 0 0| 0 0| 0 0| 0 0| 0 0 | 0 0| 0 0| 0 0| 0 0| 0 0 | 0 0
SEVEN D AD
| 0 0| 6 0| 4 0| 1 0| 11 0 | 0 0| 0 0| 0 0| 0 0| 0 0 | 11 0
JEHOVAH WT
| 1 1| 23 1| 13 1| 1 0| 38 1 | 0 0| 1 1| 0 0| 0 0| 1 0 | 39 1
LATR DAY S
| 0 0| 2 0| 1 0| 0 0| 3 0 | 0 0| 0 0| 0 0| 0 0| 0 0 | 3 0
QUAKER
| 0 0| 0 0| 0 0| 0 0| 0 0 | 0 0| 0 0| 0 0| 0 0| 0 0 | 0 0
OTHER PROD
| 22 13| 228 8| 68 3| 17 4| 335 6 | 0 0| 8 7| 6 7| 1 5| 15 6 | 350 6
NONE
| 46 27| 442 16| 142 7| 16 4| 646 12 | 1 11| 6 5| 1 1| 0 0| 8 3 | 654 12
OTHER
| 16 9| 210 7| 152 8| 35 8| 413 8 | 1 11| 7 6| 6 7| 2 9| 16 7 | 429 8
------------------------------------------------------------------------------------------------------------------------------------
Total reported
| 172 100| 2843 100| 1950 100| 413 100| 5378 100 | 9 100| 118 100| 84 100| 22 100| 233 100 | 5611 100
|
|
|
|
|
|
|
|
|
|
|
Percent reported |
95.6|
94.4|
91.5|
93.9|
93.3 | 100.0|
95.9|
95.5|
88.0|
95.1 |
93.4
|
|
|
|
|
|
|
|
|
|
|
|
|
|
|
|
|
|
|
|
|
|
NOT RPTD
| 8 | 169 | 180 | 27 | 384
| 0 | 5 | 4 | 3 | 12
| 396
------------------------------------------------------------------------------------------------------------------------------------
Total
| 180 | 3012 | 2130 | 440 | 5762
| 9 | 123 | 88 | 25 | 245
| 6007
Page 15 Run 06/18/01
Georgia Department of Corrections Office of Planning and Analysis
Inmate statistical profile
Sample: ACTIVE PRISONERS SERVING LIFE EXCLUDING JAIL
Requestor: Statistics
Active inmates 06/18/2001
Self-Rpt Family Behavior Patterns * by current age & sex
|
MEN
|
WOMEN
|
| Age | Age | Age | Age | Men
| Age | Age | Age | Age |Women
|Grand
Family Behavior
|00-21 %|22-39 %|40-54 %|55-99 %|Total % |00-21 %|22-39 %|40-54 %|55-99 %|Total % |Total %
------------------------------------------------------------------------------------------------------------------------------------
CRIMINLTY
| 53 21| 796 24| 530 29| 83 26| 1462 25 | 4 15| 34 18| 17 21| 2 12| 57 18 | 1519 25
ALCOHOLISM
| 19 7| 321 10| 291 16| 47 15| 678 12 | 2 7| 26 13| 16 20| 2 12| 46 14 | 724 12
DRUG ABUSE
| 27 11| 181 5| 72 4| 8 3| 288 5 | 2 7| 21 11| 5 6| 0 0| 28 9 | 316 5
DOMINERING
| 2 1| 13 0| 13 1| 0 0| 28 0 | 6 22| 13 7| 5 6| 2 12| 26 8 | 54 1
MIGRANT
| 1 0| 46 1| 42 2| 1 0| 90 2 | 1 4| 2 1| 2 3| 0 0| 5 2 | 95 2
INFL BTGS
| 7 3| 140 4| 69 4| 16 5| 232 4 | 3 11| 20 10| 6 8| 2 12| 31 10 | 263 4
PERMISSIVE
| 1 0| 7 0| 15 1| 2 1| 25 0 | 1 4| 5 3| 2 3| 0 0| 8 3 | 33 1
FATH ABSNT
| 109 43| 1497 45| 662 36| 125 39| 2393 41 | 5 19| 49 25| 17 21| 7 41| 78 25 | 2471 41
MOTH ABSNT
| 32 13| 307 9| 147 8| 33 10| 519 9 | 1 4| 15 8| 3 4| 1 6| 20 6 | 539 9
NONE
| 3 1| 37 1| 16 1| 2 1| 58 1 | 2 7| 9 5| 7 9| 1 6| 19 6 | 77 1
------------------------------------------------------------------------------------------------------------------------------------
Total reported
| 254 100| 3345 100| 1857 100| 317 100| 5773 100 | 27 100| 194 100| 80 100| 17 100| 318 100 | 6091 100
|
|
|
|
|
|
|
|
|
|
|
Percent reported |
76.1|
70.4|
60.4|
50.9|
65.4 | 100.0|
69.1|
58.0|
48.0|
64.1 |
65.3
|
|
|
|
|
|
|
|
|
|
|
|
|
|
|
|
|
|
|
|
|
|
OTHER
| 43 | 893 | 844 | 216 | 1996
| 0 | 38 | 37 | 13 | 88
| 2084
------------------------------------------------------------------------------------------------------------------------------------
Total
| 180 | 3012 | 2130 | 440 | 5762
| 9 | 123 | 88 | 25 | 245
| 6007
* NOTE: SINCE THERE CAN BE UP TO FIVE BEHAVIOR CODES PER INMATE, THE NUMBER OF CASES REPORTED IN THE DETAIL LINES AND THE TOTAL REPORTED LINE MAY EXCEED THE TOTAL NUMBER OF CASES. IN SHORT, THIS TABLE COUNTS THE NUMBER OF BEHAVIOR PROBLEMS, NOT INMATES.
Page 16 Run 06/18/01
Georgia Department of Corrections Office of Planning and Analysis
Inmate statistical profile
Sample: ACTIVE PRISONERS SERVING LIFE EXCLUDING JAIL
Requestor: Statistics
Active inmates 06/18/2001
Inmate Diagnostic Behavior Problem * by current age & sex
|
MEN
|
WOMEN
|
| Age | Age | Age | Age | Men
| Age | Age | Age | Age |Women
|Grand
Diagnostic Problem |00-21 %|22-39 %|40-54 %|55-99 %|Total % |00-21 %|22-39 %|40-54 %|55-99 %|Total % |Total %
------------------------------------------------------------------------------------------------------------------------------------
ALCOHOLIC
| 2 1| 132 2| 142 4| 40 6| 316 3 | 1 4| 3 1| 12 8| 2 7| 18 4 | 334 3
ALCOH ABSE
| 39 11| 868 16| 655 17| 116 17| 1678 16 | 1 4| 27 13| 17 11| 5 17| 50 12 | 1728 16
DRUG EXP
| 65 18| 783 15| 383 10| 42 6| 1273 12 | 2 8| 21 10| 16 11| 0 0| 39 10 | 1312 12
DRUG ABSE
| 71 19| 960 18| 672 18| 46 7| 1749 17 | 4 16| 41 20| 25 17| 0 0| 70 17 | 1819 17
NARC ADDCT
| 1 0| 95 2| 95 2| 7 1| 198 2 | 0 0| 3 1| 3 2| 0 0| 6 1 | 204 2
EPILEPTIC
| 0 0| 26 0| 23 1| 6 1| 55 1 | 0 0| 0 0| 2 1| 0 0| 2 0 | 57 1
MANIPULTVE
| 34 9| 267 5| 117 3| 22 3| 440 4 | 1 4| 3 1| 0 0| 1 3| 5 1 | 445 4
ASSAULTIVE
| 119 33| 1378 26| 962 25| 187 27| 2646 26 | 7 28| 57 28| 30 20| 5 17| 99 24 | 2745 26
ESCPE TEND
| 5 1| 110 2| 212 6| 46 7| 373 4 | 0 0| 2 1| 4 3| 0 0| 6 1 | 379 4
SUICIDAL
| 8 2| 141 3| 111 3| 16 2| 276 3 | 4 16| 16 8| 7 5| 2 7| 29 7 | 305 3
WITHDRAWN
| 0 0| 33 1| 22 1| 7 1| 62 1 | 2 8| 2 1| 3 2| 0 0| 7 2 | 69 1
PR RLTY CT
| 0 0| 34 1| 49 1| 13 2| 96 1 | 1 4| 1 0| 3 2| 1 3| 6 1 | 102 1
HOMOSEXUAL
| 1 0| 12 0| 10 0| 5 1| 28 0 | 2 8| 4 2| 3 2| 0 0| 9 2 | 37 0
NONE
| 1 0| 278 5| 241 6| 76 11| 596 6 | 0 0| 9 4| 15 10| 9 30| 33 8 | 629 6
OTHER
| 2 1| 71 1| 60 2| 24 4| 157 2 | 0 0| 0 0| 0 0| 3 10| 3 1 | 160 2
NOT RPTD
| 17 5| 186 3| 67 2| 28 4| 298 3 | 0 0| 17 8| 7 5| 2 7| 26 6 | 324 3
------------------------------------------------------------------------------------------------------------------------------------
Total reported
| 365 100| 5383 100| 3822 100| 682 100|10252 100 | 25 100| 206 100| 148 100| 30 100| 409 100 |10661 100
|
|
|
|
|
|
|
|
|
|
|
Percent reported | 100.0|
99.7| 100.0|
99.8|
99.8 | 100.0| 100.0|
98.9| 100.0|
99.6 |
99.8
|
|
|
|
|
|
|
|
|
|
|
|
|
|
|
|
|
|
|
|
|
|
UNKNOWN
| 0 | 9 | 1 | 1 | 11
|0|0|1|0|1
| 12
------------------------------------------------------------------------------------------------------------------------------------
Total
| 180 | 3012 | 2130 | 440 | 5762
| 9 | 123 | 88 | 25 | 245
| 6007
* NOTE: SINCE THERE CAN BE UP TO FIVE BEHAVIOR CODES PER INMATE, THE NUMBER OF CASES REPORTED IN THE DETAIL LINES AND THE TOTAL REPORTED LINE MAY EXCEED THE TOTAL NUMBER OF CASES. IN SHORT, THIS TABLE COUNTS THE NUMBER OF BEHAVIOR PROBLEMS, NOT INMATES.
Page 17 Run 06/18/01
Georgia Department of Corrections Office of Planning and Analysis
Inmate statistical profile
Sample: ACTIVE PRISONERS SERVING LIFE EXCLUDING JAIL
Requestor: Statistics
Active inmates 06/18/2001
Physical Profile (General Condition) by current age & sex
|
MEN
|
WOMEN
|
| Age | Age | Age | Age | Men
| Age | Age | Age | Age |Women
|Grand
Physical Profile |00-21 %|22-39 %|40-54 %|55-99 %|Total % |00-21 %|22-39 %|40-54 %|55-99 %|Total % |Total %
------------------------------------------------------------------------------------------------------------------------------------
NO LIMITATION
| 157 90| 2180 73| 1041 49| 82 19| 3460 61 | 8 89| 89 74| 43 49| 1 5| 141 59 | 3601 61
DEFECT NO MAJOR LIMT| 12 7| 399 13| 457 22| 94 22| 962 17 | 0 0| 4 3| 11 13| 5 23| 20 8 | 982 17
DEFECT MAJOR LIMIT | 6 3| 399 13| 609 29| 231 53| 1245 22 | 1 11| 27 23| 32 37| 14 64| 74 31 | 1319 22
VERY MAJOR DEFECT | 0 0| 4 0| 12 1| 28 6| 44 1 | 0 0| 0 0| 1 1| 2 9| 3 1 | 47 1
------------------------------------------------------------------------------------------------------------------------------------
Total reported
| 175 100| 2982 100| 2119 100| 435 100| 5711 100 | 9 100| 120 100| 87 100| 22 100| 238 100 | 5949 100
|
|
|
|
|
|
|
|
|
|
|
Percent reported |
97.2|
99.0|
99.5|
98.9|
99.1 | 100.0|
97.6|
98.9|
88.0|
97.1 |
99.0
|
|
|
|
|
|
|
|
|
|
|
|
|
|
|
|
|
|
|
|
|
|
NOT REPORTED
| 5 | 30 | 11 | 5 | 51
|0|3|1|3|7
| 58
------------------------------------------------------------------------------------------------------------------------------------
Total
| 180 | 3012 | 2130 | 440 | 5762
| 9 | 123 | 88 | 25 | 245
| 6007
Page 18 Run 06/18/01
Georgia Department of Corrections Office of Planning and Analysis
Inmate statistical profile
Sample: ACTIVE PRISONERS SERVING LIFE EXCLUDING JAIL
Requestor: Statistics
Active inmates 06/18/2001
Security Status by current age & sex
|
MEN
|
WOMEN
|
| Age | Age | Age | Age | Men
| Age | Age | Age | Age |Women
|Grand
Security
|00-21 %|22-39 %|40-54 %|55-99 %|Total % |00-21 %|22-39 %|40-54 %|55-99 %|Total % |Total %
------------------------------------------------------------------------------------------------------------------------------------
DIAG INCOM
| 0 0| 1 0| 1 0| 0 0| 2 0 | 0 0| 0 0| 0 0| 0 0| 0 0 | 2 0
WRK RELEAS
| 0 0| 0 0| 0 0| 0 0| 0 0 | 0 0| 0 0| 0 0| 0 0| 0 0 | 0 0
TRUSTY
| 0 0| 58 2| 42 2| 3 1| 103 2 | 0 0| 1 1| 4 5| 1 4| 6 2 | 109 2
MINIMUM
| 0 0| 375 12| 463 22| 104 24| 942 16 | 0 0| 41 33| 35 40| 16 64| 92 38 | 1034 17
MEDIUM
| 17 9| 1266 42| 1126 53| 258 59| 2667 46 | 1 11| 48 39| 36 41| 8 32| 93 38 | 2760 46
CLOSE
| 148 82| 1155 38| 410 19| 68 15| 1781 31 | 8 89| 33 27| 12 14| 0 0| 53 22 | 1834 31
MAXIMUM
| 3 2| 139 5| 84 4| 6 1| 232 4 | 0 0| 0 0| 1 1| 0 0| 1 0 | 233 4
DIAGNOSTIC
| 12 7| 18 1| 4 0| 1 0| 35 1 | 0 0| 0 0| 0 0| 0 0| 0 0 | 35 1
------------------------------------------------------------------------------------------------------------------------------------
Total reported
| 180 100| 3012 100| 2130 100| 440 100| 5762 100 | 9 100| 123 100| 88 100| 25 100| 245 100 | 6007 100
|
|
|
|
|
|
|
|
|
|
|
Percent reported | 100.0| 100.0| 100.0| 100.0| 100.0 | 100.0| 100.0| 100.0| 100.0| 100.0 | 100.0
|
|
|
|
|
|
|
|
|
|
|
|
|
|
|
|
|
|
|
|
|
|
NOT RPTD
|0|0|0|0|0
|0|0|0|0|0
|0
------------------------------------------------------------------------------------------------------------------------------------
Total
| 180 | 3012 | 2130 | 440 | 5762
| 9 | 123 | 88 | 25 | 245
| 6007
* NOTE: BEGINNING IN JULY 1987, THE FACILITIES DIVISION NO LONGER CODED INMATES AS BEING WORK RELEASE
Page 19 Run 06/18/01
Georgia Department of Corrections Office of Planning and Analysis
Inmate statistical profile
Sample: ACTIVE PRISONERS SERVING LIFE EXCLUDING JAIL
Requestor: Statistics
Active inmates 06/18/2001
Number Of Sentences by current age & sex
|
MEN
|
WOMEN
|
| Age | Age | Age | Age | Men
| Age | Age | Age | Age |Women
|Grand
Number Of Sentences |00-21 %|22-39 %|40-54 %|55-99 %|Total % |00-21 %|22-39 %|40-54 %|55-99 %|Total % |Total %
------------------------------------------------------------------------------------------------------------------------------------
ONE
| 56 31| 736 24| 537 25| 153 35| 1482 26 | 3 33| 45 37| 40 45| 12 48| 100 41 | 1582 26
TWO
| 51 28| 706 23| 499 23| 107 24| 1363 24 | 2 22| 39 32| 24 27| 8 32| 73 30 | 1436 24
THREE
| 20 11| 519 17| 376 18| 69 16| 984 17 | 2 22| 21 17| 10 11| 5 20| 38 16 | 1022 17
FOUR
| 24 13| 333 11| 244 11| 37 8| 638 11 | 1 11| 9 7| 4 5| 0 0| 14 6 | 652 11
FIVE
| 9 5| 232 8| 153 7| 21 5| 415 7 | 1 11| 4 3| 4 5| 0 0| 9 4 | 424 7
MORE THAN FIVE
| 20 11| 486 16| 321 15| 53 12| 880 15 | 0 0| 5 4| 6 7| 0 0| 11 4 | 891 15
------------------------------------------------------------------------------------------------------------------------------------
Total reported
| 180 100| 3012 100| 2130 100| 440 100| 5762 100 | 9 100| 123 100| 88 100| 25 100| 245 100 | 6007 100
|
|
|
|
|
|
|
|
|
|
|
Percent reported | 100.0| 100.0| 100.0| 100.0| 100.0 | 100.0| 100.0| 100.0| 100.0| 100.0 | 100.0
|
|
|
|
|
|
|
|
|
|
|
|
|
|
|
|
|
|
|
|
|
|
NOT REPORTED
|0|0|0|0|0
|0|0|0|0|0
|0
------------------------------------------------------------------------------------------------------------------------------------
Total
| 180 | 3012 | 2130 | 440 | 5762
| 9 | 123 | 88 | 25 | 245
| 6007
|
|
|
|
|
|
|
|
|
|
|
|
|
|
|
|
|
|
|
|
|
|
|
|
|
|
|
|
|
|
|
|
|
|
|
|
|
|
|
|
|
|
|
|
|
|
|
|
|
|
|
|
|
|
|
AVG NUM SENTENCES | 2.82 | 3.42 | 3.34 | 2.90 | 3.33 | 2.44 | 2.33 | 2.26 | 1.72 | 2.25 | 3.29
Page 20 Run 06/18/01
Georgia Department of Corrections Office of Planning and Analysis
Inmate statistical profile
Sample: ACTIVE PRISONERS SERVING LIFE EXCLUDING JAIL
Requestor: Statistics
Active inmates 06/18/2001
Number Of Disciplinaries by current age & sex
|
MEN
|
WOMEN
|
| Age | Age | Age | Age | Men
| Age | Age | Age | Age |Women
|Grand
Disciplinaries
|00-21 %|22-39 %|40-54 %|55-99 %|Total % |00-21 %|22-39 %|40-54 %|55-99 %|Total % |Total %
------------------------------------------------------------------------------------------------------------------------------------
ZERO
| 34 19| 429 14| 339 16| 117 27| 919 16 | 1 11| 24 20| 21 24| 13 52| 59 24 | 978 16
ONE
| 22 12| 302 10| 268 13| 69 16| 661 11 | 2 22| 15 12| 18 20| 6 24| 41 17 | 702 12
TWO
| 21 12| 254 8| 186 9| 55 13| 516 9 | 0 0| 14 11| 9 10| 1 4| 24 10 | 540 9
THREE
| 10 6| 183 6| 152 7| 38 9| 383 7 | 1 11| 10 8| 12 14| 1 4| 24 10 | 407 7
FOUR
| 7 4| 167 6| 116 5| 26 6| 316 5 | 0 0| 3 2| 4 5| 1 4| 8 3 | 324 5
FIVE
| 10 6| 146 5| 96 5| 17 4| 269 5 | 0 0| 5 4| 0 0| 0 0| 5 2 | 274 5
MORE THAN FIVE
| 76 42| 1531 51| 973 46| 118 27| 2698 47 | 5 56| 52 42| 24 27| 3 12| 84 34 | 2782 46
------------------------------------------------------------------------------------------------------------------------------------
Total reported
| 180 100| 3012 100| 2130 100| 440 100| 5762 100 | 9 100| 123 100| 88 100| 25 100| 245 100 | 6007 100
|
|
|
|
|
|
|
|
|
|
|
Percent reported | 100.0| 100.0| 100.0| 100.0| 100.0 | 100.0| 100.0| 100.0| 100.0| 100.0 | 100.0
|
|
|
|
|
|
|
|
|
|
|
|
|
|
|
|
|
|
|
|
|
|
NOT REPORTED
|0|0|0|0|0
|0|0|0|0|0
|0
------------------------------------------------------------------------------------------------------------------------------------
Total
| 180 | 3012 | 2130 | 440 | 5762
| 9 | 123 | 88 | 25 | 245
| 6007
|
|
|
|
|
|
|
|
|
|
|
|
|
|
|
|
|
|
|
|
|
|
|
|
|
|
|
|
|
|
|
|
|
|
|
|
|
|
|
|
|
|
|
|
|
|
|
|
|
|
|
|
|
|
|
AVG NUM DISCIP
| 9.82 | 10.94 | 10.50 | 5.50 | 10.32 | 5.67 | 8.26 | 5.86 | 1.68 | 6.63 | 10.17
Page 21 Run 06/18/01
Georgia Department of Corrections Office of Planning and Analysis
Inmate statistical profile
Sample: ACTIVE PRISONERS SERVING LIFE EXCLUDING JAIL
Requestor: Statistics
Active inmates 06/18/2001
Number Of Escapes by current age & sex
|
MEN
|
WOMEN
|
| Age | Age | Age | Age | Men
| Age | Age | Age | Age |Women
|Grand
Escapes
|00-21 %|22-39 %|40-54 %|55-99 %|Total % |00-21 %|22-39 %|40-54 %|55-99 %|Total % |Total %
------------------------------------------------------------------------------------------------------------------------------------
ZERO
| 180 100| 2979 99| 2041 96| 423 96| 5623 98 | 9 100| 123 100| 86 98| 25 100| 243 99 | 5866 98
ONE
| 0 0| 32 1| 71 3| 11 3| 114 2 | 0 0| 0 0| 2 2| 0 0| 2 1 | 116 2
TWO
| 0 0| 1 0| 14 1| 4 1| 19 0 | 0 0| 0 0| 0 0| 0 0| 0 0 | 19 0
THREE
| 0 0| 0 0| 3 0| 2 0| 5 0 | 0 0| 0 0| 0 0| 0 0| 0 0 | 5 0
FOUR
| 0 0| 0 0| 1 0| 0 0| 1 0 | 0 0| 0 0| 0 0| 0 0| 0 0 | 1 0
FIVE
| 0 0| 0 0| 0 0| 0 0| 0 0 | 0 0| 0 0| 0 0| 0 0| 0 0 | 0 0
MORE THAN FIVE
| 0 0| 0 0| 0 0| 0 0| 0 0 | 0 0| 0 0| 0 0| 0 0| 0 0 | 0 0
------------------------------------------------------------------------------------------------------------------------------------
Total reported
| 180 100| 3012 100| 2130 100| 440 100| 5762 100 | 9 100| 123 100| 88 100| 25 100| 245 100 | 6007 100
|
|
|
|
|
|
|
|
|
|
|
Percent reported | 100.0| 100.0| 100.0| 100.0| 100.0 | 100.0| 100.0| 100.0| 100.0| 100.0 | 100.0
|
|
|
|
|
|
|
|
|
|
|
|
|
|
|
|
|
|
|
|
|
|
NOT REPORTED
|0|0|0|0|0
|0|0|0|0|0
|0
------------------------------------------------------------------------------------------------------------------------------------
Total
| 180 | 3012 | 2130 | 440 | 5762
| 9 | 123 | 88 | 25 | 245
| 6007
|
|
|
|
|
|
|
|
|
|
|
|
|
|
|
|
|
|
|
|
|
|
|
|
|
|
|
|
|
|
|
|
|
|
|
|
|
|
|
|
|
|
|
|
|
|
|
|
|
|
|
|
|
|
|
AVG NUM ESCAPES
| .00 | .01 | .05 | .06 | .03 | .00 | .00 | .02 | .00 | .01 | .03
Page 22 Run 06/18/01
Georgia Department of Corrections Office of Planning and Analysis
Inmate statistical profile
Sample: ACTIVE PRISONERS SERVING LIFE EXCLUDING JAIL
Requestor: Statistics
Active inmates 06/18/2001
Number Of Prior Georgia Incarcerations * by current age & sex
|
MEN
|
WOMEN
|
| Age | Age | Age | Age | Men
| Age | Age | Age | Age |Women
|Grand
Prior Incarcerations|00-21 %|22-39 %|40-54 %|55-99 %|Total % |00-21 %|22-39 %|40-54 %|55-99 %|Total % |Total %
------------------------------------------------------------------------------------------------------------------------------------
ZERO
| 171 95| 2019 67| 960 45| 246 56| 3396 59 | 9 100| 105 85| 68 77| 23 92| 205 84 | 3601 60
ONE
| 8 4| 568 19| 519 24| 101 23| 1196 21 | 0 0| 14 11| 13 15| 1 4| 28 11 | 1224 20
TWO
| 1 1| 234 8| 342 16| 45 10| 622 11 | 0 0| 3 2| 6 7| 1 4| 10 4 | 632 11
THREE
| 0 0| 128 4| 174 8| 33 8| 335 6 | 0 0| 0 0| 0 0| 0 0| 0 0 | 335 6
FOUR
| 0 0| 50 2| 75 4| 11 3| 136 2 | 0 0| 1 1| 0 0| 0 0| 1 0 | 137 2
FIVE
| 0 0| 10 0| 38 2| 2 0| 50 1 | 0 0| 0 0| 0 0| 0 0| 0 0 | 50 1
MORE THAN FIVE
| 0 0| 3 0| 22 1| 2 0| 27 0 | 0 0| 0 0| 1 1| 0 0| 1 0 | 28 0
------------------------------------------------------------------------------------------------------------------------------------
Total reported
| 180 100| 3012 100| 2130 100| 440 100| 5762 100 | 9 100| 123 100| 88 100| 25 100| 245 100 | 6007 100
|
|
|
|
|
|
|
|
|
|
|
Percent reported | 100.0| 100.0| 100.0| 100.0| 100.0 | 100.0| 100.0| 100.0| 100.0| 100.0 | 100.0
|
|
|
|
|
|
|
|
|
|
|
|
|
|
|
|
|
|
|
|
|
|
NOT REPORTED
|0|0|0|0|0
|0|0|0|0|0
|0
------------------------------------------------------------------------------------------------------------------------------------
Total
| 180 | 3012 | 2130 | 440 | 5762
| 9 | 123 | 88 | 25 | 245
| 6007
|
|
|
|
|
|
|
|
|
|
|
|
|
|
|
|
|
|
|
|
|
|
|
|
|
|
|
|
|
|
|
|
|
|
|
|
|
|
|
|
|
|
|
|
|
|
|
|
|
|
|
|
|
|
|
AVG # INCARCERATIONS| .06 | .56 | 1.11 | .81 | .77 | .00 | .20 | .38 | .12 | .24 | .74
* This data counts a parole revocation on an existing sentenCE AS A prior incarceration. Also, this data counts, for any cohort of inmates, the total number of Georgia incarcerations the inmate has had during his entire criminal career. For example, if an inmate was admitted to prison first in FY72, and then re-admitted in FY79 and FY85, he had two prior incarcerations before the FY85 admission. This inmate's records show two prior incarcerations in all three of his records since he has had two prior incarcerations in his criminal career. If the cohort of FY72 admissions is selected for analysis, two prior incarcerations will be listed for this inmate even though in FY72, he had no prior incarcerations.
Page 23 Run 06/18/01
Georgia Department of Corrections Office of Planning and Analysis
Inmate statistical profile
Sample: ACTIVE PRISONERS SERVING LIFE EXCLUDING JAIL
Requestor: Statistics
Active inmates 06/18/2001
Number Of Transfers by current age & sex
|
MEN
|
WOMEN
|
| Age | Age | Age | Age | Men
| Age | Age | Age | Age |Women
|Grand
Transfers
|00-21 %|22-39 %|40-54 %|55-99 %|Total % |00-21 %|22-39 %|40-54 %|55-99 %|Total % |Total %
------------------------------------------------------------------------------------------------------------------------------------
ZERO
| 58 32| 101 3| 20 1| 7 2| 186 3 | 0 0| 5 4| 5 6| 0 0| 10 4 | 196 3
ONE
| 84 47| 844 28| 393 18| 96 22| 1417 25 | 8 89| 36 29| 27 31| 5 20| 76 31 | 1493 25
TWO
| 25 14| 675 22| 348 16| 69 16| 1117 19 | 0 0| 40 33| 17 19| 5 20| 62 25 | 1179 20
THREE
| 10 6| 464 15| 300 14| 73 17| 847 15 | 1 11| 19 15| 17 19| 7 28| 44 18 | 891 15
FOUR
| 1 1| 312 10| 237 11| 41 9| 591 10 | 0 0| 12 10| 9 10| 3 12| 24 10 | 615 10
FIVE
| 2 1| 219 7| 184 9| 33 8| 438 8 | 0 0| 6 5| 5 6| 3 12| 14 6 | 452 8
MORE THAN FIVE
| 0 0| 397 13| 648 30| 121 28| 1166 20 | 0 0| 5 4| 8 9| 2 8| 15 6 | 1181 20
------------------------------------------------------------------------------------------------------------------------------------
Total reported
| 180 100| 3012 100| 2130 100| 440 100| 5762 100 | 9 100| 123 100| 88 100| 25 100| 245 100 | 6007 100
|
|
|
|
|
|
|
|
|
|
|
Percent reported | 100.0| 100.0| 100.0| 100.0| 100.0 | 100.0| 100.0| 100.0| 100.0| 100.0 | 100.0
|
|
|
|
|
|
|
|
|
|
|
|
|
|
|
|
|
|
|
|
|
|
NOT REPORTED
|0|0|0|0|0
|0|0|0|0|0
|0
------------------------------------------------------------------------------------------------------------------------------------
Total
| 180 | 3012 | 2130 | 440 | 5762
| 9 | 123 | 88 | 25 | 245
| 6007
|
|
|
|
|
|
|
|
|
|
|
|
|
|
|
|
|
|
|
|
|
|
|
|
|
|
|
|
|
|
|
|
|
|
|
|
|
|
|
|
|
|
|
|
|
|
|
|
|
|
|
|
|
|
|
AVG NUM TRANSFERS | .99 | 3.02 | 4.61 | 4.30 | 3.64 | 1.22 | 2.34 | 2.66 | 3.08 | 2.49 | 3.59
Page 24 Run 06/18/01
Georgia Department of Corrections Office of Planning and Analysis
Inmate statistical profile
Sample: ACTIVE PRISONERS SERVING LIFE EXCLUDING JAIL
Requestor: Statistics
Active inmates 06/18/2001
County Of Conviction by current age & sex
|
MEN
|
WOMEN
|
| Age | Age | Age | Age | Men
| Age | Age | Age | Age |Women
|Grand
County Of Conviction|00-21 %|22-39 %|40-54 %|55-99 %|Total % |00-21 %|22-39 %|40-54 %|55-99 %|Total % |Total %
------------------------------------------------------------------------------------------------------------------------------------
Appling
| 0 0| 4 0| 4 0| 1 0| 9 0 | 0 0| 0 0| 0 0| 0 0| 0 0 | 9 0
Atkinson
| 0 0| 1 0| 2 0| 2 0| 5 0 | 0 0| 0 0| 1 1| 0 0| 1 0 | 6 0
Bacon
| 0 0| 6 0| 3 0| 0 0| 9 0 | 0 0| 0 0| 0 0| 0 0| 0 0 | 9 0
Baker
| 0 0| 1 0| 1 0| 0 0| 2 0 | 0 0| 0 0| 0 0| 0 0| 0 0 | 2 0
Baldwin
| 0 0| 17 1| 12 1| 1 0| 30 1 | 0 0| 1 1| 0 0| 0 0| 1 0 | 31 1
Banks
| 0 0| 2 0| 9 0| 2 0| 13 0 | 0 0| 0 0| 0 0| 0 0| 0 0 | 13 0
Barrow
| 0 0| 3 0| 9 0| 4 1| 16 0 | 0 0| 0 0| 1 1| 0 0| 1 0 | 17 0
Bartow
| 1 1| 27 1| 20 1| 2 0| 50 1 | 0 0| 2 2| 0 0| 0 0| 2 1 | 52 1
Ben Hill
| 0 0| 6 0| 9 0| 3 1| 18 0 | 0 0| 0 0| 0 0| 0 0| 0 0 | 18 0
Berrien
| 0 0| 4 0| 1 0| 0 0| 5 0 | 0 0| 0 0| 0 0| 0 0| 0 0 | 5 0
Bibb
| 3 2| 89 3| 84 4| 18 4| 194 3 | 1 11| 1 1| 2 2| 1 4| 5 2 | 199 3
Bleckley
| 0 0| 7 0| 4 0| 1 0| 12 0 | 0 0| 0 0| 1 1| 0 0| 1 0 | 13 0
Brantley
| 0 0| 1 0| 4 0| 2 0| 7 0 | 0 0| 0 0| 0 0| 0 0| 0 0 | 7 0
Brooks
| 0 0| 5 0| 4 0| 2 0| 11 0 | 0 0| 0 0| 0 0| 0 0| 0 0 | 11 0
Bryan
| 0 0| 9 0| 5 0| 1 0| 15 0 | 0 0| 0 0| 0 0| 1 4| 1 0 | 16 0
Bulloch
| 1 1| 16 1| 15 1| 0 0| 32 1 | 0 0| 1 1| 1 1| 1 4| 3 1 | 35 1
Burke
| 2 1| 15 0| 12 1| 2 0| 31 1 | 0 0| 0 0| 0 0| 0 0| 0 0 | 31 1
Butts
| 2 1| 21 1| 11 1| 2 0| 36 1 | 0 0| 2 2| 1 1| 0 0| 3 1 | 39 1
Calhoun
| 0 0| 2 0| 4 0| 1 0| 7 0 | 0 0| 0 0| 0 0| 0 0| 0 0 | 7 0
Camden
| 1 1| 20 1| 8 0| 0 0| 29 1 | 0 0| 0 0| 1 1| 0 0| 1 0 | 30 0
Candler
| 0 0| 1 0| 1 0| 0 0| 2 0 | 0 0| 0 0| 0 0| 0 0| 0 0 | 2 0
Carroll
| 1 1| 19 1| 13 1| 6 1| 39 1 | 0 0| 3 2| 1 1| 0 0| 4 2 | 43 1
Catoosa
| 0 0| 5 0| 8 0| 0 0| 13 0 | 0 0| 0 0| 0 0| 0 0| 0 0 | 13 0
Charlton
| 0 0| 0 0| 1 0| 0 0| 1 0 | 0 0| 2 2| 0 0| 0 0| 2 1 | 3 0
Chatham
| 8 4| 164 5| 113 5| 16 4| 301 5 | 0 0| 2 2| 1 1| 0 0| 3 1 | 304 5
Chattahoochee
| 0 0| 1 0| 2 0| 0 0| 3 0 | 0 0| 0 0| 0 0| 0 0| 0 0 | 3 0
Chatooga
| 0 0| 5 0| 6 0| 2 0| 13 0 | 0 0| 0 0| 1 1| 1 4| 2 1 | 15 0
Cherokee
| 1 1| 8 0| 21 1| 2 0| 32 1 | 0 0| 3 2| 0 0| 0 0| 3 1 | 35 1
Clarke
| 2 1| 39 1| 22 1| 8 2| 71 1 | 0 0| 2 2| 0 0| 1 4| 3 1 | 74 1
Clay
| 0 0| 1 0| 1 0| 0 0| 2 0 | 0 0| 0 0| 0 0| 0 0| 0 0 | 2 0
Clayton
| 6 3| 74 2| 39 2| 11 3| 130 2 | 1 11| 2 2| 2 2| 1 4| 6 2 | 136 2
Clinch
| 0 0| 1 0| 3 0| 0 0| 4 0 | 0 0| 0 0| 0 0| 0 0| 0 0 | 4 0
Cobb
| 8 4| 108 4| 75 4| 14 3| 205 4 | 0 0| 6 5| 3 3| 1 4| 10 4 | 215 4
Coffee
| 0 0| 8 0| 9 0| 2 0| 19 0 | 0 0| 1 1| 1 1| 0 0| 2 1 | 21 0
Colquit
| 3 2| 36 1| 24 1| 5 1| 68 1 | 0 0| 0 0| 1 1| 1 4| 2 1 | 70 1
Columbia
| 1 1| 5 0| 11 1| 2 0| 19 0 | 0 0| 0 0| 1 1| 0 0| 1 0 | 20 0
------------------------------------------------------------------------------------------------------------------------------------
(continued)
Page 25 Run 06/18/01
Georgia Department of Corrections Office of Planning and Analysis
Inmate statistical profile
Sample: ACTIVE PRISONERS SERVING LIFE EXCLUDING JAIL
Requestor:
Active inmates 06/18/2001
County Of Conviction by current age & sex
Statistics (continued)
|
MEN
|
WOMEN
|
| Age | Age | Age | Age | Men
| Age | Age | Age | Age |Women
|Grand
County Of Conviction|00-21 %|22-39 %|40-54 %|55-99 %|Total % |00-21 %|22-39 %|40-54 %|55-99 %|Total % |Total %
------------------------------------------------------------------------------------------------------------------------------------
Cook
| 0 0| 7 0| 3 0| 0 0| 10 0 | 0 0| 1 1| 0 0| 0 0| 1 0 | 11 0
Coweta
| 3 2| 24 1| 10 0| 3 1| 40 1 | 0 0| 2 2| 1 1| 0 0| 3 1 | 43 1
Crawford
| 0 0| 3 0| 0 0| 0 0| 3 0 | 0 0| 0 0| 0 0| 0 0| 0 0 | 3 0
Crisp
| 3 2| 14 0| 11 1| 2 0| 30 1 | 0 0| 3 2| 0 0| 1 4| 4 2 | 34 1
Dade
| 2 1| 6 0| 5 0| 3 1| 16 0 | 0 0| 0 0| 0 0| 0 0| 0 0 | 16 0
Dawson
| 0 0| 2 0| 4 0| 0 0| 6 0 | 0 0| 0 0| 0 0| 0 0| 0 0 | 6 0
Decatur
| 1 1| 21 1| 6 0| 1 0| 29 1 | 0 0| 1 1| 0 0| 0 0| 1 0 | 30 0
DeKalb
| 13 7| 248 8| 166 8| 25 6| 452 8 | 1 11| 3 2| 4 5| 1 4| 9 4 | 461 8
Dodge
| 0 0| 6 0| 4 0| 1 0| 11 0 | 0 0| 0 0| 0 0| 0 0| 0 0 | 11 0
Dooly
| 2 1| 8 0| 7 0| 0 0| 17 0 | 0 0| 0 0| 0 0| 0 0| 0 0 | 17 0
Dougherty
| 4 2| 73 2| 41 2| 5 1| 123 2 | 0 0| 4 3| 1 1| 0 0| 5 2 | 128 2
Douglas
| 4 2| 49 2| 19 1| 6 1| 78 1 | 0 0| 1 1| 1 1| 0 0| 2 1 | 80 1
Early
| 0 0| 10 0| 5 0| 2 0| 17 0 | 0 0| 0 0| 0 0| 0 0| 0 0 | 17 0
Effingham
| 0 0| 5 0| 4 0| 0 0| 9 0 | 0 0| 0 0| 0 0| 0 0| 0 0 | 9 0
Elbert
| 0 0| 12 0| 10 0| 1 0| 23 0 | 0 0| 1 1| 0 0| 0 0| 1 0 | 24 0
Emanuel
| 0 0| 8 0| 10 0| 3 1| 21 0 | 0 0| 0 0| 1 1| 0 0| 1 0 | 22 0
Evans
| 0 0| 7 0| 3 0| 2 0| 12 0 | 0 0| 0 0| 0 0| 0 0| 0 0 | 12 0
Fannin
| 0 0| 4 0| 5 0| 1 0| 10 0 | 0 0| 0 0| 0 0| 0 0| 0 0 | 10 0
Fayette
| 1 1| 10 0| 5 0| 0 0| 16 0 | 0 0| 0 0| 0 0| 0 0| 0 0 | 16 0
Floyd
| 1 1| 26 1| 27 1| 6 1| 60 1 | 2 22| 3 2| 2 2| 1 4| 8 3 | 68 1
Forsyth
| 0 0| 5 0| 9 0| 4 1| 18 0 | 0 0| 1 1| 1 1| 0 0| 2 1 | 20 0
Franklin
| 1 1| 2 0| 3 0| 1 0| 7 0 | 0 0| 0 0| 2 2| 1 4| 3 1 | 10 0
Fulton
| 30 17| 471 16| 318 15| 63 14| 882 15 | 0 0| 15 12| 8 9| 4 16| 27 11 | 909 15
Gilmer
| 0 0| 1 0| 2 0| 3 1| 6 0 | 0 0| 0 0| 0 0| 0 0| 0 0 | 6 0
Glynn
| 6 3| 33 1| 28 1| 4 1| 71 1 | 0 0| 2 2| 1 1| 0 0| 3 1 | 74 1
Gordon
| 0 0| 21 1| 13 1| 2 0| 36 1 | 0 0| 0 0| 1 1| 0 0| 1 0 | 37 1
Grady
| 5 3| 17 1| 10 0| 1 0| 33 1 | 0 0| 0 0| 0 0| 0 0| 0 0 | 33 1
Greene
| 0 0| 3 0| 5 0| 1 0| 9 0 | 0 0| 0 0| 0 0| 0 0| 0 0 | 9 0
Gwinnett
| 1 1| 66 2| 43 2| 9 2| 119 2 | 0 0| 2 2| 5 6| 1 4| 8 3 | 127 2
Habersham
| 1 1| 12 0| 10 0| 0 0| 23 0 | 0 0| 0 0| 0 0| 0 0| 0 0 | 23 0
Hall
| 3 2| 38 1| 41 2| 10 2| 92 2 | 1 11| 2 2| 2 2| 1 4| 6 2 | 98 2
Hancock
| 0 0| 3 0| 1 0| 0 0| 4 0 | 0 0| 0 0| 1 1| 0 0| 1 0 | 5 0
Haralson
| 0 0| 3 0| 2 0| 1 0| 6 0 | 0 0| 0 0| 0 0| 0 0| 0 0 | 6 0
Harris
| 1 1| 8 0| 3 0| 0 0| 12 0 | 0 0| 0 0| 0 0| 0 0| 0 0 | 12 0
Hart
| 0 0| 2 0| 3 0| 0 0| 5 0 | 0 0| 0 0| 0 0| 0 0| 0 0 | 5 0
------------------------------------------------------------------------------------------------------------------------------------
(continued)
Page 26 Run 06/18/01
Georgia Department of Corrections Office of Planning and Analysis
Inmate statistical profile
Sample: ACTIVE PRISONERS SERVING LIFE EXCLUDING JAIL
Requestor:
Active inmates 06/18/2001
County Of Conviction by current age & sex
Statistics (continued)
|
MEN
|
WOMEN
|
| Age | Age | Age | Age | Men
| Age | Age | Age | Age |Women
|Grand
County Of Conviction|00-21 %|22-39 %|40-54 %|55-99 %|Total % |00-21 %|22-39 %|40-54 %|55-99 %|Total % |Total %
------------------------------------------------------------------------------------------------------------------------------------
Heard
| 0 0| 2 0| 0 0| 3 1| 5 0 | 0 0| 0 0| 0 0| 0 0| 0 0 | 5 0
Henry
| 1 1| 23 1| 10 0| 1 0| 35 1 | 0 0| 1 1| 0 0| 0 0| 1 0 | 36 1
Houston
| 1 1| 38 1| 20 1| 3 1| 62 1 | 0 0| 3 2| 3 3| 1 4| 7 3 | 69 1
Irwin
| 0 0| 3 0| 1 0| 1 0| 5 0 | 0 0| 0 0| 0 0| 0 0| 0 0 | 5 0
Jackson
| 1 1| 6 0| 13 1| 1 0| 21 0 | 0 0| 1 1| 0 0| 0 0| 1 0 | 22 0
Jasper
| 0 0| 7 0| 2 0| 0 0| 9 0 | 0 0| 0 0| 1 1| 0 0| 1 0 | 10 0
Jeff Davis
| 0 0| 4 0| 4 0| 2 0| 10 0 | 0 0| 0 0| 0 0| 0 0| 0 0 | 10 0
Jefferson
| 0 0| 7 0| 7 0| 4 1| 18 0 | 0 0| 0 0| 0 0| 0 0| 0 0 | 18 0
Jenkins
| 0 0| 2 0| 4 0| 0 0| 6 0 | 0 0| 0 0| 0 0| 0 0| 0 0 | 6 0
Johnson
| 0 0| 9 0| 2 0| 1 0| 12 0 | 0 0| 1 1| 0 0| 0 0| 1 0 | 13 0
Jones
| 0 0| 1 0| 8 0| 3 1| 12 0 | 0 0| 0 0| 0 0| 0 0| 0 0 | 12 0
Lamar
| 1 1| 11 0| 8 0| 3 1| 23 0 | 0 0| 0 0| 1 1| 0 0| 1 0 | 24 0
Lanier
| 0 0| 1 0| 0 0| 0 0| 1 0 | 0 0| 0 0| 0 0| 0 0| 0 0 | 1 0
Laurens
| 1 1| 12 0| 8 0| 1 0| 22 0 | 0 0| 1 1| 2 2| 0 0| 3 1 | 25 0
Lee
| 0 0| 2 0| 0 0| 0 0| 2 0 | 1 11| 0 0| 0 0| 0 0| 1 0 | 3 0
Liberty
| 1 1| 19 1| 10 0| 4 1| 34 1 | 0 0| 2 2| 0 0| 0 0| 2 1 | 36 1
Lincoln
| 0 0| 3 0| 2 0| 0 0| 5 0 | 0 0| 0 0| 0 0| 0 0| 0 0 | 5 0
Long
| 2 1| 5 0| 4 0| 2 0| 13 0 | 0 0| 2 2| 0 0| 0 0| 2 1 | 15 0
Lowndes
| 0 0| 42 1| 27 1| 2 0| 71 1 | 0 0| 0 0| 2 2| 1 4| 3 1 | 74 1
Lumpkins
| 1 1| 3 0| 0 0| 2 0| 6 0 | 0 0| 0 0| 0 0| 0 0| 0 0 | 6 0
Macon
| 0 0| 16 1| 8 0| 0 0| 24 0 | 0 0| 0 0| 0 0| 0 0| 0 0 | 24 0
Madison
| 0 0| 9 0| 5 0| 2 0| 16 0 | 0 0| 2 2| 0 0| 0 0| 2 1 | 18 0
Marion
| 0 0| 2 0| 1 0| 0 0| 3 0 | 0 0| 0 0| 1 1| 0 0| 1 0 | 4 0
McDuffie
| 0 0| 27 1| 12 1| 4 1| 43 1 | 1 11| 0 0| 0 0| 0 0| 1 0 | 44 1
McIntosh
| 2 1| 7 0| 8 0| 0 0| 17 0 | 0 0| 0 0| 0 0| 0 0| 0 0 | 17 0
Meriwether
| 0 0| 10 0| 9 0| 4 1| 23 0 | 0 0| 2 2| 0 0| 1 4| 3 1 | 26 0
Miller
| 0 0| 1 0| 2 0| 0 0| 3 0 | 0 0| 0 0| 0 0| 0 0| 0 0 | 3 0
Mitchell
| 0 0| 12 0| 10 0| 2 0| 24 0 | 0 0| 2 2| 0 0| 0 0| 2 1 | 26 0
Monroe
| 0 0| 11 0| 9 0| 2 0| 22 0 | 0 0| 1 1| 0 0| 0 0| 1 0 | 23 0
Montgomery
| 0 0| 0 0| 3 0| 0 0| 3 0 | 0 0| 0 0| 0 0| 0 0| 0 0 | 3 0
Morgan
| 0 0| 11 0| 3 0| 0 0| 14 0 | 0 0| 1 1| 0 0| 0 0| 1 0 | 15 0
Murray
| 2 1| 3 0| 6 0| 5 1| 16 0 | 0 0| 0 0| 0 0| 0 0| 0 0 | 16 0
Muscogee
| 2 1| 86 3| 76 4| 12 3| 176 3 | 0 0| 4 3| 2 2| 0 0| 6 2 | 182 3
Newton
| 1 1| 45 1| 15 1| 4 1| 65 1 | 0 0| 2 2| 0 0| 0 0| 2 1 | 67 1
Oconee
| 0 0| 8 0| 4 0| 0 0| 12 0 | 0 0| 0 0| 0 0| 0 0| 0 0 | 12 0
------------------------------------------------------------------------------------------------------------------------------------
(continued)
Page 27 Run 06/18/01
Georgia Department of Corrections Office of Planning and Analysis
Inmate statistical profile
Sample: ACTIVE PRISONERS SERVING LIFE EXCLUDING JAIL
Requestor:
Active inmates 06/18/2001
County Of Conviction by current age & sex
Statistics (continued)
|
MEN
|
WOMEN
|
| Age | Age | Age | Age | Men
| Age | Age | Age | Age |Women
|Grand
County Of Conviction|00-21 %|22-39 %|40-54 %|55-99 %|Total % |00-21 %|22-39 %|40-54 %|55-99 %|Total % |Total %
------------------------------------------------------------------------------------------------------------------------------------
Oglethrope
| 0 0| 4 0| 4 0| 1 0| 9 0 | 0 0| 0 0| 0 0| 0 0| 0 0 | 9 0
Paulding
| 0 0| 4 0| 6 0| 2 0| 12 0 | 0 0| 1 1| 0 0| 0 0| 1 0 | 13 0
Peach
| 0 0| 6 0| 3 0| 0 0| 9 0 | 0 0| 0 0| 1 1| 0 0| 1 0 | 10 0
Pickens
| 0 0| 2 0| 2 0| 1 0| 5 0 | 0 0| 0 0| 1 1| 0 0| 1 0 | 6 0
Pierce
| 3 2| 2 0| 4 0| 1 0| 10 0 | 0 0| 0 0| 0 0| 0 0| 0 0 | 10 0
Pike
| 0 0| 1 0| 1 0| 0 0| 2 0 | 0 0| 0 0| 0 0| 0 0| 0 0 | 2 0
Polk
| 1 1| 14 0| 6 0| 3 1| 24 0 | 0 0| 0 0| 0 0| 0 0| 0 0 | 24 0
Pulaski
| 0 0| 7 0| 1 0| 0 0| 8 0 | 0 0| 1 1| 0 0| 0 0| 1 0 | 9 0
Putnam
| 0 0| 20 1| 14 1| 3 1| 37 1 | 0 0| 0 0| 0 0| 0 0| 0 0 | 37 1
Quitman
| 0 0| 4 0| 0 0| 0 0| 4 0 | 0 0| 0 0| 0 0| 0 0| 0 0 | 4 0
Rabun
| 0 0| 6 0| 3 0| 0 0| 9 0 | 0 0| 0 0| 0 0| 0 0| 0 0 | 9 0
Randolph
| 0 0| 3 0| 2 0| 2 0| 7 0 | 0 0| 0 0| 0 0| 0 0| 0 0 | 7 0
Richmond
| 9 5| 160 5| 74 3| 14 3| 257 4 | 0 0| 8 7| 8 9| 1 4| 17 7 | 274 5
Rockdale
| 1 1| 10 0| 12 1| 5 1| 28 0 | 0 0| 1 1| 0 0| 0 0| 1 0 | 29 0
Schely
| 0 0| 3 0| 2 0| 0 0| 5 0 | 0 0| 0 0| 0 0| 0 0| 0 0 | 5 0
Screven
| 0 0| 5 0| 4 0| 3 1| 12 0 | 0 0| 0 0| 0 0| 0 0| 0 0 | 12 0
Seminole
| 1 1| 4 0| 4 0| 2 0| 11 0 | 0 0| 1 1| 0 0| 0 0| 1 0 | 12 0
Spalding
| 2 1| 41 1| 24 1| 6 1| 73 1 | 1 11| 2 2| 2 2| 1 4| 6 2 | 79 1
Stephens
| 0 0| 3 0| 4 0| 3 1| 10 0 | 0 0| 0 0| 0 0| 0 0| 0 0 | 10 0
Stewart
| 0 0| 2 0| 1 0| 0 0| 3 0 | 0 0| 0 0| 2 2| 0 0| 2 1 | 5 0
Sumter
| 0 0| 5 0| 13 1| 1 0| 19 0 | 0 0| 0 0| 1 1| 0 0| 1 0 | 20 0
Talbot
| 2 1| 4 0| 1 0| 0 0| 7 0 | 0 0| 0 0| 1 1| 0 0| 1 0 | 8 0
Taliaferro
| 0 0| 0 0| 3 0| 0 0| 3 0 | 0 0| 0 0| 0 0| 0 0| 0 0 | 3 0
Tattnall
| 0 0| 17 1| 13 1| 2 0| 32 1 | 0 0| 0 0| 1 1| 0 0| 1 0 | 33 1
Taylor
| 3 2| 9 0| 5 0| 0 0| 17 0 | 0 0| 0 0| 0 0| 0 0| 0 0 | 17 0
Telfair
| 1 1| 6 0| 2 0| 0 0| 9 0 | 0 0| 0 0| 1 1| 0 0| 1 0 | 10 0
Terrell
| 1 1| 12 0| 2 0| 2 0| 17 0 | 0 0| 0 0| 0 0| 0 0| 0 0 | 17 0
Thomas
| 1 1| 17 1| 22 1| 3 1| 43 1 | 0 0| 1 1| 1 1| 0 0| 2 1 | 45 1
Tift
| 6 3| 32 1| 24 1| 4 1| 66 1 | 0 0| 0 0| 2 2| 1 4| 3 1 | 69 1
Toombs
| 4 2| 20 1| 10 0| 2 0| 36 1 | 0 0| 2 2| 0 0| 0 0| 2 1 | 38 1
Towns
| 0 0| 1 0| 1 0| 0 0| 2 0 | 0 0| 0 0| 0 0| 0 0| 0 0 | 2 0
Treutlen
| 0 0| 3 0| 4 0| 0 0| 7 0 | 0 0| 0 0| 0 0| 0 0| 0 0 | 7 0
Troup
| 2 1| 25 1| 27 1| 7 2| 61 1 | 0 0| 2 2| 1 1| 0 0| 3 1 | 64 1
Turner
| 0 0| 7 0| 7 0| 1 0| 15 0 | 0 0| 0 0| 0 0| 0 0| 0 0 | 15 0
Twiggs
| 0 0| 3 0| 5 0| 1 0| 9 0 | 0 0| 0 0| 0 0| 0 0| 0 0 | 9 0
------------------------------------------------------------------------------------------------------------------------------------
(continued)
Page 28 Run 06/18/01
Georgia Department of Corrections Office of Planning and Analysis
Inmate statistical profile
Sample: ACTIVE PRISONERS SERVING LIFE EXCLUDING JAIL
Requestor:
Active inmates 06/18/2001
County Of Conviction by current age & sex
Statistics (continued)
|
MEN
|
WOMEN
|
| Age | Age | Age | Age | Men
| Age | Age | Age | Age |Women
|Grand
County Of Conviction|00-21 %|22-39 %|40-54 %|55-99 %|Total % |00-21 %|22-39 %|40-54 %|55-99 %|Total % |Total %
------------------------------------------------------------------------------------------------------------------------------------
Union
| 0 0| 0 0| 1 0| 0 0| 1 0 | 0 0| 0 0| 0 0| 0 0| 0 0 | 1 0
Upson
| 1 1| 7 0| 4 0| 1 0| 13 0 | 0 0| 0 0| 1 1| 0 0| 1 0 | 14 0
Walker
| 0 0| 14 0| 11 1| 4 1| 29 1 | 0 0| 1 1| 1 1| 0 0| 2 1 | 31 1
Walton
| 3 2| 29 1| 21 1| 4 1| 57 1 | 0 0| 1 1| 0 0| 0 0| 1 0 | 58 1
Ware
| 0 0| 14 0| 11 1| 3 1| 28 0 | 0 0| 0 0| 1 1| 0 0| 1 0 | 29 0
Warren
| 0 0| 4 0| 6 0| 1 0| 11 0 | 0 0| 0 0| 0 0| 0 0| 0 0 | 11 0
Washington
| 0 0| 7 0| 6 0| 2 0| 15 0 | 0 0| 2 2| 0 0| 0 0| 2 1 | 17 0
Wayne
| 0 0| 7 0| 8 0| 2 0| 17 0 | 0 0| 1 1| 0 0| 0 0| 1 0 | 18 0
Webster
| 0 0| 1 0| 0 0| 0 0| 1 0 | 0 0| 0 0| 0 0| 0 0| 0 0 | 1 0
Wheeler
| 0 0| 3 0| 3 0| 1 0| 7 0 | 0 0| 0 0| 0 0| 1 4| 1 0 | 8 0
White
| 0 0| 3 0| 1 0| 1 0| 5 0 | 0 0| 0 0| 0 0| 0 0| 0 0 | 5 0
Whitfield
| 1 1| 24 1| 23 1| 8 2| 56 1 | 0 0| 5 4| 1 1| 0 0| 6 2 | 62 1
Wilcox
| 0 0| 1 0| 6 0| 1 0| 8 0 | 0 0| 0 0| 0 0| 0 0| 0 0 | 8 0
Wilkes
| 0 0| 6 0| 6 0| 1 0| 13 0 | 0 0| 0 0| 0 0| 0 0| 0 0 | 13 0
Wilkinson
| 0 0| 7 0| 1 0| 0 0| 8 0 | 0 0| 0 0| 0 0| 0 0| 0 0 | 8 0
Worth
| 0 0| 16 1| 5 0| 2 0| 23 0 | 0 0| 0 0| 0 0| 0 0| 0 0 | 23 0
------------------------------------------------------------------------------------------------------------------------------------
Total reported
| 180 100| 3012 100| 2130 100| 440 100| 5762 100 | 9 100| 123 100| 88 100| 25 100| 245 100 | 6007 100
|
|
|
|
|
|
|
|
|
|
|
Percent reported | 100.0| 100.0| 100.0| 100.0| 100.0 | 100.0| 100.0| 100.0| 100.0| 100.0 | 100.0
|
|
|
|
|
|
|
|
|
|
|
|
|
|
|
|
|
|
|
|
|
|
Not reported
|0|0|0|0|0
|0|0|0|0|0
|0
------------------------------------------------------------------------------------------------------------------------------------
Total
| 180 | 3012 | 2130 | 440 | 5762
| 9 | 123 | 88 | 25 | 245
| 6007
Page 29 Run 06/18/01
Georgia Department of Corrections Office of Planning and Analysis
Inmate statistical profile
Sample: ACTIVE PRISONERS SERVING LIFE EXCLUDING JAIL
Requestor: Statistics
Active inmates 06/18/2001
Circ Of Conviction by current age & sex
|
MEN
|
WOMEN
|
| Age | Age | Age | Age | Men
| Age | Age | Age | Age |Women
|Grand
Circ Of Conviction |00-21 %|22-39 %|40-54 %|55-99 %|Total % |00-21 %|22-39 %|40-54 %|55-99 %|Total % |Total %
------------------------------------------------------------------------------------------------------------------------------------
Alapaha
| 0 0| 14 0| 9 0| 2 0| 25 0 | 0 0| 1 1| 1 1| 0 0| 2 1 | 27 0
Alcovy
| 4 2| 74 2| 36 2| 8 2| 122 2 | 0 0| 3 2| 0 0| 0 0| 3 1 | 125 2
Atlanta
| 30 17| 471 16| 318 15| 63 14| 882 15 | 0 0| 15 12| 8 9| 4 16| 27 11 | 909 15
Atlantic
| 5 3| 64 2| 43 2| 11 3| 123 2 | 0 0| 4 3| 1 1| 1 4| 6 2 | 129 2
Augusta
| 12 7| 180 6| 97 5| 18 4| 307 5 | 0 0| 8 7| 9 10| 1 4| 18 7 | 325 5
Blue Ridge
| 1 1| 8 0| 21 1| 2 0| 32 1 | 0 0| 3 2| 0 0| 0 0| 3 1 | 35 1
Brunswick
| 7 4| 68 2| 52 2| 9 2| 136 2 | 0 0| 3 2| 2 2| 0 0| 5 2 | 141 2
Chattahoochee
| 8 4| 110 4| 88 4| 12 3| 218 4 | 0 0| 4 3| 4 5| 0 0| 8 3 | 226 4
Cherokee
| 1 1| 48 2| 33 2| 4 1| 86 1 | 0 0| 2 2| 1 1| 0 0| 3 1 | 89 1
Clayton
| 6 3| 74 2| 39 2| 11 3| 130 2 | 1 11| 2 2| 2 2| 1 4| 6 2 | 136 2
Cobb
| 8 4| 108 4| 75 4| 14 3| 205 4 | 0 0| 6 5| 3 3| 1 4| 10 4 | 215 4
Conasauga
| 3 2| 27 1| 29 1| 13 3| 72 1 | 0 0| 5 4| 1 1| 0 0| 6 2 | 78 1
Cordele
| 5 3| 29 1| 33 2| 6 1| 73 1 | 0 0| 3 2| 0 0| 1 4| 4 2 | 77 1
Coweta
| 6 3| 80 3| 59 3| 23 5| 168 3 | 0 0| 9 7| 3 3| 1 4| 13 5 | 181 3
Dougherty
| 4 2| 73 2| 41 2| 5 1| 123 2 | 0 0| 4 3| 1 1| 0 0| 5 2 | 128 2
Dublin
| 1 1| 27 1| 19 1| 3 1| 50 1 | 0 0| 2 2| 2 2| 0 0| 4 2 | 54 1
Eastern
| 8 4| 164 5| 113 5| 16 4| 301 5 | 0 0| 2 2| 1 1| 0 0| 3 1 | 304 5
Flint
| 1 1| 23 1| 10 0| 1 0| 35 1 | 0 0| 1 1| 0 0| 0 0| 1 0 | 36 1
Griffin
| 4 2| 59 2| 34 2| 7 2| 104 2 | 1 11| 2 2| 3 3| 1 4| 7 3 | 111 2
Gwinnett
| 1 1| 66 2| 43 2| 9 2| 119 2 | 0 0| 2 2| 5 6| 1 4| 8 3 | 127 2
Houston
| 1 1| 38 1| 20 1| 3 1| 62 1 | 0 0| 3 2| 3 3| 1 4| 7 3 | 69 1
Lookout Mountain | 2 1| 30 1| 30 1| 9 2| 71 1 | 0 0| 1 1| 2 2| 1 4| 4 2 | 75 1
Macon
| 3 2| 98 3| 87 4| 18 4| 206 4 | 1 11| 1 1| 3 3| 1 4| 6 2 | 212 4
Middle
| 4 2| 43 1| 34 2| 11 3| 92 2 | 0 0| 4 3| 1 1| 0 0| 5 2 | 97 2
Mountain
| 1 1| 21 1| 17 1| 3 1| 42 1 | 0 0| 0 0| 0 0| 0 0| 0 0 | 42 1
Northeastern
| 3 2| 40 1| 45 2| 10 2| 98 2 | 1 11| 2 2| 2 2| 1 4| 6 2 | 104 2
Northern
| 1 1| 29 1| 25 1| 5 1| 60 1 | 0 0| 3 2| 2 2| 1 4| 6 2 | 66 1
Ocmulgee
| 0 0| 69 2| 46 2| 8 2| 123 2 | 0 0| 2 2| 2 2| 0 0| 4 2 | 127 2
Oconee
| 1 1| 29 1| 17 1| 3 1| 50 1 | 0 0| 1 1| 2 2| 1 4| 4 2 | 54 1
Ogeechee
| 1 1| 28 1| 27 1| 3 1| 59 1 | 0 0| 1 1| 1 1| 1 4| 3 1 | 62 1
Pataula
| 2 1| 35 1| 16 1| 8 2| 61 1 | 0 0| 1 1| 0 0| 0 0| 1 0 | 62 1
Piedmont
| 1 1| 11 0| 31 1| 7 2| 50 1 | 0 0| 1 1| 1 1| 0 0| 2 1 | 52 1
Rome
| 1 1| 26 1| 27 1| 6 1| 60 1 | 2 22| 3 2| 2 2| 1 4| 8 3 | 68 1
South Georgia
| 6 3| 53 2| 31 1| 5 1| 95 2 | 0 0| 3 2| 0 0| 0 0| 3 1 | 98 2
Southern
| 4 2| 100 3| 77 4| 12 3| 193 3 | 0 0| 1 1| 4 5| 2 8| 7 3 | 200 3
Southwestern
| 0 0| 29 1| 24 1| 1 0| 54 1 | 1 11| 0 0| 3 3| 0 0| 4 2 | 58 1
------------------------------------------------------------------------------------------------------------------------------------
(continued)
Page 30 Run 06/18/01
Georgia Department of Corrections Office of Planning and Analysis
Inmate statistical profile
Sample: ACTIVE PRISONERS SERVING LIFE EXCLUDING JAIL
Requestor:
Active inmates 06/18/2001
Circ Of Conviction by current age & sex
Statistics (continued)
|
MEN
|
WOMEN
|
| Age | Age | Age | Age | Men
| Age | Age | Age | Age |Women
|Grand
Circ Of Conviction |00-21 %|22-39 %|40-54 %|55-99 %|Total % |00-21 %|22-39 %|40-54 %|55-99 %|Total % |Total %
------------------------------------------------------------------------------------------------------------------------------------
Stone Mountain
| 13 7| 248 8| 166 8| 25 6| 452 8 | 1 11| 3 2| 4 5| 1 4| 9 4 | 461 8
Tallapoosa
| 1 1| 21 1| 14 1| 6 1| 42 1 | 0 0| 1 1| 0 0| 0 0| 1 0 | 43 1
Tifton
| 6 3| 58 2| 37 2| 8 2| 109 2 | 0 0| 0 0| 2 2| 1 4| 3 1 | 112 2
Toombs
| 0 0| 40 1| 29 1| 6 1| 75 1 | 1 11| 0 0| 0 0| 0 0| 1 0 | 76 1
Waycross
| 3 2| 31 1| 32 2| 8 2| 74 1 | 0 0| 3 2| 2 2| 0 0| 5 2 | 79 1
Western
| 2 1| 47 2| 26 1| 8 2| 83 1 | 0 0| 2 2| 0 0| 1 4| 3 1 | 86 1
Rockdale
| 1 1| 10 0| 12 1| 5 1| 28 0 | 0 0| 1 1| 0 0| 0 0| 1 0 | 29 0
Douglas
| 4 2| 49 2| 19 1| 6 1| 78 1 | 0 0| 1 1| 1 1| 0 0| 2 1 | 80 1
Appalachian
| 0 0| 7 0| 9 0| 5 1| 21 0 | 0 0| 0 0| 1 1| 0 0| 1 0 | 22 0
Enotah
| 1 1| 7 0| 3 0| 3 1| 14 0 | 0 0| 0 0| 0 0| 0 0| 0 0 | 14 0
Forsyth-Bell
| 0 0| 5 0| 9 0| 4 1| 18 0 | 0 0| 1 1| 1 1| 0 0| 2 1 | 20 0
Towaliga
| 3 2| 43 1| 28 1| 7 2| 81 1 | 0 0| 3 2| 2 2| 0 0| 5 2 | 86 1
------------------------------------------------------------------------------------------------------------------------------------
Total reported
| 180 100| 3012 100| 2130 100| 440 100| 5762 100 | 9 100| 123 100| 88 100| 25 100| 245 100 | 6007 100
|
|
|
|
|
|
|
|
|
|
|
Percent reported | 100.0| 100.0| 100.0| 100.0| 100.0 | 100.0| 100.0| 100.0| 100.0| 100.0 | 100.0
|
|
|
|
|
|
|
|
|
|
|
|
|
|
|
|
|
|
|
|
|
|
Not reported
|0|0|0|0|0
|0|0|0|0|0
|0
------------------------------------------------------------------------------------------------------------------------------------
Total
| 180 | 3012 | 2130 | 440 | 5762
| 9 | 123 | 88 | 25 | 245
| 6007
Page 31 Run 06/18/01
Georgia Department of Corrections Office of Planning and Analysis
Inmate statistical profile
Sample: ACTIVE PRISONERS SERVING LIFE EXCLUDING JAIL
Requestor: Statistics
Active inmates 06/18/2001
Home County by current age & sex
|
MEN
|
WOMEN
|
| Age | Age | Age | Age | Men
| Age | Age | Age | Age |Women
|Grand
Home County
|00-21 %|22-39 %|40-54 %|55-99 %|Total % |00-21 %|22-39 %|40-54 %|55-99 %|Total % |Total %
------------------------------------------------------------------------------------------------------------------------------------
Appling
| 0 0| 4 0| 5 0| 1 0| 10 0 | 0 0| 0 0| 0 0| 0 0| 0 0 | 10 0
Atkinson
| 0 0| 1 0| 1 0| 3 1| 5 0 | 0 0| 0 0| 0 0| 0 0| 0 0 | 5 0
Bacon
| 0 0| 5 0| 5 0| 1 0| 11 0 | 0 0| 0 0| 0 0| 0 0| 0 0 | 11 0
Baker
| 0 0| 1 0| 2 0| 0 0| 3 0 | 0 0| 0 0| 0 0| 0 0| 0 0 | 3 0
Baldwin
| 0 0| 15 1| 8 0| 0 0| 23 0 | 0 0| 1 1| 0 0| 1 4| 2 1 | 25 0
Banks
| 0 0| 2 0| 4 0| 1 0| 7 0 | 0 0| 1 1| 0 0| 0 0| 1 0 | 8 0
Barrow
| 0 0| 6 0| 8 0| 2 1| 16 0 | 0 0| 0 0| 1 1| 0 0| 1 0 | 17 0
Bartow
| 1 1| 19 1| 15 1| 5 1| 40 1 | 1 13| 3 3| 0 0| 0 0| 4 2 | 44 1
Ben Hill
| 0 0| 4 0| 7 0| 3 1| 14 0 | 0 0| 0 0| 1 1| 0 0| 1 0 | 15 0
Berrien
| 0 0| 4 0| 1 0| 1 0| 6 0 | 0 0| 0 0| 0 0| 0 0| 0 0 | 6 0
Bibb
| 3 2| 81 3| 78 4| 20 5| 182 4 | 1 13| 4 3| 3 4| 0 0| 8 4 | 190 4
Bleckley
| 0 0| 8 0| 4 0| 1 0| 13 0 | 0 0| 0 0| 1 1| 0 0| 1 0 | 14 0
Brantley
| 0 0| 2 0| 2 0| 0 0| 4 0 | 0 0| 0 0| 0 0| 0 0| 0 0 | 4 0
Brooks
| 0 0| 7 0| 2 0| 1 0| 10 0 | 0 0| 0 0| 0 0| 0 0| 0 0 | 10 0
Bryan
| 1 1| 7 0| 4 0| 1 0| 13 0 | 0 0| 0 0| 0 0| 0 0| 0 0 | 13 0
Bulloch
| 1 1| 11 0| 10 1| 0 0| 22 0 | 0 0| 0 0| 1 1| 1 4| 2 1 | 24 0
Burke
| 1 1| 9 0| 7 0| 3 1| 20 0 | 0 0| 0 0| 0 0| 0 0| 0 0 | 20 0
Butts
| 0 0| 23 1| 7 0| 2 1| 32 1 | 0 0| 1 1| 1 1| 0 0| 2 1 | 34 1
Calhoun
| 0 0| 4 0| 3 0| 1 0| 8 0 | 0 0| 0 0| 0 0| 0 0| 0 0 | 8 0
Camden
| 1 1| 17 1| 6 0| 0 0| 24 0 | 0 0| 0 0| 1 1| 0 0| 1 0 | 25 0
Candler
| 0 0| 2 0| 1 0| 0 0| 3 0 | 0 0| 0 0| 0 0| 0 0| 0 0 | 3 0
Carroll
| 0 0| 22 1| 11 1| 9 2| 42 1 | 0 0| 2 2| 1 1| 0 0| 3 1 | 45 1
Catoosa
| 0 0| 2 0| 6 0| 1 0| 9 0 | 0 0| 0 0| 0 0| 0 0| 0 0 | 9 0
Charlton
| 0 0| 0 0| 1 0| 0 0| 1 0 | 0 0| 1 1| 0 0| 0 0| 1 0 | 2 0
Chatham
| 8 5| 154 6| 100 5| 15 4| 277 5 | 0 0| 2 2| 1 1| 1 4| 4 2 | 281 5
Chattahoochee
| 0 0| 1 0| 1 0| 0 0| 2 0 | 0 0| 0 0| 0 0| 0 0| 0 0 | 2 0
Chatooga
| 0 0| 3 0| 5 0| 1 0| 9 0 | 0 0| 0 0| 1 1| 1 4| 2 1 | 11 0
Cherokee
| 1 1| 8 0| 16 1| 1 0| 26 1 | 0 0| 2 2| 0 0| 0 0| 2 1 | 28 1
Clarke
| 3 2| 43 2| 20 1| 3 1| 69 1 | 0 0| 2 2| 0 0| 2 8| 4 2 | 73 1
Clay
| 0 0| 1 0| 1 0| 0 0| 2 0 | 0 0| 0 0| 0 0| 0 0| 0 0 | 2 0
Clayton
| 6 4| 61 2| 47 2| 8 2| 122 2 | 1 13| 3 3| 1 1| 1 4| 6 3 | 128 2
Clinch
| 0 0| 1 0| 1 0| 0 0| 2 0 | 0 0| 0 0| 0 0| 0 0| 0 0 | 2 0
Cobb
| 6 4| 88 3| 71 4| 8 2| 173 3 | 0 0| 5 4| 1 1| 0 0| 6 3 | 179 3
Coffee
| 0 0| 11 0| 3 0| 3 1| 17 0 | 0 0| 1 1| 2 3| 1 4| 4 2 | 21 0
Colquit
| 5 3| 26 1| 18 1| 3 1| 52 1 | 0 0| 0 0| 1 1| 0 0| 1 0 | 53 1
Columbia
| 0 0| 9 0| 8 0| 0 0| 17 0 | 0 0| 0 0| 2 3| 0 0| 2 1 | 19 0
------------------------------------------------------------------------------------------------------------------------------------
(continued)
Page 32 Run 06/18/01
Georgia Department of Corrections Office of Planning and Analysis
Inmate statistical profile
Sample: ACTIVE PRISONERS SERVING LIFE EXCLUDING JAIL
Requestor:
Active inmates 06/18/2001
Home County by current age & sex
Statistics (continued)
|
MEN
|
WOMEN
|
| Age | Age | Age | Age | Men
| Age | Age | Age | Age |Women
|Grand
Home County
|00-21 %|22-39 %|40-54 %|55-99 %|Total % |00-21 %|22-39 %|40-54 %|55-99 %|Total % |Total %
------------------------------------------------------------------------------------------------------------------------------------
Cook
| 0 0| 6 0| 3 0| 1 0| 10 0 | 0 0| 1 1| 0 0| 0 0| 1 0 | 11 0
Coweta
| 3 2| 19 1| 10 1| 1 0| 33 1 | 0 0| 2 2| 1 1| 0 0| 3 1 | 36 1
Crawford
| 0 0| 1 0| 1 0| 0 0| 2 0 | 0 0| 0 0| 0 0| 0 0| 0 0 | 2 0
Crisp
| 3 2| 13 0| 7 0| 2 1| 25 0 | 0 0| 3 3| 0 0| 0 0| 3 1 | 28 1
Dade
| 1 1| 3 0| 2 0| 3 1| 9 0 | 0 0| 0 0| 0 0| 0 0| 0 0 | 9 0
Dawson
| 0 0| 2 0| 1 0| 0 0| 3 0 | 0 0| 0 0| 0 0| 0 0| 0 0 | 3 0
Decatur
| 3 2| 13 0| 5 0| 0 0| 21 0 | 0 0| 0 0| 0 0| 0 0| 0 0 | 21 0
DeKalb
| 15 9| 220 8| 128 7| 27 7| 390 8 | 1 13| 4 3| 2 3| 2 8| 9 4 | 399 7
Dodge
| 0 0| 7 0| 6 0| 0 0| 13 0 | 0 0| 0 0| 0 0| 0 0| 0 0 | 13 0
Dooly
| 2 1| 7 0| 4 0| 0 0| 13 0 | 0 0| 0 0| 0 0| 0 0| 0 0 | 13 0
Dougherty
| 4 2| 68 2| 43 2| 2 1| 117 2 | 0 0| 5 4| 1 1| 1 4| 7 3 | 124 2
Douglas
| 1 1| 20 1| 13 1| 2 1| 36 1 | 0 0| 1 1| 1 1| 0 0| 2 1 | 38 1
Early
| 0 0| 7 0| 5 0| 1 0| 13 0 | 0 0| 0 0| 0 0| 0 0| 0 0 | 13 0
Effingham
| 0 0| 5 0| 3 0| 0 0| 8 0 | 0 0| 0 0| 0 0| 0 0| 0 0 | 8 0
Elbert
| 0 0| 10 0| 10 1| 1 0| 21 0 | 0 0| 1 1| 0 0| 0 0| 1 0 | 22 0
Emanuel
| 0 0| 9 0| 6 0| 2 1| 17 0 | 0 0| 0 0| 1 1| 0 0| 1 0 | 18 0
Evans
| 0 0| 8 0| 3 0| 1 0| 12 0 | 0 0| 0 0| 0 0| 0 0| 0 0 | 12 0
Fannin
| 0 0| 5 0| 3 0| 1 0| 9 0 | 0 0| 0 0| 0 0| 0 0| 0 0 | 9 0
Fayette
| 0 0| 3 0| 3 0| 0 0| 6 0 | 0 0| 0 0| 0 0| 0 0| 0 0 | 6 0
Floyd
| 1 1| 29 1| 24 1| 3 1| 57 1 | 1 13| 3 3| 2 3| 1 4| 7 3 | 64 1
Forsyth
| 0 0| 6 0| 4 0| 2 1| 12 0 | 0 0| 0 0| 1 1| 0 0| 1 0 | 13 0
Franklin
| 0 0| 2 0| 4 0| 0 0| 6 0 | 0 0| 0 0| 0 0| 1 4| 1 0 | 7 0
Fulton
| 30 18| 509 19| 361 19| 58 15| 958 18 | 0 0| 17 15| 9 11| 3 13| 29 13 | 987 18
Gilmer
| 0 0| 1 0| 3 0| 2 1| 6 0 | 0 0| 0 0| 0 0| 0 0| 0 0 | 6 0
Glascock
| 0 0| 0 0| 1 0| 0 0| 1 0 | 0 0| 0 0| 0 0| 0 0| 0 0 | 1 0
Glynn
| 4 2| 29 1| 27 1| 4 1| 64 1 | 0 0| 1 1| 1 1| 0 0| 2 1 | 66 1
Gordon
| 0 0| 20 1| 11 1| 2 1| 33 1 | 0 0| 0 0| 1 1| 0 0| 1 0 | 34 1
Grady
| 3 2| 14 1| 8 0| 0 0| 25 0 | 0 0| 0 0| 0 0| 0 0| 0 0 | 25 0
Greene
| 0 0| 4 0| 3 0| 1 0| 8 0 | 0 0| 0 0| 1 1| 0 0| 1 0 | 9 0
Gwinnett
| 2 1| 63 2| 41 2| 12 3| 118 2 | 0 0| 3 3| 2 3| 0 0| 5 2 | 123 2
Habersham
| 0 0| 7 0| 9 0| 0 0| 16 0 | 0 0| 0 0| 0 0| 0 0| 0 0 | 16 0
Hall
| 2 1| 26 1| 39 2| 10 3| 77 1 | 1 13| 1 1| 2 3| 1 4| 5 2 | 82 2
Hancock
| 1 1| 2 0| 2 0| 1 0| 6 0 | 0 0| 0 0| 1 1| 0 0| 1 0 | 7 0
Haralson
| 0 0| 1 0| 1 0| 1 0| 3 0 | 0 0| 1 1| 0 0| 0 0| 1 0 | 4 0
Harris
| 1 1| 6 0| 2 0| 0 0| 9 0 | 0 0| 0 0| 0 0| 0 0| 0 0 | 9 0
------------------------------------------------------------------------------------------------------------------------------------
(continued)
Page 33 Run 06/18/01
Georgia Department of Corrections Office of Planning and Analysis
Inmate statistical profile
Sample: ACTIVE PRISONERS SERVING LIFE EXCLUDING JAIL
Requestor:
Active inmates 06/18/2001
Home County by current age & sex
Statistics (continued)
|
MEN
|
WOMEN
|
| Age | Age | Age | Age | Men
| Age | Age | Age | Age |Women
|Grand
Home County
|00-21 %|22-39 %|40-54 %|55-99 %|Total % |00-21 %|22-39 %|40-54 %|55-99 %|Total % |Total %
------------------------------------------------------------------------------------------------------------------------------------
Hart
| 0 0| 1 0| 3 0| 0 0| 4 0 | 0 0| 0 0| 1 1| 0 0| 1 0 | 5 0
Heard
| 0 0| 1 0| 1 0| 2 1| 4 0 | 0 0| 0 0| 0 0| 0 0| 0 0 | 4 0
Henry
| 2 1| 20 1| 9 0| 5 1| 36 1 | 0 0| 1 1| 2 3| 0 0| 3 1 | 39 1
Houston
| 1 1| 39 1| 23 1| 5 1| 68 1 | 0 0| 2 2| 4 5| 0 0| 6 3 | 74 1
Irwin
| 0 0| 5 0| 4 0| 0 0| 9 0 | 0 0| 0 0| 0 0| 0 0| 0 0 | 9 0
Jackson
| 1 1| 9 0| 9 0| 7 2| 26 1 | 0 0| 0 0| 0 0| 0 0| 0 0 | 26 0
Jasper
| 0 0| 9 0| 2 0| 1 0| 12 0 | 0 0| 0 0| 0 0| 0 0| 0 0 | 12 0
Jeff Davis
| 1 1| 5 0| 2 0| 1 0| 9 0 | 0 0| 0 0| 0 0| 0 0| 0 0 | 9 0
Jefferson
| 0 0| 4 0| 3 0| 2 1| 9 0 | 0 0| 1 1| 0 0| 0 0| 1 0 | 10 0
Jenkins
| 0 0| 0 0| 6 0| 0 0| 6 0 | 0 0| 0 0| 0 0| 0 0| 0 0 | 6 0
Johnson
| 0 0| 3 0| 2 0| 0 0| 5 0 | 0 0| 0 0| 0 0| 0 0| 0 0 | 5 0
Jones
| 0 0| 0 0| 5 0| 1 0| 6 0 | 0 0| 1 1| 0 0| 0 0| 1 0 | 7 0
Lamar
| 0 0| 9 0| 7 0| 3 1| 19 0 | 0 0| 0 0| 1 1| 0 0| 1 0 | 20 0
Laurens
| 1 1| 14 1| 8 0| 2 1| 25 0 | 0 0| 1 1| 1 1| 0 0| 2 1 | 27 0
Lee
| 0 0| 3 0| 0 0| 0 0| 3 0 | 0 0| 0 0| 0 0| 0 0| 0 0 | 3 0
Liberty
| 0 0| 21 1| 9 0| 4 1| 34 1 | 0 0| 2 2| 0 0| 0 0| 2 1 | 36 1
Lincoln
| 0 0| 2 0| 3 0| 0 0| 5 0 | 0 0| 0 0| 0 0| 0 0| 0 0 | 5 0
Long
| 0 0| 4 0| 3 0| 1 0| 8 0 | 0 0| 1 1| 0 0| 0 0| 1 0 | 9 0
Lowndes
| 0 0| 35 1| 23 1| 3 1| 61 1 | 0 0| 0 0| 2 3| 1 4| 3 1 | 64 1
Lumpkins
| 2 1| 5 0| 4 0| 1 0| 12 0 | 0 0| 0 0| 0 0| 0 0| 0 0 | 12 0
Macon
| 0 0| 12 0| 5 0| 0 0| 17 0 | 0 0| 0 0| 1 1| 0 0| 1 0 | 18 0
Madison
| 0 0| 7 0| 6 0| 1 0| 14 0 | 0 0| 2 2| 0 0| 0 0| 2 1 | 16 0
Marion
| 0 0| 2 0| 1 0| 0 0| 3 0 | 0 0| 0 0| 0 0| 0 0| 0 0 | 3 0
McDuffie
| 0 0| 21 1| 11 1| 4 1| 36 1 | 1 13| 0 0| 0 0| 0 0| 1 0 | 37 1
McIntosh
| 2 1| 4 0| 3 0| 0 0| 9 0 | 0 0| 0 0| 0 0| 0 0| 0 0 | 9 0
Meriwether
| 1 1| 8 0| 7 0| 3 1| 19 0 | 0 0| 1 1| 0 0| 1 4| 2 1 | 21 0
Miller
| 0 0| 2 0| 3 0| 0 0| 5 0 | 0 0| 0 0| 0 0| 0 0| 0 0 | 5 0
Mitchell
| 0 0| 13 0| 11 1| 3 1| 27 1 | 0 0| 1 1| 0 0| 0 0| 1 0 | 28 1
Monroe
| 0 0| 10 0| 4 0| 0 0| 14 0 | 0 0| 0 0| 0 0| 0 0| 0 0 | 14 0
Montgomery
| 0 0| 0 0| 0 0| 0 0| 0 0 | 0 0| 1 1| 0 0| 0 0| 1 0 | 1 0
Morgan
| 0 0| 7 0| 3 0| 0 0| 10 0 | 0 0| 0 0| 0 0| 0 0| 0 0 | 10 0
Murray
| 2 1| 5 0| 4 0| 4 1| 15 0 | 0 0| 1 1| 0 0| 0 0| 1 0 | 16 0
Muscogee
| 2 1| 77 3| 57 3| 10 3| 146 3 | 0 0| 3 3| 3 4| 0 0| 6 3 | 152 3
Newton
| 1 1| 35 1| 11 1| 3 1| 50 1 | 0 0| 2 2| 0 0| 1 4| 3 1 | 53 1
Oconee
| 0 0| 3 0| 2 0| 0 0| 5 0 | 0 0| 0 0| 1 1| 0 0| 1 0 | 6 0
------------------------------------------------------------------------------------------------------------------------------------
(continued)
Page 34 Run 06/18/01
Georgia Department of Corrections Office of Planning and Analysis
Inmate statistical profile
Sample: ACTIVE PRISONERS SERVING LIFE EXCLUDING JAIL
Requestor:
Active inmates 06/18/2001
Home County by current age & sex
Statistics (continued)
|
MEN
|
WOMEN
|
| Age | Age | Age | Age | Men
| Age | Age | Age | Age |Women
|Grand
Home County
|00-21 %|22-39 %|40-54 %|55-99 %|Total % |00-21 %|22-39 %|40-54 %|55-99 %|Total % |Total %
------------------------------------------------------------------------------------------------------------------------------------
Oglethrope
| 0 0| 3 0| 1 0| 1 0| 5 0 | 0 0| 0 0| 0 0| 0 0| 0 0 | 5 0
Paulding
| 0 0| 6 0| 5 0| 2 1| 13 0 | 0 0| 0 0| 1 1| 1 4| 2 1 | 15 0
Peach
| 0 0| 7 0| 3 0| 0 0| 10 0 | 0 0| 1 1| 0 0| 0 0| 1 0 | 11 0
Pickens
| 0 0| 1 0| 2 0| 0 0| 3 0 | 0 0| 0 0| 1 1| 0 0| 1 0 | 4 0
Pierce
| 2 1| 2 0| 2 0| 0 0| 6 0 | 0 0| 0 0| 0 0| 0 0| 0 0 | 6 0
Pike
| 0 0| 1 0| 0 0| 0 0| 1 0 | 0 0| 0 0| 0 0| 0 0| 0 0 | 1 0
Polk
| 1 1| 15 1| 4 0| 4 1| 24 0 | 0 0| 0 0| 0 0| 0 0| 0 0 | 24 0
Pulaski
| 0 0| 4 0| 3 0| 0 0| 7 0 | 0 0| 1 1| 0 0| 0 0| 1 0 | 8 0
Putnam
| 0 0| 13 0| 13 1| 2 1| 28 1 | 0 0| 0 0| 0 0| 0 0| 0 0 | 28 1
Quitman
| 0 0| 2 0| 0 0| 0 0| 2 0 | 0 0| 0 0| 0 0| 0 0| 0 0 | 2 0
Rabun
| 0 0| 5 0| 3 0| 0 0| 8 0 | 0 0| 0 0| 0 0| 0 0| 0 0 | 8 0
Randolph
| 0 0| 3 0| 2 0| 1 0| 6 0 | 0 0| 0 0| 0 0| 0 0| 0 0 | 6 0
Richmond
| 10 6| 145 5| 70 4| 8 2| 233 4 | 0 0| 8 7| 7 9| 1 4| 16 7 | 249 5
Rockdale
| 1 1| 10 0| 7 0| 4 1| 22 0 | 0 0| 1 1| 0 0| 0 0| 1 0 | 23 0
Schely
| 0 0| 2 0| 2 0| 0 0| 4 0 | 0 0| 0 0| 0 0| 0 0| 0 0 | 4 0
Screven
| 0 0| 3 0| 2 0| 2 1| 7 0 | 0 0| 0 0| 0 0| 0 0| 0 0 | 7 0
Seminole
| 1 1| 5 0| 5 0| 1 0| 12 0 | 0 0| 1 1| 0 0| 0 0| 1 0 | 13 0
Spalding
| 4 2| 37 1| 23 1| 5 1| 69 1 | 1 13| 2 2| 1 1| 1 4| 5 2 | 74 1
Stephens
| 0 0| 5 0| 5 0| 4 1| 14 0 | 0 0| 0 0| 0 0| 0 0| 0 0 | 14 0
Stewart
| 0 0| 2 0| 2 0| 0 0| 4 0 | 0 0| 0 0| 0 0| 0 0| 0 0 | 4 0
Sumter
| 0 0| 3 0| 16 1| 2 1| 21 0 | 0 0| 0 0| 1 1| 0 0| 1 0 | 22 0
Talbot
| 2 1| 3 0| 1 0| 0 0| 6 0 | 0 0| 0 0| 1 1| 0 0| 1 0 | 7 0
Taliaferro
| 0 0| 0 0| 1 0| 0 0| 1 0 | 0 0| 0 0| 0 0| 0 0| 0 0 | 1 0
Tattnall
| 0 0| 16 1| 4 0| 0 0| 20 0 | 0 0| 0 0| 1 1| 0 0| 1 0 | 21 0
Taylor
| 1 1| 10 0| 4 0| 1 0| 16 0 | 0 0| 0 0| 0 0| 0 0| 0 0 | 16 0
Telfair
| 1 1| 6 0| 3 0| 0 0| 10 0 | 0 0| 0 0| 1 1| 0 0| 1 0 | 11 0
Terrell
| 2 1| 11 0| 1 0| 0 0| 14 0 | 0 0| 0 0| 0 0| 0 0| 0 0 | 14 0
Thomas
| 1 1| 15 1| 16 1| 4 1| 36 1 | 0 0| 1 1| 1 1| 0 0| 2 1 | 38 1
Tift
| 3 2| 27 1| 22 1| 3 1| 55 1 | 0 0| 0 0| 0 0| 1 4| 1 0 | 56 1
Toombs
| 2 1| 11 0| 12 1| 0 0| 25 0 | 0 0| 1 1| 0 0| 0 0| 1 0 | 26 0
Treutlen
| 0 0| 2 0| 3 0| 0 0| 5 0 | 0 0| 0 0| 0 0| 0 0| 0 0 | 5 0
Troup
| 2 1| 20 1| 20 1| 5 1| 47 1 | 0 0| 1 1| 1 1| 0 0| 2 1 | 49 1
Turner
| 0 0| 8 0| 5 0| 0 0| 13 0 | 0 0| 0 0| 0 0| 0 0| 0 0 | 13 0
Twiggs
| 0 0| 6 0| 4 0| 0 0| 10 0 | 0 0| 0 0| 0 0| 0 0| 0 0 | 10 0
Upson
| 1 1| 7 0| 4 0| 0 0| 12 0 | 0 0| 0 0| 1 1| 0 0| 1 0 | 13 0
------------------------------------------------------------------------------------------------------------------------------------
(continued)
Page 35 Run 06/18/01
Georgia Department of Corrections Office of Planning and Analysis
Inmate statistical profile
Sample: ACTIVE PRISONERS SERVING LIFE EXCLUDING JAIL
Requestor:
Active inmates 06/18/2001
Home County by current age & sex
Statistics (continued)
|
MEN
|
WOMEN
|
| Age | Age | Age | Age | Men
| Age | Age | Age | Age |Women
|Grand
Home County
|00-21 %|22-39 %|40-54 %|55-99 %|Total % |00-21 %|22-39 %|40-54 %|55-99 %|Total % |Total %
------------------------------------------------------------------------------------------------------------------------------------
Walker
| 1 1| 14 1| 7 0| 3 1| 25 0 | 0 0| 1 1| 1 1| 0 0| 2 1 | 27 0
Walton
| 1 1| 25 1| 19 1| 4 1| 49 1 | 0 0| 0 0| 0 0| 0 0| 0 0 | 49 1
Ware
| 1 1| 14 1| 13 1| 4 1| 32 1 | 0 0| 0 0| 0 0| 0 0| 0 0 | 32 1
Warren
| 0 0| 3 0| 5 0| 1 0| 9 0 | 0 0| 0 0| 0 0| 0 0| 0 0 | 9 0
Washington
| 0 0| 12 0| 8 0| 1 0| 21 0 | 0 0| 2 2| 0 0| 0 0| 2 1 | 23 0
Wayne
| 0 0| 6 0| 12 1| 3 1| 21 0 | 0 0| 1 1| 0 0| 0 0| 1 0 | 22 0
Webster
| 0 0| 3 0| 0 0| 0 0| 3 0 | 0 0| 0 0| 0 0| 0 0| 0 0 | 3 0
Wheeler
| 0 0| 1 0| 2 0| 2 1| 5 0 | 0 0| 0 0| 0 0| 0 0| 0 0 | 5 0
White
| 0 0| 3 0| 2 0| 2 1| 7 0 | 0 0| 0 0| 0 0| 0 0| 0 0 | 7 0
Whitfield
| 1 1| 11 0| 23 1| 7 2| 42 1 | 0 0| 2 2| 0 0| 0 0| 2 1 | 44 1
Wilcox
| 0 0| 0 0| 5 0| 1 0| 6 0 | 0 0| 0 0| 0 0| 0 0| 0 0 | 6 0
Wilkes
| 0 0| 2 0| 4 0| 2 1| 8 0 | 0 0| 0 0| 0 0| 0 0| 0 0 | 8 0
Wilkinson
| 0 0| 7 0| 2 0| 0 0| 9 0 | 0 0| 0 0| 0 0| 0 0| 0 0 | 9 0
Worth
| 0 0| 13 0| 3 0| 1 0| 17 0 | 0 0| 1 1| 0 0| 0 0| 1 0 | 18 0
------------------------------------------------------------------------------------------------------------------------------------
Total reported
| 167 100| 2732 100| 1914 100| 384 100| 5197 100 | 8 100| 115 100| 79 100| 24 100| 226 100 | 5423 100
|
|
|
|
|
|
|
|
|
|
|
Percent reported |
92.8|
90.7|
89.9|
87.3|
90.2 |
88.9|
93.5|
89.8|
96.0|
92.2 |
90.3
|
|
|
|
|
|
|
|
|
|
|
|
|
|
|
|
|
|
|
|
|
|
Not reported
| 13 | 280 | 216 | 56 | 565
| 1 | 8 | 9 | 1 | 19
| 584
------------------------------------------------------------------------------------------------------------------------------------
Total
| 180 | 3012 | 2130 | 440 | 5762
| 9 | 123 | 88 | 25 | 245
| 6007
Georgia Department of Corrections
Page 36 Run 06/18/01
Office of Planning and Analysis
Inmate statistical profile
Sample: ACTIVE PRISONERS SERVING LIFE EXCLUDING JAIL
Requestor: Statistics
Active inmates 06/18/2001
Prison Sentence In Years by current age & sex
|
MEN
|
WOMEN
|
| Age | Age | Age | Age | Men
| Age | Age | Age | Age |Women
|Grand
Sentence In Years |00-21 %|22-39 %|40-54 %|55-99 %|Total % |00-21 %|22-39 %|40-54 %|55-99 %|Total % |Total %
------------------------------------------------------------------------------------------------------------------------------------
0-1
| 0 0| 0 0| 0 0| 0 0| 0 0 | 0 0| 0 0| 0 0| 0 0| 0 0 | 0 0
1.1-2
| 0 0| 0 0| 0 0| 0 0| 0 0 | 0 0| 0 0| 0 0| 0 0| 0 0 | 0 0
2.1-3
| 0 0| 0 0| 0 0| 0 0| 0 0 | 0 0| 0 0| 0 0| 0 0| 0 0 | 0 0
3.1-4
| 0 0| 0 0| 0 0| 0 0| 0 0 | 0 0| 0 0| 0 0| 0 0| 0 0 | 0 0
4.1-5
| 0 0| 0 0| 0 0| 0 0| 0 0 | 0 0| 0 0| 0 0| 0 0| 0 0 | 0 0
5.1-6
| 0 0| 0 0| 0 0| 0 0| 0 0 | 0 0| 0 0| 0 0| 0 0| 0 0 | 0 0
6.1-7
| 0 0| 0 0| 0 0| 0 0| 0 0 | 0 0| 0 0| 0 0| 0 0| 0 0 | 0 0
7.1-8
| 0 0| 0 0| 0 0| 0 0| 0 0 | 0 0| 0 0| 0 0| 0 0| 0 0 | 0 0
8.1-9
| 0 0| 0 0| 0 0| 0 0| 0 0 | 0 0| 0 0| 0 0| 0 0| 0 0 | 0 0
9.1-10
| 0 0| 0 0| 0 0| 0 0| 0 0 | 0 0| 0 0| 0 0| 0 0| 0 0 | 0 0
10.1-12
| 0 0| 0 0| 0 0| 0 0| 0 0 | 0 0| 0 0| 0 0| 0 0| 0 0 | 0 0
12.1-15
| 0 0| 0 0| 0 0| 0 0| 0 0 | 0 0| 0 0| 0 0| 0 0| 0 0 | 0 0
15.1-20
| 0 0| 0 0| 0 0| 0 0| 0 0 | 0 0| 0 0| 0 0| 0 0| 0 0 | 0 0
20.1-OVER
| 0 0| 0 0| 0 0| 0 0| 0 0 | 0 0| 0 0| 0 0| 0 0| 0 0 | 0 0
LIFE
| 180 100| 3012 100| 2130 100| 440 100| 5762 100 | 9 100| 123 100| 88 100| 25 100| 245 100 | 6007 100
DEATH
| 0 0| 0 0| 0 0| 0 0| 0 0 | 0 0| 0 0| 0 0| 0 0| 0 0 | 0 0
LIFE W/O PAROLE
| 0 0| 0 0| 0 0| 0 0| 0 0 | 0 0| 0 0| 0 0| 0 0| 0 0 | 0 0
YOUTHFUL OFFENDERS | 0 0| 0 0| 0 0| 0 0| 0 0 | 0 0| 0 0| 0 0| 0 0| 0 0 | 0 0
------------------------------------------------------------------------------------------------------------------------------------
Total reported
| 180 100| 3012 100| 2130 100| 440 100| 5762 100 | 9 100| 123 100| 88 100| 25 100| 245 100 | 6007 100
|
|
|
|
|
|
|
|
|
|
|
Percent reported | 100.0| 100.0| 100.0| 100.0| 100.0 | 100.0| 100.0| 100.0| 100.0| 100.0 | 100.0
|
|
|
|
|
|
|
|
|
|
|
|
|
|
|
|
|
|
|
|
|
|
NOT REPORTED
|0|0|0|0|0
|0|0|0|0|0
|0
------------------------------------------------------------------------------------------------------------------------------------
Total
| 180 | 3012 | 2130 | 440 | 5762
| 9 | 123 | 88 | 25 | 245
| 6007
|
|
|
|
|
|
|
|
|
|
|
|
|
|
|
|
|
|
|
|
|
|
|
|
|
|
|
|
|
|
|
|
|
|
|
|
|
|
|
|
|
|
|
|
|
|
|
|
|
|
|
|
|
|
|
AVG EXCLUDING
|
|
|
|
|
|
|
|
|
|
|
LIFE, DEATH, YO
| .00 | .00 | .00 | .00 | .00 | .00 | .00 | .00 | .00 | .00 | .00
|
|
|
|
|
|
|
|
|
|
|
|
|
|
|
|
|
|
|
|
|
|
|
|
|
|
|
|
|
|
|
|
|
|
|
|
|
|
|
|
|
|
|
|
|
|
|
|
|
|
|
|
|
|
|
AVG INCLUDING
|
|
|
|
|
|
|
|
|
|
|
LIFE=21, YO=3 YRS | 21.00 | 21.00 | 21.00 | 21.00 | 21.00 | 21.00 | 21.00 | 21.00 | 21.00 | 21.00 | 21.00
Page 37 Run 06/18/01
Georgia Department of Corrections Office of Planning and Analysis
Inmate statistical profile
Sample: ACTIVE PRISONERS SERVING LIFE EXCLUDING JAIL
Requestor: Statistics
Active inmates 06/18/2001
Probation To Follow Prison by current age & sex
|
MEN
|
WOMEN
|
| Age | Age | Age | Age | Men
| Age | Age | Age | Age |Women
|Grand
Prob After Prison |00-21 %|22-39 %|40-54 %|55-99 %|Total % |00-21 %|22-39 %|40-54 %|55-99 %|Total % |Total %
------------------------------------------------------------------------------------------------------------------------------------
PROBATION TO FOLLOW | 10 6| 91 3| 64 3| 6 1| 171 3 | 0 0| 3 2| 3 3| 1 4| 7 3 | 178 3
NO PROBATION
| 170 94| 2921 97| 2066 97| 434 99| 5591 97 | 9 100| 120 98| 85 97| 24 96| 238 97 | 5829 97
------------------------------------------------------------------------------------------------------------------------------------
Total reported
| 180 100| 3012 100| 2130 100| 440 100| 5762 100 | 9 100| 123 100| 88 100| 25 100| 245 100 | 6007 100
|
|
|
|
|
|
|
|
|
|
|
Percent reported | 100.0| 100.0| 100.0| 100.0| 100.0 | 100.0| 100.0| 100.0| 100.0| 100.0 | 100.0
|
|
|
|
|
|
|
|
|
|
|
|
|
|
|
|
|
|
|
|
|
|
NOT REPORTED
|0|0|0|0|0
|0|0|0|0|0
|0
------------------------------------------------------------------------------------------------------------------------------------
Total
| 180 | 3012 | 2130 | 440 | 5762
| 9 | 123 | 88 | 25 | 245
| 6007
Page 38 Run 06/18/01
Georgia Department of Corrections Office of Planning and Analysis
Inmate statistical profile
Sample: ACTIVE PRISONERS SERVING LIFE EXCLUDING JAIL
Requestor: Statistics
Active inmates 06/18/2001
Admission Type by current age & sex
|
MEN
|
WOMEN
|
| Age | Age | Age | Age | Men
| Age | Age | Age | Age |Women
|Grand
Admission Type
|00-21 %|22-39 %|40-54 %|55-99 %|Total % |00-21 %|22-39 %|40-54 %|55-99 %|Total % |Total %
------------------------------------------------------------------------------------------------------------------------------------
COMMITTED FROM COURT| 176 98| 2474 82| 1576 74| 315 72| 4541 79 | 9 100| 115 93| 76 86| 25 100| 225 92 | 4766 79
RETURN APPEAL/BOND | 0 0| 1 0| 1 0| 0 0| 2 0 | 0 0| 0 0| 0 0| 0 0| 0 0 | 2 0
PAROLE REV/NEW SENT | 1 1| 340 11| 332 16| 82 19| 755 13 | 0 0| 5 4| 8 9| 0 0| 13 5 | 768 13
PAR REV/NO NEW SENT | 0 0| 19 1| 66 3| 11 3| 96 2 | 0 0| 1 1| 1 1| 0 0| 2 1 | 98 2
PROB VIOL/TOTAL REV | 0 0| 0 0| 0 0| 0 0| 0 0 | 0 0| 0 0| 0 0| 0 0| 0 0 | 0 0
PROB VIOL/PARTIAL | 0 0| 32 1| 45 2| 2 0| 79 1 | 0 0| 0 0| 1 1| 0 0| 1 0 | 80 1
ADMIT FM OTHER CUST | 0 0| 1 0| 1 0| 5 1| 7 0 | 0 0| 0 0| 0 0| 0 0| 0 0 | 7 0
SHOCK INCARCERATION | 0 0| 0 0| 0 0| 0 0| 0 0 | 0 0| 0 0| 0 0| 0 0| 0 0 | 0 0
PROB REV/REMAINDER | 2 1| 112 4| 46 2| 5 1| 165 3 | 0 0| 2 2| 2 2| 0 0| 4 2 | 169 3
NEW SENT/PAR REV PND| 0 0| 2 0| 4 0| 1 0| 7 0 | 0 0| 0 0| 0 0| 0 0| 0 0 | 7 0
LIFE W/O PAROLE
| 1 1| 9 0| 3 0| 0 0| 13 0 | 0 0| 0 0| 0 0| 0 0| 0 0 | 13 0
PAROLE REV BOOT CAMP| 0 0| 2 0| 1 0| 0 0| 3 0 | 0 0| 0 0| 0 0| 0 0| 0 0 | 3 0
PAR REV/RSN UNKNOWN | 0 0| 14 0| 41 2| 19 4| 74 1 | 0 0| 0 0| 0 0| 0 0| 0 0 | 74 1
PROBATION/PAROLE REV| 0 0| 0 0| 0 0| 0 0| 0 0 | 0 0| 0 0| 0 0| 0 0| 0 0 | 0 0
PB PAROLE RESCINDED | 0 0| 0 0| 0 0| 0 0| 0 0 | 0 0| 0 0| 0 0| 0 0| 0 0 | 0 0
PROB REVOC/SPEC COND| 0 0| 0 0| 0 0| 0 0| 0 0 | 0 0| 0 0| 0 0| 0 0| 0 0 | 0 0
PAR REV/REVOC CENTER| 0 0| 5 0| 13 1| 0 0| 18 0 | 0 0| 0 0| 0 0| 0 0| 0 0 | 18 0
INFORMATION ONLY | 0 0| 0 0| 0 0| 0 0| 0 0 | 0 0| 0 0| 0 0| 0 0| 0 0 | 0 0
INCOMPLETE SENT PKG | 0 0| 0 0| 0 0| 0 0| 0 0 | 0 0| 0 0| 0 0| 0 0| 0 0 | 0 0
HANCOCK REVOC CENTER| 0 0| 0 0| 0 0| 0 0| 0 0 | 0 0| 0 0| 0 0| 0 0| 0 0 | 0 0
WHITWORTH DETENTION | 0 0| 0 0| 1 0| 0 0| 1 0 | 0 0| 0 0| 0 0| 0 0| 0 0 | 1 0
DCYS AT RISK
| 0 0| 0 0| 0 0| 0 0| 0 0 | 0 0| 0 0| 0 0| 0 0| 0 0 | 0 0
OTHER
| 0 0| 0 0| 0 0| 0 0| 0 0 | 0 0| 0 0| 0 0| 0 0| 0 0 | 0 0
------------------------------------------------------------------------------------------------------------------------------------
Total reported
| 180 100| 3011 100| 2130 100| 440 100| 5761 100 | 9 100| 123 100| 88 100| 25 100| 245 100 | 6006 100
|
|
|
|
|
|
|
|
|
|
|
Percent reported | 100.0| 100.0| 100.0| 100.0| 100.0 | 100.0| 100.0| 100.0| 100.0| 100.0 | 100.0
|
|
|
|
|
|
|
|
|
|
|
|
|
|
|
|
|
|
|
|
|
|
UNKNOWN
|0|1|0|0|1
|0|0|0|0|0
|1
------------------------------------------------------------------------------------------------------------------------------------
Total
| 180 | 3012 | 2130 | 440 | 5762
| 9 | 123 | 88 | 25 | 245
| 6007
Page 39 Run 06/18/01
Georgia Department of Corrections Office of Planning and Analysis
Inmate statistical profile
Sample: ACTIVE PRISONERS SERVING LIFE EXCLUDING JAIL
Requestor: Statistics
Active inmates 06/18/2001
Release Type by current age & sex
|
MEN
|
WOMEN
|
| Age | Age | Age | Age | Men
| Age | Age | Age | Age |Women
|Grand
Release Type
|00-21 %|22-39 %|40-54 %|55-99 %|Total % |00-21 %|22-39 %|40-54 %|55-99 %|Total % |Total %
------------------------------------------------------------------------------------------------------------------------------------
PAROLE
| 0 0| 1 0| 0 0| 0 0| 1 0 | 0 0| 0 0| 0 0| 0 0| 0 0 | 1 0
Active
| 180 100| 3012 100| 2130 100| 440 100| 5762 100 | 9 100| 123 100| 88 100| 25 100| 245 100 | 6007 100
------------------------------------------------------------------------------------------------------------------------------------
Total
| 180 | 3012 | 2130 | 440 | 5762
| 9 | 123 | 88 | 25 | 245
| 6007
Page 40 Run 06/18/01
Georgia Department of Corrections Office of Planning and Analysis
Inmate statistical profile
Sample: ACTIVE PRISONERS SERVING LIFE EXCLUDING JAIL
Requestor: Statistics
Active inmates 06/18/2001
Inst By Group by current age & sex
|
MEN
|
WOMEN
|
| Age | Age | Age | Age | Men
| Age | Age | Age | Age |Women
|Grand
Inst By Group
|00-21 %|22-39 %|40-54 %|55-99 %|Total % |00-21 %|22-39 %|40-54 %|55-99 %|Total % |Total %
------------------------------------------------------------------------------------------------------------------------------------
County jails
| 0 0| 0 0| 0 0| 0 0| 0 0 | 0 0| 0 0| 0 0| 0 0| 0 0 | 0 0
Transitional centers| 0 0| 16 1| 15 1| 3 1| 34 1 | 0 0| 2 2| 2 2| 1 4| 5 2 | 39 1
County camps
| 0 0| 10 0| 9 0| 3 1| 22 0 | 0 0| 0 0| 0 0| 0 0| 0 0 | 22 0
Inmate boot camps | 0 0| 0 0| 0 0| 0 0| 0 0 | 0 0| 0 0| 0 0| 0 0| 0 0 | 0 0
State prisons
| 180 100| 2878 96| 2017 95| 421 96| 5496 95 | 9 100| 121 98| 86 98| 24 96| 240 98 | 5736 95
Private prisons
| 0 0| 108 4| 89 4| 13 3| 210 4 | 0 0| 0 0| 0 0| 0 0| 0 0 | 210 3
Other
| 0 0| 0 0| 0 0| 0 0| 0 0 | 0 0| 0 0| 0 0| 0 0| 0 0 | 0 0
------------------------------------------------------------------------------------------------------------------------------------
Total reported
| 180 100| 3012 100| 2130 100| 440 100| 5762 100 | 9 100| 123 100| 88 100| 25 100| 245 100 | 6007 100
|
|
|
|
|
|
|
|
|
|
|
Percent reported | 100.0| 100.0| 100.0| 100.0| 100.0 | 100.0| 100.0| 100.0| 100.0| 100.0 | 100.0
|
|
|
|
|
|
|
|
|
|
|
|
|
|
|
|
|
|
|
|
|
|
Not reported
|0|0|0|0|0
|0|0|0|0|0
|0
------------------------------------------------------------------------------------------------------------------------------------
Total
| 180 | 3012 | 2130 | 440 | 5762
| 9 | 123 | 88 | 25 | 245
| 6007
Page 41 Run 06/18/01
Georgia Department of Corrections Office of Planning and Analysis
Inmate statistical profile
Sample: ACTIVE PRISONERS SERVING LIFE EXCLUDING JAIL
Requestor: Statistics
Active inmates 06/18/2001
Institution by current age & sex
|
MEN
|
WOMEN
|
| Age | Age | Age | Age | Men
| Age | Age | Age | Age |Women
|Grand
Institution
|00-21 %|22-39 %|40-54 %|55-99 %|Total % |00-21 %|22-39 %|40-54 %|55-99 %|Total % |Total %
------------------------------------------------------------------------------------------------------------------------------------
Albany Trans Ctr | 0 0| 0 0| 1 0| 0 0| 1 0 | 0 0| 0 0| 0 0| 0 0| 0 0 | 1 0
Atlanta Trans Ctr(M)| 0 0| 11 0| 11 1| 3 1| 25 0 | 0 0| 0 0| 0 0| 0 0| 0 0 | 25 0
Macon Trans Ctr
| 0 0| 4 0| 1 0| 0 0| 5 0 | 0 0| 0 0| 0 0| 0 0| 0 0 | 5 0
Metro Trans Ctr (W) | 0 0| 0 0| 0 0| 0 0| 0 0 | 0 0| 2 2| 2 2| 1 4| 5 2 | 5 0
Savannah Trans Ctr | 0 0| 1 0| 2 0| 0 0| 3 0 | 0 0| 0 0| 0 0| 0 0| 0 0 | 3 0
Carroll County
| 0 0| 0 0| 0 0| 1 0| 1 0 | 0 0| 0 0| 0 0| 0 0| 0 0 | 1 0
Clarke County
| 0 0| 1 0| 0 0| 0 0| 1 0 | 0 0| 0 0| 0 0| 0 0| 0 0 | 1 0
Colquitt County
| 0 0| 0 0| 1 0| 0 0| 1 0 | 0 0| 0 0| 0 0| 0 0| 0 0 | 1 0
Coweta County
| 0 0| 0 0| 1 0| 0 0| 1 0 | 0 0| 0 0| 0 0| 0 0| 0 0 | 1 0
Floyd County
| 0 0| 1 0| 1 0| 0 0| 2 0 | 0 0| 0 0| 0 0| 0 0| 0 0 | 2 0
Gwinnett County
| 0 0| 1 0| 0 0| 0 0| 1 0 | 0 0| 0 0| 0 0| 0 0| 0 0 | 1 0
Hall County
| 0 0| 2 0| 1 0| 0 0| 3 0 | 0 0| 0 0| 0 0| 0 0| 0 0 | 3 0
Jackson County
| 0 0| 1 0| 2 0| 1 0| 4 0 | 0 0| 0 0| 0 0| 0 0| 0 0 | 4 0
Jefferson County | 0 0| 1 0| 1 0| 0 0| 2 0 | 0 0| 0 0| 0 0| 0 0| 0 0 | 2 0
Mitchell County
| 0 0| 0 0| 1 0| 0 0| 1 0 | 0 0| 0 0| 0 0| 0 0| 0 0 | 1 0
Muscogee County
| 0 0| 0 0| 1 0| 0 0| 1 0 | 0 0| 0 0| 0 0| 0 0| 0 0 | 1 0
Screven County
| 0 0| 1 0| 0 0| 0 0| 1 0 | 0 0| 0 0| 0 0| 0 0| 0 0 | 1 0
Terrell County
| 0 0| 1 0| 0 0| 1 0| 2 0 | 0 0| 0 0| 0 0| 0 0| 0 0 | 2 0
Clayton County
| 0 0| 1 0| 0 0| 0 0| 1 0 | 0 0| 0 0| 0 0| 0 0| 0 0 | 1 0
Ware Prison
| 13 7| 201 7| 103 5| 11 3| 328 6 | 0 0| 0 0| 0 0| 0 0| 0 0 | 328 5
Lowndes Prison
| 0 0| 6 0| 11 1| 2 0| 19 0 | 0 0| 0 0| 0 0| 0 0| 0 0 | 19 0
Dodge Prison
| 0 0| 56 2| 75 4| 7 2| 138 2 | 0 0| 0 0| 0 0| 0 0| 0 0 | 138 2
Phillips Prison
| 5 3| 125 4| 97 5| 20 5| 247 4 | 0 0| 0 0| 0 0| 0 0| 0 0 | 247 4
Walker Prison
| 0 0| 21 1| 22 1| 6 1| 49 1 | 0 0| 0 0| 0 0| 0 0| 0 0 | 49 1
Wayne Prison
| 0 0| 2 0| 5 0| 0 0| 7 0 | 0 0| 0 0| 0 0| 0 0| 0 0 | 7 0
Arrendale Prison | 42 23| 106 4| 34 2| 2 0| 184 3 | 0 0| 0 0| 0 0| 0 0| 0 0 | 184 3
Montgomery Prison | 0 0| 15 0| 9 0| 3 1| 27 0 | 0 0| 0 0| 0 0| 0 0| 0 0 | 27 0
Lee Prison
| 1 1| 23 1| 19 1| 2 0| 45 1 | 0 0| 0 0| 0 0| 0 0| 0 0 | 45 1
Putnam Prison
| 0 0| 5 0| 1 0| 0 0| 6 0 | 0 0| 0 0| 0 0| 0 0| 0 0 | 6 0
Georgia State Prison| 4 2| 263 9| 205 10| 18 4| 490 9 | 0 0| 0 0| 0 0| 0 0| 0 0 | 490 8
Mens Prison
| 0 0| 11 0| 34 2| 74 17| 119 2 | 0 0| 0 0| 0 0| 0 0| 0 0 | 119 2
Jackson Prison-Diag | 8 4| 22 1| 10 0| 5 1| 45 1 | 0 0| 0 0| 0 0| 0 0| 0 0 | 45 1
Jackson Prison-Perm | 0 0| 3 0| 1 0| 1 0| 5 0 | 0 0| 0 0| 0 0| 0 0| 0 0 | 5 0
Coastal Prison
| 13 7| 50 2| 15 1| 2 0| 80 1 | 0 0| 0 0| 0 0| 0 0| 0 0 | 80 1
Scott Prison
| 0 0| 66 2| 53 2| 9 2| 128 2 | 0 0| 0 0| 0 0| 0 0| 0 0 | 128 2
Rivers Prison
| 0 0| 71 2| 66 3| 12 3| 149 3 | 0 0| 0 0| 0 0| 0 0| 0 0 | 149 2
------------------------------------------------------------------------------------------------------------------------------------
(continued)
Page 42 Run 06/18/01
Georgia Department of Corrections Office of Planning and Analysis
Inmate statistical profile
Sample: ACTIVE PRISONERS SERVING LIFE EXCLUDING JAIL
Requestor:
Active inmates 06/18/2001
Institution by current age & sex
Statistics (CONTINUED)
|
MEN
|
WOMEN
|
| Age | Age | Age | Age | Men
| Age | Age | Age | Age |Women
|Grand
Institution
|00-21 %|22-39 %|40-54 %|55-99 %|Total % |00-21 %|22-39 %|40-54 %|55-99 %|Total % |Total %
------------------------------------------------------------------------------------------------------------------------------------
Rutledge Prison
| 0 0| 31 1| 45 2| 16 4| 92 2 | 0 0| 0 0| 0 0| 0 0| 0 0 | 92 2
Central Prison
| 0 0| 81 3| 118 6| 17 4| 216 4 | 0 0| 0 0| 0 0| 0 0| 0 0 | 216 4
Augusta Med Prison | 1 1| 96 3| 82 4| 33 8| 212 4 | 0 0| 0 0| 0 0| 0 0| 0 0 | 212 4
Rogers Prison
| 0 0| 21 1| 22 1| 0 0| 43 1 | 0 0| 0 0| 0 0| 0 0| 0 0 | 43 1
Burruss Prison
| 0 0| 5 0| 11 1| 2 0| 18 0 | 0 0| 0 0| 0 0| 0 0| 0 0 | 18 0
Bostick Prison
| 0 0| 8 0| 28 1| 28 6| 64 1 | 0 0| 0 0| 0 0| 0 0| 0 0 | 64 1
Valdosta Prison
| 9 5| 138 5| 102 5| 18 4| 267 5 | 0 0| 0 0| 0 0| 0 0| 0 0 | 267 4
Hays Prison
| 6 3| 152 5| 109 5| 17 4| 284 5 | 0 0| 0 0| 0 0| 0 0| 0 0 | 284 5
Hancock Prison
| 7 4| 212 7| 140 7| 22 5| 381 7 | 0 0| 0 0| 0 0| 0 0| 0 0 | 381 6
Telfair Prison
| 12 7| 220 7| 91 4| 10 2| 333 6 | 0 0| 0 0| 0 0| 0 0| 0 0 | 333 6
Autry Prison
| 12 7| 128 4| 110 5| 21 5| 271 5 | 0 0| 0 0| 0 0| 0 0| 0 0 | 271 5
Wilcox Prison
| 0 0| 64 2| 66 3| 6 1| 136 2 | 0 0| 0 0| 0 0| 0 0| 0 0 | 136 2
Calhoun Prison
| 11 6| 86 3| 60 3| 7 2| 164 3 | 0 0| 0 0| 0 0| 0 0| 0 0 | 164 3
Dooly Prison
| 0 0| 49 2| 68 3| 6 1| 123 2 | 0 0| 0 0| 0 0| 0 0| 0 0 | 123 2
Macon Prison
| 16 9| 294 10| 102 5| 29 7| 441 8 | 0 0| 0 0| 0 0| 0 0| 0 0 | 441 7
Smith Prison
| 17 9| 205 7| 67 3| 12 3| 301 5 | 0 0| 0 0| 0 0| 0 0| 0 0 | 301 5
Homerville Prison | 0 0| 3 0| 5 0| 0 0| 8 0 | 0 0| 0 0| 0 0| 0 0| 0 0 | 8 0
Washingtn Women Pris| 0 0| 0 0| 0 0| 0 0| 0 0 | 3 33| 28 23| 26 30| 9 36| 66 27 | 66 1
Baldwin Prison
| 3 2| 19 1| 22 1| 3 1| 47 1 | 0 0| 0 0| 0 0| 0 0| 0 0 | 47 1
Metro Womens Prison | 0 0| 0 0| 0 0| 0 0| 0 0 | 0 0| 30 24| 30 34| 7 28| 67 27 | 67 1
Pulaski Womens Pris | 0 0| 0 0| 0 0| 0 0| 0 0 | 6 67| 63 51| 30 34| 8 32| 107 44 | 107 2
Pelham PreTrans Unit| 0 0| 17 1| 9 0| 0 0| 26 0 | 0 0| 0 0| 0 0| 0 0| 0 0 | 26 0
West Central Prison | 0 0| 3 0| 0 0| 0 0| 3 0 | 0 0| 0 0| 0 0| 0 0| 0 0 | 3 0
D Ray James Prison | 0 0| 35 1| 29 1| 3 1| 67 1 | 0 0| 0 0| 0 0| 0 0| 0 0 | 67 1
Coffee Corr Facility| 0 0| 33 1| 25 1| 6 1| 64 1 | 0 0| 0 0| 0 0| 0 0| 0 0 | 64 1
Wheeler Corr Facilty| 0 0| 40 1| 35 2| 4 1| 79 1 | 0 0| 0 0| 0 0| 0 0| 0 0 | 79 1
------------------------------------------------------------------------------------------------------------------------------------
Total reported
| 180 100| 3012 100| 2130 100| 440 100| 5762 100 | 9 100| 123 100| 88 100| 25 100| 245 100 | 6007 100
|
|
|
|
|
|
|
|
|
|
|
Percent reported | 100.0| 100.0| 100.0| 100.0| 100.0 | 100.0| 100.0| 100.0| 100.0| 100.0 | 100.0
|
|
|
|
|
|
|
|
|
|
|
|
|
|
|
|
|
|
|
|
|
|
Not Reported
|0|0|0|0|0
|0|0|0|0|0
|0
------------------------------------------------------------------------------------------------------------------------------------
Total
| 180 | 3012 | 2130 | 440 | 5762
| 9 | 123 | 88 | 25 | 245
| 6007
Page 43 Run 06/18/01
Georgia Department of Corrections Office of Planning and Analysis
Inmate statistical profile
Sample: ACTIVE PRISONERS SERVING LIFE EXCLUDING JAIL
Requestor: Statistics
Active inmates 06/18/2001
Misdemeanors And Felonies by current age & sex
|
MEN
|
WOMEN
|
| Age | Age | Age | Age | Men
| Age | Age | Age | Age |Women
|Grand
Crime Type
|00-21 %|22-39 %|40-54 %|55-99 %|Total % |00-21 %|22-39 %|40-54 %|55-99 %|Total % |Total %
------------------------------------------------------------------------------------------------------------------------------------
MISDEMEANOR
| 0 0| 0 0| 0 0| 0 0| 0 0 | 0 0| 0 0| 0 0| 0 0| 0 0 | 0 0
FELONY
| 180 100| 3012 100| 2130 100| 440 100| 5762 100 | 9 100| 123 100| 88 100| 25 100| 245 100 | 6007 100
------------------------------------------------------------------------------------------------------------------------------------
Total reported
| 180 100| 3012 100| 2130 100| 440 100| 5762 100 | 9 100| 123 100| 88 100| 25 100| 245 100 | 6007 100
|
|
|
|
|
|
|
|
|
|
|
Percent reported | 100.0| 100.0| 100.0| 100.0| 100.0 | 100.0| 100.0| 100.0| 100.0| 100.0 | 100.0
|
|
|
|
|
|
|
|
|
|
|
|
|
|
|
|
|
|
|
|
|
|
NOT REPORTED
|0|0|0|0|0
|0|0|0|0|0
|0
------------------------------------------------------------------------------------------------------------------------------------
Total
| 180 | 3012 | 2130 | 440 | 5762
| 9 | 123 | 88 | 25 | 245
| 6007
Page 44 Run 06/18/01
Georgia Department of Corrections Office of Planning and Analysis
Inmate statistical profile
Sample: ACTIVE PRISONERS SERVING LIFE EXCLUDING JAIL
Requestor: Statistics
Active inmates 06/18/2001
Crimes By Group by current age & sex
|
MEN
|
WOMEN
|
| Age | Age | Age | Age | Men
| Age | Age | Age | Age |Women
|Grand
Crimes By Group
|00-21 %|22-39 %|40-54 %|55-99 %|Total % |00-21 %|22-39 %|40-54 %|55-99 %|Total % |Total %
------------------------------------------------------------------------------------------------------------------------------------
HOMICIDE
| 132 74| 1905 63| 1252 59| 332 75| 3621 63 | 9 100| 110 89| 73 83| 25 100| 217 89 | 3838 64
ABORTION
| 0 0| 0 0| 0 0| 0 0| 0 0 | 0 0| 0 0| 0 0| 0 0| 0 0 | 0 0
BODILY INJRY&REL OFF| 17 10| 184 6| 111 5| 5 1| 317 6 | 0 0| 2 2| 5 6| 0 0| 7 3 | 324 5
ARSON & REL OFF
| 0 0| 1 0| 0 0| 0 0| 1 0 | 0 0| 0 0| 0 0| 0 0| 0 0 | 1 0
DAMAGE OF PROPERTY | 0 0| 1 0| 0 0| 0 0| 1 0 | 0 0| 0 0| 0 0| 0 0| 0 0 | 1 0
BURGLARY & REL OFF | 0 0| 15 0| 8 0| 0 0| 23 0 | 0 0| 0 0| 1 1| 0 0| 1 0 | 24 0
FORGERY & REL OFF | 0 0| 6 0| 4 0| 0 0| 10 0 | 0 0| 0 0| 0 0| 0 0| 0 0 | 10 0
THEFT
| 0 0| 6 0| 5 0| 0 0| 11 0 | 0 0| 0 0| 0 0| 0 0| 0 0 | 11 0
ROBBERY
| 19 11| 351 12| 247 12| 35 8| 652 11 | 0 0| 2 2| 1 1| 0 0| 3 1 | 655 11
SEXUAL OFFENSES
| 9 5| 320 11| 374 18| 56 13| 759 13 | 0 0| 0 0| 2 2| 0 0| 2 1 | 761 13
OBSCENITY CRIMES | 0 0| 0 0| 0 0| 0 0| 0 0 | 0 0| 0 0| 0 0| 0 0| 0 0 | 0 0
TREASON & REL OFF | 0 0| 0 0| 0 0| 0 0| 0 0 | 0 0| 0 0| 0 0| 0 0| 0 0 | 0 0
CRIMES INVOLVNG GOVT| 0 0| 5 0| 6 0| 1 0| 12 0 | 0 0| 0 0| 0 0| 0 0| 0 0 | 12 0
FALSIFICATIONS
| 0 0| 0 0| 0 0| 0 0| 0 0 | 0 0| 0 0| 0 0| 0 0| 0 0 | 0 0
OBSTRUCT LAW ENFORCE| 0 0| 0 0| 2 0| 0 0| 2 0 | 0 0| 0 0| 0 0| 0 0| 0 0 | 2 0
DISORDERLY CONDUCT | 0 0| 0 0| 0 0| 0 0| 0 0 | 0 0| 0 0| 0 0| 0 0| 0 0 | 0 0
GAMBLING & REL OFF | 0 0| 0 0| 0 0| 0 0| 0 0 | 0 0| 0 0| 0 0| 0 0| 0 0 | 0 0
CRUELTY TO CHILDREN | 0 0| 0 0| 0 0| 0 0| 0 0 | 0 0| 0 0| 0 0| 0 0| 0 0 | 0 0
CRIMES WITH GUNS | 0 0| 0 0| 1 0| 0 0| 1 0 | 0 0| 0 0| 0 0| 0 0| 0 0 | 1 0
INVASION PRIVACY | 0 0| 0 0| 0 0| 0 0| 0 0 | 0 0| 0 0| 0 0| 0 0| 0 0 | 0 0
RACKETEERING
| 0 0| 0 0| 0 0| 0 0| 0 0 | 0 0| 0 0| 0 0| 0 0| 0 0 | 0 0
DRUG ABUSE OFFENSES | 1 1| 198 7| 113 5| 9 2| 321 6 | 0 0| 9 7| 6 7| 0 0| 15 6 | 336 6
DRUG TRAFFICKING | 0 0| 15 0| 6 0| 1 0| 22 0 | 0 0| 0 0| 0 0| 0 0| 0 0 | 22 0
AUTO CRIMES
| 0 0| 0 0| 0 0| 0 0| 0 0 | 0 0| 0 0| 0 0| 0 0| 0 0 | 0 0
REVENUE & CONTRABAND| 0 0| 0 0| 0 0| 0 0| 0 0 | 0 0| 0 0| 0 0| 0 0| 0 0 | 0 0
CRIMES OF OTH STATES| 0 0| 0 0| 0 0| 0 0| 0 0 | 0 0| 0 0| 0 0| 0 0| 0 0 | 0 0
MISC. FELONIES
| 0 0| 1 0| 0 0| 1 0| 2 0 | 0 0| 0 0| 0 0| 0 0| 0 0 | 2 0
MISDEMEANORS
| 0 0| 0 0| 0 0| 0 0| 0 0 | 0 0| 0 0| 0 0| 0 0| 0 0 | 0 0
------------------------------------------------------------------------------------------------------------------------------------
Total reported
| 178 100| 3008 100| 2129 100| 440 100| 5755 100 | 9 100| 123 100| 88 100| 25 100| 245 100 | 6000 100
|
|
|
|
|
|
|
|
|
|
|
Percent reported |
98.9|
99.9| 100.0| 100.0|
99.9 | 100.0| 100.0| 100.0| 100.0| 100.0 |
99.9
|
|
|
|
|
|
|
|
|
|
|
|
|
|
|
|
|
|
|
|
|
|
NOT REPORTED
|2|4|1|0|7
|0|0|0|0|0
|7
------------------------------------------------------------------------------------------------------------------------------------
Total
| 180 | 3012 | 2130 | 440 | 5762
| 9 | 123 | 88 | 25 | 245
| 6007
Page 45 Run 06/18/01
Georgia Department of Corrections Office of Planning and Analysis
Inmate statistical profile
Sample: ACTIVE PRISONERS SERVING LIFE EXCLUDING JAIL
Requestor: Statistics
Active inmates 06/18/2001
Most Serious Offense by current age & sex
|
MEN
|
WOMEN
|
| Age | Age | Age | Age | Men
| Age | Age | Age | Age |Women
|Grand
Most Serious Offense|00-21 %|22-39 %|40-54 %|55-99 %|Total % |00-21 %|22-39 %|40-54 %|55-99 %|Total % |Total %
------------------------------------------------------------------------------------------------------------------------------------
Misdemeanors
|
|
|
------------------------------------------------------------------------------------------------------------------------------------
------------------------------------------------------------------------------------------------------------------------------------
------------------------------------------------------------------------------------------------------------------------------------
FELONIES
|
|
|
------------------------------------------------------------------------------------------------------------------------------------
------------------------------------------------------------------------------------------------------------------------------------
MISC. HOMICIDE OFFEN| 2 1| 4 0| 1 0| 0 0| 7 0 | 0 0| 0 0| 0 0| 0 0| 0 0 | 7 0
MURDER
| 132 73| 1904 63| 1252 59| 331 75| 3619 63 | 9 100| 110 89| 73 83| 25 100| 217 89 | 3836 64
VOLUNTARY MANSLAUGHT| 0 0| 1 0| 0 0| 1 0| 2 0 | 0 0| 0 0| 0 0| 0 0| 0 0 | 2 0
AGGRAVATED ASSAULT | 0 0| 8 0| 1 0| 0 0| 9 0 | 0 0| 0 0| 0 0| 0 0| 0 0 | 9 0
AGGRAVATED BATTERY | 0 0| 1 0| 0 0| 0 0| 1 0 | 0 0| 0 0| 0 0| 0 0| 0 0 | 1 0
KIDNAPPING
| 17 9| 175 6| 108 5| 5 1| 305 5 | 0 0| 2 2| 5 6| 0 0| 7 3 | 312 5
AGG ASSLT ON POLICE | 0 0| 0 0| 2 0| 0 0| 2 0 | 0 0| 0 0| 0 0| 0 0| 0 0 | 2 0
SECOND DEGREE ARSON | 0 0| 1 0| 0 0| 0 0| 1 0 | 0 0| 0 0| 0 0| 0 0| 0 0 | 1 0
CRIM. DAMAGE 2ND DEG| 0 0| 1 0| 0 0| 0 0| 1 0 | 0 0| 0 0| 0 0| 0 0| 0 0 | 1 0
BURGLARY
| 0 0| 15 0| 8 0| 0 0| 23 0 | 0 0| 0 0| 1 1| 0 0| 1 0 | 24 0
FORGERY 1ST DEGREE | 0 0| 6 0| 4 0| 0 0| 10 0 | 0 0| 0 0| 0 0| 0 0| 0 0 | 10 0
THEFT BY TAKING
| 0 0| 2 0| 3 0| 0 0| 5 0 | 0 0| 0 0| 0 0| 0 0| 0 0 | 5 0
THEFT BY REC STOLEN | 0 0| 2 0| 1 0| 0 0| 3 0 | 0 0| 0 0| 0 0| 0 0| 0 0 | 3 0
THEFT BY CONVERSION | 0 0| 1 0| 1 0| 0 0| 2 0 | 0 0| 0 0| 0 0| 0 0| 0 0 | 2 0
THEFT OF MOTOR VEH, | 0 0| 1 0| 0 0| 0 0| 1 0 | 0 0| 0 0| 0 0| 0 0| 0 0 | 1 0
ROBBERY
| 0 0| 5 0| 4 0| 4 1| 13 0 | 0 0| 0 0| 0 0| 0 0| 0 0 | 13 0
ARMED ROBBERY
| 18 10| 346 11| 243 11| 31 7| 638 11 | 0 0| 2 2| 1 1| 0 0| 3 1 | 641 11
CRMNL ATMPT ARMED RO| 1 1| 0 0| 0 0| 0 0| 1 0 | 0 0| 0 0| 0 0| 0 0| 0 0 | 1 0
MISC. SEXUAL
| 0 0| 1 0| 0 0| 0 0| 1 0 | 0 0| 0 0| 0 0| 0 0| 0 0 | 1 0
RAPE
| 9 5| 299 10| 340 16| 44 10| 692 12 | 0 0| 0 0| 2 2| 0 0| 2 1 | 694 12
AGGRAVATED SODOMY | 0 0| 14 0| 21 1| 9 2| 44 1 | 0 0| 0 0| 0 0| 0 0| 0 0 | 44 1
CHILD MOLESTATION | 0 0| 2 0| 3 0| 1 0| 6 0 | 0 0| 0 0| 0 0| 0 0| 0 0 | 6 0
AGGRAV. CHILD MOLEST| 0 0| 4 0| 10 0| 2 0| 16 0 | 0 0| 0 0| 0 0| 0 0| 0 0 | 16 0
OBSTR OF LAW ENF OFF| 0 0| 5 0| 6 0| 1 0| 12 0 | 0 0| 0 0| 0 0| 0 0| 0 0 | 12 0
ESCAPE
| 0 0| 0 0| 2 0| 0 0| 2 0 | 0 0| 0 0| 0 0| 0 0| 0 0 | 2 0
POSS OF CERTAIN WEAP| 0 0| 0 0| 1 0| 0 0| 1 0 | 0 0| 0 0| 0 0| 0 0| 0 0 | 1 0
S/D NARCOTICS, OPIAT| 0 0| 11 0| 12 1| 2 0| 25 0 | 0 0| 0 0| 1 1| 0 0| 1 0 | 26 0
S/D DEP,STIM,CNTRF D| 0 0| 4 0| 2 0| 0 0| 6 0 | 0 0| 0 0| 0 0| 0 0| 0 0 | 6 0
SALE/DIST OF MARIJUA| 0 0| 4 0| 5 0| 1 0| 10 0 | 0 0| 0 0| 0 0| 0 0| 0 0 | 10 0
------------------------------------------------------------------------------------------------------------------------------------
(continued)
Page 46 Run 06/18/01
Georgia Department of Corrections Office of Planning and Analysis
Inmate statistical profile
Sample: ACTIVE PRISONERS SERVING LIFE EXCLUDING JAIL
Requestor:
Active inmates 06/18/2001
Most Serious Offense by current age & sex
Statistics (CONTINUED)
|
MEN
|
WOMEN
|
| Age | Age | Age | Age | Men
| Age | Age | Age | Age |Women
|Grand
Most Serious Offense|00-21 %|22-39 %|40-54 %|55-99 %|Total % |00-21 %|22-39 %|40-54 %|55-99 %|Total % |Total %
------------------------------------------------------------------------------------------------------------------------------------
POSS NARCOTICS, OPIA| 0 0| 4 0| 3 0| 0 0| 7 0 | 0 0| 0 0| 0 0| 0 0| 0 0 | 7 0
POSS DEP,STIM,CNTRF | 0 0| 0 0| 1 0| 0 0| 1 0 | 0 0| 0 0| 0 0| 0 0| 0 0 | 1 0
VIOLATE GA CNTRL SBS| 0 0| 14 0| 5 0| 0 0| 19 0 | 0 0| 1 1| 1 1| 0 0| 2 1 | 21 0
UNLWFL MFG/DEL/DIST | 0 0| 5 0| 1 0| 0 0| 6 0 | 0 0| 0 0| 0 0| 0 0| 0 0 | 6 0
SALE/DIST CONT SUB P| 0 0| 2 0| 0 0| 0 0| 2 0 | 0 0| 0 0| 0 0| 0 0| 0 0 | 2 0
SALE/DIST CONT SUB S| 0 0| 1 0| 0 0| 0 0| 1 0 | 0 0| 0 0| 0 0| 0 0| 0 0 | 1 0
SALE/DISTRIBUTION CO| 1 1| 129 4| 69 3| 4 1| 203 4 | 0 0| 8 7| 4 5| 0 0| 12 5 | 215 4
POSSESSION OF COCAIN| 0 0| 24 1| 15 1| 2 0| 41 1 | 0 0| 0 0| 0 0| 0 0| 0 0 | 41 1
COCAINE LESS 200 GRA| 0 0| 10 0| 5 0| 1 0| 16 0 | 0 0| 0 0| 0 0| 0 0| 0 0 | 16 0
COCAINE 401 OR MORE | 0 0| 4 0| 1 0| 0 0| 5 0 | 0 0| 0 0| 0 0| 0 0| 0 0 | 5 0
ATT/CONSPRCY COMMT C| 0 0| 1 0| 0 0| 0 0| 1 0 | 0 0| 0 0| 0 0| 0 0| 0 0 | 1 0
CONSPIRACY
| 0 0| 1 0| 0 0| 0 0| 1 0 | 0 0| 0 0| 0 0| 0 0| 0 0 | 1 0
CRIMINAL ATTEMPT | 0 0| 0 0| 0 0| 1 0| 1 0 | 0 0| 0 0| 0 0| 0 0| 0 0 | 1 0
------------------------------------------------------------------------------------------------------------------------------------
Total reported
| 180 100| 3012 100| 2130 100| 440 100| 5762 100 | 9 100| 123 100| 88 100| 25 100| 245 100 | 6007 100
|
|
|
|
|
|
|
|
|
|
|
Percent reported | 100.0| 100.0| 100.0| 100.0| 100.0 | 100.0| 100.0| 100.0| 100.0| 100.0 | 100.0
|
|
|
|
|
|
|
|
|
|
|
|
|
|
|
|
|
|
|
|
|
|
NOT REPORTED
|0|0|0|0|0
|0|0|0|0|0
|0
------------------------------------------------------------------------------------------------------------------------------------
Total
| 180 | 3012 | 2130 | 440 | 5762
| 9 | 123 | 88 | 25 | 245
| 6007
Page 47 Run 06/18/01
Georgia Department of Corrections Office of Planning and Analysis
Inmate statistical profile
Sample: ACTIVE PRISONERS SERVING LIFE EXCLUDING JAIL
Requestor: Statistics
Active inmates 06/18/2001
Most Serious Crime Type by current age & sex
|
MEN
|
WOMEN
|
| Age | Age | Age | Age | Men
| Age | Age | Age | Age |Women
|Grand
Crime Type
|00-21 %|22-39 %|40-54 %|55-99 %|Total % |00-21 %|22-39 %|40-54 %|55-99 %|Total % |Total %
------------------------------------------------------------------------------------------------------------------------------------
VIOL/PERSN
| 170 94| 2444 81| 1611 76| 372 85| 4597 80 | 9 100| 114 93| 79 90| 25 100| 227 93 | 4824 80
NVIOL/PERS
| 0 0| 0 0| 0 0| 0 0| 0 0 | 0 0| 0 0| 0 0| 0 0| 0 0 | 0 0
PROPERTY
| 0 0| 29 1| 17 1| 0 0| 46 1 | 0 0| 0 0| 1 1| 0 0| 1 0 | 47 1
DRUG SALES
| 1 1| 171 6| 95 4| 8 2| 275 5 | 0 0| 8 7| 5 6| 0 0| 13 5 | 288 5
DRUG POSSN
| 0 0| 42 1| 24 1| 2 0| 68 1 | 0 0| 1 1| 1 1| 0 0| 2 1 | 70 1
ALCOHOL
| 0 0| 0 0| 0 0| 0 0| 0 0 | 0 0| 0 0| 0 0| 0 0| 0 0 | 0 0
HABIT/DUI
| 0 0| 0 0| 0 0| 0 0| 0 0 | 0 0| 0 0| 0 0| 0 0| 0 0 | 0 0
SEX OFFEND
| 9 5| 320 11| 374 18| 56 13| 759 13 | 0 0| 0 0| 2 2| 0 0| 2 1 | 761 13
OTHER
| 0 0| 6 0| 9 0| 2 0| 17 0 | 0 0| 0 0| 0 0| 0 0| 0 0 | 17 0
------------------------------------------------------------------------------------------------------------------------------------
Total reported
| 180 100| 3012 100| 2130 100| 440 100| 5762 100 | 9 100| 123 100| 88 100| 25 100| 245 100 | 6007 100
|
|
|
|
|
|
|
|
|
|
|
Percent reported | 100.0| 100.0| 100.0| 100.0| 100.0 | 100.0| 100.0| 100.0| 100.0| 100.0 | 100.0
|
|
|
|
|
|
|
|
|
|
|
|
|
|
|
|
|
|
|
|
|
|
NOT REPORTED
|0|0|0|0|0
|0|0|0|0|0
|0
------------------------------------------------------------------------------------------------------------------------------------
Total
| 180 | 3012 | 2130 | 440 | 5762
| 9 | 123 | 88 | 25 | 245
| 6007