- Collection:
- Georgia Government Publications
- Title:
- Inmate statistical profile: active lifers, 2001-05-01
- Creator:
- Georgia. Department of Corrections. Planning and Analysis Section
- Publisher:
- Atlanta, GA. : Georgia Dept. of Corrections, Office of Planning and Analysis, 2001-05-01
- Date of Original:
- 2001-05-01
- Subject:
- Prisoners--Georgia
- Location:
- United States, Georgia, 32.75042, -83.50018
- Medium:
- state government records
- Type:
- Text
- Format:
- application/pdf
- External Identifiers:
- Call Number GA R300.P5 P1 L5 2001/5
- Metadata URL:
- https://dlg.galileo.usg.edu/id:dlg_ggpd_i-ga-br300-pp5-bp1-bl5-b2001-s5-belec-p-btext
- Digital Object URL:
- https://dlg.galileo.usg.edu/do:dlg_ggpd_i-ga-br300-pp5-bp1-bl5-b2001-s5-belec-p-btext
- Language:
- eng
- Holding Institution:
- University of Georgia. Map and Government Information Library
- Rights:
-

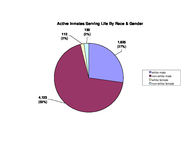
Active Inmates Serving Life By Race & Gender
112 (2%)
130 (2%)
1,625 (27%)
4,123 (69%)
white male non-white male white female non-white female
Prior Incarcerations of Active Inmates Serving A Life Sentence
4000
3,643
(61%)
3500
3000
Number of Inmates
2500
2000 1500 1000
500 0
zero
1,205 (20%)
one
609 (10%)
332 (6%)
two
three
Priors
130 (2%)
four
71 (1%)
five or more
Active Inmates Serving Life By Crime Type
73 (1%)
760 (13%)
17 (<1%)
296 (5%)
46 (1%)
4,798 (80%)
viol/persn
property
drug sales
drug possn
sex offend
other
Georgia Department of Corrections
Page 1 Run 05/22/01
Office of Planning and Analysis
Inmate statistical profile TABLE OF CONTENTS FOR ACTIVE PRISONERS SERVING LIFE EXCLUDING JAIL
TITLE ----RACE AND SEX............................ 2 Culture Fair IQ Scores.................. 3 Self-Rpt Socioeconomic Class............ 4 Self-Rpt Environment To Age 16.......... 5 Self-Rpt Education Level................ 6 Functional Reading Level (WRAT Scores).. 7 Functional Math Level (WRAT Scores)..... 8 Functional Spelling Level (WRAT Scores). 9 Self-Rpt Guardian Status To Age 16......10 Self-Rpt Employment Status Before Prison11 Self-Rpt Marital Status At Admission....12 Self-Rpt Number Of Children At Admission13 Self-Rpt Religious Affiliation..........14 Self-Rpt Family Behavior Patterns *.....15 Inmate Diagnostic Behavior Problem *....16 Physical Profile (General Condition)....17 Security Status.........................18 Number Of Sentences.....................19 Number Of Disciplinaries................20 Number Of Escapes.......................21 Number Of Prior Georgia Incarcerations *22 Number Of Transfers.....................23 County Of Conviction....................24 Circuit Of Conviction...................29 Home County.............................31 Prison Sentence In Years................36 Probation To Follow Prison..............37 Admission Type..........................38 Release Type............................39 Inst By Group...........................40 Institution.............................41 Misdemeanors And Felonies...............43 Crimes By Group.........................44 Most Serious Offense....................45 Most Serious Crime Type.................47
PAGE ----
Georgia Department of Corrections
Page 2 Run 05/22/01
Office of Planning and Analysis
Inmate statistical profile
Sample: ACTIVE PRISONERS SERVING LIFE EXCLUDING JAIL
Requestor: Statistics
Active inmates 05/22/2001
RACE AND SEX by current age & sex
|
MEN
|
WOMEN
|
| Age | Age | Age | Age | Men
| Age | Age | Age | Age |Women
|Grand
RACE AND SEX
|00-21 %|22-39 %|40-54 %|55-99 %|Total % |00-21 %|22-39 %|40-54 %|55-99 %|Total % |Total %
------------------------------------------------------------------------------------------------------------------------------------
WHITE MALE
| 31 17| 671 22| 704 33| 219 50| 1625 28 | 0 0| 0 0| 0 0| 0 0| 0 0 | 1625 27
NON WHITE MALE
| 147 83| 2342 78| 1418 67| 216 50| 4123 72 | 0 0| 0 0| 0 0| 0 0| 0 0 | 4123 69
WHITE FEMALE
| 0 0| 0 0| 0 0| 0 0| 0 0 | 4 44| 44 37| 46 52| 18 72| 112 46 | 112 2
NON WHITE FEMALE | 0 0| 0 0| 0 0| 0 0| 0 0 | 5 56| 76 63| 42 48| 7 28| 130 54 | 130 2
------------------------------------------------------------------------------------------------------------------------------------
Total reported
| 178 100| 3013 100| 2122 100| 435 100| 5748 100 | 9 100| 120 100| 88 100| 25 100| 242 100 | 5990 100
|
|
|
|
|
|
|
|
|
|
|
Percent reported | 100.0| 100.0| 100.0| 100.0| 100.0 | 100.0| 100.0| 100.0| 100.0| 100.0 | 100.0
|
|
|
|
|
|
|
|
|
|
|
|
|
|
|
|
|
|
|
|
|
|
NOT REPORTED
|0|0|0|0|0
|0|0|0|0|0
|0
------------------------------------------------------------------------------------------------------------------------------------
Total
| 178 | 3013 | 2122 | 435 | 5748
| 9 | 120 | 88 | 25 | 242
| 5990
|
|
|
|
|
|
|
|
|
|
|
|
|
|
|
|
|
|
|
|
|
|
|
|
|
|
|
|
|
|
|
|
|
|
|
|
|
|
|
|
|
|
|
|
|
|
|
|
|
|
|
|
|
|
|
AVERAGE AGE
| 19.97 | 31.20 | 45.80 | 61.00 | 38.49 | 19.78 | 31.16 | 45.00 | 61.28 | 38.88 | 38.51
Page 3 Run 05/22/01
Georgia Department of Corrections Office of Planning and Analysis
Inmate statistical profile
Sample: ACTIVE PRISONERS SERVING LIFE EXCLUDING JAIL
Requestor: Statistics
Active inmates 05/22/2001
Culture Fair IQ Scores by current age & sex
|
MEN
|
WOMEN
|
| Age | Age | Age | Age | Men
| Age | Age | Age | Age |Women
|Grand
IQ Score
|00-21 %|22-39 %|40-54 %|55-99 %|Total % |00-21 %|22-39 %|40-54 %|55-99 %|Total % |Total %
------------------------------------------------------------------------------------------------------------------------------------
LESS THAN 70
| 3 2| 76 3| 154 8| 41 10| 274 5 | 0 0| 9 8| 9 11| 2 9| 20 9 | 294 5
70 AND UP
| 163 98| 2800 97| 1821 92| 350 90| 5134 95 | 8 100| 108 92| 76 89| 20 91| 212 91 | 5346 95
------------------------------------------------------------------------------------------------------------------------------------
Total reported
| 166 100| 2876 100| 1975 100| 391 100| 5408 100 | 8 100| 117 100| 85 100| 22 100| 232 100 | 5640 100
|
|
|
|
|
|
|
|
|
|
|
Percent reported |
93.3|
95.5|
93.1|
89.9|
94.1 |
88.9|
97.5|
96.6|
88.0|
95.9 |
94.2
|
|
|
|
|
|
|
|
|
|
|
|
|
|
|
|
|
|
|
|
|
|
NOT REPORTED
| 12 | 137 | 147 | 44 | 340
| 1 | 3 | 3 | 3 | 10
| 350
------------------------------------------------------------------------------------------------------------------------------------
Total
| 178 | 3013 | 2122 | 435 | 5748
| 9 | 120 | 88 | 25 | 242
| 5990
|
|
|
|
|
|
|
|
|
|
|
|
|
|
|
|
|
|
|
|
|
|
|
|
|
|
|
|
|
|
|
|
|
|
|
|
|
|
|
|
|
|
|
|
|
|
|
|
|
|
|
|
|
|
|
AVERAGE IQ
| 99.65 | 101.42 | 97.18 | 93.93 | 99.28 | 99.38 | 95.48 | 91.49 | 88.36 | 93.48 | 99.04
Page 4 Run 05/22/01
Georgia Department of Corrections Office of Planning and Analysis
Inmate statistical profile
Sample: ACTIVE PRISONERS SERVING LIFE EXCLUDING JAIL
Requestor: Statistics
Active inmates 05/22/2001
Self-Rpt Socioeconomic Class by current age & sex
|
MEN
|
WOMEN
|
| Age | Age | Age | Age | Men
| Age | Age | Age | Age |Women
|Grand
Socioeconomic Class |00-21 %|22-39 %|40-54 %|55-99 %|Total % |00-21 %|22-39 %|40-54 %|55-99 %|Total % |Total %
------------------------------------------------------------------------------------------------------------------------------------
WELFARE
| 14 9| 344 12| 203 10| 25 6| 586 11 | 0 0| 23 19| 7 8| 0 0| 30 13 | 616 11
OCC EMPLOY
| 11 7| 192 7| 65 3| 7 2| 275 5 | 0 0| 3 3| 0 0| 1 5| 4 2 | 279 5
MINIMUM STD
| 72 45| 1028 36| 894 44| 226 55| 2220 40 | 5 56| 40 34| 27 31| 8 36| 80 34 | 2300 40
MIDDLE
| 63 39| 1305 45| 884 43| 151 37| 2403 44 | 4 44| 51 43| 51 58| 12 55| 118 50 | 2521 44
OTHER
| 1 1| 25 1| 7 0| 3 1| 36 1 | 0 0| 1 1| 3 3| 1 5| 5 2 | 41 1
------------------------------------------------------------------------------------------------------------------------------------
Total reported
| 161 100| 2894 100| 2053 100| 412 100| 5520 100 | 9 100| 118 100| 88 100| 22 100| 237 100 | 5757 100
|
|
|
|
|
|
|
|
|
|
|
Percent reported |
90.4|
96.1|
96.7|
94.7|
96.0 | 100.0|
98.3| 100.0|
88.0|
97.9 |
96.1
|
|
|
|
|
|
|
|
|
|
|
|
|
|
|
|
|
|
|
|
|
|
NOT RPTD
| 17 | 119 | 69 | 23 | 228
|0|2|0|3|5
| 233
------------------------------------------------------------------------------------------------------------------------------------
Total
| 178 | 3013 | 2122 | 435 | 5748
| 9 | 120 | 88 | 25 | 242
| 5990
Page 5 Run 05/22/01
Georgia Department of Corrections Office of Planning and Analysis
Inmate statistical profile
Sample: ACTIVE PRISONERS SERVING LIFE EXCLUDING JAIL
Requestor: Statistics
Active inmates 05/22/2001
Self-Rpt Environment To Age 16 by current age & sex
|
MEN
|
WOMEN
|
| Age | Age | Age | Age | Men
| Age | Age | Age | Age |Women
|Grand
Environment
|00-21 %|22-39 %|40-54 %|55-99 %|Total % |00-21 %|22-39 %|40-54 %|55-99 %|Total % |Total %
------------------------------------------------------------------------------------------------------------------------------------
RURAL/FARM
| 1 1| 106 4| 177 9| 90 21| 374 7 | 0 0| 8 7| 4 5| 3 14| 15 6 | 389 7
RURAL/NFARM
| 4 2| 201 7| 176 9| 38 9| 419 7 | 0 0| 7 6| 3 3| 0 0| 10 4 | 429 7
S.M.S.A
| 75 43| 1224 42| 742 36| 109 26| 2150 38 | 2 22| 24 20| 22 25| 6 29| 54 23 | 2204 38
URBAN
| 32 18| 517 18| 376 18| 57 14| 982 18 | 4 44| 32 27| 24 27| 2 10| 62 26 | 1044 18
SMALL TOWN
| 62 36| 880 30| 583 28| 126 30| 1651 29 | 3 33| 47 40| 33 38| 9 43| 92 39 | 1743 30
OTHER
| 0 0| 17 1| 9 0| 0 0| 26 0 | 0 0| 0 0| 2 2| 1 5| 3 1 | 29 0
------------------------------------------------------------------------------------------------------------------------------------
Total reported
| 174 100| 2945 100| 2063 100| 420 100| 5602 100 | 9 100| 118 100| 88 100| 21 100| 236 100 | 5838 100
|
|
|
|
|
|
|
|
|
|
|
Percent reported |
97.8|
97.7|
97.2|
96.6|
97.5 | 100.0|
98.3| 100.0|
84.0|
97.5 |
97.5
|
|
|
|
|
|
|
|
|
|
|
|
|
|
|
|
|
|
|
|
|
|
NOT RPTD
| 4 | 68 | 59 | 15 | 146
|0|2|0|4|6
| 152
------------------------------------------------------------------------------------------------------------------------------------
Total
| 178 | 3013 | 2122 | 435 | 5748
| 9 | 120 | 88 | 25 | 242
| 5990
Page 6 Run 05/22/01
Georgia Department of Corrections Office of Planning and Analysis
Inmate statistical profile
Sample: ACTIVE PRISONERS SERVING LIFE EXCLUDING JAIL
Requestor: Statistics
Active inmates 05/22/2001
Self-Rpt Education Level by current age & sex
|
MEN
|
WOMEN
|
| Age | Age | Age | Age | Men
| Age | Age | Age | Age |Women
|Grand
Education Level
|00-21 %|22-39 %|40-54 %|55-99 %|Total % |00-21 %|22-39 %|40-54 %|55-99 %|Total % |Total %
------------------------------------------------------------------------------------------------------------------------------------
LESS THAN GRADE 7 | 5 3| 50 2| 107 5| 84 20| 246 4 | 0 0| 1 1| 2 2| 5 21| 8 3 | 254 4
GRADE 7
| 7 4| 85 3| 63 3| 36 8| 191 3 | 0 0| 5 4| 4 5| 1 4| 10 4 | 201 3
GRADE 8
| 41 24| 265 9| 198 9| 45 11| 549 10 | 3 33| 16 14| 7 8| 1 4| 27 11 | 576 10
GRADE 9
| 41 24| 458 15| 253 12| 38 9| 790 14 | 3 33| 17 14| 6 7| 0 0| 26 11 | 816 14
GRADE 10
| 34 20| 599 20| 306 15| 38 9| 977 17 | 1 11| 20 17| 12 14| 3 13| 36 15 | 1013 17
GRADE 11
| 34 20| 552 19| 239 11| 29 7| 854 15 | 1 11| 17 14| 5 6| 1 4| 24 10 | 878 15
GRADE 12
| 8 5| 717 24| 662 32| 106 25| 1493 26 | 1 11| 25 21| 31 35| 9 38| 66 28 | 1559 26
MORE THAN GRADE 12 | 2 1| 241 8| 266 13| 51 12| 560 10 | 0 0| 17 14| 21 24| 4 17| 42 18 | 602 10
------------------------------------------------------------------------------------------------------------------------------------
Total reported
| 172 100| 2967 100| 2094 100| 427 100| 5660 100 | 9 100| 118 100| 88 100| 24 100| 239 100 | 5899 100
|
|
|
|
|
|
|
|
|
|
|
Percent reported |
96.6|
98.5|
98.7|
98.2|
98.5 | 100.0|
98.3| 100.0|
96.0|
98.8 |
98.5
|
|
|
|
|
|
|
|
|
|
|
|
|
|
|
|
|
|
|
|
|
|
NOT REPORTED
| 6 | 46 | 28 | 8 | 88
|0|2|0|1|3
| 91
------------------------------------------------------------------------------------------------------------------------------------
Total
| 178 | 3013 | 2122 | 435 | 5748
| 9 | 120 | 88 | 25 | 242
| 5990
|
|
|
|
|
|
|
|
|
|
|
|
|
|
|
|
|
|
|
|
|
|
|
|
|
|
|
|
|
|
|
|
|
|
|
|
|
|
|
|
|
|
|
|
|
|
|
|
|
|
|
|
|
|
|
AVG EDUCATION LEVEL | 9.37 | 10.97 | 11.23 | 9.80 | 10.93 | 9.33 | 11.36 | 12.05 | 11.13 | 11.51 | 10.95
* NOTE: THE FIELD LABLED "LESS THAN GRADE 7" WAS CORRECTED IN MARCH 1989: MISSING DATA FOR INMATES STILL IN DIAGNOSTICS NOW HAS BEEN REMOVED FROM THIS FIELD AND IDENTIFIED AS "NOT REPORTED" INFORMATION.
Page 7 Run 05/22/01
Georgia Department of Corrections Office of Planning and Analysis
Inmate statistical profile
Sample: ACTIVE PRISONERS SERVING LIFE EXCLUDING JAIL
Requestor: Statistics
Active inmates 05/22/2001
Functional Reading Level (WRAT Scores) by current age & sex
|
MEN
|
WOMEN
|
| Age | Age | Age | Age | Men
| Age | Age | Age | Age |Women
|Grand
WRAT Reading Score |00-21 %|22-39 %|40-54 %|55-99 %|Total % |00-21 %|22-39 %|40-54 %|55-99 %|Total % |Total %
------------------------------------------------------------------------------------------------------------------------------------
LESS THAN GRADE 6 | 67 40| 1101 38| 862 46| 182 50| 2212 42 | 1 13| 45 38| 22 27| 10 43| 78 34 | 2290 41
6TH THRU 8TH GRADE | 33 20| 682 24| 410 22| 63 17| 1188 22 | 2 25| 27 23| 21 25| 4 17| 54 23 | 1242 23
GRADE 9
| 10 6| 210 7| 116 6| 23 6| 359 7 | 1 13| 3 3| 7 8| 2 9| 13 6 | 372 7
GRADE 10
| 11 7| 136 5| 74 4| 14 4| 235 4 | 1 13| 2 2| 6 7| 1 4| 10 4 | 245 4
GRADE 11
| 6 4| 117 4| 85 5| 9 2| 217 4 | 0 0| 4 3| 5 6| 1 4| 10 4 | 227 4
GRADE 12
| 28 17| 522 18| 298 16| 71 19| 919 17 | 3 38| 7 6| 2 2| 1 4| 13 6 | 932 17
MORE THAN GRADE 12 | 12 7| 111 4| 31 2| 5 1| 159 3 | 0 0| 29 25| 20 24| 4 17| 53 23 | 212 4
------------------------------------------------------------------------------------------------------------------------------------
Total reported
| 167 100| 2879 100| 1876 100| 367 100| 5289 100 | 8 100| 117 100| 83 100| 23 100| 231 100 | 5520 100
|
|
|
|
|
|
|
|
|
|
|
Percent reported |
93.8|
95.6|
88.4|
84.4|
92.0 |
88.9|
97.5|
94.3|
92.0|
95.5 |
92.2
|
|
|
|
|
|
|
|
|
|
|
|
|
|
|
|
|
|
|
|
|
|
NOT REPORTED
| 11 | 134 | 246 | 68 | 459
| 1 | 3 | 5 | 2 | 11
| 470
------------------------------------------------------------------------------------------------------------------------------------
Total
| 178 | 3013 | 2122 | 435 | 5748
| 9 | 120 | 88 | 25 | 242
| 5990
|
|
|
|
|
|
|
|
|
|
|
|
|
|
|
|
|
|
|
|
|
|
|
|
|
|
|
|
|
|
|
|
|
|
|
|
|
|
|
|
|
|
|
|
|
|
|
|
|
|
|
|
|
|
|
AVG READING SCORE | 7.83 | 7.72 | 7.03 | 6.86 | 7.42 | 9.35 | 8.02 | 8.41 | 7.36 | 8.14 | 7.45
Page 8 Run 05/22/01
Georgia Department of Corrections Office of Planning and Analysis
Inmate statistical profile
Sample: ACTIVE PRISONERS SERVING LIFE EXCLUDING JAIL
Requestor: Statistics
Active inmates 05/22/2001
Functional Math Level (WRAT Scores) by current age & sex
|
MEN
|
WOMEN
|
| Age | Age | Age | Age | Men
| Age | Age | Age | Age |Women
|Grand
WRAT Math Score
|00-21 %|22-39 %|40-54 %|55-99 %|Total % |00-21 %|22-39 %|40-54 %|55-99 %|Total % |Total %
------------------------------------------------------------------------------------------------------------------------------------
LESS THAN GRADE 6 | 62 37| 850 29| 822 44| 182 50| 1916 36 | 2 25| 41 35| 30 36| 10 43| 83 36 | 1999 36
6TH THRU 8TH GRADE | 73 44| 1462 51| 692 37| 100 27| 2327 44 | 5 63| 52 44| 34 40| 8 35| 99 43 | 2426 44
GRADE 9
| 8 5| 229 8| 129 7| 27 7| 393 7 | 1 13| 11 9| 6 7| 2 9| 20 9 | 413 7
GRADE 10
| 16 10| 135 5| 100 5| 20 5| 271 5 | 0 0| 7 6| 3 4| 1 4| 11 5 | 282 5
GRADE 11
| 4 2| 90 3| 52 3| 15 4| 161 3 | 0 0| 0 0| 3 4| 2 9| 5 2 | 166 3
GRADE 12
| 2 1| 98 3| 83 4| 20 5| 203 4 | 0 0| 2 2| 3 4| 0 0| 5 2 | 208 4
MORE THAN GRADE 12 | 2 1| 19 1| 3 0| 3 1| 27 1 | 0 0| 4 3| 5 6| 0 0| 9 4 | 36 1
------------------------------------------------------------------------------------------------------------------------------------
Total reported
| 167 100| 2883 100| 1881 100| 367 100| 5298 100 | 8 100| 117 100| 84 100| 23 100| 232 100 | 5530 100
|
|
|
|
|
|
|
|
|
|
|
Percent reported |
93.8|
95.7|
88.6|
84.4|
92.2 |
88.9|
97.5|
95.5|
92.0|
95.9 |
92.3
|
|
|
|
|
|
|
|
|
|
|
|
|
|
|
|
|
|
|
|
|
|
NOT REPORTED
| 11 | 130 | 241 | 68 | 450
| 1 | 3 | 4 | 2 | 10
| 460
------------------------------------------------------------------------------------------------------------------------------------
Total
| 178 | 3013 | 2122 | 435 | 5748
| 9 | 120 | 88 | 25 | 242
| 5990
|
|
|
|
|
|
|
|
|
|
|
|
|
|
|
|
|
|
|
|
|
|
|
|
|
|
|
|
|
|
|
|
|
|
|
|
|
|
|
|
|
|
|
|
|
|
|
|
|
|
|
|
|
|
|
AVG MATH SCORE
| 6.83 | 7.13 | 6.59 | 6.43 | 6.88 | 6.83 | 7.08 | 7.26 | 6.17 | 7.05 | 6.89
Page 9 Run 05/22/01
Georgia Department of Corrections Office of Planning and Analysis
Inmate statistical profile
Sample: ACTIVE PRISONERS SERVING LIFE EXCLUDING JAIL
Requestor: Statistics
Active inmates 05/22/2001
Functional Spelling Level (WRAT Scores) by current age & sex
|
MEN
|
WOMEN
|
| Age | Age | Age | Age | Men
| Age | Age | Age | Age |Women
|Grand
WRAT Spelling Score |00-21 %|22-39 %|40-54 %|55-99 %|Total % |00-21 %|22-39 %|40-54 %|55-99 %|Total % |Total %
------------------------------------------------------------------------------------------------------------------------------------
LESS THAN GRADE 6 | 61 37| 1278 44| 1073 57| 218 59| 2630 50 | 2 25| 40 34| 28 33| 12 52| 82 35 | 2712 49
6TH THRU 8TH GRADE | 56 34| 784 27| 385 21| 71 19| 1296 24 | 3 38| 31 26| 20 24| 3 13| 57 25 | 1353 24
GRADE 9
| 10 6| 178 6| 111 6| 14 4| 313 6 | 1 13| 8 7| 3 4| 2 9| 14 6 | 327 6
GRADE 10
| 18 11| 180 6| 70 4| 15 4| 283 5 | 1 13| 9 8| 7 8| 0 0| 17 7 | 300 5
GRADE 11
| 4 2| 134 5| 49 3| 6 2| 193 4 | 1 13| 4 3| 5 6| 2 9| 12 5 | 205 4
GRADE 12
| 10 6| 284 10| 175 9| 40 11| 509 10 | 0 0| 8 7| 5 6| 0 0| 13 6 | 522 9
MORE THAN GRADE 12 | 8 5| 42 1| 14 1| 3 1| 67 1 | 0 0| 17 15| 16 19| 4 17| 37 16 | 104 2
------------------------------------------------------------------------------------------------------------------------------------
Total reported
| 167 100| 2880 100| 1877 100| 367 100| 5291 100 | 8 100| 117 100| 84 100| 23 100| 232 100 | 5523 100
|
|
|
|
|
|
|
|
|
|
|
Percent reported |
93.8|
95.6|
88.5|
84.4|
92.0 |
88.9|
97.5|
95.5|
92.0|
95.9 |
92.2
|
|
|
|
|
|
|
|
|
|
|
|
|
|
|
|
|
|
|
|
|
|
NOT REPORTED
| 11 | 133 | 245 | 68 | 457
| 1 | 3 | 4 | 2 | 10
| 467
------------------------------------------------------------------------------------------------------------------------------------
Total
| 178 | 3013 | 2122 | 435 | 5748
| 9 | 120 | 88 | 25 | 242
| 5990
|
|
|
|
|
|
|
|
|
|
|
|
|
|
|
|
|
|
|
|
|
|
|
|
|
|
|
|
|
|
|
|
|
|
|
|
|
|
|
|
|
|
|
|
|
|
|
|
|
|
|
|
|
|
|
AVG SPELLING SCORE | 7.26 | 6.93 | 6.08 | 5.84 | 6.56 | 7.91 | 7.94 | 8.16 | 6.70 | 7.90 | 6.62
Page 10 Run 05/22/01
Georgia Department of Corrections Office of Planning and Analysis
Inmate statistical profile
Sample: ACTIVE PRISONERS SERVING LIFE EXCLUDING JAIL
Requestor: Statistics
Active inmates 05/22/2001
Self-Rpt Guardian Status To Age 16 by current age & sex
|
MEN
|
WOMEN
|
| Age | Age | Age | Age | Men
| Age | Age | Age | Age |Women
|Grand
Guardian Status
|00-21 %|22-39 %|40-54 %|55-99 %|Total % |00-21 %|22-39 %|40-54 %|55-99 %|Total % |Total %
------------------------------------------------------------------------------------------------------------------------------------
ORPHANAGE
| 0 0| 4 0| 4 0| 3 1| 11 0 | 0 0| 0 0| 0 0| 0 0| 0 0 | 11 0
FATHER ONLY
| 8 5| 82 3| 61 3| 7 2| 158 3 | 0 0| 2 2| 2 2| 1 4| 5 2 | 163 3
FTR MTR HD
| 12 7| 121 4| 70 3| 7 2| 210 4 | 0 0| 1 1| 5 6| 0 0| 6 3 | 216 4
MOTHER ONLY
| 87 51| 1401 47| 678 33| 110 26| 2276 40 | 5 56| 45 38| 26 30| 8 35| 84 36 | 2360 40
MTR FTR HD
| 36 21| 912 31| 983 47| 232 55| 2163 38 | 4 44| 45 38| 45 52| 13 57| 107 45 | 2270 39
OTH FEMALE
| 2 1| 57 2| 49 2| 16 4| 124 2 | 0 0| 4 3| 2 2| 0 0| 6 3 | 130 2
OTH MALE
| 2 1| 6 0| 13 1| 1 0| 22 0 | 0 0| 1 1| 2 2| 0 0| 3 1 | 25 0
STEP-PARNTS
| 3 2| 52 2| 27 1| 7 2| 89 2 | 0 0| 0 0| 0 0| 0 0| 0 0 | 89 2
FOSTER HOME
| 4 2| 26 1| 31 1| 7 2| 68 1 | 0 0| 2 2| 0 0| 0 0| 2 1 | 70 1
GRAND PRNTS
| 14 8| 238 8| 134 6| 27 6| 413 7 | 0 0| 15 13| 4 5| 1 4| 20 8 | 433 7
OTHER
| 4 2| 62 2| 27 1| 6 1| 99 2 | 0 0| 3 3| 0 0| 0 0| 3 1 | 102 2
------------------------------------------------------------------------------------------------------------------------------------
Total reported
| 172 100| 2961 100| 2077 100| 423 100| 5633 100 | 9 100| 118 100| 86 100| 23 100| 236 100 | 5869 100
|
|
|
|
|
|
|
|
|
|
|
Percent reported |
96.6|
98.3|
97.9|
97.2|
98.0 | 100.0|
98.3|
97.7|
92.0|
97.5 |
98.0
|
|
|
|
|
|
|
|
|
|
|
|
|
|
|
|
|
|
|
|
|
|
NOT RPTD
| 6 | 52 | 45 | 12 | 115
|0|2|2|2|6
| 121
------------------------------------------------------------------------------------------------------------------------------------
Total
| 178 | 3013 | 2122 | 435 | 5748
| 9 | 120 | 88 | 25 | 242
| 5990
Page 11 Run 05/22/01
Georgia Department of Corrections Office of Planning and Analysis
Inmate statistical profile
Sample: ACTIVE PRISONERS SERVING LIFE EXCLUDING JAIL
Requestor: Statistics
Active inmates 05/22/2001
Self-Rpt Employment Status Before Prison by current age & sex
|
MEN
|
WOMEN
|
| Age | Age | Age | Age | Men
| Age | Age | Age | Age |Women
|Grand
Employment
|00-21 %|22-39 %|40-54 %|55-99 %|Total % |00-21 %|22-39 %|40-54 %|55-99 %|Total % |Total %
------------------------------------------------------------------------------------------------------------------------------------
FULL TIME
| 33 20| 967 34| 773 38| 171 42| 1944 36 | 1 11| 28 25| 14 16| 5 23| 48 21 | 1992 35
PART TIME
| 7 4| 234 8| 112 6| 22 5| 375 7 | 0 0| 6 5| 3 4| 0 0| 9 4 | 384 7
UNEMPL < 6M
| 14 9| 461 16| 336 17| 59 15| 870 16 | 0 0| 22 19| 22 26| 4 18| 48 21 | 918 16
UNEMPL > 6M
| 18 11| 873 31| 720 36| 113 28| 1724 32 | 2 22| 33 29| 37 44| 11 50| 83 36 | 1807 32
NEVER WORKD
| 70 43| 260 9| 22 1| 3 1| 355 7 | 3 33| 23 20| 4 5| 0 0| 30 13 | 385 7
STUDENT
| 18 11| 34 1| 6 0| 1 0| 59 1 | 3 33| 1 1| 2 2| 0 0| 6 3 | 65 1
INCAPABLE
| 1 1| 32 1| 49 2| 34 8| 116 2 | 0 0| 0 0| 3 4| 2 9| 5 2 | 121 2
OTHER
| 0 0| 0 0| 0 0| 0 0| 0 0 | 0 0| 0 0| 0 0| 0 0| 0 0 | 0 0
------------------------------------------------------------------------------------------------------------------------------------
Total reported
| 161 100| 2861 100| 2018 100| 403 100| 5443 100 | 9 100| 113 100| 85 100| 22 100| 229 100 | 5672 100
|
|
|
|
|
|
|
|
|
|
|
Percent reported |
90.4|
95.0|
95.1|
92.6|
94.7 | 100.0|
94.2|
96.6|
88.0|
94.6 |
94.7
|
|
|
|
|
|
|
|
|
|
|
|
|
|
|
|
|
|
|
|
|
|
NOT RPTD
| 17 | 152 | 104 | 32 | 305
| 0 | 7 | 3 | 3 | 13
| 318
------------------------------------------------------------------------------------------------------------------------------------
Total
| 178 | 3013 | 2122 | 435 | 5748
| 9 | 120 | 88 | 25 | 242
| 5990
* NOTE: THE FIELD LABELD "OTHER" WAS CORRECTED IN APRIL 1989; INMATES CODED "PRE-OTIS NOT REPORTED" NOW HAVE BEEN REMOVED FROM THIS FIELD AND IDENTIFIED AS "NOT REPORTED".
Page 12 Run 05/22/01
Georgia Department of Corrections Office of Planning and Analysis
Inmate statistical profile
Sample: ACTIVE PRISONERS SERVING LIFE EXCLUDING JAIL
Requestor: Statistics
Active inmates 05/22/2001
Self-Rpt Marital Status At Admission by current age & sex
|
MEN
|
WOMEN
|
| Age | Age | Age | Age | Men
| Age | Age | Age | Age |Women
|Grand
Marital Status
|00-21 %|22-39 %|40-54 %|55-99 %|Total % |00-21 %|22-39 %|40-54 %|55-99 %|Total % |Total %
------------------------------------------------------------------------------------------------------------------------------------
SINGLE
| 160 92| 2044 69| 736 35| 56 13| 2996 53 | 9 100| 70 59| 16 18| 2 9| 97 41 | 3093 53
MARRIED
| 1 1| 232 8| 390 19| 120 28| 743 13 | 0 0| 11 9| 17 20| 3 13| 31 13 | 774 13
SEPARATED
| 0 0| 98 3| 168 8| 43 10| 309 5 | 0 0| 13 11| 8 9| 2 9| 23 10 | 332 6
DIVORCED
| 0 0| 138 5| 353 17| 99 23| 590 10 | 0 0| 9 8| 14 16| 6 26| 29 12 | 619 11
WIDOWED
| 2 1| 43 1| 93 4| 54 13| 192 3 | 0 0| 5 4| 20 23| 9 39| 34 14 | 226 4
COMMON LAW
| 10 6| 403 14| 344 16| 52 12| 809 14 | 0 0| 11 9| 12 14| 1 4| 24 10 | 833 14
OTHER
| 0 0| 2 0| 2 0| 0 0| 4 0 | 0 0| 0 0| 0 0| 0 0| 0 0 | 4 0
------------------------------------------------------------------------------------------------------------------------------------
Total reported
| 173 100| 2960 100| 2086 100| 424 100| 5643 100 | 9 100| 119 100| 87 100| 23 100| 238 100 | 5881 100
|
|
|
|
|
|
|
|
|
|
|
Percent reported |
97.2|
98.2|
98.3|
97.5|
98.2 | 100.0|
99.2|
98.9|
92.0|
98.3 |
98.2
|
|
|
|
|
|
|
|
|
|
|
|
|
|
|
|
|
|
|
|
|
|
NOT RPTD
| 5 | 53 | 36 | 11 | 105
|0|1|1|2|4
| 109
------------------------------------------------------------------------------------------------------------------------------------
Total
| 178 | 3013 | 2122 | 435 | 5748
| 9 | 120 | 88 | 25 | 242
| 5990
Page 13 Run 05/22/01
Georgia Department of Corrections Office of Planning and Analysis
Inmate statistical profile
Sample: ACTIVE PRISONERS SERVING LIFE EXCLUDING JAIL
Requestor: Statistics
Active inmates 05/22/2001
Self-Rpt Number Of Children At Admission by current age & sex
|
MEN
|
WOMEN
|
| Age | Age | Age | Age | Men
| Age | Age | Age | Age |Women
|Grand
Number Of Children |00-21 %|22-39 %|40-54 %|55-99 %|Total % |00-21 %|22-39 %|40-54 %|55-99 %|Total % |Total %
------------------------------------------------------------------------------------------------------------------------------------
NO CHILDREN
| 0 0| 420 21| 281 17| 38 10| 739 18 | 0 0| 3 3| 3 4| 1 4| 7 4 | 746 18
ONE CHILD
| 36 78| 746 38| 485 30| 63 17| 1330 33 | 1 100| 28 31| 18 23| 1 4| 48 25 | 1378 33
TWO CHILDREN
| 5 11| 417 21| 381 23| 83 22| 886 22 | 0 0| 33 37| 22 28| 9 39| 64 34 | 950 23
THREE CHILDREN
| 4 9| 240 12| 238 15| 73 20| 555 14 | 0 0| 14 16| 16 21| 7 30| 37 19 | 592 14
FOUR CHILDREN
| 0 0| 84 4| 119 7| 45 12| 248 6 | 0 0| 6 7| 11 14| 3 13| 20 10 | 268 6
FIVE CHILDREN
| 1 2| 34 2| 64 4| 25 7| 124 3 | 0 0| 4 4| 2 3| 1 4| 7 4 | 131 3
MORE THAN 5 CHILDREN| 0 0| 32 2| 61 4| 42 11| 135 3 | 0 0| 1 1| 6 8| 1 4| 8 4 | 143 3
------------------------------------------------------------------------------------------------------------------------------------
Total reported
| 46 100| 1973 100| 1629 100| 369 100| 4017 100 | 1 100| 89 100| 78 100| 23 100| 191 100 | 4208 100
|
|
|
|
|
|
|
|
|
|
|
Percent reported |
25.8|
65.5|
76.8|
84.8|
69.9 |
11.1|
74.2|
88.6|
92.0|
78.9 |
70.3
|
|
|
|
|
|
|
|
|
|
|
|
|
|
|
|
|
|
|
|
|
|
NOT REPORTED
| 132 | 1040 | 493 | 66 | 1731
| 8 | 31 | 10 | 2 | 51
| 1782
------------------------------------------------------------------------------------------------------------------------------------
Total
| 178 | 3013 | 2122 | 435 | 5748
| 9 | 120 | 88 | 25 | 242
| 5990
|
|
|
|
|
|
|
|
|
|
|
|
|
|
|
|
|
|
|
|
|
|
|
|
|
|
|
|
|
|
|
|
|
|
|
|
|
|
|
|
|
|
|
|
|
|
|
|
|
|
|
|
|
|
|
AVG NUM CHILDREN | 1.37 | 1.63 | 2.04 | 2.87 | 1.91 | 1.00 | 2.09 | 2.60 | 2.78 | 2.38 | 1.93
* NOTE: THE FIELD LABLED "NO CHILDREN" WAS CORRECTED IN MARCH 1989: MISSING DATA FOR INMATES STILL IN DIAGNOSTICS NOW HAS BEEN REMOVED FROM THIS FIELD AND IDENTIFIED AS "NOT REPORTED" INFORMATION.
Page 14 Run 05/22/01
Georgia Department of Corrections Office of Planning and Analysis
Inmate statistical profile
Sample: ACTIVE PRISONERS SERVING LIFE EXCLUDING JAIL
Requestor: Statistics
Active inmates 05/22/2001
Self-Rpt Religious Affiliation by current age & sex
|
MEN
|
WOMEN
|
| Age | Age | Age | Age | Men
| Age | Age | Age | Age |Women
|Grand
Religion
|00-21 %|22-39 %|40-54 %|55-99 %|Total % |00-21 %|22-39 %|40-54 %|55-99 %|Total % |Total %
------------------------------------------------------------------------------------------------------------------------------------
ISLAM
| 3 2| 148 5| 78 4| 10 2| 239 4 | 0 0| 1 1| 0 0| 0 0| 1 0 | 240 4
CATHOLIC
| 4 2| 86 3| 68 4| 19 5| 177 3 | 0 0| 7 6| 3 4| 1 5| 11 5 | 188 3
BAPTIST
| 72 42| 1459 51| 1203 62| 239 59| 2973 55 | 5 56| 63 55| 45 54| 15 68| 128 56 | 3101 55
METHODIST
| 2 1| 68 2| 86 4| 28 7| 184 3 | 0 0| 3 3| 8 10| 1 5| 12 5 | 196 4
EPISCOPLN
| 1 1| 4 0| 4 0| 2 0| 11 0 | 0 0| 1 1| 2 2| 0 0| 3 1 | 14 0
PRESBYTRN
| 0 0| 7 0| 9 0| 3 1| 19 0 | 0 0| 0 0| 0 0| 2 9| 2 1 | 21 0
CHC OF GOD
| 0 0| 33 1| 25 1| 9 2| 67 1 | 0 0| 4 3| 1 1| 0 0| 5 2 | 72 1
HOLINESS
| 5 3| 128 5| 92 5| 26 6| 251 5 | 2 22| 14 12| 12 14| 0 0| 28 12 | 279 5
JEWISH
| 0 0| 1 0| 3 0| 1 0| 5 0 | 0 0| 0 0| 0 0| 0 0| 0 0 | 5 0
ANGLICAN
| 0 0| 0 0| 0 0| 0 0| 0 0 | 0 0| 1 1| 0 0| 0 0| 1 0 | 1 0
GRK ORTHDX
| 0 0| 0 0| 0 0| 0 0| 0 0 | 0 0| 0 0| 0 0| 0 0| 0 0 | 0 0
HINDU
| 0 0| 0 0| 0 0| 0 0| 0 0 | 0 0| 0 0| 0 0| 0 0| 0 0 | 0 0
BUDDHIST
| 2 1| 2 0| 1 0| 0 0| 5 0 | 0 0| 0 0| 0 0| 0 0| 0 0 | 5 0
TAOIST
| 0 0| 0 0| 0 0| 0 0| 0 0 | 0 0| 0 0| 0 0| 0 0| 0 0 | 0 0
SHINTOIST
| 0 0| 0 0| 0 0| 0 0| 0 0 | 0 0| 0 0| 0 0| 0 0| 0 0 | 0 0
SEVEN D AD
| 0 0| 5 0| 4 0| 1 0| 10 0 | 0 0| 0 0| 0 0| 0 0| 0 0 | 10 0
JEHOVAH WT
| 1 1| 23 1| 13 1| 1 0| 38 1 | 0 0| 0 0| 0 0| 0 0| 0 0 | 38 1
LATR DAY S
| 0 0| 2 0| 1 0| 0 0| 3 0 | 0 0| 0 0| 0 0| 0 0| 0 0 | 3 0
QUAKER
| 0 0| 0 0| 0 0| 0 0| 0 0 | 0 0| 0 0| 0 0| 0 0| 0 0 | 0 0
OTHER PROD
| 18 11| 223 8| 67 3| 17 4| 325 6 | 0 0| 8 7| 6 7| 1 5| 15 7 | 340 6
NONE
| 45 26| 440 15| 141 7| 17 4| 643 12 | 1 11| 6 5| 1 1| 0 0| 8 3 | 651 12
OTHER
| 17 10| 210 7| 147 8| 35 9| 409 8 | 1 11| 7 6| 6 7| 2 9| 16 7 | 425 8
------------------------------------------------------------------------------------------------------------------------------------
Total reported
| 170 100| 2839 100| 1942 100| 408 100| 5359 100 | 9 100| 115 100| 84 100| 22 100| 230 100 | 5589 100
|
|
|
|
|
|
|
|
|
|
|
Percent reported |
95.5|
94.2|
91.5|
93.8|
93.2 | 100.0|
95.8|
95.5|
88.0|
95.0 |
93.3
|
|
|
|
|
|
|
|
|
|
|
|
|
|
|
|
|
|
|
|
|
|
NOT RPTD
| 8 | 174 | 180 | 27 | 389
| 0 | 5 | 4 | 3 | 12
| 401
------------------------------------------------------------------------------------------------------------------------------------
Total
| 178 | 3013 | 2122 | 435 | 5748
| 9 | 120 | 88 | 25 | 242
| 5990
Page 15 Run 05/22/01
Georgia Department of Corrections Office of Planning and Analysis
Inmate statistical profile
Sample: ACTIVE PRISONERS SERVING LIFE EXCLUDING JAIL
Requestor: Statistics
Active inmates 05/22/2001
Self-Rpt Family Behavior Patterns * by current age & sex
|
MEN
|
WOMEN
|
| Age | Age | Age | Age | Men
| Age | Age | Age | Age |Women
|Grand
Family Behavior
|00-21 %|22-39 %|40-54 %|55-99 %|Total % |00-21 %|22-39 %|40-54 %|55-99 %|Total % |Total %
------------------------------------------------------------------------------------------------------------------------------------
CRIMINLTY
| 53 21| 793 24| 531 29| 81 26| 1458 25 | 4 15| 34 18| 17 21| 2 12| 57 18 | 1515 25
ALCOHOLISM
| 19 8| 326 10| 288 16| 48 15| 681 12 | 2 7| 26 13| 16 20| 2 12| 46 15 | 727 12
DRUG ABUSE
| 25 10| 182 5| 71 4| 8 3| 286 5 | 2 7| 20 10| 5 6| 0 0| 27 9 | 313 5
DOMINERING
| 2 1| 13 0| 13 1| 0 0| 28 0 | 6 22| 13 7| 5 6| 2 12| 26 8 | 54 1
MIGRANT
| 1 0| 45 1| 43 2| 1 0| 90 2 | 1 4| 2 1| 2 3| 0 0| 5 2 | 95 2
INFL BTGS
| 6 2| 140 4| 68 4| 16 5| 230 4 | 3 11| 20 10| 6 8| 2 12| 31 10 | 261 4
PERMISSIVE
| 1 0| 7 0| 15 1| 2 1| 25 0 | 1 4| 5 3| 2 3| 0 0| 8 3 | 33 1
FATH ABSNT
| 107 43| 1489 45| 660 36| 126 40| 2382 41 | 5 19| 49 25| 17 21| 7 41| 78 25 | 2460 41
MOTH ABSNT
| 32 13| 304 9| 149 8| 33 10| 518 9 | 1 4| 15 8| 3 4| 1 6| 20 6 | 538 9
NONE
| 3 1| 37 1| 16 1| 2 1| 58 1 | 2 7| 9 5| 7 9| 1 6| 19 6 | 77 1
------------------------------------------------------------------------------------------------------------------------------------
Total reported
| 249 100| 3336 100| 1854 100| 317 100| 5756 100 | 27 100| 193 100| 80 100| 17 100| 317 100 | 6073 100
|
|
|
|
|
|
|
|
|
|
|
Percent reported |
75.8|
70.1|
60.5|
51.0|
65.3 | 100.0|
70.0|
58.0|
48.0|
64.5 |
65.2
|
|
|
|
|
|
|
|
|
|
|
|
|
|
|
|
|
|
|
|
|
|
OTHER
| 43 | 902 | 838 | 213 | 1996
| 0 | 36 | 37 | 13 | 86
| 2082
------------------------------------------------------------------------------------------------------------------------------------
Total
| 178 | 3013 | 2122 | 435 | 5748
| 9 | 120 | 88 | 25 | 242
| 5990
* NOTE: SINCE THERE CAN BE UP TO FIVE BEHAVIOR CODES PER INMATE, THE NUMBER OF CASES REPORTED IN THE DETAIL LINES AND THE TOTAL REPORTED LINE MAY EXCEED THE TOTAL NUMBER OF CASES. IN SHORT, THIS TABLE COUNTS THE NUMBER OF BEHAVIOR PROBLEMS, NOT INMATES.
Page 16 Run 05/22/01
Georgia Department of Corrections Office of Planning and Analysis
Inmate statistical profile
Sample: ACTIVE PRISONERS SERVING LIFE EXCLUDING JAIL
Requestor: Statistics
Active inmates 05/22/2001
Inmate Diagnostic Behavior Problem * by current age & sex
|
MEN
|
WOMEN
|
| Age | Age | Age | Age | Men
| Age | Age | Age | Age |Women
|Grand
Diagnostic Problem |00-21 %|22-39 %|40-54 %|55-99 %|Total % |00-21 %|22-39 %|40-54 %|55-99 %|Total % |Total %
------------------------------------------------------------------------------------------------------------------------------------
ALCOHOLIC
| 1 0| 132 2| 143 4| 41 6| 317 3 | 1 4| 3 1| 12 8| 2 7| 18 4 | 335 3
ALCOH ABSE
| 37 11| 871 16| 651 17| 116 17| 1675 16 | 1 4| 27 13| 17 11| 5 17| 50 12 | 1725 16
DRUG EXP
| 64 18| 779 15| 375 10| 43 6| 1261 12 | 2 8| 21 10| 16 11| 0 0| 39 10 | 1300 12
DRUG ABSE
| 69 20| 961 18| 668 18| 45 7| 1743 17 | 4 16| 41 20| 25 17| 0 0| 70 17 | 1813 17
NARC ADDCT
| 0 0| 95 2| 96 3| 7 1| 198 2 | 0 0| 3 1| 3 2| 0 0| 6 1 | 204 2
EPILEPTIC
| 0 0| 26 0| 24 1| 5 1| 55 1 | 0 0| 0 0| 2 1| 0 0| 2 0 | 57 1
MANIPULTVE
| 31 9| 260 5| 119 3| 22 3| 432 4 | 1 4| 2 1| 0 0| 1 3| 4 1 | 436 4
ASSAULTIVE
| 112 32| 1365 25| 956 25| 183 27| 2616 26 | 7 28| 55 27| 30 20| 5 17| 97 24 | 2713 26
ESCPE TEND
| 5 1| 110 2| 214 6| 43 6| 372 4 | 0 0| 2 1| 4 3| 0 0| 6 1 | 378 4
SUICIDAL
| 9 3| 141 3| 110 3| 16 2| 276 3 | 4 16| 16 8| 7 5| 2 7| 29 7 | 305 3
WITHDRAWN
| 0 0| 34 1| 21 1| 7 1| 62 1 | 2 8| 2 1| 3 2| 0 0| 7 2 | 69 1
PR RLTY CT
| 0 0| 34 1| 49 1| 13 2| 96 1 | 1 4| 1 0| 3 2| 1 3| 6 1 | 102 1
HOMOSEXUAL
| 1 0| 12 0| 10 0| 5 1| 28 0 | 2 8| 4 2| 3 2| 0 0| 9 2 | 37 0
NONE
| 2 1| 280 5| 240 6| 76 11| 598 6 | 0 0| 9 4| 15 10| 9 30| 33 8 | 631 6
OTHER
| 2 1| 70 1| 61 2| 24 4| 157 2 | 0 0| 0 0| 0 0| 3 10| 3 1 | 160 2
NOT RPTD
| 17 5| 187 3| 68 2| 27 4| 299 3 | 0 0| 16 8| 7 5| 2 7| 25 6 | 324 3
------------------------------------------------------------------------------------------------------------------------------------
Total reported
| 350 100| 5366 100| 3806 100| 674 100|10196 100 | 25 100| 202 100| 148 100| 30 100| 405 100 |10601 100
|
|
|
|
|
|
|
|
|
|
|
Percent reported | 100.0|
99.7| 100.0|
99.8|
99.8 | 100.0| 100.0|
98.9| 100.0|
99.6 |
99.8
|
|
|
|
|
|
|
|
|
|
|
|
|
|
|
|
|
|
|
|
|
|
UNKNOWN
| 0 | 9 | 1 | 1 | 11
|0|0|1|0|1
| 12
------------------------------------------------------------------------------------------------------------------------------------
Total
| 178 | 3013 | 2122 | 435 | 5748
| 9 | 120 | 88 | 25 | 242
| 5990
* NOTE: SINCE THERE CAN BE UP TO FIVE BEHAVIOR CODES PER INMATE, THE NUMBER OF CASES REPORTED IN THE DETAIL LINES AND THE TOTAL REPORTED LINE MAY EXCEED THE TOTAL NUMBER OF CASES. IN SHORT, THIS TABLE COUNTS THE NUMBER OF BEHAVIOR PROBLEMS, NOT INMATES.
Page 17 Run 05/22/01
Georgia Department of Corrections Office of Planning and Analysis
Inmate statistical profile
Sample: ACTIVE PRISONERS SERVING LIFE EXCLUDING JAIL
Requestor: Statistics
Active inmates 05/22/2001
Physical Profile (General Condition) by current age & sex
|
MEN
|
WOMEN
|
| Age | Age | Age | Age | Men
| Age | Age | Age | Age |Women
|Grand
Physical Profile |00-21 %|22-39 %|40-54 %|55-99 %|Total % |00-21 %|22-39 %|40-54 %|55-99 %|Total % |Total %
------------------------------------------------------------------------------------------------------------------------------------
NO LIMITATION
| 161 91| 2189 73| 1047 50| 85 20| 3482 61 | 8 89| 86 74| 43 49| 1 5| 138 59 | 3620 61
DEFECT NO MAJOR LIMT| 12 7| 405 14| 455 22| 96 22| 968 17 | 0 0| 4 3| 11 13| 5 23| 20 9 | 988 17
DEFECT MAJOR LIMIT | 4 2| 381 13| 598 28| 224 52| 1207 21 | 1 11| 27 23| 32 37| 14 64| 74 31 | 1281 22
VERY MAJOR DEFECT | 0 0| 5 0| 12 1| 26 6| 43 1 | 0 0| 0 0| 1 1| 2 9| 3 1 | 46 1
------------------------------------------------------------------------------------------------------------------------------------
Total reported
| 177 100| 2980 100| 2112 100| 431 100| 5700 100 | 9 100| 117 100| 87 100| 22 100| 235 100 | 5935 100
|
|
|
|
|
|
|
|
|
|
|
Percent reported |
99.4|
98.9|
99.5|
99.1|
99.2 | 100.0|
97.5|
98.9|
88.0|
97.1 |
99.1
|
|
|
|
|
|
|
|
|
|
|
|
|
|
|
|
|
|
|
|
|
|
NOT REPORTED
| 1 | 33 | 10 | 4 | 48
|0|3|1|3|7
| 55
------------------------------------------------------------------------------------------------------------------------------------
Total
| 178 | 3013 | 2122 | 435 | 5748
| 9 | 120 | 88 | 25 | 242
| 5990
Page 18 Run 05/22/01
Georgia Department of Corrections Office of Planning and Analysis
Inmate statistical profile
Sample: ACTIVE PRISONERS SERVING LIFE EXCLUDING JAIL
Requestor: Statistics
Active inmates 05/22/2001
Security Status by current age & sex
|
MEN
|
WOMEN
|
| Age | Age | Age | Age | Men
| Age | Age | Age | Age |Women
|Grand
Security
|00-21 %|22-39 %|40-54 %|55-99 %|Total % |00-21 %|22-39 %|40-54 %|55-99 %|Total % |Total %
------------------------------------------------------------------------------------------------------------------------------------
DIAG INCOM
| 0 0| 1 0| 1 0| 0 0| 2 0 | 0 0| 0 0| 0 0| 0 0| 0 0 | 2 0
WRK RELEAS
| 0 0| 0 0| 0 0| 0 0| 0 0 | 0 0| 0 0| 0 0| 0 0| 0 0 | 0 0
TRUSTY
| 0 0| 56 2| 43 2| 4 1| 103 2 | 0 0| 1 1| 4 5| 1 4| 6 2 | 109 2
MINIMUM
| 0 0| 384 13| 465 22| 102 23| 951 17 | 0 0| 39 33| 35 40| 16 64| 90 37 | 1041 17
MEDIUM
| 21 12| 1264 42| 1120 53| 255 59| 2660 46 | 1 11| 49 41| 36 41| 8 32| 94 39 | 2754 46
CLOSE
| 147 83| 1148 38| 402 19| 66 15| 1763 31 | 8 89| 31 26| 12 14| 0 0| 51 21 | 1814 30
MAXIMUM
| 4 2| 140 5| 86 4| 6 1| 236 4 | 0 0| 0 0| 1 1| 0 0| 1 0 | 237 4
DIAGNOSTIC
| 6 3| 20 1| 5 0| 2 0| 33 1 | 0 0| 0 0| 0 0| 0 0| 0 0 | 33 1
------------------------------------------------------------------------------------------------------------------------------------
Total reported
| 178 100| 3013 100| 2122 100| 435 100| 5748 100 | 9 100| 120 100| 88 100| 25 100| 242 100 | 5990 100
|
|
|
|
|
|
|
|
|
|
|
Percent reported | 100.0| 100.0| 100.0| 100.0| 100.0 | 100.0| 100.0| 100.0| 100.0| 100.0 | 100.0
|
|
|
|
|
|
|
|
|
|
|
|
|
|
|
|
|
|
|
|
|
|
NOT RPTD
|0|0|0|0|0
|0|0|0|0|0
|0
------------------------------------------------------------------------------------------------------------------------------------
Total
| 178 | 3013 | 2122 | 435 | 5748
| 9 | 120 | 88 | 25 | 242
| 5990
* NOTE: BEGINNING IN JULY 1987, THE FACILITIES DIVISION NO LONGER CODED INMATES AS BEING WORK RELEASE
Page 19 Run 05/22/01
Georgia Department of Corrections Office of Planning and Analysis
Inmate statistical profile
Sample: ACTIVE PRISONERS SERVING LIFE EXCLUDING JAIL
Requestor: Statistics
Active inmates 05/22/2001
Number Of Sentences by current age & sex
|
MEN
|
WOMEN
|
| Age | Age | Age | Age | Men
| Age | Age | Age | Age |Women
|Grand
Number Of Sentences |00-21 %|22-39 %|40-54 %|55-99 %|Total % |00-21 %|22-39 %|40-54 %|55-99 %|Total % |Total %
------------------------------------------------------------------------------------------------------------------------------------
ONE
| 51 29| 736 24| 538 25| 153 35| 1478 26 | 3 33| 44 37| 40 45| 12 48| 99 41 | 1577 26
TWO
| 52 29| 706 23| 497 23| 106 24| 1361 24 | 2 22| 39 33| 24 27| 8 32| 73 30 | 1434 24
THREE
| 22 12| 516 17| 377 18| 66 15| 981 17 | 2 22| 20 17| 10 11| 5 20| 37 15 | 1018 17
FOUR
| 23 13| 336 11| 244 11| 37 9| 640 11 | 1 11| 8 7| 4 5| 0 0| 13 5 | 653 11
FIVE
| 8 4| 232 8| 150 7| 21 5| 411 7 | 1 11| 4 3| 4 5| 0 0| 9 4 | 420 7
MORE THAN FIVE
| 22 12| 487 16| 316 15| 52 12| 877 15 | 0 0| 5 4| 6 7| 0 0| 11 5 | 888 15
------------------------------------------------------------------------------------------------------------------------------------
Total reported
| 178 100| 3013 100| 2122 100| 435 100| 5748 100 | 9 100| 120 100| 88 100| 25 100| 242 100 | 5990 100
|
|
|
|
|
|
|
|
|
|
|
Percent reported | 100.0| 100.0| 100.0| 100.0| 100.0 | 100.0| 100.0| 100.0| 100.0| 100.0 | 100.0
|
|
|
|
|
|
|
|
|
|
|
|
|
|
|
|
|
|
|
|
|
|
NOT REPORTED
|0|0|0|0|0
|0|0|0|0|0
|0
------------------------------------------------------------------------------------------------------------------------------------
Total
| 178 | 3013 | 2122 | 435 | 5748
| 9 | 120 | 88 | 25 | 242
| 5990
|
|
|
|
|
|
|
|
|
|
|
|
|
|
|
|
|
|
|
|
|
|
|
|
|
|
|
|
|
|
|
|
|
|
|
|
|
|
|
|
|
|
|
|
|
|
|
|
|
|
|
|
|
|
|
AVG NUM SENTENCES | 2.89 | 3.42 | 3.33 | 2.88 | 3.33 | 2.44 | 2.33 | 2.26 | 1.72 | 2.24 | 3.29
Page 20 Run 05/22/01
Georgia Department of Corrections Office of Planning and Analysis
Inmate statistical profile
Sample: ACTIVE PRISONERS SERVING LIFE EXCLUDING JAIL
Requestor: Statistics
Active inmates 05/22/2001
Number Of Disciplinaries by current age & sex
|
MEN
|
WOMEN
|
| Age | Age | Age | Age | Men
| Age | Age | Age | Age |Women
|Grand
Disciplinaries
|00-21 %|22-39 %|40-54 %|55-99 %|Total % |00-21 %|22-39 %|40-54 %|55-99 %|Total % |Total %
------------------------------------------------------------------------------------------------------------------------------------
ZERO
| 33 19| 441 15| 336 16| 118 27| 928 16 | 2 22| 22 18| 21 24| 13 52| 58 24 | 986 16
ONE
| 20 11| 300 10| 270 13| 71 16| 661 12 | 1 11| 16 13| 18 20| 6 24| 41 17 | 702 12
TWO
| 20 11| 250 8| 188 9| 52 12| 510 9 | 0 0| 12 10| 9 10| 1 4| 22 9 | 532 9
THREE
| 11 6| 194 6| 149 7| 37 9| 391 7 | 1 11| 10 8| 12 14| 1 4| 24 10 | 415 7
FOUR
| 8 4| 159 5| 118 6| 26 6| 311 5 | 0 0| 4 3| 4 5| 1 4| 9 4 | 320 5
FIVE
| 8 4| 149 5| 94 4| 17 4| 268 5 | 1 11| 5 4| 0 0| 0 0| 6 2 | 274 5
MORE THAN FIVE
| 78 44| 1519 50| 967 46| 114 26| 2678 47 | 4 44| 51 43| 24 27| 3 12| 82 34 | 2760 46
------------------------------------------------------------------------------------------------------------------------------------
Total reported
| 178 100| 3012 100| 2122 100| 435 100| 5747 100 | 9 100| 120 100| 88 100| 25 100| 242 100 | 5989 100
|
|
|
|
|
|
|
|
|
|
|
Percent reported | 100.0| 100.0| 100.0| 100.0| 100.0 | 100.0| 100.0| 100.0| 100.0| 100.0 | 100.0
|
|
|
|
|
|
|
|
|
|
|
|
|
|
|
|
|
|
|
|
|
|
NOT REPORTED
|0|1|0|0|1
|0|0|0|0|0
|1
------------------------------------------------------------------------------------------------------------------------------------
Total
| 178 | 3013 | 2122 | 435 | 5748
| 9 | 120 | 88 | 25 | 242
| 5990
|
|
|
|
|
|
|
|
|
|
|
|
|
|
|
|
|
|
|
|
|
|
|
|
|
|
|
|
|
|
|
|
|
|
|
|
|
|
|
|
|
|
|
|
|
|
|
|
|
|
|
|
|
|
|
AVG NUM DISCIP
| 9.97 | 10.80 | 10.50 | 5.38 | 10.25 | 5.11 | 8.35 | 5.81 | 1.68 | 6.62 | 10.11
Page 21 Run 05/22/01
Georgia Department of Corrections Office of Planning and Analysis
Inmate statistical profile
Sample: ACTIVE PRISONERS SERVING LIFE EXCLUDING JAIL
Requestor: Statistics
Active inmates 05/22/2001
Number Of Escapes by current age & sex
|
MEN
|
WOMEN
|
| Age | Age | Age | Age | Men
| Age | Age | Age | Age |Women
|Grand
Escapes
|00-21 %|22-39 %|40-54 %|55-99 %|Total % |00-21 %|22-39 %|40-54 %|55-99 %|Total % |Total %
------------------------------------------------------------------------------------------------------------------------------------
ZERO
| 178 100| 2980 99| 2032 96| 419 96| 5609 98 | 9 100| 120 100| 86 98| 25 100| 240 99 | 5849 98
ONE
| 0 0| 32 1| 72 3| 10 2| 114 2 | 0 0| 0 0| 2 2| 0 0| 2 1 | 116 2
TWO
| 0 0| 1 0| 14 1| 4 1| 19 0 | 0 0| 0 0| 0 0| 0 0| 0 0 | 19 0
THREE
| 0 0| 0 0| 3 0| 2 0| 5 0 | 0 0| 0 0| 0 0| 0 0| 0 0 | 5 0
FOUR
| 0 0| 0 0| 1 0| 0 0| 1 0 | 0 0| 0 0| 0 0| 0 0| 0 0 | 1 0
FIVE
| 0 0| 0 0| 0 0| 0 0| 0 0 | 0 0| 0 0| 0 0| 0 0| 0 0 | 0 0
MORE THAN FIVE
| 0 0| 0 0| 0 0| 0 0| 0 0 | 0 0| 0 0| 0 0| 0 0| 0 0 | 0 0
------------------------------------------------------------------------------------------------------------------------------------
Total reported
| 178 100| 3013 100| 2122 100| 435 100| 5748 100 | 9 100| 120 100| 88 100| 25 100| 242 100 | 5990 100
|
|
|
|
|
|
|
|
|
|
|
Percent reported | 100.0| 100.0| 100.0| 100.0| 100.0 | 100.0| 100.0| 100.0| 100.0| 100.0 | 100.0
|
|
|
|
|
|
|
|
|
|
|
|
|
|
|
|
|
|
|
|
|
|
NOT REPORTED
|0|0|0|0|0
|0|0|0|0|0
|0
------------------------------------------------------------------------------------------------------------------------------------
Total
| 178 | 3013 | 2122 | 435 | 5748
| 9 | 120 | 88 | 25 | 242
| 5990
|
|
|
|
|
|
|
|
|
|
|
|
|
|
|
|
|
|
|
|
|
|
|
|
|
|
|
|
|
|
|
|
|
|
|
|
|
|
|
|
|
|
|
|
|
|
|
|
|
|
|
|
|
|
|
AVG NUM ESCAPES
| .00 | .01 | .05 | .06 | .03 | .00 | .00 | .02 | .00 | .01 | .03
Page 22 Run 05/22/01
Georgia Department of Corrections Office of Planning and Analysis
Inmate statistical profile
Sample: ACTIVE PRISONERS SERVING LIFE EXCLUDING JAIL
Requestor: Statistics
Active inmates 05/22/2001
Number Of Prior Georgia Incarcerations * by current age & sex
|
MEN
|
WOMEN
|
| Age | Age | Age | Age | Men
| Age | Age | Age | Age |Women
|Grand
Prior Incarcerations|00-21 %|22-39 %|40-54 %|55-99 %|Total % |00-21 %|22-39 %|40-54 %|55-99 %|Total % |Total %
------------------------------------------------------------------------------------------------------------------------------------
ZERO
| 173 97| 2059 68| 962 45| 245 56| 3439 60 | 9 100| 103 86| 69 78| 23 92| 204 84 | 3643 61
ONE
| 4 2| 556 18| 518 24| 101 23| 1179 21 | 0 0| 13 11| 12 14| 1 4| 26 11 | 1205 20
TWO
| 1 1| 218 7| 338 16| 42 10| 599 10 | 0 0| 3 3| 6 7| 1 4| 10 4 | 609 10
THREE
| 0 0| 124 4| 175 8| 32 7| 331 6 | 0 0| 1 1| 0 0| 0 0| 1 0 | 332 6
FOUR
| 0 0| 44 1| 75 4| 11 3| 130 2 | 0 0| 0 0| 0 0| 0 0| 0 0 | 130 2
FIVE
| 0 0| 9 0| 34 2| 2 0| 45 1 | 0 0| 0 0| 0 0| 0 0| 0 0 | 45 1
MORE THAN FIVE
| 0 0| 3 0| 20 1| 2 0| 25 0 | 0 0| 0 0| 1 1| 0 0| 1 0 | 26 0
------------------------------------------------------------------------------------------------------------------------------------
Total reported
| 178 100| 3013 100| 2122 100| 435 100| 5748 100 | 9 100| 120 100| 88 100| 25 100| 242 100 | 5990 100
|
|
|
|
|
|
|
|
|
|
|
Percent reported | 100.0| 100.0| 100.0| 100.0| 100.0 | 100.0| 100.0| 100.0| 100.0| 100.0 | 100.0
|
|
|
|
|
|
|
|
|
|
|
|
|
|
|
|
|
|
|
|
|
|
NOT REPORTED
|0|0|0|0|0
|0|0|0|0|0
|0
------------------------------------------------------------------------------------------------------------------------------------
Total
| 178 | 3013 | 2122 | 435 | 5748
| 9 | 120 | 88 | 25 | 242
| 5990
|
|
|
|
|
|
|
|
|
|
|
|
|
|
|
|
|
|
|
|
|
|
|
|
|
|
|
|
|
|
|
|
|
|
|
|
|
|
|
|
|
|
|
|
|
|
|
|
|
|
|
|
|
|
|
AVG # INCARCERATIONS| .03 | .53 | 1.09 | .80 | .74 | .00 | .18 | .35 | .12 | .23 | .72
* This data counts a parole revocation on an existing sentenCE AS A prior incarceration. Also, this data counts, for any cohort of inmates, the total number of Georgia incarcerations the inmate has had during his entire criminal career. For example, if an inmate was admitted to prison first in FY72, and then re-admitted in FY79 and FY85, he had two prior incarcerations before the FY85 admission. This inmate's records show two prior incarcerations in all three of his records since he has had two prior incarcerations in his criminal career. If the cohort of FY72 admissions is selected for analysis, two prior incarcerations will be listed for this inmate even though in FY72, he had no prior incarcerations.
Page 23 Run 05/22/01
Georgia Department of Corrections Office of Planning and Analysis
Inmate statistical profile
Sample: ACTIVE PRISONERS SERVING LIFE EXCLUDING JAIL
Requestor: Statistics
Active inmates 05/22/2001
Number Of Transfers by current age & sex
|
MEN
|
WOMEN
|
| Age | Age | Age | Age | Men
| Age | Age | Age | Age |Women
|Grand
Transfers
|00-21 %|22-39 %|40-54 %|55-99 %|Total % |00-21 %|22-39 %|40-54 %|55-99 %|Total % |Total %
------------------------------------------------------------------------------------------------------------------------------------
ZERO
| 58 33| 99 3| 22 1| 6 1| 185 3 | 0 0| 4 3| 5 6| 0 0| 9 4 | 194 3
ONE
| 82 46| 851 28| 397 19| 93 21| 1423 25 | 8 89| 35 29| 27 31| 5 20| 75 31 | 1498 25
TWO
| 25 14| 670 22| 345 16| 69 16| 1109 19 | 0 0| 39 33| 17 19| 6 24| 62 26 | 1171 20
THREE
| 10 6| 460 15| 296 14| 72 17| 838 15 | 1 11| 19 16| 17 19| 6 24| 43 18 | 881 15
FOUR
| 1 1| 325 11| 238 11| 41 9| 605 11 | 0 0| 13 11| 9 10| 3 12| 25 10 | 630 11
FIVE
| 2 1| 216 7| 181 9| 34 8| 433 8 | 0 0| 5 4| 5 6| 3 12| 13 5 | 446 7
MORE THAN FIVE
| 0 0| 392 13| 643 30| 120 28| 1155 20 | 0 0| 5 4| 8 9| 2 8| 15 6 | 1170 20
------------------------------------------------------------------------------------------------------------------------------------
Total reported
| 178 100| 3013 100| 2122 100| 435 100| 5748 100 | 9 100| 120 100| 88 100| 25 100| 242 100 | 5990 100
|
|
|
|
|
|
|
|
|
|
|
Percent reported | 100.0| 100.0| 100.0| 100.0| 100.0 | 100.0| 100.0| 100.0| 100.0| 100.0 | 100.0
|
|
|
|
|
|
|
|
|
|
|
|
|
|
|
|
|
|
|
|
|
|
NOT REPORTED
|0|0|0|0|0
|0|0|0|0|0
|0
------------------------------------------------------------------------------------------------------------------------------------
Total
| 178 | 3013 | 2122 | 435 | 5748
| 9 | 120 | 88 | 25 | 242
| 5990
|
|
|
|
|
|
|
|
|
|
|
|
|
|
|
|
|
|
|
|
|
|
|
|
|
|
|
|
|
|
|
|
|
|
|
|
|
|
|
|
|
|
|
|
|
|
|
|
|
|
|
|
|
|
|
AVG NUM TRANSFERS | .99 | 3.01 | 4.59 | 4.31 | 3.63 | 1.22 | 2.37 | 2.65 | 3.04 | 2.50 | 3.58
Page 24 Run 05/22/01
Georgia Department of Corrections Office of Planning and Analysis
Inmate statistical profile
Sample: ACTIVE PRISONERS SERVING LIFE EXCLUDING JAIL
Requestor: Statistics
Active inmates 05/22/2001
County Of Conviction by current age & sex
|
MEN
|
WOMEN
|
| Age | Age | Age | Age | Men
| Age | Age | Age | Age |Women
|Grand
County Of Conviction|00-21 %|22-39 %|40-54 %|55-99 %|Total % |00-21 %|22-39 %|40-54 %|55-99 %|Total % |Total %
------------------------------------------------------------------------------------------------------------------------------------
APPLING COUNTY
| 0 0| 4 0| 4 0| 1 0| 9 0 | 0 0| 0 0| 0 0| 0 0| 0 0 | 9 0
ATKINSON COUNTY
| 0 0| 1 0| 2 0| 2 0| 5 0 | 0 0| 0 0| 1 1| 0 0| 1 0 | 6 0
BACON COUNTY
| 0 0| 6 0| 3 0| 0 0| 9 0 | 0 0| 0 0| 0 0| 0 0| 0 0 | 9 0
BAKER COUNTY
| 0 0| 1 0| 1 0| 0 0| 2 0 | 0 0| 0 0| 0 0| 0 0| 0 0 | 2 0
BALDWIN COUNTY
| 0 0| 18 1| 12 1| 1 0| 31 1 | 0 0| 1 1| 0 0| 0 0| 1 0 | 32 1
BANKS COUNTY
| 0 0| 2 0| 9 0| 2 0| 13 0 | 0 0| 0 0| 0 0| 0 0| 0 0 | 13 0
BARROW COUNTY
| 0 0| 3 0| 9 0| 4 1| 16 0 | 0 0| 0 0| 1 1| 0 0| 1 0 | 17 0
BARTOW COUNTY
| 1 1| 27 1| 20 1| 2 0| 50 1 | 0 0| 2 2| 0 0| 0 0| 2 1 | 52 1
BEN HILL COUNTY
| 0 0| 6 0| 9 0| 3 1| 18 0 | 0 0| 0 0| 0 0| 0 0| 0 0 | 18 0
BERRIEN COUNTY
| 0 0| 4 0| 1 0| 0 0| 5 0 | 0 0| 0 0| 0 0| 0 0| 0 0 | 5 0
BIBB COUNTY
| 3 2| 90 3| 83 4| 18 4| 194 3 | 1 11| 1 1| 2 2| 1 4| 5 2 | 199 3
BLECKLEY COUNTY
| 0 0| 7 0| 4 0| 1 0| 12 0 | 0 0| 0 0| 1 1| 0 0| 1 0 | 13 0
BRANTLEY COUNTY
| 0 0| 1 0| 4 0| 2 0| 7 0 | 0 0| 0 0| 0 0| 0 0| 0 0 | 7 0
BROOKS COUNTY
| 0 0| 5 0| 4 0| 2 0| 11 0 | 0 0| 0 0| 0 0| 0 0| 0 0 | 11 0
BRYAN COUNTY
| 0 0| 9 0| 5 0| 1 0| 15 0 | 0 0| 0 0| 0 0| 1 4| 1 0 | 16 0
BULLOCH COUNTY
| 1 1| 17 1| 14 1| 0 0| 32 1 | 0 0| 1 1| 1 1| 1 4| 3 1 | 35 1
BURKE COUNTY
| 2 1| 15 0| 12 1| 2 0| 31 1 | 0 0| 0 0| 0 0| 0 0| 0 0 | 31 1
BUTTS COUNTY
| 2 1| 22 1| 11 1| 2 0| 37 1 | 0 0| 2 2| 1 1| 0 0| 3 1 | 40 1
CALHOUN COUNTY
| 0 0| 2 0| 4 0| 1 0| 7 0 | 0 0| 0 0| 0 0| 0 0| 0 0 | 7 0
CAMDEN COUNTY
| 1 1| 20 1| 9 0| 0 0| 30 1 | 0 0| 0 0| 1 1| 0 0| 1 0 | 31 1
CANDLER COUNTY
| 0 0| 1 0| 1 0| 0 0| 2 0 | 0 0| 0 0| 0 0| 0 0| 0 0 | 2 0
CARROLL COUNTY
| 0 0| 19 1| 13 1| 6 1| 38 1 | 0 0| 2 2| 1 1| 0 0| 3 1 | 41 1
CATOOSA COUNTY
| 0 0| 5 0| 8 0| 0 0| 13 0 | 0 0| 0 0| 0 0| 0 0| 0 0 | 13 0
CHARLTON COUNTY
| 0 0| 1 0| 0 0| 0 0| 1 0 | 0 0| 2 2| 0 0| 0 0| 2 1 | 3 0
CHATHAM COUNTY
| 9 5| 161 5| 113 5| 16 4| 299 5 | 0 0| 2 2| 1 1| 0 0| 3 1 | 302 5
CHATTAHOOCHEE COUNTY| 0 0| 1 0| 2 0| 0 0| 3 0 | 0 0| 0 0| 0 0| 0 0| 0 0 | 3 0
CHATTOOGA COUNTY | 0 0| 5 0| 6 0| 2 0| 13 0 | 0 0| 0 0| 1 1| 1 4| 2 1 | 15 0
CHEROKEE COUNTY
| 1 1| 8 0| 21 1| 2 0| 32 1 | 0 0| 3 3| 0 0| 0 0| 3 1 | 35 1
CLARKE COUNTY
| 2 1| 39 1| 22 1| 8 2| 71 1 | 0 0| 2 2| 0 0| 1 4| 3 1 | 74 1
CLAY COUNTY
| 0 0| 1 0| 1 0| 0 0| 2 0 | 0 0| 0 0| 0 0| 0 0| 0 0 | 2 0
CLAYTON COUNTY
| 5 3| 73 2| 39 2| 11 3| 128 2 | 1 11| 2 2| 2 2| 1 4| 6 2 | 134 2
CLINCH COUNTY
| 0 0| 1 0| 3 0| 0 0| 4 0 | 0 0| 0 0| 0 0| 0 0| 0 0 | 4 0
COBB COUNTY
| 7 4| 107 4| 76 4| 14 3| 204 4 | 0 0| 6 5| 3 3| 1 4| 10 4 | 214 4
COFFEE COUNTY
| 0 0| 8 0| 8 0| 2 0| 18 0 | 0 0| 1 1| 1 1| 0 0| 2 1 | 20 0
COLQUITT COUNTY
| 3 2| 36 1| 25 1| 4 1| 68 1 | 0 0| 0 0| 1 1| 1 4| 2 1 | 70 1
COLUMBIA COUNTY
| 1 1| 5 0| 11 1| 2 0| 19 0 | 0 0| 0 0| 1 1| 0 0| 1 0 | 20 0
------------------------------------------------------------------------------------------------------------------------------------
(continued)
Page 25 Run 05/22/01
Georgia Department of Corrections Office of Planning and Analysis
Inmate statistical profile
Sample: ACTIVE PRISONERS SERVING LIFE EXCLUDING JAIL
Requestor:
Active inmates 05/22/2001
County Of Conviction by current age & sex
Statistics (CONTINUED)
|
MEN
|
WOMEN
|
| Age | Age | Age | Age | Men
| Age | Age | Age | Age |Women
|Grand
County Of Conviction|00-21 %|22-39 %|40-54 %|55-99 %|Total % |00-21 %|22-39 %|40-54 %|55-99 %|Total % |Total %
------------------------------------------------------------------------------------------------------------------------------------
COOK COUNTY
| 0 0| 7 0| 3 0| 0 0| 10 0 | 0 0| 1 1| 0 0| 0 0| 1 0 | 11 0
COWETA COUNTY
| 3 2| 23 1| 10 0| 3 1| 39 1 | 0 0| 2 2| 1 1| 0 0| 3 1 | 42 1
CRAWFORD COUNTY
| 0 0| 3 0| 0 0| 0 0| 3 0 | 0 0| 0 0| 0 0| 0 0| 0 0 | 3 0
CRISP COUNTY
| 3 2| 14 0| 11 1| 2 0| 30 1 | 0 0| 3 3| 0 0| 1 4| 4 2 | 34 1
DADE COUNTY
| 2 1| 7 0| 5 0| 3 1| 17 0 | 0 0| 0 0| 0 0| 0 0| 0 0 | 17 0
DAWSON COUNTY
| 0 0| 2 0| 4 0| 0 0| 6 0 | 0 0| 0 0| 0 0| 0 0| 0 0 | 6 0
DECATUR COUNTY
| 1 1| 21 1| 6 0| 1 0| 29 1 | 0 0| 1 1| 0 0| 0 0| 1 0 | 30 1
DEKALB COUNTY
| 14 8| 249 8| 163 8| 24 6| 450 8 | 1 11| 3 3| 4 5| 1 4| 9 4 | 459 8
DODGE COUNTY
| 0 0| 6 0| 4 0| 1 0| 11 0 | 0 0| 0 0| 0 0| 0 0| 0 0 | 11 0
DOOLY COUNTY
| 2 1| 8 0| 7 0| 0 0| 17 0 | 0 0| 0 0| 0 0| 0 0| 0 0 | 17 0
DOUGHERTY COUNTY | 4 2| 73 2| 41 2| 5 1| 123 2 | 0 0| 4 3| 1 1| 0 0| 5 2 | 128 2
DOUGLAS COUNTY
| 4 2| 49 2| 19 1| 6 1| 78 1 | 0 0| 1 1| 1 1| 0 0| 2 1 | 80 1
EARLY COUNTY
| 0 0| 10 0| 5 0| 2 0| 17 0 | 0 0| 0 0| 0 0| 0 0| 0 0 | 17 0
ECHOLS COUNTY.
| 0 0| 0 0| 0 0| 0 0| 0 0 | 0 0| 0 0| 0 0| 0 0| 0 0 | 0 0
EFFINGHAM COUNTY | 0 0| 5 0| 4 0| 0 0| 9 0 | 0 0| 0 0| 0 0| 0 0| 0 0 | 9 0
ELBERT COUNTY
| 0 0| 12 0| 10 0| 1 0| 23 0 | 0 0| 1 1| 0 0| 0 0| 1 0 | 24 0
EMANUEL COUNTY
| 0 0| 8 0| 10 0| 3 1| 21 0 | 0 0| 0 0| 1 1| 0 0| 1 0 | 22 0
EVANS COUNTY
| 0 0| 7 0| 4 0| 2 0| 13 0 | 0 0| 0 0| 0 0| 0 0| 0 0 | 13 0
FANNIN COUNTY
| 0 0| 4 0| 5 0| 1 0| 10 0 | 0 0| 0 0| 0 0| 0 0| 0 0 | 10 0
FAYETTE COUNTY
| 1 1| 9 0| 5 0| 0 0| 15 0 | 0 0| 0 0| 0 0| 0 0| 0 0 | 15 0
FLOYD COUNTY
| 1 1| 27 1| 26 1| 6 1| 60 1 | 2 22| 3 3| 2 2| 1 4| 8 3 | 68 1
FORSYTH COUNTY
| 0 0| 5 0| 9 0| 4 1| 18 0 | 0 0| 1 1| 1 1| 0 0| 2 1 | 20 0
FRANKLIN COUNTY
| 1 1| 2 0| 3 0| 1 0| 7 0 | 0 0| 0 0| 2 2| 1 4| 3 1 | 10 0
FULTON COUNTY
| 29 16| 470 16| 316 15| 64 15| 879 15 | 0 0| 13 11| 8 9| 4 16| 25 10 | 904 15
GILMER COUNTY
| 0 0| 1 0| 2 0| 3 1| 6 0 | 0 0| 0 0| 0 0| 0 0| 0 0 | 6 0
GLASCOCK COUNTY
| 0 0| 0 0| 0 0| 0 0| 0 0 | 0 0| 0 0| 0 0| 0 0| 0 0 | 0 0
GLYNN COUNTY
| 6 3| 33 1| 28 1| 4 1| 71 1 | 0 0| 2 2| 1 1| 0 0| 3 1 | 74 1
GORDON COUNTY
| 0 0| 21 1| 13 1| 2 0| 36 1 | 0 0| 0 0| 1 1| 0 0| 1 0 | 37 1
GRADY COUNTY
| 5 3| 16 1| 10 0| 1 0| 32 1 | 0 0| 0 0| 0 0| 0 0| 0 0 | 32 1
GREENE COUNTY
| 0 0| 3 0| 5 0| 1 0| 9 0 | 0 0| 0 0| 0 0| 0 0| 0 0 | 9 0
GWINNETT COUNTY
| 1 1| 65 2| 43 2| 9 2| 118 2 | 0 0| 2 2| 5 6| 1 4| 8 3 | 126 2
HABERSHAM COUNTY | 1 1| 12 0| 10 0| 0 0| 23 0 | 0 0| 0 0| 0 0| 0 0| 0 0 | 23 0
HALL COUNTY
| 3 2| 40 1| 40 2| 10 2| 93 2 | 1 11| 2 2| 2 2| 1 4| 6 2 | 99 2
HANCOCK COUNTY
| 0 0| 3 0| 1 0| 0 0| 4 0 | 0 0| 0 0| 1 1| 0 0| 1 0 | 5 0
HARALSON COUNTY
| 0 0| 4 0| 2 0| 1 0| 7 0 | 0 0| 0 0| 0 0| 0 0| 0 0 | 7 0
------------------------------------------------------------------------------------------------------------------------------------
(continued)
Page 26 Run 05/22/01
Georgia Department of Corrections Office of Planning and Analysis
Inmate statistical profile
Sample: ACTIVE PRISONERS SERVING LIFE EXCLUDING JAIL
Requestor:
Active inmates 05/22/2001
County Of Conviction by current age & sex
Statistics (CONTINUED)
|
MEN
|
WOMEN
|
| Age | Age | Age | Age | Men
| Age | Age | Age | Age |Women
|Grand
County Of Conviction|00-21 %|22-39 %|40-54 %|55-99 %|Total % |00-21 %|22-39 %|40-54 %|55-99 %|Total % |Total %
------------------------------------------------------------------------------------------------------------------------------------
HARRIS COUNTY
| 1 1| 8 0| 3 0| 0 0| 12 0 | 0 0| 0 0| 0 0| 0 0| 0 0 | 12 0
HART COUNTY
| 0 0| 3 0| 2 0| 0 0| 5 0 | 0 0| 0 0| 0 0| 0 0| 0 0 | 5 0
HEARD COUNTY
| 0 0| 2 0| 0 0| 3 1| 5 0 | 0 0| 0 0| 0 0| 0 0| 0 0 | 5 0
HENRY COUNTY
| 0 0| 24 1| 9 0| 1 0| 34 1 | 0 0| 1 1| 0 0| 0 0| 1 0 | 35 1
HOUSTON COUNTY
| 1 1| 39 1| 19 1| 3 1| 62 1 | 0 0| 3 3| 3 3| 1 4| 7 3 | 69 1
IRWIN COUNTY
| 0 0| 3 0| 1 0| 1 0| 5 0 | 0 0| 0 0| 0 0| 0 0| 0 0 | 5 0
JACKSON COUNTY
| 1 1| 6 0| 13 1| 1 0| 21 0 | 0 0| 1 1| 0 0| 0 0| 1 0 | 22 0
JASPER COUNTY
| 0 0| 7 0| 2 0| 0 0| 9 0 | 0 0| 0 0| 1 1| 0 0| 1 0 | 10 0
JEFF DAVIS COUNTY | 0 0| 4 0| 4 0| 2 0| 10 0 | 0 0| 0 0| 0 0| 0 0| 0 0 | 10 0
JEFFERSON COUNTY | 0 0| 7 0| 7 0| 4 1| 18 0 | 0 0| 0 0| 0 0| 0 0| 0 0 | 18 0
JENKINS COUNTY
| 0 0| 2 0| 4 0| 0 0| 6 0 | 0 0| 0 0| 0 0| 0 0| 0 0 | 6 0
JOHNSON COUNTY
| 0 0| 9 0| 2 0| 1 0| 12 0 | 0 0| 1 1| 0 0| 0 0| 1 0 | 13 0
JONES COUNTY
| 0 0| 1 0| 8 0| 3 1| 12 0 | 0 0| 0 0| 0 0| 0 0| 0 0 | 12 0
LAMAR COUNTY
| 1 1| 11 0| 8 0| 3 1| 23 0 | 0 0| 0 0| 1 1| 0 0| 1 0 | 24 0
LANIER COUNTY
| 0 0| 1 0| 0 0| 0 0| 1 0 | 0 0| 0 0| 0 0| 0 0| 0 0 | 1 0
LAURENS COUNTY
| 1 1| 12 0| 8 0| 1 0| 22 0 | 0 0| 1 1| 2 2| 0 0| 3 1 | 25 0
LEE COUNTY
| 0 0| 2 0| 0 0| 0 0| 2 0 | 1 11| 0 0| 0 0| 0 0| 1 0 | 3 0
LIBERTY COUNTY
| 1 1| 20 1| 10 0| 4 1| 35 1 | 0 0| 2 2| 0 0| 0 0| 2 1 | 37 1
LINCOLN COUNTY
| 0 0| 3 0| 2 0| 0 0| 5 0 | 0 0| 0 0| 0 0| 0 0| 0 0 | 5 0
LONG COUNTY
| 1 1| 5 0| 4 0| 2 0| 12 0 | 0 0| 2 2| 0 0| 0 0| 2 1 | 14 0
LOWNDES COUNTY
| 0 0| 42 1| 27 1| 2 0| 71 1 | 0 0| 0 0| 2 2| 1 4| 3 1 | 74 1
LUMPKIN COUNTY
| 1 1| 3 0| 0 0| 2 0| 6 0 | 0 0| 0 0| 0 0| 0 0| 0 0 | 6 0
MACON COUNTY
| 0 0| 16 1| 8 0| 0 0| 24 0 | 0 0| 0 0| 0 0| 0 0| 0 0 | 24 0
MADISON COUNTY
| 0 0| 9 0| 5 0| 2 0| 16 0 | 0 0| 2 2| 0 0| 0 0| 2 1 | 18 0
MARION COUNTY
| 0 0| 2 0| 1 0| 0 0| 3 0 | 0 0| 0 0| 1 1| 0 0| 1 0 | 4 0
MCDUFFIE COUNTY
| 0 0| 27 1| 12 1| 4 1| 43 1 | 1 11| 0 0| 0 0| 0 0| 1 0 | 44 1
MCINTOSH COUNTY
| 2 1| 7 0| 8 0| 0 0| 17 0 | 0 0| 0 0| 0 0| 0 0| 0 0 | 17 0
MERIWETHER COUNTY | 0 0| 10 0| 9 0| 4 1| 23 0 | 0 0| 2 2| 0 0| 1 4| 3 1 | 26 0
MILLER COUNTY
| 0 0| 1 0| 2 0| 0 0| 3 0 | 0 0| 0 0| 0 0| 0 0| 0 0 | 3 0
MITCHELL COUNTY
| 0 0| 11 0| 10 0| 2 0| 23 0 | 0 0| 2 2| 0 0| 0 0| 2 1 | 25 0
MONROE COUNTY
| 0 0| 10 0| 9 0| 2 0| 21 0 | 0 0| 1 1| 0 0| 0 0| 1 0 | 22 0
MONTGOMERY COUNTY | 0 0| 0 0| 3 0| 0 0| 3 0 | 0 0| 0 0| 0 0| 0 0| 0 0 | 3 0
MORGAN COUNTY
| 0 0| 12 0| 3 0| 0 0| 15 0 | 0 0| 1 1| 0 0| 0 0| 1 0 | 16 0
MURRAY COUNTY
| 2 1| 3 0| 5 0| 5 1| 15 0 | 0 0| 0 0| 0 0| 0 0| 0 0 | 15 0
MUSCOGEE COUNTY
| 3 2| 85 3| 76 4| 12 3| 176 3 | 0 0| 4 3| 2 2| 0 0| 6 2 | 182 3
------------------------------------------------------------------------------------------------------------------------------------
(continued)
Page 27 Run 05/22/01
Georgia Department of Corrections Office of Planning and Analysis
Inmate statistical profile
Sample: ACTIVE PRISONERS SERVING LIFE EXCLUDING JAIL
Requestor:
Active inmates 05/22/2001
County Of Conviction by current age & sex
Statistics (CONTINUED)
|
MEN
|
WOMEN
|
| Age | Age | Age | Age | Men
| Age | Age | Age | Age |Women
|Grand
County Of Conviction|00-21 %|22-39 %|40-54 %|55-99 %|Total % |00-21 %|22-39 %|40-54 %|55-99 %|Total % |Total %
------------------------------------------------------------------------------------------------------------------------------------
NEWTON COUNTY
| 1 1| 45 1| 15 1| 4 1| 65 1 | 0 0| 2 2| 0 0| 0 0| 2 1 | 67 1
OCONEE COUNTY
| 0 0| 8 0| 4 0| 0 0| 12 0 | 0 0| 0 0| 0 0| 0 0| 0 0 | 12 0
OGLETHORPE COUNTY | 0 0| 4 0| 4 0| 1 0| 9 0 | 0 0| 0 0| 0 0| 0 0| 0 0 | 9 0
PAULDING COUNTY
| 0 0| 4 0| 6 0| 2 0| 12 0 | 0 0| 1 1| 0 0| 0 0| 1 0 | 13 0
PEACH COUNTY
| 0 0| 6 0| 3 0| 0 0| 9 0 | 0 0| 0 0| 1 1| 0 0| 1 0 | 10 0
PICKENS COUNTY
| 0 0| 3 0| 1 0| 1 0| 5 0 | 0 0| 0 0| 1 1| 0 0| 1 0 | 6 0
PIERCE COUNTY
| 3 2| 2 0| 4 0| 1 0| 10 0 | 0 0| 0 0| 0 0| 0 0| 0 0 | 10 0
PIKE COUNTY
| 0 0| 1 0| 1 0| 0 0| 2 0 | 0 0| 0 0| 0 0| 0 0| 0 0 | 2 0
POLK COUNTY
| 1 1| 13 0| 8 0| 2 0| 24 0 | 0 0| 0 0| 0 0| 0 0| 0 0 | 24 0
PULASKI COUNTY
| 0 0| 7 0| 1 0| 0 0| 8 0 | 0 0| 1 1| 0 0| 0 0| 1 0 | 9 0
PUTNAM COUNTY
| 0 0| 20 1| 14 1| 3 1| 37 1 | 0 0| 0 0| 0 0| 0 0| 0 0 | 37 1
QUITMAN COUNTY
| 0 0| 4 0| 0 0| 0 0| 4 0 | 0 0| 0 0| 0 0| 0 0| 0 0 | 4 0
RABUN COUNTY
| 0 0| 6 0| 3 0| 0 0| 9 0 | 0 0| 0 0| 0 0| 0 0| 0 0 | 9 0
RANDOLPH COUNTY
| 0 0| 3 0| 2 0| 2 0| 7 0 | 0 0| 0 0| 0 0| 0 0| 0 0 | 7 0
RICHMOND COUNTY
| 9 5| 160 5| 76 4| 13 3| 258 4 | 0 0| 8 7| 8 9| 1 4| 17 7 | 275 5
ROCKDALE COUNTY
| 1 1| 10 0| 11 1| 5 1| 27 0 | 0 0| 1 1| 0 0| 0 0| 1 0 | 28 0
SCHLEY COUNTY
| 0 0| 3 0| 2 0| 0 0| 5 0 | 0 0| 0 0| 0 0| 0 0| 0 0 | 5 0
SCREVEN COUNTY
| 0 0| 5 0| 4 0| 3 1| 12 0 | 0 0| 0 0| 0 0| 0 0| 0 0 | 12 0
SEMINOLE COUNTY
| 1 1| 4 0| 4 0| 2 0| 11 0 | 0 0| 1 1| 0 0| 0 0| 1 0 | 12 0
SPALDING COUNTY
| 1 1| 41 1| 24 1| 6 1| 72 1 | 1 11| 2 2| 2 2| 1 4| 6 2 | 78 1
STEPHENS COUNTY
| 0 0| 3 0| 4 0| 3 1| 10 0 | 0 0| 0 0| 0 0| 0 0| 0 0 | 10 0
STEWART COUNTY
| 0 0| 2 0| 1 0| 0 0| 3 0 | 0 0| 0 0| 2 2| 0 0| 2 1 | 5 0
SUMTER COUNTY
| 0 0| 5 0| 13 1| 1 0| 19 0 | 0 0| 0 0| 1 1| 0 0| 1 0 | 20 0
TALBOT COUNTY
| 2 1| 4 0| 1 0| 0 0| 7 0 | 0 0| 0 0| 1 1| 0 0| 1 0 | 8 0
TALIAFERRO COUNTY | 0 0| 0 0| 3 0| 0 0| 3 0 | 0 0| 0 0| 0 0| 0 0| 0 0 | 3 0
TATTNALL COUNTY
| 0 0| 17 1| 13 1| 2 0| 32 1 | 0 0| 0 0| 1 1| 0 0| 1 0 | 33 1
TAYLOR COUNTY
| 3 2| 9 0| 5 0| 0 0| 17 0 | 0 0| 0 0| 0 0| 0 0| 0 0 | 17 0
TELFAIR COUNTY
| 1 1| 6 0| 2 0| 0 0| 9 0 | 0 0| 0 0| 1 1| 0 0| 1 0 | 10 0
TERRELL COUNTY
| 1 1| 12 0| 2 0| 2 0| 17 0 | 0 0| 0 0| 0 0| 0 0| 0 0 | 17 0
THOMAS COUNTY
| 2 1| 16 1| 22 1| 3 1| 43 1 | 0 0| 1 1| 1 1| 0 0| 2 1 | 45 1
TIFT COUNTY
| 6 3| 32 1| 24 1| 4 1| 66 1 | 0 0| 0 0| 2 2| 1 4| 3 1 | 69 1
TOOMBS COUNTY
| 4 2| 20 1| 10 0| 2 0| 36 1 | 0 0| 2 2| 0 0| 0 0| 2 1 | 38 1
TOWNS COUNTY
| 0 0| 1 0| 1 0| 0 0| 2 0 | 0 0| 0 0| 0 0| 0 0| 0 0 | 2 0
TREUTLEN COUNTY
| 0 0| 3 0| 4 0| 0 0| 7 0 | 0 0| 0 0| 0 0| 0 0| 0 0 | 7 0
TROUP COUNTY
| 2 1| 25 1| 27 1| 7 2| 61 1 | 0 0| 2 2| 1 1| 0 0| 3 1 | 64 1
------------------------------------------------------------------------------------------------------------------------------------
(continued)
Page 28 Run 05/22/01
Georgia Department of Corrections Office of Planning and Analysis
Inmate statistical profile
Sample: ACTIVE PRISONERS SERVING LIFE EXCLUDING JAIL
Requestor:
Active inmates 05/22/2001
County Of Conviction by current age & sex
Statistics (CONTINUED)
|
MEN
|
WOMEN
|
| Age | Age | Age | Age | Men
| Age | Age | Age | Age |Women
|Grand
County Of Conviction|00-21 %|22-39 %|40-54 %|55-99 %|Total % |00-21 %|22-39 %|40-54 %|55-99 %|Total % |Total %
------------------------------------------------------------------------------------------------------------------------------------
TURNER COUNTY
| 0 0| 7 0| 7 0| 1 0| 15 0 | 0 0| 0 0| 0 0| 0 0| 0 0 | 15 0
TWIGGS COUNTY
| 0 0| 3 0| 5 0| 1 0| 9 0 | 0 0| 0 0| 0 0| 0 0| 0 0 | 9 0
UNION COUNTY
| 0 0| 0 0| 1 0| 0 0| 1 0 | 0 0| 0 0| 0 0| 0 0| 0 0 | 1 0
UPSON COUNTY
| 1 1| 7 0| 5 0| 1 0| 14 0 | 0 0| 0 0| 1 1| 0 0| 1 0 | 15 0
WALKER COUNTY
| 0 0| 14 0| 11 1| 4 1| 29 1 | 0 0| 1 1| 1 1| 0 0| 2 1 | 31 1
WALTON COUNTY
| 3 2| 31 1| 20 1| 3 1| 57 1 | 0 0| 1 1| 0 0| 0 0| 1 0 | 58 1
WARE COUNTY
| 0 0| 14 0| 11 1| 3 1| 28 0 | 0 0| 0 0| 1 1| 0 0| 1 0 | 29 0
WARREN COUNTY
| 0 0| 4 0| 6 0| 1 0| 11 0 | 0 0| 0 0| 0 0| 0 0| 0 0 | 11 0
WASHINGTON COUNTY | 0 0| 7 0| 6 0| 2 0| 15 0 | 0 0| 2 2| 0 0| 0 0| 2 1 | 17 0
WAYNE COUNTY
| 0 0| 7 0| 8 0| 2 0| 17 0 | 0 0| 1 1| 0 0| 0 0| 1 0 | 18 0
WEBSTER COUNTY
| 0 0| 0 0| 0 0| 0 0| 0 0 | 0 0| 0 0| 0 0| 0 0| 0 0 | 0 0
WHEELER COUNTY
| 0 0| 3 0| 3 0| 1 0| 7 0 | 0 0| 0 0| 0 0| 1 4| 1 0 | 8 0
WHITE COUNTY
| 0 0| 3 0| 1 0| 1 0| 5 0 | 0 0| 0 0| 0 0| 0 0| 0 0 | 5 0
WHITFIELD COUNTY | 0 0| 24 1| 23 1| 8 2| 55 1 | 0 0| 5 4| 1 1| 0 0| 6 2 | 61 1
WILCOX COUNTY
| 0 0| 1 0| 7 0| 0 0| 8 0 | 0 0| 0 0| 0 0| 0 0| 0 0 | 8 0
WILKES COUNTY
| 0 0| 6 0| 6 0| 1 0| 13 0 | 0 0| 0 0| 0 0| 0 0| 0 0 | 13 0
WILKINSON COUNTY | 0 0| 7 0| 1 0| 0 0| 8 0 | 0 0| 0 0| 0 0| 0 0| 0 0 | 8 0
WORTH COUNTY
| 2 1| 14 0| 5 0| 2 0| 23 0 | 0 0| 0 0| 0 0| 0 0| 0 0 | 23 0
CONVERSION
| 0 1| 0 0| 0 0| 0 0| 0 0 | 0 0| 0 0| 0 0| 0 0| 0 0 | 0 0
------------------------------------------------------------------------------------------------------------------------------------
Total reported
| 178 100| 3013 100| 2122 100| 435 100| 5748 100 | 9 100| 120 100| 88 100| 25 100| 242 100 | 5990 100
|
|
|
|
|
|
|
|
|
|
|
Percent reported | 100.0| 100.0| 100.0| 100.0| 100.0 | 100.0| 100.0| 100.0| 100.0| 100.0 | 100.0
|
|
|
|
|
|
|
|
|
|
|
|
|
|
|
|
|
|
|
|
|
|
UNKNOWN
|0|0|0|0|0
|0|0|0|0|0
|0
------------------------------------------------------------------------------------------------------------------------------------
Total
| 178 | 3013 | 2122 | 435 | 5748
| 9 | 120 | 88 | 25 | 242
| 5990
Page 29 Run 05/22/01
Georgia Department of Corrections Office of Planning and Analysis
Inmate statistical profile
Sample: ACTIVE PRISONERS SERVING LIFE EXCLUDING JAIL
Requestor: Statistics
Active inmates 05/22/2001
Circuit Of Conviction by current age & sex
|
MEN
|
WOMEN
|
| Age | Age | Age | Age | Men
| Age | Age | Age | Age |Women
|Grand
Circ Of Conviction |00-21 %|22-39 %|40-54 %|55-99 %|Total % |00-21 %|22-39 %|40-54 %|55-99 %|Total % |Total %
------------------------------------------------------------------------------------------------------------------------------------
ALAPAHA CIRCUIT
| 0 0| 14 0| 9 0| 2 0| 25 0 | 0 0| 1 1| 1 1| 0 0| 2 1 | 27 0
ALCOVY CIRCUIT
| 4 2| 76 3| 35 2| 7 2| 122 2 | 0 0| 3 3| 0 0| 0 0| 3 1 | 125 2
ATLANTA CIRCUIT
| 29 17| 470 16| 316 15| 64 15| 879 16 | 0 0| 13 11| 8 9| 4 16| 25 11 | 904 15
ATLANTIC CIRCUIT | 4 2| 65 2| 44 2| 11 3| 124 2 | 0 0| 4 3| 1 1| 1 4| 6 3 | 130 2
AUGUSTA CIRCUIT
| 12 7| 180 6| 99 5| 17 4| 308 5 | 0 0| 8 7| 9 10| 1 4| 18 8 | 326 6
BLUE RIDGE CIRCUIT | 1 1| 12 0| 29 1| 6 1| 48 1 | 0 0| 4 3| 1 1| 0 0| 5 2 | 53 1
BRUNSWICK CIRCUIT | 7 4| 68 2| 53 3| 9 2| 137 2 | 0 0| 3 3| 2 2| 0 0| 5 2 | 142 2
CHATTAHOOCHEE CIRCUI| 9 5| 109 4| 88 4| 12 3| 218 4 | 0 0| 4 3| 4 5| 0 0| 8 3 | 226 4
CHEROKEE CIRCUIT | 1 1| 48 2| 33 2| 4 1| 86 2 | 0 0| 2 2| 1 1| 0 0| 3 1 | 89 2
CLAYTON CIRCUIT
| 5 3| 73 2| 39 2| 11 3| 128 2 | 1 11| 2 2| 2 2| 1 4| 6 3 | 134 2
COBB CIRCUIT
| 7 4| 107 4| 76 4| 14 3| 204 4 | 0 0| 6 5| 3 3| 1 4| 10 4 | 214 4
CONASAUGA CIRCUIT | 2 1| 27 1| 28 1| 13 3| 70 1 | 0 0| 5 4| 1 1| 0 0| 6 3 | 76 1
CORDELE CIRCUIT
| 5 3| 29 1| 34 2| 5 1| 73 1 | 0 0| 3 3| 0 0| 1 4| 4 2 | 77 1
COWETA CIRCUIT
| 5 3| 79 3| 59 3| 23 5| 166 3 | 0 0| 8 7| 3 3| 1 4| 12 5 | 178 3
DOUGHERTY CIRCUIT | 4 2| 73 2| 41 2| 5 1| 123 2 | 0 0| 4 3| 1 1| 0 0| 5 2 | 128 2
DUBLIN CIRCUIT
| 1 1| 27 1| 19 1| 3 1| 50 1 | 0 0| 2 2| 2 2| 0 0| 4 2 | 54 1
EASTERN CIRCUIT
| 9 5| 161 5| 113 5| 16 4| 299 5 | 0 0| 2 2| 1 1| 0 0| 3 1 | 302 5
FLINT CIRCUIT
| 0 0| 24 1| 9 0| 1 0| 34 1 | 0 0| 1 1| 0 0| 0 0| 1 0 | 35 1
GRIFFIN CIRCUIT
| 3 2| 58 2| 35 2| 7 2| 103 2 | 1 11| 2 2| 3 3| 1 4| 7 3 | 110 2
GWINNETT CIRCUIT | 1 1| 65 2| 43 2| 9 2| 118 2 | 0 0| 2 2| 5 6| 1 4| 8 3 | 126 2
HOUSTON CIRCUIT
| 1 1| 39 1| 19 1| 3 1| 62 1 | 0 0| 3 3| 3 3| 1 4| 7 3 | 69 1
LOOKOUT MOUNTAIN CIR| 2 1| 31 1| 30 1| 9 2| 72 1 | 0 0| 1 1| 2 2| 1 4| 4 2 | 76 1
MACON CIRCUIT
| 3 2| 99 3| 86 4| 18 4| 206 4 | 1 11| 1 1| 3 3| 1 4| 6 3 | 212 4
MIDDLE CIRCUIT
| 4 2| 43 1| 34 2| 11 3| 92 2 | 0 0| 4 3| 1 1| 0 0| 5 2 | 97 2
MOUNTAIN CIRCUIT | 1 1| 21 1| 17 1| 3 1| 42 1 | 0 0| 0 0| 0 0| 0 0| 0 0 | 42 1
NORTHEASTERN CIRCUIT| 3 2| 42 1| 44 2| 10 2| 99 2 | 1 11| 2 2| 2 2| 1 4| 6 3 | 105 2
NORTHERN CIRCUIT | 1 1| 30 1| 24 1| 5 1| 60 1 | 0 0| 3 3| 2 2| 1 4| 6 3 | 66 1
OCMULGEE CIRCUIT | 0 0| 71 2| 46 2| 8 2| 125 2 | 0 0| 2 2| 2 2| 0 0| 4 2 | 129 2
OCONEE CIRCUIT
| 1 1| 29 1| 17 1| 3 1| 50 1 | 0 0| 1 1| 2 2| 1 4| 4 2 | 54 1
OGEECHEE CIRCUIT | 1 1| 29 1| 26 1| 3 1| 59 1 | 0 0| 1 1| 1 1| 1 4| 3 1 | 62 1
PATAULA CIRCUIT
| 2 1| 35 1| 16 1| 8 2| 61 1 | 0 0| 1 1| 0 0| 0 0| 1 0 | 62 1
PIEDMONT CIRCUIT | 1 1| 11 0| 31 1| 7 2| 50 1 | 0 0| 1 1| 1 1| 0 0| 2 1 | 52 1
ROME CIRCUIT
| 1 1| 27 1| 26 1| 6 1| 60 1 | 2 22| 3 3| 2 2| 1 4| 8 3 | 68 1
SOUTH GEORGIA CIRCUI| 6 3| 51 2| 31 1| 5 1| 93 2 | 0 0| 3 3| 0 0| 0 0| 3 1 | 96 2
SOUTHERN CIRCUIT | 5 3| 99 3| 78 4| 11 3| 193 3 | 0 0| 1 1| 4 5| 2 8| 7 3 | 200 3
------------------------------------------------------------------------------------------------------------------------------------
(continued)
Page 30 Run 05/22/01
Georgia Department of Corrections Office of Planning and Analysis
Inmate statistical profile
Sample: ACTIVE PRISONERS SERVING LIFE EXCLUDING JAIL
Requestor:
Active inmates 05/22/2001
Circuit Of Conviction by current age & sex
Statistics (Continued)
|
MEN
|
WOMEN
|
| Age | Age | Age | Age | Men
| Age | Age | Age | Age |Women
|Grand
Circ Of Conviction |00-21 %|22-39 %|40-54 %|55-99 %|Total % |00-21 %|22-39 %|40-54 %|55-99 %|Total % |Total %
------------------------------------------------------------------------------------------------------------------------------------
SOUTHWESTERN CIRCUIT| 0 0| 28 1| 24 1| 1 0| 53 1 | 1 11| 0 0| 3 3| 0 0| 4 2 | 57 1
STONE MOUNTAIN CIRCU| 14 8| 249 8| 163 8| 24 6| 450 8 | 1 11| 3 3| 4 5| 1 4| 9 4 | 459 8
TALLAPOOSA CIRCUIT | 1 1| 21 1| 16 1| 5 1| 43 1 | 0 0| 1 1| 0 0| 0 0| 1 0 | 44 1
TIFTON CIRCUIT
| 8 5| 56 2| 37 2| 8 2| 109 2 | 0 0| 0 0| 2 2| 1 4| 3 1 | 112 2
TOOMBS CIRCUIT
| 0 0| 40 1| 29 1| 6 1| 75 1 | 1 11| 0 0| 0 0| 0 0| 1 0 | 76 1
WAYCROSS CIRCUIT | 3 2| 32 1| 30 1| 8 2| 73 1 | 0 0| 3 3| 2 2| 0 0| 5 2 | 78 1
WESTERN CIRCUIT
| 2 1| 47 2| 26 1| 8 2| 83 1 | 0 0| 2 2| 0 0| 1 4| 3 1 | 86 1
ROCKDALE CIRCUIT | 1 1| 10 0| 11 1| 5 1| 27 0 | 0 0| 1 1| 0 0| 0 0| 1 0 | 28 0
DOUGLAS CIRCUIT
| 4 2| 49 2| 19 1| 6 1| 78 1 | 0 0| 1 1| 1 1| 0 0| 2 1 | 80 1
APPALACHIAN CIRCUIT | 0 0| 8 0| 8 0| 5 1| 21 0 | 0 0| 0 0| 1 1| 0 0| 1 0 | 22 0
ENOTAH CIRCUIT
| 1 1| 7 0| 3 0| 3 1| 14 0 | 0 0| 0 0| 0 0| 0 0| 0 0 | 14 0
BELL-FORSYTH CIRCUIT| 0 0| 1 0| 1 0| 0 0| 2 0 | 0 0| 0 0| 0 0| 0 0| 0 0 | 2 0
------------------------------------------------------------------------------------------------------------------------------------
Total reported
| 175 100| 2970 100| 2094 100| 428 100| 5667 100 | 9 100| 117 100| 86 100| 25 100| 237 100 | 5904 100
|
|
|
|
|
|
|
|
|
|
|
Percent reported |
98.3|
98.6|
98.7|
98.4|
98.6 | 100.0|
97.5|
97.7| 100.0|
97.9 |
98.6
|
|
|
|
|
|
|
|
|
|
|
|
|
|
|
|
|
|
|
|
|
|
NOT REPORTED
| 3 | 43 | 28 | 7 | 81
|0|3|2|0|5
| 86
------------------------------------------------------------------------------------------------------------------------------------
Total
| 178 | 3013 | 2122 | 435 | 5748
| 9 | 120 | 88 | 25 | 242
| 5990
Page 31 Run 05/22/01
Georgia Department of Corrections Office of Planning and Analysis
Inmate statistical profile
Sample: ACTIVE PRISONERS SERVING LIFE EXCLUDING JAIL
Requestor: Statistics
Active inmates 05/22/2001
Home County by current age & sex
|
MEN
|
WOMEN
|
| Age | Age | Age | Age | Men
| Age | Age | Age | Age |Women
|Grand
Home County
|00-21 %|22-39 %|40-54 %|55-99 %|Total % |00-21 %|22-39 %|40-54 %|55-99 %|Total % |Total %
------------------------------------------------------------------------------------------------------------------------------------
APPLING COUNTY
| 0 0| 4 0| 5 0| 1 0| 10 0 | 0 0| 0 0| 0 0| 0 0| 0 0 | 10 0
ATKINSON COUNTY
| 0 0| 1 0| 1 0| 3 1| 5 0 | 0 0| 0 0| 0 0| 0 0| 0 0 | 5 0
BACON COUNTY
| 0 0| 5 0| 4 0| 1 0| 10 0 | 0 0| 0 0| 0 0| 0 0| 0 0 | 10 0
BAKER COUNTY
| 0 0| 1 0| 2 0| 0 0| 3 0 | 0 0| 0 0| 0 0| 0 0| 0 0 | 3 0
BALDWIN COUNTY
| 0 0| 16 1| 7 0| 0 0| 23 0 | 0 0| 1 1| 0 0| 1 4| 2 1 | 25 0
BANKS COUNTY
| 0 0| 2 0| 4 0| 1 0| 7 0 | 0 0| 1 1| 0 0| 0 0| 1 0 | 8 0
BARROW COUNTY
| 0 0| 6 0| 8 0| 2 1| 16 0 | 0 0| 0 0| 1 1| 0 0| 1 0 | 17 0
BARTOW COUNTY
| 1 1| 19 1| 16 1| 5 1| 41 1 | 1 13| 3 3| 0 0| 0 0| 4 2 | 45 1
BEN HILL COUNTY
| 0 0| 4 0| 7 0| 3 1| 14 0 | 0 0| 0 0| 1 1| 0 0| 1 0 | 15 0
BERRIEN COUNTY
| 0 0| 4 0| 1 0| 1 0| 6 0 | 0 0| 0 0| 0 0| 0 0| 0 0 | 6 0
BIBB COUNTY
| 3 2| 82 3| 77 4| 20 5| 182 3 | 1 13| 4 4| 3 4| 0 0| 8 4 | 190 3
BLECKLEY COUNTY
| 0 0| 8 0| 4 0| 1 0| 13 0 | 0 0| 0 0| 1 1| 0 0| 1 0 | 14 0
BRANTLEY COUNTY
| 0 0| 2 0| 2 0| 0 0| 4 0 | 0 0| 0 0| 0 0| 0 0| 0 0 | 4 0
BROOKS COUNTY
| 0 0| 7 0| 2 0| 1 0| 10 0 | 0 0| 0 0| 0 0| 0 0| 0 0 | 10 0
BRYAN COUNTY
| 1 1| 7 0| 4 0| 1 0| 13 0 | 0 0| 0 0| 0 0| 0 0| 0 0 | 13 0
BULLOCH COUNTY
| 1 1| 12 0| 9 0| 0 0| 22 0 | 0 0| 0 0| 1 1| 1 4| 2 1 | 24 0
BURKE COUNTY
| 0 0| 9 0| 7 0| 3 1| 19 0 | 0 0| 0 0| 0 0| 0 0| 0 0 | 19 0
BUTTS COUNTY
| 0 0| 24 1| 7 0| 2 1| 33 1 | 0 0| 1 1| 1 1| 0 0| 2 1 | 35 1
CALHOUN COUNTY
| 0 0| 4 0| 3 0| 1 0| 8 0 | 0 0| 0 0| 0 0| 0 0| 0 0 | 8 0
CAMDEN COUNTY
| 1 1| 17 1| 6 0| 0 0| 24 0 | 0 0| 0 0| 1 1| 0 0| 1 0 | 25 0
CANDLER COUNTY
| 0 0| 2 0| 1 0| 0 0| 3 0 | 0 0| 0 0| 0 0| 0 0| 0 0 | 3 0
CARROLL COUNTY
| 0 0| 23 1| 12 1| 8 2| 43 1 | 0 0| 2 2| 1 1| 0 0| 3 1 | 46 1
CATOOSA COUNTY
| 0 0| 2 0| 6 0| 1 0| 9 0 | 0 0| 0 0| 0 0| 0 0| 0 0 | 9 0
CHARLTON COUNTY
| 0 0| 1 0| 0 0| 0 0| 1 0 | 0 0| 1 1| 0 0| 0 0| 1 0 | 2 0
CHATHAM COUNTY
| 9 5| 153 6| 100 5| 15 4| 277 5 | 0 0| 2 2| 1 1| 1 4| 4 2 | 281 5
CHATTAHOOCHEE COUNTY| 0 0| 1 0| 1 0| 0 0| 2 0 | 0 0| 0 0| 0 0| 0 0| 0 0 | 2 0
CHATTOOGA COUNTY | 0 0| 3 0| 5 0| 1 0| 9 0 | 0 0| 0 0| 1 1| 1 4| 2 1 | 11 0
CHEROKEE COUNTY
| 1 1| 8 0| 16 1| 1 0| 26 0 | 0 0| 2 2| 0 0| 0 0| 2 1 | 28 1
CLARKE COUNTY
| 3 2| 43 2| 20 1| 3 1| 69 1 | 0 0| 2 2| 0 0| 2 8| 4 2 | 73 1
CLAY COUNTY
| 0 0| 0 0| 1 0| 0 0| 1 0 | 0 0| 0 0| 0 0| 0 0| 0 0 | 1 0
CLAYTON COUNTY
| 4 2| 61 2| 45 2| 8 2| 118 2 | 1 13| 2 2| 1 1| 1 4| 5 2 | 123 2
CLINCH COUNTY
| 0 0| 1 0| 1 0| 0 0| 2 0 | 0 0| 0 0| 0 0| 0 0| 0 0 | 2 0
COBB COUNTY
| 6 4| 89 3| 70 4| 8 2| 173 3 | 0 0| 4 4| 1 1| 0 0| 5 2 | 178 3
COFFEE COUNTY
| 0 0| 11 0| 3 0| 3 1| 17 0 | 0 0| 1 1| 2 3| 1 4| 4 2 | 21 0
COLQUITT COUNTY
| 5 3| 26 1| 19 1| 2 1| 52 1 | 0 0| 0 0| 1 1| 0 0| 1 0 | 53 1
COLUMBIA COUNTY
| 0 0| 9 0| 8 0| 0 0| 17 0 | 0 0| 0 0| 2 3| 0 0| 2 1 | 19 0
------------------------------------------------------------------------------------------------------------------------------------
(continued)
Page 32 Run 05/22/01
Georgia Department of Corrections Office of Planning and Analysis
Inmate statistical profile
Sample: ACTIVE PRISONERS SERVING LIFE EXCLUDING JAIL
Requestor:
Active inmates 05/22/2001
Home County by current age & sex
Statistics (CONTINUED)
|
MEN
|
WOMEN
|
| Age | Age | Age | Age | Men
| Age | Age | Age | Age |Women
|Grand
Home County
|00-21 %|22-39 %|40-54 %|55-99 %|Total % |00-21 %|22-39 %|40-54 %|55-99 %|Total % |Total %
------------------------------------------------------------------------------------------------------------------------------------
COOK COUNTY
| 0 0| 6 0| 3 0| 1 0| 10 0 | 0 0| 1 1| 0 0| 0 0| 1 0 | 11 0
COWETA COUNTY
| 3 2| 18 1| 10 1| 1 0| 32 1 | 0 0| 2 2| 1 1| 0 0| 3 1 | 35 1
CRAWFORD COUNTY
| 0 0| 1 0| 1 0| 0 0| 2 0 | 0 0| 0 0| 0 0| 0 0| 0 0 | 2 0
CRISP COUNTY
| 3 2| 13 0| 7 0| 2 1| 25 0 | 0 0| 3 3| 0 0| 0 0| 3 1 | 28 1
DADE COUNTY
| 1 1| 4 0| 2 0| 3 1| 10 0 | 0 0| 0 0| 0 0| 0 0| 0 0 | 10 0
DAWSON COUNTY
| 0 0| 2 0| 1 0| 0 0| 3 0 | 0 0| 0 0| 0 0| 0 0| 0 0 | 3 0
DECATUR COUNTY
| 3 2| 13 0| 5 0| 0 0| 21 0 | 0 0| 0 0| 0 0| 0 0| 0 0 | 21 0
DEKALB COUNTY
| 15 9| 217 8| 126 6| 27 7| 385 7 | 1 13| 4 4| 2 3| 2 8| 9 4 | 394 7
DODGE COUNTY
| 0 0| 7 0| 6 0| 0 0| 13 0 | 0 0| 0 0| 0 0| 0 0| 0 0 | 13 0
DOOLY COUNTY
| 2 1| 7 0| 4 0| 0 0| 13 0 | 0 0| 0 0| 0 0| 0 0| 0 0 | 13 0
DOUGHERTY COUNTY | 4 2| 67 2| 43 2| 2 1| 116 2 | 0 0| 5 4| 1 1| 1 4| 7 3 | 123 2
DOUGLAS COUNTY
| 1 1| 20 1| 13 1| 2 1| 36 1 | 0 0| 1 1| 1 1| 0 0| 2 1 | 38 1
EARLY COUNTY
| 0 0| 7 0| 5 0| 1 0| 13 0 | 0 0| 0 0| 0 0| 0 0| 0 0 | 13 0
ECHOLS COUNTY.
| 0 0| 0 0| 0 0| 0 0| 0 0 | 0 0| 0 0| 0 0| 0 0| 0 0 | 0 0
EFFINGHAM COUNTY | 0 0| 5 0| 3 0| 0 0| 8 0 | 0 0| 0 0| 0 0| 0 0| 0 0 | 8 0
ELBERT COUNTY
| 0 0| 10 0| 10 1| 1 0| 21 0 | 0 0| 1 1| 0 0| 0 0| 1 0 | 22 0
EMANUEL COUNTY
| 0 0| 9 0| 6 0| 2 1| 17 0 | 0 0| 0 0| 1 1| 0 0| 1 0 | 18 0
EVANS COUNTY
| 0 0| 8 0| 4 0| 1 0| 13 0 | 0 0| 0 0| 0 0| 0 0| 0 0 | 13 0
FANNIN COUNTY
| 0 0| 5 0| 3 0| 1 0| 9 0 | 0 0| 0 0| 0 0| 0 0| 0 0 | 9 0
FAYETTE COUNTY
| 0 0| 3 0| 3 0| 0 0| 6 0 | 0 0| 0 0| 0 0| 0 0| 0 0 | 6 0
FLOYD COUNTY
| 1 1| 30 1| 23 1| 3 1| 57 1 | 1 13| 3 3| 2 3| 1 4| 7 3 | 64 1
FORSYTH COUNTY
| 0 0| 6 0| 4 0| 2 1| 12 0 | 0 0| 0 0| 1 1| 0 0| 1 0 | 13 0
FRANKLIN COUNTY
| 0 0| 2 0| 4 0| 0 0| 6 0 | 0 0| 0 0| 0 0| 1 4| 1 0 | 7 0
FULTON COUNTY
| 28 17| 505 18| 361 18| 58 15| 952 18 | 0 0| 16 14| 9 11| 3 13| 28 13 | 980 18
GILMER COUNTY
| 0 0| 1 0| 3 0| 2 1| 6 0 | 0 0| 0 0| 0 0| 0 0| 0 0 | 6 0
GLASCOCK COUNTY
| 0 0| 0 0| 1 0| 0 0| 1 0 | 0 0| 0 0| 0 0| 0 0| 0 0 | 1 0
GLYNN COUNTY
| 4 2| 29 1| 27 1| 4 1| 64 1 | 0 0| 1 1| 1 1| 0 0| 2 1 | 66 1
GORDON COUNTY
| 0 0| 20 1| 11 1| 2 1| 33 1 | 0 0| 0 0| 1 1| 0 0| 1 0 | 34 1
GRADY COUNTY
| 3 2| 13 0| 8 0| 0 0| 24 0 | 0 0| 0 0| 0 0| 0 0| 0 0 | 24 0
GREENE COUNTY
| 0 0| 4 0| 3 0| 1 0| 8 0 | 0 0| 0 0| 1 1| 0 0| 1 0 | 9 0
GWINNETT COUNTY
| 2 1| 63 2| 40 2| 12 3| 117 2 | 0 0| 3 3| 2 3| 0 0| 5 2 | 122 2
HABERSHAM COUNTY | 0 0| 7 0| 9 0| 0 0| 16 0 | 0 0| 0 0| 0 0| 0 0| 0 0 | 16 0
HALL COUNTY
| 2 1| 28 1| 38 2| 10 3| 78 1 | 1 13| 1 1| 2 3| 1 4| 5 2 | 83 2
HANCOCK COUNTY
| 1 1| 2 0| 2 0| 1 0| 6 0 | 0 0| 0 0| 1 1| 0 0| 1 0 | 7 0
HARALSON COUNTY
| 0 0| 1 0| 2 0| 1 0| 4 0 | 0 0| 1 1| 0 0| 0 0| 1 0 | 5 0
------------------------------------------------------------------------------------------------------------------------------------
(continued)
Page 33 Run 05/22/01
Georgia Department of Corrections Office of Planning and Analysis
Inmate statistical profile
Sample: ACTIVE PRISONERS SERVING LIFE EXCLUDING JAIL
Requestor:
Active inmates 05/22/2001
Home County by current age & sex
Statistics (CONTINUED)
|
MEN
|
WOMEN
|
| Age | Age | Age | Age | Men
| Age | Age | Age | Age |Women
|Grand
Home County
|00-21 %|22-39 %|40-54 %|55-99 %|Total % |00-21 %|22-39 %|40-54 %|55-99 %|Total % |Total %
------------------------------------------------------------------------------------------------------------------------------------
HARRIS COUNTY
| 1 1| 6 0| 2 0| 0 0| 9 0 | 0 0| 0 0| 0 0| 0 0| 0 0 | 9 0
HART COUNTY
| 0 0| 2 0| 2 0| 0 0| 4 0 | 0 0| 0 0| 1 1| 0 0| 1 0 | 5 0
HEARD COUNTY
| 0 0| 1 0| 1 0| 2 1| 4 0 | 0 0| 0 0| 0 0| 0 0| 0 0 | 4 0
HENRY COUNTY
| 2 1| 20 1| 9 0| 5 1| 36 1 | 0 0| 1 1| 2 3| 0 0| 3 1 | 39 1
HOUSTON COUNTY
| 1 1| 40 1| 22 1| 5 1| 68 1 | 0 0| 2 2| 4 5| 0 0| 6 3 | 74 1
IRWIN COUNTY
| 1 1| 4 0| 4 0| 0 0| 9 0 | 0 0| 0 0| 0 0| 0 0| 0 0 | 9 0
JACKSON COUNTY
| 1 1| 9 0| 9 0| 7 2| 26 0 | 0 0| 0 0| 0 0| 0 0| 0 0 | 26 0
JASPER COUNTY
| 0 0| 9 0| 2 0| 1 0| 12 0 | 0 0| 0 0| 0 0| 0 0| 0 0 | 12 0
JEFF DAVIS COUNTY | 1 1| 5 0| 2 0| 1 0| 9 0 | 0 0| 0 0| 0 0| 0 0| 0 0 | 9 0
JEFFERSON COUNTY | 0 0| 4 0| 3 0| 2 1| 9 0 | 0 0| 1 1| 0 0| 0 0| 1 0 | 10 0
JENKINS COUNTY
| 0 0| 0 0| 6 0| 0 0| 6 0 | 0 0| 0 0| 0 0| 0 0| 0 0 | 6 0
JOHNSON COUNTY
| 0 0| 3 0| 2 0| 0 0| 5 0 | 0 0| 0 0| 0 0| 0 0| 0 0 | 5 0
JONES COUNTY
| 0 0| 0 0| 5 0| 1 0| 6 0 | 0 0| 1 1| 0 0| 0 0| 1 0 | 7 0
LAMAR COUNTY
| 0 0| 9 0| 7 0| 3 1| 19 0 | 0 0| 0 0| 1 1| 0 0| 1 0 | 20 0
LANIER COUNTY
| 0 0| 0 0| 0 0| 0 0| 0 0 | 0 0| 0 0| 0 0| 0 0| 0 0 | 0 0
LAURENS COUNTY
| 1 1| 14 1| 8 0| 2 1| 25 0 | 0 0| 1 1| 1 1| 0 0| 2 1 | 27 0
LEE COUNTY
| 0 0| 3 0| 0 0| 0 0| 3 0 | 0 0| 0 0| 0 0| 0 0| 0 0 | 3 0
LIBERTY COUNTY
| 0 0| 22 1| 9 0| 4 1| 35 1 | 0 0| 2 2| 0 0| 0 0| 2 1 | 37 1
LINCOLN COUNTY
| 0 0| 2 0| 3 0| 0 0| 5 0 | 0 0| 0 0| 0 0| 0 0| 0 0 | 5 0
LONG COUNTY
| 0 0| 4 0| 3 0| 1 0| 8 0 | 0 0| 1 1| 0 0| 0 0| 1 0 | 9 0
LOWNDES COUNTY
| 0 0| 34 1| 23 1| 3 1| 60 1 | 0 0| 0 0| 2 3| 1 4| 3 1 | 63 1
LUMPKIN COUNTY
| 2 1| 5 0| 4 0| 1 0| 12 0 | 0 0| 0 0| 0 0| 0 0| 0 0 | 12 0
MACON COUNTY
| 0 0| 12 0| 5 0| 0 0| 17 0 | 0 0| 0 0| 1 1| 0 0| 1 0 | 18 0
MADISON COUNTY
| 0 0| 7 0| 6 0| 1 0| 14 0 | 0 0| 2 2| 0 0| 0 0| 2 1 | 16 0
MARION COUNTY
| 0 0| 2 0| 1 0| 0 0| 3 0 | 0 0| 0 0| 0 0| 0 0| 0 0 | 3 0
MCDUFFIE COUNTY
| 0 0| 21 1| 11 1| 4 1| 36 1 | 1 13| 0 0| 0 0| 0 0| 1 0 | 37 1
MCINTOSH COUNTY
| 2 1| 4 0| 3 0| 0 0| 9 0 | 0 0| 0 0| 0 0| 0 0| 0 0 | 9 0
MERIWETHER COUNTY | 1 1| 8 0| 7 0| 3 1| 19 0 | 0 0| 1 1| 0 0| 1 4| 2 1 | 21 0
MILLER COUNTY
| 0 0| 2 0| 3 0| 0 0| 5 0 | 0 0| 0 0| 0 0| 0 0| 0 0 | 5 0
MITCHELL COUNTY
| 0 0| 12 0| 11 1| 3 1| 26 0 | 0 0| 1 1| 0 0| 0 0| 1 0 | 27 0
MONROE COUNTY
| 0 0| 10 0| 4 0| 0 0| 14 0 | 0 0| 0 0| 0 0| 0 0| 0 0 | 14 0
MONTGOMERY COUNTY | 0 0| 0 0| 0 0| 0 0| 0 0 | 0 0| 1 1| 0 0| 0 0| 1 0 | 1 0
MORGAN COUNTY
| 0 0| 8 0| 3 0| 0 0| 11 0 | 0 0| 0 0| 0 0| 0 0| 0 0 | 11 0
MURRAY COUNTY
| 2 1| 5 0| 4 0| 4 1| 15 0 | 0 0| 1 1| 0 0| 0 0| 1 0 | 16 0
MUSCOGEE COUNTY
| 2 1| 75 3| 57 3| 10 3| 144 3 | 0 0| 3 3| 3 4| 0 0| 6 3 | 150 3
------------------------------------------------------------------------------------------------------------------------------------
(continued)
Page 34 Run 05/22/01
Georgia Department of Corrections Office of Planning and Analysis
Inmate statistical profile
Sample: ACTIVE PRISONERS SERVING LIFE EXCLUDING JAIL
Requestor:
Active inmates 05/22/2001
Home County by current age & sex
Statistics (CONTINUED)
|
MEN
|
WOMEN
|
| Age | Age | Age | Age | Men
| Age | Age | Age | Age |Women
|Grand
Home County
|00-21 %|22-39 %|40-54 %|55-99 %|Total % |00-21 %|22-39 %|40-54 %|55-99 %|Total % |Total %
------------------------------------------------------------------------------------------------------------------------------------
NEWTON COUNTY
| 1 1| 35 1| 11 1| 3 1| 50 1 | 0 0| 2 2| 0 0| 1 4| 3 1 | 53 1
OCONEE COUNTY
| 0 0| 3 0| 2 0| 0 0| 5 0 | 0 0| 0 0| 1 1| 0 0| 1 0 | 6 0
OGLETHORPE COUNTY | 0 0| 3 0| 1 0| 1 0| 5 0 | 0 0| 0 0| 0 0| 0 0| 0 0 | 5 0
PAULDING COUNTY
| 0 0| 6 0| 5 0| 2 1| 13 0 | 0 0| 0 0| 1 1| 1 4| 2 1 | 15 0
PEACH COUNTY
| 0 0| 7 0| 3 0| 0 0| 10 0 | 0 0| 1 1| 0 0| 0 0| 1 0 | 11 0
PICKENS COUNTY
| 0 0| 2 0| 1 0| 0 0| 3 0 | 0 0| 0 0| 1 1| 0 0| 1 0 | 4 0
PIERCE COUNTY
| 2 1| 2 0| 2 0| 0 0| 6 0 | 0 0| 0 0| 0 0| 0 0| 0 0 | 6 0
PIKE COUNTY
| 0 0| 1 0| 0 0| 0 0| 1 0 | 0 0| 0 0| 0 0| 0 0| 0 0 | 1 0
POLK COUNTY
| 1 1| 14 1| 5 0| 3 1| 23 0 | 0 0| 0 0| 0 0| 0 0| 0 0 | 23 0
PULASKI COUNTY
| 0 0| 4 0| 3 0| 0 0| 7 0 | 0 0| 1 1| 0 0| 0 0| 1 0 | 8 0
PUTNAM COUNTY
| 0 0| 13 0| 13 1| 2 1| 28 1 | 0 0| 0 0| 0 0| 0 0| 0 0 | 28 1
QUITMAN COUNTY
| 0 0| 2 0| 0 0| 0 0| 2 0 | 0 0| 0 0| 0 0| 0 0| 0 0 | 2 0
RABUN COUNTY
| 0 0| 5 0| 3 0| 0 0| 8 0 | 0 0| 0 0| 0 0| 0 0| 0 0 | 8 0
RANDOLPH COUNTY
| 0 0| 3 0| 2 0| 1 0| 6 0 | 0 0| 0 0| 0 0| 0 0| 0 0 | 6 0
RICHMOND COUNTY
| 10 6| 145 5| 71 4| 8 2| 234 4 | 0 0| 8 7| 7 9| 1 4| 16 7 | 250 5
ROCKDALE COUNTY
| 1 1| 10 0| 7 0| 4 1| 22 0 | 0 0| 1 1| 0 0| 0 0| 1 0 | 23 0
SCHLEY COUNTY
| 0 0| 2 0| 2 0| 0 0| 4 0 | 0 0| 0 0| 0 0| 0 0| 0 0 | 4 0
SCREVEN COUNTY
| 0 0| 3 0| 2 0| 2 1| 7 0 | 0 0| 0 0| 0 0| 0 0| 0 0 | 7 0
SEMINOLE COUNTY
| 1 1| 5 0| 5 0| 1 0| 12 0 | 0 0| 1 1| 0 0| 0 0| 1 0 | 13 0
SPALDING COUNTY
| 3 2| 37 1| 23 1| 5 1| 68 1 | 1 13| 2 2| 1 1| 1 4| 5 2 | 73 1
STEPHENS COUNTY
| 0 0| 5 0| 5 0| 4 1| 14 0 | 0 0| 0 0| 0 0| 0 0| 0 0 | 14 0
STEWART COUNTY
| 0 0| 2 0| 2 0| 0 0| 4 0 | 0 0| 0 0| 0 0| 0 0| 0 0 | 4 0
SUMTER COUNTY
| 0 0| 3 0| 16 1| 2 1| 21 0 | 0 0| 0 0| 1 1| 0 0| 1 0 | 22 0
TALBOT COUNTY
| 2 1| 3 0| 1 0| 0 0| 6 0 | 0 0| 0 0| 1 1| 0 0| 1 0 | 7 0
TALIAFERRO COUNTY | 0 0| 0 0| 1 0| 0 0| 1 0 | 0 0| 0 0| 0 0| 0 0| 0 0 | 1 0
TATTNALL COUNTY
| 0 0| 16 1| 4 0| 0 0| 20 0 | 0 0| 0 0| 1 1| 0 0| 1 0 | 21 0
TAYLOR COUNTY
| 1 1| 10 0| 4 0| 1 0| 16 0 | 0 0| 0 0| 0 0| 0 0| 0 0 | 16 0
TELFAIR COUNTY
| 1 1| 6 0| 3 0| 0 0| 10 0 | 0 0| 0 0| 1 1| 0 0| 1 0 | 11 0
TERRELL COUNTY
| 2 1| 11 0| 1 0| 0 0| 14 0 | 0 0| 0 0| 0 0| 0 0| 0 0 | 14 0
THOMAS COUNTY
| 2 1| 14 1| 16 1| 4 1| 36 1 | 0 0| 1 1| 1 1| 0 0| 2 1 | 38 1
TIFT COUNTY
| 3 2| 27 1| 22 1| 3 1| 55 1 | 0 0| 0 0| 0 0| 1 4| 1 0 | 56 1
TOOMBS COUNTY
| 2 1| 11 0| 12 1| 0 0| 25 0 | 0 0| 1 1| 0 0| 0 0| 1 0 | 26 0
TOWNS COUNTY
| 0 0| 0 0| 0 0| 0 0| 0 0 | 0 0| 0 0| 0 0| 0 0| 0 0 | 0 0
TREUTLEN COUNTY
| 0 0| 2 0| 3 0| 0 0| 5 0 | 0 0| 0 0| 0 0| 0 0| 0 0 | 5 0
TROUP COUNTY
| 2 1| 20 1| 20 1| 5 1| 47 1 | 0 0| 1 1| 1 1| 0 0| 2 1 | 49 1
------------------------------------------------------------------------------------------------------------------------------------
(continued)
Page 35 Run 05/22/01
Georgia Department of Corrections Office of Planning and Analysis
Inmate statistical profile
Sample: ACTIVE PRISONERS SERVING LIFE EXCLUDING JAIL
Requestor:
Active inmates 05/22/2001
Home County by current age & sex
Statistics (CONTINUED)
|
MEN
|
WOMEN
|
| Age | Age | Age | Age | Men
| Age | Age | Age | Age |Women
|Grand
Home County
|00-21 %|22-39 %|40-54 %|55-99 %|Total % |00-21 %|22-39 %|40-54 %|55-99 %|Total % |Total %
------------------------------------------------------------------------------------------------------------------------------------
TURNER COUNTY
| 0 0| 7 0| 5 0| 0 0| 12 0 | 0 0| 0 0| 0 0| 0 0| 0 0 | 12 0
TWIGGS COUNTY
| 0 0| 6 0| 4 0| 0 0| 10 0 | 0 0| 0 0| 0 0| 0 0| 0 0 | 10 0
UNION COUNTY
| 0 0| 0 0| 0 0| 0 0| 0 0 | 0 0| 0 0| 0 0| 0 0| 0 0 | 0 0
UPSON COUNTY
| 1 1| 6 0| 5 0| 0 0| 12 0 | 0 0| 0 0| 1 1| 0 0| 1 0 | 13 0
WALKER COUNTY
| 1 1| 14 1| 7 0| 3 1| 25 0 | 0 0| 1 1| 1 1| 0 0| 2 1 | 27 0
WALTON COUNTY
| 1 1| 27 1| 18 1| 4 1| 50 1 | 0 0| 0 0| 0 0| 0 0| 0 0 | 50 1
WARE COUNTY
| 1 1| 14 1| 13 1| 4 1| 32 1 | 0 0| 0 0| 0 0| 0 0| 0 0 | 32 1
WARREN COUNTY
| 0 0| 3 0| 5 0| 1 0| 9 0 | 0 0| 0 0| 0 0| 0 0| 0 0 | 9 0
WASHINGTON COUNTY | 0 0| 12 0| 8 0| 1 0| 21 0 | 0 0| 2 2| 0 0| 0 0| 2 1 | 23 0
WAYNE COUNTY
| 0 0| 6 0| 12 1| 3 1| 21 0 | 0 0| 1 1| 0 0| 0 0| 1 0 | 22 0
WEBSTER COUNTY
| 0 0| 2 0| 0 0| 0 0| 2 0 | 0 0| 0 0| 0 0| 0 0| 0 0 | 2 0
WHEELER COUNTY
| 0 0| 1 0| 2 0| 2 1| 5 0 | 0 0| 0 0| 0 0| 0 0| 0 0 | 5 0
WHITE COUNTY
| 0 0| 3 0| 2 0| 2 1| 7 0 | 0 0| 0 0| 0 0| 0 0| 0 0 | 7 0
WHITFIELD COUNTY | 0 0| 11 0| 22 1| 7 2| 40 1 | 0 0| 2 2| 0 0| 0 0| 2 1 | 42 1
WILCOX COUNTY
| 0 0| 0 0| 6 0| 0 0| 6 0 | 0 0| 0 0| 0 0| 0 0| 0 0 | 6 0
WILKES COUNTY
| 0 0| 2 0| 4 0| 2 1| 8 0 | 0 0| 0 0| 0 0| 0 0| 0 0 | 8 0
WILKINSON COUNTY | 0 0| 7 0| 3 0| 0 0| 10 0 | 0 0| 0 0| 0 0| 0 0| 0 0 | 10 0
WORTH COUNTY
| 1 1| 12 0| 3 0| 1 0| 17 0 | 0 0| 1 1| 0 0| 0 0| 1 0 | 18 0
OUT OF STATE
| 0 1| 9 0| 55 3| 16 4| 80 2 | 0 0| 0 1| 0 0| 0 0| 0 0 | 80 1
------------------------------------------------------------------------------------------------------------------------------------
Total reported
| 164 100| 2736 100| 1961 100| 396 100| 5257 100 | 8 100| 112 100| 79 100| 24 100| 223 100 | 5480 100
|
|
|
|
|
|
|
|
|
|
|
Percent reported |
92.1|
90.8|
92.4|
91.0|
91.5 |
88.9|
93.3|
89.8|
96.0|
92.1 |
91.5
|
|
|
|
|
|
|
|
|
|
|
|
|
|
|
|
|
|
|
|
|
|
UNKNOWN
| 14 | 277 | 161 | 39 | 491
| 1 | 8 | 9 | 1 | 19
| 510
------------------------------------------------------------------------------------------------------------------------------------
Total
| 178 | 3013 | 2122 | 435 | 5748
| 9 | 120 | 88 | 25 | 242
| 5990
Georgia Department of Corrections
Page 36 Run 05/22/01
Office of Planning and Analysis
Inmate statistical profile
Sample: ACTIVE PRISONERS SERVING LIFE EXCLUDING JAIL
Requestor: Statistics
Active inmates 05/22/2001
Prison Sentence In Years by current age & sex
|
MEN
|
WOMEN
|
| Age | Age | Age | Age | Men
| Age | Age | Age | Age |Women
|Grand
Sentence In Years |00-21 %|22-39 %|40-54 %|55-99 %|Total % |00-21 %|22-39 %|40-54 %|55-99 %|Total % |Total %
------------------------------------------------------------------------------------------------------------------------------------
0-1
| 0 0| 0 0| 0 0| 0 0| 0 0 | 0 0| 0 0| 0 0| 0 0| 0 0 | 0 0
1.1-2
| 0 0| 0 0| 0 0| 0 0| 0 0 | 0 0| 0 0| 0 0| 0 0| 0 0 | 0 0
2.1-3
| 0 0| 0 0| 0 0| 0 0| 0 0 | 0 0| 0 0| 0 0| 0 0| 0 0 | 0 0
3.1-4
| 0 0| 0 0| 0 0| 0 0| 0 0 | 0 0| 0 0| 0 0| 0 0| 0 0 | 0 0
4.1-5
| 0 0| 0 0| 0 0| 0 0| 0 0 | 0 0| 0 0| 0 0| 0 0| 0 0 | 0 0
5.1-6
| 0 0| 0 0| 0 0| 0 0| 0 0 | 0 0| 0 0| 0 0| 0 0| 0 0 | 0 0
6.1-7
| 0 0| 0 0| 0 0| 0 0| 0 0 | 0 0| 0 0| 0 0| 0 0| 0 0 | 0 0
7.1-8
| 0 0| 0 0| 0 0| 0 0| 0 0 | 0 0| 0 0| 0 0| 0 0| 0 0 | 0 0
8.1-9
| 0 0| 0 0| 0 0| 0 0| 0 0 | 0 0| 0 0| 0 0| 0 0| 0 0 | 0 0
9.1-10
| 0 0| 0 0| 0 0| 0 0| 0 0 | 0 0| 0 0| 0 0| 0 0| 0 0 | 0 0
10.1-12
| 0 0| 0 0| 0 0| 0 0| 0 0 | 0 0| 0 0| 0 0| 0 0| 0 0 | 0 0
12.1-15
| 0 0| 0 0| 0 0| 0 0| 0 0 | 0 0| 0 0| 0 0| 0 0| 0 0 | 0 0
15.1-20
| 0 0| 0 0| 0 0| 0 0| 0 0 | 0 0| 0 0| 0 0| 0 0| 0 0 | 0 0
20.1-OVER
| 0 0| 0 0| 0 0| 0 0| 0 0 | 0 0| 0 0| 0 0| 0 0| 0 0 | 0 0
LIFE
| 178 100| 3013 100| 2122 100| 435 100| 5748 100 | 9 100| 120 100| 88 100| 25 100| 242 100 | 5990 100
DEATH
| 0 0| 0 0| 0 0| 0 0| 0 0 | 0 0| 0 0| 0 0| 0 0| 0 0 | 0 0
LIFE W/O PAROLE
| 0 0| 0 0| 0 0| 0 0| 0 0 | 0 0| 0 0| 0 0| 0 0| 0 0 | 0 0
YOUTHFUL OFFENDERS | 0 0| 0 0| 0 0| 0 0| 0 0 | 0 0| 0 0| 0 0| 0 0| 0 0 | 0 0
------------------------------------------------------------------------------------------------------------------------------------
Total reported
| 178 100| 3013 100| 2122 100| 435 100| 5748 100 | 9 100| 120 100| 88 100| 25 100| 242 100 | 5990 100
|
|
|
|
|
|
|
|
|
|
|
Percent reported | 100.0| 100.0| 100.0| 100.0| 100.0 | 100.0| 100.0| 100.0| 100.0| 100.0 | 100.0
|
|
|
|
|
|
|
|
|
|
|
|
|
|
|
|
|
|
|
|
|
|
NOT REPORTED
|0|0|0|0|0
|0|0|0|0|0
|0
------------------------------------------------------------------------------------------------------------------------------------
Total
| 178 | 3013 | 2122 | 435 | 5748
| 9 | 120 | 88 | 25 | 242
| 5990
|
|
|
|
|
|
|
|
|
|
|
|
|
|
|
|
|
|
|
|
|
|
|
|
|
|
|
|
|
|
|
|
|
|
|
|
|
|
|
|
|
|
|
|
|
|
|
|
|
|
|
|
|
|
|
AVG EXCLUDING
|
|
|
|
|
|
|
|
|
|
|
LIFE, DEATH, YO
| .00 | .00 | .00 | .00 | .00 | .00 | .00 | .00 | .00 | .00 | .00
|
|
|
|
|
|
|
|
|
|
|
|
|
|
|
|
|
|
|
|
|
|
|
|
|
|
|
|
|
|
|
|
|
|
|
|
|
|
|
|
|
|
|
|
|
|
|
|
|
|
|
|
|
|
|
AVG INCLUDING
|
|
|
|
|
|
|
|
|
|
|
LIFE=21, YO=3 YRS | 21.00 | 21.00 | 21.00 | 21.00 | 21.00 | 21.00 | 21.00 | 21.00 | 21.00 | 21.00 | 21.00
Page 37 Run 05/22/01
Georgia Department of Corrections Office of Planning and Analysis
Inmate statistical profile
Sample: ACTIVE PRISONERS SERVING LIFE EXCLUDING JAIL
Requestor: Statistics
Active inmates 05/22/2001
Probation To Follow Prison by current age & sex
|
MEN
|
WOMEN
|
| Age | Age | Age | Age | Men
| Age | Age | Age | Age |Women
|Grand
Prob After Prison |00-21 %|22-39 %|40-54 %|55-99 %|Total % |00-21 %|22-39 %|40-54 %|55-99 %|Total % |Total %
------------------------------------------------------------------------------------------------------------------------------------
PROBATION TO FOLLOW | 10 6| 92 3| 63 3| 6 1| 171 3 | 0 0| 3 3| 3 3| 1 4| 7 3 | 178 3
NO PROBATION
| 168 94| 2921 97| 2059 97| 429 99| 5577 97 | 9 100| 117 98| 85 97| 24 96| 235 97 | 5812 97
------------------------------------------------------------------------------------------------------------------------------------
Total reported
| 178 100| 3013 100| 2122 100| 435 100| 5748 100 | 9 100| 120 100| 88 100| 25 100| 242 100 | 5990 100
|
|
|
|
|
|
|
|
|
|
|
Percent reported | 100.0| 100.0| 100.0| 100.0| 100.0 | 100.0| 100.0| 100.0| 100.0| 100.0 | 100.0
|
|
|
|
|
|
|
|
|
|
|
|
|
|
|
|
|
|
|
|
|
|
NOT REPORTED
|0|0|0|0|0
|0|0|0|0|0
|0
------------------------------------------------------------------------------------------------------------------------------------
Total
| 178 | 3013 | 2122 | 435 | 5748
| 9 | 120 | 88 | 25 | 242
| 5990
Page 38 Run 05/22/01
Georgia Department of Corrections Office of Planning and Analysis
Inmate statistical profile
Sample: ACTIVE PRISONERS SERVING LIFE EXCLUDING JAIL
Requestor: Statistics
Active inmates 05/22/2001
Admission Type by current age & sex
|
MEN
|
WOMEN
|
| Age | Age | Age | Age | Men
| Age | Age | Age | Age |Women
|Grand
Admission Type
|00-21 %|22-39 %|40-54 %|55-99 %|Total % |00-21 %|22-39 %|40-54 %|55-99 %|Total % |Total %
------------------------------------------------------------------------------------------------------------------------------------
COMMITTED FROM COURT| 174 98| 2470 82| 1570 74| 312 72| 4526 79 | 9 100| 112 93| 76 86| 25 100| 222 92 | 4748 79
RETURN APPEAL/BOND | 0 0| 1 0| 1 0| 0 0| 2 0 | 0 0| 0 0| 0 0| 0 0| 0 0 | 2 0
PAROLE REV/NEW SENT | 1 1| 344 11| 332 16| 80 18| 757 13 | 0 0| 5 4| 8 9| 0 0| 13 5 | 770 13
PAR REV/NO NEW SENT | 0 0| 18 1| 66 3| 11 3| 95 2 | 0 0| 1 1| 1 1| 0 0| 2 1 | 97 2
PROB VIOL/TOTAL REV | 0 0| 0 0| 0 0| 0 0| 0 0 | 0 0| 0 0| 0 0| 0 0| 0 0 | 0 0
PROB VIOL/PARTIAL | 0 0| 32 1| 45 2| 2 0| 79 1 | 0 0| 0 0| 1 1| 0 0| 1 0 | 80 1
ADMIT FM OTHER CUST | 0 0| 1 0| 1 0| 5 1| 7 0 | 0 0| 0 0| 0 0| 0 0| 0 0 | 7 0
SHOCK INCARCERATION | 0 0| 0 0| 0 0| 0 0| 0 0 | 0 0| 0 0| 0 0| 0 0| 0 0 | 0 0
PROB REV/REMAINDER | 2 1| 113 4| 46 2| 5 1| 166 3 | 0 0| 2 2| 2 2| 0 0| 4 2 | 170 3
NEW SENT/PAR REV PND| 0 0| 2 0| 4 0| 1 0| 7 0 | 0 0| 0 0| 0 0| 0 0| 0 0 | 7 0
LIFE W/O PAROLE
| 1 1| 9 0| 3 0| 0 0| 13 0 | 0 0| 0 0| 0 0| 0 0| 0 0 | 13 0
PAROLE REV BOOT CAMP| 0 0| 2 0| 1 0| 0 0| 3 0 | 0 0| 0 0| 0 0| 0 0| 0 0 | 3 0
PAR REV/RSN UNKNOWN | 0 0| 15 0| 40 2| 19 4| 74 1 | 0 0| 0 0| 0 0| 0 0| 0 0 | 74 1
PROBATION/PAROLE REV| 0 0| 0 0| 0 0| 0 0| 0 0 | 0 0| 0 0| 0 0| 0 0| 0 0 | 0 0
PB PAROLE RESCINDED | 0 0| 0 0| 0 0| 0 0| 0 0 | 0 0| 0 0| 0 0| 0 0| 0 0 | 0 0
PROB REVOC/SPEC COND| 0 0| 0 0| 0 0| 0 0| 0 0 | 0 0| 0 0| 0 0| 0 0| 0 0 | 0 0
PAR REV/REVOC CENTER| 0 0| 5 0| 12 1| 0 0| 17 0 | 0 0| 0 0| 0 0| 0 0| 0 0 | 17 0
INFORMATION ONLY | 0 0| 0 0| 0 0| 0 0| 0 0 | 0 0| 0 0| 0 0| 0 0| 0 0 | 0 0
INCOMPLETE SENT PKG | 0 0| 0 0| 0 0| 0 0| 0 0 | 0 0| 0 0| 0 0| 0 0| 0 0 | 0 0
HANCOCK REVOC CENTER| 0 0| 0 0| 0 0| 0 0| 0 0 | 0 0| 0 0| 0 0| 0 0| 0 0 | 0 0
WHITWORTH DETENTION | 0 0| 0 0| 1 0| 0 0| 1 0 | 0 0| 0 0| 0 0| 0 0| 0 0 | 1 0
DCYS AT RISK
| 0 0| 0 0| 0 0| 0 0| 0 0 | 0 0| 0 0| 0 0| 0 0| 0 0 | 0 0
OTHER
| 0 0| 0 0| 0 0| 0 0| 0 0 | 0 0| 0 0| 0 0| 0 0| 0 0 | 0 0
------------------------------------------------------------------------------------------------------------------------------------
Total reported
| 178 100| 3012 100| 2122 100| 435 100| 5747 100 | 9 100| 120 100| 88 100| 25 100| 242 100 | 5989 100
|
|
|
|
|
|
|
|
|
|
|
Percent reported | 100.0| 100.0| 100.0| 100.0| 100.0 | 100.0| 100.0| 100.0| 100.0| 100.0 | 100.0
|
|
|
|
|
|
|
|
|
|
|
|
|
|
|
|
|
|
|
|
|
|
UNKNOWN
|0|1|0|0|1
|0|0|0|0|0
|1
------------------------------------------------------------------------------------------------------------------------------------
Total
| 178 | 3013 | 2122 | 435 | 5748
| 9 | 120 | 88 | 25 | 242
| 5990
Page 39 Run 05/22/01
Georgia Department of Corrections Office of Planning and Analysis
Inmate statistical profile
Sample: ACTIVE PRISONERS SERVING LIFE EXCLUDING JAIL
Requestor: Statistics
Active inmates 05/22/2001
Release Type by current age & sex
|
MEN
|
WOMEN
|
| Age | Age | Age | Age | Men
| Age | Age | Age | Age |Women
|Grand
Release Type
|00-21 %|22-39 %|40-54 %|55-99 %|Total % |00-21 %|22-39 %|40-54 %|55-99 %|Total % |Total %
------------------------------------------------------------------------------------------------------------------------------------
PAROLE
| 0 0| 1 0| 0 0| 0 0| 1 0 | 0 0| 0 0| 0 0| 0 0| 0 0 | 1 0
Active
| 178 100| 3013 100| 2122 100| 435 100| 5748 100 | 9 100| 120 100| 88 100| 25 100| 242 100 | 5990 100
------------------------------------------------------------------------------------------------------------------------------------
Total
| 178 | 3013 | 2122 | 435 | 5748
| 9 | 120 | 88 | 25 | 242
| 5990
Page 40 Run 05/22/01
Georgia Department of Corrections Office of Planning and Analysis
Inmate statistical profile
Sample: ACTIVE PRISONERS SERVING LIFE EXCLUDING JAIL
Requestor: Statistics
Active inmates 05/22/2001
Inst By Group by current age & sex
|
MEN
|
WOMEN
|
| Age | Age | Age | Age | Men
| Age | Age | Age | Age |Women
|Grand
Inst By Group
|00-21 %|22-39 %|40-54 %|55-99 %|Total % |00-21 %|22-39 %|40-54 %|55-99 %|Total % |Total %
------------------------------------------------------------------------------------------------------------------------------------
County jails
| 0 0| 0 0| 0 0| 0 0| 0 0 | 0 0| 0 0| 0 0| 0 0| 0 0 | 0 0
Transitional centers| 0 0| 16 1| 16 1| 4 1| 36 1 | 0 0| 2 2| 2 2| 1 4| 5 2 | 41 1
County camps
| 0 0| 11 0| 9 0| 3 1| 23 0 | 0 0| 0 0| 0 0| 0 0| 0 0 | 23 0
Inmate boot camps | 0 0| 0 0| 0 0| 0 0| 0 0 | 0 0| 0 0| 0 0| 0 0| 0 0 | 0 0
State prisons
| 178 100| 2877 95| 2006 95| 414 95| 5475 95 | 9 100| 118 98| 86 98| 24 96| 237 98 | 5712 95
Private prisons
| 0 0| 108 4| 91 4| 14 3| 213 4 | 0 0| 0 0| 0 0| 0 0| 0 0 | 213 4
Other
| 0 0| 1 0| 0 0| 0 0| 1 0 | 0 0| 0 0| 0 0| 0 0| 0 0 | 1 0
------------------------------------------------------------------------------------------------------------------------------------
Total reported
| 178 100| 3013 100| 2122 100| 435 100| 5748 100 | 9 100| 120 100| 88 100| 25 100| 242 100 | 5990 100
|
|
|
|
|
|
|
|
|
|
|
Percent reported | 100.0| 100.0| 100.0| 100.0| 100.0 | 100.0| 100.0| 100.0| 100.0| 100.0 | 100.0
|
|
|
|
|
|
|
|
|
|
|
|
|
|
|
|
|
|
|
|
|
|
Not reported
|0|0|0|0|0
|0|0|0|0|0
|0
------------------------------------------------------------------------------------------------------------------------------------
Total
| 178 | 3013 | 2122 | 435 | 5748
| 9 | 120 | 88 | 25 | 242
| 5990
Page 41 Run 05/22/01
Georgia Department of Corrections Office of Planning and Analysis
Inmate statistical profile
Sample: ACTIVE PRISONERS SERVING LIFE EXCLUDING JAIL
Requestor: Statistics
Active inmates 05/22/2001
Institution by current age & sex
|
MEN
|
WOMEN
|
| Age | Age | Age | Age | Men
| Age | Age | Age | Age |Women
|Grand
Institution
|00-21 %|22-39 %|40-54 %|55-99 %|Total % |00-21 %|22-39 %|40-54 %|55-99 %|Total % |Total %
------------------------------------------------------------------------------------------------------------------------------------
Albany Trans Ctr | 0 0| 0 0| 1 0| 0 0| 1 0 | 0 0| 0 0| 0 0| 0 0| 0 0 | 1 0
Atlanta Trans Ctr(M)| 0 0| 11 0| 10 0| 4 1| 25 0 | 0 0| 0 0| 0 0| 0 0| 0 0 | 25 0
Macon Trans Ctr
| 0 0| 4 0| 3 0| 0 0| 7 0 | 0 0| 0 0| 0 0| 0 0| 0 0 | 7 0
Metro Trans Ctr (W) | 0 0| 0 0| 0 0| 0 0| 0 0 | 0 0| 2 2| 2 2| 1 4| 5 2 | 5 0
Savannah Trans Ctr | 0 0| 1 0| 2 0| 0 0| 3 0 | 0 0| 0 0| 0 0| 0 0| 0 0 | 3 0
Central State Hosp | 0 0| 1 0| 0 0| 0 0| 1 0 | 0 0| 0 0| 0 0| 0 0| 0 0 | 1 0
Carroll County
| 0 0| 0 0| 0 0| 1 0| 1 0 | 0 0| 0 0| 0 0| 0 0| 0 0 | 1 0
Clarke County
| 0 0| 1 0| 0 0| 0 0| 1 0 | 0 0| 0 0| 0 0| 0 0| 0 0 | 1 0
Colquitt County
| 0 0| 0 0| 1 0| 0 0| 1 0 | 0 0| 0 0| 0 0| 0 0| 0 0 | 1 0
Coweta County
| 0 0| 1 0| 1 0| 0 0| 2 0 | 0 0| 0 0| 0 0| 0 0| 0 0 | 2 0
Floyd County
| 0 0| 1 0| 1 0| 0 0| 2 0 | 0 0| 0 0| 0 0| 0 0| 0 0 | 2 0
Hall County
| 0 0| 3 0| 1 0| 0 0| 4 0 | 0 0| 0 0| 0 0| 0 0| 0 0 | 4 0
Jackson County
| 0 0| 1 0| 2 0| 1 0| 4 0 | 0 0| 0 0| 0 0| 0 0| 0 0 | 4 0
Jefferson County | 0 0| 1 0| 1 0| 0 0| 2 0 | 0 0| 0 0| 0 0| 0 0| 0 0 | 2 0
Mitchell County
| 0 0| 0 0| 1 0| 0 0| 1 0 | 0 0| 0 0| 0 0| 0 0| 0 0 | 1 0
Muscogee County
| 0 0| 0 0| 1 0| 0 0| 1 0 | 0 0| 0 0| 0 0| 0 0| 0 0 | 1 0
Screven County
| 0 0| 1 0| 0 0| 0 0| 1 0 | 0 0| 0 0| 0 0| 0 0| 0 0 | 1 0
Terrell County
| 0 0| 1 0| 0 0| 1 0| 2 0 | 0 0| 0 0| 0 0| 0 0| 0 0 | 2 0
Clayton County
| 0 0| 1 0| 0 0| 0 0| 1 0 | 0 0| 0 0| 0 0| 0 0| 0 0 | 1 0
Ware Prison
| 13 7| 201 7| 104 5| 10 2| 328 6 | 0 0| 0 0| 0 0| 0 0| 0 0 | 328 5
Lowndes Prison
| 0 0| 6 0| 10 0| 2 0| 18 0 | 0 0| 0 0| 0 0| 0 0| 0 0 | 18 0
Dodge Prison
| 0 0| 55 2| 74 3| 8 2| 137 2 | 0 0| 0 0| 0 0| 0 0| 0 0 | 137 2
Phillips Prison
| 5 3| 129 4| 98 5| 20 5| 252 4 | 0 0| 0 0| 0 0| 0 0| 0 0 | 252 4
Walker Prison
| 0 0| 21 1| 23 1| 6 1| 50 1 | 0 0| 0 0| 0 0| 0 0| 0 0 | 50 1
Wayne Prison
| 0 0| 2 0| 5 0| 0 0| 7 0 | 0 0| 0 0| 0 0| 0 0| 0 0 | 7 0
Arrendale Prison | 42 24| 107 4| 31 1| 2 0| 182 3 | 0 0| 0 0| 0 0| 0 0| 0 0 | 182 3
Montgomery Prison | 0 0| 15 0| 11 1| 3 1| 29 1 | 0 0| 0 0| 0 0| 0 0| 0 0 | 29 0
Lee Prison
| 1 1| 23 1| 20 1| 2 0| 46 1 | 0 0| 0 0| 0 0| 0 0| 0 0 | 46 1
Putnam Prison
| 0 0| 4 0| 1 0| 0 0| 5 0 | 0 0| 0 0| 0 0| 0 0| 0 0 | 5 0
Georgia State Prison| 4 2| 262 9| 209 10| 17 4| 492 9 | 0 0| 0 0| 0 0| 0 0| 0 0 | 492 8
Mens Prison
| 0 0| 11 0| 34 2| 74 17| 119 2 | 0 0| 0 0| 0 0| 0 0| 0 0 | 119 2
Jackson Prison-Diag | 5 3| 19 1| 11 1| 4 1| 39 1 | 0 0| 0 0| 0 0| 0 0| 0 0 | 39 1
Jackson Prison-Perm | 0 0| 3 0| 1 0| 1 0| 5 0 | 0 0| 0 0| 0 0| 0 0| 0 0 | 5 0
Coastal Prison
| 16 9| 47 2| 15 1| 2 0| 80 1 | 0 0| 0 0| 0 0| 0 0| 0 0 | 80 1
Scott Prison
| 0 0| 67 2| 51 2| 9 2| 127 2 | 0 0| 0 0| 0 0| 0 0| 0 0 | 127 2
Rivers Prison
| 0 0| 71 2| 65 3| 12 3| 148 3 | 0 0| 0 0| 0 0| 0 0| 0 0 | 148 2
------------------------------------------------------------------------------------------------------------------------------------
(continued)
Page 42 Run 05/22/01
Georgia Department of Corrections Office of Planning and Analysis
Inmate statistical profile
Sample: ACTIVE PRISONERS SERVING LIFE EXCLUDING JAIL
Requestor:
Active inmates 05/22/2001
Institution by current age & sex
Statistics (CONTINUED)
|
MEN
|
WOMEN
|
| Age | Age | Age | Age | Men
| Age | Age | Age | Age |Women
|Grand
Institution
|00-21 %|22-39 %|40-54 %|55-99 %|Total % |00-21 %|22-39 %|40-54 %|55-99 %|Total % |Total %
------------------------------------------------------------------------------------------------------------------------------------
Rutledge Prison
| 0 0| 34 1| 45 2| 16 4| 95 2 | 0 0| 0 0| 0 0| 0 0| 0 0 | 95 2
Central Prison
| 0 0| 81 3| 115 5| 18 4| 214 4 | 0 0| 0 0| 0 0| 0 0| 0 0 | 214 4
Augusta Med Prison | 1 1| 94 3| 81 4| 33 8| 209 4 | 0 0| 0 0| 0 0| 0 0| 0 0 | 209 3
Rogers Prison
| 0 0| 22 1| 20 1| 0 0| 42 1 | 0 0| 0 0| 0 0| 0 0| 0 0 | 42 1
Burruss Prison
| 0 0| 4 0| 11 1| 2 0| 17 0 | 0 0| 0 0| 0 0| 0 0| 0 0 | 17 0
Bostick Prison
| 0 0| 9 0| 28 1| 28 6| 65 1 | 0 0| 0 0| 0 0| 0 0| 0 0 | 65 1
Valdosta Prison
| 8 4| 141 5| 103 5| 18 4| 270 5 | 0 0| 0 0| 0 0| 0 0| 0 0 | 270 5
Hays Prison
| 7 4| 154 5| 107 5| 16 4| 284 5 | 0 0| 0 0| 0 0| 0 0| 0 0 | 284 5
Hancock Prison
| 9 5| 214 7| 136 6| 22 5| 381 7 | 0 0| 0 0| 0 0| 0 0| 0 0 | 381 6
Telfair Prison
| 11 6| 229 8| 92 4| 10 2| 342 6 | 0 0| 0 0| 0 0| 0 0| 0 0 | 342 6
Autry Prison
| 11 6| 130 4| 112 5| 19 4| 272 5 | 0 0| 0 0| 0 0| 0 0| 0 0 | 272 5
Wilcox Prison
| 0 0| 66 2| 66 3| 6 1| 138 2 | 0 0| 0 0| 0 0| 0 0| 0 0 | 138 2
Calhoun Prison
| 11 6| 85 3| 60 3| 7 2| 163 3 | 0 0| 0 0| 0 0| 0 0| 0 0 | 163 3
Dooly Prison
| 0 0| 49 2| 68 3| 6 1| 123 2 | 0 0| 0 0| 0 0| 0 0| 0 0 | 123 2
Macon Prison
| 17 10| 283 9| 99 5| 26 6| 425 7 | 0 0| 0 0| 0 0| 0 0| 0 0 | 425 7
Smith Prison
| 15 8| 203 7| 67 3| 12 3| 297 5 | 0 0| 0 0| 0 0| 0 0| 0 0 | 297 5
Homerville Prison | 0 0| 3 0| 5 0| 0 0| 8 0 | 0 0| 0 0| 0 0| 0 0| 0 0 | 8 0
Washingtn Women Pris| 0 0| 0 0| 0 0| 0 0| 0 0 | 3 33| 26 22| 26 30| 9 36| 64 26 | 64 1
Baldwin Prison
| 2 1| 21 1| 21 1| 3 1| 47 1 | 0 0| 0 0| 0 0| 0 0| 0 0 | 47 1
Metro Womens Prison | 0 0| 0 0| 0 0| 0 0| 0 0 | 0 0| 30 25| 29 33| 6 24| 65 27 | 65 1
Pulaski Womens Pris | 0 0| 0 0| 0 0| 0 0| 0 0 | 6 67| 62 52| 31 35| 9 36| 108 45 | 108 2
Pelham PreTrans Unit| 0 0| 9 0| 7 0| 0 0| 16 0 | 0 0| 0 0| 0 0| 0 0| 0 0 | 16 0
West Central Prison | 0 0| 3 0| 0 0| 0 0| 3 0 | 0 0| 0 0| 0 0| 0 0| 0 0 | 3 0
D Ray James Prison | 0 0| 33 1| 30 1| 3 1| 66 1 | 0 0| 0 0| 0 0| 0 0| 0 0 | 66 1
Coffee Corr Facility| 0 0| 36 1| 23 1| 8 2| 67 1 | 0 0| 0 0| 0 0| 0 0| 0 0 | 67 1
Wheeler Corr Facilty| 0 0| 39 1| 38 2| 3 1| 80 1 | 0 0| 0 0| 0 0| 0 0| 0 0 | 80 1
------------------------------------------------------------------------------------------------------------------------------------
Total reported
| 178 100| 3013 100| 2122 100| 435 100| 5748 100 | 9 100| 120 100| 88 100| 25 100| 242 100 | 5990 100
|
|
|
|
|
|
|
|
|
|
|
Percent reported | 100.0| 100.0| 100.0| 100.0| 100.0 | 100.0| 100.0| 100.0| 100.0| 100.0 | 100.0
|
|
|
|
|
|
|
|
|
|
|
|
|
|
|
|
|
|
|
|
|
|
Not Reported
|0|0|0|0|0
|0|0|0|0|0
|0
------------------------------------------------------------------------------------------------------------------------------------
Total
| 178 | 3013 | 2122 | 435 | 5748
| 9 | 120 | 88 | 25 | 242
| 5990
Page 43 Run 05/22/01
Georgia Department of Corrections Office of Planning and Analysis
Inmate statistical profile
Sample: ACTIVE PRISONERS SERVING LIFE EXCLUDING JAIL
Requestor: Statistics
Active inmates 05/22/2001
Misdemeanors And Felonies by current age & sex
|
MEN
|
WOMEN
|
| Age | Age | Age | Age | Men
| Age | Age | Age | Age |Women
|Grand
Crime Type
|00-21 %|22-39 %|40-54 %|55-99 %|Total % |00-21 %|22-39 %|40-54 %|55-99 %|Total % |Total %
------------------------------------------------------------------------------------------------------------------------------------
MISDEMEANOR
| 0 0| 0 0| 0 0| 0 0| 0 0 | 0 0| 0 0| 0 0| 0 0| 0 0 | 0 0
FELONY
| 178 100| 3013 100| 2122 100| 435 100| 5748 100 | 9 100| 120 100| 88 100| 25 100| 242 100 | 5990 100
------------------------------------------------------------------------------------------------------------------------------------
Total reported
| 178 100| 3013 100| 2122 100| 435 100| 5748 100 | 9 100| 120 100| 88 100| 25 100| 242 100 | 5990 100
|
|
|
|
|
|
|
|
|
|
|
Percent reported | 100.0| 100.0| 100.0| 100.0| 100.0 | 100.0| 100.0| 100.0| 100.0| 100.0 | 100.0
|
|
|
|
|
|
|
|
|
|
|
|
|
|
|
|
|
|
|
|
|
|
NOT REPORTED
|0|0|0|0|0
|0|0|0|0|0
|0
------------------------------------------------------------------------------------------------------------------------------------
Total
| 178 | 3013 | 2122 | 435 | 5748
| 9 | 120 | 88 | 25 | 242
| 5990
Page 44 Run 05/22/01
Georgia Department of Corrections Office of Planning and Analysis
Inmate statistical profile
Sample: ACTIVE PRISONERS SERVING LIFE EXCLUDING JAIL
Requestor: Statistics
Active inmates 05/22/2001
Crimes By Group by current age & sex
|
MEN
|
WOMEN
|
| Age | Age | Age | Age | Men
| Age | Age | Age | Age |Women
|Grand
Crimes By Group
|00-21 %|22-39 %|40-54 %|55-99 %|Total % |00-21 %|22-39 %|40-54 %|55-99 %|Total % |Total %
------------------------------------------------------------------------------------------------------------------------------------
HOMICIDE
| 130 74| 1896 63| 1250 59| 327 75| 3603 63 | 9 100| 107 89| 73 83| 25 100| 214 88 | 3817 64
ABORTION
| 0 0| 0 0| 0 0| 0 0| 0 0 | 0 0| 0 0| 0 0| 0 0| 0 0 | 0 0
BODILY INJRY&REL OFF| 17 10| 182 6| 109 5| 5 1| 313 5 | 0 0| 2 2| 5 6| 0 0| 7 3 | 320 5
ARSON & REL OFF
| 0 0| 1 0| 0 0| 0 0| 1 0 | 0 0| 0 0| 0 0| 0 0| 0 0 | 1 0
DAMAGE OF PROPERTY | 0 0| 1 0| 0 0| 0 0| 1 0 | 0 0| 0 0| 0 0| 0 0| 0 0 | 1 0
BURGLARY & REL OFF | 0 0| 15 0| 8 0| 0 0| 23 0 | 0 0| 0 0| 1 1| 0 0| 1 0 | 24 0
FORGERY & REL OFF | 0 0| 5 0| 4 0| 0 0| 9 0 | 0 0| 0 0| 0 0| 0 0| 0 0 | 9 0
THEFT
| 0 0| 6 0| 5 0| 0 0| 11 0 | 0 0| 0 0| 0 0| 0 0| 0 0 | 11 0
ROBBERY
| 19 11| 352 12| 246 12| 34 8| 651 11 | 0 0| 2 2| 1 1| 0 0| 3 1 | 654 11
SEXUAL OFFENSES
| 9 5| 322 11| 371 17| 56 13| 758 13 | 0 0| 0 0| 2 2| 0 0| 2 1 | 760 13
OBSCENITY CRIMES | 0 0| 0 0| 0 0| 0 0| 0 0 | 0 0| 0 0| 0 0| 0 0| 0 0 | 0 0
TREASON & REL OFF | 0 0| 0 0| 0 0| 0 0| 0 0 | 0 0| 0 0| 0 0| 0 0| 0 0 | 0 0
CRIMES INVOLVNG GOVT| 0 0| 6 0| 5 0| 1 0| 12 0 | 0 0| 0 0| 0 0| 0 0| 0 0 | 12 0
FALSIFICATIONS
| 0 0| 0 0| 0 0| 0 0| 0 0 | 0 0| 0 0| 0 0| 0 0| 0 0 | 0 0
OBSTRUCT LAW ENFORCE| 0 0| 0 0| 2 0| 0 0| 2 0 | 0 0| 0 0| 0 0| 0 0| 0 0 | 2 0
DISORDERLY CONDUCT | 0 0| 0 0| 0 0| 0 0| 0 0 | 0 0| 0 0| 0 0| 0 0| 0 0 | 0 0
GAMBLING & REL OFF | 0 0| 0 0| 0 0| 0 0| 0 0 | 0 0| 0 0| 0 0| 0 0| 0 0 | 0 0
CRUELTY TO CHILDREN | 0 0| 0 0| 0 0| 0 0| 0 0 | 0 0| 0 0| 0 0| 0 0| 0 0 | 0 0
CRIMES WITH GUNS | 0 0| 0 0| 1 0| 0 0| 1 0 | 0 0| 0 0| 0 0| 0 0| 0 0 | 1 0
INVASION PRIVACY | 0 0| 0 0| 0 0| 0 0| 0 0 | 0 0| 0 0| 0 0| 0 0| 0 0 | 0 0
RACKETEERING
| 0 0| 0 0| 0 0| 0 0| 0 0 | 0 0| 0 0| 0 0| 0 0| 0 0 | 0 0
DRUG ABUSE OFFENSES | 1 1| 206 7| 115 5| 10 2| 332 6 | 0 0| 9 8| 6 7| 0 0| 15 6 | 347 6
DRUG TRAFFICKING | 0 0| 16 1| 5 0| 1 0| 22 0 | 0 0| 0 0| 0 0| 0 0| 0 0 | 22 0
AUTO CRIMES
| 0 0| 0 0| 0 0| 0 0| 0 0 | 0 0| 0 0| 0 0| 0 0| 0 0 | 0 0
REVENUE & CONTRABAND| 0 0| 0 0| 0 0| 0 0| 0 0 | 0 0| 0 0| 0 0| 0 0| 0 0 | 0 0
CRIMES OF OTH STATES| 0 0| 0 0| 0 0| 0 0| 0 0 | 0 0| 0 0| 0 0| 0 0| 0 0 | 0 0
MISC. FELONIES
| 0 0| 1 0| 0 0| 1 0| 2 0 | 0 0| 0 0| 0 0| 0 0| 0 0 | 2 0
MISDEMEANORS
| 0 0| 0 0| 0 0| 0 0| 0 0 | 0 0| 0 0| 0 0| 0 0| 0 0 | 0 0
------------------------------------------------------------------------------------------------------------------------------------
Total reported
| 176 100| 3009 100| 2121 100| 435 100| 5741 100 | 9 100| 120 100| 88 100| 25 100| 242 100 | 5983 100
|
|
|
|
|
|
|
|
|
|
|
Percent reported |
98.9|
99.9| 100.0| 100.0|
99.9 | 100.0| 100.0| 100.0| 100.0| 100.0 |
99.9
|
|
|
|
|
|
|
|
|
|
|
|
|
|
|
|
|
|
|
|
|
|
NOT REPORTED
|2|4|1|0|7
|0|0|0|0|0
|7
------------------------------------------------------------------------------------------------------------------------------------
Total
| 178 | 3013 | 2122 | 435 | 5748
| 9 | 120 | 88 | 25 | 242
| 5990
Page 45 Run 05/22/01
Georgia Department of Corrections Office of Planning and Analysis
Inmate statistical profile
Sample: ACTIVE PRISONERS SERVING LIFE EXCLUDING JAIL
Requestor: Statistics
Active inmates 05/22/2001
Most Serious Offense by current age & sex
|
MEN
|
WOMEN
|
| Age | Age | Age | Age | Men
| Age | Age | Age | Age |Women
|Grand
Most Serious Offense|00-21 %|22-39 %|40-54 %|55-99 %|Total % |00-21 %|22-39 %|40-54 %|55-99 %|Total % |Total %
------------------------------------------------------------------------------------------------------------------------------------
Misdemeanors
|
|
|
------------------------------------------------------------------------------------------------------------------------------------
------------------------------------------------------------------------------------------------------------------------------------
------------------------------------------------------------------------------------------------------------------------------------
FELONIES
|
|
|
------------------------------------------------------------------------------------------------------------------------------------
------------------------------------------------------------------------------------------------------------------------------------
MISC. HOMICIDE OFFEN| 2 1| 4 0| 1 0| 0 0| 7 0 | 0 0| 0 0| 0 0| 0 0| 0 0 | 7 0
MURDER
| 130 73| 1895 63| 1250 59| 326 75| 3601 63 | 9 100| 107 89| 73 83| 25 100| 214 88 | 3815 64
VOLUNTARY MANSLAUGHT| 0 0| 1 0| 0 0| 1 0| 2 0 | 0 0| 0 0| 0 0| 0 0| 0 0 | 2 0
AGGRAVATED ASSAULT | 0 0| 7 0| 1 0| 0 0| 8 0 | 0 0| 0 0| 0 0| 0 0| 0 0 | 8 0
AGGRAVATED BATTERY | 0 0| 1 0| 0 0| 0 0| 1 0 | 0 0| 0 0| 0 0| 0 0| 0 0 | 1 0
KIDNAPPING
| 17 10| 174 6| 106 5| 5 1| 302 5 | 0 0| 2 2| 5 6| 0 0| 7 3 | 309 5
AGG ASSLT ON POLICE | 0 0| 0 0| 2 0| 0 0| 2 0 | 0 0| 0 0| 0 0| 0 0| 0 0 | 2 0
SECOND DEGREE ARSON | 0 0| 1 0| 0 0| 0 0| 1 0 | 0 0| 0 0| 0 0| 0 0| 0 0 | 1 0
CRIM. DAMAGE 2ND DEG| 0 0| 1 0| 0 0| 0 0| 1 0 | 0 0| 0 0| 0 0| 0 0| 0 0 | 1 0
BURGLARY
| 0 0| 15 0| 8 0| 0 0| 23 0 | 0 0| 0 0| 1 1| 0 0| 1 0 | 24 0
FORGERY 1ST DEGREE | 0 0| 5 0| 4 0| 0 0| 9 0 | 0 0| 0 0| 0 0| 0 0| 0 0 | 9 0
THEFT BY TAKING
| 0 0| 2 0| 3 0| 0 0| 5 0 | 0 0| 0 0| 0 0| 0 0| 0 0 | 5 0
THEFT BY REC STOLEN | 0 0| 2 0| 1 0| 0 0| 3 0 | 0 0| 0 0| 0 0| 0 0| 0 0 | 3 0
THEFT BY CONVERSION | 0 0| 1 0| 1 0| 0 0| 2 0 | 0 0| 0 0| 0 0| 0 0| 0 0 | 2 0
THEFT OF MOTOR VEH, | 0 0| 1 0| 0 0| 0 0| 1 0 | 0 0| 0 0| 0 0| 0 0| 0 0 | 1 0
ROBBERY
| 0 0| 5 0| 5 0| 4 1| 14 0 | 0 0| 0 0| 0 0| 0 0| 0 0 | 14 0
ARMED ROBBERY
| 18 10| 347 12| 241 11| 30 7| 636 11 | 0 0| 2 2| 1 1| 0 0| 3 1 | 639 11
CRMNL ATMPT ARMED RO| 1 1| 0 0| 0 0| 0 0| 1 0 | 0 0| 0 0| 0 0| 0 0| 0 0 | 1 0
MISC. SEXUAL
| 0 0| 1 0| 0 0| 0 0| 1 0 | 0 0| 0 0| 0 0| 0 0| 0 0 | 1 0
RAPE
| 9 5| 301 10| 337 16| 44 10| 691 12 | 0 0| 0 0| 2 2| 0 0| 2 1 | 693 12
AGGRAVATED SODOMY | 0 0| 14 0| 21 1| 9 2| 44 1 | 0 0| 0 0| 0 0| 0 0| 0 0 | 44 1
CHILD MOLESTATION | 0 0| 2 0| 3 0| 1 0| 6 0 | 0 0| 0 0| 0 0| 0 0| 0 0 | 6 0
AGGRAV. CHILD MOLEST| 0 0| 4 0| 10 0| 2 0| 16 0 | 0 0| 0 0| 0 0| 0 0| 0 0 | 16 0
OBSTR OF LAW ENF OFF| 0 0| 6 0| 5 0| 1 0| 12 0 | 0 0| 0 0| 0 0| 0 0| 0 0 | 12 0
ESCAPE
| 0 0| 0 0| 2 0| 0 0| 2 0 | 0 0| 0 0| 0 0| 0 0| 0 0 | 2 0
POSS OF CERTAIN WEAP| 0 0| 0 0| 1 0| 0 0| 1 0 | 0 0| 0 0| 0 0| 0 0| 0 0 | 1 0
S/D NARCOTICS, OPIAT| 0 0| 11 0| 12 1| 2 0| 25 0 | 0 0| 0 0| 1 1| 0 0| 1 0 | 26 0
S/D DEP,STIM,CNTRF D| 0 0| 4 0| 2 0| 0 0| 6 0 | 0 0| 0 0| 0 0| 0 0| 0 0 | 6 0
SALE/DIST OF MARIJUA| 0 0| 5 0| 5 0| 1 0| 11 0 | 0 0| 0 0| 0 0| 0 0| 0 0 | 11 0
------------------------------------------------------------------------------------------------------------------------------------
(continued)
Page 46 Run 05/22/01
Georgia Department of Corrections Office of Planning and Analysis
Inmate statistical profile
Sample: ACTIVE PRISONERS SERVING LIFE EXCLUDING JAIL
Requestor:
Active inmates 05/22/2001
Most Serious Offense by current age & sex
Statistics (CONTINUED)
|
MEN
|
WOMEN
|
| Age | Age | Age | Age | Men
| Age | Age | Age | Age |Women
|Grand
Most Serious Offense|00-21 %|22-39 %|40-54 %|55-99 %|Total % |00-21 %|22-39 %|40-54 %|55-99 %|Total % |Total %
------------------------------------------------------------------------------------------------------------------------------------
POSS NARCOTICS, OPIA| 0 0| 4 0| 3 0| 0 0| 7 0 | 0 0| 0 0| 0 0| 0 0| 0 0 | 7 0
POSS DEP,STIM,CNTRF | 0 0| 0 0| 1 0| 0 0| 1 0 | 0 0| 0 0| 0 0| 0 0| 0 0 | 1 0
VIOLATE GA CNTRL SBS| 0 0| 15 0| 5 0| 0 0| 20 0 | 0 0| 1 1| 1 1| 0 0| 2 1 | 22 0
UNLWFL MFG/DEL/DIST | 0 0| 5 0| 1 0| 0 0| 6 0 | 0 0| 0 0| 0 0| 0 0| 0 0 | 6 0
SALE/DIST CONT SUB P| 0 0| 3 0| 0 0| 0 0| 3 0 | 0 0| 0 0| 0 0| 0 0| 0 0 | 3 0
SALE/DIST CONT SUB S| 0 0| 1 0| 0 0| 0 0| 1 0 | 0 0| 0 0| 0 0| 0 0| 0 0 | 1 0
SALE/DISTRIBUTION CO| 1 1| 132 4| 72 3| 4 1| 209 4 | 0 0| 8 7| 4 5| 0 0| 12 5 | 221 4
POSSESSION OF COCAIN| 0 0| 26 1| 14 1| 3 1| 43 1 | 0 0| 0 0| 0 0| 0 0| 0 0 | 43 1
COCAINE LESS 200 GRA| 0 0| 10 0| 5 0| 1 0| 16 0 | 0 0| 0 0| 0 0| 0 0| 0 0 | 16 0
COCAINE 401 OR MORE | 0 0| 5 0| 0 0| 0 0| 5 0 | 0 0| 0 0| 0 0| 0 0| 0 0 | 5 0
ATT/CONSPRCY COMMT C| 0 0| 1 0| 0 0| 0 0| 1 0 | 0 0| 0 0| 0 0| 0 0| 0 0 | 1 0
CONSPIRACY
| 0 0| 1 0| 0 0| 0 0| 1 0 | 0 0| 0 0| 0 0| 0 0| 0 0 | 1 0
CRIMINAL ATTEMPT | 0 0| 0 0| 0 0| 1 0| 1 0 | 0 0| 0 0| 0 0| 0 0| 0 0 | 1 0
------------------------------------------------------------------------------------------------------------------------------------
Total reported
| 178 100| 3013 100| 2122 100| 435 100| 5748 100 | 9 100| 120 100| 88 100| 25 100| 242 100 | 5990 100
|
|
|
|
|
|
|
|
|
|
|
Percent reported | 100.0| 100.0| 100.0| 100.0| 100.0 | 100.0| 100.0| 100.0| 100.0| 100.0 | 100.0
|
|
|
|
|
|
|
|
|
|
|
|
|
|
|
|
|
|
|
|
|
|
NOT REPORTED
|0|0|0|0|0
|0|0|0|0|0
|0
------------------------------------------------------------------------------------------------------------------------------------
Total
| 178 | 3013 | 2122 | 435 | 5748
| 9 | 120 | 88 | 25 | 242
| 5990
Page 47 Run 05/22/01
Georgia Department of Corrections Office of Planning and Analysis
Inmate statistical profile
Sample: ACTIVE PRISONERS SERVING LIFE EXCLUDING JAIL
Requestor: Statistics
Active inmates 05/22/2001
Most Serious Crime Type by current age & sex
|
MEN
|
WOMEN
|
| Age | Age | Age | Age | Men
| Age | Age | Age | Age |Women
|Grand
Crime Type
|00-21 %|22-39 %|40-54 %|55-99 %|Total % |00-21 %|22-39 %|40-54 %|55-99 %|Total % |Total %
------------------------------------------------------------------------------------------------------------------------------------
VIOL/PERSN
| 168 94| 2434 81| 1606 76| 366 84| 4574 80 | 9 100| 111 93| 79 90| 25 100| 224 93 | 4798 80
NVIOL/PERS
| 0 0| 0 0| 0 0| 0 0| 0 0 | 0 0| 0 0| 0 0| 0 0| 0 0 | 0 0
PROPERTY
| 0 0| 28 1| 17 1| 0 0| 45 1 | 0 0| 0 0| 1 1| 0 0| 1 0 | 46 1
DRUG SALES
| 1 1| 177 6| 97 5| 8 2| 283 5 | 0 0| 8 7| 5 6| 0 0| 13 5 | 296 5
DRUG POSSN
| 0 0| 45 1| 23 1| 3 1| 71 1 | 0 0| 1 1| 1 1| 0 0| 2 1 | 73 1
ALCOHOL
| 0 0| 0 0| 0 0| 0 0| 0 0 | 0 0| 0 0| 0 0| 0 0| 0 0 | 0 0
HABIT/DUI
| 0 0| 0 0| 0 0| 0 0| 0 0 | 0 0| 0 0| 0 0| 0 0| 0 0 | 0 0
SEX OFFEND
| 9 5| 322 11| 371 17| 56 13| 758 13 | 0 0| 0 0| 2 2| 0 0| 2 1 | 760 13
OTHER
| 0 0| 7 0| 8 0| 2 0| 17 0 | 0 0| 0 0| 0 0| 0 0| 0 0 | 17 0
------------------------------------------------------------------------------------------------------------------------------------
Total reported
| 178 100| 3013 100| 2122 100| 435 100| 5748 100 | 9 100| 120 100| 88 100| 25 100| 242 100 | 5990 100
|
|
|
|
|
|
|
|
|
|
|
Percent reported | 100.0| 100.0| 100.0| 100.0| 100.0 | 100.0| 100.0| 100.0| 100.0| 100.0 | 100.0
|
|
|
|
|
|
|
|
|
|
|
|
|
|
|
|
|
|
|
|
|
|
NOT REPORTED
|0|0|0|0|0
|0|0|0|0|0
|0
------------------------------------------------------------------------------------------------------------------------------------
Total
| 178 | 3013 | 2122 | 435 | 5748
| 9 | 120 | 88 | 25 | 242
| 5990