- Collection:
- Georgia Government Publications
- Title:
- Inmate statistical profile: active lifers, Feb. 2001
- Creator:
- Georgia. Department of Corrections. Planning and Analysis Section
- Publisher:
- Atlanta, GA. : Georgia Dept. of Corrections, Office of Planning and Analysis, 2001-02
- Date of Original:
- 2001-02
- Subject:
- Prisoners--Georgia
- Location:
- United States, Georgia, 32.75042, -83.50018
- Medium:
- state government records
- Type:
- Text
- Format:
- application/pdf
- External Identifiers:
- Call Number GA R300.P5 P1 L5 2001/2
- Metadata URL:
- https://dlg.galileo.usg.edu/id:dlg_ggpd_i-ga-br300-pp5-bp1-bl5-b2001-s2-belec-p-btext
- Digital Object URL:
- https://dlg.galileo.usg.edu/do:dlg_ggpd_i-ga-br300-pp5-bp1-bl5-b2001-s2-belec-p-btext
- Language:
- eng
- Holding Institution:
- University of Georgia. Map and Government Information Library
- Rights:
-

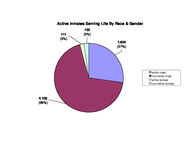
Active Inmates Serving Life By Race & Gender
111 (2%)
133 (2%)
1,624 (27%)
4,105 (69%)
white male non-white male white female non-white female
Active Inmates Serving Life By Crime Type
73 (1%)
758 (13%)
18 (<1%)
318 (5%)
47 (1%)
4,759 (80%)
viol/persn
property
drug sales
drug possn
sex offend
other
Prior Incarcerations of Active Inmates Serving A Life Sentence
4000
3,620
(61%)
3500
3000
Number of Inmates
2500
2000 1500 1000
500 0
zero
1,210 (20%)
one
613 (10%)
326 (5%)
two
three
Priors
133 (2%)
four
71 (1%)
five or more
Georgia Department of Corrections
Page 1 Run 02/27/01
Office of Planning and Analysis
Inmate statistical profile TABLE OF CONTENTS FOR ACTIVE PRISONERS SERVING LIFE EXCLUDING JAIL
TITLE ----RACE AND SEX............................ 2 Culture Fair IQ Scores.................. 3 Self-Rpt Socioeconomic Class............ 4 Self-Rpt Environment To Age 16.......... 5 Self-Rpt Education Level................ 6 Functional Reading Level (WRAT Scores).. 7 Functional Math Level (WRAT Scores)..... 8 Functional Spelling Level (WRAT Scores). 9 Self-Rpt Guardian Status To Age 16......10 Self-Rpt Employment Status Before Prison11 Self-Rpt Marital Status At Admission....12 Self-Rpt Number Of Children At Admission13 Self-Rpt Religious Affiliation..........14 Self-Rpt Family Behavior Patterns *.....15 Inmate Diagnostic Behavior Problem *....16 Physical Profile (General Condition)....17 Security Status.........................18 Number Of Sentences.....................19 Number Of Disciplinaries................20 Number Of Escapes.......................21 Number Of Prior Georgia Incarcerations *22 Number Of Transfers.....................23 County Of Conviction....................24 Circuit Of Conviction...................29 Home County.............................31 Prison Sentence In Years................36 Probation To Follow Prison..............37 Admission Type..........................38 Release Type............................39 Inst By Group...........................40 Institution.............................41 Misdemeanors And Felonies...............43 Crimes By Group.........................44 Most Serious Offense....................45 Most Serious Crime Type.................47
PAGE ----
Georgia Department of Corrections
Page 2 Run 02/27/01
Office of Planning and Analysis
Inmate statistical profile
Sample: ACTIVE PRISONERS SERVING LIFE EXCLUDING JAIL
Requestor: Statistics
Active inmates 02/27/2001
RACE AND SEX by current age & sex
|
MEN
|
WOMEN
|
| Age | Age | Age | Age | Men
| Age | Age | Age | Age |Women
|Grand
RACE AND SEX
|00-21 %|22-39 %|40-54 %|55-99 %|Total % |00-21 %|22-39 %|40-54 %|55-99 %|Total % |Total %
------------------------------------------------------------------------------------------------------------------------------------
WHITE MALE
| 34 19| 679 23| 700 33| 211 50| 1624 28 | 0 0| 0 0| 0 0| 0 0| 0 0 | 1624 27
NON WHITE MALE
| 149 81| 2331 77| 1418 67| 207 50| 4105 72 | 0 0| 0 0| 0 0| 0 0| 0 0 | 4105 69
WHITE FEMALE
| 0 0| 0 0| 0 0| 0 0| 0 0 | 4 36| 45 37| 44 51| 18 69| 111 45 | 111 2
NON WHITE FEMALE | 0 0| 0 0| 0 0| 0 0| 0 0 | 7 64| 76 63| 42 49| 8 31| 133 55 | 133 2
------------------------------------------------------------------------------------------------------------------------------------
Total reported
| 183 100| 3010 100| 2118 100| 418 100| 5729 100 | 11 100| 121 100| 86 100| 26 100| 244 100 | 5973 100
|
|
|
|
|
|
|
|
|
|
|
Percent reported | 100.0| 100.0| 100.0| 100.0| 100.0 | 100.0| 100.0| 100.0| 100.0| 100.0 | 100.0
|
|
|
|
|
|
|
|
|
|
|
|
|
|
|
|
|
|
|
|
|
|
NOT REPORTED
|0|0|0|0|0
|0|0|0|0|0
|0
------------------------------------------------------------------------------------------------------------------------------------
Total
| 183 | 3010 | 2118 | 418 | 5729
| 11 | 121 | 86 | 26 | 244
| 5973
|
|
|
|
|
|
|
|
|
|
|
|
|
|
|
|
|
|
|
|
|
|
|
|
|
|
|
|
|
|
|
|
|
|
|
|
|
|
|
|
|
|
|
|
|
|
|
|
|
|
|
|
|
|
|
AVERAGE AGE
| 19.86 | 31.18 | 45.77 | 61.11 | 38.40 | 19.82 | 31.48 | 45.20 | 60.96 | 38.93 | 38.42
Page 3 Run 02/27/01
Georgia Department of Corrections Office of Planning and Analysis
Inmate statistical profile
Sample: ACTIVE PRISONERS SERVING LIFE EXCLUDING JAIL
Requestor: Statistics
Active inmates 02/27/2001
Culture Fair IQ Scores by current age & sex
|
MEN
|
WOMEN
|
| Age | Age | Age | Age | Men
| Age | Age | Age | Age |Women
|Grand
IQ Score
|00-21 %|22-39 %|40-54 %|55-99 %|Total % |00-21 %|22-39 %|40-54 %|55-99 %|Total % |Total %
------------------------------------------------------------------------------------------------------------------------------------
LESS THAN 70
| 4 2| 76 3| 157 8| 39 10| 276 5 | 0 0| 9 8| 9 11| 2 9| 20 9 | 296 5
70 AND UP
| 169 98| 2802 97| 1813 92| 334 90| 5118 95 | 10 100| 109 92| 74 89| 21 91| 214 91 | 5332 95
------------------------------------------------------------------------------------------------------------------------------------
Total reported
| 173 100| 2878 100| 1970 100| 373 100| 5394 100 | 10 100| 118 100| 83 100| 23 100| 234 100 | 5628 100
|
|
|
|
|
|
|
|
|
|
|
Percent reported |
94.5|
95.6|
93.0|
89.2|
94.2 |
90.9|
97.5|
96.5|
88.5|
95.9 |
94.2
|
|
|
|
|
|
|
|
|
|
|
|
|
|
|
|
|
|
|
|
|
|
NOT REPORTED
| 10 | 132 | 148 | 45 | 335
| 1 | 3 | 3 | 3 | 10
| 345
------------------------------------------------------------------------------------------------------------------------------------
Total
| 183 | 3010 | 2118 | 418 | 5729
| 11 | 121 | 86 | 26 | 244
| 5973
|
|
|
|
|
|
|
|
|
|
|
|
|
|
|
|
|
|
|
|
|
|
|
|
|
|
|
|
|
|
|
|
|
|
|
|
|
|
|
|
|
|
|
|
|
|
|
|
|
|
|
|
|
|
|
AVERAGE IQ
| 99.32 | 101.43 | 97.10 | 93.82 | 99.26 | 97.80 | 95.63 | 90.84 | 88.83 | 93.35 | 99.01
Page 4 Run 02/27/01
Georgia Department of Corrections Office of Planning and Analysis
Inmate statistical profile
Sample: ACTIVE PRISONERS SERVING LIFE EXCLUDING JAIL
Requestor: Statistics
Active inmates 02/27/2001
Self-Rpt Socioeconomic Class by current age & sex
|
MEN
|
WOMEN
|
| Age | Age | Age | Age | Men
| Age | Age | Age | Age |Women
|Grand
Socioeconomic Class |00-21 %|22-39 %|40-54 %|55-99 %|Total % |00-21 %|22-39 %|40-54 %|55-99 %|Total % |Total %
------------------------------------------------------------------------------------------------------------------------------------
WELFARE
| 17 10| 342 12| 208 10| 22 6| 589 11 | 0 0| 22 18| 8 9| 0 0| 30 13 | 619 11
OCC EMPLOY
| 13 8| 191 7| 64 3| 7 2| 275 5 | 0 0| 3 3| 0 0| 1 4| 4 2 | 279 5
MINIMUM STD
| 70 42| 1015 35| 892 44| 218 55| 2195 40 | 7 64| 40 34| 26 30| 9 39| 82 34 | 2277 40
MIDDLE
| 66 40| 1321 46| 876 43| 145 37| 2408 44 | 4 36| 53 45| 49 57| 12 52| 118 49 | 2526 44
OTHER
| 1 1| 26 1| 6 0| 3 1| 36 1 | 0 0| 1 1| 3 3| 1 4| 5 2 | 41 1
------------------------------------------------------------------------------------------------------------------------------------
Total reported
| 167 100| 2895 100| 2046 100| 395 100| 5503 100 | 11 100| 119 100| 86 100| 23 100| 239 100 | 5742 100
|
|
|
|
|
|
|
|
|
|
|
Percent reported |
91.3|
96.2|
96.6|
94.5|
96.1 | 100.0|
98.3| 100.0|
88.5|
98.0 |
96.1
|
|
|
|
|
|
|
|
|
|
|
|
|
|
|
|
|
|
|
|
|
|
NOT RPTD
| 16 | 115 | 72 | 23 | 226
|0|2|0|3|5
| 231
------------------------------------------------------------------------------------------------------------------------------------
Total
| 183 | 3010 | 2118 | 418 | 5729
| 11 | 121 | 86 | 26 | 244
| 5973
Page 5 Run 02/27/01
Georgia Department of Corrections Office of Planning and Analysis
Inmate statistical profile
Sample: ACTIVE PRISONERS SERVING LIFE EXCLUDING JAIL
Requestor: Statistics
Active inmates 02/27/2001
Self-Rpt Environment To Age 16 by current age & sex
|
MEN
|
WOMEN
|
| Age | Age | Age | Age | Men
| Age | Age | Age | Age |Women
|Grand
Environment
|00-21 %|22-39 %|40-54 %|55-99 %|Total % |00-21 %|22-39 %|40-54 %|55-99 %|Total % |Total %
------------------------------------------------------------------------------------------------------------------------------------
RURAL/FARM
| 1 1| 106 4| 176 9| 93 23| 376 7 | 0 0| 8 7| 4 5| 3 14| 15 6 | 391 7
RURAL/NFARM
| 4 2| 206 7| 173 8| 36 9| 419 8 | 0 0| 7 6| 3 3| 0 0| 10 4 | 429 7
S.M.S.A
| 76 42| 1214 41| 732 36| 105 26| 2127 38 | 3 27| 24 20| 21 24| 7 32| 55 23 | 2182 37
URBAN
| 33 18| 516 18| 374 18| 54 13| 977 17 | 4 36| 30 25| 24 28| 2 9| 60 25 | 1037 18
SMALL TOWN
| 66 37| 887 30| 591 29| 115 29| 1659 30 | 4 36| 50 42| 32 37| 9 41| 95 40 | 1754 30
OTHER
| 0 0| 17 1| 9 0| 0 0| 26 0 | 0 0| 0 0| 2 2| 1 5| 3 1 | 29 0
------------------------------------------------------------------------------------------------------------------------------------
Total reported
| 180 100| 2946 100| 2055 100| 403 100| 5584 100 | 11 100| 119 100| 86 100| 22 100| 238 100 | 5822 100
|
|
|
|
|
|
|
|
|
|
|
Percent reported |
98.4|
97.9|
97.0|
96.4|
97.5 | 100.0|
98.3| 100.0|
84.6|
97.5 |
97.5
|
|
|
|
|
|
|
|
|
|
|
|
|
|
|
|
|
|
|
|
|
|
NOT RPTD
| 3 | 64 | 63 | 15 | 145
|0|2|0|4|6
| 151
------------------------------------------------------------------------------------------------------------------------------------
Total
| 183 | 3010 | 2118 | 418 | 5729
| 11 | 121 | 86 | 26 | 244
| 5973
Page 6 Run 02/27/01
Georgia Department of Corrections Office of Planning and Analysis
Inmate statistical profile
Sample: ACTIVE PRISONERS SERVING LIFE EXCLUDING JAIL
Requestor: Statistics
Active inmates 02/27/2001
Self-Rpt Education Level by current age & sex
|
MEN
|
WOMEN
|
| Age | Age | Age | Age | Men
| Age | Age | Age | Age |Women
|Grand
Education Level
|00-21 %|22-39 %|40-54 %|55-99 %|Total % |00-21 %|22-39 %|40-54 %|55-99 %|Total % |Total %
------------------------------------------------------------------------------------------------------------------------------------
LESS THAN GRADE 7 | 5 3| 50 2| 110 5| 81 20| 246 4 | 0 0| 1 1| 3 3| 5 20| 9 4 | 255 4
GRADE 7
| 8 4| 84 3| 62 3| 35 9| 189 3 | 0 0| 6 5| 3 3| 1 4| 10 4 | 199 3
GRADE 8
| 42 24| 268 9| 197 9| 43 10| 550 10 | 4 36| 15 13| 7 8| 1 4| 27 11 | 577 10
GRADE 9
| 44 25| 461 16| 249 12| 36 9| 790 14 | 3 27| 16 13| 6 7| 0 0| 25 10 | 815 14
GRADE 10
| 38 21| 592 20| 304 15| 36 9| 970 17 | 2 18| 19 16| 12 14| 3 12| 36 15 | 1006 17
GRADE 11
| 30 17| 552 19| 238 11| 29 7| 849 15 | 1 9| 18 15| 5 6| 2 8| 26 11 | 875 15
GRADE 12
| 8 4| 722 24| 660 32| 102 25| 1492 26 | 1 9| 26 22| 29 34| 9 36| 65 27 | 1557 26
MORE THAN GRADE 12 | 3 2| 239 8| 265 13| 48 12| 555 10 | 0 0| 18 15| 21 24| 4 16| 43 18 | 598 10
------------------------------------------------------------------------------------------------------------------------------------
Total reported
| 178 100| 2968 100| 2085 100| 410 100| 5641 100 | 11 100| 119 100| 86 100| 25 100| 241 100 | 5882 100
|
|
|
|
|
|
|
|
|
|
|
Percent reported |
97.3|
98.6|
98.4|
98.1|
98.5 | 100.0|
98.3| 100.0|
96.2|
98.8 |
98.5
|
|
|
|
|
|
|
|
|
|
|
|
|
|
|
|
|
|
|
|
|
|
NOT REPORTED
| 5 | 42 | 33 | 8 | 88
|0|2|0|1|3
| 91
------------------------------------------------------------------------------------------------------------------------------------
Total
| 183 | 3010 | 2118 | 418 | 5729
| 11 | 121 | 86 | 26 | 244
| 5973
|
|
|
|
|
|
|
|
|
|
|
|
|
|
|
|
|
|
|
|
|
|
|
|
|
|
|
|
|
|
|
|
|
|
|
|
|
|
|
|
|
|
|
|
|
|
|
|
|
|
|
|
|
|
|
AVG EDUCATION LEVEL | 9.44 | 10.97 | 11.22 | 9.79 | 10.93 | 9.27 | 11.55 | 11.83 | 11.12 | 11.50 | 10.95
* NOTE: THE FIELD LABLED "LESS THAN GRADE 7" WAS CORRECTED IN MARCH 1989: MISSING DATA FOR INMATES STILL IN DIAGNOSTICS NOW HAS BEEN REMOVED FROM THIS FIELD AND IDENTIFIED AS "NOT REPORTED" INFORMATION.
Page 7 Run 02/27/01
Georgia Department of Corrections Office of Planning and Analysis
Inmate statistical profile
Sample: ACTIVE PRISONERS SERVING LIFE EXCLUDING JAIL
Requestor: Statistics
Active inmates 02/27/2001
Functional Reading Level (WRAT Scores) by current age & sex
|
MEN
|
WOMEN
|
| Age | Age | Age | Age | Men
| Age | Age | Age | Age |Women
|Grand
WRAT Reading Score |00-21 %|22-39 %|40-54 %|55-99 %|Total % |00-21 %|22-39 %|40-54 %|55-99 %|Total % |Total %
------------------------------------------------------------------------------------------------------------------------------------
LESS THAN GRADE 6 | 71 41| 1116 39| 856 46| 172 49| 2215 42 | 3 30| 45 38| 22 27| 10 42| 80 34 | 2295 42
6TH THRU 8TH GRADE | 34 20| 680 24| 413 22| 63 18| 1190 23 | 2 20| 27 23| 20 25| 4 17| 53 23 | 1243 23
GRADE 9
| 11 6| 207 7| 116 6| 21 6| 355 7 | 1 10| 4 3| 7 9| 2 8| 14 6 | 369 7
GRADE 10
| 11 6| 134 5| 75 4| 14 4| 234 4 | 1 10| 2 2| 6 7| 2 8| 11 5 | 245 4
GRADE 11
| 6 3| 115 4| 84 4| 9 3| 214 4 | 0 0| 4 3| 5 6| 1 4| 10 4 | 224 4
GRADE 12
| 30 17| 524 18| 294 16| 66 19| 914 17 | 3 30| 7 6| 2 2| 1 4| 13 6 | 927 17
MORE THAN GRADE 12 | 11 6| 106 4| 31 2| 4 1| 152 3 | 0 0| 29 25| 19 23| 4 17| 52 22 | 204 4
------------------------------------------------------------------------------------------------------------------------------------
Total reported
| 174 100| 2882 100| 1869 100| 349 100| 5274 100 | 10 100| 118 100| 81 100| 24 100| 233 100 | 5507 100
|
|
|
|
|
|
|
|
|
|
|
Percent reported |
95.1|
95.7|
88.2|
83.5|
92.1 |
90.9|
97.5|
94.2|
92.3|
95.5 |
92.2
|
|
|
|
|
|
|
|
|
|
|
|
|
|
|
|
|
|
|
|
|
|
NOT REPORTED
| 9 | 128 | 249 | 69 | 455
| 1 | 3 | 5 | 2 | 11
| 466
------------------------------------------------------------------------------------------------------------------------------------
Total
| 183 | 3010 | 2118 | 418 | 5729
| 11 | 121 | 86 | 26 | 244
| 5973
|
|
|
|
|
|
|
|
|
|
|
|
|
|
|
|
|
|
|
|
|
|
|
|
|
|
|
|
|
|
|
|
|
|
|
|
|
|
|
|
|
|
|
|
|
|
|
|
|
|
|
|
|
|
|
AVG READING SCORE | 7.76 | 7.69 | 7.03 | 6.85 | 7.40 | 8.47 | 8.00 | 8.35 | 7.48 | 8.09 | 7.43
Page 8 Run 02/27/01
Georgia Department of Corrections Office of Planning and Analysis
Inmate statistical profile
Sample: ACTIVE PRISONERS SERVING LIFE EXCLUDING JAIL
Requestor: Statistics
Active inmates 02/27/2001
Functional Math Level (WRAT Scores) by current age & sex
|
MEN
|
WOMEN
|
| Age | Age | Age | Age | Men
| Age | Age | Age | Age |Women
|Grand
WRAT Math Score
|00-21 %|22-39 %|40-54 %|55-99 %|Total % |00-21 %|22-39 %|40-54 %|55-99 %|Total % |Total %
------------------------------------------------------------------------------------------------------------------------------------
LESS THAN GRADE 6 | 64 37| 855 30| 817 44| 174 50| 1910 36 | 2 20| 43 36| 30 37| 11 46| 86 37 | 1996 36
6TH THRU 8TH GRADE | 78 45| 1464 51| 689 37| 100 29| 2331 44 | 7 70| 50 42| 33 40| 8 33| 98 42 | 2429 44
GRADE 9
| 7 4| 225 8| 129 7| 24 7| 385 7 | 1 10| 12 10| 5 6| 2 8| 20 9 | 405 7
GRADE 10
| 16 9| 132 5| 101 5| 16 5| 265 5 | 0 0| 7 6| 3 4| 1 4| 11 5 | 276 5
GRADE 11
| 5 3| 92 3| 53 3| 14 4| 164 3 | 0 0| 0 0| 3 4| 2 8| 5 2 | 169 3
GRADE 12
| 2 1| 100 3| 81 4| 19 5| 202 4 | 0 0| 2 2| 3 4| 0 0| 5 2 | 207 4
MORE THAN GRADE 12 | 2 1| 18 1| 4 0| 2 1| 26 0 | 0 0| 4 3| 5 6| 0 0| 9 4 | 35 1
------------------------------------------------------------------------------------------------------------------------------------
Total reported
| 174 100| 2886 100| 1874 100| 349 100| 5283 100 | 10 100| 118 100| 82 100| 24 100| 234 100 | 5517 100
|
|
|
|
|
|
|
|
|
|
|
Percent reported |
95.1|
95.9|
88.5|
83.5|
92.2 |
90.9|
97.5|
95.3|
92.3|
95.9 |
92.4
|
|
|
|
|
|
|
|
|
|
|
|
|
|
|
|
|
|
|
|
|
|
NOT REPORTED
| 9 | 124 | 244 | 69 | 446
| 1 | 3 | 4 | 2 | 10
| 456
------------------------------------------------------------------------------------------------------------------------------------
Total
| 183 | 3010 | 2118 | 418 | 5729
| 11 | 121 | 86 | 26 | 244
| 5973
|
|
|
|
|
|
|
|
|
|
|
|
|
|
|
|
|
|
|
|
|
|
|
|
|
|
|
|
|
|
|
|
|
|
|
|
|
|
|
|
|
|
|
|
|
|
|
|
|
|
|
|
|
|
|
AVG MATH SCORE
| 6.82 | 7.12 | 6.59 | 6.37 | 6.87 | 6.87 | 7.07 | 7.21 | 6.16 | 7.02 | 6.88
Page 9 Run 02/27/01
Georgia Department of Corrections Office of Planning and Analysis
Inmate statistical profile
Sample: ACTIVE PRISONERS SERVING LIFE EXCLUDING JAIL
Requestor: Statistics
Active inmates 02/27/2001
Functional Spelling Level (WRAT Scores) by current age & sex
|
MEN
|
WOMEN
|
| Age | Age | Age | Age | Men
| Age | Age | Age | Age |Women
|Grand
WRAT Spelling Score |00-21 %|22-39 %|40-54 %|55-99 %|Total % |00-21 %|22-39 %|40-54 %|55-99 %|Total % |Total %
------------------------------------------------------------------------------------------------------------------------------------
LESS THAN GRADE 6 | 69 40| 1290 45| 1069 57| 210 60| 2638 50 | 2 20| 42 36| 27 33| 12 50| 83 35 | 2721 49
6TH THRU 8TH GRADE | 54 31| 787 27| 380 20| 67 19| 1288 24 | 5 50| 29 25| 20 24| 3 13| 57 24 | 1345 24
GRADE 9
| 10 6| 171 6| 111 6| 13 4| 305 6 | 1 10| 8 7| 3 4| 3 13| 15 6 | 320 6
GRADE 10
| 19 11| 174 6| 72 4| 13 4| 278 5 | 1 10| 9 8| 7 9| 0 0| 17 7 | 295 5
GRADE 11
| 5 3| 134 5| 49 3| 5 1| 193 4 | 1 10| 4 3| 5 6| 2 8| 12 5 | 205 4
GRADE 12
| 11 6| 286 10| 174 9| 39 11| 510 10 | 0 0| 8 7| 5 6| 0 0| 13 6 | 523 9
MORE THAN GRADE 12 | 6 3| 41 1| 15 1| 2 1| 64 1 | 0 0| 18 15| 15 18| 4 17| 37 16 | 101 2
------------------------------------------------------------------------------------------------------------------------------------
Total reported
| 174 100| 2883 100| 1870 100| 349 100| 5276 100 | 10 100| 118 100| 82 100| 24 100| 234 100 | 5510 100
|
|
|
|
|
|
|
|
|
|
|
Percent reported |
95.1|
95.8|
88.3|
83.5|
92.1 |
90.9|
97.5|
95.3|
92.3|
95.9 |
92.2
|
|
|
|
|
|
|
|
|
|
|
|
|
|
|
|
|
|
|
|
|
|
NOT REPORTED
| 9 | 127 | 248 | 69 | 453
| 1 | 3 | 4 | 2 | 10
| 463
------------------------------------------------------------------------------------------------------------------------------------
Total
| 183 | 3010 | 2118 | 418 | 5729
| 11 | 121 | 86 | 26 | 244
| 5973
|
|
|
|
|
|
|
|
|
|
|
|
|
|
|
|
|
|
|
|
|
|
|
|
|
|
|
|
|
|
|
|
|
|
|
|
|
|
|
|
|
|
|
|
|
|
|
|
|
|
|
|
|
|
|
AVG SPELLING SCORE | 7.14 | 6.91 | 6.07 | 5.81 | 6.55 | 7.89 | 7.91 | 8.12 | 6.82 | 7.87 | 6.60
Page 10 Run 02/27/01
Georgia Department of Corrections Office of Planning and Analysis
Inmate statistical profile
Sample: ACTIVE PRISONERS SERVING LIFE EXCLUDING JAIL
Requestor: Statistics
Active inmates 02/27/2001
Self-Rpt Guardian Status To Age 16 by current age & sex
|
MEN
|
WOMEN
|
| Age | Age | Age | Age | Men
| Age | Age | Age | Age |Women
|Grand
Guardian Status
|00-21 %|22-39 %|40-54 %|55-99 %|Total % |00-21 %|22-39 %|40-54 %|55-99 %|Total % |Total %
------------------------------------------------------------------------------------------------------------------------------------
ORPHANAGE
| 0 0| 4 0| 4 0| 3 1| 11 0 | 0 0| 0 0| 0 0| 0 0| 0 0 | 11 0
FATHER ONLY
| 9 5| 81 3| 58 3| 7 2| 155 3 | 0 0| 2 2| 2 2| 1 4| 5 2 | 160 3
FTR MTR HD
| 13 7| 121 4| 67 3| 7 2| 208 4 | 0 0| 2 2| 4 5| 0 0| 6 3 | 214 4
MOTHER ONLY
| 89 50| 1396 47| 672 32| 104 26| 2261 40 | 7 64| 44 37| 26 31| 9 38| 86 36 | 2347 40
MTR FTR HD
| 36 20| 926 31| 985 48| 227 56| 2174 39 | 4 36| 45 38| 45 54| 13 54| 107 45 | 2281 39
OTH FEMALE
| 2 1| 56 2| 48 2| 16 4| 122 2 | 0 0| 4 3| 2 2| 0 0| 6 3 | 128 2
OTH MALE
| 2 1| 5 0| 12 1| 1 0| 20 0 | 0 0| 2 2| 1 1| 0 0| 3 1 | 23 0
STEP-PARNTS
| 3 2| 52 2| 27 1| 6 1| 88 2 | 0 0| 0 0| 0 0| 0 0| 0 0 | 88 2
FOSTER HOME
| 4 2| 26 1| 31 1| 7 2| 68 1 | 0 0| 2 2| 0 0| 0 0| 2 1 | 70 1
GRAND PRNTS
| 16 9| 233 8| 137 7| 24 6| 410 7 | 0 0| 14 12| 4 5| 1 4| 19 8 | 429 7
OTHER
| 4 2| 62 2| 28 1| 4 1| 98 2 | 0 0| 4 3| 0 0| 0 0| 4 2 | 102 2
------------------------------------------------------------------------------------------------------------------------------------
Total reported
| 178 100| 2962 100| 2069 100| 406 100| 5615 100 | 11 100| 119 100| 84 100| 24 100| 238 100 | 5853 100
|
|
|
|
|
|
|
|
|
|
|
Percent reported |
97.3|
98.4|
97.7|
97.1|
98.0 | 100.0|
98.3|
97.7|
92.3|
97.5 |
98.0
|
|
|
|
|
|
|
|
|
|
|
|
|
|
|
|
|
|
|
|
|
|
NOT RPTD
| 5 | 48 | 49 | 12 | 114
|0|2|2|2|6
| 120
------------------------------------------------------------------------------------------------------------------------------------
Total
| 183 | 3010 | 2118 | 418 | 5729
| 11 | 121 | 86 | 26 | 244
| 5973
Page 11 Run 02/27/01
Georgia Department of Corrections Office of Planning and Analysis
Inmate statistical profile
Sample: ACTIVE PRISONERS SERVING LIFE EXCLUDING JAIL
Requestor: Statistics
Active inmates 02/27/2001
Self-Rpt Employment Status Before Prison by current age & sex
|
MEN
|
WOMEN
|
| Age | Age | Age | Age | Men
| Age | Age | Age | Age |Women
|Grand
Employment
|00-21 %|22-39 %|40-54 %|55-99 %|Total % |00-21 %|22-39 %|40-54 %|55-99 %|Total % |Total %
------------------------------------------------------------------------------------------------------------------------------------
FULL TIME
| 35 21| 965 34| 769 38| 159 41| 1928 36 | 1 10| 28 24| 14 17| 5 22| 48 21 | 1976 35
PART TIME
| 7 4| 232 8| 111 6| 20 5| 370 7 | 0 0| 6 5| 3 4| 0 0| 9 4 | 379 7
UNEMPL < 6M
| 12 7| 465 16| 337 17| 59 15| 873 16 | 0 0| 23 20| 21 25| 4 17| 48 21 | 921 16
UNEMPL > 6M
| 22 13| 884 31| 714 36| 113 29| 1733 32 | 2 20| 36 31| 36 43| 12 52| 86 37 | 1819 32
NEVER WORKD
| 72 43| 254 9| 22 1| 3 1| 351 6 | 4 40| 21 18| 4 5| 0 0| 29 13 | 380 7
STUDENT
| 19 11| 32 1| 6 0| 1 0| 58 1 | 3 30| 1 1| 2 2| 0 0| 6 3 | 64 1
INCAPABLE
| 1 1| 32 1| 51 3| 32 8| 116 2 | 0 0| 0 0| 3 4| 2 9| 5 2 | 121 2
OTHER
| 0 0| 0 0| 0 0| 0 0| 0 0 | 0 0| 0 0| 0 0| 0 0| 0 0 | 0 0
------------------------------------------------------------------------------------------------------------------------------------
Total reported
| 168 100| 2864 100| 2010 100| 387 100| 5429 100 | 10 100| 115 100| 83 100| 23 100| 231 100 | 5660 100
|
|
|
|
|
|
|
|
|
|
|
Percent reported |
91.8|
95.1|
94.9|
92.6|
94.8 |
90.9|
95.0|
96.5|
88.5|
94.7 |
94.8
|
|
|
|
|
|
|
|
|
|
|
|
|
|
|
|
|
|
|
|
|
|
NOT RPTD
| 15 | 146 | 108 | 31 | 300
| 1 | 6 | 3 | 3 | 13
| 313
------------------------------------------------------------------------------------------------------------------------------------
Total
| 183 | 3010 | 2118 | 418 | 5729
| 11 | 121 | 86 | 26 | 244
| 5973
* NOTE: THE FIELD LABELD "OTHER" WAS CORRECTED IN APRIL 1989; INMATES CODED "PRE-OTIS NOT REPORTED" NOW HAVE BEEN REMOVED FROM THIS FIELD AND IDENTIFIED AS "NOT REPORTED".
Page 12 Run 02/27/01
Georgia Department of Corrections Office of Planning and Analysis
Inmate statistical profile
Sample: ACTIVE PRISONERS SERVING LIFE EXCLUDING JAIL
Requestor: Statistics
Active inmates 02/27/2001
Self-Rpt Marital Status At Admission by current age & sex
|
MEN
|
WOMEN
|
| Age | Age | Age | Age | Men
| Age | Age | Age | Age |Women
|Grand
Marital Status
|00-21 %|22-39 %|40-54 %|55-99 %|Total % |00-21 %|22-39 %|40-54 %|55-99 %|Total % |Total %
------------------------------------------------------------------------------------------------------------------------------------
SINGLE
| 168 94| 2032 69| 725 35| 54 13| 2979 53 | 11 100| 69 58| 15 18| 3 13| 98 41 | 3077 52
MARRIED
| 1 1| 239 8| 388 19| 114 28| 742 13 | 0 0| 12 10| 17 20| 3 13| 32 13 | 774 13
SEPARATED
| 0 0| 101 3| 168 8| 42 10| 311 6 | 0 0| 12 10| 8 9| 2 8| 22 9 | 333 6
DIVORCED
| 0 0| 140 5| 356 17| 95 23| 591 11 | 0 0| 9 8| 15 18| 6 25| 30 13 | 621 11
WIDOWED
| 2 1| 41 1| 93 4| 54 13| 190 3 | 0 0| 5 4| 20 24| 9 38| 34 14 | 224 4
COMMON LAW
| 8 4| 406 14| 346 17| 48 12| 808 14 | 0 0| 13 11| 10 12| 1 4| 24 10 | 832 14
OTHER
| 0 0| 2 0| 1 0| 0 0| 3 0 | 0 0| 0 0| 0 0| 0 0| 0 0 | 3 0
------------------------------------------------------------------------------------------------------------------------------------
Total reported
| 179 100| 2961 100| 2077 100| 407 100| 5624 100 | 11 100| 120 100| 85 100| 24 100| 240 100 | 5864 100
|
|
|
|
|
|
|
|
|
|
|
Percent reported |
97.8|
98.4|
98.1|
97.4|
98.2 | 100.0|
99.2|
98.8|
92.3|
98.4 |
98.2
|
|
|
|
|
|
|
|
|
|
|
|
|
|
|
|
|
|
|
|
|
|
NOT RPTD
| 4 | 49 | 41 | 11 | 105
|0|1|1|2|4
| 109
------------------------------------------------------------------------------------------------------------------------------------
Total
| 183 | 3010 | 2118 | 418 | 5729
| 11 | 121 | 86 | 26 | 244
| 5973
Page 13 Run 02/27/01
Georgia Department of Corrections Office of Planning and Analysis
Inmate statistical profile
Sample: ACTIVE PRISONERS SERVING LIFE EXCLUDING JAIL
Requestor: Statistics
Active inmates 02/27/2001
Self-Rpt Number Of Children At Admission by current age & sex
|
MEN
|
WOMEN
|
| Age | Age | Age | Age | Men
| Age | Age | Age | Age |Women
|Grand
Number Of Children |00-21 %|22-39 %|40-54 %|55-99 %|Total % |00-21 %|22-39 %|40-54 %|55-99 %|Total % |Total %
------------------------------------------------------------------------------------------------------------------------------------
NO CHILDREN
| 0 0| 432 22| 275 17| 37 10| 744 19 | 0 0| 3 3| 3 4| 1 4| 7 4 | 751 18
ONE CHILD
| 35 76| 747 38| 482 30| 62 17| 1326 33 | 1 100| 30 32| 16 21| 1 4| 48 25 | 1374 33
TWO CHILDREN
| 5 11| 423 21| 379 23| 79 22| 886 22 | 0 0| 32 34| 23 30| 9 38| 64 33 | 950 23
THREE CHILDREN
| 5 11| 234 12| 240 15| 72 20| 551 14 | 0 0| 17 18| 14 18| 7 29| 38 19 | 589 14
FOUR CHILDREN
| 0 0| 83 4| 119 7| 42 12| 244 6 | 0 0| 7 7| 11 14| 4 17| 22 11 | 266 6
FIVE CHILDREN
| 1 2| 32 2| 66 4| 24 7| 123 3 | 0 0| 4 4| 3 4| 1 4| 8 4 | 131 3
MORE THAN 5 CHILDREN| 0 0| 34 2| 59 4| 41 11| 134 3 | 0 0| 1 1| 6 8| 1 4| 8 4 | 142 3
------------------------------------------------------------------------------------------------------------------------------------
Total reported
| 46 100| 1985 100| 1620 100| 357 100| 4008 100 | 1 100| 94 100| 76 100| 24 100| 195 100 | 4203 100
|
|
|
|
|
|
|
|
|
|
|
Percent reported |
25.1|
65.9|
76.5|
85.4|
70.0 |
9.1|
77.7|
88.4|
92.3|
79.9 |
70.4
|
|
|
|
|
|
|
|
|
|
|
|
|
|
|
|
|
|
|
|
|
|
NOT REPORTED
| 137 | 1025 | 498 | 61 | 1721
| 10 | 27 | 10 | 2 | 49
| 1770
------------------------------------------------------------------------------------------------------------------------------------
Total
| 183 | 3010 | 2118 | 418 | 5729
| 11 | 121 | 86 | 26 | 244
| 5973
|
|
|
|
|
|
|
|
|
|
|
|
|
|
|
|
|
|
|
|
|
|
|
|
|
|
|
|
|
|
|
|
|
|
|
|
|
|
|
|
|
|
|
|
|
|
|
|
|
|
|
|
|
|
|
AVG NUM CHILDREN | 1.41 | 1.62 | 2.04 | 2.86 | 1.90 | 1.00 | 2.12 | 2.66 | 2.83 | 2.41 | 1.92
* NOTE: THE FIELD LABLED "NO CHILDREN" WAS CORRECTED IN MARCH 1989: MISSING DATA FOR INMATES STILL IN DIAGNOSTICS NOW HAS BEEN REMOVED FROM THIS FIELD AND IDENTIFIED AS "NOT REPORTED" INFORMATION.
Page 14 Run 02/27/01
Georgia Department of Corrections Office of Planning and Analysis
Inmate statistical profile
Sample: ACTIVE PRISONERS SERVING LIFE EXCLUDING JAIL
Requestor: Statistics
Active inmates 02/27/2001
Self-Rpt Religious Affiliation by current age & sex
|
MEN
|
WOMEN
|
| Age | Age | Age | Age | Men
| Age | Age | Age | Age |Women
|Grand
Religion
|00-21 %|22-39 %|40-54 %|55-99 %|Total % |00-21 %|22-39 %|40-54 %|55-99 %|Total % |Total %
------------------------------------------------------------------------------------------------------------------------------------
ISLAM
| 4 2| 150 5| 74 4| 10 3| 238 4 | 0 0| 1 1| 0 0| 0 0| 1 0 | 239 4
CATHOLIC
| 4 2| 87 3| 66 3| 19 5| 176 3 | 0 0| 7 6| 3 4| 1 4| 11 5 | 187 3
BAPTIST
| 77 44| 1470 52| 1205 62| 229 59| 2981 56 | 5 45| 64 55| 45 55| 15 65| 129 56 | 3110 56
METHODIST
| 3 2| 68 2| 88 5| 26 7| 185 3 | 0 0| 5 4| 7 9| 2 9| 14 6 | 199 4
EPISCOPLN
| 1 1| 4 0| 4 0| 2 1| 11 0 | 0 0| 1 1| 2 2| 0 0| 3 1 | 14 0
PRESBYTRN
| 0 0| 7 0| 8 0| 3 1| 18 0 | 0 0| 0 0| 0 0| 2 9| 2 1 | 20 0
CHC OF GOD
| 0 0| 33 1| 24 1| 9 2| 66 1 | 0 0| 4 3| 1 1| 0 0| 5 2 | 71 1
HOLINESS
| 6 3| 126 4| 93 5| 25 6| 250 5 | 2 18| 14 12| 12 15| 0 0| 28 12 | 278 5
JEWISH
| 0 0| 1 0| 3 0| 1 0| 5 0 | 0 0| 0 0| 0 0| 0 0| 0 0 | 5 0
ANGLICAN
| 0 0| 0 0| 0 0| 0 0| 0 0 | 0 0| 1 1| 0 0| 0 0| 1 0 | 1 0
GRK ORTHDX
| 0 0| 0 0| 0 0| 0 0| 0 0 | 0 0| 0 0| 0 0| 0 0| 0 0 | 0 0
HINDU
| 0 0| 0 0| 0 0| 0 0| 0 0 | 0 0| 0 0| 0 0| 0 0| 0 0 | 0 0
BUDDHIST
| 2 1| 2 0| 1 0| 0 0| 5 0 | 0 0| 0 0| 0 0| 0 0| 0 0 | 5 0
TAOIST
| 0 0| 0 0| 0 0| 0 0| 0 0 | 0 0| 0 0| 0 0| 0 0| 0 0 | 0 0
SHINTOIST
| 0 0| 0 0| 0 0| 0 0| 0 0 | 0 0| 0 0| 0 0| 0 0| 0 0 | 0 0
SEVEN D AD
| 0 0| 5 0| 4 0| 1 0| 10 0 | 0 0| 0 0| 0 0| 0 0| 0 0 | 10 0
JEHOVAH WT
| 1 1| 24 1| 12 1| 0 0| 37 1 | 0 0| 0 0| 0 0| 0 0| 0 0 | 37 1
LATR DAY S
| 0 0| 2 0| 1 0| 0 0| 3 0 | 0 0| 0 0| 0 0| 0 0| 0 0 | 3 0
QUAKER
| 0 0| 0 0| 0 0| 0 0| 0 0 | 0 0| 0 0| 0 0| 0 0| 0 0 | 0 0
OTHER PROD
| 18 10| 216 8| 66 3| 16 4| 316 6 | 0 0| 7 6| 6 7| 1 4| 14 6 | 330 6
NONE
| 44 25| 433 15| 141 7| 15 4| 633 12 | 2 18| 5 4| 1 1| 0 0| 8 3 | 641 12
OTHER
| 17 10| 209 7| 144 7| 34 9| 404 8 | 2 18| 7 6| 5 6| 2 9| 16 7 | 420 8
------------------------------------------------------------------------------------------------------------------------------------
Total reported
| 177 100| 2837 100| 1934 100| 390 100| 5338 100 | 11 100| 116 100| 82 100| 23 100| 232 100 | 5570 100
|
|
|
|
|
|
|
|
|
|
|
Percent reported |
96.7|
94.3|
91.3|
93.3|
93.2 | 100.0|
95.9|
95.3|
88.5|
95.1 |
93.3
|
|
|
|
|
|
|
|
|
|
|
|
|
|
|
|
|
|
|
|
|
|
NOT RPTD
| 6 | 173 | 184 | 28 | 391
| 0 | 5 | 4 | 3 | 12
| 403
------------------------------------------------------------------------------------------------------------------------------------
Total
| 183 | 3010 | 2118 | 418 | 5729
| 11 | 121 | 86 | 26 | 244
| 5973
Page 15 Run 02/27/01
Georgia Department of Corrections Office of Planning and Analysis
Inmate statistical profile
Sample: ACTIVE PRISONERS SERVING LIFE EXCLUDING JAIL
Requestor: Statistics
Active inmates 02/27/2001
Self-Rpt Family Behavior Patterns * by current age & sex
|
MEN
|
WOMEN
|
| Age | Age | Age | Age | Men
| Age | Age | Age | Age |Women
|Grand
Family Behavior
|00-21 %|22-39 %|40-54 %|55-99 %|Total % |00-21 %|22-39 %|40-54 %|55-99 %|Total % |Total %
------------------------------------------------------------------------------------------------------------------------------------
CRIMINLTY
| 55 21| 797 24| 524 29| 76 26| 1452 26 | 6 18| 33 18| 18 23| 2 12| 59 19 | 1511 25
ALCOHOLISM
| 19 7| 323 10| 285 16| 47 16| 674 12 | 3 9| 26 14| 16 20| 2 12| 47 15 | 721 12
DRUG ABUSE
| 23 9| 177 5| 70 4| 6 2| 276 5 | 4 12| 17 9| 6 8| 0 0| 27 9 | 303 5
DOMINERING
| 2 1| 13 0| 13 1| 0 0| 28 0 | 6 18| 12 6| 5 6| 2 12| 25 8 | 53 1
MIGRANT
| 1 0| 46 1| 41 2| 1 0| 89 2 | 1 3| 2 1| 2 3| 0 0| 5 2 | 94 2
INFL BTGS
| 7 3| 139 4| 67 4| 16 5| 229 4 | 3 9| 21 11| 5 6| 2 12| 31 10 | 260 4
PERMISSIVE
| 1 0| 7 0| 16 1| 2 1| 26 0 | 1 3| 4 2| 2 3| 0 0| 7 2 | 33 1
FATH ABSNT
| 111 43| 1471 45| 657 36| 115 39| 2354 41 | 7 21| 48 26| 16 20| 7 41| 78 25 | 2432 40
MOTH ABSNT
| 34 13| 296 9| 146 8| 30 10| 506 9 | 1 3| 15 8| 2 3| 1 6| 19 6 | 525 9
NONE
| 5 2| 36 1| 17 1| 0 0| 58 1 | 2 6| 8 4| 7 9| 1 6| 18 6 | 76 1
------------------------------------------------------------------------------------------------------------------------------------
Total reported
| 258 100| 3305 100| 1836 100| 293 100| 5692 100 | 34 100| 186 100| 79 100| 17 100| 316 100 | 6008 100
|
|
|
|
|
|
|
|
|
|
|
Percent reported |
78.1|
69.9|
60.2|
49.3|
65.1 | 100.0|
69.4|
58.1|
46.2|
64.3 |
65.0
|
|
|
|
|
|
|
|
|
|
|
|
|
|
|
|
|
|
|
|
|
|
OTHER
| 40 | 906 | 844 | 212 | 2002
| 0 | 37 | 36 | 14 | 87
| 2089
------------------------------------------------------------------------------------------------------------------------------------
Total
| 183 | 3010 | 2118 | 418 | 5729
| 11 | 121 | 86 | 26 | 244
| 5973
* NOTE: SINCE THERE CAN BE UP TO FIVE BEHAVIOR CODES PER INMATE, THE NUMBER OF CASES REPORTED IN THE DETAIL LINES AND THE TOTAL REPORTED LINE MAY EXCEED THE TOTAL NUMBER OF CASES. IN SHORT, THIS TABLE COUNTS THE NUMBER OF BEHAVIOR PROBLEMS, NOT INMATES.
Page 16 Run 02/27/01
Georgia Department of Corrections Office of Planning and Analysis
Inmate statistical profile
Sample: ACTIVE PRISONERS SERVING LIFE EXCLUDING JAIL
Requestor: Statistics
Active inmates 02/27/2001
Inmate Diagnostic Behavior Problem * by current age & sex
|
MEN
|
WOMEN
|
| Age | Age | Age | Age | Men
| Age | Age | Age | Age |Women
|Grand
Diagnostic Problem |00-21 %|22-39 %|40-54 %|55-99 %|Total % |00-21 %|22-39 %|40-54 %|55-99 %|Total % |Total %
------------------------------------------------------------------------------------------------------------------------------------
ALCOHOLIC
| 1 0| 133 2| 141 4| 40 6| 315 3 | 1 3| 3 1| 13 9| 2 6| 19 5 | 334 3
ALCOH ABSE
| 42 12| 874 16| 645 17| 114 18| 1675 17 | 1 3| 28 14| 17 12| 6 18| 52 13 | 1727 16
DRUG EXP
| 63 17| 769 14| 370 10| 38 6| 1240 12 | 3 10| 20 10| 16 11| 0 0| 39 9 | 1279 12
DRUG ABSE
| 72 20| 966 18| 657 17| 43 7| 1738 17 | 4 14| 40 20| 26 18| 1 3| 71 17 | 1809 17
NARC ADDCT
| 1 0| 96 2| 93 2| 7 1| 197 2 | 0 0| 4 2| 2 1| 1 3| 7 2 | 204 2
EPILEPTIC
| 0 0| 27 1| 25 1| 4 1| 56 1 | 0 0| 0 0| 2 1| 0 0| 2 0 | 58 1
MANIPULTVE
| 29 8| 246 5| 113 3| 20 3| 408 4 | 1 3| 2 1| 0 0| 1 3| 4 1 | 412 4
ASSAULTIVE
| 116 32| 1338 25| 949 25| 172 27| 2575 25 | 9 31| 52 26| 29 20| 6 18| 96 23 | 2671 25
ESCPE TEND
| 5 1| 112 2| 213 6| 41 6| 371 4 | 0 0| 2 1| 4 3| 0 0| 6 1 | 377 4
SUICIDAL
| 10 3| 141 3| 109 3| 15 2| 275 3 | 5 17| 15 7| 8 5| 2 6| 30 7 | 305 3
WITHDRAWN
| 0 0| 34 1| 21 1| 7 1| 62 1 | 2 7| 2 1| 3 2| 0 0| 7 2 | 69 1
PR RLTY CT
| 1 0| 33 1| 50 1| 13 2| 97 1 | 1 3| 1 0| 3 2| 1 3| 6 1 | 103 1
HOMOSEXUAL
| 2 1| 11 0| 9 0| 5 1| 27 0 | 2 7| 4 2| 3 2| 0 0| 9 2 | 36 0
NONE
| 1 0| 283 5| 246 7| 72 11| 602 6 | 0 0| 11 5| 13 9| 9 26| 33 8 | 635 6
OTHER
| 4 1| 72 1| 60 2| 22 3| 158 2 | 0 0| 0 0| 0 0| 3 9| 3 1 | 161 2
NOT RPTD
| 17 5| 190 4| 68 2| 25 4| 300 3 | 0 0| 17 8| 7 5| 2 6| 26 6 | 326 3
------------------------------------------------------------------------------------------------------------------------------------
Total reported
| 364 100| 5334 100| 3770 100| 639 100|10107 100 | 29 100| 201 100| 147 100| 34 100| 411 100 |10518 100
|
|
|
|
|
|
|
|
|
|
|
Percent reported | 100.0|
99.7| 100.0|
99.8|
99.8 | 100.0| 100.0|
98.8| 100.0|
99.6 |
99.8
|
|
|
|
|
|
|
|
|
|
|
|
|
|
|
|
|
|
|
|
|
|
UNKNOWN
| 0 | 9 | 1 | 1 | 11
|0|0|1|0|1
| 12
------------------------------------------------------------------------------------------------------------------------------------
Total
| 183 | 3010 | 2118 | 418 | 5729
| 11 | 121 | 86 | 26 | 244
| 5973
* NOTE: SINCE THERE CAN BE UP TO FIVE BEHAVIOR CODES PER INMATE, THE NUMBER OF CASES REPORTED IN THE DETAIL LINES AND THE TOTAL REPORTED LINE MAY EXCEED THE TOTAL NUMBER OF CASES. IN SHORT, THIS TABLE COUNTS THE NUMBER OF BEHAVIOR PROBLEMS, NOT INMATES.
Page 17 Run 02/27/01
Georgia Department of Corrections Office of Planning and Analysis
Inmate statistical profile
Sample: ACTIVE PRISONERS SERVING LIFE EXCLUDING JAIL
Requestor: Statistics
Active inmates 02/27/2001
Physical Profile (General Condition) by current age & sex
|
MEN
|
WOMEN
|
| Age | Age | Age | Age | Men
| Age | Age | Age | Age |Women
|Grand
Physical Profile |00-21 %|22-39 %|40-54 %|55-99 %|Total % |00-21 %|22-39 %|40-54 %|55-99 %|Total % |Total %
------------------------------------------------------------------------------------------------------------------------------------
NO LIMITATION
| 161 90| 2209 74| 1044 50| 75 18| 3489 62 | 10 91| 86 73| 42 49| 1 4| 139 59 | 3628 61
DEFECT NO MAJOR LIMT| 13 7| 396 13| 459 22| 95 23| 963 17 | 0 0| 4 3| 11 13| 5 22| 20 8 | 983 17
DEFECT MAJOR LIMIT | 4 2| 367 12| 591 28| 213 52| 1175 21 | 1 9| 28 24| 31 36| 15 65| 75 32 | 1250 21
VERY MAJOR DEFECT | 0 0| 3 0| 13 1| 30 7| 46 1 | 0 0| 0 0| 1 1| 2 9| 3 1 | 49 1
------------------------------------------------------------------------------------------------------------------------------------
Total reported
| 178 100| 2975 100| 2107 100| 413 100| 5673 100 | 11 100| 118 100| 85 100| 23 100| 237 100 | 5910 100
|
|
|
|
|
|
|
|
|
|
|
Percent reported |
97.3|
98.8|
99.5|
98.8|
99.0 | 100.0|
97.5|
98.8|
88.5|
97.1 |
98.9
|
|
|
|
|
|
|
|
|
|
|
|
|
|
|
|
|
|
|
|
|
|
NOT REPORTED
| 5 | 35 | 11 | 5 | 56
|0|3|1|3|7
| 63
------------------------------------------------------------------------------------------------------------------------------------
Total
| 183 | 3010 | 2118 | 418 | 5729
| 11 | 121 | 86 | 26 | 244
| 5973
Page 18 Run 02/27/01
Georgia Department of Corrections Office of Planning and Analysis
Inmate statistical profile
Sample: ACTIVE PRISONERS SERVING LIFE EXCLUDING JAIL
Requestor: Statistics
Active inmates 02/27/2001
Security Status by current age & sex
|
MEN
|
WOMEN
|
| Age | Age | Age | Age | Men
| Age | Age | Age | Age |Women
|Grand
Security
|00-21 %|22-39 %|40-54 %|55-99 %|Total % |00-21 %|22-39 %|40-54 %|55-99 %|Total % |Total %
------------------------------------------------------------------------------------------------------------------------------------
DIAG INCOM
| 0 0| 2 0| 4 0| 0 0| 6 0 | 0 0| 0 0| 0 0| 0 0| 0 0 | 6 0
WRK RELEAS
| 0 0| 0 0| 0 0| 0 0| 0 0 | 0 0| 0 0| 0 0| 0 0| 0 0 | 0 0
TRUSTY
| 0 0| 60 2| 45 2| 4 1| 109 2 | 0 0| 1 1| 3 3| 1 4| 5 2 | 114 2
MINIMUM
| 2 1| 390 13| 466 22| 93 22| 951 17 | 0 0| 39 32| 30 35| 16 62| 85 35 | 1036 17
MEDIUM
| 20 11| 1261 42| 1109 52| 247 59| 2637 46 | 1 9| 54 45| 39 45| 9 35| 103 42 | 2740 46
CLOSE
| 150 82| 1127 37| 402 19| 66 16| 1745 30 | 10 91| 27 22| 12 14| 0 0| 49 20 | 1794 30
MAXIMUM
| 3 2| 151 5| 87 4| 6 1| 247 4 | 0 0| 0 0| 2 2| 0 0| 2 1 | 249 4
DIAGNOSTIC
| 8 4| 19 1| 5 0| 2 0| 34 1 | 0 0| 0 0| 0 0| 0 0| 0 0 | 34 1
------------------------------------------------------------------------------------------------------------------------------------
Total reported
| 183 100| 3010 100| 2118 100| 418 100| 5729 100 | 11 100| 121 100| 86 100| 26 100| 244 100 | 5973 100
|
|
|
|
|
|
|
|
|
|
|
Percent reported | 100.0| 100.0| 100.0| 100.0| 100.0 | 100.0| 100.0| 100.0| 100.0| 100.0 | 100.0
|
|
|
|
|
|
|
|
|
|
|
|
|
|
|
|
|
|
|
|
|
|
NOT RPTD
|0|0|0|0|0
|0|0|0|0|0
|0
------------------------------------------------------------------------------------------------------------------------------------
Total
| 183 | 3010 | 2118 | 418 | 5729
| 11 | 121 | 86 | 26 | 244
| 5973
* NOTE: BEGINNING IN JULY 1987, THE FACILITIES DIVISION NO LONGER CODED INMATES AS BEING WORK RELEASE
Page 19 Run 02/27/01
Georgia Department of Corrections Office of Planning and Analysis
Inmate statistical profile
Sample: ACTIVE PRISONERS SERVING LIFE EXCLUDING JAIL
Requestor: Statistics
Active inmates 02/27/2001
Number Of Sentences by current age & sex
|
MEN
|
WOMEN
|
| Age | Age | Age | Age | Men
| Age | Age | Age | Age |Women
|Grand
Number Of Sentences |00-21 %|22-39 %|40-54 %|55-99 %|Total % |00-21 %|22-39 %|40-54 %|55-99 %|Total % |Total %
------------------------------------------------------------------------------------------------------------------------------------
ONE
| 55 30| 736 24| 541 26| 144 34| 1476 26 | 5 45| 45 37| 38 44| 13 50| 101 41 | 1577 26
TWO
| 48 26| 703 23| 495 23| 105 25| 1351 24 | 2 18| 39 32| 23 27| 8 31| 72 30 | 1423 24
THREE
| 24 13| 516 17| 378 18| 60 14| 978 17 | 2 18| 19 16| 10 12| 5 19| 36 15 | 1014 17
FOUR
| 23 13| 343 11| 238 11| 37 9| 641 11 | 1 9| 9 7| 5 6| 0 0| 15 6 | 656 11
FIVE
| 9 5| 227 8| 154 7| 21 5| 411 7 | 1 9| 4 3| 4 5| 0 0| 9 4 | 420 7
MORE THAN FIVE
| 24 13| 485 16| 312 15| 51 12| 872 15 | 0 0| 5 4| 6 7| 0 0| 11 5 | 883 15
------------------------------------------------------------------------------------------------------------------------------------
Total reported
| 183 100| 3010 100| 2118 100| 418 100| 5729 100 | 11 100| 121 100| 86 100| 26 100| 244 100 | 5973 100
|
|
|
|
|
|
|
|
|
|
|
Percent reported | 100.0| 100.0| 100.0| 100.0| 100.0 | 100.0| 100.0| 100.0| 100.0| 100.0 | 100.0
|
|
|
|
|
|
|
|
|
|
|
|
|
|
|
|
|
|
|
|
|
|
NOT REPORTED
|0|0|0|0|0
|0|0|0|0|0
|0
------------------------------------------------------------------------------------------------------------------------------------
Total
| 183 | 3010 | 2118 | 418 | 5729
| 11 | 121 | 86 | 26 | 244
| 5973
|
|
|
|
|
|
|
|
|
|
|
|
|
|
|
|
|
|
|
|
|
|
|
|
|
|
|
|
|
|
|
|
|
|
|
|
|
|
|
|
|
|
|
|
|
|
|
|
|
|
|
|
|
|
|
AVG NUM SENTENCES | 2.92 | 3.42 | 3.32 | 2.90 | 3.33 | 2.18 | 2.32 | 2.31 | 1.69 | 2.25 | 3.28
Page 20 Run 02/27/01
Georgia Department of Corrections Office of Planning and Analysis
Inmate statistical profile
Sample: ACTIVE PRISONERS SERVING LIFE EXCLUDING JAIL
Requestor: Statistics
Active inmates 02/27/2001
Number Of Disciplinaries by current age & sex
|
MEN
|
WOMEN
|
| Age | Age | Age | Age | Men
| Age | Age | Age | Age |Women
|Grand
Disciplinaries
|00-21 %|22-39 %|40-54 %|55-99 %|Total % |00-21 %|22-39 %|40-54 %|55-99 %|Total % |Total %
------------------------------------------------------------------------------------------------------------------------------------
ZERO
| 31 17| 441 15| 352 17| 114 27| 938 16 | 3 27| 21 17| 27 31| 12 46| 63 26 | 1001 17
ONE
| 26 14| 306 10| 274 13| 69 17| 675 12 | 1 9| 16 13| 13 15| 7 27| 37 15 | 712 12
TWO
| 19 10| 248 8| 191 9| 47 11| 505 9 | 1 9| 13 11| 8 9| 1 4| 23 9 | 528 9
THREE
| 13 7| 194 6| 146 7| 36 9| 389 7 | 0 0| 10 8| 12 14| 2 8| 24 10 | 413 7
FOUR
| 8 4| 166 6| 116 5| 27 6| 317 6 | 0 0| 4 3| 3 3| 0 0| 7 3 | 324 5
FIVE
| 9 5| 143 5| 92 4| 13 3| 257 4 | 2 18| 5 4| 1 1| 1 4| 9 4 | 266 4
MORE THAN FIVE
| 77 42| 1511 50| 946 45| 112 27| 2646 46 | 4 36| 52 43| 22 26| 3 12| 81 33 | 2727 46
------------------------------------------------------------------------------------------------------------------------------------
Total reported
| 183 100| 3009 100| 2117 100| 418 100| 5727 100 | 11 100| 121 100| 86 100| 26 100| 244 100 | 5971 100
|
|
|
|
|
|
|
|
|
|
|
Percent reported | 100.0| 100.0| 100.0| 100.0| 100.0 | 100.0| 100.0| 100.0| 100.0| 100.0 | 100.0
|
|
|
|
|
|
|
|
|
|
|
|
|
|
|
|
|
|
|
|
|
|
NOT REPORTED
|0|1|1|0|2
|0|0|0|0|0
|2
------------------------------------------------------------------------------------------------------------------------------------
Total
| 183 | 3010 | 2118 | 418 | 5729
| 11 | 121 | 86 | 26 | 244
| 5973
|
|
|
|
|
|
|
|
|
|
|
|
|
|
|
|
|
|
|
|
|
|
|
|
|
|
|
|
|
|
|
|
|
|
|
|
|
|
|
|
|
|
|
|
|
|
|
|
|
|
|
|
|
|
|
AVG NUM DISCIP
| 9.77 | 10.74 | 10.22 | 5.55 | 10.14 | 4.91 | 8.28 | 5.41 | 1.73 | 6.42 | 9.99
Page 21 Run 02/27/01
Georgia Department of Corrections Office of Planning and Analysis
Inmate statistical profile
Sample: ACTIVE PRISONERS SERVING LIFE EXCLUDING JAIL
Requestor: Statistics
Active inmates 02/27/2001
Number Of Escapes by current age & sex
|
MEN
|
WOMEN
|
| Age | Age | Age | Age | Men
| Age | Age | Age | Age |Women
|Grand
Escapes
|00-21 %|22-39 %|40-54 %|55-99 %|Total % |00-21 %|22-39 %|40-54 %|55-99 %|Total % |Total %
------------------------------------------------------------------------------------------------------------------------------------
ZERO
| 183 100| 2976 99| 2029 96| 401 96| 5589 98 | 11 100| 121 100| 84 98| 26 100| 242 99 | 5831 98
ONE
| 0 0| 33 1| 71 3| 11 3| 115 2 | 0 0| 0 0| 2 2| 0 0| 2 1 | 117 2
TWO
| 0 0| 1 0| 14 1| 4 1| 19 0 | 0 0| 0 0| 0 0| 0 0| 0 0 | 19 0
THREE
| 0 0| 0 0| 3 0| 2 0| 5 0 | 0 0| 0 0| 0 0| 0 0| 0 0 | 5 0
FOUR
| 0 0| 0 0| 1 0| 0 0| 1 0 | 0 0| 0 0| 0 0| 0 0| 0 0 | 1 0
FIVE
| 0 0| 0 0| 0 0| 0 0| 0 0 | 0 0| 0 0| 0 0| 0 0| 0 0 | 0 0
MORE THAN FIVE
| 0 0| 0 0| 0 0| 0 0| 0 0 | 0 0| 0 0| 0 0| 0 0| 0 0 | 0 0
------------------------------------------------------------------------------------------------------------------------------------
Total reported
| 183 100| 3010 100| 2118 100| 418 100| 5729 100 | 11 100| 121 100| 86 100| 26 100| 244 100 | 5973 100
|
|
|
|
|
|
|
|
|
|
|
Percent reported | 100.0| 100.0| 100.0| 100.0| 100.0 | 100.0| 100.0| 100.0| 100.0| 100.0 | 100.0
|
|
|
|
|
|
|
|
|
|
|
|
|
|
|
|
|
|
|
|
|
|
NOT REPORTED
|0|0|0|0|0
|0|0|0|0|0
|0
------------------------------------------------------------------------------------------------------------------------------------
Total
| 183 | 3010 | 2118 | 418 | 5729
| 11 | 121 | 86 | 26 | 244
| 5973
|
|
|
|
|
|
|
|
|
|
|
|
|
|
|
|
|
|
|
|
|
|
|
|
|
|
|
|
|
|
|
|
|
|
|
|
|
|
|
|
|
|
|
|
|
|
|
|
|
|
|
|
|
|
|
AVG NUM ESCAPES
| .00 | .01 | .05 | .06 | .03 | .00 | .00 | .02 | .00 | .01 | .03
Page 22 Run 02/27/01
Georgia Department of Corrections Office of Planning and Analysis
Inmate statistical profile
Sample: ACTIVE PRISONERS SERVING LIFE EXCLUDING JAIL
Requestor: Statistics
Active inmates 02/27/2001
Number Of Prior Georgia Incarcerations * by current age & sex
|
MEN
|
WOMEN
|
| Age | Age | Age | Age | Men
| Age | Age | Age | Age |Women
|Grand
Prior Incarcerations|00-21 %|22-39 %|40-54 %|55-99 %|Total % |00-21 %|22-39 %|40-54 %|55-99 %|Total % |Total %
------------------------------------------------------------------------------------------------------------------------------------
ZERO
| 179 98| 2043 68| 959 45| 235 56| 3416 60 | 11 100| 103 85| 66 77| 24 92| 204 84 | 3620 61
ONE
| 3 2| 559 19| 525 25| 95 23| 1182 21 | 0 0| 14 12| 13 15| 1 4| 28 11 | 1210 20
TWO
| 1 1| 225 7| 336 16| 41 10| 603 11 | 0 0| 3 2| 6 7| 1 4| 10 4 | 613 10
THREE
| 0 0| 125 4| 169 8| 31 7| 325 6 | 0 0| 1 1| 0 0| 0 0| 1 0 | 326 5
FOUR
| 0 0| 44 1| 77 4| 12 3| 133 2 | 0 0| 0 0| 0 0| 0 0| 0 0 | 133 2
FIVE
| 0 0| 11 0| 32 2| 2 0| 45 1 | 0 0| 0 0| 0 0| 0 0| 0 0 | 45 1
MORE THAN FIVE
| 0 0| 3 0| 20 1| 2 0| 25 0 | 0 0| 0 0| 1 1| 0 0| 1 0 | 26 0
------------------------------------------------------------------------------------------------------------------------------------
Total reported
| 183 100| 3010 100| 2118 100| 418 100| 5729 100 | 11 100| 121 100| 86 100| 26 100| 244 100 | 5973 100
|
|
|
|
|
|
|
|
|
|
|
Percent reported | 100.0| 100.0| 100.0| 100.0| 100.0 | 100.0| 100.0| 100.0| 100.0| 100.0 | 100.0
|
|
|
|
|
|
|
|
|
|
|
|
|
|
|
|
|
|
|
|
|
|
NOT REPORTED
|0|0|0|0|0
|0|0|0|0|0
|0
------------------------------------------------------------------------------------------------------------------------------------
Total
| 183 | 3010 | 2118 | 418 | 5729
| 11 | 121 | 86 | 26 | 244
| 5973
|
|
|
|
|
|
|
|
|
|
|
|
|
|
|
|
|
|
|
|
|
|
|
|
|
|
|
|
|
|
|
|
|
|
|
|
|
|
|
|
|
|
|
|
|
|
|
|
|
|
|
|
|
|
|
AVG # INCARCERATIONS| .03 | .54 | 1.09 | .82 | .75 | .00 | .19 | .37 | .12 | .24 | .73
* This data counts a parole revocation on an existing sentenCE AS A prior incarceration. Also, this data counts, for any cohort of inmates, the total number of Georgia incarcerations the inmate has had during his entire criminal career. For example, if an inmate was admitted to prison first in FY72, and then re-admitted in FY79 and FY85, he had two prior incarcerations before the FY85 admission. This inmate's records show two prior incarcerations in all three of his records since he has had two prior incarcerations in his criminal career. If the cohort of FY72 admissions is selected for analysis, two prior incarcerations will be listed for this inmate even though in FY72, he had no prior incarcerations.
Page 23 Run 02/27/01
Georgia Department of Corrections Office of Planning and Analysis
Inmate statistical profile
Sample: ACTIVE PRISONERS SERVING LIFE EXCLUDING JAIL
Requestor: Statistics
Active inmates 02/27/2001
Number Of Transfers by current age & sex
|
MEN
|
WOMEN
|
| Age | Age | Age | Age | Men
| Age | Age | Age | Age |Women
|Grand
Transfers
|00-21 %|22-39 %|40-54 %|55-99 %|Total % |00-21 %|22-39 %|40-54 %|55-99 %|Total % |Total %
------------------------------------------------------------------------------------------------------------------------------------
ZERO
| 66 36| 103 3| 28 1| 5 1| 202 4 | 1 9| 4 3| 5 6| 0 0| 10 4 | 212 4
ONE
| 76 42| 854 28| 403 19| 87 21| 1420 25 | 8 73| 35 29| 29 34| 5 19| 77 32 | 1497 25
TWO
| 28 15| 664 22| 352 17| 66 16| 1110 19 | 0 0| 36 30| 15 17| 6 23| 57 23 | 1167 20
THREE
| 11 6| 466 15| 298 14| 67 16| 842 15 | 2 18| 23 19| 16 19| 6 23| 47 19 | 889 15
FOUR
| 0 0| 322 11| 229 11| 41 10| 592 10 | 0 0| 13 11| 8 9| 3 12| 24 10 | 616 10
FIVE
| 2 1| 220 7| 178 8| 35 8| 435 8 | 0 0| 5 4| 5 6| 3 12| 13 5 | 448 8
MORE THAN FIVE
| 0 0| 381 13| 630 30| 117 28| 1128 20 | 0 0| 5 4| 8 9| 3 12| 16 7 | 1144 19
------------------------------------------------------------------------------------------------------------------------------------
Total reported
| 183 100| 3010 100| 2118 100| 418 100| 5729 100 | 11 100| 121 100| 86 100| 26 100| 244 100 | 5973 100
|
|
|
|
|
|
|
|
|
|
|
Percent reported | 100.0| 100.0| 100.0| 100.0| 100.0 | 100.0| 100.0| 100.0| 100.0| 100.0 | 100.0
|
|
|
|
|
|
|
|
|
|
|
|
|
|
|
|
|
|
|
|
|
|
NOT REPORTED
|0|0|0|0|0
|0|0|0|0|0
|0
------------------------------------------------------------------------------------------------------------------------------------
Total
| 183 | 3010 | 2118 | 418 | 5729
| 11 | 121 | 86 | 26 | 244
| 5973
|
|
|
|
|
|
|
|
|
|
|
|
|
|
|
|
|
|
|
|
|
|
|
|
|
|
|
|
|
|
|
|
|
|
|
|
|
|
|
|
|
|
|
|
|
|
|
|
|
|
|
|
|
|
|
AVG NUM TRANSFERS | .96 | 2.99 | 4.53 | 4.42 | 3.60 | 1.27 | 2.40 | 2.57 | 3.42 | 2.52 | 3.55
Page 24 Run 02/27/01
Georgia Department of Corrections Office of Planning and Analysis
Inmate statistical profile
Sample: ACTIVE PRISONERS SERVING LIFE EXCLUDING JAIL
Requestor: Statistics
Active inmates 02/27/2001
County Of Conviction by current age & sex
|
MEN
|
WOMEN
|
| Age | Age | Age | Age | Men
| Age | Age | Age | Age |Women
|Grand
County Of Conviction|00-21 %|22-39 %|40-54 %|55-99 %|Total % |00-21 %|22-39 %|40-54 %|55-99 %|Total % |Total %
------------------------------------------------------------------------------------------------------------------------------------
APPLING COUNTY
| 0 0| 4 0| 4 0| 1 0| 9 0 | 0 0| 0 0| 0 0| 0 0| 0 0 | 9 0
ATKINSON COUNTY
| 0 0| 1 0| 2 0| 2 0| 5 0 | 0 0| 0 0| 1 1| 0 0| 1 0 | 6 0
BACON COUNTY
| 0 0| 6 0| 3 0| 0 0| 9 0 | 0 0| 0 0| 0 0| 0 0| 0 0 | 9 0
BAKER COUNTY
| 0 0| 1 0| 1 0| 0 0| 2 0 | 0 0| 0 0| 0 0| 0 0| 0 0 | 2 0
BALDWIN COUNTY
| 2 1| 16 1| 12 1| 2 0| 32 1 | 0 0| 1 1| 0 0| 0 0| 1 0 | 33 1
BANKS COUNTY
| 0 0| 2 0| 9 0| 2 0| 13 0 | 0 0| 0 0| 0 0| 0 0| 0 0 | 13 0
BARROW COUNTY
| 0 0| 3 0| 9 0| 4 1| 16 0 | 0 0| 0 0| 1 1| 0 0| 1 0 | 17 0
BARTOW COUNTY
| 1 1| 27 1| 22 1| 2 0| 52 1 | 0 0| 2 2| 0 0| 0 0| 2 1 | 54 1
BEN HILL COUNTY
| 0 0| 6 0| 9 0| 3 1| 18 0 | 0 0| 0 0| 0 0| 0 0| 0 0 | 18 0
BERRIEN COUNTY
| 0 0| 4 0| 1 0| 0 0| 5 0 | 0 0| 0 0| 0 0| 0 0| 0 0 | 5 0
BIBB COUNTY
| 3 2| 90 3| 86 4| 15 4| 194 3 | 1 9| 1 1| 2 2| 1 4| 5 2 | 199 3
BLECKLEY COUNTY
| 0 0| 7 0| 4 0| 1 0| 12 0 | 0 0| 0 0| 1 1| 0 0| 1 0 | 13 0
BRANTLEY COUNTY
| 0 0| 1 0| 4 0| 2 0| 7 0 | 0 0| 0 0| 0 0| 0 0| 0 0 | 7 0
BROOKS COUNTY
| 0 0| 5 0| 4 0| 1 0| 10 0 | 0 0| 0 0| 0 0| 0 0| 0 0 | 10 0
BRYAN COUNTY
| 0 0| 9 0| 5 0| 1 0| 15 0 | 0 0| 0 0| 0 0| 1 4| 1 0 | 16 0
BULLOCH COUNTY
| 1 1| 17 1| 15 1| 0 0| 33 1 | 0 0| 1 1| 1 1| 1 4| 3 1 | 36 1
BURKE COUNTY
| 1 1| 16 1| 11 1| 2 0| 30 1 | 0 0| 0 0| 0 0| 0 0| 0 0 | 30 1
BUTTS COUNTY
| 2 1| 22 1| 12 1| 2 0| 38 1 | 0 0| 2 2| 1 1| 0 0| 3 1 | 41 1
CALHOUN COUNTY
| 0 0| 2 0| 4 0| 1 0| 7 0 | 0 0| 0 0| 0 0| 0 0| 0 0 | 7 0
CAMDEN COUNTY
| 1 1| 21 1| 8 0| 0 0| 30 1 | 0 0| 0 0| 1 1| 0 0| 1 0 | 31 1
CANDLER COUNTY
| 0 0| 1 0| 1 0| 0 0| 2 0 | 0 0| 0 0| 0 0| 0 0| 0 0 | 2 0
CARROLL COUNTY
| 0 0| 19 1| 13 1| 6 1| 38 1 | 0 0| 2 2| 1 1| 0 0| 3 1 | 41 1
CATOOSA COUNTY
| 0 0| 5 0| 9 0| 0 0| 14 0 | 0 0| 0 0| 0 0| 0 0| 0 0 | 14 0
CHARLTON COUNTY
| 0 0| 1 0| 0 0| 0 0| 1 0 | 0 0| 2 2| 0 0| 0 0| 2 1 | 3 0
CHATHAM COUNTY
| 8 4| 158 5| 111 5| 14 3| 291 5 | 0 0| 2 2| 1 1| 0 0| 3 1 | 294 5
CHATTAHOOCHEE COUNTY| 0 0| 1 0| 2 0| 0 0| 3 0 | 0 0| 0 0| 0 0| 0 0| 0 0 | 3 0
CHATTOOGA COUNTY | 0 0| 5 0| 5 0| 2 0| 12 0 | 0 0| 0 0| 1 1| 1 4| 2 1 | 14 0
CHEROKEE COUNTY
| 1 1| 9 0| 21 1| 2 0| 33 1 | 0 0| 3 2| 0 0| 0 0| 3 1 | 36 1
CLARKE COUNTY
| 2 1| 39 1| 22 1| 8 2| 71 1 | 0 0| 2 2| 0 0| 1 4| 3 1 | 74 1
CLAY COUNTY
| 0 0| 1 0| 1 0| 0 0| 2 0 | 0 0| 0 0| 0 0| 0 0| 0 0 | 2 0
CLAYTON COUNTY
| 5 3| 76 3| 36 2| 11 3| 128 2 | 1 9| 2 2| 2 2| 1 4| 6 2 | 134 2
CLINCH COUNTY
| 0 0| 1 0| 3 0| 0 0| 4 0 | 0 0| 0 0| 0 0| 0 0| 0 0 | 4 0
COBB COUNTY
| 8 4| 111 4| 74 3| 14 3| 207 4 | 0 0| 5 4| 3 3| 1 4| 9 4 | 216 4
COFFEE COUNTY
| 0 0| 8 0| 8 0| 2 0| 18 0 | 0 0| 1 1| 1 1| 0 0| 2 1 | 20 0
COLQUITT COUNTY
| 3 2| 36 1| 25 1| 4 1| 68 1 | 0 0| 0 0| 1 1| 1 4| 2 1 | 70 1
COLUMBIA COUNTY
| 1 1| 5 0| 10 0| 2 0| 18 0 | 0 0| 0 0| 1 1| 0 0| 1 0 | 19 0
------------------------------------------------------------------------------------------------------------------------------------
(continued)
Page 25 Run 02/27/01
Georgia Department of Corrections Office of Planning and Analysis
Inmate statistical profile
Sample: ACTIVE PRISONERS SERVING LIFE EXCLUDING JAIL
Requestor:
Active inmates 02/27/2001
County Of Conviction by current age & sex
Statistics (CONTINUED)
|
MEN
|
WOMEN
|
| Age | Age | Age | Age | Men
| Age | Age | Age | Age |Women
|Grand
County Of Conviction|00-21 %|22-39 %|40-54 %|55-99 %|Total % |00-21 %|22-39 %|40-54 %|55-99 %|Total % |Total %
------------------------------------------------------------------------------------------------------------------------------------
COOK COUNTY
| 0 0| 7 0| 3 0| 0 0| 10 0 | 0 0| 2 2| 0 0| 0 0| 2 1 | 12 0
COWETA COUNTY
| 3 2| 23 1| 10 0| 3 1| 39 1 | 0 0| 2 2| 1 1| 0 0| 3 1 | 42 1
CRAWFORD COUNTY
| 0 0| 3 0| 0 0| 0 0| 3 0 | 0 0| 0 0| 0 0| 0 0| 0 0 | 3 0
CRISP COUNTY
| 3 2| 14 0| 11 1| 2 0| 30 1 | 0 0| 3 2| 0 0| 1 4| 4 2 | 34 1
DADE COUNTY
| 2 1| 7 0| 5 0| 3 1| 17 0 | 0 0| 0 0| 0 0| 0 0| 0 0 | 17 0
DAWSON COUNTY
| 0 0| 2 0| 4 0| 0 0| 6 0 | 0 0| 0 0| 0 0| 0 0| 0 0 | 6 0
DECATUR COUNTY
| 1 1| 21 1| 6 0| 1 0| 29 1 | 0 0| 1 1| 0 0| 0 0| 1 0 | 30 1
DEKALB COUNTY
| 13 7| 244 8| 164 8| 22 5| 443 8 | 1 9| 3 2| 4 5| 1 4| 9 4 | 452 8
DODGE COUNTY
| 0 0| 6 0| 5 0| 1 0| 12 0 | 0 0| 0 0| 0 0| 0 0| 0 0 | 12 0
DOOLY COUNTY
| 2 1| 8 0| 8 0| 0 0| 18 0 | 0 0| 0 0| 0 0| 0 0| 0 0 | 18 0
DOUGHERTY COUNTY | 5 3| 70 2| 42 2| 4 1| 121 2 | 0 0| 5 4| 0 0| 0 0| 5 2 | 126 2
DOUGLAS COUNTY
| 4 2| 48 2| 20 1| 5 1| 77 1 | 0 0| 1 1| 1 1| 0 0| 2 1 | 79 1
EARLY COUNTY
| 0 0| 10 0| 5 0| 2 0| 17 0 | 0 0| 0 0| 0 0| 0 0| 0 0 | 17 0
ECHOLS COUNTY.
| 0 0| 0 0| 0 0| 0 0| 0 0 | 0 0| 0 0| 0 0| 0 0| 0 0 | 0 0
EFFINGHAM COUNTY | 0 0| 5 0| 3 0| 0 0| 8 0 | 0 0| 0 0| 0 0| 0 0| 0 0 | 8 0
ELBERT COUNTY
| 0 0| 14 0| 8 0| 1 0| 23 0 | 0 0| 1 1| 0 0| 0 0| 1 0 | 24 0
EMANUEL COUNTY
| 1 1| 7 0| 10 0| 3 1| 21 0 | 0 0| 0 0| 1 1| 0 0| 1 0 | 22 0
EVANS COUNTY
| 0 0| 6 0| 4 0| 2 0| 12 0 | 0 0| 0 0| 0 0| 0 0| 0 0 | 12 0
FANNIN COUNTY
| 0 0| 4 0| 5 0| 1 0| 10 0 | 0 0| 0 0| 0 0| 0 0| 0 0 | 10 0
FAYETTE COUNTY
| 1 1| 6 0| 5 0| 0 0| 12 0 | 0 0| 0 0| 0 0| 0 0| 0 0 | 12 0
FLOYD COUNTY
| 2 1| 26 1| 27 1| 4 1| 59 1 | 2 18| 3 2| 2 2| 1 4| 8 3 | 67 1
FORSYTH COUNTY
| 0 0| 5 0| 9 0| 3 1| 17 0 | 0 0| 1 1| 1 1| 0 0| 2 1 | 19 0
FRANKLIN COUNTY
| 1 1| 2 0| 3 0| 1 0| 7 0 | 0 0| 0 0| 2 2| 1 4| 3 1 | 10 0
FULTON COUNTY
| 27 15| 465 15| 315 15| 64 15| 871 15 | 1 9| 12 10| 7 8| 5 19| 25 10 | 896 15
GILMER COUNTY
| 0 0| 1 0| 2 0| 3 1| 6 0 | 0 0| 0 0| 0 0| 0 0| 0 0 | 6 0
GLASCOCK COUNTY
| 0 0| 0 0| 0 0| 0 0| 0 0 | 0 0| 0 0| 0 0| 0 0| 0 0 | 0 0
GLYNN COUNTY
| 7 4| 31 1| 29 1| 4 1| 71 1 | 0 0| 2 2| 2 2| 0 0| 4 2 | 75 1
GORDON COUNTY
| 0 0| 21 1| 14 1| 2 0| 37 1 | 0 0| 0 0| 1 1| 0 0| 1 0 | 38 1
GRADY COUNTY
| 5 3| 16 1| 10 0| 1 0| 32 1 | 0 0| 0 0| 0 0| 0 0| 0 0 | 32 1
GREENE COUNTY
| 0 0| 3 0| 5 0| 1 0| 9 0 | 0 0| 0 0| 0 0| 0 0| 0 0 | 9 0
GWINNETT COUNTY
| 1 1| 67 2| 44 2| 8 2| 120 2 | 0 0| 2 2| 5 6| 1 4| 8 3 | 128 2
HABERSHAM COUNTY | 1 1| 14 0| 9 0| 0 0| 24 0 | 0 0| 0 0| 0 0| 0 0| 0 0 | 24 0
HALL COUNTY
| 3 2| 42 1| 39 2| 10 2| 94 2 | 1 9| 3 2| 1 1| 1 4| 6 2 | 100 2
HANCOCK COUNTY
| 0 0| 3 0| 1 0| 0 0| 4 0 | 0 0| 0 0| 1 1| 0 0| 1 0 | 5 0
HARALSON COUNTY
| 0 0| 4 0| 2 0| 1 0| 7 0 | 0 0| 0 0| 0 0| 0 0| 0 0 | 7 0
------------------------------------------------------------------------------------------------------------------------------------
(continued)
Page 26 Run 02/27/01
Georgia Department of Corrections Office of Planning and Analysis
Inmate statistical profile
Sample: ACTIVE PRISONERS SERVING LIFE EXCLUDING JAIL
Requestor:
Active inmates 02/27/2001
County Of Conviction by current age & sex
Statistics (CONTINUED)
|
MEN
|
WOMEN
|
| Age | Age | Age | Age | Men
| Age | Age | Age | Age |Women
|Grand
County Of Conviction|00-21 %|22-39 %|40-54 %|55-99 %|Total % |00-21 %|22-39 %|40-54 %|55-99 %|Total % |Total %
------------------------------------------------------------------------------------------------------------------------------------
HARRIS COUNTY
| 1 1| 8 0| 3 0| 0 0| 12 0 | 0 0| 0 0| 0 0| 0 0| 0 0 | 12 0
HART COUNTY
| 0 0| 3 0| 2 0| 0 0| 5 0 | 0 0| 0 0| 0 0| 0 0| 0 0 | 5 0
HEARD COUNTY
| 0 0| 2 0| 0 0| 3 1| 5 0 | 0 0| 0 0| 0 0| 0 0| 0 0 | 5 0
HENRY COUNTY
| 0 0| 24 1| 9 0| 1 0| 34 1 | 0 0| 1 1| 0 0| 0 0| 1 0 | 35 1
HOUSTON COUNTY
| 1 1| 39 1| 19 1| 3 1| 62 1 | 0 0| 4 3| 3 3| 1 4| 8 3 | 70 1
IRWIN COUNTY
| 0 0| 3 0| 1 0| 1 0| 5 0 | 0 0| 0 0| 0 0| 0 0| 0 0 | 5 0
JACKSON COUNTY
| 1 1| 6 0| 14 1| 1 0| 22 0 | 0 0| 1 1| 0 0| 0 0| 1 0 | 23 0
JASPER COUNTY
| 0 0| 8 0| 1 0| 0 0| 9 0 | 0 0| 0 0| 1 1| 0 0| 1 0 | 10 0
JEFF DAVIS COUNTY | 0 0| 4 0| 4 0| 2 0| 10 0 | 0 0| 0 0| 0 0| 0 0| 0 0 | 10 0
JEFFERSON COUNTY | 0 0| 7 0| 7 0| 4 1| 18 0 | 0 0| 0 0| 0 0| 0 0| 0 0 | 18 0
JENKINS COUNTY
| 0 0| 2 0| 4 0| 0 0| 6 0 | 0 0| 0 0| 0 0| 0 0| 0 0 | 6 0
JOHNSON COUNTY
| 0 0| 9 0| 2 0| 1 0| 12 0 | 0 0| 1 1| 0 0| 0 0| 1 0 | 13 0
JONES COUNTY
| 0 0| 0 0| 7 0| 3 1| 10 0 | 0 0| 0 0| 0 0| 0 0| 0 0 | 10 0
LAMAR COUNTY
| 1 1| 11 0| 10 0| 3 1| 25 0 | 0 0| 0 0| 1 1| 0 0| 1 0 | 26 0
LANIER COUNTY
| 0 0| 1 0| 0 0| 0 0| 1 0 | 0 0| 0 0| 0 0| 0 0| 0 0 | 1 0
LAURENS COUNTY
| 1 1| 13 0| 7 0| 1 0| 22 0 | 0 0| 1 1| 2 2| 0 0| 3 1 | 25 0
LEE COUNTY
| 0 0| 2 0| 0 0| 0 0| 2 0 | 1 9| 0 0| 0 0| 0 0| 1 0 | 3 0
LIBERTY COUNTY
| 1 1| 22 1| 9 0| 4 1| 36 1 | 0 0| 2 2| 0 0| 0 0| 2 1 | 38 1
LINCOLN COUNTY
| 0 0| 3 0| 2 0| 0 0| 5 0 | 0 0| 0 0| 0 0| 0 0| 0 0 | 5 0
LONG COUNTY
| 1 1| 5 0| 4 0| 2 0| 12 0 | 0 0| 2 2| 0 0| 0 0| 2 1 | 14 0
LOWNDES COUNTY
| 0 0| 41 1| 26 1| 2 0| 69 1 | 0 0| 0 0| 2 2| 1 4| 3 1 | 72 1
LUMPKIN COUNTY
| 1 1| 3 0| 0 0| 2 0| 6 0 | 0 0| 0 0| 0 0| 0 0| 0 0 | 6 0
MACON COUNTY
| 0 0| 16 1| 8 0| 0 0| 24 0 | 0 0| 0 0| 0 0| 0 0| 0 0 | 24 0
MADISON COUNTY
| 0 0| 9 0| 5 0| 2 0| 16 0 | 0 0| 2 2| 0 0| 0 0| 2 1 | 18 0
MARION COUNTY
| 0 0| 2 0| 1 0| 0 0| 3 0 | 0 0| 0 0| 1 1| 0 0| 1 0 | 4 0
MCDUFFIE COUNTY
| 0 0| 28 1| 12 1| 4 1| 44 1 | 1 9| 1 1| 0 0| 0 0| 2 1 | 46 1
MCINTOSH COUNTY
| 2 1| 7 0| 9 0| 0 0| 18 0 | 0 0| 0 0| 0 0| 0 0| 0 0 | 18 0
MERIWETHER COUNTY | 0 0| 9 0| 10 0| 3 1| 22 0 | 0 0| 2 2| 0 0| 1 4| 3 1 | 25 0
MILLER COUNTY
| 0 0| 2 0| 2 0| 0 0| 4 0 | 0 0| 0 0| 0 0| 0 0| 0 0 | 4 0
MITCHELL COUNTY
| 0 0| 11 0| 10 0| 2 0| 23 0 | 0 0| 2 2| 0 0| 0 0| 2 1 | 25 0
MONROE COUNTY
| 0 0| 9 0| 9 0| 2 0| 20 0 | 0 0| 1 1| 0 0| 0 0| 1 0 | 21 0
MONTGOMERY COUNTY | 0 0| 0 0| 3 0| 0 0| 3 0 | 0 0| 0 0| 0 0| 0 0| 0 0 | 3 0
MORGAN COUNTY
| 0 0| 12 0| 2 0| 0 0| 14 0 | 0 0| 1 1| 0 0| 0 0| 1 0 | 15 0
MURRAY COUNTY
| 2 1| 3 0| 6 0| 4 1| 15 0 | 0 0| 0 0| 0 0| 0 0| 0 0 | 15 0
MUSCOGEE COUNTY
| 3 2| 83 3| 76 4| 11 3| 173 3 | 0 0| 4 3| 2 2| 0 0| 6 2 | 179 3
------------------------------------------------------------------------------------------------------------------------------------
(continued)
Page 27 Run 02/27/01
Georgia Department of Corrections Office of Planning and Analysis
Inmate statistical profile
Sample: ACTIVE PRISONERS SERVING LIFE EXCLUDING JAIL
Requestor:
Active inmates 02/27/2001
County Of Conviction by current age & sex
Statistics (CONTINUED)
|
MEN
|
WOMEN
|
| Age | Age | Age | Age | Men
| Age | Age | Age | Age |Women
|Grand
County Of Conviction|00-21 %|22-39 %|40-54 %|55-99 %|Total % |00-21 %|22-39 %|40-54 %|55-99 %|Total % |Total %
------------------------------------------------------------------------------------------------------------------------------------
NEWTON COUNTY
| 2 1| 46 2| 16 1| 5 1| 69 1 | 0 0| 2 2| 0 0| 0 0| 2 1 | 71 1
OCONEE COUNTY
| 0 0| 8 0| 4 0| 0 0| 12 0 | 0 0| 0 0| 0 0| 0 0| 0 0 | 12 0
OGLETHORPE COUNTY | 0 0| 4 0| 4 0| 1 0| 9 0 | 0 0| 0 0| 0 0| 0 0| 0 0 | 9 0
PAULDING COUNTY
| 0 0| 4 0| 6 0| 2 0| 12 0 | 0 0| 1 1| 0 0| 0 0| 1 0 | 13 0
PEACH COUNTY
| 0 0| 6 0| 3 0| 0 0| 9 0 | 0 0| 0 0| 1 1| 0 0| 1 0 | 10 0
PICKENS COUNTY
| 0 0| 3 0| 1 0| 1 0| 5 0 | 0 0| 0 0| 1 1| 0 0| 1 0 | 6 0
PIERCE COUNTY
| 3 2| 2 0| 5 0| 0 0| 10 0 | 0 0| 0 0| 0 0| 0 0| 0 0 | 10 0
PIKE COUNTY
| 0 0| 1 0| 1 0| 0 0| 2 0 | 0 0| 0 0| 0 0| 0 0| 0 0 | 2 0
POLK COUNTY
| 0 0| 13 0| 8 0| 2 0| 23 0 | 0 0| 0 0| 0 0| 0 0| 0 0 | 23 0
PULASKI COUNTY
| 0 0| 7 0| 1 0| 0 0| 8 0 | 0 0| 1 1| 0 0| 0 0| 1 0 | 9 0
PUTNAM COUNTY
| 0 0| 20 1| 14 1| 4 1| 38 1 | 0 0| 0 0| 0 0| 0 0| 0 0 | 38 1
QUITMAN COUNTY
| 0 0| 4 0| 0 0| 0 0| 4 0 | 0 0| 0 0| 0 0| 0 0| 0 0 | 4 0
RABUN COUNTY
| 0 0| 6 0| 3 0| 0 0| 9 0 | 0 0| 0 0| 0 0| 0 0| 0 0 | 9 0
RANDOLPH COUNTY
| 0 0| 3 0| 2 0| 2 0| 7 0 | 0 0| 0 0| 0 0| 0 0| 0 0 | 7 0
RICHMOND COUNTY
| 10 5| 159 5| 76 4| 13 3| 258 5 | 0 0| 8 7| 8 9| 1 4| 17 7 | 275 5
ROCKDALE COUNTY
| 1 1| 10 0| 11 1| 5 1| 27 0 | 0 0| 1 1| 0 0| 0 0| 1 0 | 28 0
SCHLEY COUNTY
| 0 0| 3 0| 2 0| 0 0| 5 0 | 0 0| 0 0| 0 0| 0 0| 0 0 | 5 0
SCREVEN COUNTY
| 0 0| 5 0| 5 0| 2 0| 12 0 | 0 0| 0 0| 0 0| 0 0| 0 0 | 12 0
SEMINOLE COUNTY
| 1 1| 4 0| 4 0| 2 0| 11 0 | 0 0| 1 1| 0 0| 0 0| 1 0 | 12 0
SPALDING COUNTY
| 2 1| 40 1| 24 1| 6 1| 72 1 | 1 9| 1 1| 2 2| 1 4| 5 2 | 77 1
STEPHENS COUNTY
| 0 0| 3 0| 4 0| 3 1| 10 0 | 0 0| 0 0| 0 0| 0 0| 0 0 | 10 0
STEWART COUNTY
| 0 0| 2 0| 1 0| 0 0| 3 0 | 0 0| 0 0| 2 2| 0 0| 2 1 | 5 0
SUMTER COUNTY
| 0 0| 5 0| 13 1| 1 0| 19 0 | 0 0| 0 0| 1 1| 0 0| 1 0 | 20 0
TALBOT COUNTY
| 2 1| 4 0| 1 0| 0 0| 7 0 | 0 0| 0 0| 1 1| 0 0| 1 0 | 8 0
TALIAFERRO COUNTY | 0 0| 0 0| 3 0| 0 0| 3 0 | 0 0| 0 0| 0 0| 0 0| 0 0 | 3 0
TATTNALL COUNTY
| 0 0| 17 1| 13 1| 2 0| 32 1 | 0 0| 0 0| 1 1| 0 0| 1 0 | 33 1
TAYLOR COUNTY
| 3 2| 9 0| 5 0| 0 0| 17 0 | 0 0| 0 0| 0 0| 0 0| 0 0 | 17 0
TELFAIR COUNTY
| 1 1| 6 0| 2 0| 0 0| 9 0 | 0 0| 0 0| 1 1| 0 0| 1 0 | 10 0
TERRELL COUNTY
| 1 1| 12 0| 2 0| 2 0| 17 0 | 0 0| 0 0| 0 0| 0 0| 0 0 | 17 0
THOMAS COUNTY
| 2 1| 16 1| 22 1| 3 1| 43 1 | 0 0| 1 1| 1 1| 0 0| 2 1 | 45 1
TIFT COUNTY
| 7 4| 34 1| 22 1| 4 1| 67 1 | 0 0| 0 0| 2 2| 1 4| 3 1 | 70 1
TOOMBS COUNTY
| 4 2| 21 1| 9 0| 2 0| 36 1 | 0 0| 2 2| 0 0| 0 0| 2 1 | 38 1
TOWNS COUNTY
| 0 0| 1 0| 1 0| 0 0| 2 0 | 0 0| 0 0| 0 0| 0 0| 0 0 | 2 0
TREUTLEN COUNTY
| 0 0| 3 0| 4 0| 0 0| 7 0 | 0 0| 0 0| 0 0| 0 0| 0 0 | 7 0
TROUP COUNTY
| 2 1| 24 1| 26 1| 7 2| 59 1 | 0 0| 2 2| 1 1| 0 0| 3 1 | 62 1
------------------------------------------------------------------------------------------------------------------------------------
(continued)
Page 28 Run 02/27/01
Georgia Department of Corrections Office of Planning and Analysis
Inmate statistical profile
Sample: ACTIVE PRISONERS SERVING LIFE EXCLUDING JAIL
Requestor:
Active inmates 02/27/2001
County Of Conviction by current age & sex
Statistics (CONTINUED)
|
MEN
|
WOMEN
|
| Age | Age | Age | Age | Men
| Age | Age | Age | Age |Women
|Grand
County Of Conviction|00-21 %|22-39 %|40-54 %|55-99 %|Total % |00-21 %|22-39 %|40-54 %|55-99 %|Total % |Total %
------------------------------------------------------------------------------------------------------------------------------------
TURNER COUNTY
| 0 0| 8 0| 6 0| 1 0| 15 0 | 0 0| 0 0| 0 0| 0 0| 0 0 | 15 0
TWIGGS COUNTY
| 0 0| 3 0| 5 0| 1 0| 9 0 | 0 0| 0 0| 0 0| 0 0| 0 0 | 9 0
UNION COUNTY
| 0 0| 0 0| 1 0| 0 0| 1 0 | 0 0| 0 0| 0 0| 0 0| 0 0 | 1 0
UPSON COUNTY
| 1 1| 7 0| 5 0| 1 0| 14 0 | 0 0| 0 0| 1 1| 0 0| 1 0 | 15 0
WALKER COUNTY
| 0 0| 15 0| 10 0| 4 1| 29 1 | 0 0| 1 1| 1 1| 0 0| 2 1 | 31 1
WALTON COUNTY
| 3 2| 32 1| 21 1| 2 0| 58 1 | 0 0| 1 1| 0 0| 0 0| 1 0 | 59 1
WARE COUNTY
| 0 0| 14 0| 11 1| 3 1| 28 0 | 0 0| 0 0| 1 1| 0 0| 1 0 | 29 0
WARREN COUNTY
| 0 0| 4 0| 6 0| 1 0| 11 0 | 0 0| 0 0| 0 0| 0 0| 0 0 | 11 0
WASHINGTON COUNTY | 0 0| 7 0| 6 0| 2 0| 15 0 | 1 9| 1 1| 0 0| 0 0| 2 1 | 17 0
WAYNE COUNTY
| 0 0| 7 0| 8 0| 2 0| 17 0 | 0 0| 1 1| 0 0| 0 0| 1 0 | 18 0
WEBSTER COUNTY
| 0 0| 0 0| 0 0| 0 0| 0 0 | 0 0| 0 0| 0 0| 0 0| 0 0 | 0 0
WHEELER COUNTY
| 0 0| 3 0| 3 0| 1 0| 7 0 | 0 0| 0 0| 0 0| 1 4| 1 0 | 8 0
WHITE COUNTY
| 0 0| 3 0| 1 0| 1 0| 5 0 | 0 0| 0 0| 0 0| 0 0| 0 0 | 5 0
WHITFIELD COUNTY | 0 0| 24 1| 24 1| 8 2| 56 1 | 0 0| 5 4| 1 1| 0 0| 6 2 | 62 1
WILCOX COUNTY
| 0 0| 1 0| 7 0| 0 0| 8 0 | 0 0| 0 0| 0 0| 0 0| 0 0 | 8 0
WILKES COUNTY
| 0 0| 7 0| 4 0| 1 0| 12 0 | 0 0| 0 0| 0 0| 0 0| 0 0 | 12 0
WILKINSON COUNTY | 0 0| 7 0| 1 0| 0 0| 8 0 | 0 0| 0 0| 0 0| 0 0| 0 0 | 8 0
WORTH COUNTY
| 2 1| 15 0| 4 0| 2 0| 23 0 | 0 0| 0 0| 0 0| 0 0| 0 0 | 23 0
CONVERSION
| 0 1| 0 0| 0 0| 0 0| 0 0 | 0 0| 0 0| 0 0| 0 0| 0 0 | 0 0
------------------------------------------------------------------------------------------------------------------------------------
Total reported
| 183 100| 3010 100| 2118 100| 418 100| 5729 100 | 11 100| 121 100| 86 100| 26 100| 244 100 | 5973 100
|
|
|
|
|
|
|
|
|
|
|
Percent reported | 100.0| 100.0| 100.0| 100.0| 100.0 | 100.0| 100.0| 100.0| 100.0| 100.0 | 100.0
|
|
|
|
|
|
|
|
|
|
|
|
|
|
|
|
|
|
|
|
|
|
UNKNOWN
|0|0|0|0|0
|0|0|0|0|0
|0
------------------------------------------------------------------------------------------------------------------------------------
Total
| 183 | 3010 | 2118 | 418 | 5729
| 11 | 121 | 86 | 26 | 244
| 5973
Page 29 Run 02/27/01
Georgia Department of Corrections Office of Planning and Analysis
Inmate statistical profile
Sample: ACTIVE PRISONERS SERVING LIFE EXCLUDING JAIL
Requestor: Statistics
Active inmates 02/27/2001
Circuit Of Conviction by current age & sex
|
MEN
|
WOMEN
|
| Age | Age | Age | Age | Men
| Age | Age | Age | Age |Women
|Grand
Circ Of Conviction |00-21 %|22-39 %|40-54 %|55-99 %|Total % |00-21 %|22-39 %|40-54 %|55-99 %|Total % |Total %
------------------------------------------------------------------------------------------------------------------------------------
ALAPAHA CIRCUIT
| 0 0| 14 0| 9 0| 2 0| 25 0 | 0 0| 2 2| 1 1| 0 0| 3 1 | 28 0
ALCOVY CIRCUIT
| 5 3| 78 3| 37 2| 7 2| 127 2 | 0 0| 3 2| 0 0| 0 0| 3 1 | 130 2
ATLANTA CIRCUIT
| 27 15| 465 15| 315 15| 64 15| 871 15 | 1 9| 12 10| 7 8| 5 19| 25 10 | 896 15
ATLANTIC CIRCUIT | 4 2| 66 2| 44 2| 11 3| 125 2 | 0 0| 4 3| 1 1| 1 4| 6 2 | 131 2
AUGUSTA CIRCUIT
| 12 7| 180 6| 97 5| 17 4| 306 5 | 0 0| 8 7| 9 10| 1 4| 18 7 | 324 5
BLUE RIDGE CIRCUIT | 1 1| 13 0| 30 1| 5 1| 49 1 | 0 0| 4 3| 1 1| 0 0| 5 2 | 54 1
BRUNSWICK CIRCUIT | 8 4| 67 2| 53 3| 9 2| 137 2 | 0 0| 3 2| 3 3| 0 0| 6 2 | 143 2
CHATTAHOOCHEE CIRCUI| 9 5| 107 4| 88 4| 11 3| 215 4 | 0 0| 4 3| 4 5| 0 0| 8 3 | 223 4
CHEROKEE CIRCUIT | 1 1| 48 2| 36 2| 4 1| 89 2 | 0 0| 2 2| 1 1| 0 0| 3 1 | 92 2
CLAYTON CIRCUIT
| 5 3| 76 3| 36 2| 11 3| 128 2 | 1 9| 2 2| 2 2| 1 4| 6 2 | 134 2
COBB CIRCUIT
| 8 4| 111 4| 74 3| 14 3| 207 4 | 0 0| 5 4| 3 3| 1 4| 9 4 | 216 4
CONASAUGA CIRCUIT | 2 1| 27 1| 30 1| 12 3| 71 1 | 0 0| 5 4| 1 1| 0 0| 6 2 | 77 1
CORDELE CIRCUIT
| 5 3| 29 1| 35 2| 5 1| 74 1 | 0 0| 3 2| 0 0| 1 4| 4 2 | 78 1
COWETA CIRCUIT
| 5 3| 77 3| 59 3| 22 5| 163 3 | 0 0| 8 7| 3 3| 1 4| 12 5 | 175 3
DOUGHERTY CIRCUIT | 5 3| 70 2| 42 2| 4 1| 121 2 | 0 0| 5 4| 0 0| 0 0| 5 2 | 126 2
DUBLIN CIRCUIT
| 1 1| 28 1| 18 1| 3 1| 50 1 | 0 0| 2 2| 2 2| 0 0| 4 2 | 54 1
EASTERN CIRCUIT
| 8 4| 158 5| 111 5| 14 3| 291 5 | 0 0| 2 2| 1 1| 0 0| 3 1 | 294 5
FLINT CIRCUIT
| 1 1| 62 2| 39 2| 8 2| 110 2 | 0 0| 4 3| 2 2| 0 0| 6 2 | 116 2
GRIFFIN CIRCUIT
| 4 2| 54 2| 35 2| 7 2| 100 2 | 1 9| 1 1| 3 3| 1 4| 6 2 | 106 2
GWINNETT CIRCUIT | 1 1| 67 2| 44 2| 8 2| 120 2 | 0 0| 2 2| 5 6| 1 4| 8 3 | 128 2
HOUSTON CIRCUIT
| 1 1| 39 1| 19 1| 3 1| 62 1 | 0 0| 4 3| 3 3| 1 4| 8 3 | 70 1
LOOKOUT MOUNTAIN CIR| 2 1| 32 1| 29 1| 9 2| 72 1 | 0 0| 1 1| 2 2| 1 4| 4 2 | 76 1
MACON CIRCUIT
| 3 2| 99 3| 89 4| 15 4| 206 4 | 1 9| 1 1| 3 3| 1 4| 6 2 | 212 4
MIDDLE CIRCUIT
| 5 3| 43 1| 33 2| 11 3| 92 2 | 1 9| 3 2| 1 1| 0 0| 5 2 | 97 2
MOUNTAIN CIRCUIT | 1 1| 23 1| 16 1| 3 1| 43 1 | 0 0| 0 0| 0 0| 0 0| 0 0 | 43 1
NORTHEASTERN CIRCUIT| 3 2| 44 1| 43 2| 10 2| 100 2 | 1 9| 3 2| 1 1| 1 4| 6 2 | 106 2
NORTHERN CIRCUIT | 1 1| 32 1| 22 1| 5 1| 60 1 | 0 0| 3 2| 2 2| 1 4| 6 2 | 66 1
OCMULGEE CIRCUIT | 2 1| 69 2| 43 2| 10 2| 124 2 | 0 0| 2 2| 2 2| 0 0| 4 2 | 128 2
OCONEE CIRCUIT
| 1 1| 29 1| 18 1| 3 1| 51 1 | 0 0| 1 1| 2 2| 1 4| 4 2 | 55 1
OGEECHEE CIRCUIT | 1 1| 29 1| 27 1| 2 0| 59 1 | 0 0| 1 1| 1 1| 1 4| 3 1 | 62 1
PATAULA CIRCUIT
| 2 1| 36 1| 16 1| 8 2| 62 1 | 0 0| 1 1| 0 0| 0 0| 1 0 | 63 1
PIEDMONT CIRCUIT | 1 1| 11 0| 32 2| 7 2| 51 1 | 0 0| 1 1| 1 1| 0 0| 2 1 | 53 1
ROME CIRCUIT
| 2 1| 26 1| 27 1| 4 1| 59 1 | 2 18| 3 2| 2 2| 1 4| 8 3 | 67 1
SOUTH GEORGIA CIRCUI| 6 3| 51 2| 31 1| 5 1| 93 2 | 0 0| 3 2| 0 0| 0 0| 3 1 | 96 2
SOUTHERN CIRCUIT | 5 3| 98 3| 77 4| 10 2| 190 3 | 0 0| 1 1| 4 5| 2 8| 7 3 | 197 3
------------------------------------------------------------------------------------------------------------------------------------
(continued)
Page 30 Run 02/27/01
Georgia Department of Corrections Office of Planning and Analysis
Inmate statistical profile
Sample: ACTIVE PRISONERS SERVING LIFE EXCLUDING JAIL
Requestor:
Active inmates 02/27/2001
Circuit Of Conviction by current age & sex
Statistics (Continued)
|
MEN
|
WOMEN
|
| Age | Age | Age | Age | Men
| Age | Age | Age | Age |Women
|Grand
Circ Of Conviction |00-21 %|22-39 %|40-54 %|55-99 %|Total % |00-21 %|22-39 %|40-54 %|55-99 %|Total % |Total %
------------------------------------------------------------------------------------------------------------------------------------
SOUTHWESTERN CIRCUIT| 0 0| 28 1| 24 1| 1 0| 53 1 | 1 9| 0 0| 3 3| 0 0| 4 2 | 57 1
STONE MOUNTAIN CIRCU| 13 7| 244 8| 164 8| 22 5| 443 8 | 1 9| 3 2| 4 5| 1 4| 9 4 | 452 8
TALLAPOOSA CIRCUIT | 0 0| 21 1| 16 1| 5 1| 42 1 | 0 0| 1 1| 0 0| 0 0| 1 0 | 43 1
TIFTON CIRCUIT
| 9 5| 60 2| 33 2| 8 2| 110 2 | 0 0| 0 0| 2 2| 1 4| 3 1 | 113 2
TOOMBS CIRCUIT
| 0 0| 42 1| 27 1| 6 1| 75 1 | 1 9| 1 1| 0 0| 0 0| 2 1 | 77 1
WAYCROSS CIRCUIT | 3 2| 32 1| 31 1| 7 2| 73 1 | 0 0| 3 2| 2 2| 0 0| 5 2 | 78 1
WESTERN CIRCUIT
| 2 1| 47 2| 26 1| 8 2| 83 1 | 0 0| 2 2| 0 0| 1 4| 3 1 | 86 1
ROCKDALE CIRCUIT | 1 1| 10 0| 11 1| 5 1| 27 0 | 0 0| 1 1| 0 0| 0 0| 1 0 | 28 0
DOUGLAS CIRCUIT
| 4 2| 48 2| 20 1| 5 1| 77 1 | 0 0| 1 1| 1 1| 0 0| 2 1 | 79 1
APPALACHIAN CIRCUIT | 0 0| 8 0| 8 0| 5 1| 21 0 | 0 0| 0 0| 1 1| 0 0| 1 0 | 22 0
ENOTAH CIRCUIT
| 1 1| 7 0| 3 0| 3 1| 14 0 | 0 0| 0 0| 0 0| 0 0| 0 0 | 14 0
BELL-FORSYTH CIRCUIT| 0 0| 1 0| 0 0| 0 0| 1 0 | 0 0| 0 0| 0 0| 0 0| 0 0 | 1 0
------------------------------------------------------------------------------------------------------------------------------------
Total reported
| 181 100| 3006 100| 2117 100| 418 100| 5722 100 | 11 100| 121 100| 86 100| 26 100| 244 100 | 5966 100
|
|
|
|
|
|
|
|
|
|
|
Percent reported |
98.9|
99.9| 100.0| 100.0|
99.9 | 100.0| 100.0| 100.0| 100.0| 100.0 |
99.9
|
|
|
|
|
|
|
|
|
|
|
|
|
|
|
|
|
|
|
|
|
|
NOT REPORTED
|2|4|1|0|7
|0|0|0|0|0
|7
------------------------------------------------------------------------------------------------------------------------------------
Total
| 183 | 3010 | 2118 | 418 | 5729
| 11 | 121 | 86 | 26 | 244
| 5973
Page 31 Run 02/27/01
Georgia Department of Corrections Office of Planning and Analysis
Inmate statistical profile
Sample: ACTIVE PRISONERS SERVING LIFE EXCLUDING JAIL
Requestor: Statistics
Active inmates 02/27/2001
Home County by current age & sex
|
MEN
|
WOMEN
|
| Age | Age | Age | Age | Men
| Age | Age | Age | Age |Women
|Grand
Home County
|00-21 %|22-39 %|40-54 %|55-99 %|Total % |00-21 %|22-39 %|40-54 %|55-99 %|Total % |Total %
------------------------------------------------------------------------------------------------------------------------------------
APPLING COUNTY
| 0 0| 4 0| 5 0| 1 0| 10 0 | 0 0| 0 0| 0 0| 0 0| 0 0 | 10 0
ATKINSON COUNTY
| 0 0| 1 0| 1 0| 3 1| 5 0 | 0 0| 0 0| 0 0| 0 0| 0 0 | 5 0
BACON COUNTY
| 0 0| 5 0| 4 0| 1 0| 10 0 | 0 0| 0 0| 0 0| 0 0| 0 0 | 10 0
BAKER COUNTY
| 0 0| 1 0| 2 0| 0 0| 3 0 | 0 0| 0 0| 0 0| 0 0| 0 0 | 3 0
BALDWIN COUNTY
| 0 0| 16 1| 7 0| 1 0| 24 0 | 0 0| 1 1| 0 0| 1 4| 2 1 | 26 0
BANKS COUNTY
| 0 0| 2 0| 4 0| 1 0| 7 0 | 0 0| 1 1| 0 0| 0 0| 1 0 | 8 0
BARROW COUNTY
| 0 0| 6 0| 8 0| 2 1| 16 0 | 0 0| 0 0| 1 1| 0 0| 1 0 | 17 0
BARTOW COUNTY
| 1 1| 19 1| 19 1| 4 1| 43 1 | 1 10| 3 3| 0 0| 0 0| 4 2 | 47 1
BEN HILL COUNTY
| 0 0| 4 0| 7 0| 3 1| 14 0 | 0 0| 0 0| 1 1| 0 0| 1 0 | 15 0
BERRIEN COUNTY
| 0 0| 4 0| 1 0| 1 0| 6 0 | 0 0| 0 0| 0 0| 0 0| 0 0 | 6 0
BIBB COUNTY
| 3 2| 81 3| 80 4| 18 5| 182 3 | 1 10| 4 4| 3 4| 0 0| 8 4 | 190 3
BLECKLEY COUNTY
| 0 0| 8 0| 4 0| 1 0| 13 0 | 0 0| 0 0| 1 1| 0 0| 1 0 | 14 0
BRANTLEY COUNTY
| 0 0| 1 0| 2 0| 0 0| 3 0 | 0 0| 0 0| 0 0| 0 0| 0 0 | 3 0
BROOKS COUNTY
| 0 0| 7 0| 2 0| 1 0| 10 0 | 0 0| 0 0| 0 0| 0 0| 0 0 | 10 0
BRYAN COUNTY
| 1 1| 7 0| 4 0| 1 0| 13 0 | 0 0| 0 0| 0 0| 0 0| 0 0 | 13 0
BULLOCH COUNTY
| 1 1| 12 0| 10 1| 0 0| 23 0 | 0 0| 0 0| 1 1| 1 4| 2 1 | 25 0
BURKE COUNTY
| 0 0| 10 0| 6 0| 3 1| 19 0 | 0 0| 0 0| 0 0| 0 0| 0 0 | 19 0
BUTTS COUNTY
| 0 0| 24 1| 8 0| 2 1| 34 1 | 0 0| 1 1| 1 1| 0 0| 2 1 | 36 1
CALHOUN COUNTY
| 0 0| 4 0| 3 0| 1 0| 8 0 | 0 0| 0 0| 0 0| 0 0| 0 0 | 8 0
CAMDEN COUNTY
| 1 1| 17 1| 6 0| 0 0| 24 0 | 0 0| 0 0| 1 1| 0 0| 1 0 | 25 0
CANDLER COUNTY
| 0 0| 2 0| 1 0| 0 0| 3 0 | 0 0| 0 0| 0 0| 0 0| 0 0 | 3 0
CARROLL COUNTY
| 0 0| 23 1| 12 1| 8 2| 43 1 | 0 0| 2 2| 1 1| 0 0| 3 1 | 46 1
CATOOSA COUNTY
| 0 0| 2 0| 6 0| 1 0| 9 0 | 0 0| 0 0| 0 0| 0 0| 0 0 | 9 0
CHARLTON COUNTY
| 0 0| 1 0| 0 0| 0 0| 1 0 | 0 0| 1 1| 0 0| 0 0| 1 0 | 2 0
CHATHAM COUNTY
| 8 5| 151 6| 100 5| 14 4| 273 5 | 0 0| 2 2| 1 1| 1 4| 4 2 | 277 5
CHATTAHOOCHEE COUNTY| 0 0| 1 0| 1 0| 0 0| 2 0 | 0 0| 0 0| 0 0| 0 0| 0 0 | 2 0
CHATTOOGA COUNTY | 0 0| 3 0| 4 0| 1 0| 8 0 | 0 0| 0 0| 1 1| 1 4| 2 1 | 10 0
CHEROKEE COUNTY
| 1 1| 8 0| 17 1| 1 0| 27 1 | 0 0| 2 2| 0 0| 0 0| 2 1 | 29 1
CLARKE COUNTY
| 3 2| 43 2| 20 1| 3 1| 69 1 | 0 0| 2 2| 0 0| 2 8| 4 2 | 73 1
CLAY COUNTY
| 0 0| 0 0| 1 0| 0 0| 1 0 | 0 0| 0 0| 0 0| 0 0| 0 0 | 1 0
CLAYTON COUNTY
| 3 2| 60 2| 43 2| 9 2| 115 2 | 1 10| 2 2| 1 1| 1 4| 5 2 | 120 2
CLINCH COUNTY
| 0 0| 1 0| 1 0| 0 0| 2 0 | 0 0| 0 0| 0 0| 0 0| 0 0 | 2 0
COBB COUNTY
| 7 4| 91 3| 66 3| 8 2| 172 3 | 0 0| 4 4| 1 1| 0 0| 5 2 | 177 3
COFFEE COUNTY
| 0 0| 11 0| 3 0| 3 1| 17 0 | 0 0| 1 1| 2 3| 1 4| 4 2 | 21 0
COLQUITT COUNTY
| 6 4| 25 1| 19 1| 2 1| 52 1 | 0 0| 0 0| 1 1| 0 0| 1 0 | 53 1
COLUMBIA COUNTY
| 0 0| 8 0| 8 0| 0 0| 16 0 | 0 0| 0 0| 2 3| 0 0| 2 1 | 18 0
------------------------------------------------------------------------------------------------------------------------------------
(continued)
Page 32 Run 02/27/01
Georgia Department of Corrections Office of Planning and Analysis
Inmate statistical profile
Sample: ACTIVE PRISONERS SERVING LIFE EXCLUDING JAIL
Requestor:
Active inmates 02/27/2001
Home County by current age & sex
Statistics (CONTINUED)
|
MEN
|
WOMEN
|
| Age | Age | Age | Age | Men
| Age | Age | Age | Age |Women
|Grand
Home County
|00-21 %|22-39 %|40-54 %|55-99 %|Total % |00-21 %|22-39 %|40-54 %|55-99 %|Total % |Total %
------------------------------------------------------------------------------------------------------------------------------------
COOK COUNTY
| 0 0| 6 0| 3 0| 1 0| 10 0 | 0 0| 2 2| 0 0| 0 0| 2 1 | 12 0
COWETA COUNTY
| 3 2| 18 1| 10 1| 1 0| 32 1 | 0 0| 2 2| 1 1| 0 0| 3 1 | 35 1
CRAWFORD COUNTY
| 0 0| 1 0| 1 0| 0 0| 2 0 | 0 0| 0 0| 0 0| 0 0| 0 0 | 2 0
CRISP COUNTY
| 3 2| 13 0| 7 0| 2 1| 25 0 | 0 0| 3 3| 0 0| 0 0| 3 1 | 28 1
DADE COUNTY
| 1 1| 4 0| 2 0| 3 1| 10 0 | 0 0| 0 0| 0 0| 0 0| 0 0 | 10 0
DAWSON COUNTY
| 0 0| 2 0| 1 0| 0 0| 3 0 | 0 0| 0 0| 0 0| 0 0| 0 0 | 3 0
DECATUR COUNTY
| 3 2| 13 0| 5 0| 0 0| 21 0 | 0 0| 0 0| 0 0| 0 0| 0 0 | 21 0
DEKALB COUNTY
| 14 8| 215 8| 126 6| 26 7| 381 7 | 1 10| 4 4| 2 3| 2 8| 9 4 | 390 7
DODGE COUNTY
| 0 0| 7 0| 7 0| 0 0| 14 0 | 0 0| 0 0| 0 0| 0 0| 0 0 | 14 0
DOOLY COUNTY
| 2 1| 7 0| 4 0| 0 0| 13 0 | 0 0| 0 0| 0 0| 0 0| 0 0 | 13 0
DOUGHERTY COUNTY | 5 3| 65 2| 43 2| 2 1| 115 2 | 0 0| 5 4| 1 1| 1 4| 7 3 | 122 2
DOUGLAS COUNTY
| 1 1| 20 1| 13 1| 2 1| 36 1 | 0 0| 1 1| 1 1| 0 0| 2 1 | 38 1
EARLY COUNTY
| 0 0| 7 0| 5 0| 1 0| 13 0 | 0 0| 0 0| 0 0| 0 0| 0 0 | 13 0
ECHOLS COUNTY.
| 0 0| 0 0| 0 0| 0 0| 0 0 | 0 0| 0 0| 0 0| 0 0| 0 0 | 0 0
EFFINGHAM COUNTY | 0 0| 4 0| 3 0| 0 0| 7 0 | 0 0| 0 0| 0 0| 0 0| 0 0 | 7 0
ELBERT COUNTY
| 0 0| 11 0| 9 0| 1 0| 21 0 | 0 0| 1 1| 0 0| 0 0| 1 0 | 22 0
EMANUEL COUNTY
| 1 1| 8 0| 6 0| 2 1| 17 0 | 0 0| 0 0| 1 1| 0 0| 1 0 | 18 0
EVANS COUNTY
| 0 0| 7 0| 4 0| 1 0| 12 0 | 0 0| 0 0| 0 0| 0 0| 0 0 | 12 0
FANNIN COUNTY
| 0 0| 5 0| 3 0| 1 0| 9 0 | 0 0| 0 0| 0 0| 0 0| 0 0 | 9 0
FAYETTE COUNTY
| 0 0| 3 0| 3 0| 0 0| 6 0 | 0 0| 0 0| 0 0| 0 0| 0 0 | 6 0
FLOYD COUNTY
| 2 1| 29 1| 24 1| 1 0| 56 1 | 1 10| 3 3| 2 3| 1 4| 7 3 | 63 1
FORSYTH COUNTY
| 0 0| 6 0| 3 0| 2 1| 11 0 | 0 0| 0 0| 1 1| 0 0| 1 0 | 12 0
FRANKLIN COUNTY
| 0 0| 2 0| 4 0| 0 0| 6 0 | 0 0| 0 0| 0 0| 1 4| 1 0 | 7 0
FULTON COUNTY
| 28 16| 497 18| 359 18| 57 15| 941 18 | 1 10| 14 13| 8 10| 4 16| 27 12 | 968 18
GILMER COUNTY
| 0 0| 1 0| 3 0| 2 1| 6 0 | 0 0| 0 0| 0 0| 0 0| 0 0 | 6 0
GLASCOCK COUNTY
| 0 0| 0 0| 1 0| 0 0| 1 0 | 0 0| 0 0| 0 0| 0 0| 0 0 | 1 0
GLYNN COUNTY
| 5 3| 28 1| 28 1| 4 1| 65 1 | 0 0| 1 1| 2 3| 0 0| 3 1 | 68 1
GORDON COUNTY
| 0 0| 20 1| 12 1| 2 1| 34 1 | 0 0| 0 0| 1 1| 0 0| 1 0 | 35 1
GRADY COUNTY
| 3 2| 13 0| 8 0| 0 0| 24 0 | 0 0| 0 0| 0 0| 0 0| 0 0 | 24 0
GREENE COUNTY
| 0 0| 4 0| 3 0| 1 0| 8 0 | 0 0| 0 0| 1 1| 0 0| 1 0 | 9 0
GWINNETT COUNTY
| 2 1| 63 2| 43 2| 10 3| 118 2 | 0 0| 3 3| 2 3| 0 0| 5 2 | 123 2
HABERSHAM COUNTY | 0 0| 10 0| 7 0| 0 0| 17 0 | 0 0| 0 0| 0 0| 0 0| 0 0 | 17 0
HALL COUNTY
| 2 1| 29 1| 38 2| 10 3| 79 2 | 1 10| 2 2| 1 1| 1 4| 5 2 | 84 2
HANCOCK COUNTY
| 1 1| 2 0| 2 0| 1 0| 6 0 | 0 0| 0 0| 1 1| 0 0| 1 0 | 7 0
HARALSON COUNTY
| 0 0| 1 0| 2 0| 1 0| 4 0 | 0 0| 1 1| 0 0| 0 0| 1 0 | 5 0
------------------------------------------------------------------------------------------------------------------------------------
(continued)
Page 33 Run 02/27/01
Georgia Department of Corrections Office of Planning and Analysis
Inmate statistical profile
Sample: ACTIVE PRISONERS SERVING LIFE EXCLUDING JAIL
Requestor:
Active inmates 02/27/2001
Home County by current age & sex
Statistics (CONTINUED)
|
MEN
|
WOMEN
|
| Age | Age | Age | Age | Men
| Age | Age | Age | Age |Women
|Grand
Home County
|00-21 %|22-39 %|40-54 %|55-99 %|Total % |00-21 %|22-39 %|40-54 %|55-99 %|Total % |Total %
------------------------------------------------------------------------------------------------------------------------------------
HARRIS COUNTY
| 1 1| 6 0| 2 0| 0 0| 9 0 | 0 0| 0 0| 0 0| 0 0| 0 0 | 9 0
HART COUNTY
| 0 0| 2 0| 2 0| 0 0| 4 0 | 0 0| 0 0| 1 1| 0 0| 1 0 | 5 0
HEARD COUNTY
| 0 0| 1 0| 1 0| 2 1| 4 0 | 0 0| 0 0| 0 0| 0 0| 0 0 | 4 0
HENRY COUNTY
| 1 1| 20 1| 9 0| 5 1| 35 1 | 0 0| 1 1| 2 3| 0 0| 3 1 | 38 1
HOUSTON COUNTY
| 1 1| 41 1| 22 1| 5 1| 69 1 | 0 0| 3 3| 4 5| 0 0| 7 3 | 76 1
IRWIN COUNTY
| 1 1| 5 0| 3 0| 0 0| 9 0 | 0 0| 0 0| 0 0| 0 0| 0 0 | 9 0
JACKSON COUNTY
| 1 1| 9 0| 9 0| 7 2| 26 0 | 0 0| 0 0| 0 0| 0 0| 0 0 | 26 0
JASPER COUNTY
| 2 1| 8 0| 1 0| 1 0| 12 0 | 0 0| 0 0| 0 0| 0 0| 0 0 | 12 0
JEFF DAVIS COUNTY | 1 1| 5 0| 2 0| 1 0| 9 0 | 0 0| 0 0| 0 0| 0 0| 0 0 | 9 0
JEFFERSON COUNTY | 0 0| 4 0| 3 0| 2 1| 9 0 | 0 0| 1 1| 0 0| 0 0| 1 0 | 10 0
JENKINS COUNTY
| 0 0| 0 0| 6 0| 0 0| 6 0 | 0 0| 0 0| 0 0| 0 0| 0 0 | 6 0
JOHNSON COUNTY
| 0 0| 3 0| 2 0| 0 0| 5 0 | 0 0| 0 0| 0 0| 0 0| 0 0 | 5 0
JONES COUNTY
| 0 0| 0 0| 4 0| 1 0| 5 0 | 0 0| 1 1| 0 0| 0 0| 1 0 | 6 0
LAMAR COUNTY
| 0 0| 9 0| 9 0| 3 1| 21 0 | 0 0| 0 0| 1 1| 0 0| 1 0 | 22 0
LANIER COUNTY
| 0 0| 0 0| 0 0| 0 0| 0 0 | 0 0| 0 0| 0 0| 0 0| 0 0 | 0 0
LAURENS COUNTY
| 1 1| 15 1| 7 0| 2 1| 25 0 | 0 0| 1 1| 1 1| 0 0| 2 1 | 27 0
LEE COUNTY
| 0 0| 3 0| 0 0| 0 0| 3 0 | 0 0| 0 0| 0 0| 0 0| 0 0 | 3 0
LIBERTY COUNTY
| 0 0| 23 1| 9 0| 4 1| 36 1 | 0 0| 2 2| 0 0| 0 0| 2 1 | 38 1
LINCOLN COUNTY
| 0 0| 2 0| 3 0| 0 0| 5 0 | 0 0| 0 0| 0 0| 0 0| 0 0 | 5 0
LONG COUNTY
| 0 0| 5 0| 2 0| 1 0| 8 0 | 0 0| 1 1| 0 0| 0 0| 1 0 | 9 0
LOWNDES COUNTY
| 0 0| 35 1| 22 1| 3 1| 60 1 | 0 0| 0 0| 2 3| 1 4| 3 1 | 63 1
LUMPKIN COUNTY
| 2 1| 5 0| 4 0| 1 0| 12 0 | 0 0| 0 0| 0 0| 0 0| 0 0 | 12 0
MACON COUNTY
| 0 0| 12 0| 5 0| 0 0| 17 0 | 0 0| 0 0| 1 1| 0 0| 1 0 | 18 0
MADISON COUNTY
| 0 0| 7 0| 6 0| 1 0| 14 0 | 0 0| 2 2| 0 0| 0 0| 2 1 | 16 0
MARION COUNTY
| 0 0| 2 0| 1 0| 0 0| 3 0 | 0 0| 0 0| 0 0| 0 0| 0 0 | 3 0
MCDUFFIE COUNTY
| 0 0| 22 1| 11 1| 4 1| 37 1 | 1 10| 1 1| 0 0| 0 0| 2 1 | 39 1
MCINTOSH COUNTY
| 2 1| 4 0| 3 0| 0 0| 9 0 | 0 0| 0 0| 0 0| 0 0| 0 0 | 9 0
MERIWETHER COUNTY | 1 1| 7 0| 8 0| 2 1| 18 0 | 0 0| 1 1| 0 0| 1 4| 2 1 | 20 0
MILLER COUNTY
| 0 0| 3 0| 3 0| 0 0| 6 0 | 0 0| 0 0| 0 0| 0 0| 0 0 | 6 0
MITCHELL COUNTY
| 0 0| 12 0| 11 1| 3 1| 26 0 | 0 0| 1 1| 0 0| 0 0| 1 0 | 27 0
MONROE COUNTY
| 0 0| 10 0| 4 0| 0 0| 14 0 | 0 0| 0 0| 0 0| 0 0| 0 0 | 14 0
MONTGOMERY COUNTY | 0 0| 0 0| 0 0| 0 0| 0 0 | 0 0| 1 1| 0 0| 0 0| 1 0 | 1 0
MORGAN COUNTY
| 0 0| 8 0| 2 0| 0 0| 10 0 | 0 0| 0 0| 0 0| 0 0| 0 0 | 10 0
MURRAY COUNTY
| 2 1| 5 0| 4 0| 4 1| 15 0 | 0 0| 1 1| 0 0| 0 0| 1 0 | 16 0
MUSCOGEE COUNTY
| 3 2| 73 3| 57 3| 10 3| 143 3 | 0 0| 3 3| 3 4| 0 0| 6 3 | 149 3
------------------------------------------------------------------------------------------------------------------------------------
(continued)
Page 34 Run 02/27/01
Georgia Department of Corrections Office of Planning and Analysis
Inmate statistical profile
Sample: ACTIVE PRISONERS SERVING LIFE EXCLUDING JAIL
Requestor:
Active inmates 02/27/2001
Home County by current age & sex
Statistics (CONTINUED)
|
MEN
|
WOMEN
|
| Age | Age | Age | Age | Men
| Age | Age | Age | Age |Women
|Grand
Home County
|00-21 %|22-39 %|40-54 %|55-99 %|Total % |00-21 %|22-39 %|40-54 %|55-99 %|Total % |Total %
------------------------------------------------------------------------------------------------------------------------------------
NEWTON COUNTY
| 1 1| 37 1| 12 1| 3 1| 53 1 | 0 0| 2 2| 0 0| 1 4| 3 1 | 56 1
OCONEE COUNTY
| 0 0| 3 0| 2 0| 0 0| 5 0 | 0 0| 0 0| 1 1| 0 0| 1 0 | 6 0
OGLETHORPE COUNTY | 0 0| 3 0| 1 0| 0 0| 4 0 | 0 0| 0 0| 0 0| 0 0| 0 0 | 4 0
PAULDING COUNTY
| 0 0| 9 0| 5 0| 2 1| 16 0 | 0 0| 0 0| 1 1| 1 4| 2 1 | 18 0
PEACH COUNTY
| 0 0| 7 0| 2 0| 0 0| 9 0 | 0 0| 1 1| 0 0| 0 0| 1 0 | 10 0
PICKENS COUNTY
| 0 0| 2 0| 1 0| 0 0| 3 0 | 0 0| 0 0| 1 1| 0 0| 1 0 | 4 0
PIERCE COUNTY
| 2 1| 2 0| 2 0| 0 0| 6 0 | 0 0| 0 0| 0 0| 0 0| 0 0 | 6 0
PIKE COUNTY
| 0 0| 1 0| 0 0| 0 0| 1 0 | 0 0| 0 0| 0 0| 0 0| 0 0 | 1 0
POLK COUNTY
| 0 0| 13 0| 5 0| 3 1| 21 0 | 0 0| 0 0| 0 0| 0 0| 0 0 | 21 0
PULASKI COUNTY
| 0 0| 4 0| 3 0| 0 0| 7 0 | 0 0| 1 1| 0 0| 0 0| 1 0 | 8 0
PUTNAM COUNTY
| 0 0| 13 0| 13 1| 2 1| 28 1 | 0 0| 0 0| 0 0| 0 0| 0 0 | 28 1
QUITMAN COUNTY
| 0 0| 2 0| 0 0| 0 0| 2 0 | 0 0| 0 0| 0 0| 0 0| 0 0 | 2 0
RABUN COUNTY
| 0 0| 5 0| 3 0| 0 0| 8 0 | 0 0| 0 0| 0 0| 0 0| 0 0 | 8 0
RANDOLPH COUNTY
| 0 0| 3 0| 2 0| 1 0| 6 0 | 0 0| 0 0| 0 0| 0 0| 0 0 | 6 0
RICHMOND COUNTY
| 12 7| 145 5| 69 4| 8 2| 234 4 | 0 0| 8 7| 7 9| 1 4| 16 7 | 250 5
ROCKDALE COUNTY
| 1 1| 10 0| 7 0| 5 1| 23 0 | 0 0| 1 1| 0 0| 0 0| 1 0 | 24 0
SCHLEY COUNTY
| 0 0| 2 0| 2 0| 0 0| 4 0 | 0 0| 0 0| 0 0| 0 0| 0 0 | 4 0
SCREVEN COUNTY
| 0 0| 3 0| 2 0| 2 1| 7 0 | 0 0| 0 0| 0 0| 0 0| 0 0 | 7 0
SEMINOLE COUNTY
| 1 1| 5 0| 5 0| 1 0| 12 0 | 0 0| 1 1| 0 0| 0 0| 1 0 | 13 0
SPALDING COUNTY
| 4 2| 36 1| 23 1| 5 1| 68 1 | 1 10| 1 1| 1 1| 1 4| 4 2 | 72 1
STEPHENS COUNTY
| 0 0| 5 0| 6 0| 4 1| 15 0 | 0 0| 0 0| 0 0| 0 0| 0 0 | 15 0
STEWART COUNTY
| 0 0| 2 0| 2 0| 0 0| 4 0 | 0 0| 0 0| 0 0| 0 0| 0 0 | 4 0
SUMTER COUNTY
| 0 0| 3 0| 15 1| 2 1| 20 0 | 0 0| 0 0| 1 1| 0 0| 1 0 | 21 0
TALBOT COUNTY
| 2 1| 3 0| 1 0| 0 0| 6 0 | 0 0| 0 0| 1 1| 0 0| 1 0 | 7 0
TALIAFERRO COUNTY | 0 0| 0 0| 1 0| 0 0| 1 0 | 0 0| 0 0| 0 0| 0 0| 0 0 | 1 0
TATTNALL COUNTY
| 0 0| 16 1| 4 0| 0 0| 20 0 | 0 0| 0 0| 1 1| 0 0| 1 0 | 21 0
TAYLOR COUNTY
| 1 1| 10 0| 4 0| 1 0| 16 0 | 0 0| 0 0| 0 0| 0 0| 0 0 | 16 0
TELFAIR COUNTY
| 1 1| 6 0| 3 0| 0 0| 10 0 | 0 0| 0 0| 1 1| 0 0| 1 0 | 11 0
TERRELL COUNTY
| 2 1| 11 0| 1 0| 0 0| 14 0 | 0 0| 0 0| 0 0| 0 0| 0 0 | 14 0
THOMAS COUNTY
| 2 1| 14 1| 16 1| 4 1| 36 1 | 0 0| 1 1| 1 1| 0 0| 2 1 | 38 1
TIFT COUNTY
| 3 2| 28 1| 21 1| 3 1| 55 1 | 0 0| 0 0| 0 0| 1 4| 1 0 | 56 1
TOOMBS COUNTY
| 2 1| 12 0| 11 1| 0 0| 25 0 | 0 0| 1 1| 0 0| 0 0| 1 0 | 26 0
TOWNS COUNTY
| 0 0| 0 0| 0 0| 0 0| 0 0 | 0 0| 0 0| 0 0| 0 0| 0 0 | 0 0
TREUTLEN COUNTY
| 0 0| 2 0| 3 0| 0 0| 5 0 | 0 0| 0 0| 0 0| 0 0| 0 0 | 5 0
TROUP COUNTY
| 2 1| 19 1| 19 1| 5 1| 45 1 | 0 0| 1 1| 1 1| 0 0| 2 1 | 47 1
------------------------------------------------------------------------------------------------------------------------------------
(continued)
Page 35 Run 02/27/01
Georgia Department of Corrections Office of Planning and Analysis
Inmate statistical profile
Sample: ACTIVE PRISONERS SERVING LIFE EXCLUDING JAIL
Requestor:
Active inmates 02/27/2001
Home County by current age & sex
Statistics (CONTINUED)
|
MEN
|
WOMEN
|
| Age | Age | Age | Age | Men
| Age | Age | Age | Age |Women
|Grand
Home County
|00-21 %|22-39 %|40-54 %|55-99 %|Total % |00-21 %|22-39 %|40-54 %|55-99 %|Total % |Total %
------------------------------------------------------------------------------------------------------------------------------------
TURNER COUNTY
| 0 0| 8 0| 4 0| 0 0| 12 0 | 0 0| 0 0| 0 0| 0 0| 0 0 | 12 0
TWIGGS COUNTY
| 0 0| 5 0| 4 0| 0 0| 9 0 | 0 0| 0 0| 0 0| 0 0| 0 0 | 9 0
UNION COUNTY
| 0 0| 0 0| 0 0| 0 0| 0 0 | 0 0| 0 0| 0 0| 0 0| 0 0 | 0 0
UPSON COUNTY
| 1 1| 6 0| 5 0| 0 0| 12 0 | 0 0| 0 0| 1 1| 0 0| 1 0 | 13 0
WALKER COUNTY
| 1 1| 15 1| 6 0| 3 1| 25 0 | 0 0| 1 1| 1 1| 0 0| 2 1 | 27 0
WALTON COUNTY
| 1 1| 29 1| 18 1| 3 1| 51 1 | 0 0| 0 0| 0 0| 0 0| 0 0 | 51 1
WARE COUNTY
| 1 1| 15 1| 14 1| 2 1| 32 1 | 0 0| 0 0| 0 0| 0 0| 0 0 | 32 1
WARREN COUNTY
| 0 0| 3 0| 5 0| 1 0| 9 0 | 0 0| 0 0| 0 0| 0 0| 0 0 | 9 0
WASHINGTON COUNTY | 0 0| 12 0| 8 0| 1 0| 21 0 | 1 10| 1 1| 0 0| 0 0| 2 1 | 23 0
WAYNE COUNTY
| 0 0| 6 0| 12 1| 3 1| 21 0 | 0 0| 1 1| 0 0| 0 0| 1 0 | 22 0
WEBSTER COUNTY
| 0 0| 2 0| 0 0| 0 0| 2 0 | 0 0| 0 0| 0 0| 0 0| 0 0 | 2 0
WHEELER COUNTY
| 0 0| 1 0| 2 0| 2 1| 5 0 | 0 0| 0 0| 0 0| 0 0| 0 0 | 5 0
WHITE COUNTY
| 0 0| 3 0| 2 0| 2 1| 7 0 | 0 0| 0 0| 0 0| 0 0| 0 0 | 7 0
WHITFIELD COUNTY | 0 0| 11 0| 24 1| 6 2| 41 1 | 0 0| 2 2| 0 0| 0 0| 2 1 | 43 1
WILCOX COUNTY
| 0 0| 0 0| 6 0| 0 0| 6 0 | 0 0| 0 0| 0 0| 0 0| 0 0 | 6 0
WILKES COUNTY
| 0 0| 2 0| 4 0| 2 1| 8 0 | 0 0| 0 0| 0 0| 0 0| 0 0 | 8 0
WILKINSON COUNTY | 0 0| 7 0| 2 0| 0 0| 9 0 | 0 0| 0 0| 0 0| 0 0| 0 0 | 9 0
WORTH COUNTY
| 1 1| 13 0| 3 0| 0 0| 17 0 | 0 0| 1 1| 0 0| 0 0| 1 0 | 18 0
OUT OF STATE
| 0 1| 10 0| 57 3| 15 4| 82 2 | 0 0| 0 1| 0 0| 0 0| 0 0 | 82 1
------------------------------------------------------------------------------------------------------------------------------------
Total reported
| 171 100| 2734 100| 1956 100| 381 100| 5242 100 | 10 100| 112 100| 78 100| 25 100| 225 100 | 5467 100
|
|
|
|
|
|
|
|
|
|
|
Percent reported |
93.4|
90.8|
92.4|
91.1|
91.5 |
90.9|
92.6|
90.7|
96.2|
92.2 |
91.5
|
|
|
|
|
|
|
|
|
|
|
|
|
|
|
|
|
|
|
|
|
|
UNKNOWN
| 12 | 276 | 162 | 37 | 487
| 1 | 9 | 8 | 1 | 19
| 506
------------------------------------------------------------------------------------------------------------------------------------
Total
| 183 | 3010 | 2118 | 418 | 5729
| 11 | 121 | 86 | 26 | 244
| 5973
Georgia Department of Corrections
Page 36 Run 02/27/01
Office of Planning and Analysis
Inmate statistical profile
Sample: ACTIVE PRISONERS SERVING LIFE EXCLUDING JAIL
Requestor: Statistics
Active inmates 02/27/2001
Prison Sentence In Years by current age & sex
|
MEN
|
WOMEN
|
| Age | Age | Age | Age | Men
| Age | Age | Age | Age |Women
|Grand
Sentence In Years |00-21 %|22-39 %|40-54 %|55-99 %|Total % |00-21 %|22-39 %|40-54 %|55-99 %|Total % |Total %
------------------------------------------------------------------------------------------------------------------------------------
0-1
| 0 0| 0 0| 0 0| 0 0| 0 0 | 0 0| 0 0| 0 0| 0 0| 0 0 | 0 0
1.1-2
| 0 0| 0 0| 0 0| 0 0| 0 0 | 0 0| 0 0| 0 0| 0 0| 0 0 | 0 0
2.1-3
| 0 0| 0 0| 0 0| 0 0| 0 0 | 0 0| 0 0| 0 0| 0 0| 0 0 | 0 0
3.1-4
| 0 0| 0 0| 0 0| 0 0| 0 0 | 0 0| 0 0| 0 0| 0 0| 0 0 | 0 0
4.1-5
| 0 0| 0 0| 0 0| 0 0| 0 0 | 0 0| 0 0| 0 0| 0 0| 0 0 | 0 0
5.1-6
| 0 0| 0 0| 0 0| 0 0| 0 0 | 0 0| 0 0| 0 0| 0 0| 0 0 | 0 0
6.1-7
| 0 0| 0 0| 0 0| 0 0| 0 0 | 0 0| 0 0| 0 0| 0 0| 0 0 | 0 0
7.1-8
| 0 0| 0 0| 0 0| 0 0| 0 0 | 0 0| 0 0| 0 0| 0 0| 0 0 | 0 0
8.1-9
| 0 0| 0 0| 0 0| 0 0| 0 0 | 0 0| 0 0| 0 0| 0 0| 0 0 | 0 0
9.1-10
| 0 0| 0 0| 0 0| 0 0| 0 0 | 0 0| 0 0| 0 0| 0 0| 0 0 | 0 0
10.1-12
| 0 0| 0 0| 0 0| 0 0| 0 0 | 0 0| 0 0| 0 0| 0 0| 0 0 | 0 0
12.1-15
| 0 0| 0 0| 0 0| 0 0| 0 0 | 0 0| 0 0| 0 0| 0 0| 0 0 | 0 0
15.1-20
| 0 0| 0 0| 0 0| 0 0| 0 0 | 0 0| 0 0| 0 0| 0 0| 0 0 | 0 0
20.1-OVER
| 0 0| 0 0| 0 0| 0 0| 0 0 | 0 0| 0 0| 0 0| 0 0| 0 0 | 0 0
LIFE
| 183 100| 3010 100| 2118 100| 418 100| 5729 100 | 11 100| 121 100| 86 100| 26 100| 244 100 | 5973 100
DEATH
| 0 0| 0 0| 0 0| 0 0| 0 0 | 0 0| 0 0| 0 0| 0 0| 0 0 | 0 0
LIFE W/O PAROLE
| 0 0| 0 0| 0 0| 0 0| 0 0 | 0 0| 0 0| 0 0| 0 0| 0 0 | 0 0
YOUTHFUL OFFENDERS | 0 0| 0 0| 0 0| 0 0| 0 0 | 0 0| 0 0| 0 0| 0 0| 0 0 | 0 0
------------------------------------------------------------------------------------------------------------------------------------
Total reported
| 183 100| 3010 100| 2118 100| 418 100| 5729 100 | 11 100| 121 100| 86 100| 26 100| 244 100 | 5973 100
|
|
|
|
|
|
|
|
|
|
|
Percent reported | 100.0| 100.0| 100.0| 100.0| 100.0 | 100.0| 100.0| 100.0| 100.0| 100.0 | 100.0
|
|
|
|
|
|
|
|
|
|
|
|
|
|
|
|
|
|
|
|
|
|
NOT REPORTED
|0|0|0|0|0
|0|0|0|0|0
|0
------------------------------------------------------------------------------------------------------------------------------------
Total
| 183 | 3010 | 2118 | 418 | 5729
| 11 | 121 | 86 | 26 | 244
| 5973
|
|
|
|
|
|
|
|
|
|
|
|
|
|
|
|
|
|
|
|
|
|
|
|
|
|
|
|
|
|
|
|
|
|
|
|
|
|
|
|
|
|
|
|
|
|
|
|
|
|
|
|
|
|
|
AVG EXCLUDING
|
|
|
|
|
|
|
|
|
|
|
LIFE, DEATH, YO
| .00 | .00 | .00 | .00 | .00 | .00 | .00 | .00 | .00 | .00 | .00
|
|
|
|
|
|
|
|
|
|
|
|
|
|
|
|
|
|
|
|
|
|
|
|
|
|
|
|
|
|
|
|
|
|
|
|
|
|
|
|
|
|
|
|
|
|
|
|
|
|
|
|
|
|
|
AVG INCLUDING
|
|
|
|
|
|
|
|
|
|
|
LIFE=21, YO=3 YRS | 21.00 | 21.00 | 21.00 | 21.00 | 21.00 | 21.00 | 21.00 | 21.00 | 21.00 | 21.00 | 21.00
Page 37 Run 02/27/01
Georgia Department of Corrections Office of Planning and Analysis
Inmate statistical profile
Sample: ACTIVE PRISONERS SERVING LIFE EXCLUDING JAIL
Requestor: Statistics
Active inmates 02/27/2001
Probation To Follow Prison by current age & sex
|
MEN
|
WOMEN
|
| Age | Age | Age | Age | Men
| Age | Age | Age | Age |Women
|Grand
Prob After Prison |00-21 %|22-39 %|40-54 %|55-99 %|Total % |00-21 %|22-39 %|40-54 %|55-99 %|Total % |Total %
------------------------------------------------------------------------------------------------------------------------------------
PROBATION TO FOLLOW | 9 5| 92 3| 63 3| 6 1| 170 3 | 0 0| 3 2| 3 3| 1 4| 7 3 | 177 3
NO PROBATION
| 174 95| 2918 97| 2055 97| 412 99| 5559 97 | 11 100| 118 98| 83 97| 25 96| 237 97 | 5796 97
------------------------------------------------------------------------------------------------------------------------------------
Total reported
| 183 100| 3010 100| 2118 100| 418 100| 5729 100 | 11 100| 121 100| 86 100| 26 100| 244 100 | 5973 100
|
|
|
|
|
|
|
|
|
|
|
Percent reported | 100.0| 100.0| 100.0| 100.0| 100.0 | 100.0| 100.0| 100.0| 100.0| 100.0 | 100.0
|
|
|
|
|
|
|
|
|
|
|
|
|
|
|
|
|
|
|
|
|
|
NOT REPORTED
|0|0|0|0|0
|0|0|0|0|0
|0
------------------------------------------------------------------------------------------------------------------------------------
Total
| 183 | 3010 | 2118 | 418 | 5729
| 11 | 121 | 86 | 26 | 244
| 5973
Page 38 Run 02/27/01
Georgia Department of Corrections Office of Planning and Analysis
Inmate statistical profile
Sample: ACTIVE PRISONERS SERVING LIFE EXCLUDING JAIL
Requestor: Statistics
Active inmates 02/27/2001
Admission Type by current age & sex
|
MEN
|
WOMEN
|
| Age | Age | Age | Age | Men
| Age | Age | Age | Age |Women
|Grand
Admission Type
|00-21 %|22-39 %|40-54 %|55-99 %|Total % |00-21 %|22-39 %|40-54 %|55-99 %|Total % |Total %
------------------------------------------------------------------------------------------------------------------------------------
COMMITTED FROM COURT| 178 97| 2456 82| 1560 74| 301 72| 4495 78 | 11 100| 112 93| 73 85| 26 100| 222 91 | 4717 79
RETURN APPEAL/BOND | 0 0| 1 0| 1 0| 0 0| 2 0 | 0 0| 0 0| 0 0| 0 0| 0 0 | 2 0
PAROLE REV/NEW SENT | 1 1| 351 12| 338 16| 76 18| 766 13 | 0 0| 5 4| 8 9| 0 0| 13 5 | 779 13
PAR REV/NO NEW SENT | 0 0| 20 1| 68 3| 9 2| 97 2 | 0 0| 1 1| 1 1| 0 0| 2 1 | 99 2
PROB VIOL/TOTAL REV | 0 0| 0 0| 0 0| 0 0| 0 0 | 0 0| 0 0| 0 0| 0 0| 0 0 | 0 0
PROB VIOL/PARTIAL | 0 0| 34 1| 43 2| 2 0| 79 1 | 0 0| 0 0| 2 2| 0 0| 2 1 | 81 1
ADMIT FM OTHER CUST | 0 0| 1 0| 2 0| 4 1| 7 0 | 0 0| 0 0| 0 0| 0 0| 0 0 | 7 0
SHOCK INCARCERATION | 0 0| 0 0| 0 0| 0 0| 0 0 | 0 0| 0 0| 0 0| 0 0| 0 0 | 0 0
PROB REV/REMAINDER | 3 2| 111 4| 48 2| 5 1| 167 3 | 0 0| 3 2| 2 2| 0 0| 5 2 | 172 3
NEW SENT/PAR REV PND| 0 0| 2 0| 4 0| 1 0| 7 0 | 0 0| 0 0| 0 0| 0 0| 0 0 | 7 0
LIFE W/O PAROLE
| 1 1| 9 0| 3 0| 0 0| 13 0 | 0 0| 0 0| 0 0| 0 0| 0 0 | 13 0
PAROLE REV BOOT CAMP| 0 0| 2 0| 1 0| 0 0| 3 0 | 0 0| 0 0| 0 0| 0 0| 0 0 | 3 0
PAR REV/RSN UNKNOWN | 0 0| 17 1| 39 2| 20 5| 76 1 | 0 0| 0 0| 0 0| 0 0| 0 0 | 76 1
PROBATION/PAROLE REV| 0 0| 0 0| 0 0| 0 0| 0 0 | 0 0| 0 0| 0 0| 0 0| 0 0 | 0 0
PB PAROLE RESCINDED | 0 0| 0 0| 0 0| 0 0| 0 0 | 0 0| 0 0| 0 0| 0 0| 0 0 | 0 0
PROB REVOC/SPEC COND| 0 0| 0 0| 0 0| 0 0| 0 0 | 0 0| 0 0| 0 0| 0 0| 0 0 | 0 0
PAR REV/REVOC CENTER| 0 0| 5 0| 10 0| 0 0| 15 0 | 0 0| 0 0| 0 0| 0 0| 0 0 | 15 0
INFORMATION ONLY | 0 0| 0 0| 0 0| 0 0| 0 0 | 0 0| 0 0| 0 0| 0 0| 0 0 | 0 0
INCOMPLETE SENT PKG | 0 0| 0 0| 0 0| 0 0| 0 0 | 0 0| 0 0| 0 0| 0 0| 0 0 | 0 0
HANCOCK REVOC CENTER| 0 0| 0 0| 0 0| 0 0| 0 0 | 0 0| 0 0| 0 0| 0 0| 0 0 | 0 0
WHITWORTH DETENTION | 0 0| 0 0| 1 0| 0 0| 1 0 | 0 0| 0 0| 0 0| 0 0| 0 0 | 1 0
DCYS AT RISK
| 0 0| 0 0| 0 0| 0 0| 0 0 | 0 0| 0 0| 0 0| 0 0| 0 0 | 0 0
OTHER
| 0 0| 0 0| 0 0| 0 0| 0 0 | 0 0| 0 0| 0 0| 0 0| 0 0 | 0 0
------------------------------------------------------------------------------------------------------------------------------------
Total reported
| 183 100| 3009 100| 2118 100| 418 100| 5728 100 | 11 100| 121 100| 86 100| 26 100| 244 100 | 5972 100
|
|
|
|
|
|
|
|
|
|
|
Percent reported | 100.0| 100.0| 100.0| 100.0| 100.0 | 100.0| 100.0| 100.0| 100.0| 100.0 | 100.0
|
|
|
|
|
|
|
|
|
|
|
|
|
|
|
|
|
|
|
|
|
|
UNKNOWN
|0|1|0|0|1
|0|0|0|0|0
|1
------------------------------------------------------------------------------------------------------------------------------------
Total
| 183 | 3010 | 2118 | 418 | 5729
| 11 | 121 | 86 | 26 | 244
| 5973
Page 39 Run 02/27/01
Georgia Department of Corrections Office of Planning and Analysis
Inmate statistical profile
Sample: ACTIVE PRISONERS SERVING LIFE EXCLUDING JAIL
Requestor: Statistics
Active inmates 02/27/2001
Release Type by current age & sex
|
MEN
|
WOMEN
|
| Age | Age | Age | Age | Men
| Age | Age | Age | Age |Women
|Grand
Release Type
|00-21 %|22-39 %|40-54 %|55-99 %|Total % |00-21 %|22-39 %|40-54 %|55-99 %|Total % |Total %
------------------------------------------------------------------------------------------------------------------------------------
PAROLE
| 0 0| 1 0| 0 0| 0 0| 1 0 | 0 0| 0 0| 0 0| 0 0| 0 0 | 1 0
Active
| 183 100| 3010 100| 2118 100| 418 100| 5729 100 | 11 100| 121 100| 86 100| 26 100| 244 100 | 5973 100
------------------------------------------------------------------------------------------------------------------------------------
Total
| 183 | 3010 | 2118 | 418 | 5729
| 11 | 121 | 86 | 26 | 244
| 5973
Page 40 Run 02/27/01
Georgia Department of Corrections Office of Planning and Analysis
Inmate statistical profile
Sample: ACTIVE PRISONERS SERVING LIFE EXCLUDING JAIL
Requestor: Statistics
Active inmates 02/27/2001
Inst By Group by current age & sex
|
MEN
|
WOMEN
|
| Age | Age | Age | Age | Men
| Age | Age | Age | Age |Women
|Grand
Inst By Group
|00-21 %|22-39 %|40-54 %|55-99 %|Total % |00-21 %|22-39 %|40-54 %|55-99 %|Total % |Total %
------------------------------------------------------------------------------------------------------------------------------------
County jails
| 0 0| 0 0| 0 0| 0 0| 0 0 | 0 0| 0 0| 0 0| 0 0| 0 0 | 0 0
Transitional centers| 0 0| 16 1| 18 1| 4 1| 38 1 | 0 0| 3 2| 1 1| 1 4| 5 2 | 43 1
County camps
| 0 0| 10 0| 8 0| 3 1| 21 0 | 0 0| 0 0| 0 0| 0 0| 0 0 | 21 0
Inmate boot camps | 0 0| 0 0| 0 0| 0 0| 0 0 | 0 0| 0 0| 0 0| 0 0| 0 0 | 0 0
State prisons
| 183 100| 2878 96| 2012 95| 397 95| 5470 95 | 11 100| 118 98| 85 99| 25 96| 239 98 | 5709 96
Private prisons
| 0 0| 106 4| 79 4| 14 3| 199 3 | 0 0| 0 0| 0 0| 0 0| 0 0 | 199 3
Other
| 0 0| 0 0| 1 0| 0 0| 1 0 | 0 0| 0 0| 0 0| 0 0| 0 0 | 1 0
------------------------------------------------------------------------------------------------------------------------------------
Total reported
| 183 100| 3010 100| 2118 100| 418 100| 5729 100 | 11 100| 121 100| 86 100| 26 100| 244 100 | 5973 100
|
|
|
|
|
|
|
|
|
|
|
Percent reported | 100.0| 100.0| 100.0| 100.0| 100.0 | 100.0| 100.0| 100.0| 100.0| 100.0 | 100.0
|
|
|
|
|
|
|
|
|
|
|
|
|
|
|
|
|
|
|
|
|
|
Not reported
|0|0|0|0|0
|0|0|0|0|0
|0
------------------------------------------------------------------------------------------------------------------------------------
Total
| 183 | 3010 | 2118 | 418 | 5729
| 11 | 121 | 86 | 26 | 244
| 5973
Page 41 Run 02/27/01
Georgia Department of Corrections Office of Planning and Analysis
Inmate statistical profile
Sample: ACTIVE PRISONERS SERVING LIFE EXCLUDING JAIL
Requestor: Statistics
Active inmates 02/27/2001
Institution by current age & sex
|
MEN
|
WOMEN
|
| Age | Age | Age | Age | Men
| Age | Age | Age | Age |Women
|Grand
Institution
|00-21 %|22-39 %|40-54 %|55-99 %|Total % |00-21 %|22-39 %|40-54 %|55-99 %|Total % |Total %
------------------------------------------------------------------------------------------------------------------------------------
Albany Trans Ctr | 0 0| 1 0| 1 0| 0 0| 2 0 | 0 0| 0 0| 0 0| 0 0| 0 0 | 2 0
Atlanta Trans Ctr(M)| 0 0| 11 0| 11 1| 4 1| 26 0 | 0 0| 0 0| 0 0| 0 0| 0 0 | 26 0
Macon Trans Ctr
| 0 0| 3 0| 3 0| 0 0| 6 0 | 0 0| 0 0| 0 0| 0 0| 0 0 | 6 0
Metro Trans Ctr (W) | 0 0| 0 0| 0 0| 0 0| 0 0 | 0 0| 2 2| 1 1| 1 4| 4 2 | 4 0
Savannah Trans Ctr | 0 0| 1 0| 3 0| 0 0| 4 0 | 0 0| 0 0| 0 0| 0 0| 0 0 | 4 0
Savannah Womens TC | 0 0| 0 0| 0 0| 0 0| 0 0 | 0 0| 1 1| 0 0| 0 0| 1 0 | 1 0
Central State Hosp | 0 0| 0 0| 1 0| 0 0| 1 0 | 0 0| 0 0| 0 0| 0 0| 0 0 | 1 0
Carroll County
| 0 0| 0 0| 0 0| 1 0| 1 0 | 0 0| 0 0| 0 0| 0 0| 0 0 | 1 0
Clarke County
| 0 0| 1 0| 0 0| 0 0| 1 0 | 0 0| 0 0| 0 0| 0 0| 0 0 | 1 0
Colquitt County
| 0 0| 0 0| 1 0| 0 0| 1 0 | 0 0| 0 0| 0 0| 0 0| 0 0 | 1 0
Coweta County
| 0 0| 2 0| 1 0| 0 0| 3 0 | 0 0| 0 0| 0 0| 0 0| 0 0 | 3 0
Floyd County
| 0 0| 1 0| 1 0| 0 0| 2 0 | 0 0| 0 0| 0 0| 0 0| 0 0 | 2 0
Hall County
| 0 0| 2 0| 1 0| 0 0| 3 0 | 0 0| 0 0| 0 0| 0 0| 0 0 | 3 0
Jackson County
| 0 0| 1 0| 2 0| 1 0| 4 0 | 0 0| 0 0| 0 0| 0 0| 0 0 | 4 0
Jefferson County | 0 0| 1 0| 1 0| 0 0| 2 0 | 0 0| 0 0| 0 0| 0 0| 0 0 | 2 0
Mitchell County
| 0 0| 0 0| 1 0| 0 0| 1 0 | 0 0| 0 0| 0 0| 0 0| 0 0 | 1 0
Screven County
| 0 0| 1 0| 0 0| 0 0| 1 0 | 0 0| 0 0| 0 0| 0 0| 0 0 | 1 0
Terrell County
| 0 0| 0 0| 0 0| 1 0| 1 0 | 0 0| 0 0| 0 0| 0 0| 0 0 | 1 0
Clayton County
| 0 0| 1 0| 0 0| 0 0| 1 0 | 0 0| 0 0| 0 0| 0 0| 0 0 | 1 0
Ware Prison
| 15 8| 198 7| 104 5| 10 2| 327 6 | 0 0| 0 0| 0 0| 0 0| 0 0 | 327 5
Lowndes Prison
| 0 0| 3 0| 7 0| 2 0| 12 0 | 0 0| 0 0| 0 0| 0 0| 0 0 | 12 0
Dodge Prison
| 0 0| 68 2| 72 3| 7 2| 147 3 | 0 0| 0 0| 0 0| 0 0| 0 0 | 147 2
Phillips Prison
| 4 2| 129 4| 94 4| 22 5| 249 4 | 0 0| 0 0| 0 0| 0 0| 0 0 | 249 4
Walker Prison
| 0 0| 22 1| 26 1| 4 1| 52 1 | 0 0| 0 0| 0 0| 0 0| 0 0 | 52 1
Wayne Prison
| 0 0| 2 0| 5 0| 0 0| 7 0 | 0 0| 0 0| 0 0| 0 0| 0 0 | 7 0
Arrendale Prison | 46 25| 108 4| 28 1| 2 0| 184 3 | 0 0| 0 0| 0 0| 0 0| 0 0 | 184 3
Montgomery Prison | 0 0| 15 0| 13 1| 3 1| 31 1 | 0 0| 0 0| 0 0| 0 0| 0 0 | 31 1
Lee Prison
| 1 1| 20 1| 20 1| 1 0| 42 1 | 0 0| 0 0| 0 0| 0 0| 0 0 | 42 1
Putnam Prison
| 0 0| 5 0| 0 0| 0 0| 5 0 | 0 0| 0 0| 0 0| 0 0| 0 0 | 5 0
Georgia State Prison| 3 2| 262 9| 211 10| 18 4| 494 9 | 0 0| 0 0| 0 0| 0 0| 0 0 | 494 8
Mens Prison
| 0 0| 14 0| 39 2| 72 17| 125 2 | 0 0| 0 0| 0 0| 0 0| 0 0 | 125 2
Jackson Prison-Diag | 8 4| 28 1| 12 1| 3 1| 51 1 | 0 0| 0 0| 0 0| 0 0| 0 0 | 51 1
Jackson Prison-Perm | 0 0| 3 0| 1 0| 0 0| 4 0 | 0 0| 0 0| 0 0| 0 0| 0 0 | 4 0
Coastal Prison
| 16 9| 37 1| 18 1| 2 0| 73 1 | 0 0| 0 0| 0 0| 0 0| 0 0 | 73 1
Scott Prison
| 0 0| 73 2| 55 3| 10 2| 138 2 | 0 0| 0 0| 0 0| 0 0| 0 0 | 138 2
Rivers Prison
| 0 0| 72 2| 70 3| 10 2| 152 3 | 0 0| 0 0| 0 0| 0 0| 0 0 | 152 3
------------------------------------------------------------------------------------------------------------------------------------
(continued)
Page 42 Run 02/27/01
Georgia Department of Corrections Office of Planning and Analysis
Inmate statistical profile
Sample: ACTIVE PRISONERS SERVING LIFE EXCLUDING JAIL
Requestor:
Active inmates 02/27/2001
Institution by current age & sex
Statistics (CONTINUED)
|
MEN
|
WOMEN
|
| Age | Age | Age | Age | Men
| Age | Age | Age | Age |Women
|Grand
Institution
|00-21 %|22-39 %|40-54 %|55-99 %|Total % |00-21 %|22-39 %|40-54 %|55-99 %|Total % |Total %
------------------------------------------------------------------------------------------------------------------------------------
Rutledge Prison
| 0 0| 36 1| 52 2| 16 4| 104 2 | 0 0| 0 0| 0 0| 0 0| 0 0 | 104 2
Central Prison
| 0 0| 76 3| 108 5| 19 5| 203 4 | 0 0| 0 0| 0 0| 0 0| 0 0 | 203 3
Augusta Med Prison | 1 1| 92 3| 78 4| 29 7| 200 3 | 0 0| 0 0| 0 0| 0 0| 0 0 | 200 3
Rogers Prison
| 0 0| 24 1| 18 1| 1 0| 43 1 | 0 0| 0 0| 0 0| 0 0| 0 0 | 43 1
Burruss Prison
| 0 0| 3 0| 10 0| 2 0| 15 0 | 0 0| 0 0| 0 0| 0 0| 0 0 | 15 0
Bostick Prison
| 0 0| 10 0| 26 1| 27 6| 63 1 | 0 0| 0 0| 0 0| 0 0| 0 0 | 63 1
Valdosta Prison
| 6 3| 142 5| 100 5| 16 4| 264 5 | 0 0| 0 0| 0 0| 0 0| 0 0 | 264 4
Hays Prison
| 6 3| 158 5| 108 5| 17 4| 289 5 | 0 0| 0 0| 0 0| 0 0| 0 0 | 289 5
Hancock Prison
| 9 5| 221 7| 124 6| 19 5| 373 7 | 0 0| 0 0| 0 0| 0 0| 0 0 | 373 6
Telfair Prison
| 11 6| 226 8| 98 5| 11 3| 346 6 | 0 0| 0 0| 0 0| 0 0| 0 0 | 346 6
Autry Prison
| 9 5| 127 4| 106 5| 18 4| 260 5 | 0 0| 0 0| 0 0| 0 0| 0 0 | 260 4
Wilcox Prison
| 0 0| 61 2| 70 3| 5 1| 136 2 | 0 0| 0 0| 0 0| 0 0| 0 0 | 136 2
Calhoun Prison
| 11 6| 82 3| 60 3| 7 2| 160 3 | 0 0| 0 0| 0 0| 0 0| 0 0 | 160 3
Dooly Prison
| 0 0| 50 2| 74 3| 6 1| 130 2 | 0 0| 0 0| 0 0| 0 0| 0 0 | 130 2
Macon Prison
| 20 11| 279 9| 105 5| 25 6| 429 7 | 0 0| 0 0| 0 0| 0 0| 0 0 | 429 7
Smith Prison
| 14 8| 202 7| 74 3| 10 2| 300 5 | 0 0| 0 0| 0 0| 0 0| 0 0 | 300 5
Homerville Prison | 0 0| 1 0| 4 0| 0 0| 5 0 | 0 0| 0 0| 0 0| 0 0| 0 0 | 5 0
Washingtn Women Pris| 0 0| 0 0| 0 0| 0 0| 0 0 | 2 18| 28 23| 27 31| 9 35| 66 27 | 66 1
Baldwin Prison
| 3 2| 24 1| 21 1| 3 1| 51 1 | 0 0| 0 0| 0 0| 0 0| 0 0 | 51 1
Metro Womens Prison | 0 0| 0 0| 0 0| 0 0| 0 0 | 2 18| 26 21| 28 33| 7 27| 63 26 | 63 1
Pulaski Womens Pris | 0 0| 0 0| 0 0| 0 0| 0 0 | 7 64| 64 53| 30 35| 9 35| 110 45 | 110 2
Pelham PreTrans Unit| 0 0| 3 0| 1 0| 0 0| 4 0 | 0 0| 0 0| 0 0| 0 0| 0 0 | 4 0
West Central Prison | 0 0| 2 0| 0 0| 0 0| 2 0 | 0 0| 0 0| 0 0| 0 0| 0 0 | 2 0
D Ray James Prison | 0 0| 36 1| 26 1| 5 1| 67 1 | 0 0| 0 0| 0 0| 0 0| 0 0 | 67 1
Coffee Corr Facility| 0 0| 32 1| 23 1| 5 1| 60 1 | 0 0| 0 0| 0 0| 0 0| 0 0 | 60 1
Wheeler Corr Facilty| 0 0| 38 1| 30 1| 4 1| 72 1 | 0 0| 0 0| 0 0| 0 0| 0 0 | 72 1
------------------------------------------------------------------------------------------------------------------------------------
Total reported
| 183 100| 3010 100| 2118 100| 418 100| 5729 100 | 11 100| 121 100| 86 100| 26 100| 244 100 | 5973 100
|
|
|
|
|
|
|
|
|
|
|
Percent reported | 100.0| 100.0| 100.0| 100.0| 100.0 | 100.0| 100.0| 100.0| 100.0| 100.0 | 100.0
|
|
|
|
|
|
|
|
|
|
|
|
|
|
|
|
|
|
|
|
|
|
Not Reported
|0|0|0|0|0
|0|0|0|0|0
|0
------------------------------------------------------------------------------------------------------------------------------------
Total
| 183 | 3010 | 2118 | 418 | 5729
| 11 | 121 | 86 | 26 | 244
| 5973
Page 43 Run 02/27/01
Georgia Department of Corrections Office of Planning and Analysis
Inmate statistical profile
Sample: ACTIVE PRISONERS SERVING LIFE EXCLUDING JAIL
Requestor: Statistics
Active inmates 02/27/2001
Misdemeanors And Felonies by current age & sex
|
MEN
|
WOMEN
|
| Age | Age | Age | Age | Men
| Age | Age | Age | Age |Women
|Grand
Crime Type
|00-21 %|22-39 %|40-54 %|55-99 %|Total % |00-21 %|22-39 %|40-54 %|55-99 %|Total % |Total %
------------------------------------------------------------------------------------------------------------------------------------
MISDEMEANOR
| 0 0| 0 0| 0 0| 0 0| 0 0 | 0 0| 0 0| 0 0| 0 0| 0 0 | 0 0
FELONY
| 183 100| 3010 100| 2118 100| 418 100| 5729 100 | 11 100| 121 100| 86 100| 26 100| 244 100 | 5973 100
------------------------------------------------------------------------------------------------------------------------------------
Total reported
| 183 100| 3010 100| 2118 100| 418 100| 5729 100 | 11 100| 121 100| 86 100| 26 100| 244 100 | 5973 100
|
|
|
|
|
|
|
|
|
|
|
Percent reported | 100.0| 100.0| 100.0| 100.0| 100.0 | 100.0| 100.0| 100.0| 100.0| 100.0 | 100.0
|
|
|
|
|
|
|
|
|
|
|
|
|
|
|
|
|
|
|
|
|
|
NOT REPORTED
|0|0|0|0|0
|0|0|0|0|0
|0
------------------------------------------------------------------------------------------------------------------------------------
Total
| 183 | 3010 | 2118 | 418 | 5729
| 11 | 121 | 86 | 26 | 244
| 5973
Page 44 Run 02/27/01
Georgia Department of Corrections Office of Planning and Analysis
Inmate statistical profile
Sample: ACTIVE PRISONERS SERVING LIFE EXCLUDING JAIL
Requestor: Statistics
Active inmates 02/27/2001
Crimes By Group by current age & sex
|
MEN
|
WOMEN
|
| Age | Age | Age | Age | Men
| Age | Age | Age | Age |Women
|Grand
Crimes By Group
|00-21 %|22-39 %|40-54 %|55-99 %|Total % |00-21 %|22-39 %|40-54 %|55-99 %|Total % |Total %
------------------------------------------------------------------------------------------------------------------------------------
HOMICIDE
| 131 72| 1882 63| 1246 59| 315 75| 3574 62 | 11 100| 106 88| 69 80| 26 100| 212 87 | 3786 63
ABORTION
| 0 0| 0 0| 0 0| 0 0| 0 0 | 0 0| 0 0| 0 0| 0 0| 0 0 | 0 0
BODILY INJRY&REL OFF| 17 9| 182 6| 105 5| 5 1| 309 5 | 0 0| 2 2| 5 6| 0 0| 7 3 | 316 5
ARSON & REL OFF
| 0 0| 1 0| 0 0| 0 0| 1 0 | 0 0| 0 0| 0 0| 0 0| 0 0 | 1 0
DAMAGE OF PROPERTY | 0 0| 1 0| 0 0| 0 0| 1 0 | 0 0| 0 0| 0 0| 0 0| 0 0 | 1 0
BURGLARY & REL OFF | 0 0| 17 1| 6 0| 0 0| 23 0 | 0 0| 0 0| 1 1| 0 0| 1 0 | 24 0
FORGERY & REL OFF | 0 0| 5 0| 4 0| 0 0| 9 0 | 0 0| 0 0| 0 0| 0 0| 0 0 | 9 0
THEFT
| 0 0| 7 0| 5 0| 0 0| 12 0 | 0 0| 0 0| 0 0| 0 0| 0 0 | 12 0
ROBBERY
| 23 13| 352 12| 244 12| 31 7| 650 11 | 0 0| 2 2| 1 1| 0 0| 3 1 | 653 11
SEXUAL OFFENSES
| 10 5| 326 11| 365 17| 55 13| 756 13 | 0 0| 0 0| 2 2| 0 0| 2 1 | 758 13
OBSCENITY CRIMES | 0 0| 0 0| 0 0| 0 0| 0 0 | 0 0| 0 0| 0 0| 0 0| 0 0 | 0 0
TREASON & REL OFF | 0 0| 0 0| 0 0| 0 0| 0 0 | 0 0| 0 0| 0 0| 0 0| 0 0 | 0 0
CRIMES INVOLVNG GOVT| 0 0| 7 0| 5 0| 1 0| 13 0 | 0 0| 0 0| 0 0| 0 0| 0 0 | 13 0
FALSIFICATIONS
| 0 0| 0 0| 0 0| 0 0| 0 0 | 0 0| 0 0| 0 0| 0 0| 0 0 | 0 0
OBSTRUCT LAW ENFORCE| 0 0| 0 0| 2 0| 0 0| 2 0 | 0 0| 0 0| 0 0| 0 0| 0 0 | 2 0
DISORDERLY CONDUCT | 0 0| 0 0| 0 0| 0 0| 0 0 | 0 0| 0 0| 0 0| 0 0| 0 0 | 0 0
GAMBLING & REL OFF | 0 0| 0 0| 0 0| 0 0| 0 0 | 0 0| 0 0| 0 0| 0 0| 0 0 | 0 0
CRUELTY TO CHILDREN | 0 0| 0 0| 0 0| 0 0| 0 0 | 0 0| 0 0| 0 0| 0 0| 0 0 | 0 0
CRIMES WITH GUNS | 0 0| 0 0| 1 0| 0 0| 1 0 | 0 0| 0 0| 0 0| 0 0| 0 0 | 1 0
INVASION PRIVACY | 0 0| 0 0| 0 0| 0 0| 0 0 | 0 0| 0 0| 0 0| 0 0| 0 0 | 0 0
RACKETEERING
| 0 0| 0 0| 0 0| 0 0| 0 0 | 0 0| 0 0| 0 0| 0 0| 0 0 | 0 0
DRUG ABUSE OFFENSES | 1 1| 210 7| 128 6| 9 2| 348 6 | 0 0| 11 9| 8 9| 0 0| 19 8 | 367 6
DRUG TRAFFICKING | 0 0| 17 1| 6 0| 1 0| 24 0 | 0 0| 0 0| 0 0| 0 0| 0 0 | 24 0
AUTO CRIMES
| 0 0| 0 0| 0 0| 0 0| 0 0 | 0 0| 0 0| 0 0| 0 0| 0 0 | 0 0
REVENUE & CONTRABAND| 0 0| 0 0| 0 0| 0 0| 0 0 | 0 0| 0 0| 0 0| 0 0| 0 0 | 0 0
CRIMES OF OTH STATES| 0 0| 0 0| 0 0| 0 0| 0 0 | 0 0| 0 0| 0 0| 0 0| 0 0 | 0 0
MISC. FELONIES
| 0 0| 1 0| 0 0| 1 0| 2 0 | 0 0| 0 0| 0 0| 0 0| 0 0 | 2 0
MISDEMEANORS
| 0 0| 0 0| 0 0| 0 0| 0 0 | 0 0| 0 0| 0 0| 0 0| 0 0 | 0 0
------------------------------------------------------------------------------------------------------------------------------------
Total reported
| 182 100| 3008 100| 2117 100| 418 100| 5725 100 | 11 100| 121 100| 86 100| 26 100| 244 100 | 5969 100
|
|
|
|
|
|
|
|
|
|
|
Percent reported |
99.5|
99.9| 100.0| 100.0|
99.9 | 100.0| 100.0| 100.0| 100.0| 100.0 |
99.9
|
|
|
|
|
|
|
|
|
|
|
|
|
|
|
|
|
|
|
|
|
|
NOT REPORTED
|1|2|1|0|4
|0|0|0|0|0
|4
------------------------------------------------------------------------------------------------------------------------------------
Total
| 183 | 3010 | 2118 | 418 | 5729
| 11 | 121 | 86 | 26 | 244
| 5973
Page 45 Run 02/27/01
Georgia Department of Corrections Office of Planning and Analysis
Inmate statistical profile
Sample: ACTIVE PRISONERS SERVING LIFE EXCLUDING JAIL
Requestor: Statistics
Active inmates 02/27/2001
Most Serious Offense by current age & sex
|
MEN
|
WOMEN
|
| Age | Age | Age | Age | Men
| Age | Age | Age | Age |Women
|Grand
Most Serious Offense|00-21 %|22-39 %|40-54 %|55-99 %|Total % |00-21 %|22-39 %|40-54 %|55-99 %|Total % |Total %
------------------------------------------------------------------------------------------------------------------------------------
Misdemeanors
|
|
|
------------------------------------------------------------------------------------------------------------------------------------
------------------------------------------------------------------------------------------------------------------------------------
------------------------------------------------------------------------------------------------------------------------------------
FELONIES
|
|
|
------------------------------------------------------------------------------------------------------------------------------------
------------------------------------------------------------------------------------------------------------------------------------
MISC. HOMICIDE OFFEN| 1 1| 2 0| 1 0| 0 0| 4 0 | 0 0| 0 0| 0 0| 0 0| 0 0 | 4 0
MURDER
| 131 72| 1881 62| 1246 59| 314 75| 3572 62 | 11 100| 106 88| 69 80| 26 100| 212 87 | 3784 63
VOLUNTARY MANSLAUGHT| 0 0| 1 0| 0 0| 1 0| 2 0 | 0 0| 0 0| 0 0| 0 0| 0 0 | 2 0
AGGRAVATED ASSAULT | 0 0| 7 0| 1 0| 0 0| 8 0 | 0 0| 0 0| 0 0| 0 0| 0 0 | 8 0
AGGRAVATED BATTERY | 0 0| 1 0| 0 0| 0 0| 1 0 | 0 0| 0 0| 0 0| 0 0| 0 0 | 1 0
KIDNAPPING
| 17 9| 174 6| 102 5| 5 1| 298 5 | 0 0| 2 2| 5 6| 0 0| 7 3 | 305 5
AGG ASSLT ON POLICE | 0 0| 0 0| 2 0| 0 0| 2 0 | 0 0| 0 0| 0 0| 0 0| 0 0 | 2 0
SECOND DEGREE ARSON | 0 0| 1 0| 0 0| 0 0| 1 0 | 0 0| 0 0| 0 0| 0 0| 0 0 | 1 0
CRIM. DAMAGE 2ND DEG| 0 0| 1 0| 0 0| 0 0| 1 0 | 0 0| 0 0| 0 0| 0 0| 0 0 | 1 0
BURGLARY
| 0 0| 17 1| 6 0| 0 0| 23 0 | 0 0| 0 0| 1 1| 0 0| 1 0 | 24 0
FORGERY 1ST DEGREE | 0 0| 5 0| 4 0| 0 0| 9 0 | 0 0| 0 0| 0 0| 0 0| 0 0 | 9 0
THEFT BY TAKING
| 0 0| 2 0| 3 0| 0 0| 5 0 | 0 0| 0 0| 0 0| 0 0| 0 0 | 5 0
THEFT BY REC STOLEN | 0 0| 3 0| 1 0| 0 0| 4 0 | 0 0| 0 0| 0 0| 0 0| 0 0 | 4 0
THEFT BY CONVERSION | 0 0| 1 0| 1 0| 0 0| 2 0 | 0 0| 0 0| 0 0| 0 0| 0 0 | 2 0
THEFT OF MOTOR VEH, | 0 0| 1 0| 0 0| 0 0| 1 0 | 0 0| 0 0| 0 0| 0 0| 0 0 | 1 0
ROBBERY
| 0 0| 5 0| 6 0| 4 1| 15 0 | 0 0| 0 0| 0 0| 0 0| 0 0 | 15 0
ARMED ROBBERY
| 22 12| 347 12| 238 11| 27 6| 634 11 | 0 0| 2 2| 1 1| 0 0| 3 1 | 637 11
CRMNL ATMPT ARMED RO| 1 1| 0 0| 0 0| 0 0| 1 0 | 0 0| 0 0| 0 0| 0 0| 0 0 | 1 0
MISC. SEXUAL
| 0 0| 1 0| 0 0| 0 0| 1 0 | 0 0| 0 0| 0 0| 0 0| 0 0 | 1 0
RAPE
| 10 5| 304 10| 331 16| 43 10| 688 12 | 0 0| 0 0| 2 2| 0 0| 2 1 | 690 12
AGGRAVATED SODOMY | 0 0| 15 0| 21 1| 9 2| 45 1 | 0 0| 0 0| 0 0| 0 0| 0 0 | 45 1
CHILD MOLESTATION | 0 0| 2 0| 3 0| 1 0| 6 0 | 0 0| 0 0| 0 0| 0 0| 0 0 | 6 0
AGGRAV. CHILD MOLEST| 0 0| 4 0| 10 0| 2 0| 16 0 | 0 0| 0 0| 0 0| 0 0| 0 0 | 16 0
OBSTR OF LAW ENF OFF| 0 0| 7 0| 5 0| 1 0| 13 0 | 0 0| 0 0| 0 0| 0 0| 0 0 | 13 0
ESCAPE
| 0 0| 0 0| 2 0| 0 0| 2 0 | 0 0| 0 0| 0 0| 0 0| 0 0 | 2 0
POSS OF CERTAIN WEAP| 0 0| 0 0| 1 0| 0 0| 1 0 | 0 0| 0 0| 0 0| 0 0| 0 0 | 1 0
S/D NARCOTICS, OPIAT| 0 0| 10 0| 13 1| 2 0| 25 0 | 0 0| 0 0| 1 1| 0 0| 1 0 | 26 0
S/D DEP,STIM,CNTRF D| 0 0| 4 0| 2 0| 0 0| 6 0 | 0 0| 0 0| 0 0| 0 0| 0 0 | 6 0
SALE/DIST OF MARIJUA| 0 0| 6 0| 5 0| 1 0| 12 0 | 0 0| 0 0| 0 0| 0 0| 0 0 | 12 0
------------------------------------------------------------------------------------------------------------------------------------
(continued)
Page 46 Run 02/27/01
Georgia Department of Corrections Office of Planning and Analysis
Inmate statistical profile
Sample: ACTIVE PRISONERS SERVING LIFE EXCLUDING JAIL
Requestor:
Active inmates 02/27/2001
Most Serious Offense by current age & sex
Statistics (CONTINUED)
|
MEN
|
WOMEN
|
| Age | Age | Age | Age | Men
| Age | Age | Age | Age |Women
|Grand
Most Serious Offense|00-21 %|22-39 %|40-54 %|55-99 %|Total % |00-21 %|22-39 %|40-54 %|55-99 %|Total % |Total %
------------------------------------------------------------------------------------------------------------------------------------
POSS NARCOTICS, OPIA| 0 0| 4 0| 3 0| 0 0| 7 0 | 0 0| 0 0| 0 0| 0 0| 0 0 | 7 0
POSS DEP,STIM,CNTRF | 0 0| 0 0| 1 0| 0 0| 1 0 | 0 0| 0 0| 0 0| 0 0| 0 0 | 1 0
VIOLATE GA CNTRL SBS| 0 0| 15 0| 6 0| 0 0| 21 0 | 0 0| 1 1| 1 1| 0 0| 2 1 | 23 0
UNLWFL MFG/DEL/DIST | 0 0| 5 0| 1 0| 0 0| 6 0 | 0 0| 0 0| 0 0| 0 0| 0 0 | 6 0
SALE/DIST CONT SUB P| 0 0| 3 0| 1 0| 0 0| 4 0 | 0 0| 0 0| 0 0| 0 0| 0 0 | 4 0
SALE/DIST CONT SUB S| 0 0| 1 0| 0 0| 0 0| 1 0 | 0 0| 0 0| 0 0| 0 0| 0 0 | 1 0
SALE/DISTRIBUTION CO| 1 1| 137 5| 82 4| 3 1| 223 4 | 0 0| 10 8| 6 7| 0 0| 16 7 | 239 4
POSSESSION OF COCAIN| 0 0| 25 1| 14 1| 3 1| 42 1 | 0 0| 0 0| 0 0| 0 0| 0 0 | 42 1
COCAINE LESS 200 GRA| 0 0| 11 0| 6 0| 1 0| 18 0 | 0 0| 0 0| 0 0| 0 0| 0 0 | 18 0
COCAINE 401 OR MORE | 0 0| 5 0| 0 0| 0 0| 5 0 | 0 0| 0 0| 0 0| 0 0| 0 0 | 5 0
ATT/CONSPRCY COMMT C| 0 0| 1 0| 0 0| 0 0| 1 0 | 0 0| 0 0| 0 0| 0 0| 0 0 | 1 0
CONSPIRACY
| 0 0| 1 0| 0 0| 0 0| 1 0 | 0 0| 0 0| 0 0| 0 0| 0 0 | 1 0
CRIMINAL ATTEMPT | 0 0| 0 0| 0 0| 1 0| 1 0 | 0 0| 0 0| 0 0| 0 0| 0 0 | 1 0
------------------------------------------------------------------------------------------------------------------------------------
Total reported
| 183 100| 3010 100| 2118 100| 418 100| 5729 100 | 11 100| 121 100| 86 100| 26 100| 244 100 | 5973 100
|
|
|
|
|
|
|
|
|
|
|
Percent reported | 100.0| 100.0| 100.0| 100.0| 100.0 | 100.0| 100.0| 100.0| 100.0| 100.0 | 100.0
|
|
|
|
|
|
|
|
|
|
|
|
|
|
|
|
|
|
|
|
|
|
NOT REPORTED
|0|0|0|0|0
|0|0|0|0|0
|0
------------------------------------------------------------------------------------------------------------------------------------
Total
| 183 | 3010 | 2118 | 418 | 5729
| 11 | 121 | 86 | 26 | 244
| 5973
Page 47 Run 02/27/01
Georgia Department of Corrections Office of Planning and Analysis
Inmate statistical profile
Sample: ACTIVE PRISONERS SERVING LIFE EXCLUDING JAIL
Requestor: Statistics
Active inmates 02/27/2001
Most Serious Crime Type by current age & sex
|
MEN
|
WOMEN
|
| Age | Age | Age | Age | Men
| Age | Age | Age | Age |Women
|Grand
Crime Type
|00-21 %|22-39 %|40-54 %|55-99 %|Total % |00-21 %|22-39 %|40-54 %|55-99 %|Total % |Total %
------------------------------------------------------------------------------------------------------------------------------------
VIOL/PERSN
| 172 94| 2418 80| 1596 75| 351 84| 4537 79 | 11 100| 110 91| 75 87| 26 100| 222 91 | 4759 80
NVIOL/PERS
| 0 0| 0 0| 0 0| 0 0| 0 0 | 0 0| 0 0| 0 0| 0 0| 0 0 | 0 0
PROPERTY
| 0 0| 31 1| 15 1| 0 0| 46 1 | 0 0| 0 0| 1 1| 0 0| 1 0 | 47 1
DRUG SALES
| 1 1| 183 6| 110 5| 7 2| 301 5 | 0 0| 10 8| 7 8| 0 0| 17 7 | 318 5
DRUG POSSN
| 0 0| 44 1| 24 1| 3 1| 71 1 | 0 0| 1 1| 1 1| 0 0| 2 1 | 73 1
ALCOHOL
| 0 0| 0 0| 0 0| 0 0| 0 0 | 0 0| 0 0| 0 0| 0 0| 0 0 | 0 0
HABIT/DUI
| 0 0| 0 0| 0 0| 0 0| 0 0 | 0 0| 0 0| 0 0| 0 0| 0 0 | 0 0
SEX OFFEND
| 10 5| 326 11| 365 17| 55 13| 756 13 | 0 0| 0 0| 2 2| 0 0| 2 1 | 758 13
OTHER
| 0 0| 8 0| 8 0| 2 0| 18 0 | 0 0| 0 0| 0 0| 0 0| 0 0 | 18 0
------------------------------------------------------------------------------------------------------------------------------------
Total reported
| 183 100| 3010 100| 2118 100| 418 100| 5729 100 | 11 100| 121 100| 86 100| 26 100| 244 100 | 5973 100
|
|
|
|
|
|
|
|
|
|
|
Percent reported | 100.0| 100.0| 100.0| 100.0| 100.0 | 100.0| 100.0| 100.0| 100.0| 100.0 | 100.0
|
|
|
|
|
|
|
|
|
|
|
|
|
|
|
|
|
|
|
|
|
|
NOT REPORTED
|0|0|0|0|0
|0|0|0|0|0
|0
------------------------------------------------------------------------------------------------------------------------------------
Total
| 183 | 3010 | 2118 | 418 | 5729
| 11 | 121 | 86 | 26 | 244
| 5973