- Collection:
- Georgia Government Publications
- Title:
- Inmate statistical profile: active lifers, Dec. 2001
- Creator:
- Georgia. Department of Corrections. Planning and Analysis Section
- Publisher:
- Atlanta, GA. : Georgia Dept. of Corrections, Office of Planning and Analysis, 2001-12
- Date of Original:
- 2001-12
- Subject:
- Prisoners--Georgia
- Location:
- United States, Georgia, 32.75042, -83.50018
- Medium:
- state government records
- Type:
- Text
- Format:
- application/pdf
- External Identifiers:
- Call Number GA R300.P5 P1 L5 2001/12
- Metadata URL:
- https://dlg.galileo.usg.edu/id:dlg_ggpd_i-ga-br300-pp5-bp1-bl5-b2001-s12-belec-p-btext
- Digital Object URL:
- https://dlg.galileo.usg.edu/do:dlg_ggpd_i-ga-br300-pp5-bp1-bl5-b2001-s12-belec-p-btext
- Language:
- eng
- Holding Institution:
- University of Georgia. Map and Government Information Library
- Rights:
-

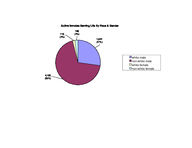
Active Inmates Serving Life By Race & Gender
115 (2%)
129 (2%)
1,641 (27%)
4,153 (69%)
white male non-white male white female non-white female
Number of Inmates
Prior Incarcerations of Active Inmates Serving A Life Sentence
4000 3500 3000 2500 2000 1500 1000
500 0
3,652 (60%)
zero
1,215 (20%)
one
628 (10%)
330 (5%)
two
three
Priors
136 (2%)
four
77 (1%)
five or more
Active Inmates Serving Life By Crime Type
63 (1%)
768 (13%)
15 (<1%)
256 (4%)
43 (1%)
4,893 (81%)
viol/persn
property
drug sales
drug possn
sex offend
other
Georgia Department of Corrections
Page 1 Run 12/21/01
Office of Planning and Analysis
Inmate statistical profile TABLE OF CONTENTS FOR ACTIVE PRISONERS SERVING LIFE EXCLUDING JAIL
Title
PAGE
-----
----
RACE AND SEX............................ 2
Culture Fair IQ Scores.................. 3
Self-Rpt Socioeconomic Class............ 4
Self-Rpt Environment To Age 16.......... 5
Self-Rpt Education Level................ 6
Functional Reading Level (WRAT Scores).. 7
Functional Math Level (WRAT Scores)..... 8
Functional Spelling Level (WRAT Scores). 9
Self-Rpt Guardian Status To Age 16......10
Self-Rpt Employment Status Before Prison11
Self-Rpt Marital Status At Admission....12
Self-Rpt Number Of Children At Admission13
Self-Rpt Religious Affiliation..........14
Self-Rpt Family Behavior Patterns *.....15
Inmate Diagnostic Behavior Problem *....16
Physical Profile (General Condition)....17
Security Status.........................18
Number Of Sentences.....................19
Number Of Disciplinaries................20
Number Of Escapes.......................21
Number Of Prior Georgia Incarcerations *22
Number Of Transfers.....................23
County Of Conviction....................24
Circ Of Conviction......................29
Home County.............................31
Prison Sentence In Years................36
Probation To Follow Prison..............37
Admission Type..........................38
Release Type............................39
Inst By Group...........................40
Institution.............................41
Misdemeanors And Felonies...............43
Crimes By Group.........................44
Most Serious Offense....................45
Most Serious Crime Type.................47
Georgia Department of Corrections
Page 2 Run 12/21/01
Office of Planning and Analysis
Inmate statistical profile
Sample: ACTIVE PRISONERS SERVING LIFE EXCLUDING JAIL
Requestor: Statistics
Active inmates 12/21/2001
RACE AND SEX by current age & sex
|
MEN
|
WOMEN
|
| Age | Age | Age | Age | Men
| Age | Age | Age | Age |Women
|Grand
RACE AND SEX
|00-21 %|22-39 %|40-54 %|55-99 %|Total % |00-21 %|22-39 %|40-54 %|55-99 %|Total % |Total %
------------------------------------------------------------------------------------------------------------------------------------
WHITE MALE
| 25 14| 659 22| 724 33| 233 51| 1641 28 | 0 0| 0 0| 0 0| 0 0| 0 0 | 1641 27
NON WHITE MALE
| 151 86| 2314 78| 1460 67| 228 49| 4153 72 | 0 0| 0 0| 0 0| 0 0| 0 0 | 4153 69
WHITE FEMALE
| 0 0| 0 0| 0 0| 0 0| 0 0 | 4 50| 45 38| 46 51| 20 77| 115 47 | 115 2
NON WHITE FEMALE | 0 0| 0 0| 0 0| 0 0| 0 0 | 4 50| 75 63| 44 49| 6 23| 129 53 | 129 2
------------------------------------------------------------------------------------------------------------------------------------
Total reported
| 176 100| 2973 100| 2184 100| 461 100| 5794 100 | 8 100| 120 100| 90 100| 26 100| 244 100 | 6038 100
|
|
|
|
|
|
|
|
|
|
|
Percent reported | 100.0| 100.0| 100.0| 100.0| 100.0 | 100.0| 100.0| 100.0| 100.0| 100.0 | 100.0
|
|
|
|
|
|
|
|
|
|
|
|
|
|
|
|
|
|
|
|
|
|
NOT REPORTED
|0|0|0|0|0
|0|0|0|0|0
|0
------------------------------------------------------------------------------------------------------------------------------------
Total
| 176 | 2973 | 2184 | 461 | 5794
| 8 | 120 | 90 | 26 | 244
| 6038
|
|
|
|
|
|
|
|
|
|
|
|
|
|
|
|
|
|
|
|
|
|
|
|
|
|
|
|
|
|
|
|
|
|
|
|
|
|
|
|
|
|
|
|
|
|
|
|
|
|
|
|
|
|
|
AVERAGE AGE
| 19.97 | 31.22 | 45.89 | 60.90 | 38.77 | 20.25 | 31.10 | 45.24 | 61.38 | 39.19 | 38.78
Page 3 Run 12/21/01
Georgia Department of Corrections Office of Planning and Analysis
Inmate statistical profile
Sample: ACTIVE PRISONERS SERVING LIFE EXCLUDING JAIL
Requestor: Statistics
Active inmates 12/21/2001
Culture Fair IQ Scores by current age & sex
|
MEN
|
WOMEN
|
| Age | Age | Age | Age | Men
| Age | Age | Age | Age |Women
|Grand
IQ Score
|00-21 %|22-39 %|40-54 %|55-99 %|Total % |00-21 %|22-39 %|40-54 %|55-99 %|Total % |Total %
------------------------------------------------------------------------------------------------------------------------------------
LESS THAN 70
| 5 3| 73 3| 157 8| 44 11| 279 5 | 0 0| 10 9| 8 9| 2 9| 20 9 | 299 5
70 AND UP
| 160 97| 2768 97| 1878 92| 369 89| 5175 95 | 7 100| 106 91| 79 91| 21 91| 213 91 | 5388 95
------------------------------------------------------------------------------------------------------------------------------------
Total reported
| 165 100| 2841 100| 2035 100| 413 100| 5454 100 | 7 100| 116 100| 87 100| 23 100| 233 100 | 5687 100
|
|
|
|
|
|
|
|
|
|
|
Percent reported |
93.8|
95.6|
93.2|
89.6|
94.1 |
87.5|
96.7|
96.7|
88.5|
95.5 |
94.2
|
|
|
|
|
|
|
|
|
|
|
|
|
|
|
|
|
|
|
|
|
|
NOT REPORTED
| 11 | 132 | 149 | 48 | 340
| 1 | 4 | 3 | 3 | 11
| 351
------------------------------------------------------------------------------------------------------------------------------------
Total
| 176 | 2973 | 2184 | 461 | 5794
| 8 | 120 | 90 | 26 | 244
| 6038
|
|
|
|
|
|
|
|
|
|
|
|
|
|
|
|
|
|
|
|
|
|
|
|
|
|
|
|
|
|
|
|
|
|
|
|
|
|
|
|
|
|
|
|
|
|
|
|
|
|
|
|
|
|
|
AVERAGE IQ
| 99.14 | 101.44 | 97.24 | 94.24 | 99.26 | 99.43 | 96.24 | 91.78 | 88.96 | 93.95 | 99.04
Page 4 Run 12/21/01
Georgia Department of Corrections Office of Planning and Analysis
Inmate statistical profile
Sample: ACTIVE PRISONERS SERVING LIFE EXCLUDING JAIL
Requestor: Statistics
Active inmates 12/21/2001
Self-Rpt Socioeconomic Class by current age & sex
|
MEN
|
WOMEN
|
| Age | Age | Age | Age | Men
| Age | Age | Age | Age |Women
|Grand
Socioeconomic Class |00-21 %|22-39 %|40-54 %|55-99 %|Total % |00-21 %|22-39 %|40-54 %|55-99 %|Total % |Total %
------------------------------------------------------------------------------------------------------------------------------------
WELFARE
| 13 8| 333 12| 210 10| 27 6| 583 10 | 0 0| 22 19| 7 8| 0 0| 29 12 | 612 11
OCC EMPLOY
| 9 6| 189 7| 66 3| 9 2| 273 5 | 0 0| 3 3| 0 0| 1 4| 4 2 | 277 5
MINIMUM STD
| 77 48| 1044 37| 897 42| 238 54| 2256 41 | 4 50| 38 32| 26 29| 10 43| 78 33 | 2334 40
MIDDLE
| 58 36| 1265 44| 931 44| 162 37| 2416 43 | 4 50| 54 46| 53 60| 12 52| 123 52 | 2539 44
OTHER
| 2 1| 26 1| 7 0| 3 1| 38 1 | 0 0| 1 1| 3 3| 0 0| 4 2 | 42 1
------------------------------------------------------------------------------------------------------------------------------------
Total reported
| 159 100| 2857 100| 2111 100| 439 100| 5566 100 | 8 100| 118 100| 89 100| 23 100| 238 100 | 5804 100
|
|
|
|
|
|
|
|
|
|
|
Percent reported |
90.3|
96.1|
96.7|
95.2|
96.1 | 100.0|
98.3|
98.9|
88.5|
97.5 |
96.1
|
|
|
|
|
|
|
|
|
|
|
|
|
|
|
|
|
|
|
|
|
|
NOT RPTD
| 17 | 116 | 73 | 22 | 228
|0|2|1|3|6
| 234
------------------------------------------------------------------------------------------------------------------------------------
Total
| 176 | 2973 | 2184 | 461 | 5794
| 8 | 120 | 90 | 26 | 244
| 6038
Page 5 Run 12/21/01
Georgia Department of Corrections Office of Planning and Analysis
Inmate statistical profile
Sample: ACTIVE PRISONERS SERVING LIFE EXCLUDING JAIL
Requestor: Statistics
Active inmates 12/21/2001
Self-Rpt Environment To Age 16 by current age & sex
|
MEN
|
WOMEN
|
| Age | Age | Age | Age | Men
| Age | Age | Age | Age |Women
|Grand
Environment
|00-21 %|22-39 %|40-54 %|55-99 %|Total % |00-21 %|22-39 %|40-54 %|55-99 %|Total % |Total %
------------------------------------------------------------------------------------------------------------------------------------
RURAL/FARM
| 1 1| 99 3| 176 8| 95 21| 371 7 | 0 0| 7 6| 5 6| 3 14| 15 6 | 386 7
RURAL/NFARM
| 4 2| 185 6| 183 9| 39 9| 411 7 | 0 0| 8 7| 3 3| 0 0| 11 5 | 422 7
S.M.S.A
| 79 46| 1216 42| 760 36| 119 27| 2174 39 | 1 13| 23 19| 23 26| 6 27| 53 22 | 2227 38
URBAN
| 29 17| 520 18| 387 18| 64 14| 1000 18 | 4 50| 35 30| 24 27| 3 14| 66 28 | 1066 18
SMALL TOWN
| 59 34| 873 30| 604 28| 129 29| 1665 29 | 3 38| 45 38| 33 37| 10 45| 91 38 | 1756 30
OTHER
| 0 0| 13 0| 11 1| 1 0| 25 0 | 0 0| 0 0| 2 2| 0 0| 2 1 | 27 0
------------------------------------------------------------------------------------------------------------------------------------
Total reported
| 172 100| 2906 100| 2121 100| 447 100| 5646 100 | 8 100| 118 100| 90 100| 22 100| 238 100 | 5884 100
|
|
|
|
|
|
|
|
|
|
|
Percent reported |
97.7|
97.7|
97.1|
97.0|
97.4 | 100.0|
98.3| 100.0|
84.6|
97.5 |
97.4
|
|
|
|
|
|
|
|
|
|
|
|
|
|
|
|
|
|
|
|
|
|
NOT RPTD
| 4 | 67 | 63 | 14 | 148
|0|2|0|4|6
| 154
------------------------------------------------------------------------------------------------------------------------------------
Total
| 176 | 2973 | 2184 | 461 | 5794
| 8 | 120 | 90 | 26 | 244
| 6038
Page 6 Run 12/21/01
Georgia Department of Corrections Office of Planning and Analysis
Inmate statistical profile
Sample: ACTIVE PRISONERS SERVING LIFE EXCLUDING JAIL
Requestor: Statistics
Active inmates 12/21/2001
Self-Rpt Education Level by current age & sex
|
MEN
|
WOMEN
|
| Age | Age | Age | Age | Men
| Age | Age | Age | Age |Women
|Grand
Education Level
|00-21 %|22-39 %|40-54 %|55-99 %|Total % |00-21 %|22-39 %|40-54 %|55-99 %|Total % |Total %
------------------------------------------------------------------------------------------------------------------------------------
LESS THAN GRADE 7 | 6 4| 48 2| 107 5| 87 19| 248 4 | 0 0| 1 1| 2 2| 5 20| 8 3 | 256 4
GRADE 7
| 7 4| 83 3| 60 3| 35 8| 185 3 | 0 0| 5 4| 4 4| 1 4| 10 4 | 195 3
GRADE 8
| 43 25| 267 9| 200 9| 49 11| 559 10 | 3 38| 17 15| 7 8| 1 4| 28 12 | 587 10
GRADE 9
| 44 26| 458 16| 259 12| 40 9| 801 14 | 3 38| 16 14| 4 4| 1 4| 24 10 | 825 14
GRADE 10
| 35 20| 599 20| 311 14| 43 10| 988 17 | 0 0| 18 16| 13 14| 3 12| 34 14 | 1022 17
GRADE 11
| 29 17| 559 19| 251 12| 27 6| 866 15 | 1 13| 16 14| 6 7| 1 4| 24 10 | 890 15
GRADE 12
| 5 3| 682 23| 692 32| 114 25| 1493 26 | 1 13| 27 23| 32 36| 9 36| 69 29 | 1562 26
MORE THAN GRADE 12 | 2 1| 233 8| 273 13| 57 13| 565 10 | 0 0| 16 14| 22 24| 4 16| 42 18 | 607 10
------------------------------------------------------------------------------------------------------------------------------------
Total reported
| 171 100| 2929 100| 2153 100| 452 100| 5705 100 | 8 100| 116 100| 90 100| 25 100| 239 100 | 5944 100
|
|
|
|
|
|
|
|
|
|
|
Percent reported |
97.2|
98.5|
98.6|
98.0|
98.5 | 100.0|
96.7| 100.0|
96.2|
98.0 |
98.4
|
|
|
|
|
|
|
|
|
|
|
|
|
|
|
|
|
|
|
|
|
|
NOT REPORTED
| 5 | 44 | 31 | 9 | 89
|0|4|0|1|5
| 94
------------------------------------------------------------------------------------------------------------------------------------
Total
| 176 | 2973 | 2184 | 461 | 5794
| 8 | 120 | 90 | 26 | 244
| 6038
|
|
|
|
|
|
|
|
|
|
|
|
|
|
|
|
|
|
|
|
|
|
|
|
|
|
|
|
|
|
|
|
|
|
|
|
|
|
|
|
|
|
|
|
|
|
|
|
|
|
|
|
|
|
|
AVG EDUCATION LEVEL | 9.35 | 10.93 | 11.28 | 9.89 | 10.93 | 9.25 | 11.23 | 12.47 | 10.96 | 11.60 | 10.96
* NOTE: THE FIELD LABLED "LESS THAN GRADE 7" WAS CORRECTED IN MARCH 1989: MISSING DATA FOR INMATES STILL IN DIAGNOSTICS NOW HAS BEEN REMOVED FROM THIS FIELD AND IDENTIFIED AS "NOT REPORTED" INFORMATION.
Page 7 Run 12/21/01
Georgia Department of Corrections Office of Planning and Analysis
Inmate statistical profile
Sample: ACTIVE PRISONERS SERVING LIFE EXCLUDING JAIL
Requestor: Statistics
Active inmates 12/21/2001
Functional Reading Level (WRAT Scores) by current age & sex
|
MEN
|
WOMEN
|
| Age | Age | Age | Age | Men
| Age | Age | Age | Age |Women
|Grand
WRAT Reading Score |00-21 %|22-39 %|40-54 %|55-99 %|Total % |00-21 %|22-39 %|40-54 %|55-99 %|Total % |Total %
------------------------------------------------------------------------------------------------------------------------------------
LESS THAN GRADE 6 | 67 40| 1072 38| 888 46| 183 48| 2210 41 | 1 14| 42 36| 23 27| 10 42| 76 33 | 2286 41
6TH THRU 8TH GRADE | 37 22| 670 24| 425 22| 67 17| 1199 22 | 1 14| 25 22| 22 26| 5 21| 53 23 | 1252 22
GRADE 9
| 10 6| 210 7| 123 6| 27 7| 370 7 | 1 14| 2 2| 7 8| 1 4| 11 5 | 381 7
GRADE 10
| 10 6| 133 5| 77 4| 16 4| 236 4 | 1 14| 2 2| 6 7| 1 4| 10 4 | 246 4
GRADE 11
| 5 3| 115 4| 89 5| 10 3| 219 4 | 0 0| 4 3| 5 6| 1 4| 10 4 | 229 4
GRADE 12
| 24 14| 524 18| 312 16| 75 20| 935 18 | 3 43| 8 7| 2 2| 1 4| 14 6 | 949 17
MORE THAN GRADE 12 | 13 8| 119 4| 30 2| 6 2| 168 3 | 0 0| 33 28| 20 24| 5 21| 58 25 | 226 4
------------------------------------------------------------------------------------------------------------------------------------
Total reported
| 166 100| 2843 100| 1944 100| 384 100| 5337 100 | 7 100| 116 100| 85 100| 24 100| 232 100 | 5569 100
|
|
|
|
|
|
|
|
|
|
|
Percent reported |
94.3|
95.6|
89.0|
83.3|
92.1 |
87.5|
96.7|
94.4|
92.3|
95.1 |
92.2
|
|
|
|
|
|
|
|
|
|
|
|
|
|
|
|
|
|
|
|
|
|
NOT REPORTED
| 10 | 130 | 240 | 77 | 457
| 1 | 4 | 5 | 2 | 12
| 469
------------------------------------------------------------------------------------------------------------------------------------
Total
| 176 | 2973 | 2184 | 461 | 5794
| 8 | 120 | 90 | 26 | 244
| 6038
|
|
|
|
|
|
|
|
|
|
|
|
|
|
|
|
|
|
|
|
|
|
|
|
|
|
|
|
|
|
|
|
|
|
|
|
|
|
|
|
|
|
|
|
|
|
|
|
|
|
|
|
|
|
|
AVG READING SCORE | 7.66 | 7.79 | 7.04 | 7.00 | 7.45 | 9.80 | 8.35 | 8.34 | 7.56 | 8.31 | 7.49
Page 8 Run 12/21/01
Georgia Department of Corrections Office of Planning and Analysis
Inmate statistical profile
Sample: ACTIVE PRISONERS SERVING LIFE EXCLUDING JAIL
Requestor: Statistics
Active inmates 12/21/2001
Functional Math Level (WRAT Scores) by current age & sex
|
MEN
|
WOMEN
|
| Age | Age | Age | Age | Men
| Age | Age | Age | Age |Women
|Grand
WRAT Math Score
|00-21 %|22-39 %|40-54 %|55-99 %|Total % |00-21 %|22-39 %|40-54 %|55-99 %|Total % |Total %
------------------------------------------------------------------------------------------------------------------------------------
LESS THAN GRADE 6 | 64 39| 837 29| 838 43| 184 48| 1923 36 | 1 14| 38 33| 33 38| 10 42| 82 35 | 2005 36
6TH THRU 8TH GRADE | 67 40| 1442 51| 738 38| 105 27| 2352 44 | 5 71| 50 43| 34 40| 8 33| 97 42 | 2449 44
GRADE 9
| 11 7| 230 8| 135 7| 30 8| 406 8 | 1 14| 14 12| 6 7| 2 8| 23 10 | 429 8
GRADE 10
| 15 9| 133 5| 101 5| 24 6| 273 5 | 0 0| 7 6| 3 3| 1 4| 11 5 | 284 5
GRADE 11
| 5 3| 88 3| 55 3| 16 4| 164 3 | 0 0| 0 0| 3 3| 2 8| 5 2 | 169 3
GRADE 12
| 2 1| 97 3| 79 4| 22 6| 200 4 | 0 0| 2 2| 3 3| 0 0| 5 2 | 205 4
MORE THAN GRADE 12 | 2 1| 19 1| 3 0| 3 1| 27 1 | 0 0| 5 4| 4 5| 1 4| 10 4 | 37 1
------------------------------------------------------------------------------------------------------------------------------------
Total reported
| 166 100| 2846 100| 1949 100| 384 100| 5345 100 | 7 100| 116 100| 86 100| 24 100| 233 100 | 5578 100
|
|
|
|
|
|
|
|
|
|
|
Percent reported |
94.3|
95.7|
89.2|
83.3|
92.3 |
87.5|
96.7|
95.6|
92.3|
95.5 |
92.4
|
|
|
|
|
|
|
|
|
|
|
|
|
|
|
|
|
|
|
|
|
|
NOT REPORTED
| 10 | 127 | 235 | 77 | 449
| 1 | 4 | 4 | 2 | 11
| 460
------------------------------------------------------------------------------------------------------------------------------------
Total
| 176 | 2973 | 2184 | 461 | 5794
| 8 | 120 | 90 | 26 | 244
| 6038
|
|
|
|
|
|
|
|
|
|
|
|
|
|
|
|
|
|
|
|
|
|
|
|
|
|
|
|
|
|
|
|
|
|
|
|
|
|
|
|
|
|
|
|
|
|
|
|
|
|
|
|
|
|
|
AVG MATH SCORE
| 6.85 | 7.13 | 6.60 | 6.54 | 6.89 | 7.14 | 7.23 | 7.13 | 6.38 | 7.10 | 6.89
Page 9 Run 12/21/01
Georgia Department of Corrections Office of Planning and Analysis
Inmate statistical profile
Sample: ACTIVE PRISONERS SERVING LIFE EXCLUDING JAIL
Requestor: Statistics
Active inmates 12/21/2001
Functional Spelling Level (WRAT Scores) by current age & sex
|
MEN
|
WOMEN
|
| Age | Age | Age | Age | Men
| Age | Age | Age | Age |Women
|Grand
WRAT Spelling Score |00-21 %|22-39 %|40-54 %|55-99 %|Total % |00-21 %|22-39 %|40-54 %|55-99 %|Total % |Total %
------------------------------------------------------------------------------------------------------------------------------------
LESS THAN GRADE 6 | 65 39| 1228 43| 1106 57| 220 57| 2619 49 | 1 14| 38 33| 29 34| 12 50| 80 34 | 2699 48
6TH THRU 8TH GRADE | 52 31| 784 28| 406 21| 76 20| 1318 25 | 3 43| 29 25| 20 23| 4 17| 56 24 | 1374 25
GRADE 9
| 13 8| 184 6| 112 6| 17 4| 326 6 | 1 14| 8 7| 3 3| 1 4| 13 6 | 339 6
GRADE 10
| 15 9| 186 7| 74 4| 15 4| 290 5 | 1 14| 8 7| 7 8| 0 0| 16 7 | 306 5
GRADE 11
| 4 2| 136 5| 54 3| 7 2| 201 4 | 1 14| 3 3| 5 6| 3 13| 12 5 | 213 4
GRADE 12
| 6 4| 279 10| 180 9| 45 12| 510 10 | 0 0| 12 10| 6 7| 0 0| 18 8 | 528 9
MORE THAN GRADE 12 | 11 7| 46 2| 13 1| 4 1| 74 1 | 0 0| 18 16| 16 19| 4 17| 38 16 | 112 2
------------------------------------------------------------------------------------------------------------------------------------
Total reported
| 166 100| 2843 100| 1945 100| 384 100| 5338 100 | 7 100| 116 100| 86 100| 24 100| 233 100 | 5571 100
|
|
|
|
|
|
|
|
|
|
|
Percent reported |
94.3|
95.6|
89.1|
83.3|
92.1 |
87.5|
96.7|
95.6|
92.3|
95.5 |
92.3
|
|
|
|
|
|
|
|
|
|
|
|
|
|
|
|
|
|
|
|
|
|
NOT REPORTED
| 10 | 130 | 239 | 77 | 456
| 1 | 4 | 4 | 2 | 11
| 467
------------------------------------------------------------------------------------------------------------------------------------
Total
| 176 | 2973 | 2184 | 461 | 5794
| 8 | 120 | 90 | 26 | 244
| 6038
|
|
|
|
|
|
|
|
|
|
|
|
|
|
|
|
|
|
|
|
|
|
|
|
|
|
|
|
|
|
|
|
|
|
|
|
|
|
|
|
|
|
|
|
|
|
|
|
|
|
|
|
|
|
|
AVG SPELLING SCORE | 7.18 | 7.01 | 6.08 | 6.02 | 6.60 | 8.34 | 8.20 | 8.14 | 6.79 | 8.03 | 6.66
Page 10 Run 12/21/01
Georgia Department of Corrections Office of Planning and Analysis
Inmate statistical profile
Sample: ACTIVE PRISONERS SERVING LIFE EXCLUDING JAIL
Requestor: Statistics
Active inmates 12/21/2001
Self-Rpt Guardian Status To Age 16 by current age & sex
|
MEN
|
WOMEN
|
| Age | Age | Age | Age | Men
| Age | Age | Age | Age |Women
|Grand
Guardian Status
|00-21 %|22-39 %|40-54 %|55-99 %|Total % |00-21 %|22-39 %|40-54 %|55-99 %|Total % |Total %
------------------------------------------------------------------------------------------------------------------------------------
ORPHANAGE
| 0 0| 4 0| 4 0| 2 0| 10 0 | 0 0| 0 0| 0 0| 0 0| 0 0 | 10 0
FATHER ONLY
| 7 4| 84 3| 62 3| 6 1| 159 3 | 0 0| 2 2| 2 2| 1 4| 5 2 | 164 3
FTR MTR HD
| 11 6| 119 4| 71 3| 9 2| 210 4 | 0 0| 2 2| 5 6| 0 0| 7 3 | 217 4
MOTHER ONLY
| 96 56| 1393 48| 710 33| 121 27| 2320 41 | 5 63| 44 38| 25 28| 9 38| 83 35 | 2403 41
MTR FTR HD
| 32 19| 878 30| 1005 47| 244 54| 2159 38 | 3 38| 43 37| 48 55| 13 54| 107 45 | 2266 38
OTH FEMALE
| 3 2| 53 2| 50 2| 17 4| 123 2 | 0 0| 4 3| 2 2| 0 0| 6 3 | 129 2
OTH MALE
| 2 1| 6 0| 13 1| 1 0| 22 0 | 0 0| 0 0| 2 2| 0 0| 2 1 | 24 0
STEP-PARNTS
| 2 1| 52 2| 26 1| 7 2| 87 2 | 0 0| 0 0| 0 0| 0 0| 0 0 | 87 1
FOSTER HOME
| 3 2| 26 1| 30 1| 8 2| 67 1 | 0 0| 2 2| 0 0| 0 0| 2 1 | 69 1
GRAND PRNTS
| 11 6| 241 8| 137 6| 29 6| 418 7 | 0 0| 17 15| 4 5| 1 4| 22 9 | 440 7
OTHER
| 3 2| 65 2| 29 1| 6 1| 103 2 | 0 0| 3 3| 0 0| 0 0| 3 1 | 106 2
------------------------------------------------------------------------------------------------------------------------------------
Total reported
| 170 100| 2921 100| 2137 100| 450 100| 5678 100 | 8 100| 117 100| 88 100| 24 100| 237 100 | 5915 100
|
|
|
|
|
|
|
|
|
|
|
Percent reported |
96.6|
98.3|
97.8|
97.6|
98.0 | 100.0|
97.5|
97.8|
92.3|
97.1 |
98.0
|
|
|
|
|
|
|
|
|
|
|
|
|
|
|
|
|
|
|
|
|
|
NOT RPTD
| 6 | 52 | 47 | 11 | 116
|0|3|2|2|7
| 123
------------------------------------------------------------------------------------------------------------------------------------
Total
| 176 | 2973 | 2184 | 461 | 5794
| 8 | 120 | 90 | 26 | 244
| 6038
Page 11 Run 12/21/01
Georgia Department of Corrections Office of Planning and Analysis
Inmate statistical profile
Sample: ACTIVE PRISONERS SERVING LIFE EXCLUDING JAIL
Requestor: Statistics
Active inmates 12/21/2001
Self-Rpt Employment Status Before Prison by current age & sex
|
MEN
|
WOMEN
|
| Age | Age | Age | Age | Men
| Age | Age | Age | Age |Women
|Grand
Employment
|00-21 %|22-39 %|40-54 %|55-99 %|Total % |00-21 %|22-39 %|40-54 %|55-99 %|Total % |Total %
------------------------------------------------------------------------------------------------------------------------------------
FULL TIME
| 33 21| 972 35| 788 38| 182 42| 1975 36 | 1 13| 32 29| 16 18| 4 17| 53 23 | 2028 36
PART TIME
| 7 4| 230 8| 114 5| 22 5| 373 7 | 0 0| 5 4| 4 5| 0 0| 9 4 | 382 7
UNEMPL < 6M
| 13 8| 440 16| 345 17| 64 15| 862 16 | 0 0| 22 20| 21 24| 5 22| 48 21 | 910 16
UNEMPL > 6M
| 16 10| 834 30| 743 36| 124 29| 1717 31 | 1 13| 30 27| 37 43| 12 52| 80 35 | 1797 31
NEVER WORKD
| 73 46| 275 10| 23 1| 3 1| 374 7 | 3 38| 22 20| 4 5| 0 0| 29 13 | 403 7
STUDENT
| 17 11| 35 1| 7 0| 1 0| 60 1 | 3 38| 1 1| 2 2| 0 0| 6 3 | 66 1
INCAPABLE
| 1 1| 28 1| 53 3| 35 8| 117 2 | 0 0| 0 0| 3 3| 2 9| 5 2 | 122 2
OTHER
| 0 0| 0 0| 0 0| 0 0| 0 0 | 0 0| 0 0| 0 0| 0 0| 0 0 | 0 0
------------------------------------------------------------------------------------------------------------------------------------
Total reported
| 160 100| 2814 100| 2073 100| 431 100| 5478 100 | 8 100| 112 100| 87 100| 23 100| 230 100 | 5708 100
|
|
|
|
|
|
|
|
|
|
|
Percent reported |
90.9|
94.7|
94.9|
93.5|
94.5 | 100.0|
93.3|
96.7|
88.5|
94.3 |
94.5
|
|
|
|
|
|
|
|
|
|
|
|
|
|
|
|
|
|
|
|
|
|
NOT RPTD
| 16 | 159 | 111 | 30 | 316
| 0 | 8 | 3 | 3 | 14
| 330
------------------------------------------------------------------------------------------------------------------------------------
Total
| 176 | 2973 | 2184 | 461 | 5794
| 8 | 120 | 90 | 26 | 244
| 6038
* NOTE: THE FIELD LABELD "OTHER" WAS CORRECTED IN APRIL 1989; INMATES CODED "PRE-OTIS NOT REPORTED" NOW HAVE BEEN REMOVED FROM THIS FIELD AND IDENTIFIED AS "NOT REPORTED".
Page 12 Run 12/21/01
Georgia Department of Corrections Office of Planning and Analysis
Inmate statistical profile
Sample: ACTIVE PRISONERS SERVING LIFE EXCLUDING JAIL
Requestor: Statistics
Active inmates 12/21/2001
Self-Rpt Marital Status At Admission by current age & sex
|
MEN
|
WOMEN
|
| Age | Age | Age | Age | Men
| Age | Age | Age | Age |Women
|Grand
Marital Status
|00-21 %|22-39 %|40-54 %|55-99 %|Total % |00-21 %|22-39 %|40-54 %|55-99 %|Total % |Total %
------------------------------------------------------------------------------------------------------------------------------------
SINGLE
| 163 95| 2054 70| 759 35| 66 15| 3042 53 | 8 100| 71 60| 16 18| 2 8| 97 41 | 3139 53
MARRIED
| 0 0| 215 7| 406 19| 117 26| 738 13 | 0 0| 10 8| 18 20| 3 13| 31 13 | 769 13
SEPARATED
| 0 0| 90 3| 171 8| 47 10| 308 5 | 0 0| 11 9| 9 10| 2 8| 22 9 | 330 6
DIVORCED
| 0 0| 127 4| 362 17| 109 24| 598 11 | 0 0| 9 8| 15 17| 6 25| 30 13 | 628 11
WIDOWED
| 2 1| 44 2| 92 4| 55 12| 193 3 | 0 0| 7 6| 18 20| 11 46| 36 15 | 229 4
COMMON LAW
| 6 4| 391 13| 354 16| 55 12| 806 14 | 0 0| 10 8| 13 15| 0 0| 23 10 | 829 14
OTHER
| 0 0| 2 0| 2 0| 0 0| 4 0 | 0 0| 0 0| 0 0| 0 0| 0 0 | 4 0
------------------------------------------------------------------------------------------------------------------------------------
Total reported
| 171 100| 2923 100| 2146 100| 449 100| 5689 100 | 8 100| 118 100| 89 100| 24 100| 239 100 | 5928 100
|
|
|
|
|
|
|
|
|
|
|
Percent reported |
97.2|
98.3|
98.3|
97.4|
98.2 | 100.0|
98.3|
98.9|
92.3|
98.0 |
98.2
|
|
|
|
|
|
|
|
|
|
|
|
|
|
|
|
|
|
|
|
|
|
NOT RPTD
| 5 | 50 | 38 | 12 | 105
|0|2|1|2|5
| 110
------------------------------------------------------------------------------------------------------------------------------------
Total
| 176 | 2973 | 2184 | 461 | 5794
| 8 | 120 | 90 | 26 | 244
| 6038
Page 13 Run 12/21/01
Georgia Department of Corrections Office of Planning and Analysis
Inmate statistical profile
Sample: ACTIVE PRISONERS SERVING LIFE EXCLUDING JAIL
Requestor: Statistics
Active inmates 12/21/2001
Self-Rpt Number Of Children At Admission by current age & sex
|
MEN
|
WOMEN
|
| Age | Age | Age | Age | Men
| Age | Age | Age | Age |Women
|Grand
Number Of Children |00-21 %|22-39 %|40-54 %|55-99 %|Total % |00-21 %|22-39 %|40-54 %|55-99 %|Total % |Total %
------------------------------------------------------------------------------------------------------------------------------------
NO CHILDREN
| 0 0| 391 20| 298 18| 42 11| 731 18 | 0 0| 3 3| 3 4| 1 4| 7 4 | 738 17
ONE CHILD
| 33 70| 736 39| 500 30| 70 18| 1339 33 | 1 100| 26 30| 23 29| 1 4| 51 27 | 1390 33
TWO CHILDREN
| 8 17| 404 21| 386 23| 88 22| 886 22 | 0 0| 32 37| 20 25| 9 38| 61 32 | 947 22
THREE CHILDREN
| 5 11| 231 12| 248 15| 81 21| 565 14 | 0 0| 16 19| 16 20| 7 29| 39 20 | 604 14
FOUR CHILDREN
| 0 0| 84 4| 121 7| 47 12| 252 6 | 0 0| 5 6| 10 13| 4 17| 19 10 | 271 6
FIVE CHILDREN
| 1 2| 31 2| 66 4| 24 6| 122 3 | 0 0| 3 3| 2 3| 1 4| 6 3 | 128 3
MORE THAN 5 CHILDREN| 0 0| 33 2| 62 4| 40 10| 135 3 | 0 0| 1 1| 6 8| 1 4| 8 4 | 143 3
------------------------------------------------------------------------------------------------------------------------------------
Total reported
| 47 100| 1910 100| 1681 100| 392 100| 4030 100 | 1 100| 86 100| 80 100| 24 100| 191 100 | 4221 100
|
|
|
|
|
|
|
|
|
|
|
Percent reported |
26.7|
64.2|
77.0|
85.0|
69.6 |
12.5|
71.7|
88.9|
92.3|
78.3 |
69.9
|
|
|
|
|
|
|
|
|
|
|
|
|
|
|
|
|
|
|
|
|
|
NOT REPORTED
| 129 | 1063 | 503 | 69 | 1764
| 7 | 34 | 10 | 2 | 53
| 1817
------------------------------------------------------------------------------------------------------------------------------------
Total
| 176 | 2973 | 2184 | 461 | 5794
| 8 | 120 | 90 | 26 | 244
| 6038
|
|
|
|
|
|
|
|
|
|
|
|
|
|
|
|
|
|
|
|
|
|
|
|
|
|
|
|
|
|
|
|
|
|
|
|
|
|
|
|
|
|
|
|
|
|
|
|
|
|
|
|
|
|
|
AVG NUM CHILDREN | 1.47 | 1.65 | 2.02 | 2.77 | 1.91 | 1.00 | 2.08 | 2.50 | 2.83 | 2.35 | 1.93
* NOTE: THE FIELD LABLED "NO CHILDREN" WAS CORRECTED IN MARCH 1989: MISSING DATA FOR INMATES STILL IN DIAGNOSTICS NOW HAS BEEN REMOVED FROM THIS FIELD AND IDENTIFIED AS "NOT REPORTED" INFORMATION.
Page 14 Run 12/21/01
Georgia Department of Corrections Office of Planning and Analysis
Inmate statistical profile
Sample: ACTIVE PRISONERS SERVING LIFE EXCLUDING JAIL
Requestor: Statistics
Active inmates 12/21/2001
Self-Rpt Religious Affiliation by current age & sex
|
MEN
|
WOMEN
|
| Age | Age | Age | Age | Men
| Age | Age | Age | Age |Women
|Grand
Religion
|00-21 %|22-39 %|40-54 %|55-99 %|Total % |00-21 %|22-39 %|40-54 %|55-99 %|Total % |Total %
------------------------------------------------------------------------------------------------------------------------------------
ISLAM
| 4 2| 147 5| 77 4| 11 3| 239 4 | 0 0| 2 2| 0 0| 0 0| 2 1 | 241 4
CATHOLIC
| 3 2| 87 3| 69 3| 20 5| 179 3 | 0 0| 7 6| 3 3| 1 4| 11 5 | 190 3
BAPTIST
| 69 42| 1411 50| 1234 62| 258 60| 2972 55 | 5 63| 60 53| 48 56| 14 61| 127 55 | 3099 55
METHODIST
| 1 1| 67 2| 82 4| 29 7| 179 3 | 0 0| 2 2| 9 10| 1 4| 12 5 | 191 3
EPISCOPLN
| 0 0| 5 0| 4 0| 2 0| 11 0 | 0 0| 1 1| 2 2| 0 0| 3 1 | 14 0
PRESBYTRN
| 0 0| 6 0| 10 1| 3 1| 19 0 | 0 0| 0 0| 0 0| 2 9| 2 1 | 21 0
CHC OF GOD
| 1 1| 31 1| 25 1| 10 2| 67 1 | 0 0| 4 4| 1 1| 0 0| 5 2 | 72 1
HOLINESS
| 5 3| 127 5| 94 5| 26 6| 252 5 | 2 25| 12 11| 11 13| 1 4| 26 11 | 278 5
JEWISH
| 0 0| 1 0| 3 0| 0 0| 4 0 | 0 0| 0 0| 0 0| 0 0| 0 0 | 4 0
ANGLICAN
| 0 0| 0 0| 0 0| 0 0| 0 0 | 0 0| 1 1| 0 0| 0 0| 1 0 | 1 0
GRK ORTHDX
| 0 0| 0 0| 0 0| 0 0| 0 0 | 0 0| 0 0| 0 0| 0 0| 0 0 | 0 0
HINDU
| 0 0| 0 0| 0 0| 0 0| 0 0 | 0 0| 0 0| 0 0| 0 0| 0 0 | 0 0
BUDDHIST
| 2 1| 2 0| 1 0| 0 0| 5 0 | 0 0| 0 0| 0 0| 0 0| 0 0 | 5 0
TAOIST
| 0 0| 0 0| 0 0| 0 0| 0 0 | 0 0| 0 0| 0 0| 0 0| 0 0 | 0 0
SHINTOIST
| 0 0| 0 0| 0 0| 0 0| 0 0 | 0 0| 0 0| 0 0| 0 0| 0 0 | 0 0
SEVEN D AD
| 0 0| 6 0| 4 0| 1 0| 11 0 | 0 0| 0 0| 0 0| 0 0| 0 0 | 11 0
JEHOVAH WT
| 1 1| 22 1| 15 1| 1 0| 39 1 | 0 0| 1 1| 0 0| 0 0| 1 0 | 40 1
LATR DAY S
| 0 0| 2 0| 1 0| 0 0| 3 0 | 0 0| 0 0| 0 0| 0 0| 0 0 | 3 0
QUAKER
| 0 0| 0 0| 0 0| 0 0| 0 0 | 0 0| 0 0| 0 0| 0 0| 0 0 | 0 0
OTHER PROD
| 19 12| 230 8| 74 4| 17 4| 340 6 | 0 0| 10 9| 6 7| 1 4| 17 7 | 357 6
NONE
| 45 28| 445 16| 148 7| 17 4| 655 12 | 0 0| 7 6| 1 1| 0 0| 8 3 | 663 12
OTHER
| 13 8| 217 8| 158 8| 36 8| 424 8 | 1 13| 7 6| 5 6| 3 13| 16 7 | 440 8
------------------------------------------------------------------------------------------------------------------------------------
Total reported
| 163 100| 2806 100| 1999 100| 431 100| 5399 100 | 8 100| 114 100| 86 100| 23 100| 231 100 | 5630 100
|
|
|
|
|
|
|
|
|
|
|
Percent reported |
92.6|
94.4|
91.5|
93.5|
93.2 | 100.0|
95.0|
95.6|
88.5|
94.7 |
93.2
|
|
|
|
|
|
|
|
|
|
|
|
|
|
|
|
|
|
|
|
|
|
NOT RPTD
| 13 | 167 | 185 | 30 | 395
| 0 | 6 | 4 | 3 | 13
| 408
------------------------------------------------------------------------------------------------------------------------------------
Total
| 176 | 2973 | 2184 | 461 | 5794
| 8 | 120 | 90 | 26 | 244
| 6038
Page 15 Run 12/21/01
Georgia Department of Corrections Office of Planning and Analysis
Inmate statistical profile
Sample: ACTIVE PRISONERS SERVING LIFE EXCLUDING JAIL
Requestor: Statistics
Active inmates 12/21/2001
Self-Rpt Family Behavior Patterns * by current age & sex
|
MEN
|
WOMEN
|
| Age | Age | Age | Age | Men
| Age | Age | Age | Age |Women
|Grand
Family Behavior
|00-21 %|22-39 %|40-54 %|55-99 %|Total % |00-21 %|22-39 %|40-54 %|55-99 %|Total % |Total %
------------------------------------------------------------------------------------------------------------------------------------
CRIMINLTY
| 51 20| 790 24| 543 28| 90 27| 1474 25 | 3 12| 33 17| 16 21| 2 10| 54 17 | 1528 25
ALCOHOLISM
| 21 8| 321 10| 307 16| 47 14| 696 12 | 2 8| 26 13| 15 20| 4 19| 47 15 | 743 12
DRUG ABUSE
| 30 12| 182 5| 74 4| 8 2| 294 5 | 2 8| 21 11| 4 5| 0 0| 27 9 | 321 5
DOMINERING
| 2 1| 12 0| 13 1| 1 0| 28 0 | 5 20| 14 7| 5 7| 2 10| 26 8 | 54 1
MIGRANT
| 1 0| 45 1| 43 2| 1 0| 90 2 | 1 4| 1 1| 2 3| 0 0| 4 1 | 94 2
INFL BTGS
| 8 3| 142 4| 73 4| 16 5| 239 4 | 3 12| 21 11| 6 8| 2 10| 32 10 | 271 4
PERMISSIVE
| 1 0| 7 0| 14 1| 3 1| 25 0 | 1 4| 5 3| 1 1| 1 5| 8 3 | 33 1
FATH ABSNT
| 110 43| 1502 45| 686 36| 135 40| 2433 42 | 5 20| 48 25| 17 23| 7 33| 77 24 | 2510 41
MOTH ABSNT
| 26 10| 309 9| 156 8| 33 10| 524 9 | 1 4| 16 8| 3 4| 1 5| 21 7 | 545 9
NONE
| 3 1| 36 1| 15 1| 3 1| 57 1 | 2 8| 9 5| 6 8| 2 10| 19 6 | 76 1
------------------------------------------------------------------------------------------------------------------------------------
Total reported
| 253 100| 3346 100| 1924 100| 337 100| 5860 100 | 25 100| 194 100| 75 100| 21 100| 315 100 | 6175 100
|
|
|
|
|
|
|
|
|
|
|
Percent reported |
78.4|
70.9|
60.6|
52.5|
65.8 | 100.0|
69.2|
54.4|
53.8|
63.1 |
65.7
|
|
|
|
|
|
|
|
|
|
|
|
|
|
|
|
|
|
|
|
|
|
OTHER
| 38 | 866 | 861 | 219 | 1984
| 0 | 37 | 41 | 12 | 90
| 2074
------------------------------------------------------------------------------------------------------------------------------------
Total
| 176 | 2973 | 2184 | 461 | 5794
| 8 | 120 | 90 | 26 | 244
| 6038
* NOTE: SINCE THERE CAN BE UP TO FIVE BEHAVIOR CODES PER INMATE, THE NUMBER OF CASES REPORTED IN THE DETAIL LINES AND THE TOTAL REPORTED LINE MAY EXCEED THE TOTAL NUMBER OF CASES. IN SHORT, THIS TABLE COUNTS THE NUMBER OF BEHAVIOR PROBLEMS, NOT INMATES.
Page 16 Run 12/21/01
Georgia Department of Corrections Office of Planning and Analysis
Inmate statistical profile
Sample: ACTIVE PRISONERS SERVING LIFE EXCLUDING JAIL
Requestor: Statistics
Active inmates 12/21/2001
Inmate Diagnostic Behavior Problem * by current age & sex
|
MEN
|
WOMEN
|
| Age | Age | Age | Age | Men
| Age | Age | Age | Age |Women
|Grand
Diagnostic Problem |00-21 %|22-39 %|40-54 %|55-99 %|Total % |00-21 %|22-39 %|40-54 %|55-99 %|Total % |Total %
------------------------------------------------------------------------------------------------------------------------------------
ALCOHOLIC
| 3 1| 127 2| 148 4| 41 6| 319 3 | 1 5| 2 1| 13 8| 2 6| 18 4 | 337 3
ALCOH ABSE
| 42 11| 846 16| 674 17| 122 17| 1684 16 | 1 5| 23 12| 17 11| 5 16| 46 11 | 1730 16
DRUG EXP
| 58 16| 783 15| 392 10| 46 6| 1279 12 | 2 9| 20 10| 16 10| 1 3| 39 10 | 1318 12
DRUG ABSE
| 73 20| 949 18| 689 18| 57 8| 1768 17 | 3 14| 38 19| 26 17| 0 0| 67 17 | 1835 17
NARC ADDCT
| 1 0| 92 2| 99 3| 7 1| 199 2 | 0 0| 3 2| 3 2| 0 0| 6 1 | 205 2
EPILEPTIC
| 1 0| 28 1| 25 1| 5 1| 59 1 | 0 0| 0 0| 2 1| 0 0| 2 0 | 61 1
MANIPULTVE
| 40 11| 273 5| 131 3| 22 3| 466 4 | 0 0| 4 2| 0 0| 1 3| 5 1 | 471 4
ASSAULTIVE
| 120 33| 1406 26| 981 25| 201 28| 2708 26 | 7 32| 56 29| 33 21| 5 16| 101 25 | 2809 26
ESCPE TEND
| 4 1| 108 2| 213 5| 52 7| 377 4 | 0 0| 1 1| 5 3| 0 0| 6 1 | 383 4
SUICIDAL
| 9 2| 139 3| 115 3| 16 2| 279 3 | 4 18| 14 7| 8 5| 2 6| 28 7 | 307 3
WITHDRAWN
| 0 0| 34 1| 22 1| 7 1| 63 1 | 2 9| 3 2| 2 1| 1 3| 8 2 | 71 1
PR RLTY CT
| 1 0| 31 1| 51 1| 14 2| 97 1 | 1 5| 2 1| 3 2| 1 3| 7 2 | 104 1
HOMOSEXUAL
| 1 0| 11 0| 11 0| 5 1| 28 0 | 1 5| 5 3| 4 3| 0 0| 10 2 | 38 0
NONE
| 0 0| 261 5| 248 6| 78 11| 587 6 | 0 0| 9 5| 15 10| 9 28| 33 8 | 620 6
OTHER
| 1 0| 72 1| 60 2| 26 4| 159 2 | 0 0| 0 0| 0 0| 3 9| 3 1 | 162 2
NOT RPTD
| 14 4| 183 3| 68 2| 25 3| 290 3 | 0 0| 16 8| 7 5| 2 6| 25 6 | 315 3
------------------------------------------------------------------------------------------------------------------------------------
Total reported
| 368 100| 5350 100| 3928 100| 725 100|10371 100 | 22 100| 196 100| 155 100| 32 100| 405 100 |10776 100
|
|
|
|
|
|
|
|
|
|
|
Percent reported | 100.0|
99.8| 100.0|
99.8|
99.8 | 100.0| 100.0|
98.9| 100.0|
99.6 |
99.8
|
|
|
|
|
|
|
|
|
|
|
|
|
|
|
|
|
|
|
|
|
|
UNKNOWN
|0|7|1|1|9
|0|0|1|0|1
| 10
------------------------------------------------------------------------------------------------------------------------------------
Total
| 176 | 2973 | 2184 | 461 | 5794
| 8 | 120 | 90 | 26 | 244
| 6038
* NOTE: SINCE THERE CAN BE UP TO FIVE BEHAVIOR CODES PER INMATE, THE NUMBER OF CASES REPORTED IN THE DETAIL LINES AND THE TOTAL REPORTED LINE MAY EXCEED THE TOTAL NUMBER OF CASES. IN SHORT, THIS TABLE COUNTS THE NUMBER OF BEHAVIOR PROBLEMS, NOT INMATES.
Page 17 Run 12/21/01
Georgia Department of Corrections Office of Planning and Analysis
Inmate statistical profile
Sample: ACTIVE PRISONERS SERVING LIFE EXCLUDING JAIL
Requestor: Statistics
Active inmates 12/21/2001
Physical Profile (General Condition) by current age & sex
|
MEN
|
WOMEN
|
| Age | Age | Age | Age | Men
| Age | Age | Age | Age |Women
|Grand
Physical Profile |00-21 %|22-39 %|40-54 %|55-99 %|Total % |00-21 %|22-39 %|40-54 %|55-99 %|Total % |Total %
------------------------------------------------------------------------------------------------------------------------------------
NO LIMITATION
| 154 89| 2132 72| 1061 49| 86 19| 3433 60 | 8 100| 89 77| 43 49| 1 4| 141 60 | 3574 60
DEFECT NO MAJOR LIMT| 12 7| 374 13| 441 20| 98 22| 925 16 | 0 0| 3 3| 13 15| 5 22| 21 9 | 946 16
DEFECT MAJOR LIMIT | 8 5| 438 15| 653 30| 246 54| 1345 23 | 0 0| 24 21| 31 35| 15 65| 70 30 | 1415 24
VERY MAJOR DEFECT | 0 0| 2 0| 16 1| 25 5| 43 1 | 0 0| 0 0| 1 1| 2 9| 3 1 | 46 1
------------------------------------------------------------------------------------------------------------------------------------
Total reported
| 174 100| 2946 100| 2171 100| 455 100| 5746 100 | 8 100| 116 100| 88 100| 23 100| 235 100 | 5981 100
|
|
|
|
|
|
|
|
|
|
|
Percent reported |
98.9|
99.1|
99.4|
98.7|
99.2 | 100.0|
96.7|
97.8|
88.5|
96.3 |
99.1
|
|
|
|
|
|
|
|
|
|
|
|
|
|
|
|
|
|
|
|
|
|
NOT REPORTED
| 2 | 27 | 13 | 6 | 48
|0|4|2|3|9
| 57
------------------------------------------------------------------------------------------------------------------------------------
Total
| 176 | 2973 | 2184 | 461 | 5794
| 8 | 120 | 90 | 26 | 244
| 6038
Page 18 Run 12/21/01
Georgia Department of Corrections Office of Planning and Analysis
Inmate statistical profile
Sample: ACTIVE PRISONERS SERVING LIFE EXCLUDING JAIL
Requestor: Statistics
Active inmates 12/21/2001
Security Status by current age & sex
|
MEN
|
WOMEN
|
| Age | Age | Age | Age | Men
| Age | Age | Age | Age |Women
|Grand
Security
|00-21 %|22-39 %|40-54 %|55-99 %|Total % |00-21 %|22-39 %|40-54 %|55-99 %|Total % |Total %
------------------------------------------------------------------------------------------------------------------------------------
DIAG INCOM
| 0 0| 0 0| 0 0| 0 0| 0 0 | 0 0| 0 0| 0 0| 0 0| 0 0 | 0 0
WRK RELEAS
| 0 0| 1 0| 0 0| 0 0| 1 0 | 0 0| 0 0| 0 0| 0 0| 0 0 | 1 0
TRUSTY
| 0 0| 38 1| 41 2| 4 1| 83 1 | 0 0| 0 0| 3 3| 1 4| 4 2 | 87 1
MINIMUM
| 0 0| 375 13| 489 22| 118 26| 982 17 | 0 0| 36 30| 44 49| 17 65| 97 40 | 1079 18
MEDIUM
| 17 10| 1271 43| 1166 53| 269 58| 2723 47 | 1 13| 51 43| 32 36| 8 31| 92 38 | 2815 47
CLOSE
| 146 83| 1133 38| 409 19| 61 13| 1749 30 | 7 88| 32 27| 9 10| 0 0| 48 20 | 1797 30
MAXIMUM
| 6 3| 135 5| 75 3| 5 1| 221 4 | 0 0| 0 0| 1 1| 0 0| 1 0 | 222 4
DIAGNOSTIC
| 7 4| 20 1| 4 0| 4 1| 35 1 | 0 0| 1 1| 1 1| 0 0| 2 1 | 37 1
------------------------------------------------------------------------------------------------------------------------------------
Total reported
| 176 100| 2973 100| 2184 100| 461 100| 5794 100 | 8 100| 120 100| 90 100| 26 100| 244 100 | 6038 100
|
|
|
|
|
|
|
|
|
|
|
Percent reported | 100.0| 100.0| 100.0| 100.0| 100.0 | 100.0| 100.0| 100.0| 100.0| 100.0 | 100.0
|
|
|
|
|
|
|
|
|
|
|
|
|
|
|
|
|
|
|
|
|
|
NOT RPTD
|0|0|0|0|0
|0|0|0|0|0
|0
------------------------------------------------------------------------------------------------------------------------------------
Total
| 176 | 2973 | 2184 | 461 | 5794
| 8 | 120 | 90 | 26 | 244
| 6038
* NOTE: BEGINNING IN JULY 1987, THE FACILITIES DIVISION NO LONGER CODED INMATES AS BEING WORK RELEASE
Page 19 Run 12/21/01
Georgia Department of Corrections Office of Planning and Analysis
Inmate statistical profile
Sample: ACTIVE PRISONERS SERVING LIFE EXCLUDING JAIL
Requestor: Statistics
Active inmates 12/21/2001
Number Of Sentences by current age & sex
|
MEN
|
WOMEN
|
| Age | Age | Age | Age | Men
| Age | Age | Age | Age |Women
|Grand
Number Of Sentences |00-21 %|22-39 %|40-54 %|55-99 %|Total % |00-21 %|22-39 %|40-54 %|55-99 %|Total % |Total %
------------------------------------------------------------------------------------------------------------------------------------
ONE
| 50 28| 712 24| 550 25| 155 34| 1467 25 | 2 25| 46 38| 42 47| 13 50| 103 42 | 1570 26
TWO
| 51 29| 694 23| 521 24| 113 25| 1379 24 | 2 25| 37 31| 23 26| 9 35| 71 29 | 1450 24
THREE
| 23 13| 521 18| 384 18| 71 15| 999 17 | 2 25| 19 16| 11 12| 4 15| 36 15 | 1035 17
FOUR
| 20 11| 333 11| 246 11| 41 9| 640 11 | 1 13| 9 8| 4 4| 0 0| 14 6 | 654 11
FIVE
| 10 6| 233 8| 153 7| 23 5| 419 7 | 1 13| 4 3| 4 4| 0 0| 9 4 | 428 7
MORE THAN FIVE
| 22 13| 480 16| 330 15| 58 13| 890 15 | 0 0| 5 4| 6 7| 0 0| 11 5 | 901 15
------------------------------------------------------------------------------------------------------------------------------------
Total reported
| 176 100| 2973 100| 2184 100| 461 100| 5794 100 | 8 100| 120 100| 90 100| 26 100| 244 100 | 6038 100
|
|
|
|
|
|
|
|
|
|
|
Percent reported | 100.0| 100.0| 100.0| 100.0| 100.0 | 100.0| 100.0| 100.0| 100.0| 100.0 | 100.0
|
|
|
|
|
|
|
|
|
|
|
|
|
|
|
|
|
|
|
|
|
|
NOT REPORTED
|0|0|0|0|0
|0|0|0|0|0
|0
------------------------------------------------------------------------------------------------------------------------------------
Total
| 176 | 2973 | 2184 | 461 | 5794
| 8 | 120 | 90 | 26 | 244
| 6038
|
|
|
|
|
|
|
|
|
|
|
|
|
|
|
|
|
|
|
|
|
|
|
|
|
|
|
|
|
|
|
|
|
|
|
|
|
|
|
|
|
|
|
|
|
|
|
|
|
|
|
|
|
|
|
AVG NUM SENTENCES | 2.92 | 3.46 | 3.34 | 2.97 | 3.36 | 2.63 | 2.32 | 2.24 | 1.65 | 2.23 | 3.31
Page 20 Run 12/21/01
Georgia Department of Corrections Office of Planning and Analysis
Inmate statistical profile
Sample: ACTIVE PRISONERS SERVING LIFE EXCLUDING JAIL
Requestor: Statistics
Active inmates 12/21/2001
Number Of Disciplinaries by current age & sex
|
MEN
|
WOMEN
|
| Age | Age | Age | Age | Men
| Age | Age | Age | Age |Women
|Grand
Disciplinaries
|00-21 %|22-39 %|40-54 %|55-99 %|Total % |00-21 %|22-39 %|40-54 %|55-99 %|Total % |Total %
------------------------------------------------------------------------------------------------------------------------------------
ZERO
| 34 19| 398 13| 350 16| 118 26| 900 16 | 1 13| 23 19| 21 23| 13 50| 58 24 | 958 16
ONE
| 23 13| 273 9| 266 12| 74 16| 636 11 | 1 13| 17 14| 17 19| 7 27| 42 17 | 678 11
TWO
| 21 12| 250 8| 193 9| 55 12| 519 9 | 1 13| 14 12| 7 8| 1 4| 23 9 | 542 9
THREE
| 6 3| 171 6| 151 7| 42 9| 370 6 | 0 0| 9 8| 9 10| 1 4| 19 8 | 389 6
FOUR
| 10 6| 173 6| 120 5| 26 6| 329 6 | 1 13| 3 3| 9 10| 1 4| 14 6 | 343 6
FIVE
| 8 5| 145 5| 95 4| 16 3| 264 5 | 0 0| 5 4| 1 1| 0 0| 6 2 | 270 4
MORE THAN FIVE
| 74 42| 1563 53| 1008 46| 130 28| 2775 48 | 4 50| 49 41| 26 29| 3 12| 82 34 | 2857 47
------------------------------------------------------------------------------------------------------------------------------------
Total reported
| 176 100| 2973 100| 2183 100| 461 100| 5793 100 | 8 100| 120 100| 90 100| 26 100| 244 100 | 6037 100
|
|
|
|
|
|
|
|
|
|
|
Percent reported | 100.0| 100.0| 100.0| 100.0| 100.0 | 100.0| 100.0| 100.0| 100.0| 100.0 | 100.0
|
|
|
|
|
|
|
|
|
|
|
|
|
|
|
|
|
|
|
|
|
|
NOT REPORTED
|0|0|1|0|1
|0|0|0|0|0
|1
------------------------------------------------------------------------------------------------------------------------------------
Total
| 176 | 2973 | 2184 | 461 | 5794
| 8 | 120 | 90 | 26 | 244
| 6038
|
|
|
|
|
|
|
|
|
|
|
|
|
|
|
|
|
|
|
|
|
|
|
|
|
|
|
|
|
|
|
|
|
|
|
|
|
|
|
|
|
|
|
|
|
|
|
|
|
|
|
|
|
|
|
AVG NUM DISCIP
| 9.84 | 11.52 | 10.50 | 5.82 | 10.63 | 5.25 | 8.54 | 6.22 | 1.69 | 6.85 | 10.48
Page 21 Run 12/21/01
Georgia Department of Corrections Office of Planning and Analysis
Inmate statistical profile
Sample: ACTIVE PRISONERS SERVING LIFE EXCLUDING JAIL
Requestor: Statistics
Active inmates 12/21/2001
Number Of Escapes by current age & sex
|
MEN
|
WOMEN
|
| Age | Age | Age | Age | Men
| Age | Age | Age | Age |Women
|Grand
Escapes
|00-21 %|22-39 %|40-54 %|55-99 %|Total % |00-21 %|22-39 %|40-54 %|55-99 %|Total % |Total %
------------------------------------------------------------------------------------------------------------------------------------
ZERO
| 176 100| 2942 99| 2095 96| 443 96| 5656 98 | 8 100| 120 100| 88 98| 26 100| 242 99 | 5898 98
ONE
| 0 0| 30 1| 71 3| 13 3| 114 2 | 0 0| 0 0| 2 2| 0 0| 2 1 | 116 2
TWO
| 0 0| 1 0| 14 1| 3 1| 18 0 | 0 0| 0 0| 0 0| 0 0| 0 0 | 18 0
THREE
| 0 0| 0 0| 3 0| 2 0| 5 0 | 0 0| 0 0| 0 0| 0 0| 0 0 | 5 0
FOUR
| 0 0| 0 0| 1 0| 0 0| 1 0 | 0 0| 0 0| 0 0| 0 0| 0 0 | 1 0
FIVE
| 0 0| 0 0| 0 0| 0 0| 0 0 | 0 0| 0 0| 0 0| 0 0| 0 0 | 0 0
MORE THAN FIVE
| 0 0| 0 0| 0 0| 0 0| 0 0 | 0 0| 0 0| 0 0| 0 0| 0 0 | 0 0
------------------------------------------------------------------------------------------------------------------------------------
Total reported
| 176 100| 2973 100| 2184 100| 461 100| 5794 100 | 8 100| 120 100| 90 100| 26 100| 244 100 | 6038 100
|
|
|
|
|
|
|
|
|
|
|
Percent reported | 100.0| 100.0| 100.0| 100.0| 100.0 | 100.0| 100.0| 100.0| 100.0| 100.0 | 100.0
|
|
|
|
|
|
|
|
|
|
|
|
|
|
|
|
|
|
|
|
|
|
NOT REPORTED
|0|0|0|0|0
|0|0|0|0|0
|0
------------------------------------------------------------------------------------------------------------------------------------
Total
| 176 | 2973 | 2184 | 461 | 5794
| 8 | 120 | 90 | 26 | 244
| 6038
|
|
|
|
|
|
|
|
|
|
|
|
|
|
|
|
|
|
|
|
|
|
|
|
|
|
|
|
|
|
|
|
|
|
|
|
|
|
|
|
|
|
|
|
|
|
|
|
|
|
|
|
|
|
|
AVG NUM ESCAPES
| .00 | .01 | .05 | .05 | .03 | .00 | .00 | .02 | .00 | .01 | .03
Page 22 Run 12/21/01
Georgia Department of Corrections Office of Planning and Analysis
Inmate statistical profile
Sample: ACTIVE PRISONERS SERVING LIFE EXCLUDING JAIL
Requestor: Statistics
Active inmates 12/21/2001
Number Of Prior Georgia Incarcerations * by current age & sex
|
MEN
|
WOMEN
|
| Age | Age | Age | Age | Men
| Age | Age | Age | Age |Women
|Grand
Prior Incarcerations|00-21 %|22-39 %|40-54 %|55-99 %|Total % |00-21 %|22-39 %|40-54 %|55-99 %|Total % |Total %
------------------------------------------------------------------------------------------------------------------------------------
ZERO
| 169 96| 2013 68| 1011 46| 252 55| 3445 59 | 8 100| 105 88| 70 78| 24 92| 207 85 | 3652 60
ONE
| 7 4| 547 18| 525 24| 110 24| 1189 21 | 0 0| 11 9| 14 16| 1 4| 26 11 | 1215 20
TWO
| 0 0| 225 8| 343 16| 51 11| 619 11 | 0 0| 3 3| 5 6| 1 4| 9 4 | 628 10
THREE
| 0 0| 124 4| 173 8| 33 7| 330 6 | 0 0| 0 0| 0 0| 0 0| 0 0 | 330 5
FOUR
| 0 0| 50 2| 74 3| 11 2| 135 2 | 0 0| 1 1| 0 0| 0 0| 1 0 | 136 2
FIVE
| 0 0| 11 0| 35 2| 2 0| 48 1 | 0 0| 0 0| 0 0| 0 0| 0 0 | 48 1
MORE THAN FIVE
| 0 0| 3 0| 23 1| 2 0| 28 0 | 0 0| 0 0| 1 1| 0 0| 1 0 | 29 0
------------------------------------------------------------------------------------------------------------------------------------
Total reported
| 176 100| 2973 100| 2184 100| 461 100| 5794 100 | 8 100| 120 100| 90 100| 26 100| 244 100 | 6038 100
|
|
|
|
|
|
|
|
|
|
|
Percent reported | 100.0| 100.0| 100.0| 100.0| 100.0 | 100.0| 100.0| 100.0| 100.0| 100.0 | 100.0
|
|
|
|
|
|
|
|
|
|
|
|
|
|
|
|
|
|
|
|
|
|
NOT REPORTED
|0|0|0|0|0
|0|0|0|0|0
|0
------------------------------------------------------------------------------------------------------------------------------------
Total
| 176 | 2973 | 2184 | 461 | 5794
| 8 | 120 | 90 | 26 | 244
| 6038
|
|
|
|
|
|
|
|
|
|
|
|
|
|
|
|
|
|
|
|
|
|
|
|
|
|
|
|
|
|
|
|
|
|
|
|
|
|
|
|
|
|
|
|
|
|
|
|
|
|
|
|
|
|
|
AVG # INCARCERATIONS| .04 | .55 | 1.07 | .82 | .76 | .00 | .18 | .36 | .12 | .23 | .73
* This data counts a parole revocation on an existing sentenCE AS A prior incarceration. Also, this data counts, for any cohort of inmates, the total number of Georgia incarcerations the inmate has had during his entire criminal career. For example, if an inmate was admitted to prison first in FY72, and then re-admitted in FY79 and FY85, he had two prior incarcerations before the FY85 admission. This inmate's records show two prior incarcerations in all three of his records since he has had two prior incarcerations in his criminal career. If the cohort of FY72 admissions is selected for analysis, two prior incarcerations will be listed for this inmate even though in FY72, he had no prior incarcerations.
Page 23 Run 12/21/01
Georgia Department of Corrections Office of Planning and Analysis
Inmate statistical profile
Sample: ACTIVE PRISONERS SERVING LIFE EXCLUDING JAIL
Requestor: Statistics
Active inmates 12/21/2001
Number Of Transfers by current age & sex
|
MEN
|
WOMEN
|
| Age | Age | Age | Age | Men
| Age | Age | Age | Age |Women
|Grand
Transfers
|00-21 %|22-39 %|40-54 %|55-99 %|Total % |00-21 %|22-39 %|40-54 %|55-99 %|Total % |Total %
------------------------------------------------------------------------------------------------------------------------------------
ZERO
| 48 27| 86 3| 18 1| 6 1| 158 3 | 0 0| 3 3| 5 6| 1 4| 9 4 | 167 3
ONE
| 90 51| 828 28| 382 17| 95 21| 1395 24 | 7 88| 39 33| 26 29| 5 19| 77 32 | 1472 24
TWO
| 25 14| 670 23| 363 17| 71 15| 1129 19 | 0 0| 41 34| 17 19| 5 19| 63 26 | 1192 20
THREE
| 10 6| 450 15| 304 14| 72 16| 836 14 | 1 13| 15 13| 16 18| 7 27| 39 16 | 875 14
FOUR
| 2 1| 319 11| 245 11| 47 10| 613 11 | 0 0| 11 9| 11 12| 3 12| 25 10 | 638 11
FIVE
| 1 1| 210 7| 203 9| 39 8| 453 8 | 0 0| 5 4| 6 7| 3 12| 14 6 | 467 8
MORE THAN FIVE
| 0 0| 410 14| 669 31| 131 28| 1210 21 | 0 0| 6 5| 9 10| 2 8| 17 7 | 1227 20
------------------------------------------------------------------------------------------------------------------------------------
Total reported
| 176 100| 2973 100| 2184 100| 461 100| 5794 100 | 8 100| 120 100| 90 100| 26 100| 244 100 | 6038 100
|
|
|
|
|
|
|
|
|
|
|
Percent reported | 100.0| 100.0| 100.0| 100.0| 100.0 | 100.0| 100.0| 100.0| 100.0| 100.0 | 100.0
|
|
|
|
|
|
|
|
|
|
|
|
|
|
|
|
|
|
|
|
|
|
NOT REPORTED
|0|0|0|0|0
|0|0|0|0|0
|0
------------------------------------------------------------------------------------------------------------------------------------
Total
| 176 | 2973 | 2184 | 461 | 5794
| 8 | 120 | 90 | 26 | 244
| 6038
|
|
|
|
|
|
|
|
|
|
|
|
|
|
|
|
|
|
|
|
|
|
|
|
|
|
|
|
|
|
|
|
|
|
|
|
|
|
|
|
|
|
|
|
|
|
|
|
|
|
|
|
|
|
|
AVG NUM TRANSFERS | 1.04 | 3.06 | 4.67 | 4.44 | 3.72 | 1.25 | 2.31 | 2.83 | 2.96 | 2.54 | 3.67
Page 24 Run 12/21/01
Georgia Department of Corrections Office of Planning and Analysis
Inmate statistical profile
Sample: ACTIVE PRISONERS SERVING LIFE EXCLUDING JAIL
Requestor: Statistics
Active inmates 12/21/2001
County Of Conviction by current age & sex
|
MEN
|
WOMEN
|
| Age | Age | Age | Age | Men
| Age | Age | Age | Age |Women
|Grand
County Of Conviction|00-21 %|22-39 %|40-54 %|55-99 %|Total % |00-21 %|22-39 %|40-54 %|55-99 %|Total % |Total %
------------------------------------------------------------------------------------------------------------------------------------
Appling
| 0 0| 5 0| 4 0| 1 0| 10 0 | 0 0| 0 0| 0 0| 0 0| 0 0 | 10 0
Atkinson
| 0 0| 1 0| 2 0| 2 0| 5 0 | 0 0| 0 0| 1 1| 0 0| 1 0 | 6 0
Bacon
| 0 0| 5 0| 4 0| 0 0| 9 0 | 0 0| 0 0| 0 0| 0 0| 0 0 | 9 0
Baker
| 0 0| 1 0| 1 0| 0 0| 2 0 | 0 0| 0 0| 0 0| 0 0| 0 0 | 2 0
Baldwin
| 1 1| 17 1| 11 1| 2 0| 31 1 | 0 0| 1 1| 0 0| 0 0| 1 0 | 32 1
Banks
| 0 0| 2 0| 8 0| 3 1| 13 0 | 0 0| 0 0| 0 0| 0 0| 0 0 | 13 0
Barrow
| 0 0| 4 0| 9 0| 4 1| 17 0 | 0 0| 0 0| 1 1| 0 0| 1 0 | 18 0
Bartow
| 1 1| 26 1| 20 1| 3 1| 50 1 | 0 0| 1 1| 0 0| 0 0| 1 0 | 51 1
Ben Hill
| 0 0| 5 0| 10 0| 3 1| 18 0 | 0 0| 0 0| 0 0| 0 0| 0 0 | 18 0
Berrien
| 0 0| 3 0| 2 0| 0 0| 5 0 | 0 0| 0 0| 0 0| 0 0| 0 0 | 5 0
Bibb
| 5 3| 89 3| 86 4| 16 3| 196 3 | 1 13| 1 1| 2 2| 1 4| 5 2 | 201 3
Bleckley
| 0 0| 6 0| 5 0| 1 0| 12 0 | 0 0| 0 0| 1 1| 0 0| 1 0 | 13 0
Brantley
| 0 0| 1 0| 4 0| 2 0| 7 0 | 0 0| 0 0| 0 0| 0 0| 0 0 | 7 0
Brooks
| 0 0| 5 0| 3 0| 3 1| 11 0 | 0 0| 0 0| 0 0| 0 0| 0 0 | 11 0
Bryan
| 0 0| 9 0| 5 0| 1 0| 15 0 | 0 0| 0 0| 0 0| 1 4| 1 0 | 16 0
Bulloch
| 1 1| 16 1| 15 1| 0 0| 32 1 | 0 0| 1 1| 1 1| 1 4| 3 1 | 35 1
Burke
| 3 2| 15 1| 13 1| 1 0| 32 1 | 0 0| 0 0| 0 0| 0 0| 0 0 | 32 1
Butts
| 2 1| 19 1| 10 0| 3 1| 34 1 | 0 0| 1 1| 0 0| 0 0| 1 0 | 35 1
Calhoun
| 0 0| 2 0| 4 0| 1 0| 7 0 | 0 0| 0 0| 0 0| 0 0| 0 0 | 7 0
Camden
| 0 0| 20 1| 8 0| 0 0| 28 0 | 0 0| 0 0| 1 1| 0 0| 1 0 | 29 0
Candler
| 0 0| 1 0| 1 0| 0 0| 2 0 | 0 0| 0 0| 0 0| 0 0| 0 0 | 2 0
Carroll
| 1 1| 19 1| 13 1| 5 1| 38 1 | 0 0| 3 3| 1 1| 0 0| 4 2 | 42 1
Catoosa
| 0 0| 5 0| 9 0| 0 0| 14 0 | 0 0| 0 0| 0 0| 0 0| 0 0 | 14 0
Charlton
| 0 0| 0 0| 1 0| 0 0| 1 0 | 0 0| 2 2| 0 0| 0 0| 2 1 | 3 0
Chatham
| 10 6| 165 6| 111 5| 19 4| 305 5 | 0 0| 2 2| 1 1| 0 0| 3 1 | 308 5
Chattahoochee
| 0 0| 1 0| 2 0| 0 0| 3 0 | 0 0| 0 0| 0 0| 0 0| 0 0 | 3 0
Chatooga
| 0 0| 5 0| 6 0| 2 0| 13 0 | 0 0| 0 0| 1 1| 1 4| 2 1 | 15 0
Cherokee
| 0 0| 6 0| 21 1| 4 1| 31 1 | 0 0| 3 3| 0 0| 0 0| 3 1 | 34 1
Clarke
| 2 1| 37 1| 23 1| 8 2| 70 1 | 0 0| 3 3| 0 0| 1 4| 4 2 | 74 1
Clay
| 0 0| 1 0| 1 0| 0 0| 2 0 | 0 0| 0 0| 0 0| 0 0| 0 0 | 2 0
Clayton
| 6 3| 73 2| 43 2| 11 2| 133 2 | 1 13| 2 2| 2 2| 1 4| 6 2 | 139 2
Clinch
| 0 0| 1 0| 3 0| 0 0| 4 0 | 0 0| 0 0| 0 0| 0 0| 0 0 | 4 0
Cobb
| 8 5| 107 4| 77 4| 17 4| 209 4 | 0 0| 5 4| 4 4| 1 4| 10 4 | 219 4
Coffee
| 0 0| 7 0| 10 0| 2 0| 19 0 | 0 0| 1 1| 1 1| 0 0| 2 1 | 21 0
Colquit
| 3 2| 34 1| 26 1| 5 1| 68 1 | 0 0| 0 0| 1 1| 1 4| 2 1 | 70 1
Columbia
| 1 1| 6 0| 11 1| 1 0| 19 0 | 0 0| 0 0| 1 1| 0 0| 1 0 | 20 0
------------------------------------------------------------------------------------------------------------------------------------
(continued)
Page 25 Run 12/21/01
Georgia Department of Corrections Office of Planning and Analysis
Inmate statistical profile
Sample: ACTIVE PRISONERS SERVING LIFE EXCLUDING JAIL
Requestor:
Active inmates 12/21/2001
County Of Conviction by current age & sex
Statistics (continued)
|
MEN
|
WOMEN
|
| Age | Age | Age | Age | Men
| Age | Age | Age | Age |Women
|Grand
County Of Conviction|00-21 %|22-39 %|40-54 %|55-99 %|Total % |00-21 %|22-39 %|40-54 %|55-99 %|Total % |Total %
------------------------------------------------------------------------------------------------------------------------------------
Cook
| 0 0| 7 0| 4 0| 0 0| 11 0 | 0 0| 1 1| 0 0| 0 0| 1 0 | 12 0
Coweta
| 2 1| 24 1| 11 1| 3 1| 40 1 | 0 0| 2 2| 1 1| 0 0| 3 1 | 43 1
Crawford
| 0 0| 3 0| 0 0| 0 0| 3 0 | 0 0| 0 0| 0 0| 0 0| 0 0 | 3 0
Crisp
| 4 2| 14 0| 10 0| 3 1| 31 1 | 0 0| 3 3| 0 0| 1 4| 4 2 | 35 1
Dade
| 2 1| 6 0| 5 0| 2 0| 15 0 | 0 0| 0 0| 0 0| 0 0| 0 0 | 15 0
Dawson
| 0 0| 2 0| 4 0| 0 0| 6 0 | 0 0| 0 0| 0 0| 0 0| 0 0 | 6 0
Decatur
| 1 1| 20 1| 5 0| 2 0| 28 0 | 0 0| 1 1| 0 0| 0 0| 1 0 | 29 0
DeKalb
| 16 9| 249 8| 174 8| 27 6| 466 8 | 0 0| 5 4| 4 4| 1 4| 10 4 | 476 8
Dodge
| 0 0| 6 0| 6 0| 1 0| 13 0 | 0 0| 0 0| 0 0| 0 0| 0 0 | 13 0
Dooly
| 2 1| 7 0| 8 0| 0 0| 17 0 | 0 0| 0 0| 0 0| 0 0| 0 0 | 17 0
Dougherty
| 4 2| 74 2| 41 2| 5 1| 124 2 | 0 0| 4 3| 1 1| 0 0| 5 2 | 129 2
Douglas
| 1 1| 52 2| 20 1| 6 1| 79 1 | 0 0| 1 1| 1 1| 0 0| 2 1 | 81 1
Early
| 0 0| 11 0| 5 0| 2 0| 18 0 | 0 0| 0 0| 0 0| 0 0| 0 0 | 18 0
Effingham
| 0 0| 5 0| 4 0| 0 0| 9 0 | 0 0| 0 0| 0 0| 0 0| 0 0 | 9 0
Elbert
| 0 0| 11 0| 11 1| 1 0| 23 0 | 0 0| 1 1| 0 0| 0 0| 1 0 | 24 0
Emanuel
| 0 0| 8 0| 10 0| 3 1| 21 0 | 0 0| 0 0| 1 1| 0 0| 1 0 | 22 0
Evans
| 0 0| 7 0| 2 0| 2 0| 11 0 | 0 0| 0 0| 0 0| 0 0| 0 0 | 11 0
Fannin
| 0 0| 4 0| 5 0| 1 0| 10 0 | 0 0| 0 0| 0 0| 0 0| 0 0 | 10 0
Fayette
| 1 1| 10 0| 5 0| 0 0| 16 0 | 0 0| 0 0| 0 0| 0 0| 0 0 | 16 0
Floyd
| 1 1| 24 1| 29 1| 7 2| 61 1 | 2 25| 2 2| 3 3| 1 4| 8 3 | 69 1
Forsyth
| 0 0| 5 0| 9 0| 4 1| 18 0 | 0 0| 1 1| 1 1| 0 0| 2 1 | 20 0
Franklin
| 1 1| 2 0| 4 0| 1 0| 8 0 | 0 0| 0 0| 2 2| 1 4| 3 1 | 11 0
Fulton
| 26 15| 463 16| 322 15| 69 15| 880 15 | 0 0| 14 12| 9 10| 3 12| 26 11 | 906 15
Gilmer
| 0 0| 1 0| 2 0| 3 1| 6 0 | 0 0| 0 0| 0 0| 0 0| 0 0 | 6 0
Glynn
| 4 2| 34 1| 27 1| 4 1| 69 1 | 0 0| 2 2| 1 1| 0 0| 3 1 | 72 1
Gordon
| 0 0| 21 1| 12 1| 2 0| 35 1 | 0 0| 0 0| 1 1| 0 0| 1 0 | 36 1
Grady
| 4 2| 20 1| 9 0| 1 0| 34 1 | 0 0| 0 0| 0 0| 0 0| 0 0 | 34 1
Greene
| 0 0| 3 0| 5 0| 1 0| 9 0 | 0 0| 0 0| 0 0| 0 0| 0 0 | 9 0
Gwinnett
| 1 1| 68 2| 46 2| 9 2| 124 2 | 0 0| 3 3| 5 6| 1 4| 9 4 | 133 2
Habersham
| 1 1| 11 0| 10 0| 0 0| 22 0 | 0 0| 0 0| 0 0| 0 0| 0 0 | 22 0
Hall
| 2 1| 36 1| 43 2| 10 2| 91 2 | 1 13| 2 2| 2 2| 1 4| 6 2 | 97 2
Hancock
| 0 0| 3 0| 1 0| 0 0| 4 0 | 0 0| 0 0| 1 1| 0 0| 1 0 | 5 0
Haralson
| 0 0| 3 0| 2 0| 1 0| 6 0 | 0 0| 0 0| 0 0| 0 0| 0 0 | 6 0
Harris
| 1 1| 8 0| 3 0| 0 0| 12 0 | 0 0| 0 0| 0 0| 0 0| 0 0 | 12 0
Hart
| 0 0| 2 0| 3 0| 0 0| 5 0 | 0 0| 0 0| 0 0| 0 0| 0 0 | 5 0
------------------------------------------------------------------------------------------------------------------------------------
(continued)
Page 26 Run 12/21/01
Georgia Department of Corrections Office of Planning and Analysis
Inmate statistical profile
Sample: ACTIVE PRISONERS SERVING LIFE EXCLUDING JAIL
Requestor:
Active inmates 12/21/2001
County Of Conviction by current age & sex
Statistics (continued)
|
MEN
|
WOMEN
|
| Age | Age | Age | Age | Men
| Age | Age | Age | Age |Women
|Grand
County Of Conviction|00-21 %|22-39 %|40-54 %|55-99 %|Total % |00-21 %|22-39 %|40-54 %|55-99 %|Total % |Total %
------------------------------------------------------------------------------------------------------------------------------------
Heard
| 0 0| 2 0| 0 0| 3 1| 5 0 | 0 0| 0 0| 0 0| 0 0| 0 0 | 5 0
Henry
| 1 1| 21 1| 10 0| 1 0| 33 1 | 0 0| 1 1| 0 0| 0 0| 1 0 | 34 1
Houston
| 2 1| 36 1| 22 1| 3 1| 63 1 | 0 0| 3 3| 3 3| 1 4| 7 3 | 70 1
Irwin
| 0 0| 2 0| 2 0| 1 0| 5 0 | 0 0| 0 0| 0 0| 0 0| 0 0 | 5 0
Jackson
| 0 0| 7 0| 13 1| 1 0| 21 0 | 0 0| 1 1| 0 0| 0 0| 1 0 | 22 0
Jasper
| 0 0| 6 0| 2 0| 0 0| 8 0 | 0 0| 0 0| 1 1| 0 0| 1 0 | 9 0
Jeff Davis
| 0 0| 4 0| 4 0| 2 0| 10 0 | 0 0| 0 0| 0 0| 0 0| 0 0 | 10 0
Jefferson
| 0 0| 7 0| 7 0| 4 1| 18 0 | 0 0| 0 0| 0 0| 0 0| 0 0 | 18 0
Jenkins
| 0 0| 1 0| 5 0| 0 0| 6 0 | 0 0| 0 0| 0 0| 0 0| 0 0 | 6 0
Johnson
| 0 0| 8 0| 3 0| 1 0| 12 0 | 0 0| 1 1| 0 0| 0 0| 1 0 | 13 0
Jones
| 0 0| 2 0| 8 0| 3 1| 13 0 | 0 0| 0 0| 0 0| 0 0| 0 0 | 13 0
Lamar
| 0 0| 10 0| 9 0| 2 0| 21 0 | 0 0| 0 0| 1 1| 0 0| 1 0 | 22 0
Lanier
| 0 0| 1 0| 0 0| 0 0| 1 0 | 0 0| 0 0| 0 0| 0 0| 0 0 | 1 0
Laurens
| 1 1| 8 0| 11 1| 1 0| 21 0 | 0 0| 1 1| 2 2| 0 0| 3 1 | 24 0
Lee
| 0 0| 2 0| 0 0| 0 0| 2 0 | 1 13| 0 0| 0 0| 0 0| 1 0 | 3 0
Liberty
| 0 0| 21 1| 9 0| 4 1| 34 1 | 0 0| 1 1| 0 0| 0 0| 1 0 | 35 1
Lincoln
| 0 0| 3 0| 1 0| 1 0| 5 0 | 0 0| 0 0| 0 0| 0 0| 0 0 | 5 0
Long
| 3 2| 4 0| 4 0| 2 0| 13 0 | 0 0| 2 2| 0 0| 0 0| 2 1 | 15 0
Lowndes
| 0 0| 41 1| 28 1| 2 0| 71 1 | 0 0| 0 0| 2 2| 1 4| 3 1 | 74 1
Lumpkins
| 1 1| 3 0| 0 0| 2 0| 6 0 | 0 0| 0 0| 0 0| 0 0| 0 0 | 6 0
Macon
| 0 0| 15 1| 7 0| 1 0| 23 0 | 0 0| 0 0| 0 0| 0 0| 0 0 | 23 0
Madison
| 0 0| 9 0| 5 0| 2 0| 16 0 | 0 0| 3 3| 0 0| 0 0| 3 1 | 19 0
Marion
| 0 0| 2 0| 1 0| 0 0| 3 0 | 0 0| 0 0| 0 0| 1 4| 1 0 | 4 0
McDuffie
| 0 0| 25 1| 14 1| 4 1| 43 1 | 1 13| 0 0| 0 0| 0 0| 1 0 | 44 1
McIntosh
| 1 1| 8 0| 8 0| 1 0| 18 0 | 0 0| 0 0| 0 0| 0 0| 0 0 | 18 0
Meriwether
| 1 1| 10 0| 9 0| 4 1| 24 0 | 0 0| 2 2| 0 0| 1 4| 3 1 | 27 0
Miller
| 0 0| 1 0| 2 0| 0 0| 3 0 | 0 0| 0 0| 0 0| 0 0| 0 0 | 3 0
Mitchell
| 0 0| 12 0| 10 0| 3 1| 25 0 | 0 0| 2 2| 0 0| 0 0| 2 1 | 27 0
Monroe
| 0 0| 11 0| 9 0| 2 0| 22 0 | 0 0| 1 1| 0 0| 0 0| 1 0 | 23 0
Montgomery
| 0 0| 0 0| 3 0| 0 0| 3 0 | 0 0| 0 0| 0 0| 0 0| 0 0 | 3 0
Morgan
| 0 0| 10 0| 3 0| 0 0| 13 0 | 0 0| 1 1| 0 0| 0 0| 1 0 | 14 0
Murray
| 1 1| 5 0| 6 0| 5 1| 17 0 | 0 0| 0 0| 0 0| 0 0| 0 0 | 17 0
Muscogee
| 2 1| 86 3| 78 4| 15 3| 181 3 | 0 0| 3 3| 3 3| 0 0| 6 2 | 187 3
Newton
| 2 1| 42 1| 16 1| 4 1| 64 1 | 0 0| 2 2| 0 0| 0 0| 2 1 | 66 1
Oconee
| 0 0| 8 0| 4 0| 0 0| 12 0 | 0 0| 0 0| 0 0| 0 0| 0 0 | 12 0
------------------------------------------------------------------------------------------------------------------------------------
(continued)
Page 27 Run 12/21/01
Georgia Department of Corrections Office of Planning and Analysis
Inmate statistical profile
Sample: ACTIVE PRISONERS SERVING LIFE EXCLUDING JAIL
Requestor:
Active inmates 12/21/2001
County Of Conviction by current age & sex
Statistics (continued)
|
MEN
|
WOMEN
|
| Age | Age | Age | Age | Men
| Age | Age | Age | Age |Women
|Grand
County Of Conviction|00-21 %|22-39 %|40-54 %|55-99 %|Total % |00-21 %|22-39 %|40-54 %|55-99 %|Total % |Total %
------------------------------------------------------------------------------------------------------------------------------------
Oglethrope
| 0 0| 3 0| 5 0| 1 0| 9 0 | 0 0| 0 0| 0 0| 0 0| 0 0 | 9 0
Paulding
| 0 0| 4 0| 6 0| 2 0| 12 0 | 0 0| 1 1| 0 0| 0 0| 1 0 | 13 0
Peach
| 0 0| 6 0| 3 0| 0 0| 9 0 | 0 0| 0 0| 1 1| 0 0| 1 0 | 10 0
Pickens
| 0 0| 2 0| 2 0| 1 0| 5 0 | 0 0| 0 0| 1 1| 0 0| 1 0 | 6 0
Pierce
| 3 2| 2 0| 4 0| 1 0| 10 0 | 0 0| 0 0| 0 0| 0 0| 0 0 | 10 0
Pike
| 0 0| 1 0| 1 0| 0 0| 2 0 | 0 0| 0 0| 0 0| 0 0| 0 0 | 2 0
Polk
| 1 1| 15 1| 6 0| 2 0| 24 0 | 0 0| 0 0| 0 0| 0 0| 0 0 | 24 0
Pulaski
| 0 0| 7 0| 1 0| 0 0| 8 0 | 0 0| 1 1| 0 0| 0 0| 1 0 | 9 0
Putnam
| 1 1| 19 1| 14 1| 3 1| 37 1 | 0 0| 0 0| 0 0| 0 0| 0 0 | 37 1
Quitman
| 0 0| 4 0| 0 0| 0 0| 4 0 | 0 0| 0 0| 0 0| 0 0| 0 0 | 4 0
Rabun
| 0 0| 6 0| 3 0| 0 0| 9 0 | 0 0| 0 0| 0 0| 0 0| 0 0 | 9 0
Randolph
| 0 0| 4 0| 2 0| 2 0| 8 0 | 0 0| 0 0| 0 0| 0 0| 0 0 | 8 0
Richmond
| 11 6| 157 5| 77 4| 16 3| 261 5 | 0 0| 8 7| 8 9| 1 4| 17 7 | 278 5
Rockdale
| 1 1| 10 0| 12 1| 4 1| 27 0 | 0 0| 1 1| 0 0| 0 0| 1 0 | 28 0
Schely
| 0 0| 3 0| 2 0| 0 0| 5 0 | 0 0| 0 0| 0 0| 0 0| 0 0 | 5 0
Screven
| 0 0| 5 0| 4 0| 3 1| 12 0 | 0 0| 0 0| 0 0| 0 0| 0 0 | 12 0
Seminole
| 0 0| 5 0| 4 0| 2 0| 11 0 | 0 0| 1 1| 0 0| 0 0| 1 0 | 12 0
Spalding
| 2 1| 38 1| 26 1| 6 1| 72 1 | 1 13| 2 2| 1 1| 2 8| 6 2 | 78 1
Stephens
| 0 0| 3 0| 4 0| 3 1| 10 0 | 0 0| 0 0| 0 0| 0 0| 0 0 | 10 0
Stewart
| 0 0| 2 0| 1 0| 0 0| 3 0 | 0 0| 0 0| 2 2| 0 0| 2 1 | 5 0
Sumter
| 1 1| 5 0| 13 1| 1 0| 20 0 | 0 0| 0 0| 1 1| 0 0| 1 0 | 21 0
Talbot
| 2 1| 5 0| 1 0| 0 0| 8 0 | 0 0| 0 0| 1 1| 0 0| 1 0 | 9 0
Taliaferro
| 0 0| 0 0| 3 0| 0 0| 3 0 | 0 0| 0 0| 0 0| 0 0| 0 0 | 3 0
Tattnall
| 0 0| 17 1| 13 1| 2 0| 32 1 | 0 0| 0 0| 1 1| 0 0| 1 0 | 33 1
Taylor
| 2 1| 10 0| 5 0| 0 0| 17 0 | 0 0| 0 0| 0 0| 0 0| 0 0 | 17 0
Telfair
| 1 1| 6 0| 2 0| 0 0| 9 0 | 0 0| 0 0| 1 1| 0 0| 1 0 | 10 0
Terrell
| 1 1| 12 0| 2 0| 2 0| 17 0 | 0 0| 0 0| 0 0| 0 0| 0 0 | 17 0
Thomas
| 2 1| 15 1| 23 1| 3 1| 43 1 | 0 0| 1 1| 1 1| 0 0| 2 1 | 45 1
Tift
| 5 3| 34 1| 23 1| 3 1| 65 1 | 0 0| 0 0| 2 2| 1 4| 3 1 | 68 1
Toombs
| 3 2| 21 1| 10 0| 2 0| 36 1 | 0 0| 2 2| 0 0| 0 0| 2 1 | 38 1
Towns
| 0 0| 1 0| 1 0| 0 0| 2 0 | 0 0| 0 0| 0 0| 0 0| 0 0 | 2 0
Treutlen
| 0 0| 3 0| 4 0| 0 0| 7 0 | 0 0| 0 0| 0 0| 0 0| 0 0 | 7 0
Troup
| 2 1| 24 1| 27 1| 6 1| 59 1 | 0 0| 1 1| 2 2| 0 0| 3 1 | 62 1
Turner
| 0 0| 7 0| 7 0| 1 0| 15 0 | 0 0| 0 0| 0 0| 0 0| 0 0 | 15 0
Twiggs
| 0 0| 3 0| 5 0| 1 0| 9 0 | 0 0| 0 0| 0 0| 0 0| 0 0 | 9 0
------------------------------------------------------------------------------------------------------------------------------------
(continued)
Page 28 Run 12/21/01
Georgia Department of Corrections Office of Planning and Analysis
Inmate statistical profile
Sample: ACTIVE PRISONERS SERVING LIFE EXCLUDING JAIL
Requestor:
Active inmates 12/21/2001
County Of Conviction by current age & sex
Statistics (continued)
|
MEN
|
WOMEN
|
| Age | Age | Age | Age | Men
| Age | Age | Age | Age |Women
|Grand
County Of Conviction|00-21 %|22-39 %|40-54 %|55-99 %|Total % |00-21 %|22-39 %|40-54 %|55-99 %|Total % |Total %
------------------------------------------------------------------------------------------------------------------------------------
Union
| 0 0| 0 0| 1 0| 0 0| 1 0 | 0 0| 0 0| 0 0| 0 0| 0 0 | 1 0
Upson
| 1 1| 8 0| 4 0| 1 0| 14 0 | 0 0| 0 0| 1 1| 0 0| 1 0 | 15 0
Walker
| 0 0| 15 1| 11 1| 4 1| 30 1 | 0 0| 1 1| 1 1| 0 0| 2 1 | 32 1
Walton
| 3 2| 26 1| 20 1| 3 1| 52 1 | 0 0| 1 1| 0 0| 0 0| 1 0 | 53 1
Ware
| 0 0| 12 0| 12 1| 3 1| 27 0 | 0 0| 0 0| 1 1| 0 0| 1 0 | 28 0
Warren
| 0 0| 4 0| 6 0| 1 0| 11 0 | 0 0| 0 0| 0 0| 0 0| 0 0 | 11 0
Washington
| 0 0| 7 0| 6 0| 2 0| 15 0 | 0 0| 2 2| 0 0| 0 0| 2 1 | 17 0
Wayne
| 0 0| 7 0| 9 0| 2 0| 18 0 | 0 0| 1 1| 0 0| 0 0| 1 0 | 19 0
Webster
| 0 0| 1 0| 0 0| 0 0| 1 0 | 0 0| 0 0| 0 0| 0 0| 0 0 | 1 0
Wheeler
| 0 0| 3 0| 3 0| 1 0| 7 0 | 0 0| 0 0| 0 0| 1 4| 1 0 | 8 0
White
| 0 0| 3 0| 1 0| 1 0| 5 0 | 0 0| 0 0| 0 0| 0 0| 0 0 | 5 0
Whitfield
| 1 1| 22 1| 25 1| 8 2| 56 1 | 0 0| 5 4| 1 1| 0 0| 6 2 | 62 1
Wilcox
| 0 0| 1 0| 5 0| 1 0| 7 0 | 0 0| 0 0| 0 0| 0 0| 0 0 | 7 0
Wilkes
| 0 0| 6 0| 6 0| 1 0| 13 0 | 0 0| 0 0| 0 0| 0 0| 0 0 | 13 0
Wilkinson
| 0 0| 6 0| 2 0| 0 0| 8 0 | 0 0| 0 0| 0 0| 0 0| 0 0 | 8 0
Worth
| 0 0| 16 1| 5 0| 2 0| 23 0 | 0 0| 0 0| 0 0| 0 0| 0 0 | 23 0
------------------------------------------------------------------------------------------------------------------------------------
Total reported
| 176 100| 2972 100| 2184 100| 461 100| 5793 100 | 8 100| 120 100| 90 100| 26 100| 244 100 | 6037 100
|
|
|
|
|
|
|
|
|
|
|
Percent reported | 100.0| 100.0| 100.0| 100.0| 100.0 | 100.0| 100.0| 100.0| 100.0| 100.0 | 100.0
|
|
|
|
|
|
|
|
|
|
|
|
|
|
|
|
|
|
|
|
|
|
Not reported
|0|1|0|0|1
|0|0|0|0|0
|1
------------------------------------------------------------------------------------------------------------------------------------
Total
| 176 | 2973 | 2184 | 461 | 5794
| 8 | 120 | 90 | 26 | 244
| 6038
Page 29 Run 12/21/01
Georgia Department of Corrections Office of Planning and Analysis
Inmate statistical profile
Sample: ACTIVE PRISONERS SERVING LIFE EXCLUDING JAIL
Requestor: Statistics
Active inmates 12/21/2001
Circ Of Conviction by current age & sex
|
MEN
|
WOMEN
|
| Age | Age | Age | Age | Men
| Age | Age | Age | Age |Women
|Grand
Circ Of Conviction |00-21 %|22-39 %|40-54 %|55-99 %|Total % |00-21 %|22-39 %|40-54 %|55-99 %|Total % |Total %
------------------------------------------------------------------------------------------------------------------------------------
Alapaha
| 0 0| 13 0| 11 1| 2 0| 26 0 | 0 0| 1 1| 1 1| 0 0| 2 1 | 28 0
Alcovy
| 5 3| 68 2| 36 2| 7 2| 116 2 | 0 0| 3 3| 0 0| 0 0| 3 1 | 119 2
Atlanta
| 26 15| 463 16| 322 15| 69 15| 880 15 | 0 0| 14 12| 9 10| 3 12| 26 11 | 906 15
Atlantic
| 4 2| 66 2| 41 2| 12 3| 123 2 | 0 0| 3 3| 1 1| 1 4| 5 2 | 128 2
Augusta
| 15 9| 178 6| 101 5| 18 4| 312 5 | 0 0| 8 7| 9 10| 1 4| 18 7 | 330 5
Blue Ridge
| 0 0| 6 0| 21 1| 4 1| 31 1 | 0 0| 3 3| 0 0| 0 0| 3 1 | 34 1
Brunswick
| 4 2| 70 2| 52 2| 9 2| 135 2 | 0 0| 3 3| 2 2| 0 0| 5 2 | 140 2
Chattahoochee
| 7 4| 112 4| 90 4| 15 3| 224 4 | 0 0| 3 3| 4 4| 1 4| 8 3 | 232 4
Cherokee
| 1 1| 47 2| 32 1| 5 1| 85 1 | 0 0| 1 1| 1 1| 0 0| 2 1 | 87 1
Clayton
| 6 3| 73 2| 43 2| 11 2| 133 2 | 1 13| 2 2| 2 2| 1 4| 6 2 | 139 2
Cobb
| 8 5| 107 4| 77 4| 17 4| 209 4 | 0 0| 5 4| 4 4| 1 4| 10 4 | 219 4
Conasauga
| 2 1| 27 1| 31 1| 13 3| 73 1 | 0 0| 5 4| 1 1| 0 0| 6 2 | 79 1
Cordele
| 6 3| 27 1| 33 2| 7 2| 73 1 | 0 0| 3 3| 0 0| 1 4| 4 2 | 77 1
Coweta
| 6 3| 79 3| 60 3| 21 5| 166 3 | 0 0| 8 7| 4 4| 1 4| 13 5 | 179 3
Dougherty
| 4 2| 74 2| 41 2| 5 1| 124 2 | 0 0| 4 3| 1 1| 0 0| 5 2 | 129 2
Dublin
| 1 1| 22 1| 23 1| 3 1| 49 1 | 0 0| 2 2| 2 2| 0 0| 4 2 | 53 1
Eastern
| 10 6| 165 6| 111 5| 19 4| 305 5 | 0 0| 2 2| 1 1| 0 0| 3 1 | 308 5
Flint
| 1 1| 21 1| 10 0| 1 0| 33 1 | 0 0| 1 1| 0 0| 0 0| 1 0 | 34 1
Griffin
| 4 2| 57 2| 36 2| 7 2| 104 2 | 1 13| 2 2| 2 2| 2 8| 7 3 | 111 2
Gwinnett
| 1 1| 68 2| 46 2| 9 2| 124 2 | 0 0| 3 3| 5 6| 1 4| 9 4 | 133 2
Houston
| 2 1| 36 1| 22 1| 3 1| 63 1 | 0 0| 3 3| 3 3| 1 4| 7 3 | 70 1
Lookout Mountain | 2 1| 31 1| 31 1| 8 2| 72 1 | 0 0| 1 1| 2 2| 1 4| 4 2 | 76 1
Macon
| 5 3| 98 3| 89 4| 16 3| 208 4 | 1 13| 1 1| 3 3| 1 4| 6 2 | 214 4
Middle
| 3 2| 44 1| 34 2| 11 2| 92 2 | 0 0| 4 3| 1 1| 0 0| 5 2 | 97 2
Mountain
| 1 1| 20 1| 17 1| 3 1| 41 1 | 0 0| 0 0| 0 0| 0 0| 0 0 | 41 1
Northeastern
| 2 1| 38 1| 47 2| 10 2| 97 2 | 1 13| 2 2| 2 2| 1 4| 6 2 | 103 2
Northern
| 1 1| 27 1| 28 1| 5 1| 61 1 | 0 0| 4 3| 2 2| 1 4| 7 3 | 68 1
Ocmulgee
| 2 1| 66 2| 46 2| 9 2| 123 2 | 0 0| 2 2| 2 2| 0 0| 4 2 | 127 2
Oconee
| 1 1| 28 1| 20 1| 3 1| 52 1 | 0 0| 1 1| 2 2| 1 4| 4 2 | 56 1
Ogeechee
| 1 1| 27 1| 28 1| 3 1| 59 1 | 0 0| 1 1| 1 1| 1 4| 3 1 | 62 1
Pataula
| 1 1| 38 1| 16 1| 8 2| 63 1 | 0 0| 1 1| 0 0| 0 0| 1 0 | 64 1
Piedmont
| 0 0| 13 0| 30 1| 8 2| 51 1 | 0 0| 1 1| 1 1| 0 0| 2 1 | 53 1
Rome
| 1 1| 24 1| 29 1| 7 2| 61 1 | 2 25| 2 2| 3 3| 1 4| 8 3 | 69 1
South Georgia
| 5 3| 55 2| 29 1| 7 2| 96 2 | 0 0| 3 3| 0 0| 0 0| 3 1 | 99 2
Southern
| 5 3| 95 3| 80 4| 13 3| 193 3 | 0 0| 1 1| 4 4| 2 8| 7 3 | 200 3
Southwestern
| 1 1| 28 1| 23 1| 2 0| 54 1 | 1 13| 0 0| 3 3| 0 0| 4 2 | 58 1
------------------------------------------------------------------------------------------------------------------------------------
(continued)
Page 30 Run 12/21/01
Georgia Department of Corrections Office of Planning and Analysis
Inmate statistical profile
Sample: ACTIVE PRISONERS SERVING LIFE EXCLUDING JAIL
Requestor:
Active inmates 12/21/2001
Circ Of Conviction by current age & sex
Statistics (continued)
|
MEN
|
WOMEN
|
| Age | Age | Age | Age | Men
| Age | Age | Age | Age |Women
|Grand
Circ Of Conviction |00-21 %|22-39 %|40-54 %|55-99 %|Total % |00-21 %|22-39 %|40-54 %|55-99 %|Total % |Total %
------------------------------------------------------------------------------------------------------------------------------------
Stone Mountain
| 16 9| 249 8| 174 8| 27 6| 466 8 | 0 0| 5 4| 4 4| 1 4| 10 4 | 476 8
Tallapoosa
| 1 1| 22 1| 14 1| 5 1| 42 1 | 0 0| 1 1| 0 0| 0 0| 1 0 | 43 1
Tifton
| 5 3| 59 2| 37 2| 7 2| 108 2 | 0 0| 0 0| 2 2| 1 4| 3 1 | 111 2
Toombs
| 0 0| 38 1| 30 1| 7 2| 75 1 | 1 13| 0 0| 0 0| 0 0| 1 0 | 76 1
Waycross
| 3 2| 27 1| 35 2| 8 2| 73 1 | 0 0| 3 3| 2 2| 0 0| 5 2 | 78 1
Western
| 2 1| 45 2| 27 1| 8 2| 82 1 | 0 0| 3 3| 0 0| 1 4| 4 2 | 86 1
Rockdale
| 1 1| 10 0| 12 1| 4 1| 27 0 | 0 0| 1 1| 0 0| 0 0| 1 0 | 28 0
Douglas
| 1 1| 52 2| 20 1| 6 1| 79 1 | 0 0| 1 1| 1 1| 0 0| 2 1 | 81 1
Appalachian
| 0 0| 7 0| 9 0| 5 1| 21 0 | 0 0| 0 0| 1 1| 0 0| 1 0 | 22 0
Enotah
| 1 1| 7 0| 3 0| 3 1| 14 0 | 0 0| 0 0| 0 0| 0 0| 0 0 | 14 0
Forsyth-Bell
| 0 0| 5 0| 9 0| 4 1| 18 0 | 0 0| 1 1| 1 1| 0 0| 2 1 | 20 0
Towaliga
| 2 1| 40 1| 28 1| 7 2| 77 1 | 0 0| 2 2| 1 1| 0 0| 3 1 | 80 1
------------------------------------------------------------------------------------------------------------------------------------
Total reported
| 176 100| 2972 100| 2184 100| 461 100| 5793 100 | 8 100| 120 100| 90 100| 26 100| 244 100 | 6037 100
|
|
|
|
|
|
|
|
|
|
|
Percent reported | 100.0| 100.0| 100.0| 100.0| 100.0 | 100.0| 100.0| 100.0| 100.0| 100.0 | 100.0
|
|
|
|
|
|
|
|
|
|
|
|
|
|
|
|
|
|
|
|
|
|
Not reported
|0|1|0|0|1
|0|0|0|0|0
|1
------------------------------------------------------------------------------------------------------------------------------------
Total
| 176 | 2973 | 2184 | 461 | 5794
| 8 | 120 | 90 | 26 | 244
| 6038
Page 31 Run 12/21/01
Georgia Department of Corrections Office of Planning and Analysis
Inmate statistical profile
Sample: ACTIVE PRISONERS SERVING LIFE EXCLUDING JAIL
Requestor: Statistics
Active inmates 12/21/2001
Home County by current age & sex
|
MEN
|
WOMEN
|
| Age | Age | Age | Age | Men
| Age | Age | Age | Age |Women
|Grand
Home County
|00-21 %|22-39 %|40-54 %|55-99 %|Total % |00-21 %|22-39 %|40-54 %|55-99 %|Total % |Total %
------------------------------------------------------------------------------------------------------------------------------------
Appling
| 0 0| 5 0| 5 0| 1 0| 11 0 | 0 0| 0 0| 0 0| 0 0| 0 0 | 11 0
Atkinson
| 0 0| 1 0| 1 0| 3 1| 5 0 | 0 0| 0 0| 0 0| 0 0| 0 0 | 5 0
Bacon
| 0 0| 4 0| 6 0| 1 0| 11 0 | 0 0| 0 0| 0 0| 0 0| 0 0 | 11 0
Baker
| 0 0| 1 0| 2 0| 0 0| 3 0 | 0 0| 0 0| 0 0| 0 0| 0 0 | 3 0
Baldwin
| 2 1| 15 1| 8 0| 0 0| 25 0 | 0 0| 1 1| 0 0| 1 4| 2 1 | 27 0
Banks
| 0 0| 2 0| 4 0| 1 0| 7 0 | 0 0| 1 1| 0 0| 0 0| 1 0 | 8 0
Barrow
| 0 0| 6 0| 8 0| 2 0| 16 0 | 0 0| 0 0| 1 1| 0 0| 1 0 | 17 0
Bartow
| 1 1| 18 1| 15 1| 6 1| 40 1 | 1 14| 2 2| 0 0| 0 0| 3 1 | 43 1
Ben Hill
| 0 0| 3 0| 8 0| 3 1| 14 0 | 0 0| 0 0| 1 1| 0 0| 1 0 | 15 0
Berrien
| 0 0| 4 0| 1 0| 1 0| 6 0 | 0 0| 0 0| 0 0| 0 0| 0 0 | 6 0
Bibb
| 5 3| 81 3| 80 4| 18 4| 184 4 | 1 14| 3 3| 4 5| 0 0| 8 4 | 192 4
Bleckley
| 0 0| 7 0| 5 0| 1 0| 13 0 | 0 0| 0 0| 1 1| 0 0| 1 0 | 14 0
Brantley
| 0 0| 2 0| 2 0| 0 0| 4 0 | 0 0| 0 0| 0 0| 0 0| 0 0 | 4 0
Brooks
| 0 0| 7 0| 1 0| 2 0| 10 0 | 0 0| 0 0| 0 0| 0 0| 0 0 | 10 0
Bryan
| 1 1| 7 0| 4 0| 1 0| 13 0 | 0 0| 0 0| 0 0| 0 0| 0 0 | 13 0
Bulloch
| 1 1| 11 0| 10 1| 0 0| 22 0 | 0 0| 0 0| 1 1| 1 4| 2 1 | 24 0
Burke
| 2 1| 8 0| 8 0| 2 0| 20 0 | 0 0| 0 0| 0 0| 0 0| 0 0 | 20 0
Butts
| 0 0| 21 1| 7 0| 2 0| 30 1 | 0 0| 0 0| 0 0| 0 0| 0 0 | 30 1
Calhoun
| 0 0| 4 0| 3 0| 1 0| 8 0 | 0 0| 0 0| 0 0| 0 0| 0 0 | 8 0
Camden
| 0 0| 17 1| 5 0| 0 0| 22 0 | 0 0| 0 0| 1 1| 0 0| 1 0 | 23 0
Candler
| 0 0| 2 0| 1 0| 0 0| 3 0 | 0 0| 0 0| 0 0| 0 0| 0 0 | 3 0
Carroll
| 0 0| 22 1| 10 1| 8 2| 40 1 | 0 0| 2 2| 1 1| 0 0| 3 1 | 43 1
Catoosa
| 0 0| 2 0| 6 0| 1 0| 9 0 | 0 0| 0 0| 0 0| 0 0| 0 0 | 9 0
Charlton
| 0 0| 0 0| 1 0| 0 0| 1 0 | 0 0| 1 1| 0 0| 0 0| 1 0 | 2 0
Chatham
| 9 6| 155 6| 100 5| 17 4| 281 5 | 0 0| 2 2| 1 1| 1 4| 4 2 | 285 5
Chattahoochee
| 0 0| 1 0| 1 0| 0 0| 2 0 | 0 0| 0 0| 0 0| 0 0| 0 0 | 2 0
Chatooga
| 0 0| 3 0| 5 0| 1 0| 9 0 | 0 0| 0 0| 1 1| 1 4| 2 1 | 11 0
Cherokee
| 0 0| 7 0| 15 1| 2 0| 24 0 | 0 0| 2 2| 0 0| 0 0| 2 1 | 26 0
Clarke
| 3 2| 41 2| 21 1| 3 1| 68 1 | 0 0| 3 3| 0 0| 2 8| 5 2 | 73 1
Clay
| 0 0| 1 0| 1 0| 0 0| 2 0 | 0 0| 0 0| 0 0| 0 0| 0 0 | 2 0
Clayton
| 9 6| 60 2| 49 3| 8 2| 126 2 | 1 14| 3 3| 1 1| 1 4| 6 3 | 132 2
Clinch
| 0 0| 1 0| 1 0| 0 0| 2 0 | 0 0| 0 0| 0 0| 0 0| 0 0 | 2 0
Cobb
| 6 4| 86 3| 74 4| 11 3| 177 3 | 0 0| 4 4| 2 3| 0 0| 6 3 | 183 3
Coffee
| 0 0| 10 0| 4 0| 3 1| 17 0 | 0 0| 1 1| 2 3| 1 4| 4 2 | 21 0
Colquit
| 4 2| 25 1| 20 1| 3 1| 52 1 | 0 0| 0 0| 1 1| 0 0| 1 0 | 53 1
Columbia
| 0 0| 9 0| 8 0| 0 0| 17 0 | 0 0| 0 0| 2 3| 0 0| 2 1 | 19 0
------------------------------------------------------------------------------------------------------------------------------------
(continued)
Page 32 Run 12/21/01
Georgia Department of Corrections Office of Planning and Analysis
Inmate statistical profile
Sample: ACTIVE PRISONERS SERVING LIFE EXCLUDING JAIL
Requestor:
Active inmates 12/21/2001
Home County by current age & sex
Statistics (continued)
|
MEN
|
WOMEN
|
| Age | Age | Age | Age | Men
| Age | Age | Age | Age |Women
|Grand
Home County
|00-21 %|22-39 %|40-54 %|55-99 %|Total % |00-21 %|22-39 %|40-54 %|55-99 %|Total % |Total %
------------------------------------------------------------------------------------------------------------------------------------
Cook
| 0 0| 4 0| 5 0| 1 0| 10 0 | 0 0| 1 1| 0 0| 0 0| 1 0 | 11 0
Coweta
| 2 1| 19 1| 11 1| 1 0| 33 1 | 0 0| 2 2| 1 1| 0 0| 3 1 | 36 1
Crawford
| 0 0| 1 0| 1 0| 0 0| 2 0 | 0 0| 0 0| 0 0| 0 0| 0 0 | 2 0
Crisp
| 4 2| 13 0| 6 0| 3 1| 26 0 | 0 0| 3 3| 0 0| 0 0| 3 1 | 29 1
Dade
| 1 1| 3 0| 2 0| 2 0| 8 0 | 0 0| 0 0| 0 0| 0 0| 0 0 | 8 0
Dawson
| 0 0| 2 0| 1 0| 0 0| 3 0 | 0 0| 0 0| 0 0| 0 0| 0 0 | 3 0
Decatur
| 3 2| 13 0| 5 0| 0 0| 21 0 | 0 0| 0 0| 0 0| 0 0| 0 0 | 21 0
DeKalb
| 14 9| 219 8| 130 7| 31 8| 394 8 | 0 0| 5 4| 2 3| 2 8| 9 4 | 403 7
Dodge
| 0 0| 7 0| 7 0| 0 0| 14 0 | 0 0| 0 0| 0 0| 0 0| 0 0 | 14 0
Dooly
| 2 1| 7 0| 4 0| 0 0| 13 0 | 0 0| 0 0| 0 0| 0 0| 0 0 | 13 0
Dougherty
| 4 2| 68 3| 43 2| 2 0| 117 2 | 0 0| 5 4| 1 1| 1 4| 7 3 | 124 2
Douglas
| 1 1| 19 1| 13 1| 3 1| 36 1 | 0 0| 1 1| 1 1| 0 0| 2 1 | 38 1
Early
| 0 0| 7 0| 5 0| 1 0| 13 0 | 0 0| 0 0| 0 0| 0 0| 0 0 | 13 0
Effingham
| 0 0| 5 0| 3 0| 0 0| 8 0 | 0 0| 0 0| 0 0| 0 0| 0 0 | 8 0
Elbert
| 0 0| 9 0| 11 1| 1 0| 21 0 | 0 0| 1 1| 0 0| 0 0| 1 0 | 22 0
Emanuel
| 0 0| 9 0| 6 0| 2 0| 17 0 | 0 0| 0 0| 1 1| 0 0| 1 0 | 18 0
Evans
| 0 0| 8 0| 2 0| 1 0| 11 0 | 0 0| 0 0| 0 0| 0 0| 0 0 | 11 0
Fannin
| 0 0| 5 0| 3 0| 1 0| 9 0 | 0 0| 0 0| 0 0| 0 0| 0 0 | 9 0
Fayette
| 0 0| 3 0| 3 0| 0 0| 6 0 | 0 0| 0 0| 0 0| 0 0| 0 0 | 6 0
Floyd
| 1 1| 25 1| 26 1| 3 1| 55 1 | 1 14| 2 2| 3 4| 1 4| 7 3 | 62 1
Forsyth
| 0 0| 6 0| 4 0| 2 0| 12 0 | 0 0| 0 0| 1 1| 0 0| 1 0 | 13 0
Franklin
| 0 0| 2 0| 5 0| 0 0| 7 0 | 0 0| 0 0| 0 0| 1 4| 1 0 | 8 0
Fulton
| 26 16| 502 19| 365 19| 65 16| 958 18 | 0 0| 16 14| 10 13| 2 8| 28 13 | 986 18
Gilmer
| 0 0| 1 0| 3 0| 2 0| 6 0 | 0 0| 0 0| 0 0| 0 0| 0 0 | 6 0
Glascock
| 0 0| 0 0| 1 0| 0 0| 1 0 | 0 0| 0 0| 0 0| 0 0| 0 0 | 1 0
Glynn
| 2 1| 31 1| 25 1| 4 1| 62 1 | 0 0| 1 1| 1 1| 0 0| 2 1 | 64 1
Gordon
| 0 0| 21 1| 10 1| 2 0| 33 1 | 0 0| 0 0| 1 1| 0 0| 1 0 | 34 1
Grady
| 2 1| 17 1| 8 0| 0 0| 27 1 | 0 0| 0 0| 0 0| 0 0| 0 0 | 27 0
Greene
| 0 0| 4 0| 3 0| 1 0| 8 0 | 0 0| 0 0| 1 1| 0 0| 1 0 | 9 0
Gwinnett
| 2 1| 65 2| 43 2| 12 3| 122 2 | 0 0| 4 4| 2 3| 0 0| 6 3 | 128 2
Habersham
| 0 0| 7 0| 9 0| 0 0| 16 0 | 0 0| 0 0| 0 0| 0 0| 0 0 | 16 0
Hall
| 1 1| 24 1| 40 2| 10 2| 75 1 | 1 14| 1 1| 2 3| 1 4| 5 2 | 80 1
Hancock
| 1 1| 2 0| 2 0| 1 0| 6 0 | 0 0| 0 0| 1 1| 0 0| 1 0 | 7 0
Haralson
| 0 0| 1 0| 1 0| 1 0| 3 0 | 0 0| 1 1| 0 0| 0 0| 1 0 | 4 0
Harris
| 1 1| 6 0| 2 0| 0 0| 9 0 | 0 0| 0 0| 0 0| 0 0| 0 0 | 9 0
------------------------------------------------------------------------------------------------------------------------------------
(continued)
Page 33 Run 12/21/01
Georgia Department of Corrections Office of Planning and Analysis
Inmate statistical profile
Sample: ACTIVE PRISONERS SERVING LIFE EXCLUDING JAIL
Requestor:
Active inmates 12/21/2001
Home County by current age & sex
Statistics (continued)
|
MEN
|
WOMEN
|
| Age | Age | Age | Age | Men
| Age | Age | Age | Age |Women
|Grand
Home County
|00-21 %|22-39 %|40-54 %|55-99 %|Total % |00-21 %|22-39 %|40-54 %|55-99 %|Total % |Total %
------------------------------------------------------------------------------------------------------------------------------------
Hart
| 0 0| 1 0| 3 0| 0 0| 4 0 | 0 0| 0 0| 1 1| 0 0| 1 0 | 5 0
Heard
| 0 0| 1 0| 1 0| 2 0| 4 0 | 0 0| 0 0| 0 0| 0 0| 0 0 | 4 0
Henry
| 1 1| 20 1| 11 1| 5 1| 37 1 | 0 0| 1 1| 2 3| 0 0| 3 1 | 40 1
Houston
| 3 2| 37 1| 25 1| 5 1| 70 1 | 0 0| 2 2| 4 5| 0 0| 6 3 | 76 1
Irwin
| 0 0| 5 0| 4 0| 0 0| 9 0 | 0 0| 0 0| 0 0| 0 0| 0 0 | 9 0
Jackson
| 0 0| 11 0| 8 0| 8 2| 27 1 | 0 0| 0 0| 0 0| 0 0| 0 0 | 27 0
Jasper
| 0 0| 8 0| 2 0| 1 0| 11 0 | 0 0| 0 0| 0 0| 0 0| 0 0 | 11 0
Jeff Davis
| 1 1| 5 0| 2 0| 1 0| 9 0 | 0 0| 0 0| 0 0| 0 0| 0 0 | 9 0
Jefferson
| 0 0| 4 0| 3 0| 2 0| 9 0 | 0 0| 1 1| 0 0| 0 0| 1 0 | 10 0
Jenkins
| 0 0| 0 0| 6 0| 0 0| 6 0 | 0 0| 0 0| 0 0| 0 0| 0 0 | 6 0
Johnson
| 0 0| 3 0| 2 0| 0 0| 5 0 | 0 0| 0 0| 0 0| 0 0| 0 0 | 5 0
Jones
| 0 0| 1 0| 5 0| 1 0| 7 0 | 0 0| 1 1| 0 0| 0 0| 1 0 | 8 0
Lamar
| 0 0| 8 0| 8 0| 2 0| 18 0 | 0 0| 0 0| 1 1| 0 0| 1 0 | 19 0
Laurens
| 1 1| 10 0| 12 1| 2 0| 25 0 | 0 0| 1 1| 1 1| 0 0| 2 1 | 27 0
Lee
| 0 0| 3 0| 0 0| 0 0| 3 0 | 0 0| 0 0| 0 0| 0 0| 0 0 | 3 0
Liberty
| 0 0| 22 1| 8 0| 4 1| 34 1 | 0 0| 1 1| 0 0| 0 0| 1 0 | 35 1
Lincoln
| 0 0| 2 0| 3 0| 0 0| 5 0 | 0 0| 0 0| 0 0| 0 0| 0 0 | 5 0
Long
| 0 0| 3 0| 3 0| 1 0| 7 0 | 0 0| 1 1| 0 0| 0 0| 1 0 | 8 0
Lowndes
| 0 0| 35 1| 22 1| 4 1| 61 1 | 0 0| 0 0| 2 3| 1 4| 3 1 | 64 1
Lumpkins
| 2 1| 5 0| 4 0| 1 0| 12 0 | 0 0| 0 0| 0 0| 0 0| 0 0 | 12 0
Macon
| 0 0| 11 0| 4 0| 1 0| 16 0 | 0 0| 0 0| 1 1| 0 0| 1 0 | 17 0
Madison
| 0 0| 7 0| 6 0| 1 0| 14 0 | 0 0| 2 2| 0 0| 0 0| 2 1 | 16 0
Marion
| 0 0| 2 0| 1 0| 0 0| 3 0 | 0 0| 0 0| 0 0| 0 0| 0 0 | 3 0
McDuffie
| 0 0| 21 1| 12 1| 3 1| 36 1 | 1 14| 0 0| 0 0| 0 0| 1 0 | 37 1
McIntosh
| 1 1| 5 0| 3 0| 0 0| 9 0 | 0 0| 0 0| 0 0| 0 0| 0 0 | 9 0
Meriwether
| 1 1| 8 0| 7 0| 3 1| 19 0 | 0 0| 1 1| 0 0| 1 4| 2 1 | 21 0
Miller
| 0 0| 2 0| 3 0| 0 0| 5 0 | 0 0| 0 0| 0 0| 0 0| 0 0 | 5 0
Mitchell
| 0 0| 13 0| 10 1| 4 1| 27 1 | 0 0| 1 1| 0 0| 0 0| 1 0 | 28 1
Monroe
| 0 0| 10 0| 4 0| 0 0| 14 0 | 0 0| 0 0| 0 0| 0 0| 0 0 | 14 0
Montgomery
| 0 0| 0 0| 0 0| 0 0| 0 0 | 0 0| 1 1| 0 0| 0 0| 1 0 | 1 0
Morgan
| 0 0| 6 0| 3 0| 1 0| 10 0 | 0 0| 0 0| 0 0| 0 0| 0 0 | 10 0
Murray
| 1 1| 6 0| 4 0| 4 1| 15 0 | 0 0| 1 1| 0 0| 0 0| 1 0 | 16 0
Muscogee
| 2 1| 77 3| 57 3| 13 3| 149 3 | 0 0| 3 3| 2 3| 1 4| 6 3 | 155 3
Newton
| 1 1| 32 1| 11 1| 3 1| 47 1 | 0 0| 2 2| 0 0| 1 4| 3 1 | 50 1
Oconee
| 0 0| 3 0| 2 0| 0 0| 5 0 | 0 0| 0 0| 1 1| 0 0| 1 0 | 6 0
------------------------------------------------------------------------------------------------------------------------------------
(continued)
Page 34 Run 12/21/01
Georgia Department of Corrections Office of Planning and Analysis
Inmate statistical profile
Sample: ACTIVE PRISONERS SERVING LIFE EXCLUDING JAIL
Requestor:
Active inmates 12/21/2001
Home County by current age & sex
Statistics (continued)
|
MEN
|
WOMEN
|
| Age | Age | Age | Age | Men
| Age | Age | Age | Age |Women
|Grand
Home County
|00-21 %|22-39 %|40-54 %|55-99 %|Total % |00-21 %|22-39 %|40-54 %|55-99 %|Total % |Total %
------------------------------------------------------------------------------------------------------------------------------------
Oglethrope
| 0 0| 2 0| 2 0| 1 0| 5 0 | 0 0| 1 1| 0 0| 0 0| 1 0 | 6 0
Paulding
| 0 0| 6 0| 5 0| 2 0| 13 0 | 0 0| 0 0| 1 1| 1 4| 2 1 | 15 0
Peach
| 0 0| 7 0| 3 0| 0 0| 10 0 | 0 0| 1 1| 0 0| 0 0| 1 0 | 11 0
Pickens
| 0 0| 1 0| 3 0| 0 0| 4 0 | 0 0| 0 0| 1 1| 0 0| 1 0 | 5 0
Pierce
| 2 1| 2 0| 2 0| 0 0| 6 0 | 0 0| 0 0| 0 0| 0 0| 0 0 | 6 0
Pike
| 0 0| 1 0| 0 0| 0 0| 1 0 | 0 0| 0 0| 0 0| 0 0| 0 0 | 1 0
Polk
| 1 1| 18 1| 4 0| 3 1| 26 0 | 0 0| 0 0| 0 0| 0 0| 0 0 | 26 0
Pulaski
| 0 0| 4 0| 3 0| 0 0| 7 0 | 0 0| 1 1| 0 0| 0 0| 1 0 | 8 0
Putnam
| 0 0| 12 0| 13 1| 2 0| 27 1 | 0 0| 0 0| 0 0| 0 0| 0 0 | 27 0
Quitman
| 0 0| 2 0| 0 0| 0 0| 2 0 | 0 0| 0 0| 0 0| 0 0| 0 0 | 2 0
Rabun
| 0 0| 5 0| 3 0| 0 0| 8 0 | 0 0| 0 0| 0 0| 0 0| 0 0 | 8 0
Randolph
| 0 0| 3 0| 2 0| 1 0| 6 0 | 0 0| 0 0| 0 0| 0 0| 0 0 | 6 0
Richmond
| 11 7| 144 5| 73 4| 10 2| 238 5 | 0 0| 8 7| 7 9| 1 4| 16 7 | 254 5
Rockdale
| 1 1| 9 0| 8 0| 3 1| 21 0 | 0 0| 1 1| 0 0| 0 0| 1 0 | 22 0
Schely
| 0 0| 2 0| 2 0| 0 0| 4 0 | 0 0| 0 0| 0 0| 0 0| 0 0 | 4 0
Screven
| 0 0| 3 0| 2 0| 2 0| 7 0 | 0 0| 0 0| 0 0| 0 0| 0 0 | 7 0
Seminole
| 0 0| 6 0| 5 0| 1 0| 12 0 | 0 0| 1 1| 0 0| 0 0| 1 0 | 13 0
Spalding
| 2 1| 35 1| 25 1| 5 1| 67 1 | 1 14| 2 2| 0 0| 2 8| 5 2 | 72 1
Stephens
| 0 0| 5 0| 5 0| 4 1| 14 0 | 0 0| 0 0| 0 0| 0 0| 0 0 | 14 0
Stewart
| 0 0| 2 0| 2 0| 0 0| 4 0 | 0 0| 0 0| 0 0| 0 0| 0 0 | 4 0
Sumter
| 1 1| 3 0| 16 1| 2 0| 22 0 | 0 0| 0 0| 1 1| 0 0| 1 0 | 23 0
Talbot
| 2 1| 3 0| 1 0| 0 0| 6 0 | 0 0| 0 0| 1 1| 0 0| 1 0 | 7 0
Taliaferro
| 0 0| 0 0| 1 0| 0 0| 1 0 | 0 0| 0 0| 0 0| 0 0| 0 0 | 1 0
Tattnall
| 0 0| 16 1| 4 0| 0 0| 20 0 | 0 0| 0 0| 1 1| 0 0| 1 0 | 21 0
Taylor
| 1 1| 10 0| 4 0| 1 0| 16 0 | 0 0| 0 0| 0 0| 0 0| 0 0 | 16 0
Telfair
| 1 1| 6 0| 3 0| 0 0| 10 0 | 0 0| 0 0| 1 1| 0 0| 1 0 | 11 0
Terrell
| 2 1| 11 0| 1 0| 0 0| 14 0 | 0 0| 0 0| 0 0| 0 0| 0 0 | 14 0
Thomas
| 1 1| 13 0| 17 1| 4 1| 35 1 | 0 0| 1 1| 1 1| 0 0| 2 1 | 37 1
Tift
| 3 2| 28 1| 21 1| 2 0| 54 1 | 0 0| 0 0| 0 0| 1 4| 1 0 | 55 1
Toombs
| 1 1| 12 0| 12 1| 0 0| 25 0 | 0 0| 1 1| 0 0| 0 0| 1 0 | 26 0
Treutlen
| 0 0| 2 0| 3 0| 0 0| 5 0 | 0 0| 0 0| 0 0| 0 0| 0 0 | 5 0
Troup
| 3 2| 19 1| 20 1| 4 1| 46 1 | 0 0| 1 1| 1 1| 0 0| 2 1 | 48 1
Turner
| 0 0| 8 0| 5 0| 0 0| 13 0 | 0 0| 0 0| 0 0| 0 0| 0 0 | 13 0
Twiggs
| 0 0| 5 0| 4 0| 0 0| 9 0 | 0 0| 0 0| 0 0| 0 0| 0 0 | 9 0
Upson
| 1 1| 8 0| 4 0| 0 0| 13 0 | 0 0| 0 0| 1 1| 0 0| 1 0 | 14 0
------------------------------------------------------------------------------------------------------------------------------------
(continued)
Page 35 Run 12/21/01
Georgia Department of Corrections Office of Planning and Analysis
Inmate statistical profile
Sample: ACTIVE PRISONERS SERVING LIFE EXCLUDING JAIL
Requestor:
Active inmates 12/21/2001
Home County by current age & sex
Statistics (continued)
|
MEN
|
WOMEN
|
| Age | Age | Age | Age | Men
| Age | Age | Age | Age |Women
|Grand
Home County
|00-21 %|22-39 %|40-54 %|55-99 %|Total % |00-21 %|22-39 %|40-54 %|55-99 %|Total % |Total %
------------------------------------------------------------------------------------------------------------------------------------
Walker
| 1 1| 15 1| 7 0| 3 1| 26 0 | 0 0| 1 1| 1 1| 0 0| 2 1 | 28 1
Walton
| 1 1| 22 1| 19 1| 3 1| 45 1 | 0 0| 0 0| 0 0| 0 0| 0 0 | 45 1
Ware
| 1 1| 12 0| 14 1| 4 1| 31 1 | 0 0| 0 0| 0 0| 0 0| 0 0 | 31 1
Warren
| 0 0| 3 0| 5 0| 1 0| 9 0 | 0 0| 0 0| 0 0| 0 0| 0 0 | 9 0
Washington
| 0 0| 12 0| 8 0| 1 0| 21 0 | 0 0| 2 2| 0 0| 0 0| 2 1 | 23 0
Wayne
| 0 0| 7 0| 12 1| 3 1| 22 0 | 0 0| 1 1| 0 0| 0 0| 1 0 | 23 0
Webster
| 0 0| 3 0| 0 0| 0 0| 3 0 | 0 0| 0 0| 0 0| 0 0| 0 0 | 3 0
Wheeler
| 0 0| 1 0| 2 0| 2 0| 5 0 | 0 0| 0 0| 0 0| 0 0| 0 0 | 5 0
White
| 0 0| 3 0| 2 0| 2 0| 7 0 | 0 0| 0 0| 0 0| 0 0| 0 0 | 7 0
Whitfield
| 1 1| 9 0| 25 1| 7 2| 42 1 | 0 0| 2 2| 0 0| 0 0| 2 1 | 44 1
Wilcox
| 0 0| 0 0| 4 0| 1 0| 5 0 | 0 0| 0 0| 0 0| 0 0| 0 0 | 5 0
Wilkes
| 0 0| 2 0| 4 0| 2 0| 8 0 | 0 0| 0 0| 0 0| 0 0| 0 0 | 8 0
Wilkinson
| 0 0| 6 0| 3 0| 0 0| 9 0 | 0 0| 0 0| 0 0| 0 0| 0 0 | 9 0
Worth
| 0 0| 12 0| 4 0| 1 0| 17 0 | 0 0| 1 1| 0 0| 0 0| 1 0 | 18 0
------------------------------------------------------------------------------------------------------------------------------------
Total reported
| 161 100| 2691 100| 1954 100| 403 100| 5209 100 | 7 100| 112 100| 80 100| 25 100| 224 100 | 5433 100
|
|
|
|
|
|
|
|
|
|
|
Percent reported |
91.5|
90.5|
89.5|
87.4|
89.9 |
87.5|
93.3|
88.9|
96.2|
91.8 |
90.0
|
|
|
|
|
|
|
|
|
|
|
|
|
|
|
|
|
|
|
|
|
|
Not reported
| 15 | 282 | 230 | 58 | 585
| 1 | 8 | 10 | 1 | 20
| 605
------------------------------------------------------------------------------------------------------------------------------------
Total
| 176 | 2973 | 2184 | 461 | 5794
| 8 | 120 | 90 | 26 | 244
| 6038
Georgia Department of Corrections
Page 36 Run 12/21/01
Office of Planning and Analysis
Inmate statistical profile
Sample: ACTIVE PRISONERS SERVING LIFE EXCLUDING JAIL
Requestor: Statistics
Active inmates 12/21/2001
Prison Sentence In Years by current age & sex
|
MEN
|
WOMEN
|
| Age | Age | Age | Age | Men
| Age | Age | Age | Age |Women
|Grand
Sentence In Years |00-21 %|22-39 %|40-54 %|55-99 %|Total % |00-21 %|22-39 %|40-54 %|55-99 %|Total % |Total %
------------------------------------------------------------------------------------------------------------------------------------
0-1
| 0 0| 0 0| 0 0| 0 0| 0 0 | 0 0| 0 0| 0 0| 0 0| 0 0 | 0 0
1.1-2
| 0 0| 0 0| 0 0| 0 0| 0 0 | 0 0| 0 0| 0 0| 0 0| 0 0 | 0 0
2.1-3
| 0 0| 0 0| 0 0| 0 0| 0 0 | 0 0| 0 0| 0 0| 0 0| 0 0 | 0 0
3.1-4
| 0 0| 0 0| 0 0| 0 0| 0 0 | 0 0| 0 0| 0 0| 0 0| 0 0 | 0 0
4.1-5
| 0 0| 0 0| 0 0| 0 0| 0 0 | 0 0| 0 0| 0 0| 0 0| 0 0 | 0 0
5.1-6
| 0 0| 0 0| 0 0| 0 0| 0 0 | 0 0| 0 0| 0 0| 0 0| 0 0 | 0 0
6.1-7
| 0 0| 0 0| 0 0| 0 0| 0 0 | 0 0| 0 0| 0 0| 0 0| 0 0 | 0 0
7.1-8
| 0 0| 0 0| 0 0| 0 0| 0 0 | 0 0| 0 0| 0 0| 0 0| 0 0 | 0 0
8.1-9
| 0 0| 0 0| 0 0| 0 0| 0 0 | 0 0| 0 0| 0 0| 0 0| 0 0 | 0 0
9.1-10
| 0 0| 0 0| 0 0| 0 0| 0 0 | 0 0| 0 0| 0 0| 0 0| 0 0 | 0 0
10.1-12
| 0 0| 0 0| 0 0| 0 0| 0 0 | 0 0| 0 0| 0 0| 0 0| 0 0 | 0 0
12.1-15
| 0 0| 0 0| 0 0| 0 0| 0 0 | 0 0| 0 0| 0 0| 0 0| 0 0 | 0 0
15.1-20
| 0 0| 0 0| 0 0| 0 0| 0 0 | 0 0| 0 0| 0 0| 0 0| 0 0 | 0 0
20.1-OVER
| 0 0| 1 0| 0 0| 0 0| 1 0 | 0 0| 0 0| 0 0| 0 0| 0 0 | 1 0
LIFE
| 176 100| 2972 100| 2184 100| 461 100| 5793 100 | 8 100| 120 100| 90 100| 26 100| 244 100 | 6037 100
DEATH
| 0 0| 0 0| 0 0| 0 0| 0 0 | 0 0| 0 0| 0 0| 0 0| 0 0 | 0 0
LIFE W/O PAROLE
| 0 0| 0 0| 0 0| 0 0| 0 0 | 0 0| 0 0| 0 0| 0 0| 0 0 | 0 0
YOUTHFUL OFFENDERS | 0 0| 0 0| 0 0| 0 0| 0 0 | 0 0| 0 0| 0 0| 0 0| 0 0 | 0 0
------------------------------------------------------------------------------------------------------------------------------------
Total reported
| 176 100| 2973 100| 2184 100| 461 100| 5794 100 | 8 100| 120 100| 90 100| 26 100| 244 100 | 6038 100
|
|
|
|
|
|
|
|
|
|
|
Percent reported | 100.0| 100.0| 100.0| 100.0| 100.0 | 100.0| 100.0| 100.0| 100.0| 100.0 | 100.0
|
|
|
|
|
|
|
|
|
|
|
|
|
|
|
|
|
|
|
|
|
|
NOT REPORTED
|0|0|0|0|0
|0|0|0|0|0
|0
------------------------------------------------------------------------------------------------------------------------------------
Total
| 176 | 2973 | 2184 | 461 | 5794
| 8 | 120 | 90 | 26 | 244
| 6038
|
|
|
|
|
|
|
|
|
|
|
|
|
|
|
|
|
|
|
|
|
|
|
|
|
|
|
|
|
|
|
|
|
|
|
|
|
|
|
|
|
|
|
|
|
|
|
|
|
|
|
|
|
|
|
AVG EXCLUDING
|
|
|
|
|
|
|
|
|
|
|
LIFE, DEATH, YO
| .00 | 243.53 | .00 | .00 | 243.53 | .00 | .00 | .00 | .00 | .00 | 243.53
|
|
|
|
|
|
|
|
|
|
|
|
|
|
|
|
|
|
|
|
|
|
|
|
|
|
|
|
|
|
|
|
|
|
|
|
|
|
|
|
|
|
|
|
|
|
|
|
|
|
|
|
|
|
|
AVG INCLUDING
|
|
|
|
|
|
|
|
|
|
|
LIFE=21, YO=3 YRS | 21.00 | 21.07 | 21.00 | 21.00 | 21.04 | 21.00 | 21.00 | 21.00 | 21.00 | 21.00 | 21.04
Page 37 Run 12/21/01
Georgia Department of Corrections Office of Planning and Analysis
Inmate statistical profile
Sample: ACTIVE PRISONERS SERVING LIFE EXCLUDING JAIL
Requestor: Statistics
Active inmates 12/21/2001
Probation To Follow Prison by current age & sex
|
MEN
|
WOMEN
|
| Age | Age | Age | Age | Men
| Age | Age | Age | Age |Women
|Grand
Prob After Prison |00-21 %|22-39 %|40-54 %|55-99 %|Total % |00-21 %|22-39 %|40-54 %|55-99 %|Total % |Total %
------------------------------------------------------------------------------------------------------------------------------------
PROBATION TO FOLLOW | 7 4| 92 3| 66 3| 7 2| 172 3 | 0 0| 3 3| 3 3| 1 4| 7 3 | 179 3
NO PROBATION
| 169 96| 2881 97| 2118 97| 454 98| 5622 97 | 8 100| 117 98| 87 97| 25 96| 237 97 | 5859 97
------------------------------------------------------------------------------------------------------------------------------------
Total reported
| 176 100| 2973 100| 2184 100| 461 100| 5794 100 | 8 100| 120 100| 90 100| 26 100| 244 100 | 6038 100
|
|
|
|
|
|
|
|
|
|
|
Percent reported | 100.0| 100.0| 100.0| 100.0| 100.0 | 100.0| 100.0| 100.0| 100.0| 100.0 | 100.0
|
|
|
|
|
|
|
|
|
|
|
|
|
|
|
|
|
|
|
|
|
|
NOT REPORTED
|0|0|0|0|0
|0|0|0|0|0
|0
------------------------------------------------------------------------------------------------------------------------------------
Total
| 176 | 2973 | 2184 | 461 | 5794
| 8 | 120 | 90 | 26 | 244
| 6038
Page 38 Run 12/21/01
Georgia Department of Corrections Office of Planning and Analysis
Inmate statistical profile
Sample: ACTIVE PRISONERS SERVING LIFE EXCLUDING JAIL
Requestor: Statistics
Active inmates 12/21/2001
Admission Type by current age & sex
|
MEN
|
WOMEN
|
| Age | Age | Age | Age | Men
| Age | Age | Age | Age |Women
|Grand
Admission Type
|00-21 %|22-39 %|40-54 %|55-99 %|Total % |00-21 %|22-39 %|40-54 %|55-99 %|Total % |Total %
------------------------------------------------------------------------------------------------------------------------------------
COMMITTED FROM COURT| 172 98| 2460 83| 1631 75| 328 71| 4591 79 | 8 100| 114 95| 79 88| 26 100| 227 93 | 4818 80
RETURN APPEAL/BOND | 0 0| 1 0| 1 0| 0 0| 2 0 | 0 0| 0 0| 0 0| 0 0| 0 0 | 2 0
PAROLE REV/NEW SENT | 0 0| 327 11| 327 15| 86 19| 740 13 | 0 0| 4 3| 7 8| 0 0| 11 5 | 751 12
PAR REV/NO NEW SENT | 0 0| 18 1| 66 3| 11 2| 95 2 | 0 0| 1 1| 1 1| 0 0| 2 1 | 97 2
PROB VIOL/TOTAL REV | 0 0| 0 0| 0 0| 0 0| 0 0 | 0 0| 0 0| 0 0| 0 0| 0 0 | 0 0
PROB VIOL/PARTIAL | 0 0| 28 1| 45 2| 3 1| 76 1 | 0 0| 0 0| 1 1| 0 0| 1 0 | 77 1
ADMIT FM OTHER CUST | 0 0| 2 0| 1 0| 5 1| 8 0 | 0 0| 0 0| 0 0| 0 0| 0 0 | 8 0
SHOCK INCARCERATION | 0 0| 0 0| 0 0| 0 0| 0 0 | 0 0| 0 0| 0 0| 0 0| 0 0 | 0 0
PROB REV/REMAINDER | 3 2| 108 4| 52 2| 4 1| 167 3 | 0 0| 1 1| 2 2| 0 0| 3 1 | 170 3
NEW SENT/PAR REV PND| 0 0| 2 0| 4 0| 1 0| 7 0 | 0 0| 0 0| 0 0| 0 0| 0 0 | 7 0
LIFE W/O PAROLE
| 1 1| 7 0| 4 0| 0 0| 12 0 | 0 0| 0 0| 0 0| 0 0| 0 0 | 12 0
PAROLE REV BOOT CAMP| 0 0| 2 0| 1 0| 0 0| 3 0 | 0 0| 0 0| 0 0| 0 0| 0 0 | 3 0
PAR REV/RSN UNKNOWN | 0 0| 12 0| 39 2| 23 5| 74 1 | 0 0| 0 0| 0 0| 0 0| 0 0 | 74 1
PROBATION/PAROLE REV| 0 0| 0 0| 0 0| 0 0| 0 0 | 0 0| 0 0| 0 0| 0 0| 0 0 | 0 0
PB PAROLE RESCINDED | 0 0| 0 0| 0 0| 0 0| 0 0 | 0 0| 0 0| 0 0| 0 0| 0 0 | 0 0
PROB REVOC/SPEC COND| 0 0| 0 0| 0 0| 0 0| 0 0 | 0 0| 0 0| 0 0| 0 0| 0 0 | 0 0
PAR REV/REVOC CENTER| 0 0| 5 0| 12 1| 0 0| 17 0 | 0 0| 0 0| 0 0| 0 0| 0 0 | 17 0
INFORMATION ONLY | 0 0| 0 0| 0 0| 0 0| 0 0 | 0 0| 0 0| 0 0| 0 0| 0 0 | 0 0
INCOMPLETE SENT PKG | 0 0| 0 0| 0 0| 0 0| 0 0 | 0 0| 0 0| 0 0| 0 0| 0 0 | 0 0
HANCOCK REVOC CENTER| 0 0| 0 0| 0 0| 0 0| 0 0 | 0 0| 0 0| 0 0| 0 0| 0 0 | 0 0
WHITWORTH DETENTION | 0 0| 0 0| 1 0| 0 0| 1 0 | 0 0| 0 0| 0 0| 0 0| 0 0 | 1 0
DCYS AT RISK
| 0 0| 0 0| 0 0| 0 0| 0 0 | 0 0| 0 0| 0 0| 0 0| 0 0 | 0 0
OTHER
| 0 0| 0 0| 0 0| 0 0| 0 0 | 0 0| 0 0| 0 0| 0 0| 0 0 | 0 0
------------------------------------------------------------------------------------------------------------------------------------
Total reported
| 176 100| 2972 100| 2184 100| 461 100| 5793 100 | 8 100| 120 100| 90 100| 26 100| 244 100 | 6037 100
|
|
|
|
|
|
|
|
|
|
|
Percent reported | 100.0| 100.0| 100.0| 100.0| 100.0 | 100.0| 100.0| 100.0| 100.0| 100.0 | 100.0
|
|
|
|
|
|
|
|
|
|
|
|
|
|
|
|
|
|
|
|
|
|
UNKNOWN
|0|1|0|0|1
|0|0|0|0|0
|1
------------------------------------------------------------------------------------------------------------------------------------
Total
| 176 | 2973 | 2184 | 461 | 5794
| 8 | 120 | 90 | 26 | 244
| 6038
Page 39 Run 12/21/01
Georgia Department of Corrections Office of Planning and Analysis
Inmate statistical profile
Sample: ACTIVE PRISONERS SERVING LIFE EXCLUDING JAIL
Requestor: Statistics
Active inmates 12/21/2001
Release Type by current age & sex
|
MEN
|
WOMEN
|
| Age | Age | Age | Age | Men
| Age | Age | Age | Age |Women
|Grand
Release Type
|00-21 %|22-39 %|40-54 %|55-99 %|Total % |00-21 %|22-39 %|40-54 %|55-99 %|Total % |Total %
------------------------------------------------------------------------------------------------------------------------------------
PAROLE
| 0 0| 1 0| 0 0| 0 0| 1 0 | 0 0| 0 0| 0 0| 0 0| 0 0 | 1 0
Active
| 176 100| 2973 100| 2184 100| 461 100| 5794 100 | 8 100| 120 100| 90 100| 26 100| 244 100 | 6038 100
------------------------------------------------------------------------------------------------------------------------------------
Total
| 176 | 2973 | 2184 | 461 | 5794
| 8 | 120 | 90 | 26 | 244
| 6038
Page 40 Run 12/21/01
Georgia Department of Corrections Office of Planning and Analysis
Inmate statistical profile
Sample: ACTIVE PRISONERS SERVING LIFE EXCLUDING JAIL
Requestor: Statistics
Active inmates 12/21/2001
Inst By Group by current age & sex
|
MEN
|
WOMEN
|
| Age | Age | Age | Age | Men
| Age | Age | Age | Age |Women
|Grand
Inst By Group
|00-21 %|22-39 %|40-54 %|55-99 %|Total % |00-21 %|22-39 %|40-54 %|55-99 %|Total % |Total %
------------------------------------------------------------------------------------------------------------------------------------
County jails
| 0 0| 0 0| 0 0| 0 0| 0 0 | 0 0| 0 0| 0 0| 0 0| 0 0 | 0 0
Transitional centers| 0 0| 24 1| 26 1| 2 0| 52 1 | 0 0| 1 1| 1 1| 1 4| 3 1 | 55 1
County camps
| 0 0| 12 0| 10 0| 2 0| 24 0 | 0 0| 0 0| 0 0| 0 0| 0 0 | 24 0
Inmate boot camps | 0 0| 0 0| 0 0| 0 0| 0 0 | 0 0| 0 0| 0 0| 0 0| 0 0 | 0 0
State prisons
| 175 99| 2829 95| 2059 94| 442 96| 5505 95 | 8 100| 119 99| 89 99| 25 96| 241 99 | 5746 95
Private prisons
| 1 1| 108 4| 89 4| 15 3| 213 4 | 0 0| 0 0| 0 0| 0 0| 0 0 | 213 4
Other
| 0 0| 0 0| 0 0| 0 0| 0 0 | 0 0| 0 0| 0 0| 0 0| 0 0 | 0 0
------------------------------------------------------------------------------------------------------------------------------------
Total reported
| 176 100| 2973 100| 2184 100| 461 100| 5794 100 | 8 100| 120 100| 90 100| 26 100| 244 100 | 6038 100
|
|
|
|
|
|
|
|
|
|
|
Percent reported | 100.0| 100.0| 100.0| 100.0| 100.0 | 100.0| 100.0| 100.0| 100.0| 100.0 | 100.0
|
|
|
|
|
|
|
|
|
|
|
|
|
|
|
|
|
|
|
|
|
|
Not reported
|0|0|0|0|0
|0|0|0|0|0
|0
------------------------------------------------------------------------------------------------------------------------------------
Total
| 176 | 2973 | 2184 | 461 | 5794
| 8 | 120 | 90 | 26 | 244
| 6038
Page 41 Run 12/21/01
Georgia Department of Corrections Office of Planning and Analysis
Inmate statistical profile
Sample: ACTIVE PRISONERS SERVING LIFE EXCLUDING JAIL
Requestor: Statistics
Active inmates 12/21/2001
Institution by current age & sex
|
MEN
|
WOMEN
|
| Age | Age | Age | Age | Men
| Age | Age | Age | Age |Women
|Grand
Institution
|00-21 %|22-39 %|40-54 %|55-99 %|Total % |00-21 %|22-39 %|40-54 %|55-99 %|Total % |Total %
------------------------------------------------------------------------------------------------------------------------------------
Albany Trans Ctr | 0 0| 1 0| 3 0| 0 0| 4 0 | 0 0| 0 0| 0 0| 0 0| 0 0 | 4 0
Atlanta Trans Ctr(M)| 0 0| 7 0| 14 1| 2 0| 23 0 | 0 0| 0 0| 0 0| 0 0| 0 0 | 23 0
Macon Trans Ctr
| 0 0| 10 0| 2 0| 0 0| 12 0 | 0 0| 0 0| 0 0| 0 0| 0 0 | 12 0
Metro Trans Ctr (W) | 0 0| 0 0| 0 0| 0 0| 0 0 | 0 0| 1 1| 1 1| 1 4| 3 1 | 3 0
Savannah Trans Ctr | 0 0| 6 0| 7 0| 0 0| 13 0 | 0 0| 0 0| 0 0| 0 0| 0 0 | 13 0
Clarke County
| 0 0| 1 0| 0 0| 0 0| 1 0 | 0 0| 0 0| 0 0| 0 0| 0 0 | 1 0
Colquitt County
| 0 0| 0 0| 1 0| 0 0| 1 0 | 0 0| 0 0| 0 0| 0 0| 0 0 | 1 0
Coweta County
| 0 0| 0 0| 1 0| 0 0| 1 0 | 0 0| 0 0| 0 0| 0 0| 0 0 | 1 0
Floyd County
| 0 0| 1 0| 0 0| 0 0| 1 0 | 0 0| 0 0| 0 0| 0 0| 0 0 | 1 0
Gwinnett County
| 0 0| 1 0| 0 0| 0 0| 1 0 | 0 0| 0 0| 0 0| 0 0| 0 0 | 1 0
Hall County
| 0 0| 2 0| 1 0| 0 0| 3 0 | 0 0| 0 0| 0 0| 0 0| 0 0 | 3 0
Jackson County
| 0 0| 1 0| 2 0| 1 0| 4 0 | 0 0| 0 0| 0 0| 0 0| 0 0 | 4 0
Jefferson County | 0 0| 1 0| 2 0| 0 0| 3 0 | 0 0| 0 0| 0 0| 0 0| 0 0 | 3 0
Mitchell County
| 0 0| 0 0| 1 0| 0 0| 1 0 | 0 0| 0 0| 0 0| 0 0| 0 0 | 1 0
Muscogee County
| 0 0| 0 0| 1 0| 0 0| 1 0 | 0 0| 0 0| 0 0| 0 0| 0 0 | 1 0
Richmond County
| 0 0| 1 0| 0 0| 0 0| 1 0 | 0 0| 0 0| 0 0| 0 0| 0 0 | 1 0
Screven County
| 0 0| 1 0| 1 0| 0 0| 2 0 | 0 0| 0 0| 0 0| 0 0| 0 0 | 2 0
Spalding County
| 0 0| 1 0| 0 0| 0 0| 1 0 | 0 0| 0 0| 0 0| 0 0| 0 0 | 1 0
Terrell County
| 0 0| 1 0| 0 0| 1 0| 2 0 | 0 0| 0 0| 0 0| 0 0| 0 0 | 2 0
Clayton County
| 0 0| 1 0| 0 0| 0 0| 1 0 | 0 0| 0 0| 0 0| 0 0| 0 0 | 1 0
Ware Prison
| 12 7| 188 6| 94 4| 12 3| 306 5 | 0 0| 0 0| 0 0| 0 0| 0 0 | 306 5
Lowndes Prison
| 0 0| 6 0| 10 0| 1 0| 17 0 | 0 0| 0 0| 0 0| 0 0| 0 0 | 17 0
Dodge Prison
| 0 0| 49 2| 80 4| 8 2| 137 2 | 0 0| 0 0| 0 0| 0 0| 0 0 | 137 2
Phillips Prison
| 5 3| 125 4| 97 4| 22 5| 249 4 | 0 0| 0 0| 0 0| 0 0| 0 0 | 249 4
Walker Prison
| 0 0| 18 1| 23 1| 6 1| 47 1 | 0 0| 0 0| 0 0| 0 0| 0 0 | 47 1
Wayne Prison
| 0 0| 2 0| 4 0| 0 0| 6 0 | 0 0| 0 0| 0 0| 0 0| 0 0 | 6 0
Arrendale Prison | 40 23| 110 4| 35 2| 3 1| 188 3 | 0 0| 0 0| 0 0| 0 0| 0 0 | 188 3
Montgomery Prison | 0 0| 11 0| 9 0| 3 1| 23 0 | 0 0| 0 0| 0 0| 0 0| 0 0 | 23 0
Lee Prison
| 1 1| 29 1| 25 1| 3 1| 58 1 | 0 0| 0 0| 0 0| 0 0| 0 0 | 58 1
Putnam Prison
| 0 0| 3 0| 0 0| 0 0| 3 0 | 0 0| 0 0| 0 0| 0 0| 0 0 | 3 0
Georgia State Prison| 5 3| 260 9| 201 9| 25 5| 491 8 | 0 0| 0 0| 0 0| 0 0| 0 0 | 491 8
Mens Prison
| 0 0| 11 0| 38 2| 72 16| 121 2 | 0 0| 0 0| 0 0| 0 0| 0 0 | 121 2
Jackson Prison-Diag | 4 2| 14 0| 6 0| 3 1| 27 0 | 0 0| 0 0| 0 0| 0 0| 0 0 | 27 0
Jackson Prison-Perm | 0 0| 2 0| 1 0| 1 0| 4 0 | 0 0| 0 0| 0 0| 0 0| 0 0 | 4 0
Coastal Prison
| 10 6| 33 1| 14 1| 5 1| 62 1 | 0 0| 0 0| 0 0| 0 0| 0 0 | 62 1
Scott Prison
| 0 0| 73 2| 58 3| 9 2| 140 2 | 0 0| 0 0| 0 0| 0 0| 0 0 | 140 2
------------------------------------------------------------------------------------------------------------------------------------
(continued)
Page 42 Run 12/21/01
Georgia Department of Corrections Office of Planning and Analysis
Inmate statistical profile
Sample: ACTIVE PRISONERS SERVING LIFE EXCLUDING JAIL
Requestor:
Active inmates 12/21/2001
Institution by current age & sex
Statistics (CONTINUED)
|
MEN
|
WOMEN
|
| Age | Age | Age | Age | Men
| Age | Age | Age | Age |Women
|Grand
Institution
|00-21 %|22-39 %|40-54 %|55-99 %|Total % |00-21 %|22-39 %|40-54 %|55-99 %|Total % |Total %
------------------------------------------------------------------------------------------------------------------------------------
Rivers Prison
| 0 0| 78 3| 78 4| 11 2| 167 3 | 0 0| 0 0| 0 0| 0 0| 0 0 | 167 3
Rutledge Prison
| 0 0| 30 1| 44 2| 15 3| 89 2 | 0 0| 0 0| 0 0| 0 0| 0 0 | 89 1
Central Prison
| 0 0| 85 3| 132 6| 19 4| 236 4 | 0 0| 0 0| 0 0| 0 0| 0 0 | 236 4
Augusta Med Prison | 12 7| 99 3| 94 4| 31 7| 236 4 | 0 0| 0 0| 0 0| 0 0| 0 0 | 236 4
Rogers Prison
| 0 0| 16 1| 18 1| 1 0| 35 1 | 0 0| 0 0| 0 0| 0 0| 0 0 | 35 1
Burruss Prison
| 0 0| 4 0| 12 1| 3 1| 19 0 | 0 0| 0 0| 0 0| 0 0| 0 0 | 19 0
Bostick Prison
| 0 0| 9 0| 32 1| 28 6| 69 1 | 0 0| 0 0| 0 0| 0 0| 0 0 | 69 1
Valdosta Prison
| 8 5| 146 5| 104 5| 20 4| 278 5 | 0 0| 0 0| 0 0| 0 0| 0 0 | 278 5
Hays Prison
| 5 3| 140 5| 105 5| 18 4| 268 5 | 0 0| 0 0| 0 0| 0 0| 0 0 | 268 4
Hancock Prison
| 9 5| 219 7| 138 6| 23 5| 389 7 | 0 0| 0 0| 0 0| 0 0| 0 0 | 389 6
Telfair Prison
| 10 6| 202 7| 97 4| 13 3| 322 6 | 0 0| 0 0| 0 0| 0 0| 0 0 | 322 5
Autry Prison
| 14 8| 143 5| 100 5| 19 4| 276 5 | 0 0| 0 0| 0 0| 0 0| 0 0 | 276 5
Wilcox Prison
| 0 0| 59 2| 63 3| 6 1| 128 2 | 0 0| 0 0| 0 0| 0 0| 0 0 | 128 2
Calhoun Prison
| 13 7| 98 3| 68 3| 5 1| 184 3 | 0 0| 0 0| 0 0| 0 0| 0 0 | 184 3
Dooly Prison
| 0 0| 42 1| 73 3| 8 2| 123 2 | 0 0| 0 0| 0 0| 0 0| 0 0 | 123 2
Macon Prison
| 11 6| 291 10| 108 5| 28 6| 438 8 | 0 0| 0 0| 0 0| 0 0| 0 0 | 438 7
Smith Prison
| 15 9| 204 7| 68 3| 14 3| 301 5 | 0 0| 0 0| 0 0| 0 0| 0 0 | 301 5
Homerville Prison | 0 0| 1 0| 3 0| 0 0| 4 0 | 0 0| 0 0| 0 0| 0 0| 0 0 | 4 0
Washingtn Women Pris| 0 0| 0 0| 0 0| 0 0| 0 0 | 3 38| 28 23| 29 32| 10 38| 70 29 | 70 1
Baldwin Prison
| 1 1| 23 1| 23 1| 6 1| 53 1 | 0 0| 0 0| 0 0| 0 0| 0 0 | 53 1
Metro Womens Prison | 0 0| 0 0| 0 0| 0 0| 0 0 | 0 0| 31 26| 26 29| 8 31| 65 27 | 65 1
Pulaski Womens Pris | 0 0| 0 0| 0 0| 0 0| 0 0 | 5 63| 60 50| 34 38| 7 27| 106 43 | 106 2
Pelham PreTrans Unit| 0 0| 3 0| 4 0| 1 0| 8 0 | 0 0| 0 0| 0 0| 0 0| 0 0 | 8 0
West Central Prison | 0 0| 3 0| 0 0| 0 0| 3 0 | 0 0| 0 0| 0 0| 0 0| 0 0 | 3 0
D Ray James Prison | 0 0| 33 1| 23 1| 3 1| 59 1 | 0 0| 0 0| 0 0| 0 0| 0 0 | 59 1
Coffee Corr Facility| 0 0| 32 1| 23 1| 5 1| 60 1 | 0 0| 0 0| 0 0| 0 0| 0 0 | 60 1
Wheeler Corr Facilty| 1 1| 43 1| 43 2| 7 2| 94 2 | 0 0| 0 0| 0 0| 0 0| 0 0 | 94 2
------------------------------------------------------------------------------------------------------------------------------------
Total reported
| 176 100| 2973 100| 2184 100| 461 100| 5794 100 | 8 100| 120 100| 90 100| 26 100| 244 100 | 6038 100
|
|
|
|
|
|
|
|
|
|
|
Percent reported | 100.0| 100.0| 100.0| 100.0| 100.0 | 100.0| 100.0| 100.0| 100.0| 100.0 | 100.0
|
|
|
|
|
|
|
|
|
|
|
|
|
|
|
|
|
|
|
|
|
|
Not Reported
|0|0|0|0|0
|0|0|0|0|0
|0
------------------------------------------------------------------------------------------------------------------------------------
Total
| 176 | 2973 | 2184 | 461 | 5794
| 8 | 120 | 90 | 26 | 244
| 6038
Page 43 Run 12/21/01
Georgia Department of Corrections Office of Planning and Analysis
Inmate statistical profile
Sample: ACTIVE PRISONERS SERVING LIFE EXCLUDING JAIL
Requestor: Statistics
Active inmates 12/21/2001
Misdemeanors And Felonies by current age & sex
|
MEN
|
WOMEN
|
| Age | Age | Age | Age | Men
| Age | Age | Age | Age |Women
|Grand
Crime Type
|00-21 %|22-39 %|40-54 %|55-99 %|Total % |00-21 %|22-39 %|40-54 %|55-99 %|Total % |Total %
------------------------------------------------------------------------------------------------------------------------------------
MISDEMEANOR
| 0 0| 0 0| 0 0| 0 0| 0 0 | 0 0| 0 0| 0 0| 0 0| 0 0 | 0 0
FELONY
| 176 100| 2973 100| 2184 100| 461 100| 5794 100 | 8 100| 120 100| 90 100| 26 100| 244 100 | 6038 100
------------------------------------------------------------------------------------------------------------------------------------
Total reported
| 176 100| 2973 100| 2184 100| 461 100| 5794 100 | 8 100| 120 100| 90 100| 26 100| 244 100 | 6038 100
|
|
|
|
|
|
|
|
|
|
|
Percent reported | 100.0| 100.0| 100.0| 100.0| 100.0 | 100.0| 100.0| 100.0| 100.0| 100.0 | 100.0
|
|
|
|
|
|
|
|
|
|
|
|
|
|
|
|
|
|
|
|
|
|
NOT REPORTED
|0|0|0|0|0
|0|0|0|0|0
|0
------------------------------------------------------------------------------------------------------------------------------------
Total
| 176 | 2973 | 2184 | 461 | 5794
| 8 | 120 | 90 | 26 | 244
| 6038
Page 44 Run 12/21/01
Georgia Department of Corrections Office of Planning and Analysis
Inmate statistical profile
Sample: ACTIVE PRISONERS SERVING LIFE EXCLUDING JAIL
Requestor: Statistics
Active inmates 12/21/2001
Crimes By Group by current age & sex
|
MEN
|
WOMEN
|
| Age | Age | Age | Age | Men
| Age | Age | Age | Age |Women
|Grand
Crimes By Group
|00-21 %|22-39 %|40-54 %|55-99 %|Total % |00-21 %|22-39 %|40-54 %|55-99 %|Total % |Total %
------------------------------------------------------------------------------------------------------------------------------------
HOMICIDE
| 129 75| 1912 64| 1285 59| 346 75| 3672 63 | 8 100| 110 92| 76 84| 26 100| 220 90 | 3892 65
ABORTION
| 0 0| 0 0| 0 0| 0 0| 0 0 | 0 0| 0 0| 0 0| 0 0| 0 0 | 0 0
BODILY INJRY&REL OFF| 15 9| 187 6| 118 5| 9 2| 329 6 | 0 0| 2 2| 5 6| 0 0| 7 3 | 336 6
ARSON & REL OFF
| 0 0| 1 0| 0 0| 0 0| 1 0 | 0 0| 0 0| 0 0| 0 0| 0 0 | 1 0
DAMAGE OF PROPERTY | 0 0| 1 0| 0 0| 0 0| 1 0 | 0 0| 0 0| 0 0| 0 0| 0 0 | 1 0
BURGLARY & REL OFF | 0 0| 13 0| 8 0| 0 0| 21 0 | 0 0| 0 0| 1 1| 0 0| 1 0 | 22 0
FORGERY & REL OFF | 0 0| 4 0| 4 0| 0 0| 8 0 | 0 0| 0 0| 0 0| 0 0| 0 0 | 8 0
THEFT
| 0 0| 6 0| 5 0| 0 0| 11 0 | 0 0| 0 0| 0 0| 0 0| 0 0 | 11 0
ROBBERY
| 16 9| 350 12| 255 12| 34 7| 655 11 | 0 0| 2 2| 1 1| 0 0| 3 1 | 658 11
SEXUAL OFFENSES
| 13 8| 305 10| 387 18| 61 13| 766 13 | 0 0| 0 0| 2 2| 0 0| 2 1 | 768 13
OBSCENITY CRIMES | 0 0| 0 0| 0 0| 0 0| 0 0 | 0 0| 0 0| 0 0| 0 0| 0 0 | 0 0
TREASON & REL OFF | 0 0| 0 0| 0 0| 0 0| 0 0 | 0 0| 0 0| 0 0| 0 0| 0 0 | 0 0
CRIMES INVOLVNG GOVT| 0 0| 4 0| 6 0| 1 0| 11 0 | 0 0| 0 0| 0 0| 0 0| 0 0 | 11 0
FALSIFICATIONS
| 0 0| 0 0| 0 0| 0 0| 0 0 | 0 0| 0 0| 0 0| 0 0| 0 0 | 0 0
OBSTRUCT LAW ENFORCE| 0 0| 0 0| 1 0| 0 0| 1 0 | 0 0| 0 0| 0 0| 0 0| 0 0 | 1 0
DISORDERLY CONDUCT | 0 0| 0 0| 0 0| 0 0| 0 0 | 0 0| 0 0| 0 0| 0 0| 0 0 | 0 0
GAMBLING & REL OFF | 0 0| 0 0| 0 0| 0 0| 0 0 | 0 0| 0 0| 0 0| 0 0| 0 0 | 0 0
CRUELTY TO CHILDREN | 0 0| 0 0| 0 0| 0 0| 0 0 | 0 0| 0 0| 0 0| 0 0| 0 0 | 0 0
CRIMES WITH GUNS | 0 0| 0 0| 1 0| 0 0| 1 0 | 0 0| 0 0| 0 0| 0 0| 0 0 | 1 0
INVASION PRIVACY | 0 0| 0 0| 0 0| 0 0| 0 0 | 0 0| 0 0| 0 0| 0 0| 0 0 | 0 0
RACKETEERING
| 0 0| 0 0| 0 0| 0 0| 0 0 | 0 0| 0 0| 0 0| 0 0| 0 0 | 0 0
DRUG ABUSE OFFENSES | 0 0| 171 6| 107 5| 8 2| 286 5 | 0 0| 6 5| 5 6| 0 0| 11 5 | 297 5
DRUG TRAFFICKING | 0 0| 15 1| 6 0| 1 0| 22 0 | 0 0| 0 0| 0 0| 0 0| 0 0 | 22 0
AUTO CRIMES
| 0 0| 0 0| 0 0| 0 0| 0 0 | 0 0| 0 0| 0 0| 0 0| 0 0 | 0 0
REVENUE & CONTRABAND| 0 0| 0 0| 0 0| 0 0| 0 0 | 0 0| 0 0| 0 0| 0 0| 0 0 | 0 0
CRIMES OF OTH STATES| 0 0| 0 0| 0 0| 0 0| 0 0 | 0 0| 0 0| 0 0| 0 0| 0 0 | 0 0
MISC. FELONIES
| 0 0| 1 0| 0 0| 1 0| 2 0 | 0 0| 0 0| 0 0| 0 0| 0 0 | 2 0
MISDEMEANORS
| 0 0| 0 0| 0 0| 0 0| 0 0 | 0 0| 0 0| 0 0| 0 0| 0 0 | 0 0
------------------------------------------------------------------------------------------------------------------------------------
Total reported
| 173 100| 2970 100| 2183 100| 461 100| 5787 100 | 8 100| 120 100| 90 100| 26 100| 244 100 | 6031 100
|
|
|
|
|
|
|
|
|
|
|
Percent reported |
98.3|
99.9| 100.0| 100.0|
99.9 | 100.0| 100.0| 100.0| 100.0| 100.0 |
99.9
|
|
|
|
|
|
|
|
|
|
|
|
|
|
|
|
|
|
|
|
|
|
NOT REPORTED
|3|3|1|0|7
|0|0|0|0|0
|7
------------------------------------------------------------------------------------------------------------------------------------
Total
| 176 | 2973 | 2184 | 461 | 5794
| 8 | 120 | 90 | 26 | 244
| 6038
Page 45 Run 12/21/01
Georgia Department of Corrections Office of Planning and Analysis
Inmate statistical profile
Sample: ACTIVE PRISONERS SERVING LIFE EXCLUDING JAIL
Requestor: Statistics
Active inmates 12/21/2001
Most Serious Offense by current age & sex
|
MEN
|
WOMEN
|
| Age | Age | Age | Age | Men
| Age | Age | Age | Age |Women
|Grand
Most Serious Offense|00-21 %|22-39 %|40-54 %|55-99 %|Total % |00-21 %|22-39 %|40-54 %|55-99 %|Total % |Total %
------------------------------------------------------------------------------------------------------------------------------------
Misdemeanors
|
|
|
------------------------------------------------------------------------------------------------------------------------------------
------------------------------------------------------------------------------------------------------------------------------------
------------------------------------------------------------------------------------------------------------------------------------
FELONIES
|
|
|
------------------------------------------------------------------------------------------------------------------------------------
------------------------------------------------------------------------------------------------------------------------------------
MISC HOMICIDE OFFENS| 3 2| 3 0| 1 0| 0 0| 7 0 | 0 0| 0 0| 0 0| 0 0| 0 0 | 7 0
MURDER
| 129 73| 1911 64| 1285 59| 346 75| 3671 63 | 8 100| 110 92| 76 84| 26 100| 220 90 | 3891 64
VOLUNTARY MANSLAUGHT| 0 0| 1 0| 0 0| 0 0| 1 0 | 0 0| 0 0| 0 0| 0 0| 0 0 | 1 0
AGGRAV ASSAULT
| 1 1| 7 0| 2 0| 0 0| 10 0 | 0 0| 0 0| 0 0| 0 0| 0 0 | 10 0
AGGRAV BATTERY
| 0 0| 1 0| 0 0| 0 0| 1 0 | 0 0| 0 0| 0 0| 0 0| 0 0 | 1 0
KIDNAPPING
| 14 8| 179 6| 114 5| 9 2| 316 5 | 0 0| 2 2| 5 6| 0 0| 7 3 | 323 5
AGGRAV ASSAULT POLCE| 0 0| 0 0| 2 0| 0 0| 2 0 | 0 0| 0 0| 0 0| 0 0| 0 0 | 2 0
ARSON 2ND DEGREE | 0 0| 1 0| 0 0| 0 0| 1 0 | 0 0| 0 0| 0 0| 0 0| 0 0 | 1 0
CRMNL DAMAGE 2ND DEG| 0 0| 1 0| 0 0| 0 0| 1 0 | 0 0| 0 0| 0 0| 0 0| 0 0 | 1 0
BURGLARY
| 0 0| 13 0| 8 0| 0 0| 21 0 | 0 0| 0 0| 1 1| 0 0| 1 0 | 22 0
FORGERY 1ST DEGREE | 0 0| 4 0| 4 0| 0 0| 8 0 | 0 0| 0 0| 0 0| 0 0| 0 0 | 8 0
THEFT BY TAKING
| 0 0| 2 0| 3 0| 0 0| 5 0 | 0 0| 0 0| 0 0| 0 0| 0 0 | 5 0
THEFT BY REC STOLEN | 0 0| 2 0| 1 0| 0 0| 3 0 | 0 0| 0 0| 0 0| 0 0| 0 0 | 3 0
THEFT BY CONVERSION | 0 0| 1 0| 1 0| 0 0| 2 0 | 0 0| 0 0| 0 0| 0 0| 0 0 | 2 0
THEFT OF MOTOR VEH, | 0 0| 1 0| 0 0| 0 0| 1 0 | 0 0| 0 0| 0 0| 0 0| 0 0 | 1 0
ROBBERY
| 0 0| 4 0| 4 0| 4 1| 12 0 | 0 0| 0 0| 0 0| 0 0| 0 0 | 12 0
ARMED ROBBERY
| 15 9| 346 12| 251 11| 30 7| 642 11 | 0 0| 2 2| 1 1| 0 0| 3 1 | 645 11
ATMPT ARMED ROBBERY | 1 1| 0 0| 0 0| 0 0| 1 0 | 0 0| 0 0| 0 0| 0 0| 0 0 | 1 0
MISC SEXUAL
| 0 0| 1 0| 0 0| 0 0| 1 0 | 0 0| 0 0| 0 0| 0 0| 0 0 | 1 0
RAPE
| 13 7| 286 10| 352 16| 47 10| 698 12 | 0 0| 0 0| 2 2| 0 0| 2 1 | 700 12
AGGRAV SODOMY
| 0 0| 12 0| 22 1| 9 2| 43 1 | 0 0| 0 0| 0 0| 0 0| 0 0 | 43 1
CHILD MOLESTATION | 0 0| 2 0| 4 0| 1 0| 7 0 | 0 0| 0 0| 0 0| 0 0| 0 0 | 7 0
AGGRAV CHILD MOLESTA| 0 0| 4 0| 9 0| 4 1| 17 0 | 0 0| 0 0| 0 0| 0 0| 0 0 | 17 0
OBSTR OF LAW ENF OFF| 0 0| 4 0| 6 0| 1 0| 11 0 | 0 0| 0 0| 0 0| 0 0| 0 0 | 11 0
ESCAPE
| 0 0| 0 0| 1 0| 0 0| 1 0 | 0 0| 0 0| 0 0| 0 0| 0 0 | 1 0
POSS OF CERTAIN WEAP| 0 0| 0 0| 1 0| 0 0| 1 0 | 0 0| 0 0| 0 0| 0 0| 0 0 | 1 0
S/D NARCOTICS, OPIAT| 0 0| 10 0| 11 1| 2 0| 23 0 | 0 0| 0 0| 1 1| 0 0| 1 0 | 24 0
S/D DEP,STIM,CNTRF D| 0 0| 4 0| 1 0| 1 0| 6 0 | 0 0| 0 0| 0 0| 0 0| 0 0 | 6 0
S/D OF MARIJUANA | 0 0| 4 0| 5 0| 0 0| 9 0 | 0 0| 0 0| 0 0| 0 0| 0 0 | 9 0
------------------------------------------------------------------------------------------------------------------------------------
(continued)
Page 46 Run 12/21/01
Georgia Department of Corrections Office of Planning and Analysis
Inmate statistical profile
Sample: ACTIVE PRISONERS SERVING LIFE EXCLUDING JAIL
Requestor:
Active inmates 12/21/2001
Most Serious Offense by current age & sex
Statistics (CONTINUED)
|
MEN
|
WOMEN
|
| Age | Age | Age | Age | Men
| Age | Age | Age | Age |Women
|Grand
Most Serious Offense|00-21 %|22-39 %|40-54 %|55-99 %|Total % |00-21 %|22-39 %|40-54 %|55-99 %|Total % |Total %
------------------------------------------------------------------------------------------------------------------------------------
POSS NARCOTICS, OPIA| 0 0| 2 0| 3 0| 0 0| 5 0 | 0 0| 0 0| 0 0| 0 0| 0 0 | 5 0
POSS DEP,STIM,CNTRF | 0 0| 0 0| 1 0| 0 0| 1 0 | 0 0| 0 0| 0 0| 0 0| 0 0 | 1 0
VIOL GA CNTRL SBST A| 0 0| 13 0| 5 0| 0 0| 18 0 | 0 0| 1 1| 1 1| 0 0| 2 1 | 20 0
UNLWFL MFG/DEL/DIST | 0 0| 5 0| 1 0| 0 0| 6 0 | 0 0| 0 0| 0 0| 0 0| 0 0 | 6 0
S/D CONT SUB PUBLIC | 0 0| 2 0| 0 0| 0 0| 2 0 | 0 0| 0 0| 0 0| 0 0| 0 0 | 2 0
S/D CONT SUB SCHOOL | 0 0| 1 0| 0 0| 0 0| 1 0 | 0 0| 0 0| 0 0| 0 0| 0 0 | 1 0
S/D COCAINE
| 0 0| 109 4| 66 3| 3 1| 178 3 | 0 0| 5 4| 3 3| 0 0| 8 3 | 186 3
POSS OF COCAINE
| 0 0| 21 1| 14 1| 2 0| 37 1 | 0 0| 0 0| 0 0| 0 0| 0 0 | 37 1
TRAF COCAINE LESS 20| 0 0| 10 0| 5 0| 1 0| 16 0 | 0 0| 0 0| 0 0| 0 0| 0 0 | 16 0
TRAF COCAINE 401+ GM| 0 0| 4 0| 1 0| 0 0| 5 0 | 0 0| 0 0| 0 0| 0 0| 0 0 | 5 0
ATT/CONSPRCY COMMT C| 0 0| 1 0| 0 0| 0 0| 1 0 | 0 0| 0 0| 0 0| 0 0| 0 0 | 1 0
CONSPIRACY
| 0 0| 1 0| 0 0| 0 0| 1 0 | 0 0| 0 0| 0 0| 0 0| 0 0 | 1 0
CRMNL ATMPT
| 0 0| 0 0| 0 0| 1 0| 1 0 | 0 0| 0 0| 0 0| 0 0| 0 0 | 1 0
NONPYMT AGR NVL STOR| 7 4| 92 3| 66 3| 7 2| 172 3 | 0 0| 3 3| 3 3| 1 4| 7 3 | 179 3
CRMNL SOLICITATION | 169 96| 2881 97| 2118 97| 454 98| 5622 97 | 8 100| 117 98| 87 97| 25 96| 237 97 | 5859 97
------------------------------------------------------------------------------------------------------------------------------------
Total reported
| 352 100| 5946 100| 4368 100| 922 100|11588 100 | 16 100| 240 100| 180 100| 52 100| 488 100 |12076 100
|
|
|
|
|
|
|
|
|
|
|
Percent reported | 100.0| 100.0| 100.0| 100.0| 100.0 | 100.0| 100.0| 100.0| 100.0| 100.0 | 100.0
|
|
|
|
|
|
|
|
|
|
|
|
|
|
|
|
|
|
|
|
|
|
NOT REPORTED
|0|0|0|0|0
|0|0|0|0|0
|0
------------------------------------------------------------------------------------------------------------------------------------
Total
| 176 | 2973 | 2184 | 461 | 5794
| 8 | 120 | 90 | 26 | 244
| 6038
Page 47 Run 12/21/01
Georgia Department of Corrections Office of Planning and Analysis
Inmate statistical profile
Sample: ACTIVE PRISONERS SERVING LIFE EXCLUDING JAIL
Requestor: Statistics
Active inmates 12/21/2001
Most Serious Crime Type by current age & sex
|
MEN
|
WOMEN
|
| Age | Age | Age | Age | Men
| Age | Age | Age | Age |Women
|Grand
Crime Type
|00-21 %|22-39 %|40-54 %|55-99 %|Total % |00-21 %|22-39 %|40-54 %|55-99 %|Total % |Total %
------------------------------------------------------------------------------------------------------------------------------------
VIOL/PERSN
| 163 93| 2452 82| 1659 76| 389 84| 4663 80 | 8 100| 114 95| 82 91| 26 100| 230 94 | 4893 81
NVIOL/PERS
| 0 0| 0 0| 0 0| 0 0| 0 0 | 0 0| 0 0| 0 0| 0 0| 0 0 | 0 0
PROPERTY
| 0 0| 25 1| 17 1| 0 0| 42 1 | 0 0| 0 0| 1 1| 0 0| 1 0 | 43 1
DRUG SALES
| 0 0| 150 5| 90 4| 7 2| 247 4 | 0 0| 5 4| 4 4| 0 0| 9 4 | 256 4
DRUG POSSN
| 0 0| 36 1| 23 1| 2 0| 61 1 | 0 0| 1 1| 1 1| 0 0| 2 1 | 63 1
ALCOHOL
| 0 0| 0 0| 0 0| 0 0| 0 0 | 0 0| 0 0| 0 0| 0 0| 0 0 | 0 0
HABIT/DUI
| 0 0| 0 0| 0 0| 0 0| 0 0 | 0 0| 0 0| 0 0| 0 0| 0 0 | 0 0
SEX OFFEND
| 13 7| 305 10| 387 18| 61 13| 766 13 | 0 0| 0 0| 2 2| 0 0| 2 1 | 768 13
OTHER
| 0 0| 5 0| 8 0| 2 0| 15 0 | 0 0| 0 0| 0 0| 0 0| 0 0 | 15 0
------------------------------------------------------------------------------------------------------------------------------------
Total reported
| 176 100| 2973 100| 2184 100| 461 100| 5794 100 | 8 100| 120 100| 90 100| 26 100| 244 100 | 6038 100
|
|
|
|
|
|
|
|
|
|
|
Percent reported | 100.0| 100.0| 100.0| 100.0| 100.0 | 100.0| 100.0| 100.0| 100.0| 100.0 | 100.0
|
|
|
|
|
|
|
|
|
|
|
|
|
|
|
|
|
|
|
|
|
|
NOT REPORTED
|0|0|0|0|0
|0|0|0|0|0
|0
------------------------------------------------------------------------------------------------------------------------------------
Total
| 176 | 2973 | 2184 | 461 | 5794
| 8 | 120 | 90 | 26 | 244
| 6038