- Collection:
- Georgia Government Publications
- Title:
- Inmate statistical profile: active lifers, Jan. 2001
- Creator:
- Georgia. Department of Corrections. Planning and Analysis Section
- Publisher:
- Atlanta, GA. : Georgia Dept. of Corrections, Office of Planning and Analysis, 2001-01
- Date of Original:
- 2001-01
- Subject:
- Prisoners--Georgia
- Location:
- United States, Georgia, 32.75042, -83.50018
- Medium:
- state government records
- Type:
- Text
- Format:
- application/pdf
- External Identifiers:
- Call Number GA R300.P5 P1 L5 2001/1
- Metadata URL:
- https://dlg.galileo.usg.edu/id:dlg_ggpd_i-ga-br300-pp5-bp1-bl5-b2001-s1-belec-p-btext
- Digital Object URL:
- https://dlg.galileo.usg.edu/do:dlg_ggpd_i-ga-br300-pp5-bp1-bl5-b2001-s1-belec-p-btext
- Language:
- eng
- Holding Institution:
- University of Georgia. Map and Government Information Library
- Rights:
-

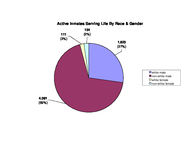
Active Inmates Serving Life By Race & Gender
111 (2%)
134 (2%)
1,623 (27%)
4,091 (69%)
white male non-white male white female non-white female
Prior Incarcerations of Active Inmates Serving A Life Sentence
4000
3,608
(61%)
3500
3000
Number of Inmates
2500
2000 1500 1000
500 0
zero
1,211 (20%)
one
611 (10%)
326 (5%)
two
three
Priors
132 (2%)
four
70 (1%)
five or more
Active Inmates Serving Life By Crime Type
73 (1%)
756 (13%)
18 (<1%)
322 (5%)
47 (1%)
4,743 (80%)
viol/persn
property
drug sales
drug possn
sex offend
other
Georgia Department of Corrections
Page 1 Run 01/24/01
Office of Planning and Analysis
Inmate statistical profile TABLE OF CONTENTS FOR ACTIVE PRISONERS SERVING LIFE EXCLUDING JAIL
TITLE ----RACE AND SEX............................ 2 Culture Fair IQ Scores.................. 3 Self-Rpt Socioeconomic Class............ 4 Self-Rpt Environment To Age 16.......... 5 Self-Rpt Education Level................ 6 Functional Reading Level (WRAT Scores).. 7 Functional Math Level (WRAT Scores)..... 8 Functional Spelling Level (WRAT Scores). 9 Self-Rpt Guardian Status To Age 16......10 Self-Rpt Employment Status Before Prison11 Self-Rpt Marital Status At Admission....12 Self-Rpt Number Of Children At Admission13 Self-Rpt Religious Affiliation..........14 Self-Rpt Family Behavior Patterns *.....15 Inmate Diagnostic Behavior Problem *....16 Physical Profile (General Condition)....17 Security Status.........................18 Number Of Sentences.....................19 Number Of Disciplinaries................20 Number Of Escapes.......................21 Number Of Prior Georgia Incarcerations *22 Number Of Transfers.....................23 County Of Conviction....................24 Circuit Of Conviction...................29 Home County.............................31 Prison Sentence In Years................36 Probation To Follow Prison..............37 Admission Type..........................38 Release Type............................39 Inst By Group...........................40 Institution.............................41 Misdemeanors And Felonies...............43 Crimes By Group.........................44 Most Serious Offense....................45 Most Serious Crime Type.................47
PAGE ----
Georgia Department of Corrections
Page 2 Run 01/24/01
Office of Planning and Analysis
Inmate statistical profile
Sample: ACTIVE PRISONERS SERVING LIFE EXCLUDING JAIL
Requestor: Statistics
Active inmates 01/24/2001
RACE AND SEX by current age & sex
|
MEN
|
WOMEN
|
| Age | Age | Age | Age | Men
| Age | Age | Age | Age |Women
|Grand
RACE AND SEX
|00-21 %|22-39 %|40-54 %|55-99 %|Total % |00-21 %|22-39 %|40-54 %|55-99 %|Total % |Total %
------------------------------------------------------------------------------------------------------------------------------------
WHITE MALE
| 35 19| 678 23| 701 33| 209 51| 1623 28 | 0 0| 0 0| 0 0| 0 0| 0 0 | 1623 27
NON WHITE MALE
| 151 81| 2327 77| 1414 67| 199 49| 4091 72 | 0 0| 0 0| 0 0| 0 0| 0 0 | 4091 69
WHITE FEMALE
| 0 0| 0 0| 0 0| 0 0| 0 0 | 4 36| 47 38| 42 50| 18 69| 111 45 | 111 2
NON WHITE FEMALE | 0 0| 0 0| 0 0| 0 0| 0 0 | 7 64| 77 62| 42 50| 8 31| 134 55 | 134 2
------------------------------------------------------------------------------------------------------------------------------------
Total reported
| 186 100| 3005 100| 2115 100| 408 100| 5714 100 | 11 100| 124 100| 84 100| 26 100| 245 100 | 5959 100
|
|
|
|
|
|
|
|
|
|
|
Percent reported | 100.0| 100.0| 100.0| 100.0| 100.0 | 100.0| 100.0| 100.0| 100.0| 100.0 | 100.0
|
|
|
|
|
|
|
|
|
|
|
|
|
|
|
|
|
|
|
|
|
|
NOT REPORTED
|0|0|0|0|0
|0|0|0|0|0
|0
------------------------------------------------------------------------------------------------------------------------------------
Total
| 186 | 3005 | 2115 | 408 | 5714
| 11 | 124 | 84 | 26 | 245
| 5959
|
|
|
|
|
|
|
|
|
|
|
|
|
|
|
|
|
|
|
|
|
|
|
|
|
|
|
|
|
|
|
|
|
|
|
|
|
|
|
|
|
|
|
|
|
|
|
|
|
|
|
|
|
|
|
AVERAGE AGE
| 19.87 | 31.16 | 45.77 | 61.23 | 38.35 | 19.82 | 31.58 | 45.20 | 60.81 | 38.82 | 38.37
Page 3 Run 01/24/01
Georgia Department of Corrections Office of Planning and Analysis
Inmate statistical profile
Sample: ACTIVE PRISONERS SERVING LIFE EXCLUDING JAIL
Requestor: Statistics
Active inmates 01/24/2001
Culture Fair IQ Scores by current age & sex
|
MEN
|
WOMEN
|
| Age | Age | Age | Age | Men
| Age | Age | Age | Age |Women
|Grand
IQ Score
|00-21 %|22-39 %|40-54 %|55-99 %|Total % |00-21 %|22-39 %|40-54 %|55-99 %|Total % |Total %
------------------------------------------------------------------------------------------------------------------------------------
LESS THAN 70
| 4 2| 77 3| 159 8| 38 10| 278 5 | 0 0| 9 7| 9 11| 2 9| 20 9 | 298 5
70 AND UP
| 172 98| 2794 97| 1808 92| 325 90| 5099 95 | 10 100| 112 93| 71 89| 21 91| 214 91 | 5313 95
------------------------------------------------------------------------------------------------------------------------------------
Total reported
| 176 100| 2871 100| 1967 100| 363 100| 5377 100 | 10 100| 121 100| 80 100| 23 100| 234 100 | 5611 100
|
|
|
|
|
|
|
|
|
|
|
Percent reported |
94.6|
95.5|
93.0|
89.0|
94.1 |
90.9|
97.6|
95.2|
88.5|
95.5 |
94.2
|
|
|
|
|
|
|
|
|
|
|
|
|
|
|
|
|
|
|
|
|
|
NOT REPORTED
| 10 | 134 | 148 | 45 | 337
| 1 | 3 | 4 | 3 | 11
| 348
------------------------------------------------------------------------------------------------------------------------------------
Total
| 186 | 3005 | 2115 | 408 | 5714
| 11 | 124 | 84 | 26 | 245
| 5959
|
|
|
|
|
|
|
|
|
|
|
|
|
|
|
|
|
|
|
|
|
|
|
|
|
|
|
|
|
|
|
|
|
|
|
|
|
|
|
|
|
|
|
|
|
|
|
|
|
|
|
|
|
|
|
AVERAGE IQ
| 99.30 | 101.43 | 97.01 | 93.99 | 99.24 | 97.80 | 95.70 | 90.58 | 88.83 | 93.36 | 99.00
Page 4 Run 01/24/01
Georgia Department of Corrections Office of Planning and Analysis
Inmate statistical profile
Sample: ACTIVE PRISONERS SERVING LIFE EXCLUDING JAIL
Requestor: Statistics
Active inmates 01/24/2001
Self-Rpt Socioeconomic Class by current age & sex
|
MEN
|
WOMEN
|
| Age | Age | Age | Age | Men
| Age | Age | Age | Age |Women
|Grand
Socioeconomic Class |00-21 %|22-39 %|40-54 %|55-99 %|Total % |00-21 %|22-39 %|40-54 %|55-99 %|Total % |Total %
------------------------------------------------------------------------------------------------------------------------------------
WELFARE
| 17 10| 342 12| 207 10| 22 6| 588 11 | 0 0| 22 18| 7 8| 0 0| 29 12 | 617 11
OCC EMPLOY
| 14 8| 191 7| 64 3| 6 2| 275 5 | 0 0| 3 2| 0 0| 1 4| 4 2 | 279 5
MINIMUM STD
| 71 42| 1009 35| 894 44| 214 56| 2188 40 | 7 64| 42 34| 25 30| 9 39| 83 35 | 2271 40
MIDDLE
| 67 39| 1321 46| 874 43| 139 36| 2401 44 | 4 36| 54 44| 48 58| 12 52| 118 49 | 2519 44
OTHER
| 1 1| 26 1| 6 0| 3 1| 36 1 | 0 0| 1 1| 3 4| 1 4| 5 2 | 41 1
------------------------------------------------------------------------------------------------------------------------------------
Total reported
| 170 100| 2889 100| 2045 100| 384 100| 5488 100 | 11 100| 122 100| 83 100| 23 100| 239 100 | 5727 100
|
|
|
|
|
|
|
|
|
|
|
Percent reported |
91.4|
96.1|
96.7|
94.1|
96.0 | 100.0|
98.4|
98.8|
88.5|
97.6 |
96.1
|
|
|
|
|
|
|
|
|
|
|
|
|
|
|
|
|
|
|
|
|
|
NOT RPTD
| 16 | 116 | 70 | 24 | 226
|0|2|1|3|6
| 232
------------------------------------------------------------------------------------------------------------------------------------
Total
| 186 | 3005 | 2115 | 408 | 5714
| 11 | 124 | 84 | 26 | 245
| 5959
Page 5 Run 01/24/01
Georgia Department of Corrections Office of Planning and Analysis
Inmate statistical profile
Sample: ACTIVE PRISONERS SERVING LIFE EXCLUDING JAIL
Requestor: Statistics
Active inmates 01/24/2001
Self-Rpt Environment To Age 16 by current age & sex
|
MEN
|
WOMEN
|
| Age | Age | Age | Age | Men
| Age | Age | Age | Age |Women
|Grand
Environment
|00-21 %|22-39 %|40-54 %|55-99 %|Total % |00-21 %|22-39 %|40-54 %|55-99 %|Total % |Total %
------------------------------------------------------------------------------------------------------------------------------------
RURAL/FARM
| 1 1| 108 4| 177 9| 92 23| 378 7 | 0 0| 8 7| 4 5| 3 14| 15 6 | 393 7
RURAL/NFARM
| 4 2| 205 7| 172 8| 35 9| 416 7 | 0 0| 7 6| 3 4| 0 0| 10 4 | 426 7
S.M.S.A
| 76 42| 1211 41| 728 35| 101 26| 2116 38 | 3 27| 24 20| 21 25| 7 32| 55 23 | 2171 37
URBAN
| 35 19| 514 17| 375 18| 52 13| 976 18 | 4 36| 30 25| 23 28| 2 9| 59 25 | 1035 18
SMALL TOWN
| 67 37| 886 30| 592 29| 112 29| 1657 30 | 4 36| 53 43| 30 36| 9 41| 96 40 | 1753 30
OTHER
| 0 0| 17 1| 9 0| 0 0| 26 0 | 0 0| 0 0| 2 2| 1 5| 3 1 | 29 0
------------------------------------------------------------------------------------------------------------------------------------
Total reported
| 183 100| 2941 100| 2053 100| 392 100| 5569 100 | 11 100| 122 100| 83 100| 22 100| 238 100 | 5807 100
|
|
|
|
|
|
|
|
|
|
|
Percent reported |
98.4|
97.9|
97.1|
96.1|
97.5 | 100.0|
98.4|
98.8|
84.6|
97.1 |
97.4
|
|
|
|
|
|
|
|
|
|
|
|
|
|
|
|
|
|
|
|
|
|
NOT RPTD
| 3 | 64 | 62 | 16 | 145
|0|2|1|4|7
| 152
------------------------------------------------------------------------------------------------------------------------------------
Total
| 186 | 3005 | 2115 | 408 | 5714
| 11 | 124 | 84 | 26 | 245
| 5959
Page 6 Run 01/24/01
Georgia Department of Corrections Office of Planning and Analysis
Inmate statistical profile
Sample: ACTIVE PRISONERS SERVING LIFE EXCLUDING JAIL
Requestor: Statistics
Active inmates 01/24/2001
Self-Rpt Education Level by current age & sex
|
MEN
|
WOMEN
|
| Age | Age | Age | Age | Men
| Age | Age | Age | Age |Women
|Grand
Education Level
|00-21 %|22-39 %|40-54 %|55-99 %|Total % |00-21 %|22-39 %|40-54 %|55-99 %|Total % |Total %
------------------------------------------------------------------------------------------------------------------------------------
LESS THAN GRADE 7 | 6 3| 49 2| 109 5| 80 20| 244 4 | 0 0| 1 1| 3 4| 5 20| 9 4 | 253 4
GRADE 7
| 8 4| 84 3| 62 3| 35 9| 189 3 | 0 0| 6 5| 3 4| 1 4| 10 4 | 199 3
GRADE 8
| 41 23| 269 9| 198 10| 42 11| 550 10 | 4 36| 15 12| 7 8| 1 4| 27 11 | 577 10
GRADE 9
| 44 24| 459 15| 249 12| 34 9| 786 14 | 3 27| 16 13| 6 7| 0 0| 25 10 | 811 14
GRADE 10
| 40 22| 591 20| 302 15| 36 9| 969 17 | 2 18| 19 16| 11 13| 3 12| 35 15 | 1004 17
GRADE 11
| 33 18| 547 18| 237 11| 28 7| 845 15 | 1 9| 19 16| 4 5| 2 8| 26 11 | 871 15
GRADE 12
| 7 4| 724 24| 662 32| 96 24| 1489 26 | 1 9| 27 22| 29 35| 9 36| 66 27 | 1555 27
MORE THAN GRADE 12 | 3 2| 240 8| 263 13| 48 12| 554 10 | 0 0| 19 16| 20 24| 4 16| 43 18 | 597 10
------------------------------------------------------------------------------------------------------------------------------------
Total reported
| 182 100| 2963 100| 2082 100| 399 100| 5626 100 | 11 100| 122 100| 83 100| 25 100| 241 100 | 5867 100
|
|
|
|
|
|
|
|
|
|
|
Percent reported |
97.8|
98.6|
98.4|
97.8|
98.5 | 100.0|
98.4|
98.8|
96.2|
98.4 |
98.5
|
|
|
|
|
|
|
|
|
|
|
|
|
|
|
|
|
|
|
|
|
|
NOT REPORTED
| 4 | 42 | 33 | 9 | 88
|0|2|1|1|4
| 92
------------------------------------------------------------------------------------------------------------------------------------
Total
| 186 | 3005 | 2115 | 408 | 5714
| 11 | 124 | 84 | 26 | 245
| 5959
|
|
|
|
|
|
|
|
|
|
|
|
|
|
|
|
|
|
|
|
|
|
|
|
|
|
|
|
|
|
|
|
|
|
|
|
|
|
|
|
|
|
|
|
|
|
|
|
|
|
|
|
|
|
|
AVG EDUCATION LEVEL | 9.45 | 10.98 | 11.23 | 9.76 | 10.93 | 9.27 | 11.56 | 11.84 | 11.12 | 11.51 | 10.96
* NOTE: THE FIELD LABLED "LESS THAN GRADE 7" WAS CORRECTED IN MARCH 1989: MISSING DATA FOR INMATES STILL IN DIAGNOSTICS NOW HAS BEEN REMOVED FROM THIS FIELD AND IDENTIFIED AS "NOT REPORTED" INFORMATION.
Page 7 Run 01/24/01
Georgia Department of Corrections Office of Planning and Analysis
Inmate statistical profile
Sample: ACTIVE PRISONERS SERVING LIFE EXCLUDING JAIL
Requestor: Statistics
Active inmates 01/24/2001
Functional Reading Level (WRAT Scores) by current age & sex
|
MEN
|
WOMEN
|
| Age | Age | Age | Age | Men
| Age | Age | Age | Age |Women
|Grand
WRAT Reading Score |00-21 %|22-39 %|40-54 %|55-99 %|Total % |00-21 %|22-39 %|40-54 %|55-99 %|Total % |Total %
------------------------------------------------------------------------------------------------------------------------------------
LESS THAN GRADE 6 | 73 41| 1116 39| 857 46| 166 49| 2212 42 | 3 30| 46 38| 22 28| 10 42| 81 35 | 2293 42
6TH THRU 8TH GRADE | 34 19| 677 24| 414 22| 60 18| 1185 23 | 2 20| 28 23| 18 23| 4 17| 52 22 | 1237 23
GRADE 9
| 10 6| 203 7| 117 6| 20 6| 350 7 | 1 10| 4 3| 7 9| 2 8| 14 6 | 364 7
GRADE 10
| 12 7| 135 5| 75 4| 14 4| 236 4 | 1 10| 2 2| 6 8| 2 8| 11 5 | 247 4
GRADE 11
| 6 3| 114 4| 84 5| 9 3| 213 4 | 0 0| 4 3| 5 6| 1 4| 10 4 | 223 4
GRADE 12
| 31 18| 525 18| 290 16| 67 20| 913 17 | 3 30| 7 6| 2 3| 1 4| 13 6 | 926 17
MORE THAN GRADE 12 | 11 6| 105 4| 29 2| 4 1| 149 3 | 0 0| 30 25| 18 23| 4 17| 52 22 | 201 4
------------------------------------------------------------------------------------------------------------------------------------
Total reported
| 177 100| 2875 100| 1866 100| 340 100| 5258 100 | 10 100| 121 100| 78 100| 24 100| 233 100 | 5491 100
|
|
|
|
|
|
|
|
|
|
|
Percent reported |
95.2|
95.7|
88.2|
83.3|
92.0 |
90.9|
97.6|
92.9|
92.3|
95.1 |
92.1
|
|
|
|
|
|
|
|
|
|
|
|
|
|
|
|
|
|
|
|
|
|
NOT REPORTED
| 9 | 130 | 249 | 68 | 456
| 1 | 3 | 6 | 2 | 12
| 468
------------------------------------------------------------------------------------------------------------------------------------
Total
| 186 | 3005 | 2115 | 408 | 5714
| 11 | 124 | 84 | 26 | 245
| 5959
|
|
|
|
|
|
|
|
|
|
|
|
|
|
|
|
|
|
|
|
|
|
|
|
|
|
|
|
|
|
|
|
|
|
|
|
|
|
|
|
|
|
|
|
|
|
|
|
|
|
|
|
|
|
|
AVG READING SCORE | 7.75 | 7.69 | 7.01 | 6.92 | 7.40 | 8.47 | 7.99 | 8.31 | 7.48 | 8.07 | 7.43
Page 8 Run 01/24/01
Georgia Department of Corrections Office of Planning and Analysis
Inmate statistical profile
Sample: ACTIVE PRISONERS SERVING LIFE EXCLUDING JAIL
Requestor: Statistics
Active inmates 01/24/2001
Functional Math Level (WRAT Scores) by current age & sex
|
MEN
|
WOMEN
|
| Age | Age | Age | Age | Men
| Age | Age | Age | Age |Women
|Grand
WRAT Math Score
|00-21 %|22-39 %|40-54 %|55-99 %|Total % |00-21 %|22-39 %|40-54 %|55-99 %|Total % |Total %
------------------------------------------------------------------------------------------------------------------------------------
LESS THAN GRADE 6 | 64 36| 856 30| 817 44| 168 49| 1905 36 | 2 20| 45 37| 29 37| 11 46| 87 37 | 1992 36
6TH THRU 8TH GRADE | 80 45| 1455 51| 689 37| 98 29| 2322 44 | 7 70| 50 41| 32 41| 8 33| 97 41 | 2419 44
GRADE 9
| 8 5| 225 8| 128 7| 24 7| 385 7 | 1 10| 12 10| 5 6| 2 8| 20 9 | 405 7
GRADE 10
| 16 9| 132 5| 100 5| 16 5| 264 5 | 0 0| 7 6| 3 4| 1 4| 11 5 | 275 5
GRADE 11
| 5 3| 92 3| 54 3| 13 4| 164 3 | 0 0| 1 1| 2 3| 2 8| 5 2 | 169 3
GRADE 12
| 2 1| 101 4| 80 4| 19 6| 202 4 | 0 0| 2 2| 3 4| 0 0| 5 2 | 207 4
MORE THAN GRADE 12 | 2 1| 18 1| 3 0| 2 1| 25 0 | 0 0| 4 3| 5 6| 0 0| 9 4 | 34 1
------------------------------------------------------------------------------------------------------------------------------------
Total reported
| 177 100| 2879 100| 1871 100| 340 100| 5267 100 | 10 100| 121 100| 79 100| 24 100| 234 100 | 5501 100
|
|
|
|
|
|
|
|
|
|
|
Percent reported |
95.2|
95.8|
88.5|
83.3|
92.2 |
90.9|
97.6|
94.0|
92.3|
95.5 |
92.3
|
|
|
|
|
|
|
|
|
|
|
|
|
|
|
|
|
|
|
|
|
|
NOT REPORTED
| 9 | 126 | 244 | 68 | 447
| 1 | 3 | 5 | 2 | 11
| 458
------------------------------------------------------------------------------------------------------------------------------------
Total
| 186 | 3005 | 2115 | 408 | 5714
| 11 | 124 | 84 | 26 | 245
| 5959
|
|
|
|
|
|
|
|
|
|
|
|
|
|
|
|
|
|
|
|
|
|
|
|
|
|
|
|
|
|
|
|
|
|
|
|
|
|
|
|
|
|
|
|
|
|
|
|
|
|
|
|
|
|
|
AVG MATH SCORE
| 6.87 | 7.12 | 6.59 | 6.39 | 6.87 | 6.87 | 7.06 | 7.22 | 6.16 | 7.01 | 6.88
Page 9 Run 01/24/01
Georgia Department of Corrections Office of Planning and Analysis
Inmate statistical profile
Sample: ACTIVE PRISONERS SERVING LIFE EXCLUDING JAIL
Requestor: Statistics
Active inmates 01/24/2001
Functional Spelling Level (WRAT Scores) by current age & sex
|
MEN
|
WOMEN
|
| Age | Age | Age | Age | Men
| Age | Age | Age | Age |Women
|Grand
WRAT Spelling Score |00-21 %|22-39 %|40-54 %|55-99 %|Total % |00-21 %|22-39 %|40-54 %|55-99 %|Total % |Total %
------------------------------------------------------------------------------------------------------------------------------------
LESS THAN GRADE 6 | 71 40| 1290 45| 1074 58| 200 59| 2635 50 | 2 20| 43 36| 27 34| 12 50| 84 36 | 2719 49
6TH THRU 8TH GRADE | 54 31| 785 27| 376 20| 68 20| 1283 24 | 5 50| 30 25| 18 23| 3 13| 56 24 | 1339 24
GRADE 9
| 11 6| 169 6| 110 6| 13 4| 303 6 | 1 10| 8 7| 3 4| 3 13| 15 6 | 318 6
GRADE 10
| 18 10| 171 6| 72 4| 13 4| 274 5 | 1 10| 9 7| 7 9| 0 0| 17 7 | 291 5
GRADE 11
| 5 3| 137 5| 46 2| 5 1| 193 4 | 1 10| 4 3| 5 6| 2 8| 12 5 | 205 4
GRADE 12
| 12 7| 283 10| 175 9| 39 11| 509 10 | 0 0| 8 7| 5 6| 0 0| 13 6 | 522 10
MORE THAN GRADE 12 | 6 3| 41 1| 14 1| 2 1| 63 1 | 0 0| 19 16| 14 18| 4 17| 37 16 | 100 2
------------------------------------------------------------------------------------------------------------------------------------
Total reported
| 177 100| 2876 100| 1867 100| 340 100| 5260 100 | 10 100| 121 100| 79 100| 24 100| 234 100 | 5494 100
|
|
|
|
|
|
|
|
|
|
|
Percent reported |
95.2|
95.7|
88.3|
83.3|
92.1 |
90.9|
97.6|
94.0|
92.3|
95.5 |
92.2
|
|
|
|
|
|
|
|
|
|
|
|
|
|
|
|
|
|
|
|
|
|
NOT REPORTED
| 9 | 129 | 248 | 68 | 454
| 1 | 3 | 5 | 2 | 11
| 465
------------------------------------------------------------------------------------------------------------------------------------
Total
| 186 | 3005 | 2115 | 408 | 5714
| 11 | 124 | 84 | 26 | 245
| 5959
|
|
|
|
|
|
|
|
|
|
|
|
|
|
|
|
|
|
|
|
|
|
|
|
|
|
|
|
|
|
|
|
|
|
|
|
|
|
|
|
|
|
|
|
|
|
|
|
|
|
|
|
|
|
|
AVG SPELLING SCORE | 7.13 | 6.89 | 6.05 | 5.88 | 6.54 | 7.89 | 7.91 | 8.11 | 6.82 | 7.86 | 6.60
Page 10 Run 01/24/01
Georgia Department of Corrections Office of Planning and Analysis
Inmate statistical profile
Sample: ACTIVE PRISONERS SERVING LIFE EXCLUDING JAIL
Requestor: Statistics
Active inmates 01/24/2001
Self-Rpt Guardian Status To Age 16 by current age & sex
|
MEN
|
WOMEN
|
| Age | Age | Age | Age | Men
| Age | Age | Age | Age |Women
|Grand
Guardian Status
|00-21 %|22-39 %|40-54 %|55-99 %|Total % |00-21 %|22-39 %|40-54 %|55-99 %|Total % |Total %
------------------------------------------------------------------------------------------------------------------------------------
ORPHANAGE
| 0 0| 5 0| 3 0| 3 1| 11 0 | 0 0| 0 0| 0 0| 0 0| 0 0 | 11 0
FATHER ONLY
| 9 5| 81 3| 59 3| 6 2| 155 3 | 0 0| 2 2| 2 2| 1 4| 5 2 | 160 3
FTR MTR HD
| 14 8| 121 4| 66 3| 6 2| 207 4 | 0 0| 2 2| 4 5| 0 0| 6 3 | 213 4
MOTHER ONLY
| 88 48| 1396 47| 668 32| 101 26| 2253 40 | 7 64| 45 37| 25 31| 9 38| 86 36 | 2339 40
MTR FTR HD
| 40 22| 920 31| 987 48| 223 56| 2170 39 | 4 36| 47 39| 44 54| 13 54| 108 45 | 2278 39
OTH FEMALE
| 2 1| 56 2| 48 2| 16 4| 122 2 | 0 0| 4 3| 2 2| 0 0| 6 3 | 128 2
OTH MALE
| 2 1| 5 0| 12 1| 1 0| 20 0 | 0 0| 2 2| 1 1| 0 0| 3 1 | 23 0
STEP-PARNTS
| 3 2| 52 2| 27 1| 6 2| 88 2 | 0 0| 0 0| 0 0| 0 0| 0 0 | 88 2
FOSTER HOME
| 4 2| 26 1| 31 1| 7 2| 68 1 | 0 0| 2 2| 0 0| 0 0| 2 1 | 70 1
GRAND PRNTS
| 16 9| 234 8| 138 7| 22 6| 410 7 | 0 0| 14 11| 3 4| 1 4| 18 8 | 428 7
OTHER
| 4 2| 61 2| 28 1| 4 1| 97 2 | 0 0| 4 3| 0 0| 0 0| 4 2 | 101 2
------------------------------------------------------------------------------------------------------------------------------------
Total reported
| 182 100| 2957 100| 2067 100| 395 100| 5601 100 | 11 100| 122 100| 81 100| 24 100| 238 100 | 5839 100
|
|
|
|
|
|
|
|
|
|
|
Percent reported |
97.8|
98.4|
97.7|
96.8|
98.0 | 100.0|
98.4|
96.4|
92.3|
97.1 |
98.0
|
|
|
|
|
|
|
|
|
|
|
|
|
|
|
|
|
|
|
|
|
|
NOT RPTD
| 4 | 48 | 48 | 13 | 113
|0|2|3|2|7
| 120
------------------------------------------------------------------------------------------------------------------------------------
Total
| 186 | 3005 | 2115 | 408 | 5714
| 11 | 124 | 84 | 26 | 245
| 5959
Page 11 Run 01/24/01
Georgia Department of Corrections Office of Planning and Analysis
Inmate statistical profile
Sample: ACTIVE PRISONERS SERVING LIFE EXCLUDING JAIL
Requestor: Statistics
Active inmates 01/24/2001
Self-Rpt Employment Status Before Prison by current age & sex
|
MEN
|
WOMEN
|
| Age | Age | Age | Age | Men
| Age | Age | Age | Age |Women
|Grand
Employment
|00-21 %|22-39 %|40-54 %|55-99 %|Total % |00-21 %|22-39 %|40-54 %|55-99 %|Total % |Total %
------------------------------------------------------------------------------------------------------------------------------------
FULL TIME
| 36 21| 965 34| 761 38| 159 42| 1921 35 | 1 10| 29 25| 13 16| 5 22| 48 21 | 1969 35
PART TIME
| 7 4| 230 8| 112 6| 19 5| 368 7 | 0 0| 6 5| 3 4| 0 0| 9 4 | 377 7
UNEMPL < 6M
| 10 6| 466 16| 343 17| 53 14| 872 16 | 0 0| 25 21| 19 24| 4 17| 48 21 | 920 16
UNEMPL > 6M
| 23 14| 885 31| 712 35| 111 29| 1731 32 | 2 20| 36 31| 36 45| 12 52| 86 37 | 1817 32
NEVER WORKD
| 73 43| 251 9| 23 1| 3 1| 350 6 | 4 40| 21 18| 4 5| 0 0| 29 13 | 379 7
STUDENT
| 20 12| 31 1| 6 0| 1 0| 58 1 | 3 30| 1 1| 2 3| 0 0| 6 3 | 64 1
INCAPABLE
| 1 1| 31 1| 50 2| 31 8| 113 2 | 0 0| 0 0| 3 4| 2 9| 5 2 | 118 2
OTHER
| 0 0| 0 0| 0 0| 0 0| 0 0 | 0 0| 0 0| 0 0| 0 0| 0 0 | 0 0
------------------------------------------------------------------------------------------------------------------------------------
Total reported
| 170 100| 2859 100| 2007 100| 377 100| 5413 100 | 10 100| 118 100| 80 100| 23 100| 231 100 | 5644 100
|
|
|
|
|
|
|
|
|
|
|
Percent reported |
91.4|
95.1|
94.9|
92.4|
94.7 |
90.9|
95.2|
95.2|
88.5|
94.3 |
94.7
|
|
|
|
|
|
|
|
|
|
|
|
|
|
|
|
|
|
|
|
|
|
NOT RPTD
| 16 | 146 | 108 | 31 | 301
| 1 | 6 | 4 | 3 | 14
| 315
------------------------------------------------------------------------------------------------------------------------------------
Total
| 186 | 3005 | 2115 | 408 | 5714
| 11 | 124 | 84 | 26 | 245
| 5959
* NOTE: THE FIELD LABELD "OTHER" WAS CORRECTED IN APRIL 1989; INMATES CODED "PRE-OTIS NOT REPORTED" NOW HAVE BEEN REMOVED FROM THIS FIELD AND IDENTIFIED AS "NOT REPORTED".
Page 12 Run 01/24/01
Georgia Department of Corrections Office of Planning and Analysis
Inmate statistical profile
Sample: ACTIVE PRISONERS SERVING LIFE EXCLUDING JAIL
Requestor: Statistics
Active inmates 01/24/2001
Self-Rpt Marital Status At Admission by current age & sex
|
MEN
|
WOMEN
|
| Age | Age | Age | Age | Men
| Age | Age | Age | Age |Women
|Grand
Marital Status
|00-21 %|22-39 %|40-54 %|55-99 %|Total % |00-21 %|22-39 %|40-54 %|55-99 %|Total % |Total %
------------------------------------------------------------------------------------------------------------------------------------
SINGLE
| 170 93| 2027 69| 720 35| 54 14| 2971 53 | 11 100| 69 56| 15 18| 3 13| 98 41 | 3069 52
MARRIED
| 2 1| 237 8| 392 19| 109 28| 740 13 | 0 0| 12 10| 17 21| 3 13| 32 13 | 772 13
SEPARATED
| 0 0| 102 3| 170 8| 39 10| 311 6 | 0 0| 12 10| 7 9| 2 8| 21 9 | 332 6
DIVORCED
| 0 0| 141 5| 354 17| 94 24| 589 11 | 0 0| 9 7| 15 18| 6 25| 30 13 | 619 11
WIDOWED
| 3 2| 39 1| 94 5| 52 13| 188 3 | 0 0| 5 4| 20 24| 9 38| 34 14 | 222 4
COMMON LAW
| 7 4| 408 14| 344 17| 48 12| 807 14 | 0 0| 16 13| 8 10| 1 4| 25 10 | 832 14
OTHER
| 0 0| 2 0| 1 0| 0 0| 3 0 | 0 0| 0 0| 0 0| 0 0| 0 0 | 3 0
------------------------------------------------------------------------------------------------------------------------------------
Total reported
| 182 100| 2956 100| 2075 100| 396 100| 5609 100 | 11 100| 123 100| 82 100| 24 100| 240 100 | 5849 100
|
|
|
|
|
|
|
|
|
|
|
Percent reported |
97.8|
98.4|
98.1|
97.1|
98.2 | 100.0|
99.2|
97.6|
92.3|
98.0 |
98.2
|
|
|
|
|
|
|
|
|
|
|
|
|
|
|
|
|
|
|
|
|
|
NOT RPTD
| 4 | 49 | 40 | 12 | 105
|0|1|2|2|5
| 110
------------------------------------------------------------------------------------------------------------------------------------
Total
| 186 | 3005 | 2115 | 408 | 5714
| 11 | 124 | 84 | 26 | 245
| 5959
Page 13 Run 01/24/01
Georgia Department of Corrections Office of Planning and Analysis
Inmate statistical profile
Sample: ACTIVE PRISONERS SERVING LIFE EXCLUDING JAIL
Requestor: Statistics
Active inmates 01/24/2001
Self-Rpt Number Of Children At Admission by current age & sex
|
MEN
|
WOMEN
|
| Age | Age | Age | Age | Men
| Age | Age | Age | Age |Women
|Grand
Number Of Children |00-21 %|22-39 %|40-54 %|55-99 %|Total % |00-21 %|22-39 %|40-54 %|55-99 %|Total % |Total %
------------------------------------------------------------------------------------------------------------------------------------
NO CHILDREN
| 0 0| 434 22| 274 17| 37 11| 745 19 | 0 0| 3 3| 3 4| 1 4| 7 4 | 752 18
ONE CHILD
| 32 71| 748 38| 482 30| 59 17| 1321 33 | 1 100| 31 32| 14 19| 1 4| 47 24 | 1368 33
TWO CHILDREN
| 8 18| 419 21| 381 24| 74 21| 882 22 | 0 0| 33 34| 22 30| 9 38| 64 33 | 946 23
THREE CHILDREN
| 4 9| 235 12| 239 15| 70 20| 548 14 | 0 0| 18 19| 14 19| 7 29| 39 20 | 587 14
FOUR CHILDREN
| 0 0| 84 4| 119 7| 42 12| 245 6 | 0 0| 7 7| 11 15| 4 17| 22 11 | 267 6
FIVE CHILDREN
| 1 2| 32 2| 67 4| 24 7| 124 3 | 0 0| 4 4| 3 4| 1 4| 8 4 | 132 3
MORE THAN 5 CHILDREN| 0 0| 34 2| 59 4| 40 12| 133 3 | 0 0| 1 1| 6 8| 1 4| 8 4 | 141 3
------------------------------------------------------------------------------------------------------------------------------------
Total reported
| 45 100| 1986 100| 1621 100| 346 100| 3998 100 | 1 100| 97 100| 73 100| 24 100| 195 100 | 4193 100
|
|
|
|
|
|
|
|
|
|
|
Percent reported |
24.2|
66.1|
76.6|
84.8|
70.0 |
9.1|
78.2|
86.9|
92.3|
79.6 |
70.4
|
|
|
|
|
|
|
|
|
|
|
|
|
|
|
|
|
|
|
|
|
|
NOT REPORTED
| 141 | 1019 | 494 | 62 | 1716
| 10 | 27 | 11 | 2 | 50
| 1766
------------------------------------------------------------------------------------------------------------------------------------
Total
| 186 | 3005 | 2115 | 408 | 5714
| 11 | 124 | 84 | 26 | 245
| 5959
|
|
|
|
|
|
|
|
|
|
|
|
|
|
|
|
|
|
|
|
|
|
|
|
|
|
|
|
|
|
|
|
|
|
|
|
|
|
|
|
|
|
|
|
|
|
|
|
|
|
|
|
|
|
|
AVG NUM CHILDREN | 1.44 | 1.62 | 2.05 | 2.87 | 1.90 | 1.00 | 2.11 | 2.71 | 2.83 | 2.42 | 1.92
* NOTE: THE FIELD LABLED "NO CHILDREN" WAS CORRECTED IN MARCH 1989: MISSING DATA FOR INMATES STILL IN DIAGNOSTICS NOW HAS BEEN REMOVED FROM THIS FIELD AND IDENTIFIED AS "NOT REPORTED" INFORMATION.
Page 14 Run 01/24/01
Georgia Department of Corrections Office of Planning and Analysis
Inmate statistical profile
Sample: ACTIVE PRISONERS SERVING LIFE EXCLUDING JAIL
Requestor: Statistics
Active inmates 01/24/2001
Self-Rpt Religious Affiliation by current age & sex
|
MEN
|
WOMEN
|
| Age | Age | Age | Age | Men
| Age | Age | Age | Age |Women
|Grand
Religion
|00-21 %|22-39 %|40-54 %|55-99 %|Total % |00-21 %|22-39 %|40-54 %|55-99 %|Total % |Total %
------------------------------------------------------------------------------------------------------------------------------------
ISLAM
| 4 2| 150 5| 74 4| 10 3| 238 4 | 0 0| 1 1| 0 0| 0 0| 1 0 | 239 4
CATHOLIC
| 4 2| 88 3| 65 3| 19 5| 176 3 | 0 0| 7 6| 3 4| 1 4| 11 5 | 187 3
BAPTIST
| 78 43| 1471 52| 1204 62| 221 58| 2974 56 | 5 45| 66 56| 43 54| 15 65| 129 56 | 3103 56
METHODIST
| 3 2| 68 2| 89 5| 25 7| 185 3 | 0 0| 5 4| 7 9| 2 9| 14 6 | 199 4
EPISCOPLN
| 1 1| 4 0| 4 0| 2 1| 11 0 | 0 0| 1 1| 2 3| 0 0| 3 1 | 14 0
PRESBYTRN
| 0 0| 7 0| 8 0| 3 1| 18 0 | 0 0| 0 0| 0 0| 2 9| 2 1 | 20 0
CHC OF GOD
| 0 0| 33 1| 24 1| 9 2| 66 1 | 0 0| 4 3| 1 1| 0 0| 5 2 | 71 1
HOLINESS
| 7 4| 127 4| 92 5| 25 7| 251 5 | 2 18| 14 12| 12 15| 0 0| 28 12 | 279 5
JEWISH
| 0 0| 1 0| 3 0| 1 0| 5 0 | 0 0| 0 0| 0 0| 0 0| 0 0 | 5 0
ANGLICAN
| 0 0| 0 0| 0 0| 0 0| 0 0 | 0 0| 1 1| 0 0| 0 0| 1 0 | 1 0
GRK ORTHDX
| 0 0| 0 0| 0 0| 0 0| 0 0 | 0 0| 0 0| 0 0| 0 0| 0 0 | 0 0
HINDU
| 0 0| 0 0| 0 0| 0 0| 0 0 | 0 0| 0 0| 0 0| 0 0| 0 0 | 0 0
BUDDHIST
| 2 1| 2 0| 1 0| 0 0| 5 0 | 0 0| 0 0| 0 0| 0 0| 0 0 | 5 0
TAOIST
| 0 0| 0 0| 0 0| 0 0| 0 0 | 0 0| 0 0| 0 0| 0 0| 0 0 | 0 0
SHINTOIST
| 0 0| 0 0| 0 0| 0 0| 0 0 | 0 0| 0 0| 0 0| 0 0| 0 0 | 0 0
SEVEN D AD
| 0 0| 5 0| 4 0| 1 0| 10 0 | 0 0| 0 0| 0 0| 0 0| 0 0 | 10 0
JEHOVAH WT
| 1 1| 24 1| 12 1| 0 0| 37 1 | 0 0| 0 0| 0 0| 0 0| 0 0 | 37 1
LATR DAY S
| 0 0| 2 0| 1 0| 0 0| 3 0 | 0 0| 0 0| 0 0| 0 0| 0 0 | 3 0
QUAKER
| 0 0| 0 0| 0 0| 0 0| 0 0 | 0 0| 0 0| 0 0| 0 0| 0 0 | 0 0
OTHER PROD
| 19 11| 213 8| 66 3| 16 4| 314 6 | 0 0| 7 6| 6 8| 1 4| 14 6 | 328 6
NONE
| 44 24| 429 15| 142 7| 14 4| 629 12 | 2 18| 5 4| 1 1| 0 0| 8 3 | 637 11
OTHER
| 17 9| 208 7| 144 7| 33 9| 402 8 | 2 18| 7 6| 5 6| 2 9| 16 7 | 418 8
------------------------------------------------------------------------------------------------------------------------------------
Total reported
| 180 100| 2832 100| 1933 100| 379 100| 5324 100 | 11 100| 118 100| 80 100| 23 100| 232 100 | 5556 100
|
|
|
|
|
|
|
|
|
|
|
Percent reported |
96.8|
94.2|
91.4|
92.9|
93.2 | 100.0|
95.2|
95.2|
88.5|
94.7 |
93.2
|
|
|
|
|
|
|
|
|
|
|
|
|
|
|
|
|
|
|
|
|
|
NOT RPTD
| 6 | 173 | 182 | 29 | 390
| 0 | 6 | 4 | 3 | 13
| 403
------------------------------------------------------------------------------------------------------------------------------------
Total
| 186 | 3005 | 2115 | 408 | 5714
| 11 | 124 | 84 | 26 | 245
| 5959
Page 15 Run 01/24/01
Georgia Department of Corrections Office of Planning and Analysis
Inmate statistical profile
Sample: ACTIVE PRISONERS SERVING LIFE EXCLUDING JAIL
Requestor: Statistics
Active inmates 01/24/2001
Self-Rpt Family Behavior Patterns * by current age & sex
|
MEN
|
WOMEN
|
| Age | Age | Age | Age | Men
| Age | Age | Age | Age |Women
|Grand
Family Behavior
|00-21 %|22-39 %|40-54 %|55-99 %|Total % |00-21 %|22-39 %|40-54 %|55-99 %|Total % |Total %
------------------------------------------------------------------------------------------------------------------------------------
CRIMINLTY
| 54 21| 795 24| 524 29| 73 26| 1446 26 | 6 18| 34 18| 17 22| 2 12| 59 19 | 1505 25
ALCOHOLISM
| 17 7| 322 10| 286 16| 46 16| 671 12 | 3 9| 26 14| 16 21| 2 12| 47 15 | 718 12
DRUG ABUSE
| 22 9| 176 5| 69 4| 6 2| 273 5 | 4 12| 17 9| 6 8| 0 0| 27 9 | 300 5
DOMINERING
| 2 1| 13 0| 13 1| 0 0| 28 0 | 6 18| 12 6| 5 6| 2 12| 25 8 | 53 1
MIGRANT
| 1 0| 46 1| 42 2| 0 0| 89 2 | 1 3| 2 1| 2 3| 0 0| 5 2 | 94 2
INFL BTGS
| 7 3| 138 4| 67 4| 16 6| 228 4 | 3 9| 21 11| 5 6| 2 12| 31 10 | 259 4
PERMISSIVE
| 0 0| 7 0| 16 1| 2 1| 25 0 | 1 3| 4 2| 2 3| 0 0| 7 2 | 32 1
FATH ABSNT
| 110 44| 1465 44| 656 36| 113 40| 2344 41 | 7 21| 48 26| 16 21| 7 41| 78 25 | 2422 40
MOTH ABSNT
| 34 13| 296 9| 147 8| 28 10| 505 9 | 1 3| 15 8| 2 3| 1 6| 19 6 | 524 9
NONE
| 5 2| 36 1| 17 1| 0 0| 58 1 | 2 6| 8 4| 7 9| 1 6| 18 6 | 76 1
------------------------------------------------------------------------------------------------------------------------------------
Total reported
| 252 100| 3294 100| 1837 100| 284 100| 5667 100 | 34 100| 187 100| 78 100| 17 100| 316 100 | 5983 100
|
|
|
|
|
|
|
|
|
|
|
Percent reported |
76.9|
69.8|
60.2|
49.3|
65.0 | 100.0|
68.5|
58.3|
46.2|
64.1 |
65.0
|
|
|
|
|
|
|
|
|
|
|
|
|
|
|
|
|
|
|
|
|
|
OTHER
| 43 | 907 | 841 | 207 | 1998
| 0 | 39 | 35 | 14 | 88
| 2086
------------------------------------------------------------------------------------------------------------------------------------
Total
| 186 | 3005 | 2115 | 408 | 5714
| 11 | 124 | 84 | 26 | 245
| 5959
* NOTE: SINCE THERE CAN BE UP TO FIVE BEHAVIOR CODES PER INMATE, THE NUMBER OF CASES REPORTED IN THE DETAIL LINES AND THE TOTAL REPORTED LINE MAY EXCEED THE TOTAL NUMBER OF CASES. IN SHORT, THIS TABLE COUNTS THE NUMBER OF BEHAVIOR PROBLEMS, NOT INMATES.
Page 16 Run 01/24/01
Georgia Department of Corrections Office of Planning and Analysis
Inmate statistical profile
Sample: ACTIVE PRISONERS SERVING LIFE EXCLUDING JAIL
Requestor: Statistics
Active inmates 01/24/2001
Inmate Diagnostic Behavior Problem * by current age & sex
|
MEN
|
WOMEN
|
| Age | Age | Age | Age | Men
| Age | Age | Age | Age |Women
|Grand
Diagnostic Problem |00-21 %|22-39 %|40-54 %|55-99 %|Total % |00-21 %|22-39 %|40-54 %|55-99 %|Total % |Total %
------------------------------------------------------------------------------------------------------------------------------------
ALCOHOLIC
| 1 0| 132 2| 142 4| 38 6| 313 3 | 1 3| 3 1| 12 8| 2 6| 18 4 | 331 3
ALCOH ABSE
| 42 11| 875 16| 643 17| 112 18| 1672 17 | 1 3| 29 14| 17 12| 6 18| 53 13 | 1725 16
DRUG EXP
| 63 17| 766 14| 368 10| 38 6| 1235 12 | 3 10| 20 10| 16 11| 0 0| 39 10 | 1274 12
DRUG ABSE
| 73 20| 964 18| 655 17| 41 7| 1733 17 | 4 14| 41 20| 25 18| 1 3| 71 17 | 1804 17
NARC ADDCT
| 1 0| 96 2| 95 3| 6 1| 198 2 | 0 0| 4 2| 2 1| 1 3| 7 2 | 205 2
EPILEPTIC
| 1 0| 26 0| 25 1| 4 1| 56 1 | 0 0| 0 0| 2 1| 0 0| 2 0 | 58 1
MANIPULTVE
| 30 8| 241 5| 112 3| 20 3| 403 4 | 1 3| 2 1| 0 0| 1 3| 4 1 | 407 4
ASSAULTIVE
| 121 33| 1325 25| 944 25| 170 27| 2560 25 | 9 31| 52 25| 29 20| 6 18| 96 23 | 2656 25
ESCPE TEND
| 5 1| 112 2| 212 6| 40 6| 369 4 | 0 0| 2 1| 4 3| 0 0| 6 1 | 375 4
SUICIDAL
| 10 3| 140 3| 108 3| 15 2| 273 3 | 5 17| 16 8| 7 5| 2 6| 30 7 | 303 3
WITHDRAWN
| 0 0| 34 1| 21 1| 7 1| 62 1 | 2 7| 2 1| 3 2| 0 0| 7 2 | 69 1
PR RLTY CT
| 1 0| 34 1| 49 1| 13 2| 97 1 | 1 3| 1 0| 3 2| 1 3| 6 1 | 103 1
HOMOSEXUAL
| 2 1| 11 0| 9 0| 5 1| 27 0 | 2 7| 4 2| 2 1| 0 0| 8 2 | 35 0
NONE
| 1 0| 284 5| 247 7| 70 11| 602 6 | 0 0| 11 5| 13 9| 9 26| 33 8 | 635 6
OTHER
| 4 1| 73 1| 59 2| 22 4| 158 2 | 0 0| 0 0| 0 0| 3 9| 3 1 | 161 2
NOT RPTD
| 16 4| 192 4| 70 2| 22 4| 300 3 | 0 0| 18 9| 6 4| 2 6| 26 6 | 326 3
------------------------------------------------------------------------------------------------------------------------------------
Total reported
| 371 100| 5314 100| 3760 100| 624 100|10069 100 | 29 100| 205 100| 142 100| 34 100| 410 100 |10479 100
|
|
|
|
|
|
|
|
|
|
|
Percent reported | 100.0|
99.7| 100.0|
99.8|
99.8 | 100.0| 100.0|
98.8| 100.0|
99.6 |
99.8
|
|
|
|
|
|
|
|
|
|
|
|
|
|
|
|
|
|
|
|
|
|
UNKNOWN
| 0 | 9 | 1 | 1 | 11
|0|0|1|0|1
| 12
------------------------------------------------------------------------------------------------------------------------------------
Total
| 186 | 3005 | 2115 | 408 | 5714
| 11 | 124 | 84 | 26 | 245
| 5959
* NOTE: SINCE THERE CAN BE UP TO FIVE BEHAVIOR CODES PER INMATE, THE NUMBER OF CASES REPORTED IN THE DETAIL LINES AND THE TOTAL REPORTED LINE MAY EXCEED THE TOTAL NUMBER OF CASES. IN SHORT, THIS TABLE COUNTS THE NUMBER OF BEHAVIOR PROBLEMS, NOT INMATES.
Page 17 Run 01/24/01
Georgia Department of Corrections Office of Planning and Analysis
Inmate statistical profile
Sample: ACTIVE PRISONERS SERVING LIFE EXCLUDING JAIL
Requestor: Statistics
Active inmates 01/24/2001
Physical Profile (General Condition) by current age & sex
|
MEN
|
WOMEN
|
| Age | Age | Age | Age | Men
| Age | Age | Age | Age |Women
|Grand
Physical Profile |00-21 %|22-39 %|40-54 %|55-99 %|Total % |00-21 %|22-39 %|40-54 %|55-99 %|Total % |Total %
------------------------------------------------------------------------------------------------------------------------------------
NO LIMITATION
| 165 91| 2207 74| 1047 50| 76 19| 3495 62 | 10 91| 91 75| 40 49| 1 4| 142 60 | 3637 62
DEFECT NO MAJOR LIMT| 13 7| 396 13| 463 22| 94 23| 966 17 | 0 0| 4 3| 12 15| 5 22| 21 9 | 987 17
DEFECT MAJOR LIMIT | 3 2| 363 12| 580 28| 204 50| 1150 20 | 1 9| 26 21| 29 35| 15 65| 71 30 | 1221 21
VERY MAJOR DEFECT | 0 0| 3 0| 13 1| 30 7| 46 1 | 0 0| 0 0| 1 1| 2 9| 3 1 | 49 1
------------------------------------------------------------------------------------------------------------------------------------
Total reported
| 181 100| 2969 100| 2103 100| 404 100| 5657 100 | 11 100| 121 100| 82 100| 23 100| 237 100 | 5894 100
|
|
|
|
|
|
|
|
|
|
|
Percent reported |
97.3|
98.8|
99.4|
99.0|
99.0 | 100.0|
97.6|
97.6|
88.5|
96.7 |
98.9
|
|
|
|
|
|
|
|
|
|
|
|
|
|
|
|
|
|
|
|
|
|
NOT REPORTED
| 5 | 36 | 12 | 4 | 57
|0|3|2|3|8
| 65
------------------------------------------------------------------------------------------------------------------------------------
Total
| 186 | 3005 | 2115 | 408 | 5714
| 11 | 124 | 84 | 26 | 245
| 5959
Page 18 Run 01/24/01
Georgia Department of Corrections Office of Planning and Analysis
Inmate statistical profile
Sample: ACTIVE PRISONERS SERVING LIFE EXCLUDING JAIL
Requestor: Statistics
Active inmates 01/24/2001
Security Status by current age & sex
|
MEN
|
WOMEN
|
| Age | Age | Age | Age | Men
| Age | Age | Age | Age |Women
|Grand
Security
|00-21 %|22-39 %|40-54 %|55-99 %|Total % |00-21 %|22-39 %|40-54 %|55-99 %|Total % |Total %
------------------------------------------------------------------------------------------------------------------------------------
DIAG INCOM
| 0 0| 2 0| 4 0| 0 0| 6 0 | 0 0| 0 0| 0 0| 0 0| 0 0 | 6 0
WRK RELEAS
| 0 0| 0 0| 0 0| 1 0| 1 0 | 0 0| 0 0| 0 0| 0 0| 0 0 | 1 0
TRUSTY
| 0 0| 59 2| 48 2| 4 1| 111 2 | 0 0| 1 1| 3 4| 1 4| 5 2 | 116 2
MINIMUM
| 1 1| 390 13| 466 22| 85 21| 942 16 | 0 0| 40 32| 29 35| 15 58| 84 34 | 1026 17
MEDIUM
| 20 11| 1251 42| 1102 52| 245 60| 2618 46 | 0 0| 52 42| 38 45| 9 35| 99 40 | 2717 46
CLOSE
| 151 81| 1118 37| 400 19| 65 16| 1734 30 | 9 82| 31 25| 11 13| 1 4| 52 21 | 1786 30
MAXIMUM
| 3 2| 158 5| 89 4| 7 2| 257 4 | 1 9| 0 0| 2 2| 0 0| 3 1 | 260 4
DIAGNOSTIC
| 11 6| 27 1| 6 0| 1 0| 45 1 | 1 9| 0 0| 1 1| 0 0| 2 1 | 47 1
------------------------------------------------------------------------------------------------------------------------------------
Total reported
| 186 100| 3005 100| 2115 100| 408 100| 5714 100 | 11 100| 124 100| 84 100| 26 100| 245 100 | 5959 100
|
|
|
|
|
|
|
|
|
|
|
Percent reported | 100.0| 100.0| 100.0| 100.0| 100.0 | 100.0| 100.0| 100.0| 100.0| 100.0 | 100.0
|
|
|
|
|
|
|
|
|
|
|
|
|
|
|
|
|
|
|
|
|
|
NOT RPTD
|0|0|0|0|0
|0|0|0|0|0
|0
------------------------------------------------------------------------------------------------------------------------------------
Total
| 186 | 3005 | 2115 | 408 | 5714
| 11 | 124 | 84 | 26 | 245
| 5959
* NOTE: BEGINNING IN JULY 1987, THE FACILITIES DIVISION NO LONGER CODED INMATES AS BEING WORK RELEASE
Page 19 Run 01/24/01
Georgia Department of Corrections Office of Planning and Analysis
Inmate statistical profile
Sample: ACTIVE PRISONERS SERVING LIFE EXCLUDING JAIL
Requestor: Statistics
Active inmates 01/24/2001
Number Of Sentences by current age & sex
|
MEN
|
WOMEN
|
| Age | Age | Age | Age | Men
| Age | Age | Age | Age |Women
|Grand
Number Of Sentences |00-21 %|22-39 %|40-54 %|55-99 %|Total % |00-21 %|22-39 %|40-54 %|55-99 %|Total % |Total %
------------------------------------------------------------------------------------------------------------------------------------
ONE
| 58 31| 733 24| 545 26| 138 34| 1474 26 | 5 45| 47 38| 36 43| 13 50| 101 41 | 1575 26
TWO
| 46 25| 707 24| 489 23| 103 25| 1345 24 | 2 18| 40 32| 23 27| 8 31| 73 30 | 1418 24
THREE
| 24 13| 514 17| 379 18| 60 15| 977 17 | 2 18| 19 15| 10 12| 5 19| 36 15 | 1013 17
FOUR
| 23 12| 340 11| 237 11| 37 9| 637 11 | 1 9| 9 7| 5 6| 0 0| 15 6 | 652 11
FIVE
| 11 6| 223 7| 154 7| 21 5| 409 7 | 1 9| 4 3| 4 5| 0 0| 9 4 | 418 7
MORE THAN FIVE
| 24 13| 488 16| 311 15| 49 12| 872 15 | 0 0| 5 4| 6 7| 0 0| 11 4 | 883 15
------------------------------------------------------------------------------------------------------------------------------------
Total reported
| 186 100| 3005 100| 2115 100| 408 100| 5714 100 | 11 100| 124 100| 84 100| 26 100| 245 100 | 5959 100
|
|
|
|
|
|
|
|
|
|
|
Percent reported | 100.0| 100.0| 100.0| 100.0| 100.0 | 100.0| 100.0| 100.0| 100.0| 100.0 | 100.0
|
|
|
|
|
|
|
|
|
|
|
|
|
|
|
|
|
|
|
|
|
|
NOT REPORTED
|0|0|0|0|0
|0|0|0|0|0
|0
------------------------------------------------------------------------------------------------------------------------------------
Total
| 186 | 3005 | 2115 | 408 | 5714
| 11 | 124 | 84 | 26 | 245
| 5959
|
|
|
|
|
|
|
|
|
|
|
|
|
|
|
|
|
|
|
|
|
|
|
|
|
|
|
|
|
|
|
|
|
|
|
|
|
|
|
|
|
|
|
|
|
|
|
|
|
|
|
|
|
|
|
AVG NUM SENTENCES | 2.92 | 3.42 | 3.31 | 2.91 | 3.33 | 2.18 | 2.30 | 2.35 | 1.69 | 2.24 | 3.28
Page 20 Run 01/24/01
Georgia Department of Corrections Office of Planning and Analysis
Inmate statistical profile
Sample: ACTIVE PRISONERS SERVING LIFE EXCLUDING JAIL
Requestor: Statistics
Active inmates 01/24/2001
Number Of Disciplinaries by current age & sex
|
MEN
|
WOMEN
|
| Age | Age | Age | Age | Men
| Age | Age | Age | Age |Women
|Grand
Disciplinaries
|00-21 %|22-39 %|40-54 %|55-99 %|Total % |00-21 %|22-39 %|40-54 %|55-99 %|Total % |Total %
------------------------------------------------------------------------------------------------------------------------------------
ZERO
| 38 20| 459 15| 352 17| 113 28| 962 17 | 3 27| 23 19| 27 32| 12 46| 65 27 | 1027 17
ONE
| 23 12| 301 10| 275 13| 66 16| 665 12 | 2 18| 15 12| 13 15| 7 27| 37 15 | 702 12
TWO
| 18 10| 249 8| 196 9| 44 11| 507 9 | 0 0| 13 10| 9 11| 1 4| 23 9 | 530 9
THREE
| 12 6| 195 6| 145 7| 35 9| 387 7 | 0 0| 11 9| 11 13| 2 8| 24 10 | 411 7
FOUR
| 8 4| 156 5| 117 6| 28 7| 309 5 | 1 9| 4 3| 2 2| 0 0| 7 3 | 316 5
FIVE
| 7 4| 144 5| 92 4| 14 3| 257 4 | 1 9| 5 4| 2 2| 1 4| 9 4 | 266 4
MORE THAN FIVE
| 80 43| 1500 50| 937 44| 108 26| 2625 46 | 4 36| 53 43| 20 24| 3 12| 80 33 | 2705 45
------------------------------------------------------------------------------------------------------------------------------------
Total reported
| 186 100| 3004 100| 2114 100| 408 100| 5712 100 | 11 100| 124 100| 84 100| 26 100| 245 100 | 5957 100
|
|
|
|
|
|
|
|
|
|
|
Percent reported | 100.0| 100.0| 100.0| 100.0| 100.0 | 100.0| 100.0| 100.0| 100.0| 100.0 | 100.0
|
|
|
|
|
|
|
|
|
|
|
|
|
|
|
|
|
|
|
|
|
|
NOT REPORTED
|0|1|1|0|2
|0|0|0|0|0
|2
------------------------------------------------------------------------------------------------------------------------------------
Total
| 186 | 3005 | 2115 | 408 | 5714
| 11 | 124 | 84 | 26 | 245
| 5959
|
|
|
|
|
|
|
|
|
|
|
|
|
|
|
|
|
|
|
|
|
|
|
|
|
|
|
|
|
|
|
|
|
|
|
|
|
|
|
|
|
|
|
|
|
|
|
|
|
|
|
|
|
|
|
AVG NUM DISCIP
| 9.89 | 10.66 | 10.13 | 5.57 | 10.08 | 4.55 | 8.23 | 5.08 | 1.69 | 6.29 | 9.92
Page 21 Run 01/24/01
Georgia Department of Corrections Office of Planning and Analysis
Inmate statistical profile
Sample: ACTIVE PRISONERS SERVING LIFE EXCLUDING JAIL
Requestor: Statistics
Active inmates 01/24/2001
Number Of Escapes by current age & sex
|
MEN
|
WOMEN
|
| Age | Age | Age | Age | Men
| Age | Age | Age | Age |Women
|Grand
Escapes
|00-21 %|22-39 %|40-54 %|55-99 %|Total % |00-21 %|22-39 %|40-54 %|55-99 %|Total % |Total %
------------------------------------------------------------------------------------------------------------------------------------
ZERO
| 186 100| 2970 99| 2027 96| 391 96| 5574 98 | 11 100| 124 100| 82 98| 26 100| 243 99 | 5817 98
ONE
| 0 0| 34 1| 70 3| 11 3| 115 2 | 0 0| 0 0| 2 2| 0 0| 2 1 | 117 2
TWO
| 0 0| 1 0| 14 1| 4 1| 19 0 | 0 0| 0 0| 0 0| 0 0| 0 0 | 19 0
THREE
| 0 0| 0 0| 3 0| 2 0| 5 0 | 0 0| 0 0| 0 0| 0 0| 0 0 | 5 0
FOUR
| 0 0| 0 0| 1 0| 0 0| 1 0 | 0 0| 0 0| 0 0| 0 0| 0 0 | 1 0
FIVE
| 0 0| 0 0| 0 0| 0 0| 0 0 | 0 0| 0 0| 0 0| 0 0| 0 0 | 0 0
MORE THAN FIVE
| 0 0| 0 0| 0 0| 0 0| 0 0 | 0 0| 0 0| 0 0| 0 0| 0 0 | 0 0
------------------------------------------------------------------------------------------------------------------------------------
Total reported
| 186 100| 3005 100| 2115 100| 408 100| 5714 100 | 11 100| 124 100| 84 100| 26 100| 245 100 | 5959 100
|
|
|
|
|
|
|
|
|
|
|
Percent reported | 100.0| 100.0| 100.0| 100.0| 100.0 | 100.0| 100.0| 100.0| 100.0| 100.0 | 100.0
|
|
|
|
|
|
|
|
|
|
|
|
|
|
|
|
|
|
|
|
|
|
NOT REPORTED
|0|0|0|0|0
|0|0|0|0|0
|0
------------------------------------------------------------------------------------------------------------------------------------
Total
| 186 | 3005 | 2115 | 408 | 5714
| 11 | 124 | 84 | 26 | 245
| 5959
|
|
|
|
|
|
|
|
|
|
|
|
|
|
|
|
|
|
|
|
|
|
|
|
|
|
|
|
|
|
|
|
|
|
|
|
|
|
|
|
|
|
|
|
|
|
|
|
|
|
|
|
|
|
|
AVG NUM ESCAPES
| .00 | .01 | .05 | .06 | .03 | .00 | .00 | .02 | .00 | .01 | .03
Page 22 Run 01/24/01
Georgia Department of Corrections Office of Planning and Analysis
Inmate statistical profile
Sample: ACTIVE PRISONERS SERVING LIFE EXCLUDING JAIL
Requestor: Statistics
Active inmates 01/24/2001
Number Of Prior Georgia Incarcerations * by current age & sex
|
MEN
|
WOMEN
|
| Age | Age | Age | Age | Men
| Age | Age | Age | Age |Women
|Grand
Prior Incarcerations|00-21 %|22-39 %|40-54 %|55-99 %|Total % |00-21 %|22-39 %|40-54 %|55-99 %|Total % |Total %
------------------------------------------------------------------------------------------------------------------------------------
ZERO
| 182 98| 2037 68| 955 45| 230 56| 3404 60 | 11 100| 105 85| 64 76| 24 92| 204 83 | 3608 61
ONE
| 4 2| 560 19| 527 25| 92 23| 1183 21 | 0 0| 14 11| 13 15| 1 4| 28 11 | 1211 20
TWO
| 0 0| 226 8| 333 16| 42 10| 601 11 | 0 0| 3 2| 6 7| 1 4| 10 4 | 611 10
THREE
| 0 0| 124 4| 171 8| 29 7| 324 6 | 0 0| 2 2| 0 0| 0 0| 2 1 | 326 5
FOUR
| 0 0| 44 1| 77 4| 11 3| 132 2 | 0 0| 0 0| 0 0| 0 0| 0 0 | 132 2
FIVE
| 0 0| 11 0| 32 2| 2 0| 45 1 | 0 0| 0 0| 0 0| 0 0| 0 0 | 45 1
MORE THAN FIVE
| 0 0| 3 0| 20 1| 2 0| 25 0 | 0 0| 0 0| 1 1| 0 0| 1 0 | 26 0
------------------------------------------------------------------------------------------------------------------------------------
Total reported
| 186 100| 3005 100| 2115 100| 408 100| 5714 100 | 11 100| 124 100| 84 100| 26 100| 245 100 | 5959 100
|
|
|
|
|
|
|
|
|
|
|
Percent reported | 100.0| 100.0| 100.0| 100.0| 100.0 | 100.0| 100.0| 100.0| 100.0| 100.0 | 100.0
|
|
|
|
|
|
|
|
|
|
|
|
|
|
|
|
|
|
|
|
|
|
NOT REPORTED
|0|0|0|0|0
|0|0|0|0|0
|0
------------------------------------------------------------------------------------------------------------------------------------
Total
| 186 | 3005 | 2115 | 408 | 5714
| 11 | 124 | 84 | 26 | 245
| 5959
|
|
|
|
|
|
|
|
|
|
|
|
|
|
|
|
|
|
|
|
|
|
|
|
|
|
|
|
|
|
|
|
|
|
|
|
|
|
|
|
|
|
|
|
|
|
|
|
|
|
|
|
|
|
|
AVG # INCARCERATIONS| .02 | .54 | 1.09 | .81 | .75 | .00 | .21 | .38 | .12 | .25 | .73
* This data counts a parole revocation on an existing sentenCE AS A prior incarceration. Also, this data counts, for any cohort of inmates, the total number of Georgia incarcerations the inmate has had during his entire criminal career. For example, if an inmate was admitted to prison first in FY72, and then re-admitted in FY79 and FY85, he had two prior incarcerations before the FY85 admission. This inmate's records show two prior incarcerations in all three of his records since he has had two prior incarcerations in his criminal career. If the cohort of FY72 admissions is selected for analysis, two prior incarcerations will be listed for this inmate even though in FY72, he had no prior incarcerations.
Page 23 Run 01/24/01
Georgia Department of Corrections Office of Planning and Analysis
Inmate statistical profile
Sample: ACTIVE PRISONERS SERVING LIFE EXCLUDING JAIL
Requestor: Statistics
Active inmates 01/24/2001
Number Of Transfers by current age & sex
|
MEN
|
WOMEN
|
| Age | Age | Age | Age | Men
| Age | Age | Age | Age |Women
|Grand
Transfers
|00-21 %|22-39 %|40-54 %|55-99 %|Total % |00-21 %|22-39 %|40-54 %|55-99 %|Total % |Total %
------------------------------------------------------------------------------------------------------------------------------------
ZERO
| 64 34| 104 3| 29 1| 5 1| 202 4 | 2 18| 4 3| 6 7| 0 0| 12 5 | 214 4
ONE
| 78 42| 853 28| 405 19| 85 21| 1421 25 | 7 64| 36 29| 29 35| 5 19| 77 31 | 1498 25
TWO
| 32 17| 666 22| 352 17| 65 16| 1115 20 | 0 0| 38 31| 14 17| 6 23| 58 24 | 1173 20
THREE
| 10 5| 470 16| 296 14| 66 16| 842 15 | 2 18| 21 17| 16 19| 6 23| 45 18 | 887 15
FOUR
| 0 0| 320 11| 232 11| 39 10| 591 10 | 0 0| 13 10| 8 10| 3 12| 24 10 | 615 10
FIVE
| 2 1| 215 7| 174 8| 33 8| 424 7 | 0 0| 7 6| 3 4| 3 12| 13 5 | 437 7
MORE THAN FIVE
| 0 0| 377 13| 627 30| 115 28| 1119 20 | 0 0| 5 4| 8 10| 3 12| 16 7 | 1135 19
------------------------------------------------------------------------------------------------------------------------------------
Total reported
| 186 100| 3005 100| 2115 100| 408 100| 5714 100 | 11 100| 124 100| 84 100| 26 100| 245 100 | 5959 100
|
|
|
|
|
|
|
|
|
|
|
Percent reported | 100.0| 100.0| 100.0| 100.0| 100.0 | 100.0| 100.0| 100.0| 100.0| 100.0 | 100.0
|
|
|
|
|
|
|
|
|
|
|
|
|
|
|
|
|
|
|
|
|
|
NOT REPORTED
|0|0|0|0|0
|0|0|0|0|0
|0
------------------------------------------------------------------------------------------------------------------------------------
Total
| 186 | 3005 | 2115 | 408 | 5714
| 11 | 124 | 84 | 26 | 245
| 5959
|
|
|
|
|
|
|
|
|
|
|
|
|
|
|
|
|
|
|
|
|
|
|
|
|
|
|
|
|
|
|
|
|
|
|
|
|
|
|
|
|
|
|
|
|
|
|
|
|
|
|
|
|
|
|
AVG NUM TRANSFERS | .98 | 2.98 | 4.51 | 4.41 | 3.58 | 1.18 | 2.41 | 2.49 | 3.42 | 2.49 | 3.54
Page 24 Run 01/24/01
Georgia Department of Corrections Office of Planning and Analysis
Inmate statistical profile
Sample: ACTIVE PRISONERS SERVING LIFE EXCLUDING JAIL
Requestor: Statistics
Active inmates 01/24/2001
County Of Conviction by current age & sex
|
MEN
|
WOMEN
|
| Age | Age | Age | Age | Men
| Age | Age | Age | Age |Women
|Grand
County Of Conviction|00-21 %|22-39 %|40-54 %|55-99 %|Total % |00-21 %|22-39 %|40-54 %|55-99 %|Total % |Total %
------------------------------------------------------------------------------------------------------------------------------------
APPLING COUNTY
| 0 0| 4 0| 4 0| 1 0| 9 0 | 0 0| 0 0| 0 0| 0 0| 0 0 | 9 0
ATKINSON COUNTY
| 0 0| 1 0| 2 0| 2 0| 5 0 | 0 0| 0 0| 1 1| 0 0| 1 0 | 6 0
BACON COUNTY
| 0 0| 6 0| 3 0| 0 0| 9 0 | 0 0| 0 0| 0 0| 0 0| 0 0 | 9 0
BAKER COUNTY
| 0 0| 1 0| 1 0| 0 0| 2 0 | 0 0| 0 0| 0 0| 0 0| 0 0 | 2 0
BALDWIN COUNTY
| 2 1| 15 0| 12 1| 2 0| 31 1 | 0 0| 1 1| 0 0| 0 0| 1 0 | 32 1
BANKS COUNTY
| 0 0| 2 0| 9 0| 2 0| 13 0 | 0 0| 0 0| 0 0| 0 0| 0 0 | 13 0
BARROW COUNTY
| 0 0| 3 0| 9 0| 4 1| 16 0 | 0 0| 0 0| 1 1| 0 0| 1 0 | 17 0
BARTOW COUNTY
| 1 1| 27 1| 22 1| 2 0| 52 1 | 0 0| 2 2| 0 0| 0 0| 2 1 | 54 1
BEN HILL COUNTY
| 0 0| 6 0| 9 0| 3 1| 18 0 | 0 0| 0 0| 0 0| 0 0| 0 0 | 18 0
BERRIEN COUNTY
| 0 0| 4 0| 1 0| 0 0| 5 0 | 0 0| 0 0| 0 0| 0 0| 0 0 | 5 0
BIBB COUNTY
| 3 2| 90 3| 86 4| 15 4| 194 3 | 1 9| 2 2| 1 1| 1 4| 5 2 | 199 3
BLECKLEY COUNTY
| 0 0| 7 0| 4 0| 1 0| 12 0 | 0 0| 0 0| 1 1| 0 0| 1 0 | 13 0
BRANTLEY COUNTY
| 0 0| 1 0| 4 0| 2 0| 7 0 | 0 0| 0 0| 0 0| 0 0| 0 0 | 7 0
BROOKS COUNTY
| 0 0| 5 0| 4 0| 1 0| 10 0 | 0 0| 0 0| 0 0| 0 0| 0 0 | 10 0
BRYAN COUNTY
| 0 0| 9 0| 5 0| 1 0| 15 0 | 0 0| 0 0| 0 0| 1 4| 1 0 | 16 0
BULLOCH COUNTY
| 1 1| 18 1| 15 1| 0 0| 34 1 | 0 0| 1 1| 1 1| 1 4| 3 1 | 37 1
BURKE COUNTY
| 1 1| 16 1| 11 1| 2 0| 30 1 | 0 0| 0 0| 0 0| 0 0| 0 0 | 30 1
BUTTS COUNTY
| 3 2| 21 1| 12 1| 2 0| 38 1 | 0 0| 2 2| 1 1| 0 0| 3 1 | 41 1
CALHOUN COUNTY
| 0 0| 2 0| 4 0| 1 0| 7 0 | 0 0| 0 0| 0 0| 0 0| 0 0 | 7 0
CAMDEN COUNTY
| 1 1| 21 1| 8 0| 0 0| 30 1 | 0 0| 0 0| 1 1| 0 0| 1 0 | 31 1
CANDLER COUNTY
| 0 0| 1 0| 1 0| 0 0| 2 0 | 0 0| 0 0| 0 0| 0 0| 0 0 | 2 0
CARROLL COUNTY
| 0 0| 18 1| 13 1| 6 1| 37 1 | 0 0| 2 2| 1 1| 0 0| 3 1 | 40 1
CATOOSA COUNTY
| 0 0| 5 0| 9 0| 0 0| 14 0 | 0 0| 0 0| 0 0| 0 0| 0 0 | 14 0
CHARLTON COUNTY
| 0 0| 1 0| 0 0| 0 0| 1 0 | 0 0| 2 2| 0 0| 0 0| 2 1 | 3 0
CHATHAM COUNTY
| 8 4| 158 5| 110 5| 14 3| 290 5 | 0 0| 2 2| 1 1| 0 0| 3 1 | 293 5
CHATTAHOOCHEE COUNTY| 0 0| 1 0| 2 0| 0 0| 3 0 | 0 0| 0 0| 0 0| 0 0| 0 0 | 3 0
CHATTOOGA COUNTY | 0 0| 5 0| 5 0| 2 0| 12 0 | 0 0| 0 0| 1 1| 1 4| 2 1 | 14 0
CHEROKEE COUNTY
| 1 1| 9 0| 21 1| 2 0| 33 1 | 0 0| 3 2| 0 0| 0 0| 3 1 | 36 1
CLARKE COUNTY
| 2 1| 39 1| 23 1| 7 2| 71 1 | 0 0| 2 2| 0 0| 1 4| 3 1 | 74 1
CLAY COUNTY
| 0 0| 1 0| 1 0| 0 0| 2 0 | 0 0| 0 0| 0 0| 0 0| 0 0 | 2 0
CLAYTON COUNTY
| 4 2| 73 2| 35 2| 11 3| 123 2 | 1 9| 2 2| 2 2| 1 4| 6 2 | 129 2
CLINCH COUNTY
| 0 0| 1 0| 3 0| 0 0| 4 0 | 0 0| 0 0| 0 0| 0 0| 0 0 | 4 0
COBB COUNTY
| 8 4| 111 4| 74 3| 14 3| 207 4 | 0 0| 5 4| 3 4| 1 4| 9 4 | 216 4
COFFEE COUNTY
| 0 0| 8 0| 9 0| 2 0| 19 0 | 0 0| 1 1| 1 1| 0 0| 2 1 | 21 0
COLQUITT COUNTY
| 3 2| 36 1| 26 1| 3 1| 68 1 | 0 0| 0 0| 1 1| 1 4| 2 1 | 70 1
COLUMBIA COUNTY
| 1 1| 5 0| 10 0| 2 0| 18 0 | 0 0| 0 0| 1 1| 0 0| 1 0 | 19 0
------------------------------------------------------------------------------------------------------------------------------------
(continued)
Page 25 Run 01/24/01
Georgia Department of Corrections Office of Planning and Analysis
Inmate statistical profile
Sample: ACTIVE PRISONERS SERVING LIFE EXCLUDING JAIL
Requestor:
Active inmates 01/24/2001
County Of Conviction by current age & sex
Statistics (CONTINUED)
|
MEN
|
WOMEN
|
| Age | Age | Age | Age | Men
| Age | Age | Age | Age |Women
|Grand
County Of Conviction|00-21 %|22-39 %|40-54 %|55-99 %|Total % |00-21 %|22-39 %|40-54 %|55-99 %|Total % |Total %
------------------------------------------------------------------------------------------------------------------------------------
COOK COUNTY
| 0 0| 7 0| 3 0| 0 0| 10 0 | 0 0| 2 2| 0 0| 0 0| 2 1 | 12 0
COWETA COUNTY
| 3 2| 23 1| 10 0| 3 1| 39 1 | 0 0| 2 2| 1 1| 0 0| 3 1 | 42 1
CRAWFORD COUNTY
| 0 0| 3 0| 0 0| 0 0| 3 0 | 0 0| 0 0| 0 0| 0 0| 0 0 | 3 0
CRISP COUNTY
| 4 2| 13 0| 11 1| 2 0| 30 1 | 0 0| 3 2| 0 0| 1 4| 4 2 | 34 1
DADE COUNTY
| 2 1| 7 0| 5 0| 3 1| 17 0 | 0 0| 0 0| 0 0| 0 0| 0 0 | 17 0
DAWSON COUNTY
| 0 0| 2 0| 4 0| 0 0| 6 0 | 0 0| 0 0| 0 0| 0 0| 0 0 | 6 0
DECATUR COUNTY
| 1 1| 21 1| 6 0| 1 0| 29 1 | 0 0| 1 1| 0 0| 0 0| 1 0 | 30 1
DEKALB COUNTY
| 13 7| 245 8| 163 8| 23 6| 444 8 | 1 9| 3 2| 4 5| 1 4| 9 4 | 453 8
DODGE COUNTY
| 0 0| 6 0| 5 0| 1 0| 12 0 | 0 0| 0 0| 0 0| 0 0| 0 0 | 12 0
DOOLY COUNTY
| 2 1| 8 0| 8 0| 0 0| 18 0 | 0 0| 0 0| 0 0| 0 0| 0 0 | 18 0
DOUGHERTY COUNTY | 6 3| 71 2| 41 2| 4 1| 122 2 | 0 0| 5 4| 0 0| 0 0| 5 2 | 127 2
DOUGLAS COUNTY
| 4 2| 47 2| 20 1| 5 1| 76 1 | 0 0| 1 1| 1 1| 0 0| 2 1 | 78 1
EARLY COUNTY
| 0 0| 10 0| 5 0| 2 0| 17 0 | 0 0| 0 0| 0 0| 0 0| 0 0 | 17 0
ECHOLS COUNTY.
| 0 0| 0 0| 0 0| 0 0| 0 0 | 0 0| 0 0| 0 0| 0 0| 0 0 | 0 0
EFFINGHAM COUNTY | 0 0| 5 0| 3 0| 0 0| 8 0 | 0 0| 0 0| 0 0| 0 0| 0 0 | 8 0
ELBERT COUNTY
| 0 0| 14 0| 8 0| 1 0| 23 0 | 0 0| 1 1| 0 0| 0 0| 1 0 | 24 0
EMANUEL COUNTY
| 1 1| 7 0| 11 1| 2 0| 21 0 | 0 0| 0 0| 1 1| 0 0| 1 0 | 22 0
EVANS COUNTY
| 0 0| 6 0| 4 0| 2 0| 12 0 | 0 0| 0 0| 0 0| 0 0| 0 0 | 12 0
FANNIN COUNTY
| 0 0| 4 0| 5 0| 1 0| 10 0 | 0 0| 0 0| 0 0| 0 0| 0 0 | 10 0
FAYETTE COUNTY
| 1 1| 6 0| 5 0| 0 0| 12 0 | 0 0| 0 0| 0 0| 0 0| 0 0 | 12 0
FLOYD COUNTY
| 2 1| 26 1| 28 1| 4 1| 60 1 | 2 18| 3 2| 2 2| 1 4| 8 3 | 68 1
FORSYTH COUNTY
| 0 0| 5 0| 9 0| 3 1| 17 0 | 0 0| 1 1| 1 1| 0 0| 2 1 | 19 0
FRANKLIN COUNTY
| 1 1| 2 0| 3 0| 1 0| 7 0 | 0 0| 0 0| 2 2| 1 4| 3 1 | 10 0
FULTON COUNTY
| 26 14| 467 16| 314 15| 59 14| 866 15 | 1 9| 12 10| 7 8| 5 19| 25 10 | 891 15
GILMER COUNTY
| 0 0| 1 0| 2 0| 3 1| 6 0 | 0 0| 0 0| 0 0| 0 0| 0 0 | 6 0
GLASCOCK COUNTY
| 0 0| 0 0| 0 0| 0 0| 0 0 | 0 0| 0 0| 0 0| 0 0| 0 0 | 0 0
GLYNN COUNTY
| 6 3| 32 1| 28 1| 3 1| 69 1 | 0 0| 2 2| 2 2| 0 0| 4 2 | 73 1
GORDON COUNTY
| 0 0| 21 1| 14 1| 2 0| 37 1 | 0 0| 1 1| 0 0| 0 0| 1 0 | 38 1
GRADY COUNTY
| 5 3| 16 1| 10 0| 1 0| 32 1 | 0 0| 0 0| 0 0| 0 0| 0 0 | 32 1
GREENE COUNTY
| 1 1| 2 0| 5 0| 1 0| 9 0 | 0 0| 0 0| 0 0| 0 0| 0 0 | 9 0
GWINNETT COUNTY
| 1 1| 67 2| 44 2| 8 2| 120 2 | 0 0| 2 2| 5 6| 1 4| 8 3 | 128 2
HABERSHAM COUNTY | 1 1| 13 0| 9 0| 0 0| 23 0 | 0 0| 0 0| 0 0| 0 0| 0 0 | 23 0
HALL COUNTY
| 3 2| 42 1| 39 2| 10 2| 94 2 | 1 9| 3 2| 1 1| 1 4| 6 2 | 100 2
HANCOCK COUNTY
| 0 0| 3 0| 1 0| 0 0| 4 0 | 0 0| 0 0| 1 1| 0 0| 1 0 | 5 0
HARALSON COUNTY
| 0 0| 4 0| 2 0| 1 0| 7 0 | 0 0| 0 0| 0 0| 0 0| 0 0 | 7 0
------------------------------------------------------------------------------------------------------------------------------------
(continued)
Page 26 Run 01/24/01
Georgia Department of Corrections Office of Planning and Analysis
Inmate statistical profile
Sample: ACTIVE PRISONERS SERVING LIFE EXCLUDING JAIL
Requestor:
Active inmates 01/24/2001
County Of Conviction by current age & sex
Statistics (CONTINUED)
|
MEN
|
WOMEN
|
| Age | Age | Age | Age | Men
| Age | Age | Age | Age |Women
|Grand
County Of Conviction|00-21 %|22-39 %|40-54 %|55-99 %|Total % |00-21 %|22-39 %|40-54 %|55-99 %|Total % |Total %
------------------------------------------------------------------------------------------------------------------------------------
HARRIS COUNTY
| 1 1| 8 0| 3 0| 0 0| 12 0 | 0 0| 0 0| 0 0| 0 0| 0 0 | 12 0
HART COUNTY
| 0 0| 3 0| 2 0| 0 0| 5 0 | 0 0| 0 0| 0 0| 0 0| 0 0 | 5 0
HEARD COUNTY
| 0 0| 2 0| 0 0| 3 1| 5 0 | 0 0| 0 0| 0 0| 0 0| 0 0 | 5 0
HENRY COUNTY
| 0 0| 24 1| 9 0| 1 0| 34 1 | 0 0| 1 1| 0 0| 0 0| 1 0 | 35 1
HOUSTON COUNTY
| 1 1| 39 1| 19 1| 3 1| 62 1 | 0 0| 4 3| 3 4| 1 4| 8 3 | 70 1
IRWIN COUNTY
| 0 0| 3 0| 1 0| 1 0| 5 0 | 0 0| 0 0| 0 0| 0 0| 0 0 | 5 0
JACKSON COUNTY
| 1 1| 6 0| 14 1| 1 0| 22 0 | 0 0| 1 1| 0 0| 0 0| 1 0 | 23 0
JASPER COUNTY
| 0 0| 8 0| 1 0| 0 0| 9 0 | 0 0| 0 0| 1 1| 0 0| 1 0 | 10 0
JEFF DAVIS COUNTY | 0 0| 4 0| 4 0| 2 0| 10 0 | 0 0| 0 0| 0 0| 0 0| 0 0 | 10 0
JEFFERSON COUNTY | 0 0| 7 0| 7 0| 4 1| 18 0 | 0 0| 0 0| 0 0| 0 0| 0 0 | 18 0
JENKINS COUNTY
| 0 0| 2 0| 4 0| 0 0| 6 0 | 0 0| 0 0| 0 0| 0 0| 0 0 | 6 0
JOHNSON COUNTY
| 0 0| 9 0| 2 0| 1 0| 12 0 | 0 0| 1 1| 0 0| 0 0| 1 0 | 13 0
JONES COUNTY
| 0 0| 0 0| 6 0| 3 1| 9 0 | 0 0| 0 0| 0 0| 0 0| 0 0 | 9 0
LAMAR COUNTY
| 1 1| 10 0| 10 0| 3 1| 24 0 | 0 0| 0 0| 1 1| 0 0| 1 0 | 25 0
LANIER COUNTY
| 0 0| 1 0| 0 0| 0 0| 1 0 | 0 0| 0 0| 0 0| 0 0| 0 0 | 1 0
LAURENS COUNTY
| 1 1| 13 0| 7 0| 1 0| 22 0 | 0 0| 1 1| 2 2| 0 0| 3 1 | 25 0
LEE COUNTY
| 0 0| 2 0| 0 0| 0 0| 2 0 | 1 9| 0 0| 0 0| 0 0| 1 0 | 3 0
LIBERTY COUNTY
| 1 1| 22 1| 9 0| 4 1| 36 1 | 0 0| 2 2| 0 0| 0 0| 2 1 | 38 1
LINCOLN COUNTY
| 0 0| 3 0| 2 0| 0 0| 5 0 | 0 0| 0 0| 0 0| 0 0| 0 0 | 5 0
LONG COUNTY
| 1 1| 5 0| 4 0| 2 0| 12 0 | 0 0| 2 2| 0 0| 0 0| 2 1 | 14 0
LOWNDES COUNTY
| 0 0| 41 1| 26 1| 2 0| 69 1 | 0 0| 0 0| 2 2| 1 4| 3 1 | 72 1
LUMPKIN COUNTY
| 1 1| 3 0| 0 0| 2 0| 6 0 | 0 0| 0 0| 0 0| 0 0| 0 0 | 6 0
MACON COUNTY
| 0 0| 16 1| 8 0| 0 0| 24 0 | 0 0| 0 0| 0 0| 0 0| 0 0 | 24 0
MADISON COUNTY
| 0 0| 9 0| 5 0| 2 0| 16 0 | 0 0| 2 2| 0 0| 0 0| 2 1 | 18 0
MARION COUNTY
| 0 0| 2 0| 1 0| 0 0| 3 0 | 0 0| 0 0| 1 1| 0 0| 1 0 | 4 0
MCDUFFIE COUNTY
| 0 0| 28 1| 12 1| 4 1| 44 1 | 1 9| 1 1| 0 0| 0 0| 2 1 | 46 1
MCINTOSH COUNTY
| 2 1| 7 0| 9 0| 0 0| 18 0 | 0 0| 0 0| 0 0| 0 0| 0 0 | 18 0
MERIWETHER COUNTY | 0 0| 9 0| 10 0| 3 1| 22 0 | 0 0| 2 2| 0 0| 1 4| 3 1 | 25 0
MILLER COUNTY
| 0 0| 2 0| 2 0| 0 0| 4 0 | 0 0| 0 0| 0 0| 0 0| 0 0 | 4 0
MITCHELL COUNTY
| 0 0| 11 0| 10 0| 2 0| 23 0 | 0 0| 2 2| 0 0| 0 0| 2 1 | 25 0
MONROE COUNTY
| 0 0| 9 0| 9 0| 2 0| 20 0 | 0 0| 1 1| 0 0| 0 0| 1 0 | 21 0
MONTGOMERY COUNTY | 0 0| 0 0| 3 0| 0 0| 3 0 | 0 0| 0 0| 0 0| 0 0| 0 0 | 3 0
MORGAN COUNTY
| 0 0| 12 0| 2 0| 0 0| 14 0 | 0 0| 1 1| 0 0| 0 0| 1 0 | 15 0
MURRAY COUNTY
| 2 1| 3 0| 6 0| 4 1| 15 0 | 0 0| 0 0| 0 0| 0 0| 0 0 | 15 0
MUSCOGEE COUNTY
| 3 2| 83 3| 76 4| 11 3| 173 3 | 0 0| 4 3| 2 2| 0 0| 6 2 | 179 3
------------------------------------------------------------------------------------------------------------------------------------
(continued)
Page 27 Run 01/24/01
Georgia Department of Corrections Office of Planning and Analysis
Inmate statistical profile
Sample: ACTIVE PRISONERS SERVING LIFE EXCLUDING JAIL
Requestor:
Active inmates 01/24/2001
County Of Conviction by current age & sex
Statistics (CONTINUED)
|
MEN
|
WOMEN
|
| Age | Age | Age | Age | Men
| Age | Age | Age | Age |Women
|Grand
County Of Conviction|00-21 %|22-39 %|40-54 %|55-99 %|Total % |00-21 %|22-39 %|40-54 %|55-99 %|Total % |Total %
------------------------------------------------------------------------------------------------------------------------------------
NEWTON COUNTY
| 2 1| 47 2| 15 1| 5 1| 69 1 | 0 0| 2 2| 0 0| 0 0| 2 1 | 71 1
OCONEE COUNTY
| 0 0| 8 0| 4 0| 0 0| 12 0 | 0 0| 0 0| 0 0| 0 0| 0 0 | 12 0
OGLETHORPE COUNTY | 0 0| 4 0| 4 0| 1 0| 9 0 | 0 0| 0 0| 0 0| 0 0| 0 0 | 9 0
PAULDING COUNTY
| 0 0| 4 0| 6 0| 2 0| 12 0 | 0 0| 1 1| 0 0| 0 0| 1 0 | 13 0
PEACH COUNTY
| 0 0| 6 0| 3 0| 0 0| 9 0 | 0 0| 0 0| 1 1| 0 0| 1 0 | 10 0
PICKENS COUNTY
| 0 0| 3 0| 1 0| 1 0| 5 0 | 0 0| 0 0| 1 1| 0 0| 1 0 | 6 0
PIERCE COUNTY
| 3 2| 2 0| 5 0| 0 0| 10 0 | 0 0| 0 0| 0 0| 0 0| 0 0 | 10 0
PIKE COUNTY
| 0 0| 1 0| 1 0| 0 0| 2 0 | 0 0| 0 0| 0 0| 0 0| 0 0 | 2 0
POLK COUNTY
| 1 1| 11 0| 8 0| 2 0| 22 0 | 0 0| 0 0| 0 0| 0 0| 0 0 | 22 0
PULASKI COUNTY
| 0 0| 7 0| 1 0| 0 0| 8 0 | 0 0| 1 1| 0 0| 0 0| 1 0 | 9 0
PUTNAM COUNTY
| 0 0| 20 1| 14 1| 4 1| 38 1 | 0 0| 0 0| 0 0| 0 0| 0 0 | 38 1
QUITMAN COUNTY
| 0 0| 4 0| 0 0| 0 0| 4 0 | 0 0| 0 0| 0 0| 0 0| 0 0 | 4 0
RABUN COUNTY
| 0 0| 6 0| 3 0| 0 0| 9 0 | 0 0| 0 0| 0 0| 0 0| 0 0 | 9 0
RANDOLPH COUNTY
| 0 0| 3 0| 2 0| 2 0| 7 0 | 0 0| 0 0| 0 0| 0 0| 0 0 | 7 0
RICHMOND COUNTY
| 11 6| 158 5| 76 4| 13 3| 258 5 | 0 0| 8 6| 8 10| 1 4| 17 7 | 275 5
ROCKDALE COUNTY
| 1 1| 10 0| 11 1| 5 1| 27 0 | 0 0| 1 1| 0 0| 0 0| 1 0 | 28 0
SCHLEY COUNTY
| 0 0| 3 0| 2 0| 0 0| 5 0 | 0 0| 0 0| 0 0| 0 0| 0 0 | 5 0
SCREVEN COUNTY
| 0 0| 5 0| 5 0| 2 0| 12 0 | 0 0| 0 0| 0 0| 0 0| 0 0 | 12 0
SEMINOLE COUNTY
| 1 1| 4 0| 4 0| 2 0| 11 0 | 0 0| 1 1| 0 0| 0 0| 1 0 | 12 0
SPALDING COUNTY
| 2 1| 41 1| 23 1| 6 1| 72 1 | 1 9| 1 1| 2 2| 1 4| 5 2 | 77 1
STEPHENS COUNTY
| 0 0| 3 0| 4 0| 3 1| 10 0 | 0 0| 0 0| 0 0| 0 0| 0 0 | 10 0
STEWART COUNTY
| 0 0| 2 0| 1 0| 0 0| 3 0 | 0 0| 0 0| 2 2| 0 0| 2 1 | 5 0
SUMTER COUNTY
| 0 0| 5 0| 13 1| 1 0| 19 0 | 0 0| 0 0| 1 1| 0 0| 1 0 | 20 0
TALBOT COUNTY
| 2 1| 4 0| 1 0| 0 0| 7 0 | 0 0| 0 0| 1 1| 0 0| 1 0 | 8 0
TALIAFERRO COUNTY | 0 0| 0 0| 3 0| 0 0| 3 0 | 0 0| 0 0| 0 0| 0 0| 0 0 | 3 0
TATTNALL COUNTY
| 0 0| 17 1| 13 1| 3 1| 33 1 | 0 0| 0 0| 1 1| 0 0| 1 0 | 34 1
TAYLOR COUNTY
| 3 2| 9 0| 5 0| 0 0| 17 0 | 0 0| 0 0| 0 0| 0 0| 0 0 | 17 0
TELFAIR COUNTY
| 1 1| 6 0| 2 0| 0 0| 9 0 | 0 0| 0 0| 1 1| 0 0| 1 0 | 10 0
TERRELL COUNTY
| 1 1| 12 0| 3 0| 1 0| 17 0 | 0 0| 0 0| 0 0| 0 0| 0 0 | 17 0
THOMAS COUNTY
| 2 1| 16 1| 22 1| 3 1| 43 1 | 0 0| 1 1| 1 1| 0 0| 2 1 | 45 1
TIFT COUNTY
| 7 4| 34 1| 22 1| 4 1| 67 1 | 0 0| 0 0| 2 2| 1 4| 3 1 | 70 1
TOOMBS COUNTY
| 4 2| 21 1| 10 0| 1 0| 36 1 | 0 0| 2 2| 0 0| 0 0| 2 1 | 38 1
TOWNS COUNTY
| 0 0| 1 0| 1 0| 0 0| 2 0 | 0 0| 0 0| 0 0| 0 0| 0 0 | 2 0
TREUTLEN COUNTY
| 0 0| 3 0| 4 0| 0 0| 7 0 | 0 0| 0 0| 0 0| 0 0| 0 0 | 7 0
TROUP COUNTY
| 2 1| 25 1| 25 1| 7 2| 59 1 | 0 0| 2 2| 1 1| 0 0| 3 1 | 62 1
------------------------------------------------------------------------------------------------------------------------------------
(continued)
Page 28 Run 01/24/01
Georgia Department of Corrections Office of Planning and Analysis
Inmate statistical profile
Sample: ACTIVE PRISONERS SERVING LIFE EXCLUDING JAIL
Requestor:
Active inmates 01/24/2001
County Of Conviction by current age & sex
Statistics (CONTINUED)
|
MEN
|
WOMEN
|
| Age | Age | Age | Age | Men
| Age | Age | Age | Age |Women
|Grand
County Of Conviction|00-21 %|22-39 %|40-54 %|55-99 %|Total % |00-21 %|22-39 %|40-54 %|55-99 %|Total % |Total %
------------------------------------------------------------------------------------------------------------------------------------
TURNER COUNTY
| 0 0| 8 0| 6 0| 1 0| 15 0 | 0 0| 0 0| 0 0| 0 0| 0 0 | 15 0
TWIGGS COUNTY
| 0 0| 3 0| 5 0| 1 0| 9 0 | 0 0| 0 0| 0 0| 0 0| 0 0 | 9 0
UNION COUNTY
| 0 0| 0 0| 1 0| 0 0| 1 0 | 0 0| 0 0| 0 0| 0 0| 0 0 | 1 0
UPSON COUNTY
| 1 1| 7 0| 5 0| 1 0| 14 0 | 0 0| 0 0| 1 1| 0 0| 1 0 | 15 0
WALKER COUNTY
| 0 0| 15 0| 10 0| 4 1| 29 1 | 0 0| 1 1| 1 1| 0 0| 2 1 | 31 1
WALTON COUNTY
| 3 2| 32 1| 21 1| 2 0| 58 1 | 0 0| 2 2| 0 0| 0 0| 2 1 | 60 1
WARE COUNTY
| 0 0| 14 0| 11 1| 3 1| 28 0 | 0 0| 0 0| 1 1| 0 0| 1 0 | 29 0
WARREN COUNTY
| 0 0| 4 0| 6 0| 1 0| 11 0 | 0 0| 0 0| 0 0| 0 0| 0 0 | 11 0
WASHINGTON COUNTY | 0 0| 7 0| 7 0| 1 0| 15 0 | 1 9| 1 1| 0 0| 0 0| 2 1 | 17 0
WAYNE COUNTY
| 0 0| 7 0| 8 0| 2 0| 17 0 | 0 0| 1 1| 0 0| 0 0| 1 0 | 18 0
WEBSTER COUNTY
| 0 0| 0 0| 0 0| 0 0| 0 0 | 0 0| 0 0| 0 0| 0 0| 0 0 | 0 0
WHEELER COUNTY
| 0 0| 3 0| 3 0| 1 0| 7 0 | 0 0| 0 0| 0 0| 1 4| 1 0 | 8 0
WHITE COUNTY
| 0 0| 3 0| 1 0| 1 0| 5 0 | 0 0| 0 0| 0 0| 0 0| 0 0 | 5 0
WHITFIELD COUNTY | 0 0| 24 1| 24 1| 8 2| 56 1 | 0 0| 5 4| 1 1| 0 0| 6 2 | 62 1
WILCOX COUNTY
| 0 0| 1 0| 7 0| 0 0| 8 0 | 0 0| 0 0| 0 0| 0 0| 0 0 | 8 0
WILKES COUNTY
| 0 0| 7 0| 3 0| 1 0| 11 0 | 0 0| 0 0| 0 0| 0 0| 0 0 | 11 0
WILKINSON COUNTY | 0 0| 7 0| 1 0| 0 0| 8 0 | 0 0| 0 0| 0 0| 0 0| 0 0 | 8 0
WORTH COUNTY
| 2 1| 15 0| 4 0| 2 0| 23 0 | 0 0| 0 0| 0 0| 0 0| 0 0 | 23 0
CONVERSION
| 0 1| 0 0| 0 0| 0 0| 0 0 | 0 0| 0 0| 0 0| 0 0| 0 0 | 0 0
------------------------------------------------------------------------------------------------------------------------------------
Total reported
| 186 100| 3005 100| 2115 100| 408 100| 5714 100 | 11 100| 124 100| 84 100| 26 100| 245 100 | 5959 100
|
|
|
|
|
|
|
|
|
|
|
Percent reported | 100.0| 100.0| 100.0| 100.0| 100.0 | 100.0| 100.0| 100.0| 100.0| 100.0 | 100.0
|
|
|
|
|
|
|
|
|
|
|
|
|
|
|
|
|
|
|
|
|
|
UNKNOWN
|0|0|0|0|0
|0|0|0|0|0
|0
------------------------------------------------------------------------------------------------------------------------------------
Total
| 186 | 3005 | 2115 | 408 | 5714
| 11 | 124 | 84 | 26 | 245
| 5959
Page 29 Run 01/24/01
Georgia Department of Corrections Office of Planning and Analysis
Inmate statistical profile
Sample: ACTIVE PRISONERS SERVING LIFE EXCLUDING JAIL
Requestor: Statistics
Active inmates 01/24/2001
Circuit Of Conviction by current age & sex
|
MEN
|
WOMEN
|
| Age | Age | Age | Age | Men
| Age | Age | Age | Age |Women
|Grand
Circ Of Conviction |00-21 %|22-39 %|40-54 %|55-99 %|Total % |00-21 %|22-39 %|40-54 %|55-99 %|Total % |Total %
------------------------------------------------------------------------------------------------------------------------------------
ALAPAHA CIRCUIT
| 0 0| 14 0| 9 0| 2 0| 25 0 | 0 0| 2 2| 1 1| 0 0| 3 1 | 28 0
ALCOVY CIRCUIT
| 5 3| 79 3| 36 2| 7 2| 127 2 | 0 0| 4 3| 0 0| 0 0| 4 2 | 131 2
ATLANTA CIRCUIT
| 26 14| 467 16| 314 15| 59 14| 866 15 | 1 9| 12 10| 7 8| 5 19| 25 10 | 891 15
ATLANTIC CIRCUIT | 4 2| 66 2| 44 2| 12 3| 126 2 | 0 0| 4 3| 1 1| 1 4| 6 2 | 132 2
AUGUSTA CIRCUIT
| 13 7| 179 6| 97 5| 17 4| 306 5 | 0 0| 8 6| 9 11| 1 4| 18 7 | 324 5
BLUE RIDGE CIRCUIT | 1 1| 13 0| 30 1| 5 1| 49 1 | 0 0| 4 3| 1 1| 0 0| 5 2 | 54 1
BRUNSWICK CIRCUIT | 7 4| 68 2| 52 2| 8 2| 135 2 | 0 0| 3 2| 3 4| 0 0| 6 2 | 141 2
CHATTAHOOCHEE CIRCUI| 9 5| 107 4| 88 4| 11 3| 215 4 | 0 0| 4 3| 4 5| 0 0| 8 3 | 223 4
CHEROKEE CIRCUIT | 1 1| 48 2| 36 2| 4 1| 89 2 | 0 0| 3 2| 0 0| 0 0| 3 1 | 92 2
CLAYTON CIRCUIT
| 4 2| 73 2| 35 2| 11 3| 123 2 | 1 9| 2 2| 2 2| 1 4| 6 2 | 129 2
COBB CIRCUIT
| 8 4| 111 4| 74 4| 14 3| 207 4 | 0 0| 5 4| 3 4| 1 4| 9 4 | 216 4
CONASAUGA CIRCUIT | 2 1| 27 1| 30 1| 12 3| 71 1 | 0 0| 5 4| 1 1| 0 0| 6 2 | 77 1
CORDELE CIRCUIT
| 6 3| 28 1| 35 2| 5 1| 74 1 | 0 0| 3 2| 0 0| 1 4| 4 2 | 78 1
COWETA CIRCUIT
| 5 3| 77 3| 58 3| 22 5| 162 3 | 0 0| 8 6| 3 4| 1 4| 12 5 | 174 3
DOUGHERTY CIRCUIT | 6 3| 71 2| 41 2| 4 1| 122 2 | 0 0| 5 4| 0 0| 0 0| 5 2 | 127 2
DUBLIN CIRCUIT
| 1 1| 28 1| 18 1| 3 1| 50 1 | 0 0| 2 2| 2 2| 0 0| 4 2 | 54 1
EASTERN CIRCUIT
| 8 4| 158 5| 110 5| 14 3| 290 5 | 0 0| 2 2| 1 1| 0 0| 3 1 | 293 5
FLINT CIRCUIT
| 1 1| 61 2| 39 2| 8 2| 109 2 | 0 0| 4 3| 2 2| 0 0| 6 2 | 115 2
GRIFFIN CIRCUIT
| 4 2| 55 2| 34 2| 7 2| 100 2 | 1 9| 1 1| 3 4| 1 4| 6 2 | 106 2
GWINNETT CIRCUIT | 1 1| 67 2| 44 2| 8 2| 120 2 | 0 0| 2 2| 5 6| 1 4| 8 3 | 128 2
HOUSTON CIRCUIT
| 1 1| 39 1| 19 1| 3 1| 62 1 | 0 0| 4 3| 3 4| 1 4| 8 3 | 70 1
LOOKOUT MOUNTAIN CIR| 2 1| 32 1| 29 1| 9 2| 72 1 | 0 0| 1 1| 2 2| 1 4| 4 2 | 76 1
MACON CIRCUIT
| 3 2| 99 3| 89 4| 15 4| 206 4 | 1 9| 2 2| 2 2| 1 4| 6 2 | 212 4
MIDDLE CIRCUIT
| 5 3| 43 1| 36 2| 8 2| 92 2 | 1 9| 3 2| 1 1| 0 0| 5 2 | 97 2
MOUNTAIN CIRCUIT | 1 1| 22 1| 16 1| 3 1| 42 1 | 0 0| 0 0| 0 0| 0 0| 0 0 | 42 1
NORTHEASTERN CIRCUIT| 3 2| 44 1| 43 2| 10 2| 100 2 | 1 9| 3 2| 1 1| 1 4| 6 2 | 106 2
NORTHERN CIRCUIT | 1 1| 32 1| 22 1| 5 1| 60 1 | 0 0| 3 2| 2 2| 1 4| 6 2 | 66 1
OCMULGEE CIRCUIT | 3 2| 67 2| 42 2| 10 2| 122 2 | 0 0| 2 2| 2 2| 0 0| 4 2 | 126 2
OCONEE CIRCUIT
| 1 1| 29 1| 18 1| 3 1| 51 1 | 0 0| 1 1| 2 2| 1 4| 4 2 | 55 1
OGEECHEE CIRCUIT | 1 1| 30 1| 27 1| 2 0| 60 1 | 0 0| 1 1| 1 1| 1 4| 3 1 | 63 1
PATAULA CIRCUIT
| 2 1| 36 1| 17 1| 7 2| 62 1 | 0 0| 1 1| 0 0| 0 0| 1 0 | 63 1
PIEDMONT CIRCUIT | 1 1| 11 0| 32 2| 7 2| 51 1 | 0 0| 1 1| 1 1| 0 0| 2 1 | 53 1
ROME CIRCUIT
| 2 1| 26 1| 28 1| 4 1| 60 1 | 2 18| 3 2| 2 2| 1 4| 8 3 | 68 1
SOUTH GEORGIA CIRCUI| 6 3| 51 2| 31 1| 5 1| 93 2 | 0 0| 3 2| 0 0| 0 0| 3 1 | 96 2
SOUTHERN CIRCUIT | 5 3| 98 3| 78 4| 9 2| 190 3 | 0 0| 1 1| 4 5| 2 8| 7 3 | 197 3
------------------------------------------------------------------------------------------------------------------------------------
(continued)
Page 30 Run 01/24/01
Georgia Department of Corrections Office of Planning and Analysis
Inmate statistical profile
Sample: ACTIVE PRISONERS SERVING LIFE EXCLUDING JAIL
Requestor:
Active inmates 01/24/2001
Circuit Of Conviction by current age & sex
Statistics (Continued)
|
MEN
|
WOMEN
|
| Age | Age | Age | Age | Men
| Age | Age | Age | Age |Women
|Grand
Circ Of Conviction |00-21 %|22-39 %|40-54 %|55-99 %|Total % |00-21 %|22-39 %|40-54 %|55-99 %|Total % |Total %
------------------------------------------------------------------------------------------------------------------------------------
SOUTHWESTERN CIRCUIT| 0 0| 28 1| 24 1| 1 0| 53 1 | 1 9| 0 0| 3 4| 0 0| 4 2 | 57 1
STONE MOUNTAIN CIRCU| 13 7| 245 8| 163 8| 23 6| 444 8 | 1 9| 3 2| 4 5| 1 4| 9 4 | 453 8
TALLAPOOSA CIRCUIT | 1 1| 19 1| 16 1| 5 1| 41 1 | 0 0| 1 1| 0 0| 0 0| 1 0 | 42 1
TIFTON CIRCUIT
| 9 5| 60 2| 33 2| 8 2| 110 2 | 0 0| 0 0| 2 2| 1 4| 3 1 | 113 2
TOOMBS CIRCUIT
| 0 0| 42 1| 26 1| 6 1| 74 1 | 1 9| 1 1| 0 0| 0 0| 2 1 | 76 1
WAYCROSS CIRCUIT | 3 2| 32 1| 32 2| 7 2| 74 1 | 0 0| 3 2| 2 2| 0 0| 5 2 | 79 1
WESTERN CIRCUIT
| 2 1| 47 2| 27 1| 7 2| 83 1 | 0 0| 2 2| 0 0| 1 4| 3 1 | 86 1
ROCKDALE CIRCUIT | 1 1| 10 0| 11 1| 5 1| 27 0 | 0 0| 1 1| 0 0| 0 0| 1 0 | 28 0
DOUGLAS CIRCUIT
| 4 2| 47 2| 20 1| 5 1| 76 1 | 0 0| 1 1| 1 1| 0 0| 2 1 | 78 1
APPALACHIAN CIRCUIT | 0 0| 8 0| 8 0| 5 1| 21 0 | 0 0| 0 0| 1 1| 0 0| 1 0 | 22 0
ENOTAH CIRCUIT
| 1 1| 7 0| 3 0| 3 1| 14 0 | 0 0| 0 0| 0 0| 0 0| 0 0 | 14 0
BELL-FORSYTH CIRCUIT| 0 0| 1 0| 0 0| 0 0| 1 0 | 0 0| 0 0| 0 0| 0 0| 0 0 | 1 0
------------------------------------------------------------------------------------------------------------------------------------
Total reported
| 183 100| 3002 100| 2114 100| 408 100| 5707 100 | 11 100| 124 100| 84 100| 26 100| 245 100 | 5952 100
|
|
|
|
|
|
|
|
|
|
|
Percent reported |
98.4|
99.9| 100.0| 100.0|
99.9 | 100.0| 100.0| 100.0| 100.0| 100.0 |
99.9
|
|
|
|
|
|
|
|
|
|
|
|
|
|
|
|
|
|
|
|
|
|
NOT REPORTED
|3|3|1|0|7
|0|0|0|0|0
|7
------------------------------------------------------------------------------------------------------------------------------------
Total
| 186 | 3005 | 2115 | 408 | 5714
| 11 | 124 | 84 | 26 | 245
| 5959
Page 31 Run 01/24/01
Georgia Department of Corrections Office of Planning and Analysis
Inmate statistical profile
Sample: ACTIVE PRISONERS SERVING LIFE EXCLUDING JAIL
Requestor: Statistics
Active inmates 01/24/2001
Home County by current age & sex
|
MEN
|
WOMEN
|
| Age | Age | Age | Age | Men
| Age | Age | Age | Age |Women
|Grand
Home County
|00-21 %|22-39 %|40-54 %|55-99 %|Total % |00-21 %|22-39 %|40-54 %|55-99 %|Total % |Total %
------------------------------------------------------------------------------------------------------------------------------------
APPLING COUNTY
| 0 0| 4 0| 5 0| 1 0| 10 0 | 0 0| 0 0| 0 0| 0 0| 0 0 | 10 0
ATKINSON COUNTY
| 0 0| 1 0| 1 0| 3 1| 5 0 | 0 0| 0 0| 0 0| 0 0| 0 0 | 5 0
BACON COUNTY
| 0 0| 5 0| 4 0| 1 0| 10 0 | 0 0| 0 0| 0 0| 0 0| 0 0 | 10 0
BAKER COUNTY
| 0 0| 1 0| 2 0| 0 0| 3 0 | 0 0| 0 0| 0 0| 0 0| 0 0 | 3 0
BALDWIN COUNTY
| 0 0| 15 1| 7 0| 1 0| 23 0 | 0 0| 1 1| 0 0| 1 4| 2 1 | 25 0
BANKS COUNTY
| 0 0| 2 0| 4 0| 1 0| 7 0 | 0 0| 1 1| 0 0| 0 0| 1 0 | 8 0
BARROW COUNTY
| 0 0| 6 0| 8 0| 2 1| 16 0 | 0 0| 0 0| 1 1| 0 0| 1 0 | 17 0
BARTOW COUNTY
| 1 1| 19 1| 18 1| 4 1| 42 1 | 1 10| 3 3| 0 0| 0 0| 4 2 | 46 1
BEN HILL COUNTY
| 0 0| 4 0| 7 0| 3 1| 14 0 | 0 0| 0 0| 1 1| 0 0| 1 0 | 15 0
BERRIEN COUNTY
| 0 0| 4 0| 1 0| 1 0| 6 0 | 0 0| 0 0| 0 0| 0 0| 0 0 | 6 0
BIBB COUNTY
| 3 2| 81 3| 80 4| 18 5| 182 3 | 1 10| 5 4| 2 3| 0 0| 8 4 | 190 3
BLECKLEY COUNTY
| 0 0| 8 0| 4 0| 1 0| 13 0 | 0 0| 0 0| 1 1| 0 0| 1 0 | 14 0
BRANTLEY COUNTY
| 0 0| 1 0| 2 0| 0 0| 3 0 | 0 0| 0 0| 0 0| 0 0| 0 0 | 3 0
BROOKS COUNTY
| 0 0| 7 0| 2 0| 1 0| 10 0 | 0 0| 0 0| 0 0| 0 0| 0 0 | 10 0
BRYAN COUNTY
| 1 1| 7 0| 4 0| 1 0| 13 0 | 0 0| 0 0| 0 0| 0 0| 0 0 | 13 0
BULLOCH COUNTY
| 1 1| 12 0| 10 1| 0 0| 23 0 | 0 0| 0 0| 1 1| 1 4| 2 1 | 25 0
BURKE COUNTY
| 0 0| 10 0| 6 0| 3 1| 19 0 | 0 0| 0 0| 0 0| 0 0| 0 0 | 19 0
BUTTS COUNTY
| 1 1| 23 1| 8 0| 2 1| 34 1 | 0 0| 1 1| 1 1| 0 0| 2 1 | 36 1
CALHOUN COUNTY
| 0 0| 4 0| 3 0| 1 0| 8 0 | 0 0| 0 0| 0 0| 0 0| 0 0 | 8 0
CAMDEN COUNTY
| 1 1| 17 1| 6 0| 0 0| 24 0 | 0 0| 0 0| 1 1| 0 0| 1 0 | 25 0
CANDLER COUNTY
| 0 0| 2 0| 1 0| 0 0| 3 0 | 0 0| 0 0| 0 0| 0 0| 0 0 | 3 0
CARROLL COUNTY
| 0 0| 21 1| 12 1| 8 2| 41 1 | 0 0| 2 2| 1 1| 0 0| 3 1 | 44 1
CATOOSA COUNTY
| 0 0| 2 0| 6 0| 1 0| 9 0 | 0 0| 0 0| 0 0| 0 0| 0 0 | 9 0
CHARLTON COUNTY
| 0 0| 1 0| 0 0| 0 0| 1 0 | 0 0| 1 1| 0 0| 0 0| 1 0 | 2 0
CHATHAM COUNTY
| 8 5| 151 6| 99 5| 14 4| 272 5 | 0 0| 2 2| 1 1| 1 4| 4 2 | 276 5
CHATTAHOOCHEE COUNTY| 0 0| 1 0| 1 0| 0 0| 2 0 | 0 0| 0 0| 0 0| 0 0| 0 0 | 2 0
CHATTOOGA COUNTY | 0 0| 3 0| 4 0| 1 0| 8 0 | 0 0| 0 0| 1 1| 1 4| 2 1 | 10 0
CHEROKEE COUNTY
| 1 1| 8 0| 17 1| 1 0| 27 1 | 0 0| 2 2| 0 0| 0 0| 2 1 | 29 1
CLARKE COUNTY
| 3 2| 43 2| 20 1| 3 1| 69 1 | 0 0| 2 2| 0 0| 2 8| 4 2 | 73 1
CLAY COUNTY
| 0 0| 0 0| 1 0| 0 0| 1 0 | 0 0| 0 0| 0 0| 0 0| 0 0 | 1 0
CLAYTON COUNTY
| 4 2| 59 2| 43 2| 9 2| 115 2 | 1 10| 2 2| 1 1| 1 4| 5 2 | 120 2
CLINCH COUNTY
| 0 0| 1 0| 1 0| 0 0| 2 0 | 0 0| 0 0| 0 0| 0 0| 0 0 | 2 0
COBB COUNTY
| 7 4| 91 3| 66 3| 8 2| 172 3 | 0 0| 4 3| 1 1| 0 0| 5 2 | 177 3
COFFEE COUNTY
| 0 0| 11 0| 3 0| 3 1| 17 0 | 0 0| 1 1| 2 3| 1 4| 4 2 | 21 0
COLQUITT COUNTY
| 6 3| 25 1| 20 1| 1 0| 52 1 | 0 0| 0 0| 1 1| 0 0| 1 0 | 53 1
COLUMBIA COUNTY
| 0 0| 8 0| 8 0| 0 0| 16 0 | 0 0| 0 0| 2 3| 0 0| 2 1 | 18 0
------------------------------------------------------------------------------------------------------------------------------------
(continued)
Page 32 Run 01/24/01
Georgia Department of Corrections Office of Planning and Analysis
Inmate statistical profile
Sample: ACTIVE PRISONERS SERVING LIFE EXCLUDING JAIL
Requestor:
Active inmates 01/24/2001
Home County by current age & sex
Statistics (CONTINUED)
|
MEN
|
WOMEN
|
| Age | Age | Age | Age | Men
| Age | Age | Age | Age |Women
|Grand
Home County
|00-21 %|22-39 %|40-54 %|55-99 %|Total % |00-21 %|22-39 %|40-54 %|55-99 %|Total % |Total %
------------------------------------------------------------------------------------------------------------------------------------
COOK COUNTY
| 0 0| 6 0| 3 0| 1 0| 10 0 | 0 0| 2 2| 0 0| 0 0| 2 1 | 12 0
COWETA COUNTY
| 3 2| 18 1| 10 1| 1 0| 32 1 | 0 0| 2 2| 1 1| 0 0| 3 1 | 35 1
CRAWFORD COUNTY
| 0 0| 1 0| 1 0| 0 0| 2 0 | 0 0| 0 0| 0 0| 0 0| 0 0 | 2 0
CRISP COUNTY
| 4 2| 12 0| 7 0| 2 1| 25 0 | 0 0| 3 3| 0 0| 0 0| 3 1 | 28 1
DADE COUNTY
| 1 1| 4 0| 2 0| 3 1| 10 0 | 0 0| 0 0| 0 0| 0 0| 0 0 | 10 0
DAWSON COUNTY
| 0 0| 2 0| 1 0| 0 0| 3 0 | 0 0| 0 0| 0 0| 0 0| 0 0 | 3 0
DECATUR COUNTY
| 3 2| 13 0| 5 0| 0 0| 21 0 | 0 0| 0 0| 0 0| 0 0| 0 0 | 21 0
DEKALB COUNTY
| 14 8| 215 8| 127 7| 26 7| 382 7 | 1 10| 4 3| 2 3| 2 8| 9 4 | 391 7
DODGE COUNTY
| 0 0| 7 0| 7 0| 0 0| 14 0 | 0 0| 0 0| 0 0| 0 0| 0 0 | 14 0
DOOLY COUNTY
| 2 1| 7 0| 4 0| 0 0| 13 0 | 0 0| 0 0| 0 0| 0 0| 0 0 | 13 0
DOUGHERTY COUNTY | 6 3| 66 2| 41 2| 2 1| 115 2 | 0 0| 5 4| 1 1| 1 4| 7 3 | 122 2
DOUGLAS COUNTY
| 1 1| 20 1| 14 1| 2 1| 37 1 | 0 0| 1 1| 1 1| 0 0| 2 1 | 39 1
EARLY COUNTY
| 0 0| 7 0| 5 0| 1 0| 13 0 | 0 0| 0 0| 0 0| 0 0| 0 0 | 13 0
ECHOLS COUNTY.
| 0 0| 0 0| 0 0| 0 0| 0 0 | 0 0| 0 0| 0 0| 0 0| 0 0 | 0 0
EFFINGHAM COUNTY | 0 0| 4 0| 3 0| 0 0| 7 0 | 0 0| 0 0| 0 0| 0 0| 0 0 | 7 0
ELBERT COUNTY
| 0 0| 11 0| 9 0| 1 0| 21 0 | 0 0| 1 1| 0 0| 0 0| 1 0 | 22 0
EMANUEL COUNTY
| 1 1| 8 0| 7 0| 1 0| 17 0 | 0 0| 0 0| 1 1| 0 0| 1 0 | 18 0
EVANS COUNTY
| 0 0| 7 0| 4 0| 1 0| 12 0 | 0 0| 0 0| 0 0| 0 0| 0 0 | 12 0
FANNIN COUNTY
| 0 0| 5 0| 3 0| 1 0| 9 0 | 0 0| 0 0| 0 0| 0 0| 0 0 | 9 0
FAYETTE COUNTY
| 0 0| 3 0| 3 0| 0 0| 6 0 | 0 0| 0 0| 0 0| 0 0| 0 0 | 6 0
FLOYD COUNTY
| 2 1| 29 1| 25 1| 1 0| 57 1 | 1 10| 3 3| 2 3| 1 4| 7 3 | 64 1
FORSYTH COUNTY
| 0 0| 6 0| 3 0| 2 1| 11 0 | 0 0| 0 0| 1 1| 0 0| 1 0 | 12 0
FRANKLIN COUNTY
| 0 0| 2 0| 4 0| 0 0| 6 0 | 0 0| 0 0| 0 0| 1 4| 1 0 | 7 0
FULTON COUNTY
| 28 16| 500 18| 356 18| 53 14| 937 18 | 1 10| 14 12| 7 9| 4 16| 26 12 | 963 18
GILMER COUNTY
| 0 0| 1 0| 3 0| 2 1| 6 0 | 0 0| 0 0| 0 0| 0 0| 0 0 | 6 0
GLASCOCK COUNTY
| 0 0| 0 0| 1 0| 0 0| 1 0 | 0 0| 0 0| 0 0| 0 0| 0 0 | 1 0
GLYNN COUNTY
| 4 2| 28 1| 28 1| 3 1| 63 1 | 0 0| 1 1| 2 3| 0 0| 3 1 | 66 1
GORDON COUNTY
| 0 0| 20 1| 12 1| 3 1| 35 1 | 0 0| 1 1| 0 0| 0 0| 1 0 | 36 1
GRADY COUNTY
| 2 1| 13 0| 8 0| 0 0| 23 0 | 0 0| 0 0| 0 0| 0 0| 0 0 | 23 0
GREENE COUNTY
| 1 1| 3 0| 3 0| 1 0| 8 0 | 0 0| 0 0| 1 1| 0 0| 1 0 | 9 0
GWINNETT COUNTY
| 2 1| 63 2| 42 2| 9 2| 116 2 | 0 0| 3 3| 2 3| 0 0| 5 2 | 121 2
HABERSHAM COUNTY | 0 0| 9 0| 7 0| 0 0| 16 0 | 0 0| 0 0| 0 0| 0 0| 0 0 | 16 0
HALL COUNTY
| 2 1| 29 1| 38 2| 10 3| 79 2 | 1 10| 2 2| 1 1| 1 4| 5 2 | 84 2
HANCOCK COUNTY
| 1 1| 2 0| 2 0| 1 0| 6 0 | 0 0| 0 0| 1 1| 0 0| 1 0 | 7 0
HARALSON COUNTY
| 0 0| 1 0| 2 0| 1 0| 4 0 | 0 0| 1 1| 0 0| 0 0| 1 0 | 5 0
------------------------------------------------------------------------------------------------------------------------------------
(continued)
Page 33 Run 01/24/01
Georgia Department of Corrections Office of Planning and Analysis
Inmate statistical profile
Sample: ACTIVE PRISONERS SERVING LIFE EXCLUDING JAIL
Requestor:
Active inmates 01/24/2001
Home County by current age & sex
Statistics (CONTINUED)
|
MEN
|
WOMEN
|
| Age | Age | Age | Age | Men
| Age | Age | Age | Age |Women
|Grand
Home County
|00-21 %|22-39 %|40-54 %|55-99 %|Total % |00-21 %|22-39 %|40-54 %|55-99 %|Total % |Total %
------------------------------------------------------------------------------------------------------------------------------------
HARRIS COUNTY
| 1 1| 6 0| 2 0| 0 0| 9 0 | 0 0| 0 0| 0 0| 0 0| 0 0 | 9 0
HART COUNTY
| 0 0| 2 0| 2 0| 0 0| 4 0 | 0 0| 0 0| 1 1| 0 0| 1 0 | 5 0
HEARD COUNTY
| 0 0| 1 0| 1 0| 2 1| 4 0 | 0 0| 0 0| 0 0| 0 0| 0 0 | 4 0
HENRY COUNTY
| 1 1| 20 1| 9 0| 5 1| 35 1 | 0 0| 1 1| 2 3| 0 0| 3 1 | 38 1
HOUSTON COUNTY
| 1 1| 41 2| 22 1| 5 1| 69 1 | 0 0| 3 3| 4 5| 0 0| 7 3 | 76 1
IRWIN COUNTY
| 1 1| 5 0| 3 0| 0 0| 9 0 | 0 0| 0 0| 0 0| 0 0| 0 0 | 9 0
JACKSON COUNTY
| 1 1| 9 0| 10 1| 6 2| 26 0 | 0 0| 0 0| 0 0| 0 0| 0 0 | 26 0
JASPER COUNTY
| 2 1| 8 0| 1 0| 1 0| 12 0 | 0 0| 0 0| 0 0| 0 0| 0 0 | 12 0
JEFF DAVIS COUNTY | 1 1| 5 0| 2 0| 1 0| 9 0 | 0 0| 0 0| 0 0| 0 0| 0 0 | 9 0
JEFFERSON COUNTY | 0 0| 4 0| 3 0| 2 1| 9 0 | 0 0| 1 1| 0 0| 0 0| 1 0 | 10 0
JENKINS COUNTY
| 0 0| 0 0| 6 0| 0 0| 6 0 | 0 0| 0 0| 0 0| 0 0| 0 0 | 6 0
JOHNSON COUNTY
| 0 0| 3 0| 2 0| 0 0| 5 0 | 0 0| 0 0| 0 0| 0 0| 0 0 | 5 0
JONES COUNTY
| 0 0| 0 0| 4 0| 1 0| 5 0 | 0 0| 1 1| 0 0| 0 0| 1 0 | 6 0
LAMAR COUNTY
| 0 0| 9 0| 9 0| 3 1| 21 0 | 0 0| 0 0| 1 1| 0 0| 1 0 | 22 0
LANIER COUNTY
| 0 0| 0 0| 0 0| 0 0| 0 0 | 0 0| 0 0| 0 0| 0 0| 0 0 | 0 0
LAURENS COUNTY
| 1 1| 15 1| 7 0| 2 1| 25 0 | 0 0| 1 1| 1 1| 0 0| 2 1 | 27 0
LEE COUNTY
| 0 0| 3 0| 0 0| 0 0| 3 0 | 0 0| 0 0| 0 0| 0 0| 0 0 | 3 0
LIBERTY COUNTY
| 0 0| 23 1| 9 0| 4 1| 36 1 | 0 0| 2 2| 0 0| 0 0| 2 1 | 38 1
LINCOLN COUNTY
| 0 0| 2 0| 3 0| 0 0| 5 0 | 0 0| 0 0| 0 0| 0 0| 0 0 | 5 0
LONG COUNTY
| 0 0| 5 0| 2 0| 1 0| 8 0 | 0 0| 1 1| 0 0| 0 0| 1 0 | 9 0
LOWNDES COUNTY
| 0 0| 35 1| 22 1| 3 1| 60 1 | 0 0| 0 0| 2 3| 1 4| 3 1 | 63 1
LUMPKIN COUNTY
| 2 1| 5 0| 4 0| 1 0| 12 0 | 0 0| 0 0| 0 0| 0 0| 0 0 | 12 0
MACON COUNTY
| 0 0| 12 0| 5 0| 0 0| 17 0 | 0 0| 0 0| 1 1| 0 0| 1 0 | 18 0
MADISON COUNTY
| 0 0| 7 0| 6 0| 1 0| 14 0 | 0 0| 2 2| 0 0| 0 0| 2 1 | 16 0
MARION COUNTY
| 0 0| 2 0| 1 0| 0 0| 3 0 | 0 0| 0 0| 0 0| 0 0| 0 0 | 3 0
MCDUFFIE COUNTY
| 0 0| 22 1| 11 1| 4 1| 37 1 | 1 10| 1 1| 0 0| 0 0| 2 1 | 39 1
MCINTOSH COUNTY
| 1 1| 4 0| 3 0| 0 0| 8 0 | 0 0| 0 0| 0 0| 0 0| 0 0 | 8 0
MERIWETHER COUNTY | 1 1| 7 0| 8 0| 2 1| 18 0 | 0 0| 1 1| 0 0| 1 4| 2 1 | 20 0
MILLER COUNTY
| 0 0| 3 0| 3 0| 0 0| 6 0 | 0 0| 0 0| 0 0| 0 0| 0 0 | 6 0
MITCHELL COUNTY
| 0 0| 12 0| 11 1| 3 1| 26 0 | 0 0| 1 1| 0 0| 0 0| 1 0 | 27 0
MONROE COUNTY
| 0 0| 10 0| 4 0| 0 0| 14 0 | 0 0| 0 0| 0 0| 0 0| 0 0 | 14 0
MONTGOMERY COUNTY | 0 0| 0 0| 0 0| 0 0| 0 0 | 0 0| 1 1| 0 0| 0 0| 1 0 | 1 0
MORGAN COUNTY
| 0 0| 8 0| 2 0| 0 0| 10 0 | 0 0| 0 0| 0 0| 0 0| 0 0 | 10 0
MURRAY COUNTY
| 2 1| 5 0| 4 0| 4 1| 15 0 | 0 0| 1 1| 0 0| 0 0| 1 0 | 16 0
MUSCOGEE COUNTY
| 3 2| 71 3| 59 3| 10 3| 143 3 | 0 0| 3 3| 3 4| 0 0| 6 3 | 149 3
------------------------------------------------------------------------------------------------------------------------------------
(continued)
Page 34 Run 01/24/01
Georgia Department of Corrections Office of Planning and Analysis
Inmate statistical profile
Sample: ACTIVE PRISONERS SERVING LIFE EXCLUDING JAIL
Requestor:
Active inmates 01/24/2001
Home County by current age & sex
Statistics (CONTINUED)
|
MEN
|
WOMEN
|
| Age | Age | Age | Age | Men
| Age | Age | Age | Age |Women
|Grand
Home County
|00-21 %|22-39 %|40-54 %|55-99 %|Total % |00-21 %|22-39 %|40-54 %|55-99 %|Total % |Total %
------------------------------------------------------------------------------------------------------------------------------------
NEWTON COUNTY
| 1 1| 38 1| 11 1| 3 1| 53 1 | 0 0| 2 2| 0 0| 1 4| 3 1 | 56 1
OCONEE COUNTY
| 0 0| 3 0| 2 0| 0 0| 5 0 | 0 0| 0 0| 1 1| 0 0| 1 0 | 6 0
OGLETHORPE COUNTY | 0 0| 3 0| 1 0| 0 0| 4 0 | 0 0| 0 0| 0 0| 0 0| 0 0 | 4 0
PAULDING COUNTY
| 0 0| 9 0| 5 0| 2 1| 16 0 | 0 0| 0 0| 1 1| 1 4| 2 1 | 18 0
PEACH COUNTY
| 0 0| 7 0| 2 0| 0 0| 9 0 | 0 0| 1 1| 0 0| 0 0| 1 0 | 10 0
PICKENS COUNTY
| 0 0| 2 0| 1 0| 0 0| 3 0 | 0 0| 0 0| 1 1| 0 0| 1 0 | 4 0
PIERCE COUNTY
| 2 1| 2 0| 2 0| 0 0| 6 0 | 0 0| 0 0| 0 0| 0 0| 0 0 | 6 0
PIKE COUNTY
| 0 0| 1 0| 0 0| 0 0| 1 0 | 0 0| 0 0| 0 0| 0 0| 0 0 | 1 0
POLK COUNTY
| 1 1| 12 0| 5 0| 3 1| 21 0 | 0 0| 0 0| 0 0| 0 0| 0 0 | 21 0
PULASKI COUNTY
| 0 0| 4 0| 3 0| 0 0| 7 0 | 0 0| 1 1| 0 0| 0 0| 1 0 | 8 0
PUTNAM COUNTY
| 0 0| 13 0| 13 1| 2 1| 28 1 | 0 0| 0 0| 0 0| 0 0| 0 0 | 28 1
QUITMAN COUNTY
| 0 0| 2 0| 0 0| 0 0| 2 0 | 0 0| 0 0| 0 0| 0 0| 0 0 | 2 0
RABUN COUNTY
| 0 0| 5 0| 3 0| 0 0| 8 0 | 0 0| 0 0| 0 0| 0 0| 0 0 | 8 0
RANDOLPH COUNTY
| 0 0| 3 0| 2 0| 1 0| 6 0 | 0 0| 0 0| 0 0| 0 0| 0 0 | 6 0
RICHMOND COUNTY
| 12 7| 144 5| 69 4| 8 2| 233 4 | 0 0| 8 7| 7 9| 1 4| 16 7 | 249 5
ROCKDALE COUNTY
| 1 1| 10 0| 7 0| 5 1| 23 0 | 0 0| 1 1| 0 0| 0 0| 1 0 | 24 0
SCHLEY COUNTY
| 0 0| 2 0| 2 0| 0 0| 4 0 | 0 0| 0 0| 0 0| 0 0| 0 0 | 4 0
SCREVEN COUNTY
| 0 0| 3 0| 2 0| 2 1| 7 0 | 0 0| 0 0| 0 0| 0 0| 0 0 | 7 0
SEMINOLE COUNTY
| 1 1| 5 0| 5 0| 1 0| 12 0 | 0 0| 1 1| 0 0| 0 0| 1 0 | 13 0
SPALDING COUNTY
| 4 2| 36 1| 22 1| 5 1| 67 1 | 1 10| 1 1| 1 1| 1 4| 4 2 | 71 1
STEPHENS COUNTY
| 0 0| 5 0| 6 0| 4 1| 15 0 | 0 0| 0 0| 0 0| 0 0| 0 0 | 15 0
STEWART COUNTY
| 0 0| 2 0| 2 0| 0 0| 4 0 | 0 0| 0 0| 0 0| 0 0| 0 0 | 4 0
SUMTER COUNTY
| 0 0| 3 0| 15 1| 2 1| 20 0 | 0 0| 0 0| 1 1| 0 0| 1 0 | 21 0
TALBOT COUNTY
| 2 1| 3 0| 1 0| 0 0| 6 0 | 0 0| 0 0| 1 1| 0 0| 1 0 | 7 0
TALIAFERRO COUNTY | 0 0| 0 0| 1 0| 0 0| 1 0 | 0 0| 0 0| 0 0| 0 0| 0 0 | 1 0
TATTNALL COUNTY
| 0 0| 16 1| 4 0| 0 0| 20 0 | 0 0| 0 0| 1 1| 0 0| 1 0 | 21 0
TAYLOR COUNTY
| 1 1| 10 0| 4 0| 1 0| 16 0 | 0 0| 0 0| 0 0| 0 0| 0 0 | 16 0
TELFAIR COUNTY
| 1 1| 6 0| 3 0| 0 0| 10 0 | 0 0| 0 0| 1 1| 0 0| 1 0 | 11 0
TERRELL COUNTY
| 2 1| 11 0| 1 0| 0 0| 14 0 | 0 0| 0 0| 0 0| 0 0| 0 0 | 14 0
THOMAS COUNTY
| 2 1| 14 1| 16 1| 4 1| 36 1 | 0 0| 1 1| 1 1| 0 0| 2 1 | 38 1
TIFT COUNTY
| 3 2| 28 1| 21 1| 3 1| 55 1 | 0 0| 0 0| 0 0| 1 4| 1 0 | 56 1
TOOMBS COUNTY
| 2 1| 12 0| 11 1| 0 0| 25 0 | 0 0| 1 1| 0 0| 0 0| 1 0 | 26 0
TOWNS COUNTY
| 0 0| 0 0| 0 0| 0 0| 0 0 | 0 0| 0 0| 0 0| 0 0| 0 0 | 0 0
TREUTLEN COUNTY
| 0 0| 2 0| 3 0| 0 0| 5 0 | 0 0| 0 0| 0 0| 0 0| 0 0 | 5 0
TROUP COUNTY
| 2 1| 20 1| 18 1| 5 1| 45 1 | 0 0| 1 1| 1 1| 0 0| 2 1 | 47 1
------------------------------------------------------------------------------------------------------------------------------------
(continued)
Page 35 Run 01/24/01
Georgia Department of Corrections Office of Planning and Analysis
Inmate statistical profile
Sample: ACTIVE PRISONERS SERVING LIFE EXCLUDING JAIL
Requestor:
Active inmates 01/24/2001
Home County by current age & sex
Statistics (CONTINUED)
|
MEN
|
WOMEN
|
| Age | Age | Age | Age | Men
| Age | Age | Age | Age |Women
|Grand
Home County
|00-21 %|22-39 %|40-54 %|55-99 %|Total % |00-21 %|22-39 %|40-54 %|55-99 %|Total % |Total %
------------------------------------------------------------------------------------------------------------------------------------
TURNER COUNTY
| 0 0| 8 0| 4 0| 0 0| 12 0 | 0 0| 0 0| 0 0| 0 0| 0 0 | 12 0
TWIGGS COUNTY
| 0 0| 5 0| 4 0| 0 0| 9 0 | 0 0| 0 0| 0 0| 0 0| 0 0 | 9 0
UNION COUNTY
| 0 0| 0 0| 0 0| 0 0| 0 0 | 0 0| 0 0| 0 0| 0 0| 0 0 | 0 0
UPSON COUNTY
| 1 1| 6 0| 5 0| 0 0| 12 0 | 0 0| 0 0| 1 1| 0 0| 1 0 | 13 0
WALKER COUNTY
| 1 1| 15 1| 6 0| 3 1| 25 0 | 0 0| 1 1| 1 1| 0 0| 2 1 | 27 0
WALTON COUNTY
| 1 1| 29 1| 18 1| 3 1| 51 1 | 0 0| 1 1| 0 0| 0 0| 1 0 | 52 1
WARE COUNTY
| 1 1| 15 1| 14 1| 2 1| 32 1 | 0 0| 0 0| 0 0| 0 0| 0 0 | 32 1
WARREN COUNTY
| 0 0| 3 0| 5 0| 1 0| 9 0 | 0 0| 0 0| 0 0| 0 0| 0 0 | 9 0
WASHINGTON COUNTY | 0 0| 12 0| 9 0| 0 0| 21 0 | 1 10| 1 1| 0 0| 0 0| 2 1 | 23 0
WAYNE COUNTY
| 0 0| 7 0| 13 1| 2 1| 22 0 | 0 0| 1 1| 0 0| 0 0| 1 0 | 23 0
WEBSTER COUNTY
| 0 0| 2 0| 0 0| 0 0| 2 0 | 0 0| 0 0| 0 0| 0 0| 0 0 | 2 0
WHEELER COUNTY
| 0 0| 1 0| 2 0| 2 1| 5 0 | 0 0| 0 0| 0 0| 0 0| 0 0 | 5 0
WHITE COUNTY
| 0 0| 3 0| 2 0| 2 1| 7 0 | 0 0| 0 0| 0 0| 0 0| 0 0 | 7 0
WHITFIELD COUNTY | 0 0| 11 0| 24 1| 6 2| 41 1 | 0 0| 2 2| 0 0| 0 0| 2 1 | 43 1
WILCOX COUNTY
| 0 0| 0 0| 6 0| 0 0| 6 0 | 0 0| 0 0| 0 0| 0 0| 0 0 | 6 0
WILKES COUNTY
| 0 0| 2 0| 3 0| 2 1| 7 0 | 0 0| 0 0| 0 0| 0 0| 0 0 | 7 0
WILKINSON COUNTY | 0 0| 7 0| 2 0| 0 0| 9 0 | 0 0| 0 0| 0 0| 0 0| 0 0 | 9 0
WORTH COUNTY
| 1 1| 13 0| 2 0| 0 0| 16 0 | 0 0| 1 1| 0 0| 0 0| 1 0 | 17 0
OUT OF STATE
| 0 1| 11 0| 56 3| 15 4| 82 2 | 0 0| 0 1| 0 0| 0 0| 0 0 | 82 2
------------------------------------------------------------------------------------------------------------------------------------
Total reported
| 174 100| 2730 100| 1952 100| 371 100| 5227 100 | 10 100| 115 100| 75 100| 25 100| 225 100 | 5452 100
|
|
|
|
|
|
|
|
|
|
|
Percent reported |
93.5|
90.8|
92.3|
90.9|
91.5 |
90.9|
92.7|
89.3|
96.2|
91.8 |
91.5
|
|
|
|
|
|
|
|
|
|
|
|
|
|
|
|
|
|
|
|
|
|
UNKNOWN
| 12 | 275 | 163 | 37 | 487
| 1 | 9 | 9 | 1 | 20
| 507
------------------------------------------------------------------------------------------------------------------------------------
Total
| 186 | 3005 | 2115 | 408 | 5714
| 11 | 124 | 84 | 26 | 245
| 5959
Georgia Department of Corrections
Page 36 Run 01/24/01
Office of Planning and Analysis
Inmate statistical profile
Sample: ACTIVE PRISONERS SERVING LIFE EXCLUDING JAIL
Requestor: Statistics
Active inmates 01/24/2001
Prison Sentence In Years by current age & sex
|
MEN
|
WOMEN
|
| Age | Age | Age | Age | Men
| Age | Age | Age | Age |Women
|Grand
Sentence In Years |00-21 %|22-39 %|40-54 %|55-99 %|Total % |00-21 %|22-39 %|40-54 %|55-99 %|Total % |Total %
------------------------------------------------------------------------------------------------------------------------------------
0-1
| 0 0| 0 0| 0 0| 0 0| 0 0 | 0 0| 0 0| 0 0| 0 0| 0 0 | 0 0
1.1-2
| 0 0| 0 0| 0 0| 0 0| 0 0 | 0 0| 0 0| 0 0| 0 0| 0 0 | 0 0
2.1-3
| 0 0| 0 0| 0 0| 0 0| 0 0 | 0 0| 0 0| 0 0| 0 0| 0 0 | 0 0
3.1-4
| 0 0| 0 0| 0 0| 0 0| 0 0 | 0 0| 0 0| 0 0| 0 0| 0 0 | 0 0
4.1-5
| 0 0| 0 0| 0 0| 0 0| 0 0 | 0 0| 0 0| 0 0| 0 0| 0 0 | 0 0
5.1-6
| 0 0| 0 0| 0 0| 0 0| 0 0 | 0 0| 0 0| 0 0| 0 0| 0 0 | 0 0
6.1-7
| 0 0| 0 0| 0 0| 0 0| 0 0 | 0 0| 0 0| 0 0| 0 0| 0 0 | 0 0
7.1-8
| 0 0| 0 0| 0 0| 0 0| 0 0 | 0 0| 0 0| 0 0| 0 0| 0 0 | 0 0
8.1-9
| 0 0| 0 0| 0 0| 0 0| 0 0 | 0 0| 0 0| 0 0| 0 0| 0 0 | 0 0
9.1-10
| 0 0| 0 0| 0 0| 0 0| 0 0 | 0 0| 0 0| 0 0| 0 0| 0 0 | 0 0
10.1-12
| 0 0| 0 0| 0 0| 0 0| 0 0 | 0 0| 0 0| 0 0| 0 0| 0 0 | 0 0
12.1-15
| 0 0| 0 0| 0 0| 0 0| 0 0 | 0 0| 0 0| 0 0| 0 0| 0 0 | 0 0
15.1-20
| 0 0| 0 0| 0 0| 0 0| 0 0 | 0 0| 0 0| 0 0| 0 0| 0 0 | 0 0
20.1-OVER
| 0 0| 0 0| 0 0| 0 0| 0 0 | 0 0| 0 0| 0 0| 0 0| 0 0 | 0 0
LIFE
| 186 100| 3005 100| 2115 100| 408 100| 5714 100 | 11 100| 124 100| 84 100| 26 100| 245 100 | 5959 100
DEATH
| 0 0| 0 0| 0 0| 0 0| 0 0 | 0 0| 0 0| 0 0| 0 0| 0 0 | 0 0
LIFE W/O PAROLE
| 0 0| 0 0| 0 0| 0 0| 0 0 | 0 0| 0 0| 0 0| 0 0| 0 0 | 0 0
YOUTHFUL OFFENDERS | 0 0| 0 0| 0 0| 0 0| 0 0 | 0 0| 0 0| 0 0| 0 0| 0 0 | 0 0
------------------------------------------------------------------------------------------------------------------------------------
Total reported
| 186 100| 3005 100| 2115 100| 408 100| 5714 100 | 11 100| 124 100| 84 100| 26 100| 245 100 | 5959 100
|
|
|
|
|
|
|
|
|
|
|
Percent reported | 100.0| 100.0| 100.0| 100.0| 100.0 | 100.0| 100.0| 100.0| 100.0| 100.0 | 100.0
|
|
|
|
|
|
|
|
|
|
|
|
|
|
|
|
|
|
|
|
|
|
NOT REPORTED
|0|0|0|0|0
|0|0|0|0|0
|0
------------------------------------------------------------------------------------------------------------------------------------
Total
| 186 | 3005 | 2115 | 408 | 5714
| 11 | 124 | 84 | 26 | 245
| 5959
|
|
|
|
|
|
|
|
|
|
|
|
|
|
|
|
|
|
|
|
|
|
|
|
|
|
|
|
|
|
|
|
|
|
|
|
|
|
|
|
|
|
|
|
|
|
|
|
|
|
|
|
|
|
|
AVG EXCLUDING
|
|
|
|
|
|
|
|
|
|
|
LIFE, DEATH, YO
| .00 | .00 | .00 | .00 | .00 | .00 | .00 | .00 | .00 | .00 | .00
|
|
|
|
|
|
|
|
|
|
|
|
|
|
|
|
|
|
|
|
|
|
|
|
|
|
|
|
|
|
|
|
|
|
|
|
|
|
|
|
|
|
|
|
|
|
|
|
|
|
|
|
|
|
|
AVG INCLUDING
|
|
|
|
|
|
|
|
|
|
|
LIFE=21, YO=3 YRS | 21.00 | 21.00 | 21.00 | 21.00 | 21.00 | 21.00 | 21.00 | 21.00 | 21.00 | 21.00 | 21.00
Page 37 Run 01/24/01
Georgia Department of Corrections Office of Planning and Analysis
Inmate statistical profile
Sample: ACTIVE PRISONERS SERVING LIFE EXCLUDING JAIL
Requestor: Statistics
Active inmates 01/24/2001
Probation To Follow Prison by current age & sex
|
MEN
|
WOMEN
|
| Age | Age | Age | Age | Men
| Age | Age | Age | Age |Women
|Grand
Prob After Prison |00-21 %|22-39 %|40-54 %|55-99 %|Total % |00-21 %|22-39 %|40-54 %|55-99 %|Total % |Total %
------------------------------------------------------------------------------------------------------------------------------------
PROBATION TO FOLLOW | 10 5| 91 3| 64 3| 6 1| 171 3 | 0 0| 3 2| 3 4| 1 4| 7 3 | 178 3
NO PROBATION
| 176 95| 2914 97| 2051 97| 402 99| 5543 97 | 11 100| 121 98| 81 96| 25 96| 238 97 | 5781 97
------------------------------------------------------------------------------------------------------------------------------------
Total reported
| 186 100| 3005 100| 2115 100| 408 100| 5714 100 | 11 100| 124 100| 84 100| 26 100| 245 100 | 5959 100
|
|
|
|
|
|
|
|
|
|
|
Percent reported | 100.0| 100.0| 100.0| 100.0| 100.0 | 100.0| 100.0| 100.0| 100.0| 100.0 | 100.0
|
|
|
|
|
|
|
|
|
|
|
|
|
|
|
|
|
|
|
|
|
|
NOT REPORTED
|0|0|0|0|0
|0|0|0|0|0
|0
------------------------------------------------------------------------------------------------------------------------------------
Total
| 186 | 3005 | 2115 | 408 | 5714
| 11 | 124 | 84 | 26 | 245
| 5959
Page 38 Run 01/24/01
Georgia Department of Corrections Office of Planning and Analysis
Inmate statistical profile
Sample: ACTIVE PRISONERS SERVING LIFE EXCLUDING JAIL
Requestor: Statistics
Active inmates 01/24/2001
Admission Type by current age & sex
|
MEN
|
WOMEN
|
| Age | Age | Age | Age | Men
| Age | Age | Age | Age |Women
|Grand
Admission Type
|00-21 %|22-39 %|40-54 %|55-99 %|Total % |00-21 %|22-39 %|40-54 %|55-99 %|Total % |Total %
------------------------------------------------------------------------------------------------------------------------------------
COMMITTED FROM COURT| 182 98| 2449 82| 1554 73| 295 72| 4480 78 | 11 100| 114 92| 71 85| 26 100| 222 91 | 4702 79
RETURN APPEAL/BOND | 0 0| 1 0| 1 0| 0 0| 2 0 | 0 0| 0 0| 0 0| 0 0| 0 0 | 2 0
PAROLE REV/NEW SENT | 0 0| 353 12| 341 16| 74 18| 768 13 | 0 0| 6 5| 8 10| 0 0| 14 6 | 782 13
PAR REV/NO NEW SENT | 0 0| 20 1| 68 3| 8 2| 96 2 | 0 0| 1 1| 1 1| 0 0| 2 1 | 98 2
PROB VIOL/TOTAL REV | 0 0| 0 0| 0 0| 0 0| 0 0 | 0 0| 0 0| 0 0| 0 0| 0 0 | 0 0
PROB VIOL/PARTIAL | 0 0| 35 1| 42 2| 2 0| 79 1 | 0 0| 0 0| 2 2| 0 0| 2 1 | 81 1
ADMIT FM OTHER CUST | 0 0| 1 0| 2 0| 4 1| 7 0 | 0 0| 0 0| 0 0| 0 0| 0 0 | 7 0
SHOCK INCARCERATION | 0 0| 0 0| 0 0| 0 0| 0 0 | 0 0| 0 0| 0 0| 0 0| 0 0 | 0 0
PROB REV/REMAINDER | 3 2| 112 4| 48 2| 5 1| 168 3 | 0 0| 3 2| 2 2| 0 0| 5 2 | 173 3
NEW SENT/PAR REV PND| 0 0| 2 0| 4 0| 1 0| 7 0 | 0 0| 0 0| 0 0| 0 0| 0 0 | 7 0
LIFE W/O PAROLE
| 1 1| 9 0| 3 0| 0 0| 13 0 | 0 0| 0 0| 0 0| 0 0| 0 0 | 13 0
PAROLE REV BOOT CAMP| 0 0| 2 0| 1 0| 0 0| 3 0 | 0 0| 0 0| 0 0| 0 0| 0 0 | 3 0
PAR REV/RSN UNKNOWN | 0 0| 17 1| 40 2| 19 5| 76 1 | 0 0| 0 0| 0 0| 0 0| 0 0 | 76 1
PROBATION/PAROLE REV| 0 0| 0 0| 0 0| 0 0| 0 0 | 0 0| 0 0| 0 0| 0 0| 0 0 | 0 0
PB PAROLE RESCINDED | 0 0| 0 0| 0 0| 0 0| 0 0 | 0 0| 0 0| 0 0| 0 0| 0 0 | 0 0
PROB REVOCATION/SC | 0 0| 0 0| 0 0| 0 0| 0 0 | 0 0| 0 0| 0 0| 0 0| 0 0 | 0 0
PAR REV/REVOC CENTER| 0 0| 3 0| 10 0| 0 0| 13 0 | 0 0| 0 0| 0 0| 0 0| 0 0 | 13 0
INFORMATION ONLY | 0 0| 0 0| 0 0| 0 0| 0 0 | 0 0| 0 0| 0 0| 0 0| 0 0 | 0 0
INCOMPLETE SENT PKG | 0 0| 0 0| 0 0| 0 0| 0 0 | 0 0| 0 0| 0 0| 0 0| 0 0 | 0 0
HANCOCK REVOC CENTER| 0 0| 0 0| 0 0| 0 0| 0 0 | 0 0| 0 0| 0 0| 0 0| 0 0 | 0 0
WHITWORTH DETENTION | 0 0| 0 0| 1 0| 0 0| 1 0 | 0 0| 0 0| 0 0| 0 0| 0 0 | 1 0
DCYS AT RISK
| 0 0| 0 0| 0 0| 0 0| 0 0 | 0 0| 0 0| 0 0| 0 0| 0 0 | 0 0
OTHER
| 0 0| 0 0| 0 0| 0 0| 0 0 | 0 0| 0 0| 0 0| 0 0| 0 0 | 0 0
------------------------------------------------------------------------------------------------------------------------------------
Total reported
| 186 100| 3004 100| 2115 100| 408 100| 5713 100 | 11 100| 124 100| 84 100| 26 100| 245 100 | 5958 100
|
|
|
|
|
|
|
|
|
|
|
Percent reported | 100.0| 100.0| 100.0| 100.0| 100.0 | 100.0| 100.0| 100.0| 100.0| 100.0 | 100.0
|
|
|
|
|
|
|
|
|
|
|
|
|
|
|
|
|
|
|
|
|
|
UNKNOWN
|0|1|0|0|1
|0|0|0|0|0
|1
------------------------------------------------------------------------------------------------------------------------------------
Total
| 186 | 3005 | 2115 | 408 | 5714
| 11 | 124 | 84 | 26 | 245
| 5959
Page 39 Run 01/24/01
Georgia Department of Corrections Office of Planning and Analysis
Inmate statistical profile
Sample: ACTIVE PRISONERS SERVING LIFE EXCLUDING JAIL
Requestor: Statistics
Active inmates 01/24/2001
Release Type by current age & sex
|
MEN
|
WOMEN
|
| Age | Age | Age | Age | Men
| Age | Age | Age | Age |Women
|Grand
Release Type
|00-21 %|22-39 %|40-54 %|55-99 %|Total % |00-21 %|22-39 %|40-54 %|55-99 %|Total % |Total %
------------------------------------------------------------------------------------------------------------------------------------
PAROLE
| 0 0| 1 0| 0 0| 0 0| 1 0 | 0 0| 0 0| 0 0| 0 0| 0 0 | 1 0
Active
| 186 100| 3005 100| 2115 100| 408 100| 5714 100 | 11 100| 124 100| 84 100| 26 100| 245 100 | 5959 100
------------------------------------------------------------------------------------------------------------------------------------
Total
| 186 | 3005 | 2115 | 408 | 5714
| 11 | 124 | 84 | 26 | 245
| 5959
Page 40 Run 01/24/01
Georgia Department of Corrections Office of Planning and Analysis
Inmate statistical profile
Sample: ACTIVE PRISONERS SERVING LIFE EXCLUDING JAIL
Requestor: Statistics
Active inmates 01/24/2001
Inst By Group by current age & sex
|
MEN
|
WOMEN
|
| Age | Age | Age | Age | Men
| Age | Age | Age | Age |Women
|Grand
Inst By Group
|00-21 %|22-39 %|40-54 %|55-99 %|Total % |00-21 %|22-39 %|40-54 %|55-99 %|Total % |Total %
------------------------------------------------------------------------------------------------------------------------------------
County jails
| 0 0| 0 0| 0 0| 0 0| 0 0 | 0 0| 0 0| 0 0| 0 0| 0 0 | 0 0
Transitional centers| 0 0| 15 0| 21 1| 3 1| 39 1 | 0 0| 3 2| 1 1| 1 4| 5 2 | 44 1
County camps
| 0 0| 10 0| 8 0| 3 1| 21 0 | 0 0| 0 0| 0 0| 0 0| 0 0 | 21 0
Inmate boot camps | 0 0| 0 0| 0 0| 0 0| 0 0 | 0 0| 0 0| 0 0| 0 0| 0 0 | 0 0
State prisons
| 186 100| 2876 96| 2009 95| 390 96| 5461 96 | 11 100| 121 98| 83 99| 25 96| 240 98 | 5701 96
Private prisons
| 0 0| 103 3| 77 4| 12 3| 192 3 | 0 0| 0 0| 0 0| 0 0| 0 0 | 192 3
Other
| 0 0| 1 0| 0 0| 0 0| 1 0 | 0 0| 0 0| 0 0| 0 0| 0 0 | 1 0
------------------------------------------------------------------------------------------------------------------------------------
Total reported
| 186 100| 3005 100| 2115 100| 408 100| 5714 100 | 11 100| 124 100| 84 100| 26 100| 245 100 | 5959 100
|
|
|
|
|
|
|
|
|
|
|
Percent reported | 100.0| 100.0| 100.0| 100.0| 100.0 | 100.0| 100.0| 100.0| 100.0| 100.0 | 100.0
|
|
|
|
|
|
|
|
|
|
|
|
|
|
|
|
|
|
|
|
|
|
Not reported
|0|0|0|0|0
|0|0|0|0|0
|0
------------------------------------------------------------------------------------------------------------------------------------
Total
| 186 | 3005 | 2115 | 408 | 5714
| 11 | 124 | 84 | 26 | 245
| 5959
Page 41 Run 01/24/01
Georgia Department of Corrections Office of Planning and Analysis
Inmate statistical profile
Sample: ACTIVE PRISONERS SERVING LIFE EXCLUDING JAIL
Requestor: Statistics
Active inmates 01/24/2001
Institution by current age & sex
|
MEN
|
WOMEN
|
| Age | Age | Age | Age | Men
| Age | Age | Age | Age |Women
|Grand
Institution
|00-21 %|22-39 %|40-54 %|55-99 %|Total % |00-21 %|22-39 %|40-54 %|55-99 %|Total % |Total %
------------------------------------------------------------------------------------------------------------------------------------
Albany Trans Ctr | 0 0| 1 0| 2 0| 0 0| 3 0 | 0 0| 0 0| 0 0| 0 0| 0 0 | 3 0
Atlanta Trans Ctr(M)| 0 0| 10 0| 12 1| 3 1| 25 0 | 0 0| 0 0| 0 0| 0 0| 0 0 | 25 0
Macon Trans Ctr
| 0 0| 3 0| 4 0| 0 0| 7 0 | 0 0| 0 0| 0 0| 0 0| 0 0 | 7 0
Metro Trans Ctr (W) | 0 0| 0 0| 0 0| 0 0| 0 0 | 0 0| 2 2| 1 1| 1 4| 4 2 | 4 0
Savannah Trans Ctr | 0 0| 1 0| 3 0| 0 0| 4 0 | 0 0| 0 0| 0 0| 0 0| 0 0 | 4 0
Savannah Womens TC | 0 0| 0 0| 0 0| 0 0| 0 0 | 0 0| 1 1| 0 0| 0 0| 1 0 | 1 0
Central State Hosp | 0 0| 1 0| 0 0| 0 0| 1 0 | 0 0| 0 0| 0 0| 0 0| 0 0 | 1 0
Carroll County
| 0 0| 0 0| 0 0| 1 0| 1 0 | 0 0| 0 0| 0 0| 0 0| 0 0 | 1 0
Clarke County
| 0 0| 1 0| 0 0| 0 0| 1 0 | 0 0| 0 0| 0 0| 0 0| 0 0 | 1 0
Colquitt County
| 0 0| 0 0| 1 0| 0 0| 1 0 | 0 0| 0 0| 0 0| 0 0| 0 0 | 1 0
Coweta County
| 0 0| 2 0| 1 0| 0 0| 3 0 | 0 0| 0 0| 0 0| 0 0| 0 0 | 3 0
Floyd County
| 0 0| 1 0| 1 0| 0 0| 2 0 | 0 0| 0 0| 0 0| 0 0| 0 0 | 2 0
Hall County
| 0 0| 2 0| 1 0| 0 0| 3 0 | 0 0| 0 0| 0 0| 0 0| 0 0 | 3 0
Jackson County
| 0 0| 1 0| 2 0| 1 0| 4 0 | 0 0| 0 0| 0 0| 0 0| 0 0 | 4 0
Jefferson County | 0 0| 1 0| 1 0| 0 0| 2 0 | 0 0| 0 0| 0 0| 0 0| 0 0 | 2 0
Mitchell County
| 0 0| 0 0| 1 0| 0 0| 1 0 | 0 0| 0 0| 0 0| 0 0| 0 0 | 1 0
Screven County
| 0 0| 1 0| 0 0| 0 0| 1 0 | 0 0| 0 0| 0 0| 0 0| 0 0 | 1 0
Terrell County
| 0 0| 0 0| 0 0| 1 0| 1 0 | 0 0| 0 0| 0 0| 0 0| 0 0 | 1 0
Clayton County
| 0 0| 1 0| 0 0| 0 0| 1 0 | 0 0| 0 0| 0 0| 0 0| 0 0 | 1 0
Ware Prison
| 14 8| 198 7| 101 5| 10 2| 323 6 | 0 0| 0 0| 0 0| 0 0| 0 0 | 323 5
Lowndes Prison
| 0 0| 3 0| 8 0| 1 0| 12 0 | 0 0| 0 0| 0 0| 0 0| 0 0 | 12 0
Dodge Prison
| 0 0| 66 2| 69 3| 6 1| 141 2 | 0 0| 0 0| 0 0| 0 0| 0 0 | 141 2
Phillips Prison
| 5 3| 126 4| 93 4| 22 5| 246 4 | 0 0| 0 0| 0 0| 0 0| 0 0 | 246 4
Walker Prison
| 0 0| 22 1| 26 1| 4 1| 52 1 | 0 0| 0 0| 0 0| 0 0| 0 0 | 52 1
Wayne Prison
| 0 0| 2 0| 5 0| 0 0| 7 0 | 0 0| 0 0| 0 0| 0 0| 0 0 | 7 0
Arrendale Prison | 48 26| 104 3| 28 1| 1 0| 181 3 | 0 0| 0 0| 0 0| 0 0| 0 0 | 181 3
Montgomery Prison | 0 0| 15 0| 13 1| 2 0| 30 1 | 0 0| 0 0| 0 0| 0 0| 0 0 | 30 1
Lee Prison
| 1 1| 20 1| 19 1| 1 0| 41 1 | 0 0| 0 0| 0 0| 0 0| 0 0 | 41 1
Putnam Prison
| 0 0| 5 0| 0 0| 0 0| 5 0 | 0 0| 0 0| 0 0| 0 0| 0 0 | 5 0
Georgia State Prison| 3 2| 273 9| 215 10| 18 4| 509 9 | 0 0| 0 0| 0 0| 0 0| 0 0 | 509 9
Mens Prison
| 0 0| 15 0| 36 2| 73 18| 124 2 | 0 0| 0 0| 0 0| 0 0| 0 0 | 124 2
Jackson Prison-Diag | 8 4| 27 1| 11 1| 4 1| 50 1 | 0 0| 0 0| 0 0| 0 0| 0 0 | 50 1
Jackson Prison-Perm | 0 0| 3 0| 1 0| 0 0| 4 0 | 0 0| 0 0| 0 0| 0 0| 0 0 | 4 0
Coastal Prison
| 14 8| 38 1| 19 1| 1 0| 72 1 | 0 0| 0 0| 0 0| 0 0| 0 0 | 72 1
Scott Prison
| 0 0| 72 2| 52 2| 10 2| 134 2 | 0 0| 0 0| 0 0| 0 0| 0 0 | 134 2
Rivers Prison
| 0 0| 75 2| 68 3| 10 2| 153 3 | 0 0| 0 0| 0 0| 0 0| 0 0 | 153 3
------------------------------------------------------------------------------------------------------------------------------------
(continued)
Page 42 Run 01/24/01
Georgia Department of Corrections Office of Planning and Analysis
Inmate statistical profile
Sample: ACTIVE PRISONERS SERVING LIFE EXCLUDING JAIL
Requestor:
Active inmates 01/24/2001
Institution by current age & sex
Statistics (CONTINUED)
|
MEN
|
WOMEN
|
| Age | Age | Age | Age | Men
| Age | Age | Age | Age |Women
|Grand
Institution
|00-21 %|22-39 %|40-54 %|55-99 %|Total % |00-21 %|22-39 %|40-54 %|55-99 %|Total % |Total %
------------------------------------------------------------------------------------------------------------------------------------
Rutledge Prison
| 0 0| 39 1| 54 3| 14 3| 107 2 | 0 0| 0 0| 0 0| 0 0| 0 0 | 107 2
Central Prison
| 0 0| 82 3| 119 6| 20 5| 221 4 | 0 0| 0 0| 0 0| 0 0| 0 0 | 221 4
Augusta Med Prison | 1 1| 87 3| 75 4| 31 8| 194 3 | 0 0| 0 0| 0 0| 0 0| 0 0 | 194 3
Rogers Prison
| 0 0| 24 1| 21 1| 0 0| 45 1 | 0 0| 0 0| 0 0| 0 0| 0 0 | 45 1
Burruss Prison
| 0 0| 3 0| 10 0| 2 0| 15 0 | 0 0| 0 0| 0 0| 0 0| 0 0 | 15 0
Bostick Prison
| 0 0| 10 0| 26 1| 25 6| 61 1 | 0 0| 0 0| 0 0| 0 0| 0 0 | 61 1
Valdosta Prison
| 6 3| 143 5| 96 5| 16 4| 261 5 | 0 0| 0 0| 0 0| 0 0| 0 0 | 261 4
Hays Prison
| 6 3| 157 5| 113 5| 17 4| 293 5 | 0 0| 0 0| 0 0| 0 0| 0 0 | 293 5
Hancock Prison
| 8 4| 218 7| 118 6| 19 5| 363 6 | 0 0| 0 0| 0 0| 0 0| 0 0 | 363 6
Telfair Prison
| 13 7| 219 7| 95 4| 11 3| 338 6 | 0 0| 0 0| 0 0| 0 0| 0 0 | 338 6
Autry Prison
| 9 5| 131 4| 104 5| 18 4| 262 5 | 0 0| 0 0| 0 0| 0 0| 0 0 | 262 4
Wilcox Prison
| 0 0| 62 2| 71 3| 5 1| 138 2 | 0 0| 0 0| 0 0| 0 0| 0 0 | 138 2
Calhoun Prison
| 10 5| 81 3| 63 3| 6 1| 160 3 | 0 0| 0 0| 0 0| 0 0| 0 0 | 160 3
Dooly Prison
| 0 0| 50 2| 72 3| 6 1| 128 2 | 0 0| 0 0| 0 0| 0 0| 0 0 | 128 2
Macon Prison
| 22 12| 278 9| 103 5| 25 6| 428 7 | 0 0| 0 0| 0 0| 0 0| 0 0 | 428 7
Smith Prison
| 15 8| 198 7| 76 4| 9 2| 298 5 | 0 0| 0 0| 0 0| 0 0| 0 0 | 298 5
Homerville Prison | 0 0| 0 0| 2 0| 0 0| 2 0 | 0 0| 0 0| 0 0| 0 0| 0 0 | 2 0
Washingtn Women Pris| 0 0| 0 0| 0 0| 0 0| 0 0 | 2 18| 31 25| 25 30| 9 35| 67 27 | 67 1
Baldwin Prison
| 3 2| 24 1| 25 1| 3 1| 55 1 | 0 0| 0 0| 0 0| 0 0| 0 0 | 55 1
Metro Womens Prison | 0 0| 0 0| 0 0| 0 0| 0 0 | 3 27| 25 20| 28 33| 7 27| 63 26 | 63 1
Pulaski Womens Pris | 0 0| 0 0| 0 0| 0 0| 0 0 | 6 55| 65 52| 30 36| 9 35| 110 45 | 110 2
Pelham PreTrans Unit| 0 0| 3 0| 1 0| 0 0| 4 0 | 0 0| 0 0| 0 0| 0 0| 0 0 | 4 0
West Central Prison | 0 0| 3 0| 1 0| 0 0| 4 0 | 0 0| 0 0| 0 0| 0 0| 0 0 | 4 0
D Ray James Prison | 0 0| 35 1| 25 1| 4 1| 64 1 | 0 0| 0 0| 0 0| 0 0| 0 0 | 64 1
Coffee Corr Facility| 0 0| 29 1| 23 1| 4 1| 56 1 | 0 0| 0 0| 0 0| 0 0| 0 0 | 56 1
Wheeler Corr Facilty| 0 0| 39 1| 29 1| 4 1| 72 1 | 0 0| 0 0| 0 0| 0 0| 0 0 | 72 1
------------------------------------------------------------------------------------------------------------------------------------
Total reported
| 186 100| 3005 100| 2115 100| 408 100| 5714 100 | 11 100| 124 100| 84 100| 26 100| 245 100 | 5959 100
|
|
|
|
|
|
|
|
|
|
|
Percent reported | 100.0| 100.0| 100.0| 100.0| 100.0 | 100.0| 100.0| 100.0| 100.0| 100.0 | 100.0
|
|
|
|
|
|
|
|
|
|
|
|
|
|
|
|
|
|
|
|
|
|
Not Reported
|0|0|0|0|0
|0|0|0|0|0
|0
------------------------------------------------------------------------------------------------------------------------------------
Total
| 186 | 3005 | 2115 | 408 | 5714
| 11 | 124 | 84 | 26 | 245
| 5959
Page 43 Run 01/24/01
Georgia Department of Corrections Office of Planning and Analysis
Inmate statistical profile
Sample: ACTIVE PRISONERS SERVING LIFE EXCLUDING JAIL
Requestor: Statistics
Active inmates 01/24/2001
Misdemeanors And Felonies by current age & sex
|
MEN
|
WOMEN
|
| Age | Age | Age | Age | Men
| Age | Age | Age | Age |Women
|Grand
Crime Type
|00-21 %|22-39 %|40-54 %|55-99 %|Total % |00-21 %|22-39 %|40-54 %|55-99 %|Total % |Total %
------------------------------------------------------------------------------------------------------------------------------------
MISDEMEANOR
| 0 0| 0 0| 0 0| 0 0| 0 0 | 0 0| 0 0| 0 0| 0 0| 0 0 | 0 0
FELONY
| 186 100| 3005 100| 2115 100| 408 100| 5714 100 | 11 100| 124 100| 84 100| 26 100| 245 100 | 5959 100
------------------------------------------------------------------------------------------------------------------------------------
Total reported
| 186 100| 3005 100| 2115 100| 408 100| 5714 100 | 11 100| 124 100| 84 100| 26 100| 245 100 | 5959 100
|
|
|
|
|
|
|
|
|
|
|
Percent reported | 100.0| 100.0| 100.0| 100.0| 100.0 | 100.0| 100.0| 100.0| 100.0| 100.0 | 100.0
|
|
|
|
|
|
|
|
|
|
|
|
|
|
|
|
|
|
|
|
|
|
NOT REPORTED
|0|0|0|0|0
|0|0|0|0|0
|0
------------------------------------------------------------------------------------------------------------------------------------
Total
| 186 | 3005 | 2115 | 408 | 5714
| 11 | 124 | 84 | 26 | 245
| 5959
Page 44 Run 01/24/01
Georgia Department of Corrections Office of Planning and Analysis
Inmate statistical profile
Sample: ACTIVE PRISONERS SERVING LIFE EXCLUDING JAIL
Requestor: Statistics
Active inmates 01/24/2001
Crimes By Group by current age & sex
|
MEN
|
WOMEN
|
| Age | Age | Age | Age | Men
| Age | Age | Age | Age |Women
|Grand
Crimes By Group
|00-21 %|22-39 %|40-54 %|55-99 %|Total % |00-21 %|22-39 %|40-54 %|55-99 %|Total % |Total %
------------------------------------------------------------------------------------------------------------------------------------
HOMICIDE
| 135 73| 1878 63| 1248 59| 305 75| 3566 62 | 11 100| 108 87| 67 80| 26 100| 212 87 | 3778 63
ABORTION
| 0 0| 0 0| 0 0| 0 0| 0 0 | 0 0| 0 0| 0 0| 0 0| 0 0 | 0 0
BODILY INJRY&REL OFF| 16 9| 182 6| 103 5| 5 1| 306 5 | 0 0| 2 2| 5 6| 0 0| 7 3 | 313 5
ARSON & REL OFF
| 0 0| 1 0| 0 0| 0 0| 1 0 | 0 0| 0 0| 0 0| 0 0| 0 0 | 1 0
DAMAGE OF PROPERTY | 0 0| 1 0| 0 0| 0 0| 1 0 | 0 0| 0 0| 0 0| 0 0| 0 0 | 1 0
BURGLARY & REL OFF | 0 0| 17 1| 6 0| 0 0| 23 0 | 0 0| 0 0| 1 1| 0 0| 1 0 | 24 0
FORGERY & REL OFF | 0 0| 5 0| 4 0| 0 0| 9 0 | 0 0| 0 0| 0 0| 0 0| 0 0 | 9 0
THEFT
| 0 0| 7 0| 5 0| 0 0| 12 0 | 0 0| 0 0| 0 0| 0 0| 0 0 | 12 0
ROBBERY
| 23 12| 351 12| 242 11| 31 8| 647 11 | 0 0| 2 2| 1 1| 0 0| 3 1 | 650 11
SEXUAL OFFENSES
| 11 6| 326 11| 362 17| 55 13| 754 13 | 0 0| 0 0| 2 2| 0 0| 2 1 | 756 13
OBSCENITY CRIMES | 0 0| 0 0| 0 0| 0 0| 0 0 | 0 0| 0 0| 0 0| 0 0| 0 0 | 0 0
TREASON & REL OFF | 0 0| 0 0| 0 0| 0 0| 0 0 | 0 0| 0 0| 0 0| 0 0| 0 0 | 0 0
CRIMES INVOLVNG GOVT| 0 0| 7 0| 5 0| 1 0| 13 0 | 0 0| 0 0| 0 0| 0 0| 0 0 | 13 0
FALSIFICATIONS
| 0 0| 0 0| 0 0| 0 0| 0 0 | 0 0| 0 0| 0 0| 0 0| 0 0 | 0 0
OBSTRUCT LAW ENFORCE| 0 0| 0 0| 2 0| 0 0| 2 0 | 0 0| 0 0| 0 0| 0 0| 0 0 | 2 0
DISORDERLY CONDUCT | 0 0| 0 0| 0 0| 0 0| 0 0 | 0 0| 0 0| 0 0| 0 0| 0 0 | 0 0
GAMBLING & REL OFF | 0 0| 0 0| 0 0| 0 0| 0 0 | 0 0| 0 0| 0 0| 0 0| 0 0 | 0 0
CRUELTY TO CHILDREN | 0 0| 0 0| 0 0| 0 0| 0 0 | 0 0| 0 0| 0 0| 0 0| 0 0 | 0 0
CRIMES WITH GUNS | 0 0| 0 0| 1 0| 0 0| 1 0 | 0 0| 0 0| 0 0| 0 0| 0 0 | 1 0
INVASION PRIVACY | 0 0| 0 0| 0 0| 0 0| 0 0 | 0 0| 0 0| 0 0| 0 0| 0 0 | 0 0
RACKETEERING
| 0 0| 0 0| 0 0| 0 0| 0 0 | 0 0| 0 0| 0 0| 0 0| 0 0 | 0 0
DRUG ABUSE OFFENSES | 1 1| 210 7| 129 6| 9 2| 349 6 | 0 0| 12 10| 8 10| 0 0| 20 8 | 369 6
DRUG TRAFFICKING | 0 0| 17 1| 8 0| 1 0| 26 0 | 0 0| 0 0| 0 0| 0 0| 0 0 | 26 0
AUTO CRIMES
| 0 0| 0 0| 0 0| 0 0| 0 0 | 0 0| 0 0| 0 0| 0 0| 0 0 | 0 0
REVENUE & CONTRABAND| 0 0| 0 0| 0 0| 0 0| 0 0 | 0 0| 0 0| 0 0| 0 0| 0 0 | 0 0
CRIMES OF OTH STATES| 0 0| 0 0| 0 0| 0 0| 0 0 | 0 0| 0 0| 0 0| 0 0| 0 0 | 0 0
MISC. FELONIES
| 0 0| 1 0| 0 0| 1 0| 2 0 | 0 0| 0 0| 0 0| 0 0| 0 0 | 2 0
MISDEMEANORS
| 0 0| 0 0| 0 0| 0 0| 0 0 | 0 0| 0 0| 0 0| 0 0| 0 0 | 0 0
------------------------------------------------------------------------------------------------------------------------------------
Total reported
| 186 100| 3003 100| 2115 100| 408 100| 5712 100 | 11 100| 124 100| 84 100| 26 100| 245 100 | 5957 100
|
|
|
|
|
|
|
|
|
|
|
Percent reported | 100.0|
99.9| 100.0| 100.0| 100.0 | 100.0| 100.0| 100.0| 100.0| 100.0 | 100.0
|
|
|
|
|
|
|
|
|
|
|
|
|
|
|
|
|
|
|
|
|
|
NOT REPORTED
|0|2|0|0|2
|0|0|0|0|0
|2
------------------------------------------------------------------------------------------------------------------------------------
Total
| 186 | 3005 | 2115 | 408 | 5714
| 11 | 124 | 84 | 26 | 245
| 5959
Page 45 Run 01/24/01
Georgia Department of Corrections Office of Planning and Analysis
Inmate statistical profile
Sample: ACTIVE PRISONERS SERVING LIFE EXCLUDING JAIL
Requestor: Statistics
Active inmates 01/24/2001
Most Serious Offense by current age & sex
|
MEN
|
WOMEN
|
| Age | Age | Age | Age | Men
| Age | Age | Age | Age |Women
|Grand
Most Serious Offense|00-21 %|22-39 %|40-54 %|55-99 %|Total % |00-21 %|22-39 %|40-54 %|55-99 %|Total % |Total %
------------------------------------------------------------------------------------------------------------------------------------
Misdemeanors
|
|
|
------------------------------------------------------------------------------------------------------------------------------------
------------------------------------------------------------------------------------------------------------------------------------
------------------------------------------------------------------------------------------------------------------------------------
FELONIES
|
|
|
------------------------------------------------------------------------------------------------------------------------------------
------------------------------------------------------------------------------------------------------------------------------------
MISC. HOMICIDE OFFEN| 0 0| 2 0| 0 0| 0 0| 2 0 | 0 0| 0 0| 0 0| 0 0| 0 0 | 2 0
MURDER
| 135 73| 1877 62| 1248 59| 304 75| 3564 62 | 11 100| 108 87| 67 80| 26 100| 212 87 | 3776 63
VOLUNTARY MANSLAUGHT| 0 0| 1 0| 0 0| 1 0| 2 0 | 0 0| 0 0| 0 0| 0 0| 0 0 | 2 0
AGGRAVATED ASSAULT | 0 0| 7 0| 1 0| 0 0| 8 0 | 0 0| 0 0| 0 0| 0 0| 0 0 | 8 0
AGGRAVATED BATTERY | 0 0| 1 0| 0 0| 0 0| 1 0 | 0 0| 0 0| 0 0| 0 0| 0 0 | 1 0
KIDNAPPING
| 16 9| 174 6| 100 5| 5 1| 295 5 | 0 0| 2 2| 5 6| 0 0| 7 3 | 302 5
AGG ASSLT ON POLICE | 0 0| 0 0| 2 0| 0 0| 2 0 | 0 0| 0 0| 0 0| 0 0| 0 0 | 2 0
SECOND DEGREE ARSON | 0 0| 1 0| 0 0| 0 0| 1 0 | 0 0| 0 0| 0 0| 0 0| 0 0 | 1 0
CRIM. DAMAGE 2ND DEG| 0 0| 1 0| 0 0| 0 0| 1 0 | 0 0| 0 0| 0 0| 0 0| 0 0 | 1 0
BURGLARY
| 0 0| 17 1| 6 0| 0 0| 23 0 | 0 0| 0 0| 1 1| 0 0| 1 0 | 24 0
FORGERY 1ST DEGREE | 0 0| 5 0| 4 0| 0 0| 9 0 | 0 0| 0 0| 0 0| 0 0| 0 0 | 9 0
THEFT BY TAKING
| 0 0| 2 0| 3 0| 0 0| 5 0 | 0 0| 0 0| 0 0| 0 0| 0 0 | 5 0
THEFT BY REC STOLEN | 0 0| 3 0| 1 0| 0 0| 4 0 | 0 0| 0 0| 0 0| 0 0| 0 0 | 4 0
THEFT BY CONVERSION | 0 0| 1 0| 1 0| 0 0| 2 0 | 0 0| 0 0| 0 0| 0 0| 0 0 | 2 0
THEFT OF MOTOR VEH, | 0 0| 1 0| 0 0| 0 0| 1 0 | 0 0| 0 0| 0 0| 0 0| 0 0 | 1 0
ROBBERY
| 0 0| 5 0| 6 0| 4 1| 15 0 | 0 0| 0 0| 0 0| 0 0| 0 0 | 15 0
ARMED ROBBERY
| 22 12| 346 12| 236 11| 27 7| 631 11 | 0 0| 2 2| 1 1| 0 0| 3 1 | 634 11
CRMNL ATMPT ARMED RO| 1 1| 0 0| 0 0| 0 0| 1 0 | 0 0| 0 0| 0 0| 0 0| 0 0 | 1 0
MISC. SEXUAL
| 0 0| 1 0| 0 0| 0 0| 1 0 | 0 0| 0 0| 0 0| 0 0| 0 0 | 1 0
RAPE
| 11 6| 305 10| 328 16| 43 11| 687 12 | 0 0| 0 0| 2 2| 0 0| 2 1 | 689 12
AGGRAVATED SODOMY | 0 0| 15 0| 21 1| 9 2| 45 1 | 0 0| 0 0| 0 0| 0 0| 0 0 | 45 1
CHILD MOLESTATION | 0 0| 1 0| 3 0| 1 0| 5 0 | 0 0| 0 0| 0 0| 0 0| 0 0 | 5 0
AGGRAV. CHILD MOLEST| 0 0| 4 0| 10 0| 2 0| 16 0 | 0 0| 0 0| 0 0| 0 0| 0 0 | 16 0
OBSTR OF LAW ENF OFF| 0 0| 7 0| 5 0| 1 0| 13 0 | 0 0| 0 0| 0 0| 0 0| 0 0 | 13 0
ESCAPE
| 0 0| 0 0| 2 0| 0 0| 2 0 | 0 0| 0 0| 0 0| 0 0| 0 0 | 2 0
POSS OF CERTAIN WEAP| 0 0| 0 0| 1 0| 0 0| 1 0 | 0 0| 0 0| 0 0| 0 0| 0 0 | 1 0
S/D NARCOTICS, OPIAT| 0 0| 11 0| 13 1| 1 0| 25 0 | 0 0| 1 1| 1 1| 0 0| 2 1 | 27 0
S/D DEP,STIM,CNTRF D| 0 0| 4 0| 2 0| 0 0| 6 0 | 0 0| 0 0| 0 0| 0 0| 0 0 | 6 0
SALE/DIST OF MARIJUA| 0 0| 6 0| 5 0| 1 0| 12 0 | 0 0| 0 0| 0 0| 0 0| 0 0 | 12 0
------------------------------------------------------------------------------------------------------------------------------------
(continued)
Page 46 Run 01/24/01
Georgia Department of Corrections Office of Planning and Analysis
Inmate statistical profile
Sample: ACTIVE PRISONERS SERVING LIFE EXCLUDING JAIL
Requestor:
Active inmates 01/24/2001
Most Serious Offense by current age & sex
Statistics (CONTINUED)
|
MEN
|
WOMEN
|
| Age | Age | Age | Age | Men
| Age | Age | Age | Age |Women
|Grand
Most Serious Offense|00-21 %|22-39 %|40-54 %|55-99 %|Total % |00-21 %|22-39 %|40-54 %|55-99 %|Total % |Total %
------------------------------------------------------------------------------------------------------------------------------------
POSS NARCOTICS, OPIA| 0 0| 4 0| 3 0| 0 0| 7 0 | 0 0| 0 0| 0 0| 0 0| 0 0 | 7 0
POSS DEP,STIM,CNTRF | 0 0| 0 0| 1 0| 0 0| 1 0 | 0 0| 0 0| 0 0| 0 0| 0 0 | 1 0
VIOLATE GA CNTRL SBS| 0 0| 15 0| 6 0| 0 0| 21 0 | 0 0| 1 1| 1 1| 0 0| 2 1 | 23 0
UNLWFL MFG/DEL/DIST | 0 0| 5 0| 2 0| 0 0| 7 0 | 0 0| 0 0| 0 0| 0 0| 0 0 | 7 0
SALE/DIST CONT SUB P| 0 0| 3 0| 1 0| 0 0| 4 0 | 0 0| 0 0| 0 0| 0 0| 0 0 | 4 0
SALE/DIST CONT SUB S| 0 0| 1 0| 0 0| 0 0| 1 0 | 0 0| 0 0| 0 0| 0 0| 0 0 | 1 0
SALE/DISTRIBUTION CO| 1 1| 136 5| 82 4| 4 1| 223 4 | 0 0| 10 8| 6 7| 0 0| 16 7 | 239 4
POSSESSION OF COCAIN| 0 0| 25 1| 14 1| 3 1| 42 1 | 0 0| 0 0| 0 0| 0 0| 0 0 | 42 1
COCAINE LESS 200 GRA| 0 0| 11 0| 7 0| 1 0| 19 0 | 0 0| 0 0| 0 0| 0 0| 0 0 | 19 0
COCAINE 401 OR MORE | 0 0| 5 0| 0 0| 0 0| 5 0 | 0 0| 0 0| 0 0| 0 0| 0 0 | 5 0
NARCOTICS LESS 14 GR| 0 0| 0 0| 1 0| 0 0| 1 0 | 0 0| 0 0| 0 0| 0 0| 0 0 | 1 0
ATT/CONSPRCY COMMT C| 0 0| 1 0| 0 0| 0 0| 1 0 | 0 0| 0 0| 0 0| 0 0| 0 0 | 1 0
CONSPIRACY
| 0 0| 1 0| 0 0| 0 0| 1 0 | 0 0| 0 0| 0 0| 0 0| 0 0 | 1 0
CRIMINAL ATTEMPT | 0 0| 0 0| 0 0| 1 0| 1 0 | 0 0| 0 0| 0 0| 0 0| 0 0 | 1 0
------------------------------------------------------------------------------------------------------------------------------------
Total reported
| 186 100| 3005 100| 2115 100| 408 100| 5714 100 | 11 100| 124 100| 84 100| 26 100| 245 100 | 5959 100
|
|
|
|
|
|
|
|
|
|
|
Percent reported | 100.0| 100.0| 100.0| 100.0| 100.0 | 100.0| 100.0| 100.0| 100.0| 100.0 | 100.0
|
|
|
|
|
|
|
|
|
|
|
|
|
|
|
|
|
|
|
|
|
|
NOT REPORTED
|0|0|0|0|0
|0|0|0|0|0
|0
------------------------------------------------------------------------------------------------------------------------------------
Total
| 186 | 3005 | 2115 | 408 | 5714
| 11 | 124 | 84 | 26 | 245
| 5959
Page 47 Run 01/24/01
Georgia Department of Corrections Office of Planning and Analysis
Inmate statistical profile
Sample: ACTIVE PRISONERS SERVING LIFE EXCLUDING JAIL
Requestor: Statistics
Active inmates 01/24/2001
Most Serious Crime Type by current age & sex
|
MEN
|
WOMEN
|
| Age | Age | Age | Age | Men
| Age | Age | Age | Age |Women
|Grand
Crime Type
|00-21 %|22-39 %|40-54 %|55-99 %|Total % |00-21 %|22-39 %|40-54 %|55-99 %|Total % |Total %
------------------------------------------------------------------------------------------------------------------------------------
VIOL/PERSN
| 174 94| 2413 80| 1593 75| 341 84| 4521 79 | 11 100| 112 90| 73 87| 26 100| 222 91 | 4743 80
NVIOL/PERS
| 0 0| 0 0| 0 0| 0 0| 0 0 | 0 0| 0 0| 0 0| 0 0| 0 0 | 0 0
PROPERTY
| 0 0| 31 1| 15 1| 0 0| 46 1 | 0 0| 0 0| 1 1| 0 0| 1 0 | 47 1
DRUG SALES
| 1 1| 183 6| 113 5| 7 2| 304 5 | 0 0| 11 9| 7 8| 0 0| 18 7 | 322 5
DRUG POSSN
| 0 0| 44 1| 24 1| 3 1| 71 1 | 0 0| 1 1| 1 1| 0 0| 2 1 | 73 1
ALCOHOL
| 0 0| 0 0| 0 0| 0 0| 0 0 | 0 0| 0 0| 0 0| 0 0| 0 0 | 0 0
HABIT/DUI
| 0 0| 0 0| 0 0| 0 0| 0 0 | 0 0| 0 0| 0 0| 0 0| 0 0 | 0 0
SEX OFFEND
| 11 6| 326 11| 362 17| 55 13| 754 13 | 0 0| 0 0| 2 2| 0 0| 2 1 | 756 13
OTHER
| 0 0| 8 0| 8 0| 2 0| 18 0 | 0 0| 0 0| 0 0| 0 0| 0 0 | 18 0
------------------------------------------------------------------------------------------------------------------------------------
Total reported
| 186 100| 3005 100| 2115 100| 408 100| 5714 100 | 11 100| 124 100| 84 100| 26 100| 245 100 | 5959 100
|
|
|
|
|
|
|
|
|
|
|
Percent reported | 100.0| 100.0| 100.0| 100.0| 100.0 | 100.0| 100.0| 100.0| 100.0| 100.0 | 100.0
|
|
|
|
|
|
|
|
|
|
|
|
|
|
|
|
|
|
|
|
|
|
NOT REPORTED
|0|0|0|0|0
|0|0|0|0|0
|0
------------------------------------------------------------------------------------------------------------------------------------
Total
| 186 | 3005 | 2115 | 408 | 5714
| 11 | 124 | 84 | 26 | 245
| 5959