- Collection:
- Georgia Government Publications
- Title:
- Inmate statistical profile: active lifers, Sept. 2000
- Creator:
- Georgia. Department of Corrections. Planning and Analysis Section
- Publisher:
- Atlanta, GA. : Georgia Dept. of Corrections, Office of Planning and Analysis, 2000-09
- Date of Original:
- 2000-09
- Subject:
- Prisoners--Georgia
- Location:
- United States, Georgia, 32.75042, -83.50018
- Medium:
- state government records
- Type:
- Text
- Format:
- application/pdf
- External Identifiers:
- Call Number GA R300.P5 P1 L5 2000/9
- Metadata URL:
- https://dlg.galileo.usg.edu/id:dlg_ggpd_i-ga-br300-pp5-bp1-bl5-b2000-s9-belec-p-btext
- Digital Object URL:
- https://dlg.galileo.usg.edu/do:dlg_ggpd_i-ga-br300-pp5-bp1-bl5-b2000-s9-belec-p-btext
- Language:
- eng
- Holding Institution:
- University of Georgia. Map and Government Information Library
- Rights:
-

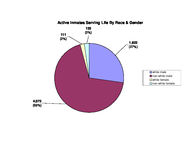
Active Inmates Serving Life By Race & Gender
111 (2%)
133 (2%)
1,622 (27%)
4,072 (69%)
white male non-white male white female non-white female
Active Inmates Serving Life By Crime Type
336 (6%)
755 (13%) 73 (1%)
18 (<1%)
53 (1%)
4,703 (79%)
viol/persn
property
drug sales
drug possn
sex offend
other
Prior Incarcerations of Active Inmates Serving A Life Sentence
4000
3,580
(60%)
3500
3000
Number of Inmates
2500
2000 1500 1000
500 0
zero
1,222 (21%)
one
609 (10%)
326 (5%)
two
three
Priors
130 (2%)
four
71 (<1%)
five or more
Georgia Department of Corrections
Page 1 Run 09/20/00
Office of Planning and Analysis
Inmate statistical profile TABLE OF CONTENTS FOR ACTIVE PRISONERS SERVING LIFE EXCLUDING JAIL
TITLE ----RACE AND SEX............................ 2 Culture Fair IQ Scores.................. 3 Self-Rpt Socioeconomic Class............ 4 Self-Rpt Environment To Age 16.......... 5 Self-Rpt Education Level................ 6 Functional Reading Level (WRAT Scores).. 7 Functional Math Level (WRAT Scores)..... 8 Functional Spelling Level (WRAT Scores). 9 Self-Rpt Guardian Status To Age 16......10 Self-Rpt Employment Status Before Prison11 Self-Rpt Marital Status At Admission....12 Self-Rpt Number Of Children At Admission13 Self-Rpt Religious Affiliation..........14 Self-Rpt Family Behavior Patterns *.....15 Inmate Diagnostic Behavior Problem *....16 Physical Profile (General Condition)....17 Security Status.........................18 Number Of Sentences.....................19 Number Of Disciplinaries................20 Number Of Escapes.......................21 Number Of Prior Georgia Incarcerations *22 Number Of Transfers.....................23 County Of Conviction....................24 Circuit Of Conviction...................29 Home County.............................31 Prison Sentence In Years................36 Probation To Follow Prison..............37 Admission Type..........................38 Release Type............................39 Inst By Group...........................40 Institution.............................41 Misdemeanors And Felonies...............43 Crimes By Group.........................44 Most Serious Offense....................45 Most Serious Crime Type.................47
PAGE ----
Page 2 Run 09/20/00
Georgia Department of Corrections Office of Planning and Analysis
Inmate statistical profile
Sample: ACTIVE PRISONERS SERVING LIFE EXCLUDING JAIL
Requestor: Statistics
Active inmates 09/20/2000
RACE AND SEX by current age & sex
|
MEN
|
WOMEN
|
| Age | Age | Age | Age | Men
| Age | Age | Age | Age |Women
|Grand
RACE AND SEX
|00-21 %|22-39 %|40-54 %|55-99 %|Total % |00-21 %|22-39 %|40-54 %|55-99 %|Total % |Total %
------------------------------------------------------------------------------------------------------------------------------------
WHITE MALE
| 37 19| 690 23| 690 34| 205 51| 1622 28 | 0 0| 0 0| 0 0| 0 0| 0 0 | 1622 27
NON WHITE MALE
| 157 81| 2352 77| 1365 66| 198 49| 4072 72 | 0 0| 0 0| 0 0| 0 0| 0 0 | 4072 69
WHITE FEMALE
| 0 0| 0 0| 0 0| 0 0| 0 0 | 4 44| 49 38| 41 50| 17 68| 111 45 | 111 2
NON WHITE FEMALE | 0 0| 0 0| 0 0| 0 0| 0 0 | 5 56| 79 62| 41 50| 8 32| 133 55 | 133 2
------------------------------------------------------------------------------------------------------------------------------------
Total reported
| 194 100| 3042 100| 2055 100| 403 100| 5694 100 | 9 100| 128 100| 82 100| 25 100| 244 100 | 5938 100
|
|
|
|
|
|
|
|
|
|
|
Percent reported | 100.0| 100.0| 100.0| 100.0| 100.0 | 100.0| 100.0| 100.0| 100.0| 100.0 | 100.0
|
|
|
|
|
|
|
|
|
|
|
|
|
|
|
|
|
|
|
|
|
|
NOT REPORTED
|0|0|0|0|0
|0|0|0|0|0
|0
------------------------------------------------------------------------------------------------------------------------------------
Total
| 194 | 3042 | 2055 | 403 | 5694
| 9 | 128 | 82 | 25 | 244
| 5938
|
|
|
|
|
|
|
|
|
|
|
|
|
|
|
|
|
|
|
|
|
|
|
|
|
|
|
|
|
|
|
|
|
|
|
|
|
|
|
|
|
|
|
|
|
|
|
|
|
|
|
|
|
|
|
AVERAGE AGE
| 19.87 | 31.17 | 45.76 | 61.32 | 38.18 | 19.11 | 31.48 | 45.27 | 60.64 | 38.65 | 38.20
Page 3 Run 09/20/00
Georgia Department of Corrections Office of Planning and Analysis
Inmate statistical profile
Sample: ACTIVE PRISONERS SERVING LIFE EXCLUDING JAIL
Requestor: Statistics
Active inmates 09/20/2000
Culture Fair IQ Scores by current age & sex
|
MEN
|
WOMEN
|
| Age | Age | Age | Age | Men
| Age | Age | Age | Age |Women
|Grand
IQ Score
|00-21 %|22-39 %|40-54 %|55-99 %|Total % |00-21 %|22-39 %|40-54 %|55-99 %|Total % |Total %
------------------------------------------------------------------------------------------------------------------------------------
LESS THAN 70
| 3 2| 85 3| 153 8| 38 11| 279 5 | 0 0| 9 7| 10 13| 2 9| 21 9 | 300 5
70 AND UP
| 184 98| 2815 97| 1763 92| 317 89| 5079 95 | 8 100| 116 93| 69 87| 20 91| 213 91 | 5292 95
------------------------------------------------------------------------------------------------------------------------------------
Total reported
| 187 100| 2900 100| 1916 100| 355 100| 5358 100 | 8 100| 125 100| 79 100| 22 100| 234 100 | 5592 100
|
|
|
|
|
|
|
|
|
|
|
Percent reported |
96.4|
95.3|
93.2|
88.1|
94.1 |
88.9|
97.7|
96.3|
88.0|
95.9 |
94.2
|
|
|
|
|
|
|
|
|
|
|
|
|
|
|
|
|
|
|
|
|
|
NOT REPORTED
| 7 | 142 | 139 | 48 | 336
| 1 | 3 | 3 | 3 | 10
| 346
------------------------------------------------------------------------------------------------------------------------------------
Total
| 194 | 3042 | 2055 | 403 | 5694
| 9 | 128 | 82 | 25 | 244
| 5938
|
|
|
|
|
|
|
|
|
|
|
|
|
|
|
|
|
|
|
|
|
|
|
|
|
|
|
|
|
|
|
|
|
|
|
|
|
|
|
|
|
|
|
|
|
|
|
|
|
|
|
|
|
|
|
AVERAGE IQ
| 98.12 | 101.40 | 96.94 | 93.57 | 99.17 | 97.50 | 95.63 | 90.37 | 88.09 | 93.21 | 98.92
Page 4 Run 09/20/00
Georgia Department of Corrections Office of Planning and Analysis
Inmate statistical profile
Sample: ACTIVE PRISONERS SERVING LIFE EXCLUDING JAIL
Requestor: Statistics
Active inmates 09/20/2000
Self-Rpt Socioeconomic Class by current age & sex
|
MEN
|
WOMEN
|
| Age | Age | Age | Age | Men
| Age | Age | Age | Age |Women
|Grand
Socioeconomic Class |00-21 %|22-39 %|40-54 %|55-99 %|Total % |00-21 %|22-39 %|40-54 %|55-99 %|Total % |Total %
------------------------------------------------------------------------------------------------------------------------------------
WELFARE
| 21 12| 343 12| 199 10| 23 6| 586 11 | 0 0| 22 17| 7 9| 0 0| 29 12 | 615 11
OCC EMPLOY
| 14 8| 192 7| 67 3| 6 2| 279 5 | 0 0| 3 2| 0 0| 1 5| 4 2 | 283 5
MINIMUM STD
| 74 41| 1010 35| 881 44| 215 57| 2180 40 | 5 56| 43 34| 26 32| 8 36| 82 34 | 2262 40
MIDDLE
| 69 39| 1350 46| 837 42| 133 35| 2389 44 | 4 44| 57 45| 46 56| 12 55| 119 50 | 2508 44
OTHER
| 1 1| 27 1| 5 0| 3 1| 36 1 | 0 0| 1 1| 3 4| 1 5| 5 2 | 41 1
------------------------------------------------------------------------------------------------------------------------------------
Total reported
| 179 100| 2922 100| 1989 100| 380 100| 5470 100 | 9 100| 126 100| 82 100| 22 100| 239 100 | 5709 100
|
|
|
|
|
|
|
|
|
|
|
Percent reported |
92.3|
96.1|
96.8|
94.3|
96.1 | 100.0|
98.4| 100.0|
88.0|
98.0 |
96.1
|
|
|
|
|
|
|
|
|
|
|
|
|
|
|
|
|
|
|
|
|
|
NOT RPTD
| 15 | 120 | 66 | 23 | 224
|0|2|0|3|5
| 229
------------------------------------------------------------------------------------------------------------------------------------
Total
| 194 | 3042 | 2055 | 403 | 5694
| 9 | 128 | 82 | 25 | 244
| 5938
Page 5 Run 09/20/00
Georgia Department of Corrections Office of Planning and Analysis
Inmate statistical profile
Sample: ACTIVE PRISONERS SERVING LIFE EXCLUDING JAIL
Requestor: Statistics
Active inmates 09/20/2000
Self-Rpt Environment To Age 16 by current age & sex
|
MEN
|
WOMEN
|
| Age | Age | Age | Age | Men
| Age | Age | Age | Age |Women
|Grand
Environment
|00-21 %|22-39 %|40-54 %|55-99 %|Total % |00-21 %|22-39 %|40-54 %|55-99 %|Total % |Total %
------------------------------------------------------------------------------------------------------------------------------------
RURAL/FARM
| 0 0| 115 4| 174 9| 93 24| 382 7 | 0 0| 8 6| 4 5| 3 14| 15 6 | 397 7
RURAL/NFARM
| 3 2| 215 7| 172 9| 34 9| 424 8 | 0 0| 7 6| 3 4| 0 0| 10 4 | 434 7
S.M.S.A
| 83 43| 1211 41| 714 36| 98 25| 2106 38 | 2 22| 24 19| 22 27| 6 29| 54 23 | 2160 37
URBAN
| 35 18| 527 18| 360 18| 52 13| 974 18 | 4 44| 32 25| 23 28| 2 10| 61 26 | 1035 18
SMALL TOWN
| 71 37| 889 30| 568 28| 111 29| 1639 30 | 3 33| 55 44| 28 34| 9 43| 95 40 | 1734 30
OTHER
| 0 0| 16 1| 9 0| 0 0| 25 0 | 0 0| 0 0| 2 2| 1 5| 3 1 | 28 0
------------------------------------------------------------------------------------------------------------------------------------
Total reported
| 192 100| 2973 100| 1997 100| 388 100| 5550 100 | 9 100| 126 100| 82 100| 21 100| 238 100 | 5788 100
|
|
|
|
|
|
|
|
|
|
|
Percent reported |
99.0|
97.7|
97.2|
96.3|
97.5 | 100.0|
98.4| 100.0|
84.0|
97.5 |
97.5
|
|
|
|
|
|
|
|
|
|
|
|
|
|
|
|
|
|
|
|
|
|
NOT RPTD
| 2 | 69 | 58 | 15 | 144
|0|2|0|4|6
| 150
------------------------------------------------------------------------------------------------------------------------------------
Total
| 194 | 3042 | 2055 | 403 | 5694
| 9 | 128 | 82 | 25 | 244
| 5938
Page 6 Run 09/20/00
Georgia Department of Corrections Office of Planning and Analysis
Inmate statistical profile
Sample: ACTIVE PRISONERS SERVING LIFE EXCLUDING JAIL
Requestor: Statistics
Active inmates 09/20/2000
Self-Rpt Education Level by current age & sex
|
MEN
|
WOMEN
|
| Age | Age | Age | Age | Men
| Age | Age | Age | Age |Women
|Grand
Education Level
|00-21 %|22-39 %|40-54 %|55-99 %|Total % |00-21 %|22-39 %|40-54 %|55-99 %|Total % |Total %
------------------------------------------------------------------------------------------------------------------------------------
LESS THAN GRADE 7 | 6 3| 48 2| 107 5| 84 21| 245 4 | 0 0| 1 1| 3 4| 5 21| 9 4 | 254 4
GRADE 7
| 9 5| 83 3| 64 3| 33 8| 189 3 | 0 0| 6 5| 3 4| 1 4| 10 4 | 199 3
GRADE 8
| 43 23| 269 9| 199 10| 37 9| 548 10 | 3 33| 15 12| 8 10| 1 4| 27 11 | 575 10
GRADE 9
| 44 23| 450 15| 245 12| 34 9| 773 14 | 3 33| 17 13| 5 6| 0 0| 25 10 | 798 14
GRADE 10
| 42 22| 601 20| 284 14| 35 9| 962 17 | 2 22| 20 16| 10 12| 3 13| 35 15 | 997 17
GRADE 11
| 37 19| 551 18| 223 11| 26 7| 837 15 | 1 11| 19 15| 4 5| 2 8| 26 11 | 863 15
GRADE 12
| 7 4| 744 25| 647 32| 96 24| 1494 27 | 0 0| 28 22| 29 35| 8 33| 65 27 | 1559 27
MORE THAN GRADE 12 | 3 2| 253 8| 254 13| 49 12| 559 10 | 0 0| 20 16| 20 24| 4 17| 44 18 | 603 10
------------------------------------------------------------------------------------------------------------------------------------
Total reported
| 191 100| 2999 100| 2023 100| 394 100| 5607 100 | 9 100| 126 100| 82 100| 24 100| 241 100 | 5848 100
|
|
|
|
|
|
|
|
|
|
|
Percent reported |
98.5|
98.6|
98.4|
97.8|
98.5 | 100.0|
98.4| 100.0|
96.0|
98.8 |
98.5
|
|
|
|
|
|
|
|
|
|
|
|
|
|
|
|
|
|
|
|
|
|
NOT REPORTED
| 3 | 43 | 32 | 9 | 87
|0|2|0|1|3
| 90
------------------------------------------------------------------------------------------------------------------------------------
Total
| 194 | 3042 | 2055 | 403 | 5694
| 9 | 128 | 82 | 25 | 244
| 5938
|
|
|
|
|
|
|
|
|
|
|
|
|
|
|
|
|
|
|
|
|
|
|
|
|
|
|
|
|
|
|
|
|
|
|
|
|
|
|
|
|
|
|
|
|
|
|
|
|
|
|
|
|
|
|
AVG EDUCATION LEVEL | 9.46 | 11.02 | 11.20 | 9.73 | 10.94 | 9.11 | 11.56 | 11.85 | 11.08 | 11.52 | 10.97
* NOTE: THE FIELD LABLED "LESS THAN GRADE 7" WAS CORRECTED IN MARCH 1989: MISSING DATA FOR INMATES STILL IN DIAGNOSTICS NOW HAS BEEN REMOVED FROM THIS FIELD AND IDENTIFIED AS "NOT REPORTED" INFORMATION.
Page 7 Run 09/20/00
Georgia Department of Corrections Office of Planning and Analysis
Inmate statistical profile
Sample: ACTIVE PRISONERS SERVING LIFE EXCLUDING JAIL
Requestor: Statistics
Active inmates 09/20/2000
Functional Reading Level (WRAT Scores) by current age & sex
|
MEN
|
WOMEN
|
| Age | Age | Age | Age | Men
| Age | Age | Age | Age |Women
|Grand
WRAT Reading Score |00-21 %|22-39 %|40-54 %|55-99 %|Total % |00-21 %|22-39 %|40-54 %|55-99 %|Total % |Total %
------------------------------------------------------------------------------------------------------------------------------------
LESS THAN GRADE 6 | 83 44| 1142 39| 835 46| 162 48| 2222 42 | 2 25| 47 38| 22 29| 10 43| 81 35 | 2303 42
6TH THRU 8TH GRADE | 33 18| 672 23| 408 23| 60 18| 1173 22 | 2 25| 29 23| 17 22| 4 17| 52 22 | 1225 22
GRADE 9
| 12 6| 211 7| 103 6| 20 6| 346 7 | 1 13| 4 3| 7 9| 2 9| 14 6 | 360 7
GRADE 10
| 13 7| 130 4| 75 4| 14 4| 232 4 | 1 13| 3 2| 5 6| 2 9| 11 5 | 243 4
GRADE 11
| 6 3| 113 4| 83 5| 9 3| 211 4 | 0 0| 4 3| 5 6| 1 4| 10 4 | 221 4
GRADE 12
| 32 17| 533 18| 281 16| 67 20| 913 17 | 2 25| 7 6| 2 3| 1 4| 12 5 | 925 17
MORE THAN GRADE 12 | 8 4| 104 4| 27 1| 4 1| 143 3 | 0 0| 31 25| 19 25| 3 13| 53 23 | 196 4
------------------------------------------------------------------------------------------------------------------------------------
Total reported
| 187 100| 2905 100| 1812 100| 336 100| 5240 100 | 8 100| 125 100| 77 100| 23 100| 233 100 | 5473 100
|
|
|
|
|
|
|
|
|
|
|
Percent reported |
96.4|
95.5|
88.2|
83.4|
92.0 |
88.9|
97.7|
93.9|
92.0|
95.5 |
92.2
|
|
|
|
|
|
|
|
|
|
|
|
|
|
|
|
|
|
|
|
|
|
NOT REPORTED
| 7 | 137 | 243 | 67 | 454
| 1 | 3 | 5 | 2 | 11
| 465
------------------------------------------------------------------------------------------------------------------------------------
Total
| 194 | 3042 | 2055 | 403 | 5694
| 9 | 128 | 82 | 25 | 244
| 5938
|
|
|
|
|
|
|
|
|
|
|
|
|
|
|
|
|
|
|
|
|
|
|
|
|
|
|
|
|
|
|
|
|
|
|
|
|
|
|
|
|
|
|
|
|
|
|
|
|
|
|
|
|
|
|
AVG READING SCORE | 7.52 | 7.67 | 6.99 | 6.92 | 7.38 | 8.41 | 8.02 | 8.34 | 7.23 | 8.06 | 7.41
Page 8 Run 09/20/00
Georgia Department of Corrections Office of Planning and Analysis
Inmate statistical profile
Sample: ACTIVE PRISONERS SERVING LIFE EXCLUDING JAIL
Requestor: Statistics
Active inmates 09/20/2000
Functional Math Level (WRAT Scores) by current age & sex
|
MEN
|
WOMEN
|
| Age | Age | Age | Age | Men
| Age | Age | Age | Age |Women
|Grand
WRAT Math Score
|00-21 %|22-39 %|40-54 %|55-99 %|Total % |00-21 %|22-39 %|40-54 %|55-99 %|Total % |Total %
------------------------------------------------------------------------------------------------------------------------------------
LESS THAN GRADE 6 | 67 36| 875 30| 796 44| 171 51| 1909 36 | 2 25| 47 38| 28 36| 11 48| 88 38 | 1997 36
6TH THRU 8TH GRADE | 89 48| 1457 50| 671 37| 93 28| 2310 44 | 5 63| 52 42| 31 40| 8 35| 96 41 | 2406 44
GRADE 9
| 11 6| 224 8| 118 6| 24 7| 377 7 | 1 13| 12 10| 5 6| 2 9| 20 9 | 397 7
GRADE 10
| 11 6| 136 5| 97 5| 15 4| 259 5 | 0 0| 7 6| 3 4| 1 4| 11 5 | 270 5
GRADE 11
| 5 3| 96 3| 50 3| 12 4| 163 3 | 0 0| 1 1| 3 4| 1 4| 5 2 | 168 3
GRADE 12
| 2 1| 103 4| 82 5| 19 6| 206 4 | 0 0| 2 2| 3 4| 0 0| 5 2 | 211 4
MORE THAN GRADE 12 | 2 1| 18 1| 3 0| 2 1| 25 0 | 0 0| 4 3| 5 6| 0 0| 9 4 | 34 1
------------------------------------------------------------------------------------------------------------------------------------
Total reported
| 187 100| 2909 100| 1817 100| 336 100| 5249 100 | 8 100| 125 100| 78 100| 23 100| 234 100 | 5483 100
|
|
|
|
|
|
|
|
|
|
|
Percent reported |
96.4|
95.6|
88.4|
83.4|
92.2 |
88.9|
97.7|
95.1|
92.0|
95.9 |
92.3
|
|
|
|
|
|
|
|
|
|
|
|
|
|
|
|
|
|
|
|
|
|
NOT REPORTED
| 7 | 133 | 238 | 67 | 445
| 1 | 3 | 4 | 2 | 10
| 455
------------------------------------------------------------------------------------------------------------------------------------
Total
| 194 | 3042 | 2055 | 403 | 5694
| 9 | 128 | 82 | 25 | 244
| 5938
|
|
|
|
|
|
|
|
|
|
|
|
|
|
|
|
|
|
|
|
|
|
|
|
|
|
|
|
|
|
|
|
|
|
|
|
|
|
|
|
|
|
|
|
|
|
|
|
|
|
|
|
|
|
|
AVG MATH SCORE
| 6.90 | 7.11 | 6.58 | 6.31 | 6.86 | 6.83 | 7.04 | 7.28 | 5.94 | 7.00 | 6.87
Page 9 Run 09/20/00
Georgia Department of Corrections Office of Planning and Analysis
Inmate statistical profile
Sample: ACTIVE PRISONERS SERVING LIFE EXCLUDING JAIL
Requestor: Statistics
Active inmates 09/20/2000
Functional Spelling Level (WRAT Scores) by current age & sex
|
MEN
|
WOMEN
|
| Age | Age | Age | Age | Men
| Age | Age | Age | Age |Women
|Grand
WRAT Spelling Score |00-21 %|22-39 %|40-54 %|55-99 %|Total % |00-21 %|22-39 %|40-54 %|55-99 %|Total % |Total %
------------------------------------------------------------------------------------------------------------------------------------
LESS THAN GRADE 6 | 79 42| 1317 45| 1052 58| 196 58| 2644 50 | 2 25| 45 36| 26 33| 12 52| 85 36 | 2729 50
6TH THRU 8TH GRADE | 56 30| 771 27| 363 20| 67 20| 1257 24 | 4 50| 30 24| 18 23| 3 13| 55 24 | 1312 24
GRADE 9
| 14 7| 169 6| 105 6| 13 4| 301 6 | 1 13| 8 6| 3 4| 3 13| 15 6 | 316 6
GRADE 10
| 16 9| 179 6| 67 4| 14 4| 276 5 | 0 0| 10 8| 6 8| 0 0| 16 7 | 292 5
GRADE 11
| 6 3| 140 5| 45 2| 5 1| 196 4 | 1 13| 4 3| 5 6| 2 9| 12 5 | 208 4
GRADE 12
| 11 6| 289 10| 168 9| 39 12| 507 10 | 0 0| 8 6| 5 6| 0 0| 13 6 | 520 9
MORE THAN GRADE 12 | 5 3| 41 1| 13 1| 2 1| 61 1 | 0 0| 20 16| 15 19| 3 13| 38 16 | 99 2
------------------------------------------------------------------------------------------------------------------------------------
Total reported
| 187 100| 2906 100| 1813 100| 336 100| 5242 100 | 8 100| 125 100| 78 100| 23 100| 234 100 | 5476 100
|
|
|
|
|
|
|
|
|
|
|
Percent reported |
96.4|
95.5|
88.2|
83.4|
92.1 |
88.9|
97.7|
95.1|
92.0|
95.9 |
92.2
|
|
|
|
|
|
|
|
|
|
|
|
|
|
|
|
|
|
|
|
|
|
NOT REPORTED
| 7 | 136 | 242 | 67 | 452
| 1 | 3 | 4 | 2 | 10
| 462
------------------------------------------------------------------------------------------------------------------------------------
Total
| 194 | 3042 | 2055 | 403 | 5694
| 9 | 128 | 82 | 25 | 244
| 5938
|
|
|
|
|
|
|
|
|
|
|
|
|
|
|
|
|
|
|
|
|
|
|
|
|
|
|
|
|
|
|
|
|
|
|
|
|
|
|
|
|
|
|
|
|
|
|
|
|
|
|
|
|
|
|
AVG SPELLING SCORE | 6.97 | 6.89 | 6.03 | 5.91 | 6.53 | 7.58 | 7.94 | 8.14 | 6.55 | 7.85 | 6.59
Page 10 Run 09/20/00
Georgia Department of Corrections Office of Planning and Analysis
Inmate statistical profile
Sample: ACTIVE PRISONERS SERVING LIFE EXCLUDING JAIL
Requestor: Statistics
Active inmates 09/20/2000
Self-Rpt Guardian Status To Age 16 by current age & sex
|
MEN
|
WOMEN
|
| Age | Age | Age | Age | Men
| Age | Age | Age | Age |Women
|Grand
Guardian Status
|00-21 %|22-39 %|40-54 %|55-99 %|Total % |00-21 %|22-39 %|40-54 %|55-99 %|Total % |Total %
------------------------------------------------------------------------------------------------------------------------------------
ORPHANAGE
| 0 0| 5 0| 3 0| 3 1| 11 0 | 0 0| 0 0| 0 0| 0 0| 0 0 | 11 0
FATHER ONLY
| 11 6| 85 3| 55 3| 6 2| 157 3 | 0 0| 2 2| 2 3| 1 4| 5 2 | 162 3
FTR MTR HD
| 13 7| 114 4| 67 3| 6 2| 200 4 | 0 0| 2 2| 4 5| 0 0| 6 3 | 206 4
MOTHER ONLY
| 96 50| 1391 47| 643 32| 104 27| 2234 40 | 5 56| 45 36| 26 33| 9 39| 85 36 | 2319 40
MTR FTR HD
| 43 23| 956 32| 967 48| 213 54| 2179 39 | 4 44| 51 40| 42 53| 12 52| 109 46 | 2288 39
OTH FEMALE
| 2 1| 56 2| 47 2| 17 4| 122 2 | 0 0| 4 3| 2 3| 0 0| 6 3 | 128 2
OTH MALE
| 1 1| 7 0| 11 1| 1 0| 20 0 | 0 0| 2 2| 1 1| 0 0| 3 1 | 23 0
STEP-PARNTS
| 4 2| 54 2| 25 1| 6 2| 89 2 | 0 0| 0 0| 0 0| 0 0| 0 0 | 89 2
FOSTER HOME
| 4 2| 25 1| 32 2| 7 2| 68 1 | 0 0| 2 2| 0 0| 0 0| 2 1 | 70 1
GRAND PRNTS
| 13 7| 236 8| 134 7| 24 6| 407 7 | 0 0| 14 11| 3 4| 1 4| 18 8 | 425 7
OTHER
| 4 2| 61 2| 27 1| 4 1| 96 2 | 0 0| 4 3| 0 0| 0 0| 4 2 | 100 2
------------------------------------------------------------------------------------------------------------------------------------
Total reported
| 191 100| 2990 100| 2011 100| 391 100| 5583 100 | 9 100| 126 100| 80 100| 23 100| 238 100 | 5821 100
|
|
|
|
|
|
|
|
|
|
|
Percent reported |
98.5|
98.3|
97.9|
97.0|
98.1 | 100.0|
98.4|
97.6|
92.0|
97.5 |
98.0
|
|
|
|
|
|
|
|
|
|
|
|
|
|
|
|
|
|
|
|
|
|
NOT RPTD
| 3 | 52 | 44 | 12 | 111
|0|2|2|2|6
| 117
------------------------------------------------------------------------------------------------------------------------------------
Total
| 194 | 3042 | 2055 | 403 | 5694
| 9 | 128 | 82 | 25 | 244
| 5938
Page 11 Run 09/20/00
Georgia Department of Corrections Office of Planning and Analysis
Inmate statistical profile
Sample: ACTIVE PRISONERS SERVING LIFE EXCLUDING JAIL
Requestor: Statistics
Active inmates 09/20/2000
Self-Rpt Employment Status Before Prison by current age & sex
|
MEN
|
WOMEN
|
| Age | Age | Age | Age | Men
| Age | Age | Age | Age |Women
|Grand
Employment
|00-21 %|22-39 %|40-54 %|55-99 %|Total % |00-21 %|22-39 %|40-54 %|55-99 %|Total % |Total %
------------------------------------------------------------------------------------------------------------------------------------
FULL TIME
| 37 21| 968 34| 748 38| 157 42| 1910 35 | 0 0| 30 25| 14 18| 4 18| 48 21 | 1958 35
PART TIME
| 12 7| 226 8| 110 6| 18 5| 366 7 | 0 0| 6 5| 3 4| 0 0| 9 4 | 375 7
UNEMPL < 6M
| 10 6| 478 17| 330 17| 53 14| 871 16 | 0 0| 25 20| 19 24| 4 18| 48 21 | 919 16
UNEMPL > 6M
| 21 12| 920 32| 690 35| 110 30| 1741 32 | 2 22| 38 31| 35 44| 12 55| 87 38 | 1828 32
NEVER WORKD
| 76 42| 237 8| 21 1| 3 1| 337 6 | 4 44| 21 17| 4 5| 0 0| 29 13 | 366 7
STUDENT
| 22 12| 28 1| 6 0| 1 0| 57 1 | 3 33| 1 1| 2 3| 0 0| 6 3 | 63 1
INCAPABLE
| 1 1| 31 1| 53 3| 30 8| 115 2 | 0 0| 1 1| 2 3| 2 9| 5 2 | 120 2
OTHER
| 0 0| 0 0| 0 0| 0 0| 0 0 | 0 0| 0 0| 0 0| 0 0| 0 0 | 0 0
------------------------------------------------------------------------------------------------------------------------------------
Total reported
| 179 100| 2888 100| 1958 100| 372 100| 5397 100 | 9 100| 122 100| 79 100| 22 100| 232 100 | 5629 100
|
|
|
|
|
|
|
|
|
|
|
Percent reported |
92.3|
94.9|
95.3|
92.3|
94.8 | 100.0|
95.3|
96.3|
88.0|
95.1 |
94.8
|
|
|
|
|
|
|
|
|
|
|
|
|
|
|
|
|
|
|
|
|
|
NOT RPTD
| 15 | 154 | 97 | 31 | 297
| 0 | 6 | 3 | 3 | 12
| 309
------------------------------------------------------------------------------------------------------------------------------------
Total
| 194 | 3042 | 2055 | 403 | 5694
| 9 | 128 | 82 | 25 | 244
| 5938
* NOTE: THE FIELD LABELD "OTHER" WAS CORRECTED IN APRIL 1989; INMATES CODED "PRE-OTIS NOT REPORTED" NOW HAVE BEEN REMOVED FROM THIS FIELD AND IDENTIFIED AS "NOT REPORTED".
Page 12 Run 09/20/00
Georgia Department of Corrections Office of Planning and Analysis
Inmate statistical profile
Sample: ACTIVE PRISONERS SERVING LIFE EXCLUDING JAIL
Requestor: Statistics
Active inmates 09/20/2000
Self-Rpt Marital Status At Admission by current age & sex
|
MEN
|
WOMEN
|
| Age | Age | Age | Age | Men
| Age | Age | Age | Age |Women
|Grand
Marital Status
|00-21 %|22-39 %|40-54 %|55-99 %|Total % |00-21 %|22-39 %|40-54 %|55-99 %|Total % |Total %
------------------------------------------------------------------------------------------------------------------------------------
SINGLE
| 180 94| 2020 68| 688 34| 54 14| 2942 53 | 9 100| 71 56| 15 19| 3 13| 98 41 | 3040 52
MARRIED
| 2 1| 251 8| 381 19| 107 27| 741 13 | 0 0| 12 9| 17 21| 3 13| 32 13 | 773 13
SEPARATED
| 0 0| 109 4| 166 8| 40 10| 315 6 | 0 0| 12 9| 7 9| 2 9| 21 9 | 336 6
DIVORCED
| 1 1| 147 5| 356 18| 91 23| 595 11 | 0 0| 10 8| 15 19| 5 22| 30 13 | 625 11
WIDOWED
| 2 1| 37 1| 93 5| 54 14| 186 3 | 0 0| 6 5| 19 23| 9 39| 34 14 | 220 4
COMMON LAW
| 6 3| 424 14| 331 16| 47 12| 808 14 | 0 0| 16 13| 8 10| 1 4| 25 10 | 833 14
OTHER
| 0 0| 2 0| 1 0| 0 0| 3 0 | 0 0| 0 0| 0 0| 0 0| 0 0 | 3 0
------------------------------------------------------------------------------------------------------------------------------------
Total reported
| 191 100| 2990 100| 2016 100| 393 100| 5590 100 | 9 100| 127 100| 81 100| 23 100| 240 100 | 5830 100
|
|
|
|
|
|
|
|
|
|
|
Percent reported |
98.5|
98.3|
98.1|
97.5|
98.2 | 100.0|
99.2|
98.8|
92.0|
98.4 |
98.2
|
|
|
|
|
|
|
|
|
|
|
|
|
|
|
|
|
|
|
|
|
|
NOT RPTD
| 3 | 52 | 39 | 10 | 104
|0|1|1|2|4
| 108
------------------------------------------------------------------------------------------------------------------------------------
Total
| 194 | 3042 | 2055 | 403 | 5694
| 9 | 128 | 82 | 25 | 244
| 5938
Page 13 Run 09/20/00
Georgia Department of Corrections Office of Planning and Analysis
Inmate statistical profile
Sample: ACTIVE PRISONERS SERVING LIFE EXCLUDING JAIL
Requestor: Statistics
Active inmates 09/20/2000
Self-Rpt Number Of Children At Admission by current age & sex
|
MEN
|
WOMEN
|
| Age | Age | Age | Age | Men
| Age | Age | Age | Age |Women
|Grand
Number Of Children |00-21 %|22-39 %|40-54 %|55-99 %|Total % |00-21 %|22-39 %|40-54 %|55-99 %|Total % |Total %
------------------------------------------------------------------------------------------------------------------------------------
NO CHILDREN
| 0 0| 454 22| 263 17| 37 11| 754 19 | 0 0| 3 3| 3 4| 1 4| 7 4 | 761 18
ONE CHILD
| 43 73| 754 37| 471 30| 59 17| 1327 33 | 0 0| 31 31| 14 19| 1 4| 46 24 | 1373 33
TWO CHILDREN
| 13 22| 425 21| 366 23| 77 22| 881 22 | 0 0| 33 33| 23 32| 8 35| 64 33 | 945 22
THREE CHILDREN
| 2 3| 242 12| 235 15| 67 19| 546 14 | 0 0| 19 19| 14 19| 7 30| 40 21 | 586 14
FOUR CHILDREN
| 0 0| 85 4| 118 7| 43 13| 246 6 | 0 0| 7 7| 11 15| 4 17| 22 11 | 268 6
FIVE CHILDREN
| 1 2| 31 2| 69 4| 22 6| 123 3 | 0 0| 4 4| 3 4| 1 4| 8 4 | 131 3
MORE THAN 5 CHILDREN| 0 0| 36 2| 59 4| 39 11| 134 3 | 0 0| 2 2| 5 7| 1 4| 8 4 | 142 3
------------------------------------------------------------------------------------------------------------------------------------
Total reported
| 59 100| 2027 100| 1581 100| 344 100| 4011 100 | 0 0| 99 100| 73 100| 23 100| 195 100 | 4206 100
|
|
|
|
|
|
|
|
|
|
|
Percent reported |
30.4|
66.6|
76.9|
85.4|
70.4 |
.0|
77.3|
89.0|
92.0|
79.9 |
70.8
|
|
|
|
|
|
|
|
|
|
|
|
|
|
|
|
|
|
|
|
|
|
NOT REPORTED
| 135 | 1015 | 474 | 59 | 1683
| 9 | 29 | 9 | 2 | 49
| 1732
------------------------------------------------------------------------------------------------------------------------------------
Total
| 194 | 3042 | 2055 | 403 | 5694
| 9 | 128 | 82 | 25 | 244
| 5938
|
|
|
|
|
|
|
|
|
|
|
|
|
|
|
|
|
|
|
|
|
|
|
|
|
|
|
|
|
|
|
|
|
|
|
|
|
|
|
|
|
|
|
|
|
|
|
|
|
|
|
|
|
|
|
AVG NUM CHILDREN | 1.36 | 1.61 | 2.07 | 2.85 | 1.89 | .00 | 2.16 | 2.66 | 2.87 | 2.43 | 1.92
* NOTE: THE FIELD LABLED "NO CHILDREN" WAS CORRECTED IN MARCH 1989: MISSING DATA FOR INMATES STILL IN DIAGNOSTICS NOW HAS BEEN REMOVED FROM THIS FIELD AND IDENTIFIED AS "NOT REPORTED" INFORMATION.
Page 14 Run 09/20/00
Georgia Department of Corrections Office of Planning and Analysis
Inmate statistical profile
Sample: ACTIVE PRISONERS SERVING LIFE EXCLUDING JAIL
Requestor: Statistics
Active inmates 09/20/2000
Self-Rpt Religious Affiliation by current age & sex
|
MEN
|
WOMEN
|
| Age | Age | Age | Age | Men
| Age | Age | Age | Age |Women
|Grand
Religion
|00-21 %|22-39 %|40-54 %|55-99 %|Total % |00-21 %|22-39 %|40-54 %|55-99 %|Total % |Total %
------------------------------------------------------------------------------------------------------------------------------------
ISLAM
| 2 1| 153 5| 69 4| 10 3| 234 4 | 0 0| 1 1| 0 0| 0 0| 1 0 | 235 4
CATHOLIC
| 4 2| 90 3| 62 3| 19 5| 175 3 | 0 0| 7 6| 3 4| 1 5| 11 5 | 186 3
BAPTIST
| 93 49| 1481 52| 1179 63| 218 58| 2971 56 | 4 44| 68 56| 43 54| 15 68| 130 56 | 3101 56
METHODIST
| 3 2| 73 3| 84 4| 25 7| 185 3 | 0 0| 6 5| 7 9| 1 5| 14 6 | 199 4
EPISCOPLN
| 1 1| 4 0| 4 0| 3 1| 12 0 | 0 0| 1 1| 2 3| 0 0| 3 1 | 15 0
PRESBYTRN
| 0 0| 7 0| 8 0| 3 1| 18 0 | 0 0| 0 0| 0 0| 2 9| 2 1 | 20 0
CHC OF GOD
| 0 0| 32 1| 24 1| 9 2| 65 1 | 0 0| 4 3| 1 1| 0 0| 5 2 | 70 1
HOLINESS
| 7 4| 135 5| 89 5| 24 6| 255 5 | 2 22| 15 12| 11 14| 0 0| 28 12 | 283 5
JEWISH
| 0 0| 1 0| 3 0| 1 0| 5 0 | 0 0| 0 0| 0 0| 0 0| 0 0 | 5 0
ANGLICAN
| 0 0| 0 0| 0 0| 0 0| 0 0 | 0 0| 1 1| 0 0| 0 0| 1 0 | 1 0
GRK ORTHDX
| 0 0| 0 0| 0 0| 0 0| 0 0 | 0 0| 0 0| 0 0| 0 0| 0 0 | 0 0
HINDU
| 0 0| 0 0| 0 0| 0 0| 0 0 | 0 0| 0 0| 0 0| 0 0| 0 0 | 0 0
BUDDHIST
| 2 1| 3 0| 1 0| 0 0| 6 0 | 0 0| 0 0| 0 0| 0 0| 0 0 | 6 0
TAOIST
| 0 0| 0 0| 0 0| 0 0| 0 0 | 0 0| 0 0| 0 0| 0 0| 0 0 | 0 0
SHINTOIST
| 0 0| 0 0| 0 0| 0 0| 0 0 | 0 0| 0 0| 0 0| 0 0| 0 0 | 0 0
SEVEN D AD
| 0 0| 5 0| 4 0| 1 0| 10 0 | 0 0| 0 0| 0 0| 0 0| 0 0 | 10 0
JEHOVAH WT
| 1 1| 25 1| 11 1| 0 0| 37 1 | 0 0| 0 0| 0 0| 0 0| 0 0 | 37 1
LATR DAY S
| 0 0| 3 0| 0 0| 0 0| 3 0 | 0 0| 0 0| 0 0| 0 0| 0 0 | 3 0
QUAKER
| 0 0| 0 0| 0 0| 0 0| 0 0 | 0 0| 0 0| 0 0| 0 0| 0 0 | 0 0
OTHER PROD
| 14 7| 213 7| 61 3| 16 4| 304 6 | 0 0| 7 6| 6 8| 1 5| 14 6 | 318 6
NONE
| 46 24| 427 15| 139 7| 12 3| 624 12 | 1 11| 5 4| 1 1| 0 0| 7 3 | 631 11
OTHER
| 15 8| 208 7| 142 8| 33 9| 398 8 | 2 22| 7 6| 5 6| 2 9| 16 7 | 414 7
------------------------------------------------------------------------------------------------------------------------------------
Total reported
| 188 100| 2860 100| 1880 100| 374 100| 5302 100 | 9 100| 122 100| 79 100| 22 100| 232 100 | 5534 100
|
|
|
|
|
|
|
|
|
|
|
Percent reported |
96.9|
94.0|
91.5|
92.8|
93.1 | 100.0|
95.3|
96.3|
88.0|
95.1 |
93.2
|
|
|
|
|
|
|
|
|
|
|
|
|
|
|
|
|
|
|
|
|
|
NOT RPTD
| 6 | 182 | 175 | 29 | 392
| 0 | 6 | 3 | 3 | 12
| 404
------------------------------------------------------------------------------------------------------------------------------------
Total
| 194 | 3042 | 2055 | 403 | 5694
| 9 | 128 | 82 | 25 | 244
| 5938
Page 15 Run 09/20/00
Georgia Department of Corrections Office of Planning and Analysis
Inmate statistical profile
Sample: ACTIVE PRISONERS SERVING LIFE EXCLUDING JAIL
Requestor: Statistics
Active inmates 09/20/2000
Self-Rpt Family Behavior Patterns * by current age & sex
|
MEN
|
WOMEN
|
| Age | Age | Age | Age | Men
| Age | Age | Age | Age |Women
|Grand
Family Behavior
|00-21 %|22-39 %|40-54 %|55-99 %|Total % |00-21 %|22-39 %|40-54 %|55-99 %|Total % |Total %
------------------------------------------------------------------------------------------------------------------------------------
CRIMINLTY
| 50 20| 798 24| 515 29| 68 24| 1431 26 | 4 15| 35 18| 18 23| 2 13| 59 19 | 1490 25
ALCOHOLISM
| 17 7| 331 10| 277 16| 45 16| 670 12 | 3 12| 28 15| 15 19| 1 6| 47 15 | 717 12
DRUG ABUSE
| 18 7| 170 5| 66 4| 6 2| 260 5 | 2 8| 17 9| 6 8| 0 0| 25 8 | 285 5
DOMINERING
| 1 0| 13 0| 12 1| 0 0| 26 0 | 5 19| 12 6| 5 6| 2 13| 24 8 | 50 1
MIGRANT
| 1 0| 49 1| 42 2| 0 0| 92 2 | 1 4| 2 1| 2 3| 0 0| 5 2 | 97 2
INFL BTGS
| 7 3| 138 4| 69 4| 15 5| 229 4 | 2 8| 21 11| 5 6| 2 13| 30 10 | 259 4
PERMISSIVE
| 0 0| 8 0| 14 1| 2 1| 24 0 | 1 4| 4 2| 2 3| 0 0| 7 2 | 31 1
FATH ABSNT
| 113 46| 1458 44| 629 35| 117 41| 2317 41 | 5 19| 48 25| 16 21| 7 44| 76 25 | 2393 40
MOTH ABSNT
| 31 13| 297 9| 139 8| 31 11| 498 9 | 1 4| 15 8| 2 3| 1 6| 19 6 | 517 9
NONE
| 6 2| 37 1| 14 1| 0 0| 57 1 | 2 8| 8 4| 7 9| 1 6| 18 6 | 75 1
------------------------------------------------------------------------------------------------------------------------------------
Total reported
| 244 100| 3299 100| 1777 100| 284 100| 5604 100 | 26 100| 190 100| 78 100| 16 100| 310 100 | 5914 100
|
|
|
|
|
|
|
|
|
|
|
Percent reported |
76.8|
69.2|
60.2|
49.6|
64.8 | 100.0|
68.8|
59.8|
44.0|
64.3 |
64.8
|
|
|
|
|
|
|
|
|
|
|
|
|
|
|
|
|
|
|
|
|
|
OTHER
| 45 | 937 | 817 | 203 | 2002
| 0 | 40 | 33 | 14 | 87
| 2089
------------------------------------------------------------------------------------------------------------------------------------
Total
| 194 | 3042 | 2055 | 403 | 5694
| 9 | 128 | 82 | 25 | 244
| 5938
* NOTE: SINCE THERE CAN BE UP TO FIVE BEHAVIOR CODES PER INMATE, THE NUMBER OF CASES REPORTED IN THE DETAIL LINES AND THE TOTAL REPORTED LINE MAY EXCEED THE TOTAL NUMBER OF CASES. IN SHORT, THIS TABLE COUNTS THE NUMBER OF BEHAVIOR PROBLEMS, NOT INMATES.
Page 16 Run 09/20/00
Georgia Department of Corrections Office of Planning and Analysis
Inmate statistical profile
Sample: ACTIVE PRISONERS SERVING LIFE EXCLUDING JAIL
Requestor: Statistics
Active inmates 09/20/2000
Inmate Diagnostic Behavior Problem * by current age & sex
|
MEN
|
WOMEN
|
| Age | Age | Age | Age | Men
| Age | Age | Age | Age |Women
|Grand
Diagnostic Problem |00-21 %|22-39 %|40-54 %|55-99 %|Total % |00-21 %|22-39 %|40-54 %|55-99 %|Total % |Total %
------------------------------------------------------------------------------------------------------------------------------------
ALCOHOLIC
| 0 0| 139 3| 140 4| 38 6| 317 3 | 1 4| 3 1| 13 9| 1 3| 18 4 | 335 3
ALCOH ABSE
| 39 10| 898 17| 627 17| 112 18| 1676 17 | 1 4| 30 14| 16 12| 6 18| 53 13 | 1729 17
DRUG EXP
| 69 19| 761 14| 351 10| 36 6| 1217 12 | 3 13| 22 10| 14 10| 0 0| 39 10 | 1256 12
DRUG ABSE
| 68 18| 972 18| 638 18| 39 6| 1717 17 | 4 17| 42 20| 24 17| 1 3| 71 17 | 1788 17
NARC ADDCT
| 1 0| 103 2| 92 3| 5 1| 201 2 | 0 0| 4 2| 2 1| 1 3| 7 2 | 208 2
EPILEPTIC
| 1 0| 25 0| 26 1| 4 1| 56 1 | 0 0| 0 0| 2 1| 0 0| 2 0 | 58 1
MANIPULTVE
| 23 6| 226 4| 104 3| 18 3| 371 4 | 1 4| 2 1| 0 0| 1 3| 4 1 | 375 4
ASSAULTIVE
| 128 34| 1309 24| 915 25| 167 27| 2519 25 | 7 29| 52 25| 29 21| 6 18| 94 23 | 2613 25
ESCPE TEND
| 4 1| 115 2| 211 6| 40 7| 370 4 | 0 0| 2 1| 4 3| 0 0| 6 1 | 376 4
SUICIDAL
| 12 3| 141 3| 104 3| 15 2| 272 3 | 4 17| 16 8| 7 5| 2 6| 29 7 | 301 3
WITHDRAWN
| 0 0| 35 1| 19 1| 7 1| 61 1 | 1 4| 2 1| 3 2| 0 0| 6 1 | 67 1
PR RLTY CT
| 1 0| 35 1| 48 1| 12 2| 96 1 | 1 4| 2 1| 2 1| 1 3| 6 1 | 102 1
HOMOSEXUAL
| 2 1| 12 0| 9 0| 5 1| 28 0 | 1 4| 4 2| 2 1| 0 0| 7 2 | 35 0
NONE
| 1 0| 306 6| 233 6| 69 11| 609 6 | 0 0| 12 6| 14 10| 9 27| 35 9 | 644 6
OTHER
| 5 1| 74 1| 58 2| 22 4| 159 2 | 0 0| 0 0| 0 0| 3 9| 3 1 | 162 2
NOT RPTD
| 18 5| 191 4| 65 2| 24 4| 298 3 | 0 0| 18 9| 6 4| 2 6| 26 6 | 324 3
------------------------------------------------------------------------------------------------------------------------------------
Total reported
| 372 100| 5351 100| 3641 100| 614 100| 9978 100 | 24 100| 211 100| 139 100| 33 100| 407 100 |10385 100
|
|
|
|
|
|
|
|
|
|
|
Percent reported | 100.0|
99.7| 100.0|
99.8|
99.8 | 100.0| 100.0|
98.8| 100.0|
99.6 |
99.8
|
|
|
|
|
|
|
|
|
|
|
|
|
|
|
|
|
|
|
|
|
|
UNKNOWN
| 0 | 9 | 1 | 1 | 11
|0|0|1|0|1
| 12
------------------------------------------------------------------------------------------------------------------------------------
Total
| 194 | 3042 | 2055 | 403 | 5694
| 9 | 128 | 82 | 25 | 244
| 5938
* NOTE: SINCE THERE CAN BE UP TO FIVE BEHAVIOR CODES PER INMATE, THE NUMBER OF CASES REPORTED IN THE DETAIL LINES AND THE TOTAL REPORTED LINE MAY EXCEED THE TOTAL NUMBER OF CASES. IN SHORT, THIS TABLE COUNTS THE NUMBER OF BEHAVIOR PROBLEMS, NOT INMATES.
Page 17 Run 09/20/00
Georgia Department of Corrections Office of Planning and Analysis
Inmate statistical profile
Sample: ACTIVE PRISONERS SERVING LIFE EXCLUDING JAIL
Requestor: Statistics
Active inmates 09/20/2000
Physical Profile (General Condition) by current age & sex
|
MEN
|
WOMEN
|
| Age | Age | Age | Age | Men
| Age | Age | Age | Age |Women
|Grand
Physical Profile |00-21 %|22-39 %|40-54 %|55-99 %|Total % |00-21 %|22-39 %|40-54 %|55-99 %|Total % |Total %
------------------------------------------------------------------------------------------------------------------------------------
NO LIMITATION
| 169 89| 2231 74| 1019 50| 74 19| 3493 62 | 8 89| 93 75| 39 48| 1 5| 141 60 | 3634 62
DEFECT NO MAJOR LIMT| 14 7| 413 14| 459 22| 97 24| 983 17 | 0 0| 5 4| 10 12| 5 23| 20 8 | 1003 17
DEFECT MAJOR LIMIT | 7 4| 357 12| 550 27| 199 50| 1113 20 | 1 11| 26 21| 31 38| 14 64| 72 31 | 1185 20
VERY MAJOR DEFECT | 0 0| 3 0| 13 1| 29 7| 45 1 | 0 0| 0 0| 1 1| 2 9| 3 1 | 48 1
------------------------------------------------------------------------------------------------------------------------------------
Total reported
| 190 100| 3004 100| 2041 100| 399 100| 5634 100 | 9 100| 124 100| 81 100| 22 100| 236 100 | 5870 100
|
|
|
|
|
|
|
|
|
|
|
Percent reported |
97.9|
98.8|
99.3|
99.0|
98.9 | 100.0|
96.9|
98.8|
88.0|
96.7 |
98.9
|
|
|
|
|
|
|
|
|
|
|
|
|
|
|
|
|
|
|
|
|
|
NOT REPORTED
| 4 | 38 | 14 | 4 | 60
|0|4|1|3|8
| 68
------------------------------------------------------------------------------------------------------------------------------------
Total
| 194 | 3042 | 2055 | 403 | 5694
| 9 | 128 | 82 | 25 | 244
| 5938
Page 18 Run 09/20/00
Georgia Department of Corrections Office of Planning and Analysis
Inmate statistical profile
Sample: ACTIVE PRISONERS SERVING LIFE EXCLUDING JAIL
Requestor: Statistics
Active inmates 09/20/2000
Security Status by current age & sex
|
MEN
|
WOMEN
|
| Age | Age | Age | Age | Men
| Age | Age | Age | Age |Women
|Grand
Security
|00-21 %|22-39 %|40-54 %|55-99 %|Total % |00-21 %|22-39 %|40-54 %|55-99 %|Total % |Total %
------------------------------------------------------------------------------------------------------------------------------------
DIAG INCOM
| 0 0| 7 0| 2 0| 0 0| 9 0 | 0 0| 0 0| 0 0| 0 0| 0 0 | 9 0
WRK RELEAS
| 0 0| 0 0| 0 0| 1 0| 1 0 | 0 0| 0 0| 0 0| 0 0| 0 0 | 1 0
TRUSTY
| 0 0| 66 2| 41 2| 4 1| 111 2 | 0 0| 1 1| 3 4| 1 4| 5 2 | 116 2
MINIMUM
| 0 0| 376 12| 440 21| 79 20| 895 16 | 0 0| 30 23| 26 32| 12 48| 68 28 | 963 16
MEDIUM
| 21 11| 1263 42| 1071 52| 246 61| 2601 46 | 0 0| 63 49| 40 49| 11 44| 114 47 | 2715 46
CLOSE
| 162 84| 1134 37| 398 19| 65 16| 1759 31 | 8 89| 34 27| 10 12| 1 4| 53 22 | 1812 31
MAXIMUM
| 6 3| 175 6| 96 5| 7 2| 284 5 | 1 11| 0 0| 2 2| 0 0| 3 1 | 287 5
DIAGNOSTIC
| 5 3| 21 1| 7 0| 1 0| 34 1 | 0 0| 0 0| 1 1| 0 0| 1 0 | 35 1
------------------------------------------------------------------------------------------------------------------------------------
Total reported
| 194 100| 3042 100| 2055 100| 403 100| 5694 100 | 9 100| 128 100| 82 100| 25 100| 244 100 | 5938 100
|
|
|
|
|
|
|
|
|
|
|
Percent reported | 100.0| 100.0| 100.0| 100.0| 100.0 | 100.0| 100.0| 100.0| 100.0| 100.0 | 100.0
|
|
|
|
|
|
|
|
|
|
|
|
|
|
|
|
|
|
|
|
|
|
NOT RPTD
|0|0|0|0|0
|0|0|0|0|0
|0
------------------------------------------------------------------------------------------------------------------------------------
Total
| 194 | 3042 | 2055 | 403 | 5694
| 9 | 128 | 82 | 25 | 244
| 5938
* NOTE: BEGINNING IN JULY 1987, THE FACILITIES DIVISION NO LONGER CODED INMATES AS BEING WORK RELEASE
Page 19 Run 09/20/00
Georgia Department of Corrections Office of Planning and Analysis
Inmate statistical profile
Sample: ACTIVE PRISONERS SERVING LIFE EXCLUDING JAIL
Requestor: Statistics
Active inmates 09/20/2000
Number Of Sentences by current age & sex
|
MEN
|
WOMEN
|
| Age | Age | Age | Age | Men
| Age | Age | Age | Age |Women
|Grand
Number Of Sentences |00-21 %|22-39 %|40-54 %|55-99 %|Total % |00-21 %|22-39 %|40-54 %|55-99 %|Total % |Total %
------------------------------------------------------------------------------------------------------------------------------------
ONE
| 60 31| 737 24| 538 26| 139 34| 1474 26 | 4 44| 50 39| 36 44| 12 48| 102 42 | 1576 27
TWO
| 53 27| 718 24| 470 23| 105 26| 1346 24 | 2 22| 40 31| 23 28| 8 32| 73 30 | 1419 24
THREE
| 30 15| 514 17| 371 18| 54 13| 969 17 | 1 11| 19 15| 10 12| 5 20| 35 14 | 1004 17
FOUR
| 20 10| 354 12| 228 11| 38 9| 640 11 | 1 11| 9 7| 4 5| 0 0| 14 6 | 654 11
FIVE
| 7 4| 227 7| 146 7| 20 5| 400 7 | 1 11| 5 4| 3 4| 0 0| 9 4 | 409 7
MORE THAN FIVE
| 24 12| 492 16| 302 15| 47 12| 865 15 | 0 0| 5 4| 6 7| 0 0| 11 5 | 876 15
------------------------------------------------------------------------------------------------------------------------------------
Total reported
| 194 100| 3042 100| 2055 100| 403 100| 5694 100 | 9 100| 128 100| 82 100| 25 100| 244 100 | 5938 100
|
|
|
|
|
|
|
|
|
|
|
Percent reported | 100.0| 100.0| 100.0| 100.0| 100.0 | 100.0| 100.0| 100.0| 100.0| 100.0 | 100.0
|
|
|
|
|
|
|
|
|
|
|
|
|
|
|
|
|
|
|
|
|
|
NOT REPORTED
|0|0|0|0|0
|0|0|0|0|0
|0
------------------------------------------------------------------------------------------------------------------------------------
Total
| 194 | 3042 | 2055 | 403 | 5694
| 9 | 128 | 82 | 25 | 244
| 5938
|
|
|
|
|
|
|
|
|
|
|
|
|
|
|
|
|
|
|
|
|
|
|
|
|
|
|
|
|
|
|
|
|
|
|
|
|
|
|
|
|
|
|
|
|
|
|
|
|
|
|
|
|
|
|
AVG NUM SENTENCES | 2.87 | 3.41 | 3.31 | 2.88 | 3.32 | 2.22 | 2.29 | 2.29 | 1.72 | 2.23 | 3.27
Page 20 Run 09/20/00
Georgia Department of Corrections Office of Planning and Analysis
Inmate statistical profile
Sample: ACTIVE PRISONERS SERVING LIFE EXCLUDING JAIL
Requestor: Statistics
Active inmates 09/20/2000
Number Of Disciplinaries by current age & sex
|
MEN
|
WOMEN
|
| Age | Age | Age | Age | Men
| Age | Age | Age | Age |Women
|Grand
Disciplinaries
|00-21 %|22-39 %|40-54 %|55-99 %|Total % |00-21 %|22-39 %|40-54 %|55-99 %|Total % |Total %
------------------------------------------------------------------------------------------------------------------------------------
ZERO
| 43 22| 484 16| 346 17| 118 29| 991 17 | 2 22| 28 22| 30 37| 12 48| 72 30 | 1063 18
ONE
| 21 11| 313 10| 269 13| 65 16| 668 12 | 1 11| 13 10| 10 12| 6 24| 30 12 | 698 12
TWO
| 16 8| 250 8| 191 9| 41 10| 498 9 | 0 0| 14 11| 10 12| 1 4| 25 10 | 523 9
THREE
| 13 7| 192 6| 145 7| 39 10| 389 7 | 0 0| 9 7| 9 11| 2 8| 20 8 | 409 7
FOUR
| 6 3| 174 6| 117 6| 25 6| 322 6 | 1 11| 9 7| 2 2| 1 4| 13 5 | 335 6
FIVE
| 6 3| 151 5| 90 4| 13 3| 260 5 | 1 11| 2 2| 3 4| 1 4| 7 3 | 267 4
MORE THAN FIVE
| 89 46| 1476 49| 896 44| 102 25| 2563 45 | 4 44| 53 41| 18 22| 2 8| 77 32 | 2640 44
------------------------------------------------------------------------------------------------------------------------------------
Total reported
| 194 100| 3040 100| 2054 100| 403 100| 5691 100 | 9 100| 128 100| 82 100| 25 100| 244 100 | 5935 100
|
|
|
|
|
|
|
|
|
|
|
Percent reported | 100.0|
99.9| 100.0| 100.0|
99.9 | 100.0| 100.0| 100.0| 100.0| 100.0 |
99.9
|
|
|
|
|
|
|
|
|
|
|
|
|
|
|
|
|
|
|
|
|
|
NOT REPORTED
|0|2|1|0|3
|0|0|0|0|0
|3
------------------------------------------------------------------------------------------------------------------------------------
Total
| 194 | 3042 | 2055 | 403 | 5694
| 9 | 128 | 82 | 25 | 244
| 5938
|
|
|
|
|
|
|
|
|
|
|
|
|
|
|
|
|
|
|
|
|
|
|
|
|
|
|
|
|
|
|
|
|
|
|
|
|
|
|
|
|
|
|
|
|
|
|
|
|
|
|
|
|
|
|
AVG NUM DISCIP
| 10.06 | 10.42 | 9.90 | 5.27 | 9.85 | 5.11 | 7.85 | 4.56 | 1.60 | 6.00 | 9.69
Page 21 Run 09/20/00
Georgia Department of Corrections Office of Planning and Analysis
Inmate statistical profile
Sample: ACTIVE PRISONERS SERVING LIFE EXCLUDING JAIL
Requestor: Statistics
Active inmates 09/20/2000
Number Of Escapes by current age & sex
|
MEN
|
WOMEN
|
| Age | Age | Age | Age | Men
| Age | Age | Age | Age |Women
|Grand
Escapes
|00-21 %|22-39 %|40-54 %|55-99 %|Total % |00-21 %|22-39 %|40-54 %|55-99 %|Total % |Total %
------------------------------------------------------------------------------------------------------------------------------------
ZERO
| 194 100| 3007 99| 1967 96| 386 96| 5554 98 | 9 100| 128 100| 80 98| 25 100| 242 99 | 5796 98
ONE
| 0 0| 34 1| 70 3| 11 3| 115 2 | 0 0| 0 0| 2 2| 0 0| 2 1 | 117 2
TWO
| 0 0| 1 0| 14 1| 4 1| 19 0 | 0 0| 0 0| 0 0| 0 0| 0 0 | 19 0
THREE
| 0 0| 0 0| 3 0| 2 0| 5 0 | 0 0| 0 0| 0 0| 0 0| 0 0 | 5 0
FOUR
| 0 0| 0 0| 1 0| 0 0| 1 0 | 0 0| 0 0| 0 0| 0 0| 0 0 | 1 0
FIVE
| 0 0| 0 0| 0 0| 0 0| 0 0 | 0 0| 0 0| 0 0| 0 0| 0 0 | 0 0
MORE THAN FIVE
| 0 0| 0 0| 0 0| 0 0| 0 0 | 0 0| 0 0| 0 0| 0 0| 0 0 | 0 0
------------------------------------------------------------------------------------------------------------------------------------
Total reported
| 194 100| 3042 100| 2055 100| 403 100| 5694 100 | 9 100| 128 100| 82 100| 25 100| 244 100 | 5938 100
|
|
|
|
|
|
|
|
|
|
|
Percent reported | 100.0| 100.0| 100.0| 100.0| 100.0 | 100.0| 100.0| 100.0| 100.0| 100.0 | 100.0
|
|
|
|
|
|
|
|
|
|
|
|
|
|
|
|
|
|
|
|
|
|
NOT REPORTED
|0|0|0|0|0
|0|0|0|0|0
|0
------------------------------------------------------------------------------------------------------------------------------------
Total
| 194 | 3042 | 2055 | 403 | 5694
| 9 | 128 | 82 | 25 | 244
| 5938
|
|
|
|
|
|
|
|
|
|
|
|
|
|
|
|
|
|
|
|
|
|
|
|
|
|
|
|
|
|
|
|
|
|
|
|
|
|
|
|
|
|
|
|
|
|
|
|
|
|
|
|
|
|
|
AVG NUM ESCAPES
| .00 | .01 | .05 | .06 | .03 | .00 | .00 | .02 | .00 | .01 | .03
Page 22 Run 09/20/00
Georgia Department of Corrections Office of Planning and Analysis
Inmate statistical profile
Sample: ACTIVE PRISONERS SERVING LIFE EXCLUDING JAIL
Requestor: Statistics
Active inmates 09/20/2000
Number Of Prior Georgia Incarcerations * by current age & sex
|
MEN
|
WOMEN
|
| Age | Age | Age | Age | Men
| Age | Age | Age | Age |Women
|Grand
Prior Incarcerations|00-21 %|22-39 %|40-54 %|55-99 %|Total % |00-21 %|22-39 %|40-54 %|55-99 %|Total % |Total %
------------------------------------------------------------------------------------------------------------------------------------
ZERO
| 189 97| 2038 67| 925 45| 225 56| 3377 59 | 9 100| 108 84| 63 77| 23 92| 203 83 | 3580 60
ONE
| 5 3| 581 19| 515 25| 93 23| 1194 21 | 0 0| 15 12| 12 15| 1 4| 28 11 | 1222 21
TWO
| 0 0| 233 8| 324 16| 42 10| 599 11 | 0 0| 3 2| 6 7| 1 4| 10 4 | 609 10
THREE
| 0 0| 129 4| 166 8| 29 7| 324 6 | 0 0| 2 2| 0 0| 0 0| 2 1 | 326 5
FOUR
| 0 0| 46 2| 74 4| 10 2| 130 2 | 0 0| 0 0| 0 0| 0 0| 0 0 | 130 2
FIVE
| 0 0| 12 0| 31 2| 2 0| 45 1 | 0 0| 0 0| 0 0| 0 0| 0 0 | 45 1
MORE THAN FIVE
| 0 0| 3 0| 20 1| 2 0| 25 0 | 0 0| 0 0| 1 1| 0 0| 1 0 | 26 0
------------------------------------------------------------------------------------------------------------------------------------
Total reported
| 194 100| 3042 100| 2055 100| 403 100| 5694 100 | 9 100| 128 100| 82 100| 25 100| 244 100 | 5938 100
|
|
|
|
|
|
|
|
|
|
|
Percent reported | 100.0| 100.0| 100.0| 100.0| 100.0 | 100.0| 100.0| 100.0| 100.0| 100.0 | 100.0
|
|
|
|
|
|
|
|
|
|
|
|
|
|
|
|
|
|
|
|
|
|
NOT REPORTED
|0|0|0|0|0
|0|0|0|0|0
|0
------------------------------------------------------------------------------------------------------------------------------------
Total
| 194 | 3042 | 2055 | 403 | 5694
| 9 | 128 | 82 | 25 | 244
| 5938
|
|
|
|
|
|
|
|
|
|
|
|
|
|
|
|
|
|
|
|
|
|
|
|
|
|
|
|
|
|
|
|
|
|
|
|
|
|
|
|
|
|
|
|
|
|
|
|
|
|
|
|
|
|
|
AVG # INCARCERATIONS| .03 | .56 | 1.09 | .81 | .75 | .00 | .21 | .38 | .12 | .25 | .73
* This data counts a parole revocation on an existing sentenCE AS A prior incarceration. Also, this data counts, for any cohort of inmates, the total number of Georgia incarcerations the inmate has had during his entire criminal career. For example, if an inmate was admitted to prison first in FY72, and then re-admitted in FY79 and FY85, he had two prior incarcerations before the FY85 admission. This inmate's records show two prior incarcerations in all three of his records since he has had two prior incarcerations in his criminal career. If the cohort of FY72 admissions is selected for analysis, two prior incarcerations will be listed for this inmate even though in FY72, he had no prior incarcerations.
Page 23 Run 09/20/00
Georgia Department of Corrections Office of Planning and Analysis
Inmate statistical profile
Sample: ACTIVE PRISONERS SERVING LIFE EXCLUDING JAIL
Requestor: Statistics
Active inmates 09/20/2000
Number Of Transfers by current age & sex
|
MEN
|
WOMEN
|
| Age | Age | Age | Age | Men
| Age | Age | Age | Age |Women
|Grand
Transfers
|00-21 %|22-39 %|40-54 %|55-99 %|Total % |00-21 %|22-39 %|40-54 %|55-99 %|Total % |Total %
------------------------------------------------------------------------------------------------------------------------------------
ZERO
| 59 30| 104 3| 20 1| 3 1| 186 3 | 1 11| 5 4| 6 7| 0 0| 12 5 | 198 3
ONE
| 85 44| 882 29| 404 20| 84 21| 1455 26 | 6 67| 38 30| 29 35| 5 20| 78 32 | 1533 26
TWO
| 37 19| 647 21| 353 17| 71 18| 1108 19 | 1 11| 42 33| 14 17| 5 20| 62 25 | 1170 20
THREE
| 10 5| 475 16| 288 14| 64 16| 837 15 | 1 11| 18 14| 15 18| 6 24| 40 16 | 877 15
FOUR
| 1 1| 335 11| 223 11| 40 10| 599 11 | 0 0| 14 11| 7 9| 3 12| 24 10 | 623 10
FIVE
| 2 1| 217 7| 163 8| 31 8| 413 7 | 0 0| 6 5| 3 4| 3 12| 12 5 | 425 7
MORE THAN FIVE
| 0 0| 382 13| 604 29| 110 27| 1096 19 | 0 0| 5 4| 8 10| 3 12| 16 7 | 1112 19
------------------------------------------------------------------------------------------------------------------------------------
Total reported
| 194 100| 3042 100| 2055 100| 403 100| 5694 100 | 9 100| 128 100| 82 100| 25 100| 244 100 | 5938 100
|
|
|
|
|
|
|
|
|
|
|
Percent reported | 100.0| 100.0| 100.0| 100.0| 100.0 | 100.0| 100.0| 100.0| 100.0| 100.0 | 100.0
|
|
|
|
|
|
|
|
|
|
|
|
|
|
|
|
|
|
|
|
|
|
NOT REPORTED
|0|0|0|0|0
|0|0|0|0|0
|0
------------------------------------------------------------------------------------------------------------------------------------
Total
| 194 | 3042 | 2055 | 403 | 5694
| 9 | 128 | 82 | 25 | 244
| 5938
|
|
|
|
|
|
|
|
|
|
|
|
|
|
|
|
|
|
|
|
|
|
|
|
|
|
|
|
|
|
|
|
|
|
|
|
|
|
|
|
|
|
|
|
|
|
|
|
|
|
|
|
|
|
|
AVG NUM TRANSFERS | 1.05 | 2.98 | 4.47 | 4.40 | 3.55 | 1.22 | 2.32 | 2.46 | 3.44 | 2.44 | 3.51
Page 24 Run 09/20/00
Georgia Department of Corrections Office of Planning and Analysis
Inmate statistical profile
Sample: ACTIVE PRISONERS SERVING LIFE EXCLUDING JAIL
Requestor: Statistics
Active inmates 09/20/2000
County Of Conviction by current age & sex
|
MEN
|
WOMEN
|
| Age | Age | Age | Age | Men
| Age | Age | Age | Age |Women
|Grand
County Of Conviction|00-21 %|22-39 %|40-54 %|55-99 %|Total % |00-21 %|22-39 %|40-54 %|55-99 %|Total % |Total %
------------------------------------------------------------------------------------------------------------------------------------
APPLING COUNTY
| 0 0| 4 0| 5 0| 0 0| 9 0 | 0 0| 0 0| 0 0| 0 0| 0 0 | 9 0
ATKINSON COUNTY
| 0 0| 1 0| 2 0| 2 0| 5 0 | 0 0| 0 0| 1 1| 0 0| 1 0 | 6 0
BACON COUNTY
| 0 0| 7 0| 3 0| 0 0| 10 0 | 0 0| 0 0| 0 0| 0 0| 0 0 | 10 0
BAKER COUNTY
| 0 0| 1 0| 1 0| 0 0| 2 0 | 0 0| 0 0| 0 0| 0 0| 0 0 | 2 0
BALDWIN COUNTY
| 2 1| 16 1| 11 1| 2 0| 31 1 | 0 0| 1 1| 0 0| 0 0| 1 0 | 32 1
BANKS COUNTY
| 0 0| 2 0| 8 0| 2 0| 12 0 | 0 0| 0 0| 0 0| 0 0| 0 0 | 12 0
BARROW COUNTY
| 0 0| 3 0| 9 0| 4 1| 16 0 | 0 0| 0 0| 1 1| 0 0| 1 0 | 17 0
BARTOW COUNTY
| 1 1| 29 1| 22 1| 3 1| 55 1 | 0 0| 2 2| 0 0| 0 0| 2 1 | 57 1
BEN HILL COUNTY
| 0 0| 7 0| 9 0| 3 1| 19 0 | 0 0| 0 0| 0 0| 0 0| 0 0 | 19 0
BERRIEN COUNTY
| 0 0| 4 0| 1 0| 0 0| 5 0 | 0 0| 0 0| 0 0| 0 0| 0 0 | 5 0
BIBB COUNTY
| 4 2| 90 3| 85 4| 15 4| 194 3 | 1 11| 2 2| 1 1| 1 4| 5 2 | 199 3
BLECKLEY COUNTY
| 0 0| 7 0| 4 0| 1 0| 12 0 | 0 0| 0 0| 1 1| 0 0| 1 0 | 13 0
BRANTLEY COUNTY
| 0 0| 1 0| 4 0| 2 0| 7 0 | 0 0| 0 0| 0 0| 0 0| 0 0 | 7 0
BROOKS COUNTY
| 0 0| 5 0| 4 0| 1 0| 10 0 | 0 0| 0 0| 0 0| 0 0| 0 0 | 10 0
BRYAN COUNTY
| 0 0| 9 0| 6 0| 1 0| 16 0 | 0 0| 0 0| 0 0| 1 4| 1 0 | 17 0
BULLOCH COUNTY
| 1 1| 19 1| 16 1| 0 0| 36 1 | 0 0| 1 1| 1 1| 1 4| 3 1 | 39 1
BURKE COUNTY
| 1 1| 16 1| 12 1| 1 0| 30 1 | 0 0| 0 0| 0 0| 0 0| 0 0 | 30 1
BUTTS COUNTY
| 2 1| 22 1| 11 1| 2 0| 37 1 | 0 0| 2 2| 1 1| 0 0| 3 1 | 40 1
CALHOUN COUNTY
| 1 1| 2 0| 3 0| 1 0| 7 0 | 0 0| 0 0| 0 0| 0 0| 0 0 | 7 0
CAMDEN COUNTY
| 1 1| 22 1| 7 0| 0 0| 30 1 | 0 0| 0 0| 1 1| 0 0| 1 0 | 31 1
CANDLER COUNTY
| 0 0| 1 0| 1 0| 0 0| 2 0 | 0 0| 0 0| 0 0| 0 0| 0 0 | 2 0
CARROLL COUNTY
| 1 1| 17 1| 13 1| 6 1| 37 1 | 0 0| 2 2| 1 1| 0 0| 3 1 | 40 1
CATOOSA COUNTY
| 0 0| 5 0| 8 0| 0 0| 13 0 | 0 0| 0 0| 0 0| 0 0| 0 0 | 13 0
CHARLTON COUNTY
| 0 0| 1 0| 0 0| 0 0| 1 0 | 0 0| 2 2| 0 0| 0 0| 2 1 | 3 0
CHATHAM COUNTY
| 6 3| 162 5| 104 5| 14 3| 286 5 | 0 0| 2 2| 1 1| 0 0| 3 1 | 289 5
CHATTAHOOCHEE COUNTY| 0 0| 0 0| 2 0| 0 0| 2 0 | 0 0| 0 0| 0 0| 0 0| 0 0 | 2 0
CHATTOOGA COUNTY | 0 0| 5 0| 6 0| 1 0| 12 0 | 0 0| 0 0| 1 1| 1 4| 2 1 | 14 0
CHEROKEE COUNTY
| 2 1| 8 0| 21 1| 2 0| 33 1 | 0 0| 3 2| 0 0| 0 0| 3 1 | 36 1
CLARKE COUNTY
| 1 1| 42 1| 23 1| 8 2| 74 1 | 0 0| 2 2| 0 0| 1 4| 3 1 | 77 1
CLAY COUNTY
| 0 0| 1 0| 1 0| 0 0| 2 0 | 0 0| 0 0| 0 0| 0 0| 0 0 | 2 0
CLAYTON COUNTY
| 5 3| 71 2| 37 2| 10 2| 123 2 | 0 0| 2 2| 3 4| 0 0| 5 2 | 128 2
CLINCH COUNTY
| 0 0| 1 0| 4 0| 0 0| 5 0 | 0 0| 0 0| 0 0| 0 0| 0 0 | 5 0
COBB COUNTY
| 8 4| 110 4| 75 4| 13 3| 206 4 | 0 0| 6 5| 3 4| 1 4| 10 4 | 216 4
COFFEE COUNTY
| 0 0| 8 0| 10 0| 3 1| 21 0 | 0 0| 1 1| 1 1| 0 0| 2 1 | 23 0
COLQUITT COUNTY
| 3 2| 39 1| 23 1| 3 1| 68 1 | 0 0| 0 0| 1 1| 1 4| 2 1 | 70 1
COLUMBIA COUNTY
| 0 0| 6 0| 9 0| 2 0| 17 0 | 0 0| 0 0| 1 1| 0 0| 1 0 | 18 0
------------------------------------------------------------------------------------------------------------------------------------
(continued)
Page 25 Run 09/20/00
Georgia Department of Corrections Office of Planning and Analysis
Inmate statistical profile
Sample: ACTIVE PRISONERS SERVING LIFE EXCLUDING JAIL
Requestor:
Active inmates 09/20/2000
County Of Conviction by current age & sex
Statistics (CONTINUED)
|
MEN
|
WOMEN
|
| Age | Age | Age | Age | Men
| Age | Age | Age | Age |Women
|Grand
County Of Conviction|00-21 %|22-39 %|40-54 %|55-99 %|Total % |00-21 %|22-39 %|40-54 %|55-99 %|Total % |Total %
------------------------------------------------------------------------------------------------------------------------------------
COOK COUNTY
| 0 0| 7 0| 3 0| 0 0| 10 0 | 0 0| 2 2| 0 0| 0 0| 2 1 | 12 0
COWETA COUNTY
| 4 2| 23 1| 10 0| 3 1| 40 1 | 0 0| 2 2| 1 1| 0 0| 3 1 | 43 1
CRAWFORD COUNTY
| 0 0| 3 0| 0 0| 0 0| 3 0 | 0 0| 0 0| 0 0| 0 0| 0 0 | 3 0
CRISP COUNTY
| 4 2| 14 0| 11 1| 1 0| 30 1 | 0 0| 3 2| 0 0| 1 4| 4 2 | 34 1
DADE COUNTY
| 2 1| 7 0| 5 0| 3 1| 17 0 | 0 0| 0 0| 0 0| 0 0| 0 0 | 17 0
DAWSON COUNTY
| 0 0| 3 0| 3 0| 1 0| 7 0 | 0 0| 0 0| 0 0| 0 0| 0 0 | 7 0
DECATUR COUNTY
| 1 1| 22 1| 5 0| 1 0| 29 1 | 0 0| 1 1| 0 0| 0 0| 1 0 | 30 1
DEKALB COUNTY
| 12 6| 249 8| 156 8| 22 5| 439 8 | 1 11| 4 3| 3 4| 1 4| 9 4 | 448 8
DODGE COUNTY
| 0 0| 6 0| 5 0| 1 0| 12 0 | 0 0| 0 0| 0 0| 0 0| 0 0 | 12 0
DOOLY COUNTY
| 2 1| 8 0| 8 0| 0 0| 18 0 | 0 0| 0 0| 0 0| 0 0| 0 0 | 18 0
DOUGHERTY COUNTY | 7 4| 72 2| 39 2| 4 1| 122 2 | 0 0| 5 4| 0 0| 0 0| 5 2 | 127 2
DOUGLAS COUNTY
| 2 1| 48 2| 18 1| 6 1| 74 1 | 0 0| 1 1| 1 1| 0 0| 2 1 | 76 1
EARLY COUNTY
| 0 0| 10 0| 5 0| 2 0| 17 0 | 0 0| 0 0| 0 0| 0 0| 0 0 | 17 0
ECHOLS COUNTY.
| 0 0| 0 0| 0 0| 0 0| 0 0 | 0 0| 0 0| 0 0| 0 0| 0 0 | 0 0
EFFINGHAM COUNTY | 0 0| 5 0| 3 0| 0 0| 8 0 | 0 0| 0 0| 0 0| 0 0| 0 0 | 8 0
ELBERT COUNTY
| 0 0| 13 0| 8 0| 1 0| 22 0 | 0 0| 1 1| 0 0| 0 0| 1 0 | 23 0
EMANUEL COUNTY
| 1 1| 8 0| 10 0| 2 0| 21 0 | 0 0| 0 0| 1 1| 0 0| 1 0 | 22 0
EVANS COUNTY
| 0 0| 7 0| 4 0| 2 0| 13 0 | 0 0| 0 0| 0 0| 0 0| 0 0 | 13 0
FANNIN COUNTY
| 0 0| 4 0| 5 0| 1 0| 10 0 | 0 0| 0 0| 0 0| 0 0| 0 0 | 10 0
FAYETTE COUNTY
| 1 1| 6 0| 5 0| 0 0| 12 0 | 0 0| 0 0| 0 0| 0 0| 0 0 | 12 0
FLOYD COUNTY
| 2 1| 30 1| 26 1| 4 1| 62 1 | 2 22| 3 2| 2 2| 1 4| 8 3 | 70 1
FORSYTH COUNTY
| 0 0| 6 0| 8 0| 3 1| 17 0 | 0 0| 1 1| 1 1| 0 0| 2 1 | 19 0
FRANKLIN COUNTY
| 1 1| 2 0| 3 0| 1 0| 7 0 | 0 0| 0 0| 2 2| 1 4| 3 1 | 10 0
FULTON COUNTY
| 29 15| 465 15| 308 15| 60 15| 862 15 | 1 11| 12 9| 6 7| 5 20| 24 10 | 886 15
GILMER COUNTY
| 0 0| 1 0| 2 0| 3 1| 6 0 | 0 0| 0 0| 0 0| 0 0| 0 0 | 6 0
GLASCOCK COUNTY
| 0 0| 0 0| 0 0| 0 0| 0 0 | 0 0| 0 0| 0 0| 0 0| 0 0 | 0 0
GLYNN COUNTY
| 7 4| 32 1| 27 1| 3 1| 69 1 | 0 0| 2 2| 2 2| 0 0| 4 2 | 73 1
GORDON COUNTY
| 0 0| 22 1| 14 1| 2 0| 38 1 | 0 0| 1 1| 0 0| 0 0| 1 0 | 39 1
GRADY COUNTY
| 3 2| 15 0| 10 0| 1 0| 29 1 | 0 0| 0 0| 0 0| 0 0| 0 0 | 29 0
GREENE COUNTY
| 1 1| 2 0| 5 0| 1 0| 9 0 | 0 0| 0 0| 0 0| 0 0| 0 0 | 9 0
GWINNETT COUNTY
| 1 1| 73 2| 41 2| 8 2| 123 2 | 0 0| 2 2| 5 6| 1 4| 8 3 | 131 2
HABERSHAM COUNTY | 1 1| 13 0| 9 0| 0 0| 23 0 | 0 0| 0 0| 0 0| 0 0| 0 0 | 23 0
HALL COUNTY
| 2 1| 44 1| 36 2| 10 2| 92 2 | 1 11| 3 2| 1 1| 1 4| 6 2 | 98 2
HANCOCK COUNTY
| 0 0| 3 0| 1 0| 0 0| 4 0 | 0 0| 0 0| 1 1| 0 0| 1 0 | 5 0
HARALSON COUNTY
| 0 0| 4 0| 2 0| 1 0| 7 0 | 0 0| 0 0| 0 0| 0 0| 0 0 | 7 0
------------------------------------------------------------------------------------------------------------------------------------
(continued)
Page 26 Run 09/20/00
Georgia Department of Corrections Office of Planning and Analysis
Inmate statistical profile
Sample: ACTIVE PRISONERS SERVING LIFE EXCLUDING JAIL
Requestor:
Active inmates 09/20/2000
County Of Conviction by current age & sex
Statistics (CONTINUED)
|
MEN
|
WOMEN
|
| Age | Age | Age | Age | Men
| Age | Age | Age | Age |Women
|Grand
County Of Conviction|00-21 %|22-39 %|40-54 %|55-99 %|Total % |00-21 %|22-39 %|40-54 %|55-99 %|Total % |Total %
------------------------------------------------------------------------------------------------------------------------------------
HARRIS COUNTY
| 1 1| 8 0| 3 0| 0 0| 12 0 | 0 0| 0 0| 0 0| 0 0| 0 0 | 12 0
HART COUNTY
| 0 0| 3 0| 2 0| 0 0| 5 0 | 0 0| 0 0| 0 0| 0 0| 0 0 | 5 0
HEARD COUNTY
| 0 0| 2 0| 0 0| 3 1| 5 0 | 0 0| 0 0| 0 0| 0 0| 0 0 | 5 0
HENRY COUNTY
| 0 0| 23 1| 9 0| 1 0| 33 1 | 0 0| 1 1| 0 0| 0 0| 1 0 | 34 1
HOUSTON COUNTY
| 0 0| 40 1| 18 1| 3 1| 61 1 | 0 0| 4 3| 3 4| 1 4| 8 3 | 69 1
IRWIN COUNTY
| 0 0| 3 0| 1 0| 1 0| 5 0 | 0 0| 0 0| 0 0| 0 0| 0 0 | 5 0
JACKSON COUNTY
| 1 1| 6 0| 14 1| 1 0| 22 0 | 0 0| 1 1| 0 0| 0 0| 1 0 | 23 0
JASPER COUNTY
| 0 0| 8 0| 0 0| 0 0| 8 0 | 0 0| 0 0| 1 1| 0 0| 1 0 | 9 0
JEFF DAVIS COUNTY | 0 0| 4 0| 4 0| 2 0| 10 0 | 0 0| 0 0| 0 0| 0 0| 0 0 | 10 0
JEFFERSON COUNTY | 0 0| 10 0| 4 0| 4 1| 18 0 | 0 0| 0 0| 0 0| 0 0| 0 0 | 18 0
JENKINS COUNTY
| 0 0| 2 0| 4 0| 0 0| 6 0 | 0 0| 0 0| 0 0| 0 0| 0 0 | 6 0
JOHNSON COUNTY
| 0 0| 9 0| 2 0| 1 0| 12 0 | 0 0| 1 1| 0 0| 0 0| 1 0 | 13 0
JONES COUNTY
| 0 0| 1 0| 6 0| 3 1| 10 0 | 0 0| 0 0| 0 0| 0 0| 0 0 | 10 0
LAMAR COUNTY
| 0 0| 9 0| 10 0| 3 1| 22 0 | 0 0| 0 0| 1 1| 0 0| 1 0 | 23 0
LANIER COUNTY
| 0 0| 1 0| 0 0| 0 0| 1 0 | 0 0| 0 0| 0 0| 0 0| 0 0 | 1 0
LAURENS COUNTY
| 1 1| 13 0| 7 0| 1 0| 22 0 | 0 0| 1 1| 2 2| 0 0| 3 1 | 25 0
LEE COUNTY
| 0 0| 2 0| 0 0| 0 0| 2 0 | 1 11| 0 0| 0 0| 0 0| 1 0 | 3 0
LIBERTY COUNTY
| 1 1| 23 1| 9 0| 4 1| 37 1 | 0 0| 2 2| 0 0| 0 0| 2 1 | 39 1
LINCOLN COUNTY
| 1 1| 2 0| 2 0| 0 0| 5 0 | 0 0| 0 0| 0 0| 0 0| 0 0 | 5 0
LONG COUNTY
| 1 1| 6 0| 3 0| 2 0| 12 0 | 0 0| 2 2| 0 0| 0 0| 2 1 | 14 0
LOWNDES COUNTY
| 0 0| 40 1| 25 1| 2 0| 67 1 | 0 0| 0 0| 2 2| 1 4| 3 1 | 70 1
LUMPKIN COUNTY
| 1 1| 3 0| 0 0| 2 0| 6 0 | 0 0| 0 0| 0 0| 0 0| 0 0 | 6 0
MACON COUNTY
| 1 1| 15 0| 8 0| 0 0| 24 0 | 0 0| 0 0| 0 0| 0 0| 0 0 | 24 0
MADISON COUNTY
| 0 0| 9 0| 4 0| 3 1| 16 0 | 0 0| 2 2| 0 0| 0 0| 2 1 | 18 0
MARION COUNTY
| 0 0| 2 0| 1 0| 0 0| 3 0 | 0 0| 0 0| 1 1| 0 0| 1 0 | 4 0
MCDUFFIE COUNTY
| 0 0| 30 1| 11 1| 4 1| 45 1 | 1 11| 1 1| 0 0| 0 0| 2 1 | 47 1
MCINTOSH COUNTY
| 1 1| 7 0| 9 0| 0 0| 17 0 | 0 0| 0 0| 0 0| 0 0| 0 0 | 17 0
MERIWETHER COUNTY | 0 0| 9 0| 9 0| 3 1| 21 0 | 0 0| 2 2| 0 0| 1 4| 3 1 | 24 0
MILLER COUNTY
| 0 0| 2 0| 2 0| 0 0| 4 0 | 0 0| 0 0| 0 0| 0 0| 0 0 | 4 0
MITCHELL COUNTY
| 0 0| 11 0| 10 0| 2 0| 23 0 | 0 0| 2 2| 0 0| 0 0| 2 1 | 25 0
MONROE COUNTY
| 0 0| 10 0| 8 0| 2 0| 20 0 | 0 0| 1 1| 0 0| 0 0| 1 0 | 21 0
MONTGOMERY COUNTY | 0 0| 0 0| 3 0| 0 0| 3 0 | 0 0| 0 0| 0 0| 0 0| 0 0 | 3 0
MORGAN COUNTY
| 0 0| 12 0| 2 0| 0 0| 14 0 | 0 0| 1 1| 0 0| 0 0| 1 0 | 15 0
MURRAY COUNTY
| 2 1| 3 0| 6 0| 4 1| 15 0 | 0 0| 0 0| 0 0| 0 0| 0 0 | 15 0
MUSCOGEE COUNTY
| 5 3| 78 3| 76 4| 10 2| 169 3 | 0 0| 4 3| 2 2| 0 0| 6 2 | 175 3
------------------------------------------------------------------------------------------------------------------------------------
(continued)
Page 27 Run 09/20/00
Georgia Department of Corrections Office of Planning and Analysis
Inmate statistical profile
Sample: ACTIVE PRISONERS SERVING LIFE EXCLUDING JAIL
Requestor:
Active inmates 09/20/2000
County Of Conviction by current age & sex
Statistics (CONTINUED)
|
MEN
|
WOMEN
|
| Age | Age | Age | Age | Men
| Age | Age | Age | Age |Women
|Grand
County Of Conviction|00-21 %|22-39 %|40-54 %|55-99 %|Total % |00-21 %|22-39 %|40-54 %|55-99 %|Total % |Total %
------------------------------------------------------------------------------------------------------------------------------------
NEWTON COUNTY
| 4 2| 45 1| 16 1| 5 1| 70 1 | 0 0| 2 2| 0 0| 0 0| 2 1 | 72 1
OCONEE COUNTY
| 0 0| 9 0| 3 0| 0 0| 12 0 | 0 0| 0 0| 0 0| 0 0| 0 0 | 12 0
OGLETHORPE COUNTY | 0 0| 5 0| 3 0| 1 0| 9 0 | 0 0| 0 0| 0 0| 0 0| 0 0 | 9 0
PAULDING COUNTY
| 0 0| 4 0| 6 0| 3 1| 13 0 | 0 0| 1 1| 0 0| 0 0| 1 0 | 14 0
PEACH COUNTY
| 0 0| 6 0| 3 0| 0 0| 9 0 | 0 0| 0 0| 1 1| 0 0| 1 0 | 10 0
PICKENS COUNTY
| 0 0| 4 0| 0 0| 1 0| 5 0 | 0 0| 0 0| 1 1| 0 0| 1 0 | 6 0
PIERCE COUNTY
| 3 2| 2 0| 5 0| 0 0| 10 0 | 0 0| 0 0| 0 0| 0 0| 0 0 | 10 0
PIKE COUNTY
| 0 0| 1 0| 1 0| 0 0| 2 0 | 0 0| 0 0| 0 0| 0 0| 0 0 | 2 0
POLK COUNTY
| 1 1| 11 0| 8 0| 2 0| 22 0 | 0 0| 0 0| 0 0| 0 0| 0 0 | 22 0
PULASKI COUNTY
| 0 0| 7 0| 1 0| 0 0| 8 0 | 0 0| 1 1| 0 0| 0 0| 1 0 | 9 0
PUTNAM COUNTY
| 0 0| 21 1| 15 1| 3 1| 39 1 | 0 0| 0 0| 0 0| 0 0| 0 0 | 39 1
QUITMAN COUNTY
| 0 0| 4 0| 0 0| 0 0| 4 0 | 0 0| 0 0| 0 0| 0 0| 0 0 | 4 0
RABUN COUNTY
| 0 0| 8 0| 1 0| 0 0| 9 0 | 0 0| 0 0| 0 0| 0 0| 0 0 | 9 0
RANDOLPH COUNTY
| 0 0| 3 0| 2 0| 2 0| 7 0 | 0 0| 0 0| 0 0| 0 0| 0 0 | 7 0
RICHMOND COUNTY
| 15 8| 155 5| 73 4| 12 3| 255 4 | 0 0| 9 7| 8 10| 1 4| 18 7 | 273 5
ROCKDALE COUNTY
| 1 1| 11 0| 10 0| 5 1| 27 0 | 0 0| 1 1| 0 0| 0 0| 1 0 | 28 0
SCHLEY COUNTY
| 0 0| 3 0| 2 0| 0 0| 5 0 | 0 0| 0 0| 0 0| 0 0| 0 0 | 5 0
SCREVEN COUNTY
| 0 0| 5 0| 5 0| 2 0| 12 0 | 0 0| 0 0| 0 0| 0 0| 0 0 | 12 0
SEMINOLE COUNTY
| 1 1| 4 0| 4 0| 2 0| 11 0 | 0 0| 1 1| 0 0| 0 0| 1 0 | 12 0
SPALDING COUNTY
| 2 1| 41 1| 23 1| 6 1| 72 1 | 1 11| 1 1| 2 2| 1 4| 5 2 | 77 1
STEPHENS COUNTY
| 0 0| 4 0| 4 0| 3 1| 11 0 | 0 0| 0 0| 0 0| 0 0| 0 0 | 11 0
STEWART COUNTY
| 0 0| 2 0| 1 0| 0 0| 3 0 | 0 0| 0 0| 2 2| 0 0| 2 1 | 5 0
SUMTER COUNTY
| 0 0| 5 0| 13 1| 1 0| 19 0 | 0 0| 0 0| 1 1| 0 0| 1 0 | 20 0
TALBOT COUNTY
| 2 1| 3 0| 1 0| 0 0| 6 0 | 0 0| 0 0| 1 1| 0 0| 1 0 | 7 0
TALIAFERRO COUNTY | 0 0| 0 0| 3 0| 0 0| 3 0 | 0 0| 0 0| 0 0| 0 0| 0 0 | 3 0
TATTNALL COUNTY
| 0 0| 18 1| 13 1| 3 1| 34 1 | 0 0| 0 0| 1 1| 0 0| 1 0 | 35 1
TAYLOR COUNTY
| 3 2| 10 0| 4 0| 0 0| 17 0 | 0 0| 0 0| 0 0| 0 0| 0 0 | 17 0
TELFAIR COUNTY
| 1 1| 6 0| 2 0| 0 0| 9 0 | 0 0| 0 0| 1 1| 0 0| 1 0 | 10 0
TERRELL COUNTY
| 1 1| 12 0| 3 0| 1 0| 17 0 | 0 0| 0 0| 0 0| 0 0| 0 0 | 17 0
THOMAS COUNTY
| 2 1| 19 1| 20 1| 3 1| 44 1 | 0 0| 2 2| 0 0| 0 0| 2 1 | 46 1
TIFT COUNTY
| 7 4| 34 1| 21 1| 5 1| 67 1 | 0 0| 0 0| 2 2| 1 4| 3 1 | 70 1
TOOMBS COUNTY
| 5 3| 22 1| 8 0| 1 0| 36 1 | 0 0| 2 2| 0 0| 0 0| 2 1 | 38 1
TOWNS COUNTY
| 0 0| 1 0| 1 0| 0 0| 2 0 | 0 0| 0 0| 0 0| 0 0| 0 0 | 2 0
TREUTLEN COUNTY
| 0 0| 3 0| 4 0| 0 0| 7 0 | 0 0| 0 0| 0 0| 0 0| 0 0 | 7 0
TROUP COUNTY
| 2 1| 26 1| 25 1| 6 1| 59 1 | 0 0| 2 2| 1 1| 0 0| 3 1 | 62 1
------------------------------------------------------------------------------------------------------------------------------------
(continued)
Page 28 Run 09/20/00
Georgia Department of Corrections Office of Planning and Analysis
Inmate statistical profile
Sample: ACTIVE PRISONERS SERVING LIFE EXCLUDING JAIL
Requestor:
Active inmates 09/20/2000
County Of Conviction by current age & sex
Statistics (CONTINUED)
|
MEN
|
WOMEN
|
| Age | Age | Age | Age | Men
| Age | Age | Age | Age |Women
|Grand
County Of Conviction|00-21 %|22-39 %|40-54 %|55-99 %|Total % |00-21 %|22-39 %|40-54 %|55-99 %|Total % |Total %
------------------------------------------------------------------------------------------------------------------------------------
TURNER COUNTY
| 0 0| 8 0| 7 0| 0 0| 15 0 | 0 0| 0 0| 0 0| 0 0| 0 0 | 15 0
TWIGGS COUNTY
| 0 0| 3 0| 5 0| 1 0| 9 0 | 0 0| 0 0| 0 0| 0 0| 0 0 | 9 0
UNION COUNTY
| 0 0| 0 0| 1 0| 0 0| 1 0 | 0 0| 0 0| 0 0| 0 0| 0 0 | 1 0
UPSON COUNTY
| 0 0| 7 0| 5 0| 1 0| 13 0 | 0 0| 0 0| 1 1| 0 0| 1 0 | 14 0
WALKER COUNTY
| 0 0| 14 0| 10 0| 4 1| 28 0 | 0 0| 1 1| 1 1| 0 0| 2 1 | 30 1
WALTON COUNTY
| 2 1| 29 1| 20 1| 2 0| 53 1 | 0 0| 2 2| 0 0| 0 0| 2 1 | 55 1
WARE COUNTY
| 0 0| 13 0| 11 1| 3 1| 27 0 | 0 0| 0 0| 1 1| 0 0| 1 0 | 28 0
WARREN COUNTY
| 0 0| 4 0| 6 0| 1 0| 11 0 | 0 0| 0 0| 0 0| 0 0| 0 0 | 11 0
WASHINGTON COUNTY | 0 0| 7 0| 7 0| 1 0| 15 0 | 0 0| 1 1| 0 0| 0 0| 1 0 | 16 0
WAYNE COUNTY
| 0 0| 7 0| 8 0| 2 0| 17 0 | 0 0| 1 1| 0 0| 0 0| 1 0 | 18 0
WEBSTER COUNTY
| 0 0| 0 0| 0 0| 0 0| 0 0 | 0 0| 0 0| 0 0| 0 0| 0 0 | 0 0
WHEELER COUNTY
| 0 0| 3 0| 3 0| 1 0| 7 0 | 0 0| 0 0| 0 0| 1 4| 1 0 | 8 0
WHITE COUNTY
| 0 0| 3 0| 2 0| 0 0| 5 0 | 0 0| 0 0| 0 0| 0 0| 0 0 | 5 0
WHITFIELD COUNTY | 0 0| 25 1| 24 1| 7 2| 56 1 | 0 0| 5 4| 1 1| 0 0| 6 2 | 62 1
WILCOX COUNTY
| 0 0| 1 0| 7 0| 0 0| 8 0 | 0 0| 0 0| 0 0| 0 0| 0 0 | 8 0
WILKES COUNTY
| 0 0| 7 0| 3 0| 1 0| 11 0 | 0 0| 0 0| 0 0| 0 0| 0 0 | 11 0
WILKINSON COUNTY | 0 0| 7 0| 1 0| 0 0| 8 0 | 0 0| 0 0| 0 0| 0 0| 0 0 | 8 0
WORTH COUNTY
| 4 2| 13 0| 4 0| 2 0| 23 0 | 0 0| 0 0| 0 0| 0 0| 0 0 | 23 0
CONVERSION
| 0 2| 0 0| 0 0| 0 0| 0 0 | 0 0| 0 0| 0 0| 0 0| 0 0 | 0 0
------------------------------------------------------------------------------------------------------------------------------------
Total reported
| 194 100| 3042 100| 2055 100| 403 100| 5694 100 | 9 100| 128 100| 82 100| 25 100| 244 100 | 5938 100
|
|
|
|
|
|
|
|
|
|
|
Percent reported | 100.0| 100.0| 100.0| 100.0| 100.0 | 100.0| 100.0| 100.0| 100.0| 100.0 | 100.0
|
|
|
|
|
|
|
|
|
|
|
|
|
|
|
|
|
|
|
|
|
|
UNKNOWN
|0|0|0|0|0
|0|0|0|0|0
|0
------------------------------------------------------------------------------------------------------------------------------------
Total
| 194 | 3042 | 2055 | 403 | 5694
| 9 | 128 | 82 | 25 | 244
| 5938
Page 29 Run 09/20/00
Georgia Department of Corrections Office of Planning and Analysis
Inmate statistical profile
Sample: ACTIVE PRISONERS SERVING LIFE EXCLUDING JAIL
Requestor: Statistics
Active inmates 09/20/2000
Circuit Of Conviction by current age & sex
|
MEN
|
WOMEN
|
| Age | Age | Age | Age | Men
| Age | Age | Age | Age |Women
|Grand
Circ Of Conviction |00-21 %|22-39 %|40-54 %|55-99 %|Total % |00-21 %|22-39 %|40-54 %|55-99 %|Total % |Total %
------------------------------------------------------------------------------------------------------------------------------------
ALAPAHA CIRCUIT
| 0 0| 14 0| 10 0| 2 0| 26 0 | 0 0| 2 2| 1 1| 0 0| 3 1 | 29 0
ALCOVY CIRCUIT
| 6 3| 74 2| 36 2| 7 2| 123 2 | 0 0| 4 3| 0 0| 0 0| 4 2 | 127 2
ATLANTA CIRCUIT
| 29 15| 465 15| 308 15| 60 15| 862 15 | 1 11| 12 9| 6 7| 5 20| 24 10 | 886 15
ATLANTIC CIRCUIT | 3 2| 70 2| 44 2| 12 3| 129 2 | 0 0| 4 3| 1 1| 1 4| 6 2 | 135 2
AUGUSTA CIRCUIT
| 16 8| 177 6| 94 5| 15 4| 302 5 | 0 0| 9 7| 9 11| 1 4| 19 8 | 321 5
BLUE RIDGE CIRCUIT | 2 1| 13 0| 29 1| 5 1| 49 1 | 0 0| 4 3| 1 1| 0 0| 5 2 | 54 1
BRUNSWICK CIRCUIT | 8 4| 69 2| 51 2| 7 2| 135 2 | 0 0| 3 2| 3 4| 0 0| 6 2 | 141 2
CHATTAHOOCHEE CIRCUI| 11 6| 101 3| 87 4| 10 2| 209 4 | 0 0| 4 3| 4 5| 0 0| 8 3 | 217 4
CHEROKEE CIRCUIT | 1 1| 51 2| 36 2| 5 1| 93 2 | 0 0| 3 2| 0 0| 0 0| 3 1 | 96 2
CLAYTON CIRCUIT
| 5 3| 71 2| 37 2| 10 2| 123 2 | 0 0| 2 2| 3 4| 0 0| 5 2 | 128 2
COBB CIRCUIT
| 8 4| 110 4| 75 4| 13 3| 206 4 | 0 0| 6 5| 3 4| 1 4| 10 4 | 216 4
CONASAUGA CIRCUIT | 2 1| 28 1| 30 1| 11 3| 71 1 | 0 0| 5 4| 1 1| 0 0| 6 2 | 77 1
CORDELE CIRCUIT
| 6 3| 30 1| 35 2| 4 1| 75 1 | 0 0| 3 2| 0 0| 1 4| 4 2 | 79 1
COWETA CIRCUIT
| 7 4| 77 3| 57 3| 21 5| 162 3 | 0 0| 8 6| 3 4| 1 4| 12 5 | 174 3
DOUGHERTY CIRCUIT | 7 4| 72 2| 39 2| 4 1| 122 2 | 0 0| 5 4| 0 0| 0 0| 5 2 | 127 2
DUBLIN CIRCUIT
| 1 1| 28 1| 18 1| 3 1| 50 1 | 0 0| 2 2| 2 2| 0 0| 4 2 | 54 1
EASTERN CIRCUIT
| 6 3| 162 5| 104 5| 14 3| 286 5 | 0 0| 2 2| 1 1| 0 0| 3 1 | 289 5
FLINT CIRCUIT
| 1 1| 62 2| 37 2| 8 2| 108 2 | 0 0| 4 3| 2 2| 0 0| 6 2 | 114 2
GRIFFIN CIRCUIT
| 3 2| 55 2| 34 2| 7 2| 99 2 | 1 11| 1 1| 3 4| 1 4| 6 2 | 105 2
GWINNETT CIRCUIT | 1 1| 73 2| 41 2| 8 2| 123 2 | 0 0| 2 2| 5 6| 1 4| 8 3 | 131 2
HOUSTON CIRCUIT
| 0 0| 40 1| 18 1| 3 1| 61 1 | 0 0| 4 3| 3 4| 1 4| 8 3 | 69 1
LOOKOUT MOUNTAIN CIR| 2 1| 31 1| 29 1| 8 2| 70 1 | 0 0| 1 1| 2 2| 1 4| 4 2 | 74 1
MACON CIRCUIT
| 4 2| 99 3| 88 4| 15 4| 206 4 | 1 11| 2 2| 2 2| 1 4| 6 2 | 212 4
MIDDLE CIRCUIT
| 6 3| 48 2| 30 1| 8 2| 92 2 | 0 0| 3 2| 1 1| 0 0| 4 2 | 96 2
MOUNTAIN CIRCUIT | 1 1| 25 1| 14 1| 3 1| 43 1 | 0 0| 0 0| 0 0| 0 0| 0 0 | 43 1
NORTHEASTERN CIRCUIT| 2 1| 47 2| 39 2| 11 3| 99 2 | 1 11| 3 2| 1 1| 1 4| 6 2 | 105 2
NORTHERN CIRCUIT | 1 1| 32 1| 20 1| 6 1| 59 1 | 0 0| 3 2| 2 2| 1 4| 6 2 | 65 1
OCMULGEE CIRCUIT | 3 2| 70 2| 41 2| 9 2| 123 2 | 0 0| 2 2| 2 2| 0 0| 4 2 | 127 2
OCONEE CIRCUIT
| 1 1| 29 1| 18 1| 3 1| 51 1 | 0 0| 1 1| 2 2| 1 4| 4 2 | 55 1
OGEECHEE CIRCUIT | 1 1| 31 1| 28 1| 2 0| 62 1 | 0 0| 1 1| 1 1| 1 4| 3 1 | 65 1
PATAULA CIRCUIT
| 2 1| 36 1| 17 1| 7 2| 62 1 | 0 0| 1 1| 0 0| 0 0| 1 0 | 63 1
PIEDMONT CIRCUIT | 1 1| 11 0| 31 2| 7 2| 50 1 | 0 0| 1 1| 1 1| 0 0| 2 1 | 52 1
ROME CIRCUIT
| 2 1| 30 1| 26 1| 4 1| 62 1 | 2 22| 3 2| 2 2| 1 4| 8 3 | 70 1
SOUTH GEORGIA CIRCUI| 5 3| 51 2| 29 1| 5 1| 90 2 | 0 0| 3 2| 0 0| 0 0| 3 1 | 93 2
SOUTHERN CIRCUIT | 5 3| 103 3| 72 4| 9 2| 189 3 | 0 0| 2 2| 3 4| 2 8| 7 3 | 196 3
------------------------------------------------------------------------------------------------------------------------------------
(continued)
Page 30 Run 09/20/00
Georgia Department of Corrections Office of Planning and Analysis
Inmate statistical profile
Sample: ACTIVE PRISONERS SERVING LIFE EXCLUDING JAIL
Requestor:
Active inmates 09/20/2000
Circuit Of Conviction by current age & sex
Statistics (Continued)
|
MEN
|
WOMEN
|
| Age | Age | Age | Age | Men
| Age | Age | Age | Age |Women
|Grand
Circ Of Conviction |00-21 %|22-39 %|40-54 %|55-99 %|Total % |00-21 %|22-39 %|40-54 %|55-99 %|Total % |Total %
------------------------------------------------------------------------------------------------------------------------------------
SOUTHWESTERN CIRCUIT| 1 1| 27 1| 24 1| 1 0| 53 1 | 1 11| 0 0| 3 4| 0 0| 4 2 | 57 1
STONE MOUNTAIN CIRCU| 12 6| 249 8| 156 8| 22 5| 439 8 | 1 11| 4 3| 3 4| 1 4| 9 4 | 448 8
TALLAPOOSA CIRCUIT | 1 1| 19 1| 16 1| 6 1| 42 1 | 0 0| 1 1| 0 0| 0 0| 1 0 | 43 1
TIFTON CIRCUIT
| 11 6| 58 2| 33 2| 8 2| 110 2 | 0 0| 0 0| 2 2| 1 4| 3 1 | 113 2
TOOMBS CIRCUIT
| 1 1| 43 1| 25 1| 6 1| 75 1 | 1 11| 1 1| 0 0| 0 0| 2 1 | 77 1
WAYCROSS CIRCUIT | 3 2| 32 1| 33 2| 8 2| 76 1 | 0 0| 3 2| 2 2| 0 0| 5 2 | 81 1
WESTERN CIRCUIT
| 1 1| 51 2| 26 1| 8 2| 86 2 | 0 0| 2 2| 0 0| 1 4| 3 1 | 89 1
ROCKDALE CIRCUIT | 1 1| 11 0| 10 0| 5 1| 27 0 | 0 0| 1 1| 0 0| 0 0| 1 0 | 28 0
DOUGLAS CIRCUIT
| 2 1| 48 2| 18 1| 6 1| 74 1 | 0 0| 1 1| 1 1| 0 0| 2 1 | 76 1
APPALACHIAN CIRCUIT | 0 0| 9 0| 7 0| 5 1| 21 0 | 0 0| 0 0| 1 1| 0 0| 1 0 | 22 0
ENOTAH CIRCUIT
| 1 1| 7 0| 4 0| 2 0| 14 0 | 0 0| 0 0| 0 0| 0 0| 0 0 | 14 0
BELL-FORSYTH CIRCUIT| 0 0| 1 0| 0 0| 0 0| 1 0 | 0 0| 0 0| 0 0| 0 0| 0 0 | 1 0
------------------------------------------------------------------------------------------------------------------------------------
Total reported
| 193 100| 3040 100| 2054 100| 403 100| 5690 100 | 9 100| 128 100| 82 100| 25 100| 244 100 | 5934 100
|
|
|
|
|
|
|
|
|
|
|
Percent reported |
99.5|
99.9| 100.0| 100.0|
99.9 | 100.0| 100.0| 100.0| 100.0| 100.0 |
99.9
|
|
|
|
|
|
|
|
|
|
|
|
|
|
|
|
|
|
|
|
|
|
NOT REPORTED
|1|2|1|0|4
|0|0|0|0|0
|4
------------------------------------------------------------------------------------------------------------------------------------
Total
| 194 | 3042 | 2055 | 403 | 5694
| 9 | 128 | 82 | 25 | 244
| 5938
Page 31 Run 09/20/00
Georgia Department of Corrections Office of Planning and Analysis
Inmate statistical profile
Sample: ACTIVE PRISONERS SERVING LIFE EXCLUDING JAIL
Requestor: Statistics
Active inmates 09/20/2000
Home County by current age & sex
|
MEN
|
WOMEN
|
| Age | Age | Age | Age | Men
| Age | Age | Age | Age |Women
|Grand
Home County
|00-21 %|22-39 %|40-54 %|55-99 %|Total % |00-21 %|22-39 %|40-54 %|55-99 %|Total % |Total %
------------------------------------------------------------------------------------------------------------------------------------
APPLING COUNTY
| 0 0| 4 0| 5 0| 1 0| 10 0 | 0 0| 0 0| 0 0| 0 0| 0 0 | 10 0
ATKINSON COUNTY
| 0 0| 1 0| 1 0| 3 1| 5 0 | 0 0| 0 0| 0 0| 0 0| 0 0 | 5 0
BACON COUNTY
| 0 0| 5 0| 4 0| 1 0| 10 0 | 0 0| 0 0| 0 0| 0 0| 0 0 | 10 0
BAKER COUNTY
| 0 0| 1 0| 2 0| 0 0| 3 0 | 0 0| 0 0| 0 0| 0 0| 0 0 | 3 0
BALDWIN COUNTY
| 0 0| 16 1| 6 0| 1 0| 23 0 | 0 0| 1 1| 0 0| 1 4| 2 1 | 25 0
BANKS COUNTY
| 0 0| 1 0| 4 0| 1 0| 6 0 | 0 0| 1 1| 0 0| 0 0| 1 0 | 7 0
BARROW COUNTY
| 0 0| 6 0| 8 0| 2 1| 16 0 | 0 0| 0 0| 1 1| 0 0| 1 0 | 17 0
BARTOW COUNTY
| 1 1| 21 1| 18 1| 5 1| 45 1 | 1 13| 3 3| 0 0| 0 0| 4 2 | 49 1
BEN HILL COUNTY
| 0 0| 5 0| 7 0| 3 1| 15 0 | 0 0| 0 0| 1 1| 0 0| 1 0 | 16 0
BERRIEN COUNTY
| 0 0| 4 0| 1 0| 1 0| 6 0 | 0 0| 0 0| 0 0| 0 0| 0 0 | 6 0
BIBB COUNTY
| 4 2| 81 3| 79 4| 18 5| 182 3 | 1 13| 5 4| 2 3| 0 0| 8 4 | 190 3
BLECKLEY COUNTY
| 0 0| 8 0| 4 0| 1 0| 13 0 | 0 0| 0 0| 1 1| 0 0| 1 0 | 14 0
BRANTLEY COUNTY
| 0 0| 1 0| 2 0| 0 0| 3 0 | 0 0| 0 0| 0 0| 0 0| 0 0 | 3 0
BROOKS COUNTY
| 0 0| 7 0| 2 0| 1 0| 10 0 | 0 0| 0 0| 0 0| 0 0| 0 0 | 10 0
BRYAN COUNTY
| 0 0| 8 0| 5 0| 1 0| 14 0 | 0 0| 0 0| 0 0| 0 0| 0 0 | 14 0
BULLOCH COUNTY
| 1 1| 13 0| 11 1| 0 0| 25 0 | 0 0| 0 0| 1 1| 1 4| 2 1 | 27 0
BURKE COUNTY
| 0 0| 10 0| 7 0| 2 1| 19 0 | 0 0| 0 0| 0 0| 0 0| 0 0 | 19 0
BUTTS COUNTY
| 0 0| 23 1| 8 0| 2 1| 33 1 | 0 0| 1 1| 1 1| 0 0| 2 1 | 35 1
CALHOUN COUNTY
| 1 1| 3 0| 3 0| 1 0| 8 0 | 0 0| 0 0| 0 0| 0 0| 0 0 | 8 0
CAMDEN COUNTY
| 2 1| 17 1| 5 0| 0 0| 24 0 | 0 0| 0 0| 1 1| 0 0| 1 0 | 25 0
CANDLER COUNTY
| 0 0| 2 0| 1 0| 0 0| 3 0 | 0 0| 0 0| 0 0| 0 0| 0 0 | 3 0
CARROLL COUNTY
| 1 1| 19 1| 12 1| 8 2| 40 1 | 0 0| 2 2| 1 1| 0 0| 3 1 | 43 1
CATOOSA COUNTY
| 0 0| 2 0| 5 0| 1 0| 8 0 | 0 0| 0 0| 0 0| 0 0| 0 0 | 8 0
CHARLTON COUNTY
| 0 0| 1 0| 0 0| 0 0| 1 0 | 0 0| 1 1| 0 0| 0 0| 1 0 | 2 0
CHATHAM COUNTY
| 7 4| 150 5| 96 5| 14 4| 267 5 | 0 0| 2 2| 1 1| 1 4| 4 2 | 271 5
CHATTAHOOCHEE COUNTY| 0 0| 0 0| 1 0| 0 0| 1 0 | 0 0| 0 0| 0 0| 0 0| 0 0 | 1 0
CHATTOOGA COUNTY | 0 0| 3 0| 6 0| 0 0| 9 0 | 0 0| 0 0| 1 1| 1 4| 2 1 | 11 0
CHEROKEE COUNTY
| 2 1| 7 0| 17 1| 1 0| 27 1 | 0 0| 2 2| 0 0| 0 0| 2 1 | 29 1
CLARKE COUNTY
| 2 1| 48 2| 18 1| 5 1| 73 1 | 0 0| 2 2| 0 0| 2 8| 4 2 | 77 1
CLAY COUNTY
| 0 0| 1 0| 0 0| 0 0| 1 0 | 0 0| 0 0| 0 0| 0 0| 0 0 | 1 0
CLAYTON COUNTY
| 5 3| 57 2| 44 2| 8 2| 114 2 | 0 0| 2 2| 2 3| 0 0| 4 2 | 118 2
CLINCH COUNTY
| 0 0| 1 0| 2 0| 0 0| 3 0 | 0 0| 0 0| 0 0| 0 0| 0 0 | 3 0
COBB COUNTY
| 7 4| 90 3| 68 4| 7 2| 172 3 | 0 0| 5 4| 1 1| 0 0| 6 3 | 178 3
COFFEE COUNTY
| 0 0| 11 0| 4 0| 3 1| 18 0 | 0 0| 1 1| 2 3| 1 4| 4 2 | 22 0
COLQUITT COUNTY
| 6 3| 28 1| 18 1| 1 0| 53 1 | 0 0| 0 0| 1 1| 0 0| 1 0 | 54 1
COLUMBIA COUNTY
| 0 0| 9 0| 7 0| 0 0| 16 0 | 0 0| 1 1| 1 1| 0 0| 2 1 | 18 0
------------------------------------------------------------------------------------------------------------------------------------
(continued)
Page 32 Run 09/20/00
Georgia Department of Corrections Office of Planning and Analysis
Inmate statistical profile
Sample: ACTIVE PRISONERS SERVING LIFE EXCLUDING JAIL
Requestor:
Active inmates 09/20/2000
Home County by current age & sex
Statistics (CONTINUED)
|
MEN
|
WOMEN
|
| Age | Age | Age | Age | Men
| Age | Age | Age | Age |Women
|Grand
Home County
|00-21 %|22-39 %|40-54 %|55-99 %|Total % |00-21 %|22-39 %|40-54 %|55-99 %|Total % |Total %
------------------------------------------------------------------------------------------------------------------------------------
COOK COUNTY
| 0 0| 6 0| 3 0| 1 0| 10 0 | 0 0| 2 2| 0 0| 0 0| 2 1 | 12 0
COWETA COUNTY
| 4 2| 18 1| 10 1| 1 0| 33 1 | 0 0| 2 2| 1 1| 0 0| 3 1 | 36 1
CRAWFORD COUNTY
| 0 0| 1 0| 1 0| 0 0| 2 0 | 0 0| 0 0| 0 0| 0 0| 0 0 | 2 0
CRISP COUNTY
| 3 2| 13 0| 7 0| 1 0| 24 0 | 0 0| 3 3| 0 0| 0 0| 3 1 | 27 0
DADE COUNTY
| 1 1| 4 0| 2 0| 3 1| 10 0 | 0 0| 0 0| 0 0| 0 0| 0 0 | 10 0
DAWSON COUNTY
| 0 0| 2 0| 1 0| 0 0| 3 0 | 0 0| 0 0| 0 0| 0 0| 0 0 | 3 0
DECATUR COUNTY
| 3 2| 14 1| 4 0| 0 0| 21 0 | 0 0| 0 0| 0 0| 0 0| 0 0 | 21 0
DEKALB COUNTY
| 14 8| 214 8| 126 7| 25 7| 379 7 | 1 13| 5 4| 1 1| 2 8| 9 4 | 388 7
DODGE COUNTY
| 0 0| 7 0| 7 0| 0 0| 14 0 | 0 0| 0 0| 0 0| 0 0| 0 0 | 14 0
DOOLY COUNTY
| 2 1| 7 0| 4 0| 0 0| 13 0 | 0 0| 0 0| 0 0| 0 0| 0 0 | 13 0
DOUGHERTY COUNTY | 7 4| 66 2| 41 2| 2 1| 116 2 | 0 0| 5 4| 1 1| 1 4| 7 3 | 123 2
DOUGLAS COUNTY
| 0 0| 22 1| 13 1| 2 1| 37 1 | 0 0| 1 1| 1 1| 0 0| 2 1 | 39 1
EARLY COUNTY
| 0 0| 7 0| 5 0| 1 0| 13 0 | 0 0| 0 0| 0 0| 0 0| 0 0 | 13 0
ECHOLS COUNTY.
| 0 0| 0 0| 0 0| 0 0| 0 0 | 0 0| 0 0| 0 0| 0 0| 0 0 | 0 0
EFFINGHAM COUNTY | 0 0| 4 0| 3 0| 0 0| 7 0 | 0 0| 0 0| 0 0| 0 0| 0 0 | 7 0
ELBERT COUNTY
| 0 0| 11 0| 8 0| 1 0| 20 0 | 0 0| 1 1| 0 0| 0 0| 1 0 | 21 0
EMANUEL COUNTY
| 1 1| 10 0| 5 0| 1 0| 17 0 | 0 0| 0 0| 1 1| 0 0| 1 0 | 18 0
EVANS COUNTY
| 0 0| 8 0| 4 0| 1 0| 13 0 | 0 0| 0 0| 0 0| 0 0| 0 0 | 13 0
FANNIN COUNTY
| 0 0| 5 0| 3 0| 1 0| 9 0 | 0 0| 0 0| 0 0| 0 0| 0 0 | 9 0
FAYETTE COUNTY
| 0 0| 3 0| 3 0| 0 0| 6 0 | 0 0| 0 0| 0 0| 0 0| 0 0 | 6 0
FLOYD COUNTY
| 2 1| 33 1| 21 1| 1 0| 57 1 | 1 13| 3 3| 2 3| 1 4| 7 3 | 64 1
FORSYTH COUNTY
| 0 0| 7 0| 2 0| 2 1| 11 0 | 0 0| 0 0| 1 1| 0 0| 1 0 | 12 0
FRANKLIN COUNTY
| 0 0| 2 0| 4 0| 0 0| 6 0 | 0 0| 0 0| 0 0| 1 4| 1 0 | 7 0
FULTON COUNTY
| 27 15| 502 18| 344 18| 54 15| 927 18 | 1 13| 14 12| 7 9| 4 17| 26 12 | 953 18
GILMER COUNTY
| 0 0| 1 0| 3 0| 2 1| 6 0 | 0 0| 0 0| 0 0| 0 0| 0 0 | 6 0
GLASCOCK COUNTY
| 0 0| 1 0| 0 0| 0 0| 1 0 | 0 0| 0 0| 0 0| 0 0| 0 0 | 1 0
GLYNN COUNTY
| 4 2| 29 1| 27 1| 3 1| 63 1 | 0 0| 1 1| 2 3| 0 0| 3 1 | 66 1
GORDON COUNTY
| 0 0| 22 1| 12 1| 3 1| 37 1 | 0 0| 1 1| 0 0| 0 0| 1 0 | 38 1
GRADY COUNTY
| 1 1| 14 1| 7 0| 0 0| 22 0 | 0 0| 0 0| 0 0| 0 0| 0 0 | 22 0
GREENE COUNTY
| 1 1| 3 0| 3 0| 1 0| 8 0 | 0 0| 0 0| 1 1| 0 0| 1 0 | 9 0
GWINNETT COUNTY
| 2 1| 67 2| 40 2| 9 2| 118 2 | 0 0| 3 3| 2 3| 0 0| 5 2 | 123 2
HABERSHAM COUNTY | 0 0| 10 0| 7 0| 0 0| 17 0 | 0 0| 0 0| 0 0| 0 0| 0 0 | 17 0
HALL COUNTY
| 2 1| 32 1| 34 2| 11 3| 79 2 | 1 13| 2 2| 1 1| 1 4| 5 2 | 84 2
HANCOCK COUNTY
| 0 0| 2 0| 2 0| 1 0| 5 0 | 0 0| 0 0| 1 1| 0 0| 1 0 | 6 0
HARALSON COUNTY
| 0 0| 1 0| 2 0| 1 0| 4 0 | 0 0| 1 1| 0 0| 0 0| 1 0 | 5 0
------------------------------------------------------------------------------------------------------------------------------------
(continued)
Page 33 Run 09/20/00
Georgia Department of Corrections Office of Planning and Analysis
Inmate statistical profile
Sample: ACTIVE PRISONERS SERVING LIFE EXCLUDING JAIL
Requestor:
Active inmates 09/20/2000
Home County by current age & sex
Statistics (CONTINUED)
|
MEN
|
WOMEN
|
| Age | Age | Age | Age | Men
| Age | Age | Age | Age |Women
|Grand
Home County
|00-21 %|22-39 %|40-54 %|55-99 %|Total % |00-21 %|22-39 %|40-54 %|55-99 %|Total % |Total %
------------------------------------------------------------------------------------------------------------------------------------
HARRIS COUNTY
| 1 1| 6 0| 2 0| 0 0| 9 0 | 0 0| 0 0| 0 0| 0 0| 0 0 | 9 0
HART COUNTY
| 0 0| 1 0| 2 0| 0 0| 3 0 | 0 0| 0 0| 1 1| 0 0| 1 0 | 4 0
HEARD COUNTY
| 0 0| 1 0| 1 0| 2 1| 4 0 | 0 0| 0 0| 0 0| 0 0| 0 0 | 4 0
HENRY COUNTY
| 1 1| 19 1| 8 0| 5 1| 33 1 | 0 0| 1 1| 2 3| 0 0| 3 1 | 36 1
HOUSTON COUNTY
| 0 0| 42 2| 21 1| 5 1| 68 1 | 0 0| 3 3| 4 5| 0 0| 7 3 | 75 1
IRWIN COUNTY
| 1 1| 4 0| 3 0| 0 0| 8 0 | 0 0| 0 0| 0 0| 0 0| 0 0 | 8 0
JACKSON COUNTY
| 1 1| 9 0| 10 1| 5 1| 25 0 | 0 0| 0 0| 0 0| 0 0| 0 0 | 25 0
JASPER COUNTY
| 2 1| 8 0| 0 0| 1 0| 11 0 | 0 0| 0 0| 0 0| 0 0| 0 0 | 11 0
JEFF DAVIS COUNTY | 1 1| 5 0| 2 0| 1 0| 9 0 | 0 0| 0 0| 0 0| 0 0| 0 0 | 9 0
JEFFERSON COUNTY | 0 0| 5 0| 2 0| 2 1| 9 0 | 0 0| 1 1| 0 0| 0 0| 1 0 | 10 0
JENKINS COUNTY
| 0 0| 0 0| 6 0| 0 0| 6 0 | 0 0| 0 0| 0 0| 0 0| 0 0 | 6 0
JOHNSON COUNTY
| 0 0| 3 0| 2 0| 0 0| 5 0 | 0 0| 0 0| 0 0| 0 0| 0 0 | 5 0
JONES COUNTY
| 0 0| 0 0| 4 0| 1 0| 5 0 | 0 0| 1 1| 0 0| 0 0| 1 0 | 6 0
LAMAR COUNTY
| 0 0| 9 0| 9 0| 3 1| 21 0 | 0 0| 0 0| 1 1| 0 0| 1 0 | 22 0
LANIER COUNTY
| 0 0| 0 0| 0 0| 0 0| 0 0 | 0 0| 0 0| 0 0| 0 0| 0 0 | 0 0
LAURENS COUNTY
| 1 1| 15 1| 7 0| 2 1| 25 0 | 0 0| 1 1| 1 1| 0 0| 2 1 | 27 0
LEE COUNTY
| 0 0| 3 0| 0 0| 0 0| 3 0 | 0 0| 0 0| 0 0| 0 0| 0 0 | 3 0
LIBERTY COUNTY
| 0 0| 25 1| 8 0| 4 1| 37 1 | 0 0| 2 2| 0 0| 0 0| 2 1 | 39 1
LINCOLN COUNTY
| 1 1| 1 0| 3 0| 0 0| 5 0 | 0 0| 0 0| 0 0| 0 0| 0 0 | 5 0
LONG COUNTY
| 0 0| 5 0| 2 0| 1 0| 8 0 | 0 0| 1 1| 0 0| 0 0| 1 0 | 9 0
LOWNDES COUNTY
| 0 0| 34 1| 21 1| 3 1| 58 1 | 0 0| 0 0| 2 3| 1 4| 3 1 | 61 1
LUMPKIN COUNTY
| 1 1| 5 0| 4 0| 1 0| 11 0 | 0 0| 0 0| 0 0| 0 0| 0 0 | 11 0
MACON COUNTY
| 0 0| 12 0| 5 0| 0 0| 17 0 | 0 0| 0 0| 1 1| 0 0| 1 0 | 18 0
MADISON COUNTY
| 0 0| 7 0| 6 0| 2 1| 15 0 | 0 0| 2 2| 0 0| 0 0| 2 1 | 17 0
MARION COUNTY
| 1 1| 1 0| 1 0| 1 0| 4 0 | 0 0| 0 0| 0 0| 0 0| 0 0 | 4 0
MCDUFFIE COUNTY
| 0 0| 22 1| 10 1| 4 1| 36 1 | 1 13| 1 1| 0 0| 0 0| 2 1 | 38 1
MCINTOSH COUNTY
| 1 1| 4 0| 3 0| 0 0| 8 0 | 0 0| 0 0| 0 0| 0 0| 0 0 | 8 0
MERIWETHER COUNTY | 1 1| 7 0| 7 0| 3 1| 18 0 | 0 0| 1 1| 0 0| 1 4| 2 1 | 20 0
MILLER COUNTY
| 0 0| 3 0| 3 0| 0 0| 6 0 | 0 0| 0 0| 0 0| 0 0| 0 0 | 6 0
MITCHELL COUNTY
| 0 0| 12 0| 11 1| 3 1| 26 0 | 0 0| 1 1| 0 0| 0 0| 1 0 | 27 0
MONROE COUNTY
| 0 0| 11 0| 3 0| 0 0| 14 0 | 0 0| 0 0| 0 0| 0 0| 0 0 | 14 0
MONTGOMERY COUNTY | 0 0| 0 0| 0 0| 0 0| 0 0 | 0 0| 1 1| 0 0| 0 0| 1 0 | 1 0
MORGAN COUNTY
| 0 0| 8 0| 2 0| 0 0| 10 0 | 0 0| 0 0| 0 0| 0 0| 0 0 | 10 0
MURRAY COUNTY
| 2 1| 6 0| 4 0| 4 1| 16 0 | 0 0| 1 1| 0 0| 0 0| 1 0 | 17 0
MUSCOGEE COUNTY
| 5 3| 67 2| 57 3| 9 2| 138 3 | 0 0| 3 3| 3 4| 0 0| 6 3 | 144 3
------------------------------------------------------------------------------------------------------------------------------------
(continued)
Page 34 Run 09/20/00
Georgia Department of Corrections Office of Planning and Analysis
Inmate statistical profile
Sample: ACTIVE PRISONERS SERVING LIFE EXCLUDING JAIL
Requestor:
Active inmates 09/20/2000
Home County by current age & sex
Statistics (CONTINUED)
|
MEN
|
WOMEN
|
| Age | Age | Age | Age | Men
| Age | Age | Age | Age |Women
|Grand
Home County
|00-21 %|22-39 %|40-54 %|55-99 %|Total % |00-21 %|22-39 %|40-54 %|55-99 %|Total % |Total %
------------------------------------------------------------------------------------------------------------------------------------
NEWTON COUNTY
| 2 1| 37 1| 12 1| 3 1| 54 1 | 0 0| 2 2| 0 0| 1 4| 3 1 | 57 1
OCONEE COUNTY
| 0 0| 3 0| 2 0| 0 0| 5 0 | 0 0| 0 0| 1 1| 0 0| 1 0 | 6 0
OGLETHORPE COUNTY | 0 0| 4 0| 0 0| 0 0| 4 0 | 0 0| 0 0| 0 0| 0 0| 0 0 | 4 0
PAULDING COUNTY
| 0 0| 9 0| 5 0| 3 1| 17 0 | 0 0| 0 0| 1 1| 1 4| 2 1 | 19 0
PEACH COUNTY
| 0 0| 7 0| 2 0| 0 0| 9 0 | 0 0| 1 1| 0 0| 0 0| 1 0 | 10 0
PICKENS COUNTY
| 0 0| 3 0| 0 0| 0 0| 3 0 | 0 0| 0 0| 1 1| 0 0| 1 0 | 4 0
PIERCE COUNTY
| 2 1| 2 0| 2 0| 0 0| 6 0 | 0 0| 0 0| 0 0| 0 0| 0 0 | 6 0
PIKE COUNTY
| 0 0| 1 0| 0 0| 0 0| 1 0 | 0 0| 0 0| 0 0| 0 0| 0 0 | 1 0
POLK COUNTY
| 1 1| 12 0| 5 0| 3 1| 21 0 | 0 0| 0 0| 0 0| 0 0| 0 0 | 21 0
PULASKI COUNTY
| 0 0| 4 0| 3 0| 0 0| 7 0 | 0 0| 1 1| 0 0| 0 0| 1 0 | 8 0
PUTNAM COUNTY
| 0 0| 15 1| 13 1| 1 0| 29 1 | 0 0| 0 0| 0 0| 0 0| 0 0 | 29 1
QUITMAN COUNTY
| 0 0| 2 0| 0 0| 0 0| 2 0 | 0 0| 0 0| 0 0| 0 0| 0 0 | 2 0
RABUN COUNTY
| 0 0| 7 0| 1 0| 0 0| 8 0 | 0 0| 0 0| 0 0| 0 0| 0 0 | 8 0
RANDOLPH COUNTY
| 0 0| 3 0| 3 0| 1 0| 7 0 | 0 0| 0 0| 0 0| 0 0| 0 0 | 7 0
RICHMOND COUNTY
| 16 9| 142 5| 66 3| 7 2| 231 4 | 0 0| 8 7| 8 11| 1 4| 17 8 | 248 5
ROCKDALE COUNTY
| 1 1| 10 0| 7 0| 5 1| 23 0 | 0 0| 1 1| 0 0| 0 0| 1 0 | 24 0
SCHLEY COUNTY
| 0 0| 2 0| 2 0| 0 0| 4 0 | 0 0| 0 0| 0 0| 0 0| 0 0 | 4 0
SCREVEN COUNTY
| 0 0| 3 0| 2 0| 2 1| 7 0 | 0 0| 0 0| 0 0| 0 0| 0 0 | 7 0
SEMINOLE COUNTY
| 1 1| 5 0| 5 0| 1 0| 12 0 | 0 0| 1 1| 0 0| 0 0| 1 0 | 13 0
SPALDING COUNTY
| 3 2| 35 1| 22 1| 5 1| 65 1 | 1 13| 1 1| 1 1| 1 4| 4 2 | 69 1
STEPHENS COUNTY
| 0 0| 5 0| 6 0| 4 1| 15 0 | 0 0| 0 0| 0 0| 0 0| 0 0 | 15 0
STEWART COUNTY
| 0 0| 2 0| 2 0| 0 0| 4 0 | 0 0| 0 0| 0 0| 0 0| 0 0 | 4 0
SUMTER COUNTY
| 0 0| 3 0| 15 1| 2 1| 20 0 | 0 0| 0 0| 1 1| 0 0| 1 0 | 21 0
TALBOT COUNTY
| 2 1| 2 0| 1 0| 0 0| 5 0 | 0 0| 0 0| 1 1| 0 0| 1 0 | 6 0
TALIAFERRO COUNTY | 0 0| 0 0| 1 0| 0 0| 1 0 | 0 0| 0 0| 0 0| 0 0| 0 0 | 1 0
TATTNALL COUNTY
| 1 1| 16 1| 4 0| 0 0| 21 0 | 0 0| 0 0| 1 1| 0 0| 1 0 | 22 0
TAYLOR COUNTY
| 1 1| 11 0| 3 0| 1 0| 16 0 | 0 0| 0 0| 0 0| 0 0| 0 0 | 16 0
TELFAIR COUNTY
| 1 1| 6 0| 3 0| 0 0| 10 0 | 0 0| 0 0| 1 1| 0 0| 1 0 | 11 0
TERRELL COUNTY
| 2 1| 11 0| 1 0| 0 0| 14 0 | 0 0| 0 0| 0 0| 0 0| 0 0 | 14 0
THOMAS COUNTY
| 2 1| 15 1| 15 1| 4 1| 36 1 | 0 0| 2 2| 0 0| 0 0| 2 1 | 38 1
TIFT COUNTY
| 3 2| 29 1| 20 1| 4 1| 56 1 | 0 0| 0 0| 0 0| 1 4| 1 0 | 57 1
TOOMBS COUNTY
| 2 1| 13 0| 9 0| 0 0| 24 0 | 0 0| 1 1| 0 0| 0 0| 1 0 | 25 0
TOWNS COUNTY
| 0 0| 0 0| 0 0| 0 0| 0 0 | 0 0| 0 0| 0 0| 0 0| 0 0 | 0 0
TREUTLEN COUNTY
| 0 0| 2 0| 3 0| 0 0| 5 0 | 0 0| 0 0| 0 0| 0 0| 0 0 | 5 0
TROUP COUNTY
| 2 1| 21 1| 18 1| 4 1| 45 1 | 0 0| 1 1| 1 1| 0 0| 2 1 | 47 1
------------------------------------------------------------------------------------------------------------------------------------
(continued)
Page 35 Run 09/20/00
Georgia Department of Corrections Office of Planning and Analysis
Inmate statistical profile
Sample: ACTIVE PRISONERS SERVING LIFE EXCLUDING JAIL
Requestor:
Active inmates 09/20/2000
Home County by current age & sex
Statistics (CONTINUED)
|
MEN
|
WOMEN
|
| Age | Age | Age | Age | Men
| Age | Age | Age | Age |Women
|Grand
Home County
|00-21 %|22-39 %|40-54 %|55-99 %|Total % |00-21 %|22-39 %|40-54 %|55-99 %|Total % |Total %
------------------------------------------------------------------------------------------------------------------------------------
TURNER COUNTY
| 0 0| 8 0| 4 0| 0 0| 12 0 | 0 0| 0 0| 0 0| 0 0| 0 0 | 12 0
TWIGGS COUNTY
| 0 0| 5 0| 4 0| 0 0| 9 0 | 0 0| 0 0| 0 0| 0 0| 0 0 | 9 0
UNION COUNTY
| 0 0| 0 0| 0 0| 0 0| 0 0 | 0 0| 0 0| 0 0| 0 0| 0 0 | 0 0
UPSON COUNTY
| 0 0| 6 0| 5 0| 0 0| 11 0 | 0 0| 0 0| 1 1| 0 0| 1 0 | 12 0
WALKER COUNTY
| 1 1| 15 1| 6 0| 3 1| 25 0 | 0 0| 1 1| 1 1| 0 0| 2 1 | 27 0
WALTON COUNTY
| 2 1| 27 1| 17 1| 3 1| 49 1 | 0 0| 1 1| 0 0| 0 0| 1 0 | 50 1
WARE COUNTY
| 1 1| 15 1| 14 1| 2 1| 32 1 | 0 0| 0 0| 0 0| 0 0| 0 0 | 32 1
WARREN COUNTY
| 0 0| 3 0| 5 0| 1 0| 9 0 | 0 0| 0 0| 0 0| 0 0| 0 0 | 9 0
WASHINGTON COUNTY | 0 0| 13 0| 8 0| 0 0| 21 0 | 0 0| 1 1| 0 0| 0 0| 1 0 | 22 0
WAYNE COUNTY
| 0 0| 7 0| 13 1| 2 1| 22 0 | 0 0| 1 1| 0 0| 0 0| 1 0 | 23 0
WEBSTER COUNTY
| 0 0| 2 0| 0 0| 0 0| 2 0 | 0 0| 0 0| 0 0| 0 0| 0 0 | 2 0
WHEELER COUNTY
| 0 0| 1 0| 3 0| 1 0| 5 0 | 0 0| 0 0| 0 0| 0 0| 0 0 | 5 0
WHITE COUNTY
| 0 0| 3 0| 3 0| 1 0| 7 0 | 0 0| 0 0| 0 0| 0 0| 0 0 | 7 0
WHITFIELD COUNTY | 0 0| 11 0| 24 1| 5 1| 40 1 | 0 0| 2 2| 0 0| 0 0| 2 1 | 42 1
WILCOX COUNTY
| 0 0| 0 0| 6 0| 0 0| 6 0 | 0 0| 0 0| 0 0| 0 0| 0 0 | 6 0
WILKES COUNTY
| 0 0| 2 0| 3 0| 2 1| 7 0 | 0 0| 0 0| 0 0| 0 0| 0 0 | 7 0
WILKINSON COUNTY | 0 0| 7 0| 3 0| 0 0| 10 0 | 0 0| 0 0| 0 0| 0 0| 0 0 | 10 0
WORTH COUNTY
| 3 2| 12 0| 2 0| 0 0| 17 0 | 0 0| 1 1| 0 0| 0 0| 1 0 | 18 0
OUT OF STATE
| 0 2| 12 0| 56 3| 16 4| 84 2 | 0 0| 0 1| 0 0| 0 0| 0 0 | 84 2
------------------------------------------------------------------------------------------------------------------------------------
Total reported
| 182 100| 2763 100| 1897 100| 368 100| 5210 100 | 8 100| 119 100| 74 100| 24 100| 225 100 | 5435 100
|
|
|
|
|
|
|
|
|
|
|
Percent reported |
93.8|
90.8|
92.3|
91.3|
91.5 |
88.9|
93.0|
90.2|
96.0|
92.2 |
91.5
|
|
|
|
|
|
|
|
|
|
|
|
|
|
|
|
|
|
|
|
|
|
UNKNOWN
| 12 | 279 | 158 | 35 | 484
| 1 | 9 | 8 | 1 | 19
| 503
------------------------------------------------------------------------------------------------------------------------------------
Total
| 194 | 3042 | 2055 | 403 | 5694
| 9 | 128 | 82 | 25 | 244
| 5938
Georgia Department of Corrections
Page 36 Run 09/20/00
Office of Planning and Analysis
Inmate statistical profile
Sample: ACTIVE PRISONERS SERVING LIFE EXCLUDING JAIL
Requestor: Statistics
Active inmates 09/20/2000
Prison Sentence In Years by current age & sex
|
MEN
|
WOMEN
|
| Age | Age | Age | Age | Men
| Age | Age | Age | Age |Women
|Grand
Sentence In Years |00-21 %|22-39 %|40-54 %|55-99 %|Total % |00-21 %|22-39 %|40-54 %|55-99 %|Total % |Total %
------------------------------------------------------------------------------------------------------------------------------------
0-1
| 0 0| 0 0| 0 0| 0 0| 0 0 | 0 0| 0 0| 0 0| 0 0| 0 0 | 0 0
1.1-2
| 0 0| 0 0| 0 0| 0 0| 0 0 | 0 0| 0 0| 0 0| 0 0| 0 0 | 0 0
2.1-3
| 0 0| 0 0| 0 0| 0 0| 0 0 | 0 0| 0 0| 0 0| 0 0| 0 0 | 0 0
3.1-4
| 0 0| 0 0| 0 0| 0 0| 0 0 | 0 0| 0 0| 0 0| 0 0| 0 0 | 0 0
4.1-5
| 0 0| 0 0| 0 0| 0 0| 0 0 | 0 0| 0 0| 0 0| 0 0| 0 0 | 0 0
5.1-6
| 0 0| 0 0| 0 0| 0 0| 0 0 | 0 0| 0 0| 0 0| 0 0| 0 0 | 0 0
6.1-7
| 0 0| 0 0| 0 0| 0 0| 0 0 | 0 0| 0 0| 0 0| 0 0| 0 0 | 0 0
7.1-8
| 0 0| 0 0| 0 0| 0 0| 0 0 | 0 0| 0 0| 0 0| 0 0| 0 0 | 0 0
8.1-9
| 0 0| 0 0| 0 0| 0 0| 0 0 | 0 0| 0 0| 0 0| 0 0| 0 0 | 0 0
9.1-10
| 0 0| 0 0| 0 0| 0 0| 0 0 | 0 0| 0 0| 0 0| 0 0| 0 0 | 0 0
10.1-12
| 0 0| 0 0| 0 0| 0 0| 0 0 | 0 0| 0 0| 0 0| 0 0| 0 0 | 0 0
12.1-15
| 0 0| 0 0| 0 0| 0 0| 0 0 | 0 0| 0 0| 0 0| 0 0| 0 0 | 0 0
15.1-20
| 0 0| 0 0| 0 0| 0 0| 0 0 | 0 0| 0 0| 0 0| 0 0| 0 0 | 0 0
20.1-OVER
| 0 0| 0 0| 0 0| 0 0| 0 0 | 0 0| 0 0| 0 0| 0 0| 0 0 | 0 0
LIFE
| 194 100| 3042 100| 2055 100| 403 100| 5694 100 | 9 100| 128 100| 82 100| 25 100| 244 100 | 5938 100
DEATH
| 0 0| 0 0| 0 0| 0 0| 0 0 | 0 0| 0 0| 0 0| 0 0| 0 0 | 0 0
LIFE W/O PAROLE
| 0 0| 0 0| 0 0| 0 0| 0 0 | 0 0| 0 0| 0 0| 0 0| 0 0 | 0 0
YOUTHFUL OFFENDERS | 0 0| 0 0| 0 0| 0 0| 0 0 | 0 0| 0 0| 0 0| 0 0| 0 0 | 0 0
------------------------------------------------------------------------------------------------------------------------------------
Total reported
| 194 100| 3042 100| 2055 100| 403 100| 5694 100 | 9 100| 128 100| 82 100| 25 100| 244 100 | 5938 100
|
|
|
|
|
|
|
|
|
|
|
Percent reported | 100.0| 100.0| 100.0| 100.0| 100.0 | 100.0| 100.0| 100.0| 100.0| 100.0 | 100.0
|
|
|
|
|
|
|
|
|
|
|
|
|
|
|
|
|
|
|
|
|
|
NOT REPORTED
|0|0|0|0|0
|0|0|0|0|0
|0
------------------------------------------------------------------------------------------------------------------------------------
Total
| 194 | 3042 | 2055 | 403 | 5694
| 9 | 128 | 82 | 25 | 244
| 5938
|
|
|
|
|
|
|
|
|
|
|
|
|
|
|
|
|
|
|
|
|
|
|
|
|
|
|
|
|
|
|
|
|
|
|
|
|
|
|
|
|
|
|
|
|
|
|
|
|
|
|
|
|
|
|
AVG EXCLUDING
|
|
|
|
|
|
|
|
|
|
|
LIFE, DEATH, YO
| .00 | .00 | .00 | .00 | .00 | .00 | .00 | .00 | .00 | .00 | .00
|
|
|
|
|
|
|
|
|
|
|
|
|
|
|
|
|
|
|
|
|
|
|
|
|
|
|
|
|
|
|
|
|
|
|
|
|
|
|
|
|
|
|
|
|
|
|
|
|
|
|
|
|
|
|
AVG INCLUDING
|
|
|
|
|
|
|
|
|
|
|
LIFE=21, YO=3 YRS | 21.00 | 21.00 | 21.00 | 21.00 | 21.00 | 21.00 | 21.00 | 21.00 | 21.00 | 21.00 | 21.00
Page 37 Run 09/20/00
Georgia Department of Corrections Office of Planning and Analysis
Inmate statistical profile
Sample: ACTIVE PRISONERS SERVING LIFE EXCLUDING JAIL
Requestor: Statistics
Active inmates 09/20/2000
Probation To Follow Prison by current age & sex
|
MEN
|
WOMEN
|
| Age | Age | Age | Age | Men
| Age | Age | Age | Age |Women
|Grand
Prob After Prison |00-21 %|22-39 %|40-54 %|55-99 %|Total % |00-21 %|22-39 %|40-54 %|55-99 %|Total % |Total %
------------------------------------------------------------------------------------------------------------------------------------
PROBATION TO FOLLOW | 9 5| 91 3| 61 3| 6 1| 167 3 | 0 0| 3 2| 3 4| 1 4| 7 3 | 174 3
NO PROBATION
| 185 95| 2951 97| 1994 97| 397 99| 5527 97 | 9 100| 125 98| 79 96| 24 96| 237 97 | 5764 97
------------------------------------------------------------------------------------------------------------------------------------
Total reported
| 194 100| 3042 100| 2055 100| 403 100| 5694 100 | 9 100| 128 100| 82 100| 25 100| 244 100 | 5938 100
|
|
|
|
|
|
|
|
|
|
|
Percent reported | 100.0| 100.0| 100.0| 100.0| 100.0 | 100.0| 100.0| 100.0| 100.0| 100.0 | 100.0
|
|
|
|
|
|
|
|
|
|
|
|
|
|
|
|
|
|
|
|
|
|
NOT REPORTED
|0|0|0|0|0
|0|0|0|0|0
|0
------------------------------------------------------------------------------------------------------------------------------------
Total
| 194 | 3042 | 2055 | 403 | 5694
| 9 | 128 | 82 | 25 | 244
| 5938
Page 38 Run 09/20/00
Georgia Department of Corrections Office of Planning and Analysis
Inmate statistical profile
Sample: ACTIVE PRISONERS SERVING LIFE EXCLUDING JAIL
Requestor: Statistics
Active inmates 09/20/2000
Admission Type by current age & sex
|
MEN
|
WOMEN
|
| Age | Age | Age | Age | Men
| Age | Age | Age | Age |Women
|Grand
Admission Type
|00-21 %|22-39 %|40-54 %|55-99 %|Total % |00-21 %|22-39 %|40-54 %|55-99 %|Total % |Total %
------------------------------------------------------------------------------------------------------------------------------------
COMMITTED FROM COURT| 192 99| 2463 81| 1503 73| 288 71| 4446 78 | 9 100| 117 91| 70 85| 25 100| 221 91 | 4667 79
RETURN APPEAL/BOND | 0 0| 0 0| 1 0| 0 0| 1 0 | 0 0| 0 0| 0 0| 0 0| 0 0 | 1 0
PAROLE REV/NEW SENT | 0 0| 370 12| 340 17| 72 18| 782 14 | 0 0| 7 5| 7 9| 0 0| 14 6 | 796 13
PAR REV/NO NEW SENT | 0 0| 20 1| 69 3| 8 2| 97 2 | 0 0| 1 1| 1 1| 0 0| 2 1 | 99 2
PROB VIOL/TOTAL REV | 0 0| 0 0| 0 0| 0 0| 0 0 | 0 0| 0 0| 0 0| 0 0| 0 0 | 0 0
PROB VIOL/PARTIAL | 0 0| 37 1| 39 2| 3 1| 79 1 | 0 0| 0 0| 2 2| 0 0| 2 1 | 81 1
ADMIT FM OTHER CUST | 0 0| 1 0| 2 0| 4 1| 7 0 | 0 0| 0 0| 0 0| 0 0| 0 0 | 7 0
SHOCK INCARCERATION | 0 0| 0 0| 0 0| 0 0| 0 0 | 0 0| 0 0| 0 0| 0 0| 0 0 | 0 0
PROB REV/REMAINDER | 1 1| 116 4| 45 2| 7 2| 169 3 | 0 0| 3 2| 2 2| 0 0| 5 2 | 174 3
NEW SENT/PAR REV PND| 0 0| 2 0| 4 0| 1 0| 7 0 | 0 0| 0 0| 0 0| 0 0| 0 0 | 7 0
LIFE W/O PAROLE
| 1 1| 9 0| 3 0| 0 0| 13 0 | 0 0| 0 0| 0 0| 0 0| 0 0 | 13 0
PAROLE REV BOOT CAMP| 0 0| 2 0| 1 0| 0 0| 3 0 | 0 0| 0 0| 0 0| 0 0| 0 0 | 3 0
PAR REV/RSN UNKNOWN | 0 0| 18 1| 39 2| 19 5| 76 1 | 0 0| 0 0| 0 0| 0 0| 0 0 | 76 1
PROBATION/PAROLE REV| 0 0| 0 0| 0 0| 0 0| 0 0 | 0 0| 0 0| 0 0| 0 0| 0 0 | 0 0
PB PAROLE RESCINDED | 0 0| 0 0| 0 0| 0 0| 0 0 | 0 0| 0 0| 0 0| 0 0| 0 0 | 0 0
PROB REVOCATION/SC | 0 0| 0 0| 0 0| 0 0| 0 0 | 0 0| 0 0| 0 0| 0 0| 0 0 | 0 0
PAR REV/REVOC CENTER| 0 0| 3 0| 8 0| 1 0| 12 0 | 0 0| 0 0| 0 0| 0 0| 0 0 | 12 0
INFORMATION ONLY | 0 0| 0 0| 0 0| 0 0| 0 0 | 0 0| 0 0| 0 0| 0 0| 0 0 | 0 0
INCOMPLETE SENT PKG | 0 0| 0 0| 0 0| 0 0| 0 0 | 0 0| 0 0| 0 0| 0 0| 0 0 | 0 0
HANCOCK REVOC CENTER| 0 0| 0 0| 0 0| 0 0| 0 0 | 0 0| 0 0| 0 0| 0 0| 0 0 | 0 0
WHITWORTH DETENTION | 0 0| 0 0| 1 0| 0 0| 1 0 | 0 0| 0 0| 0 0| 0 0| 0 0 | 1 0
DCYS AT RISK
| 0 0| 0 0| 0 0| 0 0| 0 0 | 0 0| 0 0| 0 0| 0 0| 0 0 | 0 0
OTHER
| 0 0| 0 0| 0 0| 0 0| 0 0 | 0 0| 0 0| 0 0| 0 0| 0 0 | 0 0
------------------------------------------------------------------------------------------------------------------------------------
Total reported
| 194 100| 3041 100| 2055 100| 403 100| 5693 100 | 9 100| 128 100| 82 100| 25 100| 244 100 | 5937 100
|
|
|
|
|
|
|
|
|
|
|
Percent reported | 100.0| 100.0| 100.0| 100.0| 100.0 | 100.0| 100.0| 100.0| 100.0| 100.0 | 100.0
|
|
|
|
|
|
|
|
|
|
|
|
|
|
|
|
|
|
|
|
|
|
UNKNOWN
|0|1|0|0|1
|0|0|0|0|0
|1
------------------------------------------------------------------------------------------------------------------------------------
Total
| 194 | 3042 | 2055 | 403 | 5694
| 9 | 128 | 82 | 25 | 244
| 5938
Page 39 Run 09/20/00
Georgia Department of Corrections Office of Planning and Analysis
Inmate statistical profile
Sample: ACTIVE PRISONERS SERVING LIFE EXCLUDING JAIL
Requestor: Statistics
Active inmates 09/20/2000
Release Type by current age & sex
|
MEN
|
WOMEN
|
| Age | Age | Age | Age | Men
| Age | Age | Age | Age |Women
|Grand
Release Type
|00-21 %|22-39 %|40-54 %|55-99 %|Total % |00-21 %|22-39 %|40-54 %|55-99 %|Total % |Total %
------------------------------------------------------------------------------------------------------------------------------------
PAROLE
| 0 0| 1 0| 0 0| 0 0| 1 0 | 0 0| 0 0| 0 0| 0 0| 0 0 | 1 0
Active
| 194 100| 3042 100| 2055 100| 403 100| 5694 100 | 9 100| 128 100| 82 100| 25 100| 244 100 | 5938 100
------------------------------------------------------------------------------------------------------------------------------------
Total
| 194 | 3042 | 2055 | 403 | 5694
| 9 | 128 | 82 | 25 | 244
| 5938
Page 40 Run 09/20/00
Georgia Department of Corrections Office of Planning and Analysis
Inmate statistical profile
Sample: ACTIVE PRISONERS SERVING LIFE EXCLUDING JAIL
Requestor: Statistics
Active inmates 09/20/2000
Inst By Group by current age & sex
|
MEN
|
WOMEN
|
| Age | Age | Age | Age | Men
| Age | Age | Age | Age |Women
|Grand
Inst By Group
|00-21 %|22-39 %|40-54 %|55-99 %|Total % |00-21 %|22-39 %|40-54 %|55-99 %|Total % |Total %
------------------------------------------------------------------------------------------------------------------------------------
County jails
| 0 0| 0 0| 0 0| 0 0| 0 0 | 0 0| 0 0| 0 0| 0 0| 0 0 | 0 0
Transitional centers| 0 0| 16 1| 22 1| 6 1| 44 1 | 0 0| 1 1| 0 0| 1 4| 2 1 | 46 1
County camps
| 0 0| 13 0| 9 0| 4 1| 26 0 | 0 0| 0 0| 0 0| 0 0| 0 0 | 26 0
Inmate boot camps | 0 0| 0 0| 0 0| 0 0| 0 0 | 0 0| 0 0| 0 0| 0 0| 0 0 | 0 0
State prisons
| 194 100| 2915 96| 1963 96| 382 95| 5454 96 | 9 100| 127 99| 82 100| 24 96| 242 99 | 5696 96
Private prisons
| 0 0| 98 3| 61 3| 11 3| 170 3 | 0 0| 0 0| 0 0| 0 0| 0 0 | 170 3
Other
| 0 0| 0 0| 0 0| 0 0| 0 0 | 0 0| 0 0| 0 0| 0 0| 0 0 | 0 0
------------------------------------------------------------------------------------------------------------------------------------
Total reported
| 194 100| 3042 100| 2055 100| 403 100| 5694 100 | 9 100| 128 100| 82 100| 25 100| 244 100 | 5938 100
|
|
|
|
|
|
|
|
|
|
|
Percent reported | 100.0| 100.0| 100.0| 100.0| 100.0 | 100.0| 100.0| 100.0| 100.0| 100.0 | 100.0
|
|
|
|
|
|
|
|
|
|
|
|
|
|
|
|
|
|
|
|
|
|
Not reported
|0|0|0|0|0
|0|0|0|0|0
|0
------------------------------------------------------------------------------------------------------------------------------------
Total
| 194 | 3042 | 2055 | 403 | 5694
| 9 | 128 | 82 | 25 | 244
| 5938
Page 41 Run 09/20/00
Georgia Department of Corrections Office of Planning and Analysis
Inmate statistical profile
Sample: ACTIVE PRISONERS SERVING LIFE EXCLUDING JAIL
Requestor: Statistics
Active inmates 09/20/2000
Institution by current age & sex
|
MEN
|
WOMEN
|
| Age | Age | Age | Age | Men
| Age | Age | Age | Age |Women
|Grand
Institution
|00-21 %|22-39 %|40-54 %|55-99 %|Total % |00-21 %|22-39 %|40-54 %|55-99 %|Total % |Total %
------------------------------------------------------------------------------------------------------------------------------------
Albany Trans Ctr | 0 0| 0 0| 2 0| 0 0| 2 0 | 0 0| 0 0| 0 0| 0 0| 0 0 | 2 0
Atlanta Trans Ctr(M)| 0 0| 11 0| 14 1| 5 1| 30 1 | 0 0| 0 0| 0 0| 0 0| 0 0 | 30 1
Macon Trans Ctr
| 0 0| 3 0| 3 0| 0 0| 6 0 | 0 0| 0 0| 0 0| 0 0| 0 0 | 6 0
Metro Trans Ctr (W) | 0 0| 0 0| 0 0| 0 0| 0 0 | 0 0| 0 0| 0 0| 1 4| 1 0 | 1 0
Savannah Trans Ctr | 0 0| 2 0| 3 0| 1 0| 6 0 | 0 0| 0 0| 0 0| 0 0| 0 0 | 6 0
Savannah Womens TC | 0 0| 0 0| 0 0| 0 0| 0 0 | 0 0| 1 1| 0 0| 0 0| 1 0 | 1 0
Carroll County
| 0 0| 0 0| 0 0| 1 0| 1 0 | 0 0| 0 0| 0 0| 0 0| 0 0 | 1 0
Clarke County
| 0 0| 1 0| 0 0| 0 0| 1 0 | 0 0| 0 0| 0 0| 0 0| 0 0 | 1 0
Colquitt County
| 0 0| 0 0| 1 0| 0 0| 1 0 | 0 0| 0 0| 0 0| 0 0| 0 0 | 1 0
Coweta County
| 0 0| 3 0| 1 0| 0 0| 4 0 | 0 0| 0 0| 0 0| 0 0| 0 0 | 4 0
Floyd County
| 0 0| 0 0| 1 0| 0 0| 1 0 | 0 0| 0 0| 0 0| 0 0| 0 0 | 1 0
Hall County
| 0 0| 2 0| 2 0| 0 0| 4 0 | 0 0| 0 0| 0 0| 0 0| 0 0 | 4 0
Jackson County
| 0 0| 1 0| 2 0| 1 0| 4 0 | 0 0| 0 0| 0 0| 0 0| 0 0 | 4 0
Jefferson County | 0 0| 2 0| 1 0| 0 0| 3 0 | 0 0| 0 0| 0 0| 0 0| 0 0 | 3 0
Mitchell County
| 0 0| 0 0| 1 0| 0 0| 1 0 | 0 0| 0 0| 0 0| 0 0| 0 0 | 1 0
Screven County
| 0 0| 1 0| 0 0| 0 0| 1 0 | 0 0| 0 0| 0 0| 0 0| 0 0 | 1 0
Stewart County
| 0 0| 0 0| 0 0| 1 0| 1 0 | 0 0| 0 0| 0 0| 0 0| 0 0 | 1 0
Terrell County
| 0 0| 0 0| 0 0| 1 0| 1 0 | 0 0| 0 0| 0 0| 0 0| 0 0 | 1 0
Clayton County
| 0 0| 3 0| 0 0| 0 0| 3 0 | 0 0| 0 0| 0 0| 0 0| 0 0 | 3 0
Ware Prison
| 14 7| 210 7| 103 5| 10 2| 337 6 | 0 0| 0 0| 0 0| 0 0| 0 0 | 337 6
Lowndes Prison
| 0 0| 5 0| 7 0| 1 0| 13 0 | 0 0| 0 0| 0 0| 0 0| 0 0 | 13 0
Dodge Prison
| 0 0| 56 2| 64 3| 5 1| 125 2 | 0 0| 0 0| 0 0| 0 0| 0 0 | 125 2
Phillips Prison
| 6 3| 129 4| 88 4| 21 5| 244 4 | 0 0| 0 0| 0 0| 0 0| 0 0 | 244 4
Walker Prison
| 0 0| 23 1| 28 1| 4 1| 55 1 | 0 0| 0 0| 0 0| 0 0| 0 0 | 55 1
Wayne Prison
| 0 0| 3 0| 4 0| 0 0| 7 0 | 0 0| 0 0| 0 0| 0 0| 0 0 | 7 0
Arrendale Prison | 51 26| 103 3| 23 1| 1 0| 178 3 | 0 0| 0 0| 0 0| 0 0| 0 0 | 178 3
Montgomery Prison | 0 0| 15 0| 14 1| 3 1| 32 1 | 0 0| 0 0| 0 0| 0 0| 0 0 | 32 1
Lee Prison
| 1 1| 24 1| 17 1| 1 0| 43 1 | 0 0| 0 0| 0 0| 0 0| 0 0 | 43 1
Putnam Prison
| 0 0| 5 0| 0 0| 0 0| 5 0 | 0 0| 0 0| 0 0| 0 0| 0 0 | 5 0
Georgia State Prison| 5 3| 278 9| 208 10| 17 4| 508 9 | 0 0| 0 0| 0 0| 0 0| 0 0 | 508 9
Mens Prison
| 0 0| 14 0| 32 2| 76 19| 122 2 | 0 0| 0 0| 0 0| 0 0| 0 0 | 122 2
Jackson Prison-Diag | 7 4| 30 1| 4 0| 2 0| 43 1 | 0 0| 0 0| 0 0| 0 0| 0 0 | 43 1
Jackson Prison-Perm | 0 0| 3 0| 1 0| 0 0| 4 0 | 0 0| 0 0| 0 0| 0 0| 0 0 | 4 0
Coastal Prison
| 8 4| 42 1| 17 1| 1 0| 68 1 | 0 0| 0 0| 0 0| 0 0| 0 0 | 68 1
Scott Prison
| 0 0| 68 2| 46 2| 11 3| 125 2 | 0 0| 0 0| 0 0| 0 0| 0 0 | 125 2
Rivers Prison
| 0 0| 71 2| 65 3| 9 2| 145 3 | 0 0| 0 0| 0 0| 0 0| 0 0 | 145 2
------------------------------------------------------------------------------------------------------------------------------------
(continued)
Page 42 Run 09/20/00
Georgia Department of Corrections Office of Planning and Analysis
Inmate statistical profile
Sample: ACTIVE PRISONERS SERVING LIFE EXCLUDING JAIL
Requestor:
Active inmates 09/20/2000
Institution by current age & sex
Statistics (CONTINUED)
|
MEN
|
WOMEN
|
| Age | Age | Age | Age | Men
| Age | Age | Age | Age |Women
|Grand
Institution
|00-21 %|22-39 %|40-54 %|55-99 %|Total % |00-21 %|22-39 %|40-54 %|55-99 %|Total % |Total %
------------------------------------------------------------------------------------------------------------------------------------
Rutledge Prison
| 0 0| 45 1| 63 3| 18 4| 126 2 | 0 0| 0 0| 0 0| 0 0| 0 0 | 126 2
Central Prison
| 0 0| 89 3| 112 5| 19 5| 220 4 | 0 0| 0 0| 0 0| 0 0| 0 0 | 220 4
Augusta Med Prison | 3 2| 74 2| 82 4| 25 6| 184 3 | 0 0| 0 0| 0 0| 0 0| 0 0 | 184 3
Rogers Prison
| 0 0| 27 1| 20 1| 0 0| 47 1 | 0 0| 0 0| 0 0| 0 0| 0 0 | 47 1
Burruss Prison
| 0 0| 5 0| 10 0| 2 0| 17 0 | 0 0| 0 0| 0 0| 0 0| 0 0 | 17 0
Bostick Prison
| 0 0| 10 0| 26 1| 28 7| 64 1 | 0 0| 0 0| 0 0| 0 0| 0 0 | 64 1
Valdosta Prison
| 7 4| 159 5| 97 5| 15 4| 278 5 | 0 0| 0 0| 0 0| 0 0| 0 0 | 278 5
Hays Prison
| 8 4| 164 5| 111 5| 15 4| 298 5 | 0 0| 0 0| 0 0| 0 0| 0 0 | 298 5
Hancock Prison
| 7 4| 226 7| 109 5| 18 4| 360 6 | 0 0| 0 0| 0 0| 0 0| 0 0 | 360 6
Telfair Prison
| 16 8| 200 7| 102 5| 10 2| 328 6 | 0 0| 0 0| 0 0| 0 0| 0 0 | 328 6
Autry Prison
| 7 4| 141 5| 97 5| 18 4| 263 5 | 0 0| 0 0| 0 0| 0 0| 0 0 | 263 4
Wilcox Prison
| 0 0| 66 2| 74 4| 6 1| 146 3 | 0 0| 0 0| 0 0| 0 0| 0 0 | 146 2
Calhoun Prison
| 11 6| 79 3| 56 3| 5 1| 151 3 | 0 0| 0 0| 0 0| 0 0| 0 0 | 151 3
Dooly Prison
| 0 0| 58 2| 74 4| 7 2| 139 2 | 0 0| 0 0| 0 0| 0 0| 0 0 | 139 2
Macon Prison
| 23 12| 267 9| 97 5| 22 5| 409 7 | 0 0| 0 0| 0 0| 0 0| 0 0 | 409 7
Smith Prison
| 16 8| 196 6| 78 4| 9 2| 299 5 | 0 0| 0 0| 0 0| 0 0| 0 0 | 299 5
Homerville Prison | 0 0| 1 0| 2 0| 0 0| 3 0 | 0 0| 0 0| 0 0| 0 0| 0 0 | 3 0
Washingtn Women Pris| 0 0| 0 0| 0 0| 0 0| 0 0 | 2 22| 37 29| 24 29| 8 32| 71 29 | 71 1
Baldwin Prison
| 4 2| 18 1| 23 1| 3 1| 48 1 | 0 0| 0 0| 0 0| 0 0| 0 0 | 48 1
Metro Womens Prison | 0 0| 0 0| 0 0| 0 0| 0 0 | 3 33| 25 20| 28 34| 8 32| 64 26 | 64 1
Pulaski Womens Pris | 0 0| 0 0| 0 0| 0 0| 0 0 | 4 44| 65 51| 30 37| 8 32| 107 44 | 107 2
Pelham PreTrans Unit| 0 0| 8 0| 7 0| 0 0| 15 0 | 0 0| 0 0| 0 0| 0 0| 0 0 | 15 0
Milan Prison
| 0 0| 0 0| 1 0| 0 0| 1 0 | 0 0| 0 0| 0 0| 0 0| 0 0 | 1 0
West Central Prison | 0 0| 3 0| 1 0| 0 0| 4 0 | 0 0| 0 0| 0 0| 0 0| 0 0 | 4 0
D Ray James Prison | 0 0| 35 1| 21 1| 3 1| 59 1 | 0 0| 0 0| 0 0| 0 0| 0 0 | 59 1
Coffee Corr Facility| 0 0| 31 1| 20 1| 4 1| 55 1 | 0 0| 0 0| 0 0| 0 0| 0 0 | 55 1
Wheeler Corr Facilty| 0 0| 32 1| 20 1| 4 1| 56 1 | 0 0| 0 0| 0 0| 0 0| 0 0 | 56 1
------------------------------------------------------------------------------------------------------------------------------------
Total reported
| 194 100| 3042 100| 2055 100| 403 100| 5694 100 | 9 100| 128 100| 82 100| 25 100| 244 100 | 5938 100
|
|
|
|
|
|
|
|
|
|
|
Percent reported | 100.0| 100.0| 100.0| 100.0| 100.0 | 100.0| 100.0| 100.0| 100.0| 100.0 | 100.0
|
|
|
|
|
|
|
|
|
|
|
|
|
|
|
|
|
|
|
|
|
|
Not Reported
|0|0|0|0|0
|0|0|0|0|0
|0
------------------------------------------------------------------------------------------------------------------------------------
Total
| 194 | 3042 | 2055 | 403 | 5694
| 9 | 128 | 82 | 25 | 244
| 5938
Page 43 Run 09/20/00
Georgia Department of Corrections Office of Planning and Analysis
Inmate statistical profile
Sample: ACTIVE PRISONERS SERVING LIFE EXCLUDING JAIL
Requestor: Statistics
Active inmates 09/20/2000
Misdemeanors And Felonies by current age & sex
|
MEN
|
WOMEN
|
| Age | Age | Age | Age | Men
| Age | Age | Age | Age |Women
|Grand
Crime Type
|00-21 %|22-39 %|40-54 %|55-99 %|Total % |00-21 %|22-39 %|40-54 %|55-99 %|Total % |Total %
------------------------------------------------------------------------------------------------------------------------------------
MISDEMEANOR
| 0 0| 0 0| 0 0| 0 0| 0 0 | 0 0| 0 0| 0 0| 0 0| 0 0 | 0 0
FELONY
| 194 100| 3042 100| 2055 100| 403 100| 5694 100 | 9 100| 128 100| 82 100| 25 100| 244 100 | 5938 100
------------------------------------------------------------------------------------------------------------------------------------
Total reported
| 194 100| 3042 100| 2055 100| 403 100| 5694 100 | 9 100| 128 100| 82 100| 25 100| 244 100 | 5938 100
|
|
|
|
|
|
|
|
|
|
|
Percent reported | 100.0| 100.0| 100.0| 100.0| 100.0 | 100.0| 100.0| 100.0| 100.0| 100.0 | 100.0
|
|
|
|
|
|
|
|
|
|
|
|
|
|
|
|
|
|
|
|
|
|
NOT REPORTED
|0|0|0|0|0
|0|0|0|0|0
|0
------------------------------------------------------------------------------------------------------------------------------------
Total
| 194 | 3042 | 2055 | 403 | 5694
| 9 | 128 | 82 | 25 | 244
| 5938
Page 44 Run 09/20/00
Georgia Department of Corrections Office of Planning and Analysis
Inmate statistical profile
Sample: ACTIVE PRISONERS SERVING LIFE EXCLUDING JAIL
Requestor: Statistics
Active inmates 09/20/2000
Crimes By Group by current age & sex
|
MEN
|
WOMEN
|
| Age | Age | Age | Age | Men
| Age | Age | Age | Age |Women
|Grand
Crimes By Group
|00-21 %|22-39 %|40-54 %|55-99 %|Total % |00-21 %|22-39 %|40-54 %|55-99 %|Total % |Total %
------------------------------------------------------------------------------------------------------------------------------------
HOMICIDE
| 148 76| 1880 62| 1214 59| 301 75| 3543 62 | 9 100| 112 88| 65 79| 25 100| 211 86 | 3754 63
ABORTION
| 0 0| 0 0| 0 0| 0 0| 0 0 | 0 0| 0 0| 0 0| 0 0| 0 0 | 0 0
BODILY INJRY&REL OFF| 14 7| 179 6| 99 5| 5 1| 297 5 | 0 0| 2 2| 5 6| 0 0| 7 3 | 304 5
ARSON & REL OFF
| 0 0| 1 0| 0 0| 0 0| 1 0 | 0 0| 0 0| 0 0| 0 0| 0 0 | 1 0
DAMAGE OF PROPERTY | 0 0| 1 0| 0 0| 0 0| 1 0 | 0 0| 0 0| 0 0| 0 0| 0 0 | 1 0
BURGLARY & REL OFF | 0 0| 20 1| 6 0| 0 0| 26 0 | 0 0| 0 0| 1 1| 0 0| 1 0 | 27 0
FORGERY & REL OFF | 0 0| 7 0| 4 0| 1 0| 12 0 | 0 0| 0 0| 0 0| 0 0| 0 0 | 12 0
THEFT
| 0 0| 7 0| 5 0| 0 0| 12 0 | 0 0| 0 0| 0 0| 0 0| 0 0 | 12 0
ROBBERY
| 22 11| 354 12| 236 11| 29 7| 641 11 | 0 0| 2 2| 1 1| 0 0| 3 1 | 644 11
SEXUAL OFFENSES
| 9 5| 344 11| 346 17| 54 13| 753 13 | 0 0| 0 0| 2 2| 0 0| 2 1 | 755 13
OBSCENITY CRIMES | 0 0| 0 0| 0 0| 0 0| 0 0 | 0 0| 0 0| 0 0| 0 0| 0 0 | 0 0
TREASON & REL OFF | 0 0| 0 0| 0 0| 0 0| 0 0 | 0 0| 0 0| 0 0| 0 0| 0 0 | 0 0
CRIMES INVOLVNG GOVT| 0 0| 7 0| 5 0| 1 0| 13 0 | 0 0| 0 0| 0 0| 0 0| 0 0 | 13 0
FALSIFICATIONS
| 0 0| 0 0| 0 0| 0 0| 0 0 | 0 0| 0 0| 0 0| 0 0| 0 0 | 0 0
OBSTRUCT LAW ENFORCE| 0 0| 1 0| 1 0| 0 0| 2 0 | 0 0| 0 0| 0 0| 0 0| 0 0 | 2 0
DISORDERLY CONDUCT | 0 0| 0 0| 0 0| 0 0| 0 0 | 0 0| 0 0| 0 0| 0 0| 0 0 | 0 0
GAMBLING & REL OFF | 0 0| 0 0| 0 0| 0 0| 0 0 | 0 0| 0 0| 0 0| 0 0| 0 0 | 0 0
CRUELTY TO CHILDREN | 0 0| 0 0| 0 0| 0 0| 0 0 | 0 0| 0 0| 0 0| 0 0| 0 0 | 0 0
CRIMES WITH GUNS | 0 0| 0 0| 1 0| 0 0| 1 0 | 0 0| 0 0| 0 0| 0 0| 0 0 | 1 0
INVASION PRIVACY | 0 0| 0 0| 0 0| 0 0| 0 0 | 0 0| 0 0| 0 0| 0 0| 0 0 | 0 0
RACKETEERING
| 0 0| 0 0| 0 0| 0 0| 0 0 | 0 0| 0 0| 0 0| 0 0| 0 0 | 0 0
DRUG ABUSE OFFENSES | 1 1| 221 7| 130 6| 10 2| 362 6 | 0 0| 12 9| 8 10| 0 0| 20 8 | 382 6
DRUG TRAFFICKING | 0 0| 18 1| 8 0| 1 0| 27 0 | 0 0| 0 0| 0 0| 0 0| 0 0 | 27 0
AUTO CRIMES
| 0 0| 0 0| 0 0| 0 0| 0 0 | 0 0| 0 0| 0 0| 0 0| 0 0 | 0 0
REVENUE & CONTRABAND| 0 0| 0 0| 0 0| 0 0| 0 0 | 0 0| 0 0| 0 0| 0 0| 0 0 | 0 0
CRIMES OF OTH STATES| 0 0| 0 0| 0 0| 0 0| 0 0 | 0 0| 0 0| 0 0| 0 0| 0 0 | 0 0
MISC. FELONIES
| 0 0| 1 0| 0 0| 1 0| 2 0 | 0 0| 0 0| 0 0| 0 0| 0 0 | 2 0
MISDEMEANORS
| 0 0| 0 0| 0 0| 0 0| 0 0 | 0 0| 0 0| 0 0| 0 0| 0 0 | 0 0
------------------------------------------------------------------------------------------------------------------------------------
Total reported
| 194 100| 3041 100| 2055 100| 403 100| 5693 100 | 9 100| 128 100| 82 100| 25 100| 244 100 | 5937 100
|
|
|
|
|
|
|
|
|
|
|
Percent reported | 100.0| 100.0| 100.0| 100.0| 100.0 | 100.0| 100.0| 100.0| 100.0| 100.0 | 100.0
|
|
|
|
|
|
|
|
|
|
|
|
|
|
|
|
|
|
|
|
|
|
NOT REPORTED
|0|1|0|0|1
|0|0|0|0|0
|1
------------------------------------------------------------------------------------------------------------------------------------
Total
| 194 | 3042 | 2055 | 403 | 5694
| 9 | 128 | 82 | 25 | 244
| 5938
Page 45 Run 09/20/00
Georgia Department of Corrections Office of Planning and Analysis
Inmate statistical profile
Sample: ACTIVE PRISONERS SERVING LIFE EXCLUDING JAIL
Requestor: Statistics
Active inmates 09/20/2000
Most Serious Offense by current age & sex
|
MEN
|
WOMEN
|
| Age | Age | Age | Age | Men
| Age | Age | Age | Age |Women
|Grand
Most Serious Offense|00-21 %|22-39 %|40-54 %|55-99 %|Total % |00-21 %|22-39 %|40-54 %|55-99 %|Total % |Total %
------------------------------------------------------------------------------------------------------------------------------------
Misdemeanors
|
|
|
------------------------------------------------------------------------------------------------------------------------------------
------------------------------------------------------------------------------------------------------------------------------------
------------------------------------------------------------------------------------------------------------------------------------
FELONIES
|
|
|
------------------------------------------------------------------------------------------------------------------------------------
------------------------------------------------------------------------------------------------------------------------------------
MISC. HOMICIDE OFFEN| 0 0| 1 0| 0 0| 0 0| 1 0 | 0 0| 0 0| 0 0| 0 0| 0 0 | 1 0
MURDER
| 148 76| 1879 62| 1214 59| 300 74| 3541 62 | 9 100| 112 88| 65 79| 25 100| 211 86 | 3752 63
VOLUNTARY MANSLAUGHT| 0 0| 1 0| 0 0| 1 0| 2 0 | 0 0| 0 0| 0 0| 0 0| 0 0 | 2 0
AGGRAVATED ASSAULT | 0 0| 8 0| 1 0| 0 0| 9 0 | 0 0| 0 0| 0 0| 0 0| 0 0 | 9 0
AGGRAVATED BATTERY | 0 0| 1 0| 0 0| 0 0| 1 0 | 0 0| 0 0| 0 0| 0 0| 0 0 | 1 0
KIDNAPPING
| 14 7| 170 6| 96 5| 5 1| 285 5 | 0 0| 2 2| 5 6| 0 0| 7 3 | 292 5
AGG ASSLT ON POLICE | 0 0| 0 0| 2 0| 0 0| 2 0 | 0 0| 0 0| 0 0| 0 0| 0 0 | 2 0
SECOND DEGREE ARSON | 0 0| 1 0| 0 0| 0 0| 1 0 | 0 0| 0 0| 0 0| 0 0| 0 0 | 1 0
CRIM. DAMAGE 2ND DEG| 0 0| 1 0| 0 0| 0 0| 1 0 | 0 0| 0 0| 0 0| 0 0| 0 0 | 1 0
BURGLARY
| 0 0| 20 1| 6 0| 0 0| 26 0 | 0 0| 0 0| 1 1| 0 0| 1 0 | 27 0
FORGERY 1ST DEGREE | 0 0| 7 0| 4 0| 1 0| 12 0 | 0 0| 0 0| 0 0| 0 0| 0 0 | 12 0
THEFT BY TAKING
| 0 0| 2 0| 3 0| 0 0| 5 0 | 0 0| 0 0| 0 0| 0 0| 0 0 | 5 0
THEFT BY REC STOLEN | 0 0| 3 0| 1 0| 0 0| 4 0 | 0 0| 0 0| 0 0| 0 0| 0 0 | 4 0
THEFT BY CONVERSION | 0 0| 1 0| 1 0| 0 0| 2 0 | 0 0| 0 0| 0 0| 0 0| 0 0 | 2 0
THEFT OF MOTOR VEH, | 0 0| 1 0| 0 0| 0 0| 1 0 | 0 0| 0 0| 0 0| 0 0| 0 0 | 1 0
ROBBERY
| 0 0| 5 0| 6 0| 4 1| 15 0 | 0 0| 0 0| 0 0| 0 0| 0 0 | 15 0
ARMED ROBBERY
| 22 11| 349 11| 230 11| 25 6| 626 11 | 0 0| 2 2| 1 1| 0 0| 3 1 | 629 11
MISC. SEXUAL
| 0 0| 1 0| 0 0| 0 0| 1 0 | 0 0| 0 0| 0 0| 0 0| 0 0 | 1 0
RAPE
| 9 5| 321 11| 312 15| 42 10| 684 12 | 0 0| 0 0| 2 2| 0 0| 2 1 | 686 12
AGGRAVATED SODOMY | 0 0| 16 1| 21 1| 9 2| 46 1 | 0 0| 0 0| 0 0| 0 0| 0 0 | 46 1
CHILD MOLESTATION | 0 0| 1 0| 3 0| 1 0| 5 0 | 0 0| 0 0| 0 0| 0 0| 0 0 | 5 0
AGGRAV. CHILD MOLEST| 0 0| 5 0| 10 0| 2 0| 17 0 | 0 0| 0 0| 0 0| 0 0| 0 0 | 17 0
OBSTR OF LAW ENF OFF| 0 0| 7 0| 5 0| 1 0| 13 0 | 0 0| 0 0| 0 0| 0 0| 0 0 | 13 0
ESCAPE
| 0 0| 1 0| 1 0| 0 0| 2 0 | 0 0| 0 0| 0 0| 0 0| 0 0 | 2 0
POSS OF CERTAIN WEAP| 0 0| 0 0| 1 0| 0 0| 1 0 | 0 0| 0 0| 0 0| 0 0| 0 0 | 1 0
S/D NARCOTICS, OPIAT| 0 0| 12 0| 13 1| 1 0| 26 0 | 0 0| 1 1| 1 1| 0 0| 2 1 | 28 0
S/D DEP,STIM,CNTRF D| 0 0| 4 0| 2 0| 0 0| 6 0 | 0 0| 0 0| 0 0| 0 0| 0 0 | 6 0
SALE/DIST OF MARIJUA| 0 0| 6 0| 5 0| 1 0| 12 0 | 0 0| 0 0| 0 0| 0 0| 0 0 | 12 0
POSS NARCOTICS, OPIA| 0 0| 5 0| 2 0| 0 0| 7 0 | 0 0| 0 0| 0 0| 0 0| 0 0 | 7 0
------------------------------------------------------------------------------------------------------------------------------------
(continued)
Page 46 Run 09/20/00
Georgia Department of Corrections Office of Planning and Analysis
Inmate statistical profile
Sample: ACTIVE PRISONERS SERVING LIFE EXCLUDING JAIL
Requestor:
Active inmates 09/20/2000
Most Serious Offense by current age & sex
Statistics (CONTINUED)
|
MEN
|
WOMEN
|
| Age | Age | Age | Age | Men
| Age | Age | Age | Age |Women
|Grand
Most Serious Offense|00-21 %|22-39 %|40-54 %|55-99 %|Total % |00-21 %|22-39 %|40-54 %|55-99 %|Total % |Total %
------------------------------------------------------------------------------------------------------------------------------------
POSS DEP,STIM,CNTRF | 0 0| 0 0| 1 0| 0 0| 1 0 | 0 0| 0 0| 0 0| 0 0| 0 0 | 1 0
VIOLATE GA CNTRL SBS| 0 0| 14 0| 6 0| 0 0| 20 0 | 0 0| 1 1| 1 1| 0 0| 2 1 | 22 0
UNLWFL MFG/DEL/DIST | 0 0| 7 0| 1 0| 0 0| 8 0 | 0 0| 0 0| 0 0| 0 0| 0 0 | 8 0
SALE/DIST CONT SUB P| 0 0| 3 0| 1 0| 0 0| 4 0 | 0 0| 0 0| 0 0| 0 0| 0 0 | 4 0
SALE/DIST CONT SUB S| 0 0| 1 0| 0 0| 0 0| 1 0 | 0 0| 0 0| 0 0| 0 0| 0 0 | 1 0
SALE/DISTRIBUTION CO| 1 1| 144 5| 83 4| 6 1| 234 4 | 0 0| 10 8| 6 7| 0 0| 16 7 | 250 4
POSSESSION OF COCAIN| 0 0| 25 1| 16 1| 2 0| 43 1 | 0 0| 0 0| 0 0| 0 0| 0 0 | 43 1
COCAINE LESS 200 GRA| 0 0| 12 0| 7 0| 1 0| 20 0 | 0 0| 0 0| 0 0| 0 0| 0 0 | 20 0
COCAINE 401 OR MORE | 0 0| 5 0| 0 0| 0 0| 5 0 | 0 0| 0 0| 0 0| 0 0| 0 0 | 5 0
NARCOTICS LESS 14 GR| 0 0| 0 0| 1 0| 0 0| 1 0 | 0 0| 0 0| 0 0| 0 0| 0 0 | 1 0
ATT/CONSPRCY COMMT C| 0 0| 1 0| 0 0| 0 0| 1 0 | 0 0| 0 0| 0 0| 0 0| 0 0 | 1 0
CONSPIRACY
| 0 0| 1 0| 0 0| 0 0| 1 0 | 0 0| 0 0| 0 0| 0 0| 0 0 | 1 0
CRIMINAL ATTEMPT | 0 0| 0 0| 0 0| 1 0| 1 0 | 0 0| 0 0| 0 0| 0 0| 0 0 | 1 0
------------------------------------------------------------------------------------------------------------------------------------
Total reported
| 194 100| 3042 100| 2055 100| 403 100| 5694 100 | 9 100| 128 100| 82 100| 25 100| 244 100 | 5938 100
|
|
|
|
|
|
|
|
|
|
|
Percent reported | 100.0| 100.0| 100.0| 100.0| 100.0 | 100.0| 100.0| 100.0| 100.0| 100.0 | 100.0
|
|
|
|
|
|
|
|
|
|
|
|
|
|
|
|
|
|
|
|
|
|
NOT REPORTED
|0|0|0|0|0
|0|0|0|0|0
|0
------------------------------------------------------------------------------------------------------------------------------------
Total
| 194 | 3042 | 2055 | 403 | 5694
| 9 | 128 | 82 | 25 | 244
| 5938
Page 47 Run 09/20/00
Georgia Department of Corrections Office of Planning and Analysis
Inmate statistical profile
Sample: ACTIVE PRISONERS SERVING LIFE EXCLUDING JAIL
Requestor: Statistics
Active inmates 09/20/2000
Most Serious Crime Type by current age & sex
|
MEN
|
WOMEN
|
| Age | Age | Age | Age | Men
| Age | Age | Age | Age |Women
|Grand
Crime Type
|00-21 %|22-39 %|40-54 %|55-99 %|Total % |00-21 %|22-39 %|40-54 %|55-99 %|Total % |Total %
------------------------------------------------------------------------------------------------------------------------------------
VIOL/PERSN
| 184 95| 2414 79| 1549 75| 335 83| 4482 79 | 9 100| 116 91| 71 87| 25 100| 221 91 | 4703 79
NVIOL/PERS
| 0 0| 0 0| 0 0| 0 0| 0 0 | 0 0| 0 0| 0 0| 0 0| 0 0 | 0 0
PROPERTY
| 0 0| 36 1| 15 1| 1 0| 52 1 | 0 0| 0 0| 1 1| 0 0| 1 0 | 53 1
DRUG SALES
| 1 1| 195 6| 113 5| 9 2| 318 6 | 0 0| 11 9| 7 9| 0 0| 18 7 | 336 6
DRUG POSSN
| 0 0| 44 1| 25 1| 2 0| 71 1 | 0 0| 1 1| 1 1| 0 0| 2 1 | 73 1
ALCOHOL
| 0 0| 0 0| 0 0| 0 0| 0 0 | 0 0| 0 0| 0 0| 0 0| 0 0 | 0 0
HABIT/DUI
| 0 0| 0 0| 0 0| 0 0| 0 0 | 0 0| 0 0| 0 0| 0 0| 0 0 | 0 0
SEX OFFEND
| 9 5| 344 11| 346 17| 54 13| 753 13 | 0 0| 0 0| 2 2| 0 0| 2 1 | 755 13
OTHER
| 0 0| 9 0| 7 0| 2 0| 18 0 | 0 0| 0 0| 0 0| 0 0| 0 0 | 18 0
------------------------------------------------------------------------------------------------------------------------------------
Total reported
| 194 100| 3042 100| 2055 100| 403 100| 5694 100 | 9 100| 128 100| 82 100| 25 100| 244 100 | 5938 100
|
|
|
|
|
|
|
|
|
|
|
Percent reported | 100.0| 100.0| 100.0| 100.0| 100.0 | 100.0| 100.0| 100.0| 100.0| 100.0 | 100.0
|
|
|
|
|
|
|
|
|
|
|
|
|
|
|
|
|
|
|
|
|
|
NOT REPORTED
|0|0|0|0|0
|0|0|0|0|0
|0
------------------------------------------------------------------------------------------------------------------------------------
Total
| 194 | 3042 | 2055 | 403 | 5694
| 9 | 128 | 82 | 25 | 244
| 5938