- Collection:
- Georgia Government Publications
- Title:
- Inmate statistical profile: active lifers, Aug. 2000
- Creator:
- Georgia. Department of Corrections. Planning and Analysis Section
- Publisher:
- Atlanta, GA. : Georgia Dept. of Corrections, Office of Planning and Analysis, 2000-08
- Date of Original:
- 2000-08
- Subject:
- Prisoners--Georgia
- Location:
- United States, Georgia, 32.75042, -83.50018
- Medium:
- state government records
- Type:
- Text
- Format:
- application/pdf
- External Identifiers:
- Call Number GA R300.P5 P1 L5 2000/8
- Metadata URL:
- https://dlg.galileo.usg.edu/id:dlg_ggpd_i-ga-br300-pp5-bp1-bl5-b2000-s8-belec-p-btext
- Digital Object URL:
- https://dlg.galileo.usg.edu/do:dlg_ggpd_i-ga-br300-pp5-bp1-bl5-b2000-s8-belec-p-btext
- Language:
- eng
- Holding Institution:
- University of Georgia. Map and Government Information Library
- Rights:
-

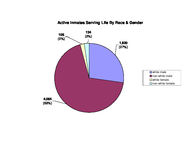
Active Inmates Serving Life By Race & Gender
108 (2%)
134 (2%)
1,620 (27%)
4,064 (69%)
white male non-white male white female non-white female
Active Inmates Serving Life By Crime Type
76 336 (1%) (6%)
753 (13%)
18 (<1%)
53 (1%)
4,690 (79%)
viol/persn
property
drug sales
drug possn
sex offend
other
Prior Incarcerations of Active Inmates Serving A Life Sentence
4000
3,570
(60%)
3500
3000
Number of Inmates
2500
2000 1500 1000
500 0
zero
1,223 (21%)
one
608 (10%)
326 (6%)
two
three
Priors
129 (2%)
four
70 (1%)
five or more
Georgia Department of Corrections
Page 1 Run 08/21/00
Office of Planning and Analysis
Inmate statistical profile TABLE OF CONTENTS FOR ACTIVE PRISONERS SERVING LIFE EXCLUDING JAIL
TITLE ----RACE AND SEX............................ 2 Culture Fair IQ Scores.................. 3 Self-Rpt Socioeconomic Class............ 4 Self-Rpt Environment To Age 16.......... 5 Self-Rpt Education Level................ 6 Functional Reading Level (WRAT Scores).. 7 Functional Math Level (WRAT Scores)..... 8 Functional Spelling Level (WRAT Scores). 9 Self-Rpt Guardian Status To Age 16......10 Self-Rpt Employment Status Before Prison11 Self-Rpt Marital Status At Admission....12 Self-Rpt Number Of Children At Admission13 Self-Rpt Religious Affiliation..........14 Self-Rpt Family Behavior Patterns *.....15 Inmate Diagnostic Behavior Problem *....16 Physical Profile (General Condition)....17 Security Status.........................18 Number Of Sentences.....................19 Number Of Disciplinaries................20 Number Of Escapes.......................21 Number Of Prior Georgia Incarcerations *22 Number Of Transfers.....................23 County Of Conviction....................24 Circuit Of Conviction...................29 Home County.............................31 Prison Sentence In Years................36 Probation To Follow Prison..............37 Admission Type..........................38 Release Type............................39 Inst By Group...........................40 Institution.............................41 Misdemeanors And Felonies...............43 Crimes By Group.........................44 Most Serious Offense....................45 Most Serious Crime Type.................47
PAGE ----
Georgia Department of Corrections
Page 2 Run 08/21/00
Office of Planning and Analysis
Inmate statistical profile
Sample: ACTIVE PRISONERS SERVING LIFE EXCLUDING JAIL
Requestor: Statistics
Active inmates 08/21/2000
RACE AND SEX by current age & sex
|
MEN
|
WOMEN
|
| Age | Age | Age | Age | Men
| Age | Age | Age | Age |Women
|Grand
RACE AND SEX
|00-21 %|22-39 %|40-54 %|55-99 %|Total % |00-21 %|22-39 %|40-54 %|55-99 %|Total % |Total %
------------------------------------------------------------------------------------------------------------------------------------
WHITE MALE
| 37 19| 691 23| 690 34| 202 50| 1620 29 | 0 0| 0 0| 0 0| 0 0| 0 0 | 1620 27
NON WHITE MALE
| 160 81| 2348 77| 1357 66| 199 50| 4064 71 | 0 0| 0 0| 0 0| 0 0| 0 0 | 4064 69
WHITE FEMALE
| 0 0| 0 0| 0 0| 0 0| 0 0 | 4 44| 47 36| 40 51| 17 65| 108 45 | 108 2
NON WHITE FEMALE | 0 0| 0 0| 0 0| 0 0| 0 0 | 5 56| 82 64| 38 49| 9 35| 134 55 | 134 2
------------------------------------------------------------------------------------------------------------------------------------
Total reported
| 197 100| 3039 100| 2047 100| 401 100| 5684 100 | 9 100| 129 100| 78 100| 26 100| 242 100 | 5926 100
|
|
|
|
|
|
|
|
|
|
|
Percent reported | 100.0| 100.0| 100.0| 100.0| 100.0 | 100.0| 100.0| 100.0| 100.0| 100.0 | 100.0
|
|
|
|
|
|
|
|
|
|
|
|
|
|
|
|
|
|
|
|
|
|
NOT REPORTED
|0|0|0|0|0
|0|0|0|0|0
|0
------------------------------------------------------------------------------------------------------------------------------------
Total
| 197 | 3039 | 2047 | 401 | 5684
| 9 | 129 | 78 | 26 | 242
| 5926
|
|
|
|
|
|
|
|
|
|
|
|
|
|
|
|
|
|
|
|
|
|
|
|
|
|
|
|
|
|
|
|
|
|
|
|
|
|
|
|
|
|
|
|
|
|
|
|
|
|
|
|
|
|
|
AVERAGE AGE
| 19.88 | 31.17 | 45.75 | 61.31 | 38.16 | 19.00 | 31.52 | 45.26 | 60.35 | 38.58 | 38.17
Page 3 Run 08/21/00
Georgia Department of Corrections Office of Planning and Analysis
Inmate statistical profile
Sample: ACTIVE PRISONERS SERVING LIFE EXCLUDING JAIL
Requestor: Statistics
Active inmates 08/21/2000
Culture Fair IQ Scores by current age & sex
|
MEN
|
WOMEN
|
| Age | Age | Age | Age | Men
| Age | Age | Age | Age |Women
|Grand
IQ Score
|00-21 %|22-39 %|40-54 %|55-99 %|Total % |00-21 %|22-39 %|40-54 %|55-99 %|Total % |Total %
------------------------------------------------------------------------------------------------------------------------------------
LESS THAN 70
| 3 2| 87 3| 153 8| 38 11| 281 5 | 0 0| 9 7| 10 13| 2 9| 21 9 | 302 5
70 AND UP
| 187 98| 2814 97| 1755 92| 315 89| 5071 95 | 8 100| 117 93| 65 87| 21 91| 211 91 | 5282 95
------------------------------------------------------------------------------------------------------------------------------------
Total reported
| 190 100| 2901 100| 1908 100| 353 100| 5352 100 | 8 100| 126 100| 75 100| 23 100| 232 100 | 5584 100
|
|
|
|
|
|
|
|
|
|
|
Percent reported |
96.4|
95.5|
93.2|
88.0|
94.2 |
88.9|
97.7|
96.2|
88.5|
95.9 |
94.2
|
|
|
|
|
|
|
|
|
|
|
|
|
|
|
|
|
|
|
|
|
|
NOT REPORTED
| 7 | 138 | 139 | 48 | 332
| 1 | 3 | 3 | 3 | 10
| 342
------------------------------------------------------------------------------------------------------------------------------------
Total
| 197 | 3039 | 2047 | 401 | 5684
| 9 | 129 | 78 | 26 | 242
| 5926
|
|
|
|
|
|
|
|
|
|
|
|
|
|
|
|
|
|
|
|
|
|
|
|
|
|
|
|
|
|
|
|
|
|
|
|
|
|
|
|
|
|
|
|
|
|
|
|
|
|
|
|
|
|
|
AVERAGE IQ
| 97.80 | 101.38 | 96.93 | 93.49 | 99.15 | 97.50 | 95.52 | 90.35 | 88.00 | 93.17 | 98.90
Page 4 Run 08/21/00
Georgia Department of Corrections Office of Planning and Analysis
Inmate statistical profile
Sample: ACTIVE PRISONERS SERVING LIFE EXCLUDING JAIL
Requestor: Statistics
Active inmates 08/21/2000
Self-Rpt Socioeconomic Class by current age & sex
|
MEN
|
WOMEN
|
| Age | Age | Age | Age | Men
| Age | Age | Age | Age |Women
|Grand
Socioeconomic Class |00-21 %|22-39 %|40-54 %|55-99 %|Total % |00-21 %|22-39 %|40-54 %|55-99 %|Total % |Total %
------------------------------------------------------------------------------------------------------------------------------------
WELFARE
| 21 11| 347 12| 196 10| 23 6| 587 11 | 0 0| 21 17| 7 9| 0 0| 28 12 | 615 11
OCC EMPLOY
| 13 7| 190 7| 68 3| 5 1| 276 5 | 0 0| 3 2| 0 0| 1 4| 4 2 | 280 5
MINIMUM STD
| 81 44| 1000 34| 881 44| 215 57| 2177 40 | 5 56| 45 35| 23 29| 8 35| 81 34 | 2258 40
MIDDLE
| 68 37| 1357 46| 833 42| 132 35| 2390 44 | 4 44| 57 45| 45 58| 13 57| 119 50 | 2509 44
OTHER
| 1 1| 27 1| 5 0| 3 1| 36 1 | 0 0| 1 1| 3 4| 1 4| 5 2 | 41 1
------------------------------------------------------------------------------------------------------------------------------------
Total reported
| 184 100| 2921 100| 1983 100| 378 100| 5466 100 | 9 100| 127 100| 78 100| 23 100| 237 100 | 5703 100
|
|
|
|
|
|
|
|
|
|
|
Percent reported |
93.4|
96.1|
96.9|
94.3|
96.2 | 100.0|
98.4| 100.0|
88.5|
97.9 |
96.2
|
|
|
|
|
|
|
|
|
|
|
|
|
|
|
|
|
|
|
|
|
|
NOT RPTD
| 13 | 118 | 64 | 23 | 218
|0|2|0|3|5
| 223
------------------------------------------------------------------------------------------------------------------------------------
Total
| 197 | 3039 | 2047 | 401 | 5684
| 9 | 129 | 78 | 26 | 242
| 5926
Page 5 Run 08/21/00
Georgia Department of Corrections Office of Planning and Analysis
Inmate statistical profile
Sample: ACTIVE PRISONERS SERVING LIFE EXCLUDING JAIL
Requestor: Statistics
Active inmates 08/21/2000
Self-Rpt Environment To Age 16 by current age & sex
|
MEN
|
WOMEN
|
| Age | Age | Age | Age | Men
| Age | Age | Age | Age |Women
|Grand
Environment
|00-21 %|22-39 %|40-54 %|55-99 %|Total % |00-21 %|22-39 %|40-54 %|55-99 %|Total % |Total %
------------------------------------------------------------------------------------------------------------------------------------
RURAL/FARM
| 0 0| 115 4| 173 9| 94 24| 382 7 | 0 0| 8 6| 4 5| 3 14| 15 6 | 397 7
RURAL/NFARM
| 3 2| 214 7| 170 9| 33 9| 420 8 | 0 0| 6 5| 3 4| 0 0| 9 4 | 429 7
S.M.S.A
| 83 42| 1217 41| 708 36| 98 25| 2106 38 | 2 22| 25 20| 21 27| 6 27| 54 23 | 2160 37
URBAN
| 37 19| 523 18| 358 18| 52 13| 970 17 | 4 44| 32 25| 21 27| 3 14| 60 25 | 1030 18
SMALL TOWN
| 74 38| 887 30| 573 29| 109 28| 1643 30 | 3 33| 56 44| 27 35| 9 41| 95 40 | 1738 30
OTHER
| 0 0| 16 1| 9 0| 0 0| 25 0 | 0 0| 0 0| 2 3| 1 5| 3 1 | 28 0
------------------------------------------------------------------------------------------------------------------------------------
Total reported
| 197 100| 2972 100| 1991 100| 386 100| 5546 100 | 9 100| 127 100| 78 100| 22 100| 236 100 | 5782 100
|
|
|
|
|
|
|
|
|
|
|
Percent reported | 100.0|
97.8|
97.3|
96.3|
97.6 | 100.0|
98.4| 100.0|
84.6|
97.5 |
97.6
|
|
|
|
|
|
|
|
|
|
|
|
|
|
|
|
|
|
|
|
|
|
NOT RPTD
| 0 | 67 | 56 | 15 | 138
|0|2|0|4|6
| 144
------------------------------------------------------------------------------------------------------------------------------------
Total
| 197 | 3039 | 2047 | 401 | 5684
| 9 | 129 | 78 | 26 | 242
| 5926
Page 6 Run 08/21/00
Georgia Department of Corrections Office of Planning and Analysis
Inmate statistical profile
Sample: ACTIVE PRISONERS SERVING LIFE EXCLUDING JAIL
Requestor: Statistics
Active inmates 08/21/2000
Self-Rpt Education Level by current age & sex
|
MEN
|
WOMEN
|
| Age | Age | Age | Age | Men
| Age | Age | Age | Age |Women
|Grand
Education Level
|00-21 %|22-39 %|40-54 %|55-99 %|Total % |00-21 %|22-39 %|40-54 %|55-99 %|Total % |Total %
------------------------------------------------------------------------------------------------------------------------------------
LESS THAN GRADE 7 | 6 3| 48 2| 107 5| 83 21| 244 4 | 0 0| 1 1| 3 4| 5 20| 9 4 | 253 4
GRADE 7
| 10 5| 82 3| 64 3| 32 8| 188 3 | 0 0| 6 5| 3 4| 1 4| 10 4 | 198 3
GRADE 8
| 43 22| 269 9| 199 10| 38 10| 549 10 | 3 33| 14 11| 8 10| 1 4| 26 11 | 575 10
GRADE 9
| 47 24| 447 15| 243 12| 33 8| 770 14 | 3 33| 17 13| 5 6| 0 0| 25 10 | 795 14
GRADE 10
| 44 22| 599 20| 285 14| 35 9| 963 17 | 2 22| 21 17| 9 12| 3 12| 35 15 | 998 17
GRADE 11
| 37 19| 551 18| 222 11| 26 7| 836 15 | 1 11| 20 16| 3 4| 2 8| 26 11 | 862 15
GRADE 12
| 8 4| 747 25| 645 32| 96 24| 1496 27 | 0 0| 28 22| 28 36| 9 36| 65 27 | 1561 27
MORE THAN GRADE 12 | 1 1| 255 9| 252 12| 49 13| 557 10 | 0 0| 20 16| 19 24| 4 16| 43 18 | 600 10
------------------------------------------------------------------------------------------------------------------------------------
Total reported
| 196 100| 2998 100| 2017 100| 392 100| 5603 100 | 9 100| 127 100| 78 100| 25 100| 239 100 | 5842 100
|
|
|
|
|
|
|
|
|
|
|
Percent reported |
99.5|
98.7|
98.5|
97.8|
98.6 | 100.0|
98.4| 100.0|
96.2|
98.8 |
98.6
|
|
|
|
|
|
|
|
|
|
|
|
|
|
|
|
|
|
|
|
|
|
NOT REPORTED
| 1 | 41 | 30 | 9 | 81
|0|2|0|1|3
| 84
------------------------------------------------------------------------------------------------------------------------------------
Total
| 197 | 3039 | 2047 | 401 | 5684
| 9 | 129 | 78 | 26 | 242
| 5926
|
|
|
|
|
|
|
|
|
|
|
|
|
|
|
|
|
|
|
|
|
|
|
|
|
|
|
|
|
|
|
|
|
|
|
|
|
|
|
|
|
|
|
|
|
|
|
|
|
|
|
|
|
|
|
AVG EDUCATION LEVEL | 9.33 | 11.04 | 11.18 | 9.75 | 10.94 | 9.11 | 11.57 | 11.86 | 11.12 | 11.53 | 10.96
* NOTE: THE FIELD LABLED "LESS THAN GRADE 7" WAS CORRECTED IN MARCH 1989: MISSING DATA FOR INMATES STILL IN DIAGNOSTICS NOW HAS BEEN REMOVED FROM THIS FIELD AND IDENTIFIED AS "NOT REPORTED" INFORMATION.
Page 7 Run 08/21/00
Georgia Department of Corrections Office of Planning and Analysis
Inmate statistical profile
Sample: ACTIVE PRISONERS SERVING LIFE EXCLUDING JAIL
Requestor: Statistics
Active inmates 08/21/2000
Functional Reading Level (WRAT Scores) by current age & sex
|
MEN
|
WOMEN
|
| Age | Age | Age | Age | Men
| Age | Age | Age | Age |Women
|Grand
WRAT Reading Score |00-21 %|22-39 %|40-54 %|55-99 %|Total % |00-21 %|22-39 %|40-54 %|55-99 %|Total % |Total %
------------------------------------------------------------------------------------------------------------------------------------
LESS THAN GRADE 6 | 85 45| 1142 39| 831 46| 162 48| 2220 42 | 2 25| 49 39| 20 27| 10 42| 81 35 | 2301 42
6TH THRU 8TH GRADE | 35 18| 671 23| 407 23| 60 18| 1173 22 | 2 25| 30 24| 16 22| 4 17| 52 23 | 1225 22
GRADE 9
| 12 6| 210 7| 104 6| 20 6| 346 7 | 1 13| 4 3| 7 10| 3 13| 15 6 | 361 7
GRADE 10
| 12 6| 131 5| 73 4| 14 4| 230 4 | 1 13| 2 2| 5 7| 2 8| 10 4 | 240 4
GRADE 11
| 6 3| 114 4| 81 4| 9 3| 210 4 | 0 0| 4 3| 5 7| 1 4| 10 4 | 220 4
GRADE 12
| 31 16| 536 18| 278 15| 67 20| 912 17 | 2 25| 7 6| 2 3| 1 4| 12 5 | 924 17
MORE THAN GRADE 12 | 9 5| 102 4| 27 1| 4 1| 142 3 | 0 0| 30 24| 18 25| 3 13| 51 22 | 193 4
------------------------------------------------------------------------------------------------------------------------------------
Total reported
| 190 100| 2906 100| 1801 100| 336 100| 5233 100 | 8 100| 126 100| 73 100| 24 100| 231 100 | 5464 100
|
|
|
|
|
|
|
|
|
|
|
Percent reported |
96.4|
95.6|
88.0|
83.8|
92.1 |
88.9|
97.7|
93.6|
92.3|
95.5 |
92.2
|
|
|
|
|
|
|
|
|
|
|
|
|
|
|
|
|
|
|
|
|
|
NOT REPORTED
| 7 | 133 | 246 | 65 | 451
| 1 | 3 | 5 | 2 | 11
| 462
------------------------------------------------------------------------------------------------------------------------------------
Total
| 197 | 3039 | 2047 | 401 | 5684
| 9 | 129 | 78 | 26 | 242
| 5926
|
|
|
|
|
|
|
|
|
|
|
|
|
|
|
|
|
|
|
|
|
|
|
|
|
|
|
|
|
|
|
|
|
|
|
|
|
|
|
|
|
|
|
|
|
|
|
|
|
|
|
|
|
|
|
AVG READING SCORE | 7.45 | 7.67 | 6.98 | 6.93 | 7.38 | 8.41 | 7.87 | 8.44 | 7.32 | 8.01 | 7.40
Page 8 Run 08/21/00
Georgia Department of Corrections Office of Planning and Analysis
Inmate statistical profile
Sample: ACTIVE PRISONERS SERVING LIFE EXCLUDING JAIL
Requestor: Statistics
Active inmates 08/21/2000
Functional Math Level (WRAT Scores) by current age & sex
|
MEN
|
WOMEN
|
| Age | Age | Age | Age | Men
| Age | Age | Age | Age |Women
|Grand
WRAT Math Score
|00-21 %|22-39 %|40-54 %|55-99 %|Total % |00-21 %|22-39 %|40-54 %|55-99 %|Total % |Total %
------------------------------------------------------------------------------------------------------------------------------------
LESS THAN GRADE 6 | 71 37| 875 30| 795 44| 170 51| 1911 36 | 2 25| 49 39| 26 35| 11 46| 88 38 | 1999 37
6TH THRU 8TH GRADE | 89 47| 1455 50| 663 37| 94 28| 2301 44 | 5 63| 52 41| 30 41| 9 38| 96 41 | 2397 44
GRADE 9
| 12 6| 224 8| 117 6| 24 7| 377 7 | 1 13| 11 9| 5 7| 2 8| 19 8 | 396 7
GRADE 10
| 10 5| 138 5| 98 5| 15 4| 261 5 | 0 0| 7 6| 3 4| 1 4| 11 5 | 272 5
GRADE 11
| 4 2| 97 3| 49 3| 12 4| 162 3 | 0 0| 1 1| 3 4| 1 4| 5 2 | 167 3
GRADE 12
| 2 1| 103 4| 82 5| 19 6| 206 4 | 0 0| 2 2| 3 4| 0 0| 5 2 | 211 4
MORE THAN GRADE 12 | 2 1| 18 1| 3 0| 2 1| 25 0 | 0 0| 4 3| 4 5| 0 0| 8 3 | 33 1
------------------------------------------------------------------------------------------------------------------------------------
Total reported
| 190 100| 2910 100| 1807 100| 336 100| 5243 100 | 8 100| 126 100| 74 100| 24 100| 232 100 | 5475 100
|
|
|
|
|
|
|
|
|
|
|
Percent reported |
96.4|
95.8|
88.3|
83.8|
92.2 |
88.9|
97.7|
94.9|
92.3|
95.9 |
92.4
|
|
|
|
|
|
|
|
|
|
|
|
|
|
|
|
|
|
|
|
|
|
NOT REPORTED
| 7 | 129 | 240 | 65 | 441
| 1 | 3 | 4 | 2 | 10
| 451
------------------------------------------------------------------------------------------------------------------------------------
Total
| 197 | 3039 | 2047 | 401 | 5684
| 9 | 129 | 78 | 26 | 242
| 5926
|
|
|
|
|
|
|
|
|
|
|
|
|
|
|
|
|
|
|
|
|
|
|
|
|
|
|
|
|
|
|
|
|
|
|
|
|
|
|
|
|
|
|
|
|
|
|
|
|
|
|
|
|
|
|
AVG MATH SCORE
| 6.84 | 7.11 | 6.58 | 6.32 | 6.86 | 6.83 | 6.96 | 7.28 | 5.98 | 6.96 | 6.87
Page 9 Run 08/21/00
Georgia Department of Corrections Office of Planning and Analysis
Inmate statistical profile
Sample: ACTIVE PRISONERS SERVING LIFE EXCLUDING JAIL
Requestor: Statistics
Active inmates 08/21/2000
Functional Spelling Level (WRAT Scores) by current age & sex
|
MEN
|
WOMEN
|
| Age | Age | Age | Age | Men
| Age | Age | Age | Age |Women
|Grand
WRAT Spelling Score |00-21 %|22-39 %|40-54 %|55-99 %|Total % |00-21 %|22-39 %|40-54 %|55-99 %|Total % |Total %
------------------------------------------------------------------------------------------------------------------------------------
LESS THAN GRADE 6 | 82 43| 1319 45| 1046 58| 196 58| 2643 50 | 2 25| 46 37| 25 34| 12 50| 85 37 | 2728 50
6TH THRU 8TH GRADE | 58 31| 768 26| 363 20| 67 20| 1256 24 | 4 50| 31 25| 17 23| 4 17| 56 24 | 1312 24
GRADE 9
| 15 8| 167 6| 104 6| 13 4| 299 6 | 1 13| 8 6| 3 4| 3 13| 15 6 | 314 6
GRADE 10
| 15 8| 179 6| 66 4| 14 4| 274 5 | 0 0| 8 6| 6 8| 0 0| 14 6 | 288 5
GRADE 11
| 5 3| 142 5| 43 2| 5 1| 195 4 | 1 13| 5 4| 3 4| 2 8| 11 5 | 206 4
GRADE 12
| 10 5| 291 10| 167 9| 39 12| 507 10 | 0 0| 8 6| 5 7| 0 0| 13 6 | 520 10
MORE THAN GRADE 12 | 5 3| 41 1| 13 1| 2 1| 61 1 | 0 0| 20 16| 15 20| 3 13| 38 16 | 99 2
------------------------------------------------------------------------------------------------------------------------------------
Total reported
| 190 100| 2907 100| 1802 100| 336 100| 5235 100 | 8 100| 126 100| 74 100| 24 100| 232 100 | 5467 100
|
|
|
|
|
|
|
|
|
|
|
Percent reported |
96.4|
95.7|
88.0|
83.8|
92.1 |
88.9|
97.7|
94.9|
92.3|
95.9 |
92.3
|
|
|
|
|
|
|
|
|
|
|
|
|
|
|
|
|
|
|
|
|
|
NOT REPORTED
| 7 | 132 | 245 | 65 | 449
| 1 | 3 | 4 | 2 | 10
| 459
------------------------------------------------------------------------------------------------------------------------------------
Total
| 197 | 3039 | 2047 | 401 | 5684
| 9 | 129 | 78 | 26 | 242
| 5926
|
|
|
|
|
|
|
|
|
|
|
|
|
|
|
|
|
|
|
|
|
|
|
|
|
|
|
|
|
|
|
|
|
|
|
|
|
|
|
|
|
|
|
|
|
|
|
|
|
|
|
|
|
|
|
AVG SPELLING SCORE | 6.86 | 6.89 | 6.02 | 5.92 | 6.53 | 7.58 | 7.87 | 8.14 | 6.60 | 7.82 | 6.58
Page 10 Run 08/21/00
Georgia Department of Corrections Office of Planning and Analysis
Inmate statistical profile
Sample: ACTIVE PRISONERS SERVING LIFE EXCLUDING JAIL
Requestor: Statistics
Active inmates 08/21/2000
Self-Rpt Guardian Status To Age 16 by current age & sex
|
MEN
|
WOMEN
|
| Age | Age | Age | Age | Men
| Age | Age | Age | Age |Women
|Grand
Guardian Status
|00-21 %|22-39 %|40-54 %|55-99 %|Total % |00-21 %|22-39 %|40-54 %|55-99 %|Total % |Total %
------------------------------------------------------------------------------------------------------------------------------------
ORPHANAGE
| 0 0| 5 0| 3 0| 3 1| 11 0 | 0 0| 0 0| 0 0| 0 0| 0 0 | 11 0
FATHER ONLY
| 11 6| 85 3| 55 3| 6 2| 157 3 | 0 0| 2 2| 2 3| 1 4| 5 2 | 162 3
FTR MTR HD
| 12 6| 114 4| 66 3| 6 2| 198 4 | 0 0| 2 2| 4 5| 0 0| 6 3 | 204 4
MOTHER ONLY
| 100 51| 1388 46| 643 32| 104 27| 2235 40 | 5 56| 47 37| 22 29| 9 38| 83 35 | 2318 40
MTR FTR HD
| 44 22| 961 32| 961 48| 212 54| 2178 39 | 4 44| 50 39| 42 55| 13 54| 109 46 | 2287 39
OTH FEMALE
| 2 1| 55 2| 48 2| 16 4| 121 2 | 0 0| 4 3| 2 3| 0 0| 6 3 | 127 2
OTH MALE
| 1 1| 7 0| 11 1| 1 0| 20 0 | 0 0| 2 2| 1 1| 0 0| 3 1 | 23 0
STEP-PARNTS
| 4 2| 54 2| 25 1| 6 2| 89 2 | 0 0| 0 0| 0 0| 0 0| 0 0 | 89 2
FOSTER HOME
| 4 2| 25 1| 33 2| 7 2| 69 1 | 0 0| 2 2| 0 0| 0 0| 2 1 | 71 1
GRAND PRNTS
| 14 7| 234 8| 134 7| 24 6| 406 7 | 0 0| 14 11| 3 4| 1 4| 18 8 | 424 7
OTHER
| 4 2| 62 2| 26 1| 4 1| 96 2 | 0 0| 4 3| 0 0| 0 0| 4 2 | 100 2
------------------------------------------------------------------------------------------------------------------------------------
Total reported
| 196 100| 2990 100| 2005 100| 389 100| 5580 100 | 9 100| 127 100| 76 100| 24 100| 236 100 | 5816 100
|
|
|
|
|
|
|
|
|
|
|
Percent reported |
99.5|
98.4|
97.9|
97.0|
98.2 | 100.0|
98.4|
97.4|
92.3|
97.5 |
98.1
|
|
|
|
|
|
|
|
|
|
|
|
|
|
|
|
|
|
|
|
|
|
NOT RPTD
| 1 | 49 | 42 | 12 | 104
|0|2|2|2|6
| 110
------------------------------------------------------------------------------------------------------------------------------------
Total
| 197 | 3039 | 2047 | 401 | 5684
| 9 | 129 | 78 | 26 | 242
| 5926
Page 11 Run 08/21/00
Georgia Department of Corrections Office of Planning and Analysis
Inmate statistical profile
Sample: ACTIVE PRISONERS SERVING LIFE EXCLUDING JAIL
Requestor: Statistics
Active inmates 08/21/2000
Self-Rpt Employment Status Before Prison by current age & sex
|
MEN
|
WOMEN
|
| Age | Age | Age | Age | Men
| Age | Age | Age | Age |Women
|Grand
Employment
|00-21 %|22-39 %|40-54 %|55-99 %|Total % |00-21 %|22-39 %|40-54 %|55-99 %|Total % |Total %
------------------------------------------------------------------------------------------------------------------------------------
FULL TIME
| 36 20| 971 34| 743 38| 154 42| 1904 35 | 0 0| 30 24| 13 17| 4 17| 47 20 | 1951 35
PART TIME
| 12 7| 227 8| 108 6| 17 5| 364 7 | 0 0| 6 5| 3 4| 0 0| 9 4 | 373 7
UNEMPL < 6M
| 12 7| 475 16| 330 17| 53 14| 870 16 | 0 0| 26 21| 18 24| 4 17| 48 21 | 918 16
UNEMPL > 6M
| 22 12| 923 32| 692 35| 111 30| 1748 32 | 2 22| 39 32| 33 44| 13 57| 87 38 | 1835 33
NEVER WORKD
| 78 43| 234 8| 21 1| 3 1| 336 6 | 4 44| 21 17| 4 5| 0 0| 29 13 | 365 6
STUDENT
| 22 12| 28 1| 6 0| 1 0| 57 1 | 3 33| 1 1| 2 3| 0 0| 6 3 | 63 1
INCAPABLE
| 1 1| 32 1| 53 3| 30 8| 116 2 | 0 0| 0 0| 2 3| 2 9| 4 2 | 120 2
OTHER
| 0 0| 0 0| 0 0| 0 0| 0 0 | 0 0| 0 0| 0 0| 0 0| 0 0 | 0 0
------------------------------------------------------------------------------------------------------------------------------------
Total reported
| 183 100| 2890 100| 1953 100| 369 100| 5395 100 | 9 100| 123 100| 75 100| 23 100| 230 100 | 5625 100
|
|
|
|
|
|
|
|
|
|
|
Percent reported |
92.9|
95.1|
95.4|
92.0|
94.9 | 100.0|
95.3|
96.2|
88.5|
95.0 |
94.9
|
|
|
|
|
|
|
|
|
|
|
|
|
|
|
|
|
|
|
|
|
|
NOT RPTD
| 14 | 149 | 94 | 32 | 289
| 0 | 6 | 3 | 3 | 12
| 301
------------------------------------------------------------------------------------------------------------------------------------
Total
| 197 | 3039 | 2047 | 401 | 5684
| 9 | 129 | 78 | 26 | 242
| 5926
* NOTE: THE FIELD LABELD "OTHER" WAS CORRECTED IN APRIL 1989; INMATES CODED "PRE-OTIS NOT REPORTED" NOW HAVE BEEN REMOVED FROM THIS FIELD AND IDENTIFIED AS "NOT REPORTED".
Page 12 Run 08/21/00
Georgia Department of Corrections Office of Planning and Analysis
Inmate statistical profile
Sample: ACTIVE PRISONERS SERVING LIFE EXCLUDING JAIL
Requestor: Statistics
Active inmates 08/21/2000
Self-Rpt Marital Status At Admission by current age & sex
|
MEN
|
WOMEN
|
| Age | Age | Age | Age | Men
| Age | Age | Age | Age |Women
|Grand
Marital Status
|00-21 %|22-39 %|40-54 %|55-99 %|Total % |00-21 %|22-39 %|40-54 %|55-99 %|Total % |Total %
------------------------------------------------------------------------------------------------------------------------------------
SINGLE
| 186 95| 2015 67| 682 34| 54 14| 2937 53 | 9 100| 73 57| 13 17| 3 13| 98 41 | 3035 52
MARRIED
| 2 1| 252 8| 379 19| 107 27| 740 13 | 0 0| 13 10| 16 21| 3 13| 32 13 | 772 13
SEPARATED
| 0 0| 108 4| 167 8| 40 10| 315 6 | 0 0| 11 9| 7 9| 2 8| 20 8 | 335 6
DIVORCED
| 1 1| 148 5| 357 18| 89 23| 595 11 | 0 0| 9 7| 15 19| 6 25| 30 13 | 625 11
WIDOWED
| 1 1| 38 1| 92 5| 54 14| 185 3 | 0 0| 6 5| 18 23| 9 38| 33 14 | 218 4
COMMON LAW
| 6 3| 426 14| 332 17| 47 12| 811 15 | 0 0| 16 13| 8 10| 1 4| 25 11 | 836 14
OTHER
| 0 0| 2 0| 1 0| 0 0| 3 0 | 0 0| 0 0| 0 0| 0 0| 0 0 | 3 0
------------------------------------------------------------------------------------------------------------------------------------
Total reported
| 196 100| 2989 100| 2010 100| 391 100| 5586 100 | 9 100| 128 100| 77 100| 24 100| 238 100 | 5824 100
|
|
|
|
|
|
|
|
|
|
|
Percent reported |
99.5|
98.4|
98.2|
97.5|
98.3 | 100.0|
99.2|
98.7|
92.3|
98.3 |
98.3
|
|
|
|
|
|
|
|
|
|
|
|
|
|
|
|
|
|
|
|
|
|
NOT RPTD
| 1 | 50 | 37 | 10 | 98
|0|1|1|2|4
| 102
------------------------------------------------------------------------------------------------------------------------------------
Total
| 197 | 3039 | 2047 | 401 | 5684
| 9 | 129 | 78 | 26 | 242
| 5926
Page 13 Run 08/21/00
Georgia Department of Corrections Office of Planning and Analysis
Inmate statistical profile
Sample: ACTIVE PRISONERS SERVING LIFE EXCLUDING JAIL
Requestor: Statistics
Active inmates 08/21/2000
Self-Rpt Number Of Children At Admission by current age & sex
|
MEN
|
WOMEN
|
| Age | Age | Age | Age | Men
| Age | Age | Age | Age |Women
|Grand
Number Of Children |00-21 %|22-39 %|40-54 %|55-99 %|Total % |00-21 %|22-39 %|40-54 %|55-99 %|Total % |Total %
------------------------------------------------------------------------------------------------------------------------------------
NO CHILDREN
| 0 0| 457 23| 265 17| 37 11| 759 19 | 0 0| 3 3| 3 4| 1 4| 7 4 | 766 18
ONE CHILD
| 43 72| 750 37| 472 30| 56 16| 1321 33 | 0 0| 33 33| 12 17| 2 8| 47 24 | 1368 33
TWO CHILDREN
| 14 23| 429 21| 362 23| 77 23| 882 22 | 0 0| 33 33| 22 32| 8 33| 63 32 | 945 22
THREE CHILDREN
| 2 3| 242 12| 234 15| 67 20| 545 14 | 0 0| 20 20| 13 19| 7 29| 40 21 | 585 14
FOUR CHILDREN
| 0 0| 86 4| 118 7| 43 13| 247 6 | 0 0| 6 6| 11 16| 4 17| 21 11 | 268 6
FIVE CHILDREN
| 1 2| 31 2| 70 4| 22 6| 124 3 | 0 0| 4 4| 3 4| 1 4| 8 4 | 132 3
MORE THAN 5 CHILDREN| 0 0| 36 2| 60 4| 40 12| 136 3 | 0 0| 2 2| 5 7| 1 4| 8 4 | 144 3
------------------------------------------------------------------------------------------------------------------------------------
Total reported
| 60 100| 2031 100| 1581 100| 342 100| 4014 100 | 0 0| 101 100| 69 100| 24 100| 194 100 | 4208 100
|
|
|
|
|
|
|
|
|
|
|
Percent reported |
30.5|
66.8|
77.2|
85.3|
70.6 |
.0|
78.3|
88.5|
92.3|
80.2 |
71.0
|
|
|
|
|
|
|
|
|
|
|
|
|
|
|
|
|
|
|
|
|
|
NOT REPORTED
| 137 | 1008 | 466 | 59 | 1670
| 9 | 28 | 9 | 2 | 48
| 1718
------------------------------------------------------------------------------------------------------------------------------------
Total
| 197 | 3039 | 2047 | 401 | 5684
| 9 | 129 | 78 | 26 | 242
| 5926
|
|
|
|
|
|
|
|
|
|
|
|
|
|
|
|
|
|
|
|
|
|
|
|
|
|
|
|
|
|
|
|
|
|
|
|
|
|
|
|
|
|
|
|
|
|
|
|
|
|
|
|
|
|
|
AVG NUM CHILDREN | 1.37 | 1.61 | 2.07 | 2.88 | 1.89 | .00 | 2.13 | 2.71 | 2.79 | 2.42 | 1.92
* NOTE: THE FIELD LABLED "NO CHILDREN" WAS CORRECTED IN MARCH 1989: MISSING DATA FOR INMATES STILL IN DIAGNOSTICS NOW HAS BEEN REMOVED FROM THIS FIELD AND IDENTIFIED AS "NOT REPORTED" INFORMATION.
Page 14 Run 08/21/00
Georgia Department of Corrections Office of Planning and Analysis
Inmate statistical profile
Sample: ACTIVE PRISONERS SERVING LIFE EXCLUDING JAIL
Requestor: Statistics
Active inmates 08/21/2000
Self-Rpt Religious Affiliation by current age & sex
|
MEN
|
WOMEN
|
| Age | Age | Age | Age | Men
| Age | Age | Age | Age |Women
|Grand
Religion
|00-21 %|22-39 %|40-54 %|55-99 %|Total % |00-21 %|22-39 %|40-54 %|55-99 %|Total % |Total %
------------------------------------------------------------------------------------------------------------------------------------
ISLAM
| 2 1| 153 5| 67 4| 10 3| 232 4 | 0 0| 1 1| 0 0| 0 0| 1 0 | 233 4
CATHOLIC
| 4 2| 89 3| 62 3| 19 5| 174 3 | 0 0| 7 6| 3 4| 1 4| 11 5 | 185 3
BAPTIST
| 93 49| 1486 52| 1173 63| 217 58| 2969 56 | 4 44| 70 57| 41 55| 16 70| 131 57 | 3100 56
METHODIST
| 3 2| 72 3| 86 5| 26 7| 187 4 | 0 0| 5 4| 7 9| 1 4| 13 6 | 200 4
EPISCOPLN
| 1 1| 4 0| 4 0| 3 1| 12 0 | 0 0| 1 1| 2 3| 0 0| 3 1 | 15 0
PRESBYTRN
| 0 0| 8 0| 7 0| 3 1| 18 0 | 0 0| 0 0| 0 0| 2 9| 2 1 | 20 0
CHC OF GOD
| 0 0| 32 1| 24 1| 9 2| 65 1 | 0 0| 4 3| 1 1| 0 0| 5 2 | 70 1
HOLINESS
| 7 4| 136 5| 91 5| 23 6| 257 5 | 2 22| 16 13| 10 13| 0 0| 28 12 | 285 5
JEWISH
| 0 0| 1 0| 3 0| 1 0| 5 0 | 0 0| 0 0| 0 0| 0 0| 0 0 | 5 0
ANGLICAN
| 0 0| 0 0| 0 0| 0 0| 0 0 | 0 0| 1 1| 0 0| 0 0| 1 0 | 1 0
GRK ORTHDX
| 0 0| 0 0| 0 0| 0 0| 0 0 | 0 0| 0 0| 0 0| 0 0| 0 0 | 0 0
HINDU
| 0 0| 0 0| 0 0| 0 0| 0 0 | 0 0| 0 0| 0 0| 0 0| 0 0 | 0 0
BUDDHIST
| 2 1| 3 0| 1 0| 0 0| 6 0 | 0 0| 0 0| 0 0| 0 0| 0 0 | 6 0
TAOIST
| 0 0| 0 0| 0 0| 0 0| 0 0 | 0 0| 0 0| 0 0| 0 0| 0 0 | 0 0
SHINTOIST
| 0 0| 0 0| 0 0| 0 0| 0 0 | 0 0| 0 0| 0 0| 0 0| 0 0 | 0 0
SEVEN D AD
| 0 0| 5 0| 4 0| 1 0| 10 0 | 0 0| 0 0| 0 0| 0 0| 0 0 | 10 0
JEHOVAH WT
| 1 1| 25 1| 10 1| 0 0| 36 1 | 0 0| 0 0| 0 0| 0 0| 0 0 | 36 1
LATR DAY S
| 0 0| 3 0| 0 0| 0 0| 3 0 | 0 0| 0 0| 0 0| 0 0| 0 0 | 3 0
QUAKER
| 0 0| 0 0| 0 0| 0 0| 0 0 | 0 0| 0 0| 0 0| 0 0| 0 0 | 0 0
OTHER PROD
| 15 8| 212 7| 61 3| 16 4| 304 6 | 0 0| 6 5| 6 8| 1 4| 13 6 | 317 6
NONE
| 47 25| 423 15| 140 7| 12 3| 622 12 | 1 11| 5 4| 1 1| 0 0| 7 3 | 629 11
OTHER
| 16 8| 209 7| 141 8| 32 9| 398 8 | 2 22| 7 6| 4 5| 2 9| 15 7 | 413 7
------------------------------------------------------------------------------------------------------------------------------------
Total reported
| 191 100| 2861 100| 1874 100| 372 100| 5298 100 | 9 100| 123 100| 75 100| 23 100| 230 100 | 5528 100
|
|
|
|
|
|
|
|
|
|
|
Percent reported |
97.0|
94.1|
91.5|
92.8|
93.2 | 100.0|
95.3|
96.2|
88.5|
95.0 |
93.3
|
|
|
|
|
|
|
|
|
|
|
|
|
|
|
|
|
|
|
|
|
|
NOT RPTD
| 6 | 178 | 173 | 29 | 386
| 0 | 6 | 3 | 3 | 12
| 398
------------------------------------------------------------------------------------------------------------------------------------
Total
| 197 | 3039 | 2047 | 401 | 5684
| 9 | 129 | 78 | 26 | 242
| 5926
Page 15 Run 08/21/00
Georgia Department of Corrections Office of Planning and Analysis
Inmate statistical profile
Sample: ACTIVE PRISONERS SERVING LIFE EXCLUDING JAIL
Requestor: Statistics
Active inmates 08/21/2000
Self-Rpt Family Behavior Patterns * by current age & sex
|
MEN
|
WOMEN
|
| Age | Age | Age | Age | Men
| Age | Age | Age | Age |Women
|Grand
Family Behavior
|00-21 %|22-39 %|40-54 %|55-99 %|Total % |00-21 %|22-39 %|40-54 %|55-99 %|Total % |Total %
------------------------------------------------------------------------------------------------------------------------------------
CRIMINLTY
| 57 22| 790 24| 513 29| 66 24| 1426 26 | 4 15| 35 19| 18 24| 2 13| 59 19 | 1485 25
ALCOHOLISM
| 19 7| 326 10| 275 15| 45 16| 665 12 | 3 12| 27 14| 14 19| 1 6| 45 15 | 710 12
DRUG ABUSE
| 17 7| 169 5| 67 4| 6 2| 259 5 | 2 8| 17 9| 6 8| 0 0| 25 8 | 284 5
DOMINERING
| 1 0| 13 0| 12 1| 0 0| 26 0 | 5 19| 11 6| 5 7| 2 13| 23 8 | 49 1
MIGRANT
| 2 1| 48 1| 42 2| 0 0| 92 2 | 1 4| 2 1| 2 3| 0 0| 5 2 | 97 2
INFL BTGS
| 7 3| 138 4| 69 4| 15 5| 229 4 | 2 8| 20 11| 5 7| 2 13| 29 10 | 258 4
PERMISSIVE
| 0 0| 8 0| 14 1| 2 1| 24 0 | 1 4| 4 2| 2 3| 0 0| 7 2 | 31 1
FATH ABSNT
| 115 45| 1453 44| 630 35| 116 41| 2314 41 | 5 19| 49 26| 14 19| 7 44| 75 25 | 2389 41
MOTH ABSNT
| 31 12| 294 9| 139 8| 30 11| 494 9 | 1 4| 15 8| 2 3| 1 6| 19 6 | 513 9
NONE
| 5 2| 37 1| 14 1| 0 0| 56 1 | 2 8| 7 4| 6 8| 1 6| 16 5 | 72 1
------------------------------------------------------------------------------------------------------------------------------------
Total reported
| 254 100| 3276 100| 1775 100| 280 100| 5585 100 | 26 100| 187 100| 74 100| 16 100| 303 100 | 5888 100
|
|
|
|
|
|
|
|
|
|
|
Percent reported |
77.7|
68.9|
60.4|
49.4|
64.8 | 100.0|
69.0|
59.0|
42.3|
64.0 |
64.7
|
|
|
|
|
|
|
|
|
|
|
|
|
|
|
|
|
|
|
|
|
|
OTHER
| 44 | 944 | 811 | 203 | 2002
| 0 | 40 | 32 | 15 | 87
| 2089
------------------------------------------------------------------------------------------------------------------------------------
Total
| 197 | 3039 | 2047 | 401 | 5684
| 9 | 129 | 78 | 26 | 242
| 5926
* NOTE: SINCE THERE CAN BE UP TO FIVE BEHAVIOR CODES PER INMATE, THE NUMBER OF CASES REPORTED IN THE DETAIL LINES AND THE TOTAL REPORTED LINE MAY EXCEED THE TOTAL NUMBER OF CASES. IN SHORT, THIS TABLE COUNTS THE NUMBER OF BEHAVIOR PROBLEMS, NOT INMATES.
Page 16 Run 08/21/00
Georgia Department of Corrections Office of Planning and Analysis
Inmate statistical profile
Sample: ACTIVE PRISONERS SERVING LIFE EXCLUDING JAIL
Requestor: Statistics
Active inmates 08/21/2000
Inmate Diagnostic Behavior Problem * by current age & sex
|
MEN
|
WOMEN
|
| Age | Age | Age | Age | Men
| Age | Age | Age | Age |Women
|Grand
Diagnostic Problem |00-21 %|22-39 %|40-54 %|55-99 %|Total % |00-21 %|22-39 %|40-54 %|55-99 %|Total % |Total %
------------------------------------------------------------------------------------------------------------------------------------
ALCOHOLIC
| 0 0| 140 3| 138 4| 39 6| 317 3 | 1 4| 3 1| 13 10| 1 3| 18 4 | 335 3
ALCOH ABSE
| 39 10| 897 17| 628 17| 111 18| 1675 17 | 1 4| 31 15| 15 11| 6 18| 53 13 | 1728 17
DRUG EXP
| 73 19| 757 14| 352 10| 36 6| 1218 12 | 3 13| 22 10| 12 9| 0 0| 37 9 | 1255 12
DRUG ABSE
| 69 18| 971 18| 636 18| 38 6| 1714 17 | 4 17| 41 19| 24 18| 1 3| 70 17 | 1784 17
NARC ADDCT
| 1 0| 103 2| 92 3| 5 1| 201 2 | 0 0| 5 2| 1 1| 1 3| 7 2 | 208 2
EPILEPTIC
| 1 0| 26 0| 26 1| 3 0| 56 1 | 0 0| 0 0| 2 2| 0 0| 2 0 | 58 1
MANIPULTVE
| 25 7| 217 4| 104 3| 19 3| 365 4 | 1 4| 2 1| 0 0| 1 3| 4 1 | 369 4
ASSAULTIVE
| 134 35| 1303 24| 910 25| 166 27| 2513 25 | 7 29| 52 24| 28 21| 6 18| 93 23 | 2606 25
ESCPE TEND
| 6 2| 114 2| 211 6| 40 7| 371 4 | 0 0| 3 1| 3 2| 0 0| 6 1 | 377 4
SUICIDAL
| 11 3| 142 3| 103 3| 14 2| 270 3 | 4 17| 16 8| 7 5| 2 6| 29 7 | 299 3
WITHDRAWN
| 0 0| 35 1| 19 1| 7 1| 61 1 | 1 4| 2 1| 3 2| 0 0| 6 1 | 67 1
PR RLTY CT
| 1 0| 35 1| 48 1| 12 2| 96 1 | 1 4| 1 0| 2 2| 1 3| 5 1 | 101 1
HOMOSEXUAL
| 1 0| 12 0| 9 0| 5 1| 27 0 | 1 4| 4 2| 2 2| 0 0| 7 2 | 34 0
NONE
| 1 0| 306 6| 235 6| 68 11| 610 6 | 0 0| 13 6| 13 10| 10 29| 36 9 | 646 6
OTHER
| 4 1| 75 1| 57 2| 22 4| 158 2 | 0 0| 0 0| 0 0| 3 9| 3 1 | 161 2
NOT RPTD
| 18 5| 192 4| 65 2| 24 4| 299 3 | 0 0| 18 8| 6 5| 2 6| 26 6 | 325 3
------------------------------------------------------------------------------------------------------------------------------------
Total reported
| 384 100| 5334 100| 3634 100| 610 100| 9962 100 | 24 100| 213 100| 132 100| 34 100| 403 100 |10365 100
|
|
|
|
|
|
|
|
|
|
|
Percent reported | 100.0|
99.7| 100.0|
99.8|
99.8 | 100.0| 100.0|
98.7| 100.0|
99.6 |
99.8
|
|
|
|
|
|
|
|
|
|
|
|
|
|
|
|
|
|
|
|
|
|
UNKNOWN
| 0 | 9 | 1 | 1 | 11
|0|0|1|0|1
| 12
------------------------------------------------------------------------------------------------------------------------------------
Total
| 197 | 3039 | 2047 | 401 | 5684
| 9 | 129 | 78 | 26 | 242
| 5926
* NOTE: SINCE THERE CAN BE UP TO FIVE BEHAVIOR CODES PER INMATE, THE NUMBER OF CASES REPORTED IN THE DETAIL LINES AND THE TOTAL REPORTED LINE MAY EXCEED THE TOTAL NUMBER OF CASES. IN SHORT, THIS TABLE COUNTS THE NUMBER OF BEHAVIOR PROBLEMS, NOT INMATES.
Page 17 Run 08/21/00
Georgia Department of Corrections Office of Planning and Analysis
Inmate statistical profile
Sample: ACTIVE PRISONERS SERVING LIFE EXCLUDING JAIL
Requestor: Statistics
Active inmates 08/21/2000
Physical Profile (General Condition) by current age & sex
|
MEN
|
WOMEN
|
| Age | Age | Age | Age | Men
| Age | Age | Age | Age |Women
|Grand
Physical Profile |00-21 %|22-39 %|40-54 %|55-99 %|Total % |00-21 %|22-39 %|40-54 %|55-99 %|Total % |Total %
------------------------------------------------------------------------------------------------------------------------------------
NO LIMITATION
| 171 89| 2235 74| 1022 50| 72 18| 3500 62 | 8 89| 92 74| 37 48| 1 4| 138 59 | 3638 62
DEFECT NO MAJOR LIMT| 14 7| 413 14| 458 23| 101 25| 986 18 | 0 0| 5 4| 10 13| 5 22| 20 9 | 1006 17
DEFECT MAJOR LIMIT | 8 4| 352 12| 542 27| 194 49| 1096 19 | 1 11| 27 22| 29 38| 15 65| 72 31 | 1168 20
VERY MAJOR DEFECT | 0 0| 3 0| 13 1| 30 8| 46 1 | 0 0| 0 0| 1 1| 2 9| 3 1 | 49 1
------------------------------------------------------------------------------------------------------------------------------------
Total reported
| 193 100| 3003 100| 2035 100| 397 100| 5628 100 | 9 100| 124 100| 77 100| 23 100| 233 100 | 5861 100
|
|
|
|
|
|
|
|
|
|
|
Percent reported |
98.0|
98.8|
99.4|
99.0|
99.0 | 100.0|
96.1|
98.7|
88.5|
96.3 |
98.9
|
|
|
|
|
|
|
|
|
|
|
|
|
|
|
|
|
|
|
|
|
|
NOT REPORTED
| 4 | 36 | 12 | 4 | 56
|0|5|1|3|9
| 65
------------------------------------------------------------------------------------------------------------------------------------
Total
| 197 | 3039 | 2047 | 401 | 5684
| 9 | 129 | 78 | 26 | 242
| 5926
Page 18 Run 08/21/00
Georgia Department of Corrections Office of Planning and Analysis
Inmate statistical profile
Sample: ACTIVE PRISONERS SERVING LIFE EXCLUDING JAIL
Requestor: Statistics
Active inmates 08/21/2000
Security Status by current age & sex
|
MEN
|
WOMEN
|
| Age | Age | Age | Age | Men
| Age | Age | Age | Age |Women
|Grand
Security
|00-21 %|22-39 %|40-54 %|55-99 %|Total % |00-21 %|22-39 %|40-54 %|55-99 %|Total % |Total %
------------------------------------------------------------------------------------------------------------------------------------
DIAG INCOM
| 0 0| 6 0| 1 0| 0 0| 7 0 | 0 0| 0 0| 0 0| 0 0| 0 0 | 7 0
WRK RELEAS
| 0 0| 0 0| 0 0| 1 0| 1 0 | 0 0| 0 0| 0 0| 0 0| 0 0 | 1 0
TRUSTY
| 0 0| 67 2| 41 2| 5 1| 113 2 | 0 0| 1 1| 3 4| 1 4| 5 2 | 118 2
MINIMUM
| 0 0| 369 12| 441 22| 74 18| 884 16 | 0 0| 30 23| 24 31| 12 46| 66 27 | 950 16
MEDIUM
| 19 10| 1265 42| 1071 52| 248 62| 2603 46 | 0 0| 64 50| 40 51| 12 46| 116 48 | 2719 46
CLOSE
| 165 84| 1135 37| 392 19| 64 16| 1756 31 | 8 89| 33 26| 9 12| 1 4| 51 21 | 1807 30
MAXIMUM
| 7 4| 183 6| 96 5| 7 2| 293 5 | 1 11| 0 0| 2 3| 0 0| 3 1 | 296 5
DIAGNOSTIC
| 6 3| 14 0| 5 0| 2 0| 27 0 | 0 0| 1 1| 0 0| 0 0| 1 0 | 28 0
------------------------------------------------------------------------------------------------------------------------------------
Total reported
| 197 100| 3039 100| 2047 100| 401 100| 5684 100 | 9 100| 129 100| 78 100| 26 100| 242 100 | 5926 100
|
|
|
|
|
|
|
|
|
|
|
Percent reported | 100.0| 100.0| 100.0| 100.0| 100.0 | 100.0| 100.0| 100.0| 100.0| 100.0 | 100.0
|
|
|
|
|
|
|
|
|
|
|
|
|
|
|
|
|
|
|
|
|
|
NOT RPTD
|0|0|0|0|0
|0|0|0|0|0
|0
------------------------------------------------------------------------------------------------------------------------------------
Total
| 197 | 3039 | 2047 | 401 | 5684
| 9 | 129 | 78 | 26 | 242
| 5926
* NOTE: BEGINNING IN JULY 1987, THE FACILITIES DIVISION NO LONGER CODED INMATES AS BEING WORK RELEASE
Page 19 Run 08/21/00
Georgia Department of Corrections Office of Planning and Analysis
Inmate statistical profile
Sample: ACTIVE PRISONERS SERVING LIFE EXCLUDING JAIL
Requestor: Statistics
Active inmates 08/21/2000
Number Of Sentences by current age & sex
|
MEN
|
WOMEN
|
| Age | Age | Age | Age | Men
| Age | Age | Age | Age |Women
|Grand
Number Of Sentences |00-21 %|22-39 %|40-54 %|55-99 %|Total % |00-21 %|22-39 %|40-54 %|55-99 %|Total % |Total %
------------------------------------------------------------------------------------------------------------------------------------
ONE
| 60 30| 735 24| 537 26| 138 34| 1470 26 | 4 44| 50 39| 35 45| 13 50| 102 42 | 1572 27
TWO
| 54 27| 717 24| 473 23| 105 26| 1349 24 | 2 22| 41 32| 20 26| 8 31| 71 29 | 1420 24
THREE
| 30 15| 514 17| 364 18| 54 13| 962 17 | 1 11| 19 15| 10 13| 5 19| 35 14 | 997 17
FOUR
| 21 11| 354 12| 229 11| 38 9| 642 11 | 1 11| 9 7| 4 5| 0 0| 14 6 | 656 11
FIVE
| 9 5| 226 7| 145 7| 20 5| 400 7 | 1 11| 5 4| 3 4| 0 0| 9 4 | 409 7
MORE THAN FIVE
| 23 12| 493 16| 299 15| 46 11| 861 15 | 0 0| 5 4| 6 8| 0 0| 11 5 | 872 15
------------------------------------------------------------------------------------------------------------------------------------
Total reported
| 197 100| 3039 100| 2047 100| 401 100| 5684 100 | 9 100| 129 100| 78 100| 26 100| 242 100 | 5926 100
|
|
|
|
|
|
|
|
|
|
|
Percent reported | 100.0| 100.0| 100.0| 100.0| 100.0 | 100.0| 100.0| 100.0| 100.0| 100.0 | 100.0
|
|
|
|
|
|
|
|
|
|
|
|
|
|
|
|
|
|
|
|
|
|
NOT REPORTED
|0|0|0|0|0
|0|0|0|0|0
|0
------------------------------------------------------------------------------------------------------------------------------------
Total
| 197 | 3039 | 2047 | 401 | 5684
| 9 | 129 | 78 | 26 | 242
| 5926
|
|
|
|
|
|
|
|
|
|
|
|
|
|
|
|
|
|
|
|
|
|
|
|
|
|
|
|
|
|
|
|
|
|
|
|
|
|
|
|
|
|
|
|
|
|
|
|
|
|
|
|
|
|
|
AVG NUM SENTENCES | 2.89 | 3.42 | 3.30 | 2.86 | 3.32 | 2.22 | 2.29 | 2.32 | 1.69 | 2.23 | 3.27
Page 20 Run 08/21/00
Georgia Department of Corrections Office of Planning and Analysis
Inmate statistical profile
Sample: ACTIVE PRISONERS SERVING LIFE EXCLUDING JAIL
Requestor: Statistics
Active inmates 08/21/2000
Number Of Disciplinaries by current age & sex
|
MEN
|
WOMEN
|
| Age | Age | Age | Age | Men
| Age | Age | Age | Age |Women
|Grand
Disciplinaries
|00-21 %|22-39 %|40-54 %|55-99 %|Total % |00-21 %|22-39 %|40-54 %|55-99 %|Total % |Total %
------------------------------------------------------------------------------------------------------------------------------------
ZERO
| 43 22| 477 16| 344 17| 117 29| 981 17 | 2 22| 28 22| 27 35| 12 46| 69 29 | 1050 18
ONE
| 24 12| 319 11| 273 13| 67 17| 683 12 | 1 11| 13 10| 10 13| 6 23| 30 12 | 713 12
TWO
| 17 9| 250 8| 188 9| 44 11| 499 9 | 1 11| 15 12| 11 14| 1 4| 28 12 | 527 9
THREE
| 12 6| 190 6| 147 7| 36 9| 385 7 | 0 0| 8 6| 8 10| 2 8| 18 7 | 403 7
FOUR
| 6 3| 182 6| 115 6| 25 6| 328 6 | 0 0| 9 7| 2 3| 1 4| 12 5 | 340 6
FIVE
| 8 4| 141 5| 88 4| 13 3| 250 4 | 1 11| 2 2| 3 4| 1 4| 7 3 | 257 4
MORE THAN FIVE
| 87 44| 1478 49| 890 44| 99 25| 2554 45 | 4 44| 54 42| 17 22| 3 12| 78 32 | 2632 44
------------------------------------------------------------------------------------------------------------------------------------
Total reported
| 197 100| 3037 100| 2045 100| 401 100| 5680 100 | 9 100| 129 100| 78 100| 26 100| 242 100 | 5922 100
|
|
|
|
|
|
|
|
|
|
|
Percent reported | 100.0|
99.9|
99.9| 100.0|
99.9 | 100.0| 100.0| 100.0| 100.0| 100.0 |
99.9
|
|
|
|
|
|
|
|
|
|
|
|
|
|
|
|
|
|
|
|
|
|
NOT REPORTED
|0|2|2|0|4
|0|0|0|0|0
|4
------------------------------------------------------------------------------------------------------------------------------------
Total
| 197 | 3039 | 2047 | 401 | 5684
| 9 | 129 | 78 | 26 | 242
| 5926
|
|
|
|
|
|
|
|
|
|
|
|
|
|
|
|
|
|
|
|
|
|
|
|
|
|
|
|
|
|
|
|
|
|
|
|
|
|
|
|
|
|
|
|
|
|
|
|
|
|
|
|
|
|
|
AVG NUM DISCIP
| 9.90 | 10.43 | 9.84 | 5.13 | 9.82 | 4.89 | 8.02 | 4.27 | 1.96 | 6.05 | 9.67
Page 21 Run 08/21/00
Georgia Department of Corrections Office of Planning and Analysis
Inmate statistical profile
Sample: ACTIVE PRISONERS SERVING LIFE EXCLUDING JAIL
Requestor: Statistics
Active inmates 08/21/2000
Number Of Escapes by current age & sex
|
MEN
|
WOMEN
|
| Age | Age | Age | Age | Men
| Age | Age | Age | Age |Women
|Grand
Escapes
|00-21 %|22-39 %|40-54 %|55-99 %|Total % |00-21 %|22-39 %|40-54 %|55-99 %|Total % |Total %
------------------------------------------------------------------------------------------------------------------------------------
ZERO
| 197 100| 3003 99| 1960 96| 383 96| 5543 98 | 9 100| 129 100| 76 97| 26 100| 240 99 | 5783 98
ONE
| 0 0| 35 1| 69 3| 12 3| 116 2 | 0 0| 0 0| 2 3| 0 0| 2 1 | 118 2
TWO
| 0 0| 1 0| 14 1| 4 1| 19 0 | 0 0| 0 0| 0 0| 0 0| 0 0 | 19 0
THREE
| 0 0| 0 0| 3 0| 2 0| 5 0 | 0 0| 0 0| 0 0| 0 0| 0 0 | 5 0
FOUR
| 0 0| 0 0| 1 0| 0 0| 1 0 | 0 0| 0 0| 0 0| 0 0| 0 0 | 1 0
FIVE
| 0 0| 0 0| 0 0| 0 0| 0 0 | 0 0| 0 0| 0 0| 0 0| 0 0 | 0 0
MORE THAN FIVE
| 0 0| 0 0| 0 0| 0 0| 0 0 | 0 0| 0 0| 0 0| 0 0| 0 0 | 0 0
------------------------------------------------------------------------------------------------------------------------------------
Total reported
| 197 100| 3039 100| 2047 100| 401 100| 5684 100 | 9 100| 129 100| 78 100| 26 100| 242 100 | 5926 100
|
|
|
|
|
|
|
|
|
|
|
Percent reported | 100.0| 100.0| 100.0| 100.0| 100.0 | 100.0| 100.0| 100.0| 100.0| 100.0 | 100.0
|
|
|
|
|
|
|
|
|
|
|
|
|
|
|
|
|
|
|
|
|
|
NOT REPORTED
|0|0|0|0|0
|0|0|0|0|0
|0
------------------------------------------------------------------------------------------------------------------------------------
Total
| 197 | 3039 | 2047 | 401 | 5684
| 9 | 129 | 78 | 26 | 242
| 5926
|
|
|
|
|
|
|
|
|
|
|
|
|
|
|
|
|
|
|
|
|
|
|
|
|
|
|
|
|
|
|
|
|
|
|
|
|
|
|
|
|
|
|
|
|
|
|
|
|
|
|
|
|
|
|
AVG NUM ESCAPES
| .00 | .01 | .05 | .06 | .03 | .00 | .00 | .03 | .00 | .01 | .03
Page 22 Run 08/21/00
Georgia Department of Corrections Office of Planning and Analysis
Inmate statistical profile
Sample: ACTIVE PRISONERS SERVING LIFE EXCLUDING JAIL
Requestor: Statistics
Active inmates 08/21/2000
Number Of Prior Georgia Incarcerations * by current age & sex
|
MEN
|
WOMEN
|
| Age | Age | Age | Age | Men
| Age | Age | Age | Age |Women
|Grand
Prior Incarcerations|00-21 %|22-39 %|40-54 %|55-99 %|Total % |00-21 %|22-39 %|40-54 %|55-99 %|Total % |Total %
------------------------------------------------------------------------------------------------------------------------------------
ZERO
| 191 97| 2036 67| 919 45| 224 56| 3370 59 | 9 100| 107 83| 61 78| 23 88| 200 83 | 3570 60
ONE
| 6 3| 580 19| 515 25| 93 23| 1194 21 | 0 0| 16 12| 11 14| 2 8| 29 12 | 1223 21
TWO
| 0 0| 232 8| 325 16| 41 10| 598 11 | 0 0| 3 2| 6 8| 1 4| 10 4 | 608 10
THREE
| 0 0| 129 4| 166 8| 29 7| 324 6 | 0 0| 2 2| 0 0| 0 0| 2 1 | 326 6
FOUR
| 0 0| 47 2| 72 4| 10 2| 129 2 | 0 0| 0 0| 0 0| 0 0| 0 0 | 129 2
FIVE
| 0 0| 12 0| 31 2| 2 0| 45 1 | 0 0| 0 0| 0 0| 0 0| 0 0 | 45 1
MORE THAN FIVE
| 0 0| 3 0| 19 1| 2 0| 24 0 | 0 0| 1 1| 0 0| 0 0| 1 0 | 25 0
------------------------------------------------------------------------------------------------------------------------------------
Total reported
| 197 100| 3039 100| 2047 100| 401 100| 5684 100 | 9 100| 129 100| 78 100| 26 100| 242 100 | 5926 100
|
|
|
|
|
|
|
|
|
|
|
Percent reported | 100.0| 100.0| 100.0| 100.0| 100.0 | 100.0| 100.0| 100.0| 100.0| 100.0 | 100.0
|
|
|
|
|
|
|
|
|
|
|
|
|
|
|
|
|
|
|
|
|
|
NOT REPORTED
|0|0|0|0|0
|0|0|0|0|0
|0
------------------------------------------------------------------------------------------------------------------------------------
Total
| 197 | 3039 | 2047 | 401 | 5684
| 9 | 129 | 78 | 26 | 242
| 5926
|
|
|
|
|
|
|
|
|
|
|
|
|
|
|
|
|
|
|
|
|
|
|
|
|
|
|
|
|
|
|
|
|
|
|
|
|
|
|
|
|
|
|
|
|
|
|
|
|
|
|
|
|
|
|
AVG # INCARCERATIONS| .03 | .56 | 1.09 | .81 | .75 | .00 | .27 | .29 | .15 | .26 | .73
* This data counts a parole revocation on an existing sentenCE AS A prior incarceration. Also, this data counts, for any cohort of inmates, the total number of Georgia incarcerations the inmate has had during his entire criminal career. For example, if an inmate was admitted to prison first in FY72, and then re-admitted in FY79 and FY85, he had two prior incarcerations before the FY85 admission. This inmate's records show two prior incarcerations in all three of his records since he has had two prior incarcerations in his criminal career. If the cohort of FY72 admissions is selected for analysis, two prior incarcerations will be listed for this inmate even though in FY72, he had no prior incarcerations.
Page 23 Run 08/21/00
Georgia Department of Corrections Office of Planning and Analysis
Inmate statistical profile
Sample: ACTIVE PRISONERS SERVING LIFE EXCLUDING JAIL
Requestor: Statistics
Active inmates 08/21/2000
Number Of Transfers by current age & sex
|
MEN
|
WOMEN
|
| Age | Age | Age | Age | Men
| Age | Age | Age | Age |Women
|Grand
Transfers
|00-21 %|22-39 %|40-54 %|55-99 %|Total % |00-21 %|22-39 %|40-54 %|55-99 %|Total % |Total %
------------------------------------------------------------------------------------------------------------------------------------
ZERO
| 58 29| 91 3| 17 1| 3 1| 169 3 | 1 11| 7 5| 5 6| 0 0| 13 5 | 182 3
ONE
| 88 45| 892 29| 403 20| 85 21| 1468 26 | 6 67| 37 29| 27 35| 5 19| 75 31 | 1543 26
TWO
| 39 20| 641 21| 354 17| 69 17| 1103 19 | 1 11| 43 33| 14 18| 5 19| 63 26 | 1166 20
THREE
| 9 5| 482 16| 282 14| 66 16| 839 15 | 1 11| 18 14| 14 18| 6 23| 39 16 | 878 15
FOUR
| 1 1| 333 11| 225 11| 37 9| 596 10 | 0 0| 13 10| 7 9| 4 15| 24 10 | 620 10
FIVE
| 2 1| 215 7| 161 8| 32 8| 410 7 | 0 0| 6 5| 3 4| 3 12| 12 5 | 422 7
MORE THAN FIVE
| 0 0| 385 13| 605 30| 109 27| 1099 19 | 0 0| 5 4| 8 10| 3 12| 16 7 | 1115 19
------------------------------------------------------------------------------------------------------------------------------------
Total reported
| 197 100| 3039 100| 2047 100| 401 100| 5684 100 | 9 100| 129 100| 78 100| 26 100| 242 100 | 5926 100
|
|
|
|
|
|
|
|
|
|
|
Percent reported | 100.0| 100.0| 100.0| 100.0| 100.0 | 100.0| 100.0| 100.0| 100.0| 100.0 | 100.0
|
|
|
|
|
|
|
|
|
|
|
|
|
|
|
|
|
|
|
|
|
|
NOT REPORTED
|0|0|0|0|0
|0|0|0|0|0
|0
------------------------------------------------------------------------------------------------------------------------------------
Total
| 197 | 3039 | 2047 | 401 | 5684
| 9 | 129 | 78 | 26 | 242
| 5926
|
|
|
|
|
|
|
|
|
|
|
|
|
|
|
|
|
|
|
|
|
|
|
|
|
|
|
|
|
|
|
|
|
|
|
|
|
|
|
|
|
|
|
|
|
|
|
|
|
|
|
|
|
|
|
AVG NUM TRANSFERS | 1.05 | 2.99 | 4.47 | 4.39 | 3.55 | 1.22 | 2.28 | 2.53 | 3.46 | 2.45 | 3.51
Page 24 Run 08/21/00
Georgia Department of Corrections Office of Planning and Analysis
Inmate statistical profile
Sample: ACTIVE PRISONERS SERVING LIFE EXCLUDING JAIL
Requestor: Statistics
Active inmates 08/21/2000
County Of Conviction by current age & sex
|
MEN
|
WOMEN
|
| Age | Age | Age | Age | Men
| Age | Age | Age | Age |Women
|Grand
County Of Conviction|00-21 %|22-39 %|40-54 %|55-99 %|Total % |00-21 %|22-39 %|40-54 %|55-99 %|Total % |Total %
------------------------------------------------------------------------------------------------------------------------------------
APPLING COUNTY
| 0 0| 4 0| 5 0| 0 0| 9 0 | 0 0| 0 0| 0 0| 0 0| 0 0 | 9 0
ATKINSON COUNTY
| 0 0| 1 0| 2 0| 2 0| 5 0 | 0 0| 0 0| 1 1| 0 0| 1 0 | 6 0
BACON COUNTY
| 0 0| 7 0| 3 0| 0 0| 10 0 | 0 0| 0 0| 0 0| 0 0| 0 0 | 10 0
BAKER COUNTY
| 0 0| 1 0| 1 0| 0 0| 2 0 | 0 0| 0 0| 0 0| 0 0| 0 0 | 2 0
BALDWIN COUNTY
| 2 1| 16 1| 12 1| 2 0| 32 1 | 0 0| 1 1| 0 0| 0 0| 1 0 | 33 1
BANKS COUNTY
| 0 0| 2 0| 8 0| 2 0| 12 0 | 0 0| 0 0| 0 0| 0 0| 0 0 | 12 0
BARROW COUNTY
| 0 0| 3 0| 10 0| 4 1| 17 0 | 0 0| 0 0| 1 1| 0 0| 1 0 | 18 0
BARTOW COUNTY
| 1 1| 29 1| 21 1| 3 1| 54 1 | 0 0| 2 2| 0 0| 0 0| 2 1 | 56 1
BEN HILL COUNTY
| 0 0| 7 0| 9 0| 3 1| 19 0 | 0 0| 0 0| 0 0| 0 0| 0 0 | 19 0
BERRIEN COUNTY
| 0 0| 4 0| 1 0| 0 0| 5 0 | 0 0| 0 0| 0 0| 0 0| 0 0 | 5 0
BIBB COUNTY
| 4 2| 91 3| 84 4| 15 4| 194 3 | 1 11| 2 2| 1 1| 1 4| 5 2 | 199 3
BLECKLEY COUNTY
| 0 0| 7 0| 4 0| 1 0| 12 0 | 0 0| 0 0| 1 1| 0 0| 1 0 | 13 0
BRANTLEY COUNTY
| 0 0| 1 0| 4 0| 2 0| 7 0 | 0 0| 0 0| 0 0| 0 0| 0 0 | 7 0
BROOKS COUNTY
| 0 0| 6 0| 5 0| 1 0| 12 0 | 0 0| 0 0| 0 0| 0 0| 0 0 | 12 0
BRYAN COUNTY
| 0 0| 9 0| 6 0| 1 0| 16 0 | 0 0| 0 0| 0 0| 1 4| 1 0 | 17 0
BULLOCH COUNTY
| 1 1| 19 1| 16 1| 0 0| 36 1 | 0 0| 1 1| 1 1| 1 4| 3 1 | 39 1
BURKE COUNTY
| 1 1| 14 0| 12 1| 1 0| 28 0 | 0 0| 0 0| 0 0| 0 0| 0 0 | 28 0
BUTTS COUNTY
| 3 2| 21 1| 11 1| 2 0| 37 1 | 0 0| 2 2| 1 1| 0 0| 3 1 | 40 1
CALHOUN COUNTY
| 1 1| 2 0| 3 0| 1 0| 7 0 | 0 0| 0 0| 0 0| 0 0| 0 0 | 7 0
CAMDEN COUNTY
| 1 1| 21 1| 7 0| 0 0| 29 1 | 0 0| 0 0| 1 1| 0 0| 1 0 | 30 1
CANDLER COUNTY
| 0 0| 1 0| 1 0| 0 0| 2 0 | 0 0| 0 0| 0 0| 0 0| 0 0 | 2 0
CARROLL COUNTY
| 1 1| 16 1| 13 1| 6 1| 36 1 | 0 0| 2 2| 1 1| 0 0| 3 1 | 39 1
CATOOSA COUNTY
| 0 0| 5 0| 8 0| 0 0| 13 0 | 0 0| 0 0| 0 0| 0 0| 0 0 | 13 0
CHARLTON COUNTY
| 0 0| 1 0| 0 0| 0 0| 1 0 | 0 0| 2 2| 0 0| 0 0| 2 1 | 3 0
CHATHAM COUNTY
| 7 4| 161 5| 103 5| 14 3| 285 5 | 0 0| 2 2| 1 1| 0 0| 3 1 | 288 5
CHATTAHOOCHEE COUNTY| 0 0| 0 0| 2 0| 0 0| 2 0 | 0 0| 0 0| 0 0| 0 0| 0 0 | 2 0
CHATTOOGA COUNTY | 0 0| 5 0| 6 0| 1 0| 12 0 | 0 0| 0 0| 1 1| 1 4| 2 1 | 14 0
CHEROKEE COUNTY
| 2 1| 8 0| 21 1| 2 0| 33 1 | 0 0| 3 2| 0 0| 0 0| 3 1 | 36 1
CLARKE COUNTY
| 1 1| 43 1| 23 1| 8 2| 75 1 | 0 0| 2 2| 0 0| 1 4| 3 1 | 78 1
CLAY COUNTY
| 0 0| 1 0| 1 0| 0 0| 2 0 | 0 0| 0 0| 0 0| 0 0| 0 0 | 2 0
CLAYTON COUNTY
| 5 3| 72 2| 37 2| 10 2| 124 2 | 0 0| 2 2| 3 4| 0 0| 5 2 | 129 2
CLINCH COUNTY
| 0 0| 2 0| 3 0| 0 0| 5 0 | 0 0| 0 0| 0 0| 0 0| 0 0 | 5 0
COBB COUNTY
| 7 4| 111 4| 74 4| 13 3| 205 4 | 0 0| 6 5| 3 4| 1 4| 10 4 | 215 4
COFFEE COUNTY
| 0 0| 8 0| 10 0| 3 1| 21 0 | 0 0| 1 1| 1 1| 0 0| 2 1 | 23 0
COLQUITT COUNTY
| 3 2| 40 1| 22 1| 3 1| 68 1 | 0 0| 1 1| 0 0| 1 4| 2 1 | 70 1
COLUMBIA COUNTY
| 0 0| 6 0| 9 0| 2 0| 17 0 | 0 0| 0 0| 1 1| 0 0| 1 0 | 18 0
------------------------------------------------------------------------------------------------------------------------------------
(continued)
Page 25 Run 08/21/00
Georgia Department of Corrections Office of Planning and Analysis
Inmate statistical profile
Sample: ACTIVE PRISONERS SERVING LIFE EXCLUDING JAIL
Requestor:
Active inmates 08/21/2000
County Of Conviction by current age & sex
Statistics (CONTINUED)
|
MEN
|
WOMEN
|
| Age | Age | Age | Age | Men
| Age | Age | Age | Age |Women
|Grand
County Of Conviction|00-21 %|22-39 %|40-54 %|55-99 %|Total % |00-21 %|22-39 %|40-54 %|55-99 %|Total % |Total %
------------------------------------------------------------------------------------------------------------------------------------
COOK COUNTY
| 0 0| 7 0| 3 0| 0 0| 10 0 | 0 0| 2 2| 0 0| 0 0| 2 1 | 12 0
COWETA COUNTY
| 5 3| 22 1| 10 0| 3 1| 40 1 | 0 0| 2 2| 1 1| 0 0| 3 1 | 43 1
CRAWFORD COUNTY
| 0 0| 3 0| 0 0| 0 0| 3 0 | 0 0| 0 0| 0 0| 0 0| 0 0 | 3 0
CRISP COUNTY
| 3 2| 14 0| 11 1| 1 0| 29 1 | 0 0| 3 2| 0 0| 2 8| 5 2 | 34 1
DADE COUNTY
| 2 1| 8 0| 6 0| 2 0| 18 0 | 0 0| 0 0| 0 0| 0 0| 0 0 | 18 0
DAWSON COUNTY
| 0 0| 3 0| 3 0| 1 0| 7 0 | 0 0| 0 0| 0 0| 0 0| 0 0 | 7 0
DECATUR COUNTY
| 2 1| 21 1| 5 0| 1 0| 29 1 | 0 0| 1 1| 0 0| 0 0| 1 0 | 30 1
DEKALB COUNTY
| 12 6| 250 8| 156 8| 21 5| 439 8 | 1 11| 3 2| 3 4| 1 4| 8 3 | 447 8
DODGE COUNTY
| 0 0| 6 0| 5 0| 1 0| 12 0 | 0 0| 0 0| 0 0| 0 0| 0 0 | 12 0
DOOLY COUNTY
| 2 1| 8 0| 7 0| 0 0| 17 0 | 0 0| 0 0| 0 0| 0 0| 0 0 | 17 0
DOUGHERTY COUNTY | 5 3| 71 2| 39 2| 4 1| 119 2 | 0 0| 5 4| 0 0| 0 0| 5 2 | 124 2
DOUGLAS COUNTY
| 2 1| 48 2| 18 1| 6 1| 74 1 | 0 0| 1 1| 1 1| 0 0| 2 1 | 76 1
EARLY COUNTY
| 0 0| 10 0| 5 0| 2 0| 17 0 | 0 0| 0 0| 0 0| 0 0| 0 0 | 17 0
ECHOLS COUNTY.
| 0 0| 0 0| 0 0| 0 0| 0 0 | 0 0| 0 0| 0 0| 0 0| 0 0 | 0 0
EFFINGHAM COUNTY | 0 0| 5 0| 3 0| 0 0| 8 0 | 0 0| 0 0| 0 0| 0 0| 0 0 | 8 0
ELBERT COUNTY
| 0 0| 13 0| 8 0| 1 0| 22 0 | 0 0| 1 1| 0 0| 0 0| 1 0 | 23 0
EMANUEL COUNTY
| 1 1| 8 0| 10 0| 2 0| 21 0 | 0 0| 0 0| 1 1| 0 0| 1 0 | 22 0
EVANS COUNTY
| 0 0| 7 0| 4 0| 2 0| 13 0 | 0 0| 0 0| 0 0| 0 0| 0 0 | 13 0
FANNIN COUNTY
| 0 0| 4 0| 5 0| 1 0| 10 0 | 0 0| 0 0| 0 0| 0 0| 0 0 | 10 0
FAYETTE COUNTY
| 1 1| 6 0| 5 0| 0 0| 12 0 | 0 0| 0 0| 0 0| 0 0| 0 0 | 12 0
FLOYD COUNTY
| 2 1| 30 1| 26 1| 4 1| 62 1 | 2 22| 3 2| 2 3| 1 4| 8 3 | 70 1
FORSYTH COUNTY
| 0 0| 6 0| 8 0| 3 1| 17 0 | 0 0| 1 1| 1 1| 0 0| 2 1 | 19 0
FRANKLIN COUNTY
| 1 1| 2 0| 3 0| 1 0| 7 0 | 0 0| 0 0| 2 3| 1 4| 3 1 | 10 0
FULTON COUNTY
| 29 15| 464 15| 307 15| 62 15| 862 15 | 1 11| 13 10| 5 6| 5 19| 24 10 | 886 15
GILMER COUNTY
| 0 0| 1 0| 2 0| 3 1| 6 0 | 0 0| 0 0| 0 0| 0 0| 0 0 | 6 0
GLASCOCK COUNTY
| 0 0| 0 0| 0 0| 0 0| 0 0 | 0 0| 0 0| 0 0| 0 0| 0 0 | 0 0
GLYNN COUNTY
| 7 4| 32 1| 27 1| 3 1| 69 1 | 0 0| 2 2| 2 3| 0 0| 4 2 | 73 1
GORDON COUNTY
| 0 0| 23 1| 13 1| 2 0| 38 1 | 0 0| 1 1| 0 0| 0 0| 1 0 | 39 1
GRADY COUNTY
| 3 2| 15 0| 10 0| 1 0| 29 1 | 0 0| 0 0| 0 0| 0 0| 0 0 | 29 0
GREENE COUNTY
| 1 1| 2 0| 5 0| 1 0| 9 0 | 0 0| 0 0| 0 0| 0 0| 0 0 | 9 0
GWINNETT COUNTY
| 1 1| 74 2| 40 2| 8 2| 123 2 | 0 0| 2 2| 5 6| 1 4| 8 3 | 131 2
HABERSHAM COUNTY | 2 1| 12 0| 9 0| 0 0| 23 0 | 0 0| 0 0| 0 0| 0 0| 0 0 | 23 0
HALL COUNTY
| 2 1| 44 1| 35 2| 10 2| 91 2 | 1 11| 3 2| 1 1| 1 4| 6 2 | 97 2
HANCOCK COUNTY
| 0 0| 3 0| 1 0| 0 0| 4 0 | 0 0| 0 0| 1 1| 0 0| 1 0 | 5 0
HARALSON COUNTY
| 0 0| 4 0| 2 0| 1 0| 7 0 | 0 0| 0 0| 0 0| 0 0| 0 0 | 7 0
------------------------------------------------------------------------------------------------------------------------------------
(continued)
Page 26 Run 08/21/00
Georgia Department of Corrections Office of Planning and Analysis
Inmate statistical profile
Sample: ACTIVE PRISONERS SERVING LIFE EXCLUDING JAIL
Requestor:
Active inmates 08/21/2000
County Of Conviction by current age & sex
Statistics (CONTINUED)
|
MEN
|
WOMEN
|
| Age | Age | Age | Age | Men
| Age | Age | Age | Age |Women
|Grand
County Of Conviction|00-21 %|22-39 %|40-54 %|55-99 %|Total % |00-21 %|22-39 %|40-54 %|55-99 %|Total % |Total %
------------------------------------------------------------------------------------------------------------------------------------
HARRIS COUNTY
| 1 1| 8 0| 3 0| 0 0| 12 0 | 0 0| 0 0| 0 0| 0 0| 0 0 | 12 0
HART COUNTY
| 0 0| 3 0| 2 0| 0 0| 5 0 | 0 0| 0 0| 0 0| 0 0| 0 0 | 5 0
HEARD COUNTY
| 0 0| 2 0| 0 0| 3 1| 5 0 | 0 0| 0 0| 0 0| 0 0| 0 0 | 5 0
HENRY COUNTY
| 0 0| 23 1| 9 0| 1 0| 33 1 | 0 0| 1 1| 0 0| 0 0| 1 0 | 34 1
HOUSTON COUNTY
| 0 0| 40 1| 19 1| 3 1| 62 1 | 0 0| 4 3| 3 4| 1 4| 8 3 | 70 1
IRWIN COUNTY
| 0 0| 3 0| 1 0| 1 0| 5 0 | 0 0| 0 0| 0 0| 0 0| 0 0 | 5 0
JACKSON COUNTY
| 1 1| 6 0| 14 1| 1 0| 22 0 | 0 0| 1 1| 0 0| 0 0| 1 0 | 23 0
JASPER COUNTY
| 0 0| 8 0| 0 0| 0 0| 8 0 | 0 0| 0 0| 1 1| 0 0| 1 0 | 9 0
JEFF DAVIS COUNTY | 0 0| 4 0| 4 0| 2 0| 10 0 | 0 0| 0 0| 0 0| 0 0| 0 0 | 10 0
JEFFERSON COUNTY | 0 0| 9 0| 4 0| 4 1| 17 0 | 0 0| 0 0| 0 0| 0 0| 0 0 | 17 0
JENKINS COUNTY
| 0 0| 2 0| 4 0| 0 0| 6 0 | 0 0| 0 0| 0 0| 0 0| 0 0 | 6 0
JOHNSON COUNTY
| 0 0| 9 0| 2 0| 1 0| 12 0 | 0 0| 1 1| 0 0| 0 0| 1 0 | 13 0
JONES COUNTY
| 0 0| 1 0| 6 0| 3 1| 10 0 | 0 0| 0 0| 0 0| 0 0| 0 0 | 10 0
LAMAR COUNTY
| 0 0| 9 0| 10 0| 3 1| 22 0 | 0 0| 0 0| 1 1| 0 0| 1 0 | 23 0
LANIER COUNTY
| 0 0| 1 0| 0 0| 0 0| 1 0 | 0 0| 0 0| 0 0| 0 0| 0 0 | 1 0
LAURENS COUNTY
| 1 1| 13 0| 7 0| 1 0| 22 0 | 0 0| 1 1| 2 3| 0 0| 3 1 | 25 0
LEE COUNTY
| 0 0| 2 0| 0 0| 0 0| 2 0 | 1 11| 0 0| 0 0| 0 0| 1 0 | 3 0
LIBERTY COUNTY
| 2 1| 22 1| 9 0| 4 1| 37 1 | 0 0| 2 2| 0 0| 0 0| 2 1 | 39 1
LINCOLN COUNTY
| 1 1| 2 0| 2 0| 0 0| 5 0 | 0 0| 0 0| 0 0| 0 0| 0 0 | 5 0
LONG COUNTY
| 1 1| 6 0| 3 0| 2 0| 12 0 | 0 0| 2 2| 0 0| 0 0| 2 1 | 14 0
LOWNDES COUNTY
| 0 0| 40 1| 25 1| 2 0| 67 1 | 0 0| 0 0| 2 3| 1 4| 3 1 | 70 1
LUMPKIN COUNTY
| 1 1| 3 0| 0 0| 2 0| 6 0 | 0 0| 0 0| 0 0| 0 0| 0 0 | 6 0
MACON COUNTY
| 1 1| 16 1| 7 0| 0 0| 24 0 | 0 0| 0 0| 0 0| 0 0| 0 0 | 24 0
MADISON COUNTY
| 0 0| 6 0| 4 0| 3 1| 13 0 | 0 0| 2 2| 0 0| 0 0| 2 1 | 15 0
MARION COUNTY
| 0 0| 2 0| 1 0| 0 0| 3 0 | 0 0| 0 0| 1 1| 0 0| 1 0 | 4 0
MCDUFFIE COUNTY
| 0 0| 31 1| 10 0| 4 1| 45 1 | 1 11| 1 1| 0 0| 0 0| 2 1 | 47 1
MCINTOSH COUNTY
| 1 1| 8 0| 8 0| 0 0| 17 0 | 0 0| 0 0| 0 0| 0 0| 0 0 | 17 0
MERIWETHER COUNTY | 0 0| 9 0| 9 0| 3 1| 21 0 | 0 0| 2 2| 0 0| 1 4| 3 1 | 24 0
MILLER COUNTY
| 0 0| 2 0| 2 0| 0 0| 4 0 | 0 0| 0 0| 0 0| 0 0| 0 0 | 4 0
MITCHELL COUNTY
| 0 0| 11 0| 9 0| 2 0| 22 0 | 0 0| 2 2| 0 0| 0 0| 2 1 | 24 0
MONROE COUNTY
| 0 0| 10 0| 8 0| 2 0| 20 0 | 0 0| 1 1| 0 0| 0 0| 1 0 | 21 0
MONTGOMERY COUNTY | 0 0| 0 0| 4 0| 0 0| 4 0 | 0 0| 0 0| 0 0| 0 0| 0 0 | 4 0
MORGAN COUNTY
| 0 0| 12 0| 2 0| 0 0| 14 0 | 0 0| 1 1| 0 0| 0 0| 1 0 | 15 0
MURRAY COUNTY
| 2 1| 3 0| 6 0| 4 1| 15 0 | 0 0| 0 0| 0 0| 0 0| 0 0 | 15 0
MUSCOGEE COUNTY
| 5 3| 77 3| 75 4| 10 2| 167 3 | 0 0| 5 4| 1 1| 0 0| 6 2 | 173 3
------------------------------------------------------------------------------------------------------------------------------------
(continued)
Page 27 Run 08/21/00
Georgia Department of Corrections Office of Planning and Analysis
Inmate statistical profile
Sample: ACTIVE PRISONERS SERVING LIFE EXCLUDING JAIL
Requestor:
Active inmates 08/21/2000
County Of Conviction by current age & sex
Statistics (CONTINUED)
|
MEN
|
WOMEN
|
| Age | Age | Age | Age | Men
| Age | Age | Age | Age |Women
|Grand
County Of Conviction|00-21 %|22-39 %|40-54 %|55-99 %|Total % |00-21 %|22-39 %|40-54 %|55-99 %|Total % |Total %
------------------------------------------------------------------------------------------------------------------------------------
NEWTON COUNTY
| 4 2| 45 1| 17 1| 4 1| 70 1 | 0 0| 2 2| 0 0| 0 0| 2 1 | 72 1
OCONEE COUNTY
| 0 0| 9 0| 3 0| 0 0| 12 0 | 0 0| 0 0| 0 0| 0 0| 0 0 | 12 0
OGLETHORPE COUNTY | 0 0| 5 0| 3 0| 1 0| 9 0 | 0 0| 0 0| 0 0| 0 0| 0 0 | 9 0
PAULDING COUNTY
| 0 0| 4 0| 6 0| 3 1| 13 0 | 0 0| 0 0| 0 0| 0 0| 0 0 | 13 0
PEACH COUNTY
| 0 0| 6 0| 3 0| 0 0| 9 0 | 0 0| 0 0| 1 1| 0 0| 1 0 | 10 0
PICKENS COUNTY
| 0 0| 4 0| 0 0| 1 0| 5 0 | 0 0| 0 0| 1 1| 0 0| 1 0 | 6 0
PIERCE COUNTY
| 3 2| 2 0| 5 0| 0 0| 10 0 | 0 0| 0 0| 0 0| 0 0| 0 0 | 10 0
PIKE COUNTY
| 0 0| 1 0| 1 0| 0 0| 2 0 | 0 0| 0 0| 0 0| 0 0| 0 0 | 2 0
POLK COUNTY
| 1 1| 11 0| 8 0| 2 0| 22 0 | 0 0| 0 0| 0 0| 0 0| 0 0 | 22 0
PULASKI COUNTY
| 1 1| 6 0| 1 0| 0 0| 8 0 | 0 0| 1 1| 0 0| 0 0| 1 0 | 9 0
PUTNAM COUNTY
| 0 0| 21 1| 15 1| 3 1| 39 1 | 0 0| 0 0| 0 0| 0 0| 0 0 | 39 1
QUITMAN COUNTY
| 0 0| 4 0| 0 0| 0 0| 4 0 | 0 0| 0 0| 0 0| 0 0| 0 0 | 4 0
RABUN COUNTY
| 0 0| 8 0| 1 0| 0 0| 9 0 | 0 0| 0 0| 0 0| 0 0| 0 0 | 9 0
RANDOLPH COUNTY
| 0 0| 3 0| 2 0| 2 0| 7 0 | 0 0| 0 0| 0 0| 0 0| 0 0 | 7 0
RICHMOND COUNTY
| 15 8| 156 5| 73 4| 12 3| 256 5 | 0 0| 9 7| 8 10| 1 4| 18 7 | 274 5
ROCKDALE COUNTY
| 1 1| 11 0| 10 0| 5 1| 27 0 | 0 0| 1 1| 0 0| 0 0| 1 0 | 28 0
SCHLEY COUNTY
| 0 0| 4 0| 1 0| 0 0| 5 0 | 0 0| 0 0| 0 0| 0 0| 0 0 | 5 0
SCREVEN COUNTY
| 0 0| 5 0| 5 0| 2 0| 12 0 | 0 0| 0 0| 0 0| 0 0| 0 0 | 12 0
SEMINOLE COUNTY
| 1 1| 4 0| 4 0| 2 0| 11 0 | 0 0| 1 1| 0 0| 0 0| 1 0 | 12 0
SPALDING COUNTY
| 2 1| 41 1| 23 1| 6 1| 72 1 | 1 11| 1 1| 1 1| 1 4| 4 2 | 76 1
STEPHENS COUNTY
| 0 0| 4 0| 4 0| 3 1| 11 0 | 0 0| 0 0| 0 0| 0 0| 0 0 | 11 0
STEWART COUNTY
| 0 0| 2 0| 1 0| 0 0| 3 0 | 0 0| 0 0| 2 3| 0 0| 2 1 | 5 0
SUMTER COUNTY
| 0 0| 5 0| 13 1| 1 0| 19 0 | 0 0| 0 0| 1 1| 0 0| 1 0 | 20 0
TALBOT COUNTY
| 2 1| 3 0| 1 0| 0 0| 6 0 | 0 0| 0 0| 1 1| 0 0| 1 0 | 7 0
TALIAFERRO COUNTY | 0 0| 0 0| 3 0| 0 0| 3 0 | 0 0| 0 0| 0 0| 0 0| 0 0 | 3 0
TATTNALL COUNTY
| 0 0| 17 1| 13 1| 3 1| 33 1 | 0 0| 0 0| 1 1| 0 0| 1 0 | 34 1
TAYLOR COUNTY
| 3 2| 9 0| 4 0| 0 0| 16 0 | 0 0| 0 0| 0 0| 0 0| 0 0 | 16 0
TELFAIR COUNTY
| 1 1| 6 0| 2 0| 0 0| 9 0 | 0 0| 0 0| 1 1| 0 0| 1 0 | 10 0
TERRELL COUNTY
| 1 1| 12 0| 3 0| 1 0| 17 0 | 0 0| 0 0| 0 0| 0 0| 0 0 | 17 0
THOMAS COUNTY
| 2 1| 19 1| 20 1| 3 1| 44 1 | 0 0| 2 2| 0 0| 0 0| 2 1 | 46 1
TIFT COUNTY
| 7 4| 34 1| 21 1| 5 1| 67 1 | 0 0| 0 0| 2 3| 1 4| 3 1 | 70 1
TOOMBS COUNTY
| 5 3| 23 1| 8 0| 1 0| 37 1 | 0 0| 2 2| 0 0| 0 0| 2 1 | 39 1
TOWNS COUNTY
| 0 0| 1 0| 1 0| 0 0| 2 0 | 0 0| 0 0| 0 0| 0 0| 0 0 | 2 0
TREUTLEN COUNTY
| 0 0| 3 0| 4 0| 0 0| 7 0 | 0 0| 0 0| 0 0| 0 0| 0 0 | 7 0
TROUP COUNTY
| 2 1| 26 1| 25 1| 6 1| 59 1 | 0 0| 2 2| 1 1| 0 0| 3 1 | 62 1
------------------------------------------------------------------------------------------------------------------------------------
(continued)
Page 28 Run 08/21/00
Georgia Department of Corrections Office of Planning and Analysis
Inmate statistical profile
Sample: ACTIVE PRISONERS SERVING LIFE EXCLUDING JAIL
Requestor:
Active inmates 08/21/2000
County Of Conviction by current age & sex
Statistics (CONTINUED)
|
MEN
|
WOMEN
|
| Age | Age | Age | Age | Men
| Age | Age | Age | Age |Women
|Grand
County Of Conviction|00-21 %|22-39 %|40-54 %|55-99 %|Total % |00-21 %|22-39 %|40-54 %|55-99 %|Total % |Total %
------------------------------------------------------------------------------------------------------------------------------------
TURNER COUNTY
| 0 0| 8 0| 7 0| 0 0| 15 0 | 0 0| 0 0| 0 0| 0 0| 0 0 | 15 0
TWIGGS COUNTY
| 0 0| 3 0| 5 0| 1 0| 9 0 | 0 0| 0 0| 0 0| 0 0| 0 0 | 9 0
UNION COUNTY
| 0 0| 0 0| 1 0| 0 0| 1 0 | 0 0| 0 0| 0 0| 0 0| 0 0 | 1 0
UPSON COUNTY
| 0 0| 7 0| 5 0| 1 0| 13 0 | 0 0| 0 0| 1 1| 0 0| 1 0 | 14 0
WALKER COUNTY
| 0 0| 14 0| 11 1| 3 1| 28 0 | 0 0| 1 1| 1 1| 0 0| 2 1 | 30 1
WALTON COUNTY
| 2 1| 29 1| 20 1| 2 0| 53 1 | 0 0| 2 2| 0 0| 0 0| 2 1 | 55 1
WARE COUNTY
| 0 0| 13 0| 11 1| 3 1| 27 0 | 0 0| 0 0| 1 1| 0 0| 1 0 | 28 0
WARREN COUNTY
| 0 0| 4 0| 6 0| 1 0| 11 0 | 0 0| 0 0| 0 0| 0 0| 0 0 | 11 0
WASHINGTON COUNTY | 0 0| 7 0| 7 0| 1 0| 15 0 | 0 0| 1 1| 0 0| 0 0| 1 0 | 16 0
WAYNE COUNTY
| 0 0| 7 0| 8 0| 2 0| 17 0 | 0 0| 1 1| 0 0| 0 0| 1 0 | 18 0
WEBSTER COUNTY
| 0 0| 0 0| 0 0| 0 0| 0 0 | 0 0| 0 0| 0 0| 0 0| 0 0 | 0 0
WHEELER COUNTY
| 0 0| 3 0| 3 0| 1 0| 7 0 | 0 0| 0 0| 0 0| 1 4| 1 0 | 8 0
WHITE COUNTY
| 0 0| 3 0| 2 0| 0 0| 5 0 | 0 0| 0 0| 0 0| 0 0| 0 0 | 5 0
WHITFIELD COUNTY | 0 0| 25 1| 25 1| 7 2| 57 1 | 0 0| 5 4| 1 1| 0 0| 6 2 | 63 1
WILCOX COUNTY
| 0 0| 1 0| 7 0| 0 0| 8 0 | 0 0| 0 0| 0 0| 0 0| 0 0 | 8 0
WILKES COUNTY
| 0 0| 7 0| 3 0| 1 0| 11 0 | 0 0| 0 0| 0 0| 0 0| 0 0 | 11 0
WILKINSON COUNTY | 0 0| 7 0| 1 0| 0 0| 8 0 | 0 0| 0 0| 0 0| 0 0| 0 0 | 8 0
WORTH COUNTY
| 4 2| 13 0| 4 0| 2 0| 23 0 | 0 0| 0 0| 0 0| 0 0| 0 0 | 23 0
CONVERSION
| 0 2| 0 0| 0 0| 0 0| 0 0 | 0 0| 0 0| 0 0| 0 0| 0 0 | 0 0
------------------------------------------------------------------------------------------------------------------------------------
Total reported
| 197 100| 3039 100| 2047 100| 401 100| 5684 100 | 9 100| 129 100| 78 100| 26 100| 242 100 | 5926 100
|
|
|
|
|
|
|
|
|
|
|
Percent reported | 100.0| 100.0| 100.0| 100.0| 100.0 | 100.0| 100.0| 100.0| 100.0| 100.0 | 100.0
|
|
|
|
|
|
|
|
|
|
|
|
|
|
|
|
|
|
|
|
|
|
UNKNOWN
|0|0|0|0|0
|0|0|0|0|0
|0
------------------------------------------------------------------------------------------------------------------------------------
Total
| 197 | 3039 | 2047 | 401 | 5684
| 9 | 129 | 78 | 26 | 242
| 5926
Page 29 Run 08/21/00
Georgia Department of Corrections Office of Planning and Analysis
Inmate statistical profile
Sample: ACTIVE PRISONERS SERVING LIFE EXCLUDING JAIL
Requestor: Statistics
Active inmates 08/21/2000
Circuit Of Conviction by current age & sex
|
MEN
|
WOMEN
|
| Age | Age | Age | Age | Men
| Age | Age | Age | Age |Women
|Grand
Circ Of Conviction |00-21 %|22-39 %|40-54 %|55-99 %|Total % |00-21 %|22-39 %|40-54 %|55-99 %|Total % |Total %
------------------------------------------------------------------------------------------------------------------------------------
ALAPAHA CIRCUIT
| 0 0| 15 0| 9 0| 2 0| 26 0 | 0 0| 2 2| 1 1| 0 0| 3 1 | 29 0
ALCOVY CIRCUIT
| 6 3| 74 2| 37 2| 6 1| 123 2 | 0 0| 4 3| 0 0| 0 0| 4 2 | 127 2
ATLANTA CIRCUIT
| 29 15| 464 15| 307 15| 62 15| 862 15 | 1 11| 13 10| 5 6| 5 19| 24 10 | 886 15
ATLANTIC CIRCUIT | 4 2| 69 2| 43 2| 12 3| 128 2 | 0 0| 4 3| 1 1| 1 4| 6 2 | 134 2
AUGUSTA CIRCUIT
| 16 8| 176 6| 94 5| 15 4| 301 5 | 0 0| 9 7| 9 12| 1 4| 19 8 | 320 5
BLUE RIDGE CIRCUIT | 2 1| 13 0| 29 1| 5 1| 49 1 | 0 0| 4 3| 1 1| 0 0| 5 2 | 54 1
BRUNSWICK CIRCUIT | 8 4| 68 2| 51 2| 7 2| 134 2 | 0 0| 3 2| 3 4| 0 0| 6 2 | 140 2
CHATTAHOOCHEE CIRCUI| 11 6| 99 3| 86 4| 10 2| 206 4 | 0 0| 5 4| 3 4| 0 0| 8 3 | 214 4
CHEROKEE CIRCUIT | 1 1| 52 2| 34 2| 5 1| 92 2 | 0 0| 3 2| 0 0| 0 0| 3 1 | 95 2
CLAYTON CIRCUIT
| 5 3| 72 2| 37 2| 10 2| 124 2 | 0 0| 2 2| 3 4| 0 0| 5 2 | 129 2
COBB CIRCUIT
| 7 4| 111 4| 74 4| 13 3| 205 4 | 0 0| 6 5| 3 4| 1 4| 10 4 | 215 4
CONASAUGA CIRCUIT | 2 1| 28 1| 31 2| 11 3| 72 1 | 0 0| 5 4| 1 1| 0 0| 6 2 | 78 1
CORDELE CIRCUIT
| 5 3| 30 1| 34 2| 4 1| 73 1 | 0 0| 3 2| 0 0| 2 8| 5 2 | 78 1
COWETA CIRCUIT
| 8 4| 75 2| 57 3| 21 5| 161 3 | 0 0| 8 6| 3 4| 1 4| 12 5 | 173 3
DOUGHERTY CIRCUIT | 5 3| 71 2| 39 2| 4 1| 119 2 | 0 0| 5 4| 0 0| 0 0| 5 2 | 124 2
DUBLIN CIRCUIT
| 1 1| 28 1| 18 1| 3 1| 50 1 | 0 0| 2 2| 2 3| 0 0| 4 2 | 54 1
EASTERN CIRCUIT
| 7 4| 161 5| 103 5| 14 3| 285 5 | 0 0| 2 2| 1 1| 0 0| 3 1 | 288 5
FLINT CIRCUIT
| 2 1| 61 2| 37 2| 8 2| 108 2 | 0 0| 4 3| 2 3| 0 0| 6 2 | 114 2
GRIFFIN CIRCUIT
| 3 2| 55 2| 34 2| 7 2| 99 2 | 1 11| 1 1| 2 3| 1 4| 5 2 | 104 2
GWINNETT CIRCUIT | 1 1| 74 2| 40 2| 8 2| 123 2 | 0 0| 2 2| 5 6| 1 4| 8 3 | 131 2
HOUSTON CIRCUIT
| 0 0| 40 1| 19 1| 3 1| 62 1 | 0 0| 4 3| 3 4| 1 4| 8 3 | 70 1
LOOKOUT MOUNTAIN CIR| 2 1| 32 1| 31 2| 6 1| 71 1 | 0 0| 1 1| 2 3| 1 4| 4 2 | 75 1
MACON CIRCUIT
| 4 2| 100 3| 87 4| 15 4| 206 4 | 1 11| 2 2| 2 3| 1 4| 6 2 | 212 4
MIDDLE CIRCUIT
| 6 3| 48 2| 30 1| 8 2| 92 2 | 0 0| 3 2| 1 1| 0 0| 4 2 | 96 2
MOUNTAIN CIRCUIT | 2 1| 24 1| 14 1| 3 1| 43 1 | 0 0| 0 0| 0 0| 0 0| 0 0 | 43 1
NORTHEASTERN CIRCUIT| 2 1| 47 2| 38 2| 11 3| 98 2 | 1 11| 3 2| 1 1| 1 4| 6 2 | 104 2
NORTHERN CIRCUIT | 1 1| 29 1| 20 1| 6 1| 56 1 | 0 0| 3 2| 2 3| 1 4| 6 2 | 62 1
OCMULGEE CIRCUIT | 3 2| 70 2| 42 2| 9 2| 124 2 | 0 0| 2 2| 2 3| 0 0| 4 2 | 128 2
OCONEE CIRCUIT
| 2 1| 28 1| 19 1| 3 1| 52 1 | 0 0| 1 1| 2 3| 1 4| 4 2 | 56 1
OGEECHEE CIRCUIT | 1 1| 31 1| 28 1| 2 0| 62 1 | 0 0| 1 1| 1 1| 1 4| 3 1 | 65 1
PATAULA CIRCUIT
| 2 1| 36 1| 17 1| 7 2| 62 1 | 0 0| 1 1| 0 0| 0 0| 1 0 | 63 1
PIEDMONT CIRCUIT | 1 1| 11 0| 32 2| 7 2| 51 1 | 0 0| 1 1| 1 1| 0 0| 2 1 | 53 1
ROME CIRCUIT
| 2 1| 30 1| 26 1| 4 1| 62 1 | 2 22| 3 2| 2 3| 1 4| 8 3 | 70 1
SOUTH GEORGIA CIRCUI| 6 3| 50 2| 28 1| 5 1| 89 2 | 0 0| 3 2| 0 0| 0 0| 3 1 | 92 2
SOUTHERN CIRCUIT | 5 3| 105 3| 72 4| 9 2| 191 3 | 0 0| 3 2| 2 3| 2 8| 7 3 | 198 3
------------------------------------------------------------------------------------------------------------------------------------
(continued)
Page 30 Run 08/21/00
Georgia Department of Corrections Office of Planning and Analysis
Inmate statistical profile
Sample: ACTIVE PRISONERS SERVING LIFE EXCLUDING JAIL
Requestor:
Active inmates 08/21/2000
Circuit Of Conviction by current age & sex
Statistics (Continued)
|
MEN
|
WOMEN
|
| Age | Age | Age | Age | Men
| Age | Age | Age | Age |Women
|Grand
Circ Of Conviction |00-21 %|22-39 %|40-54 %|55-99 %|Total % |00-21 %|22-39 %|40-54 %|55-99 %|Total % |Total %
------------------------------------------------------------------------------------------------------------------------------------
SOUTHWESTERN CIRCUIT| 1 1| 29 1| 22 1| 1 0| 53 1 | 1 11| 0 0| 3 4| 0 0| 4 2 | 57 1
STONE MOUNTAIN CIRCU| 12 6| 250 8| 156 8| 21 5| 439 8 | 1 11| 3 2| 3 4| 1 4| 8 3 | 447 8
TALLAPOOSA CIRCUIT | 1 1| 19 1| 16 1| 6 1| 42 1 | 0 0| 0 0| 0 0| 0 0| 0 0 | 42 1
TIFTON CIRCUIT
| 11 6| 58 2| 33 2| 8 2| 110 2 | 0 0| 0 0| 2 3| 1 4| 3 1 | 113 2
TOOMBS CIRCUIT
| 1 1| 44 1| 24 1| 6 1| 75 1 | 1 11| 1 1| 0 0| 0 0| 2 1 | 77 1
WAYCROSS CIRCUIT | 3 2| 32 1| 33 2| 8 2| 76 1 | 0 0| 3 2| 2 3| 0 0| 5 2 | 81 1
WESTERN CIRCUIT
| 1 1| 52 2| 26 1| 8 2| 87 2 | 0 0| 2 2| 0 0| 1 4| 3 1 | 90 2
ROCKDALE CIRCUIT | 1 1| 11 0| 10 0| 5 1| 27 0 | 0 0| 1 1| 0 0| 0 0| 1 0 | 28 0
DOUGLAS CIRCUIT
| 2 1| 48 2| 18 1| 6 1| 74 1 | 0 0| 1 1| 1 1| 0 0| 2 1 | 76 1
APPALACHIAN CIRCUIT | 0 0| 9 0| 7 0| 5 1| 21 0 | 0 0| 0 0| 1 1| 0 0| 1 0 | 22 0
ENOTAH CIRCUIT
| 1 1| 7 0| 4 0| 2 0| 14 0 | 0 0| 0 0| 0 0| 0 0| 0 0 | 14 0
BELL-FORSYTH CIRCUIT| 0 0| 1 0| 0 0| 0 0| 1 0 | 0 0| 0 0| 0 0| 0 0| 0 0 | 1 0
------------------------------------------------------------------------------------------------------------------------------------
Total reported
| 196 100| 3037 100| 2046 100| 401 100| 5680 100 | 9 100| 129 100| 78 100| 26 100| 242 100 | 5922 100
|
|
|
|
|
|
|
|
|
|
|
Percent reported |
99.5|
99.9| 100.0| 100.0|
99.9 | 100.0| 100.0| 100.0| 100.0| 100.0 |
99.9
|
|
|
|
|
|
|
|
|
|
|
|
|
|
|
|
|
|
|
|
|
|
NOT REPORTED
|1|2|1|0|4
|0|0|0|0|0
|4
------------------------------------------------------------------------------------------------------------------------------------
Total
| 197 | 3039 | 2047 | 401 | 5684
| 9 | 129 | 78 | 26 | 242
| 5926
Page 31 Run 08/21/00
Georgia Department of Corrections Office of Planning and Analysis
Inmate statistical profile
Sample: ACTIVE PRISONERS SERVING LIFE EXCLUDING JAIL
Requestor: Statistics
Active inmates 08/21/2000
Home County by current age & sex
|
MEN
|
WOMEN
|
| Age | Age | Age | Age | Men
| Age | Age | Age | Age |Women
|Grand
Home County
|00-21 %|22-39 %|40-54 %|55-99 %|Total % |00-21 %|22-39 %|40-54 %|55-99 %|Total % |Total %
------------------------------------------------------------------------------------------------------------------------------------
APPLING COUNTY
| 0 0| 4 0| 5 0| 1 0| 10 0 | 0 0| 0 0| 0 0| 0 0| 0 0 | 10 0
ATKINSON COUNTY
| 0 0| 1 0| 1 0| 3 1| 5 0 | 0 0| 0 0| 0 0| 0 0| 0 0 | 5 0
BACON COUNTY
| 0 0| 5 0| 4 0| 1 0| 10 0 | 0 0| 0 0| 0 0| 0 0| 0 0 | 10 0
BAKER COUNTY
| 0 0| 1 0| 2 0| 0 0| 3 0 | 0 0| 0 0| 0 0| 0 0| 0 0 | 3 0
BALDWIN COUNTY
| 0 0| 16 1| 7 0| 1 0| 24 0 | 0 0| 1 1| 0 0| 1 4| 2 1 | 26 0
BANKS COUNTY
| 0 0| 1 0| 4 0| 1 0| 6 0 | 0 0| 1 1| 0 0| 0 0| 1 0 | 7 0
BARROW COUNTY
| 0 0| 6 0| 8 0| 2 1| 16 0 | 0 0| 0 0| 1 1| 0 0| 1 0 | 17 0
BARTOW COUNTY
| 1 1| 21 1| 18 1| 5 1| 45 1 | 1 13| 3 3| 0 0| 0 0| 4 2 | 49 1
BEN HILL COUNTY
| 0 0| 5 0| 7 0| 3 1| 15 0 | 0 0| 0 0| 1 1| 0 0| 1 0 | 16 0
BERRIEN COUNTY
| 0 0| 4 0| 1 0| 1 0| 6 0 | 0 0| 0 0| 0 0| 0 0| 0 0 | 6 0
BIBB COUNTY
| 4 2| 82 3| 78 4| 18 5| 182 3 | 1 13| 5 4| 2 3| 0 0| 8 4 | 190 3
BLECKLEY COUNTY
| 0 0| 8 0| 4 0| 1 0| 13 0 | 0 0| 0 0| 1 1| 0 0| 1 0 | 14 0
BRANTLEY COUNTY
| 0 0| 1 0| 2 0| 0 0| 3 0 | 0 0| 0 0| 0 0| 0 0| 0 0 | 3 0
BROOKS COUNTY
| 0 0| 8 0| 3 0| 1 0| 12 0 | 0 0| 0 0| 0 0| 0 0| 0 0 | 12 0
BRYAN COUNTY
| 0 0| 8 0| 5 0| 1 0| 14 0 | 0 0| 0 0| 0 0| 0 0| 0 0 | 14 0
BULLOCH COUNTY
| 1 1| 13 0| 11 1| 0 0| 25 0 | 0 0| 0 0| 1 1| 1 4| 2 1 | 27 0
BURKE COUNTY
| 0 0| 8 0| 7 0| 2 1| 17 0 | 0 0| 0 0| 0 0| 0 0| 0 0 | 17 0
BUTTS COUNTY
| 1 1| 22 1| 8 0| 2 1| 33 1 | 0 0| 1 1| 1 1| 0 0| 2 1 | 35 1
CALHOUN COUNTY
| 1 1| 3 0| 3 0| 1 0| 8 0 | 0 0| 0 0| 0 0| 0 0| 0 0 | 8 0
CAMDEN COUNTY
| 2 1| 17 1| 5 0| 0 0| 24 0 | 0 0| 0 0| 1 1| 0 0| 1 0 | 25 0
CANDLER COUNTY
| 0 0| 2 0| 1 0| 0 0| 3 0 | 0 0| 0 0| 0 0| 0 0| 0 0 | 3 0
CARROLL COUNTY
| 1 1| 19 1| 12 1| 8 2| 40 1 | 0 0| 2 2| 1 1| 0 0| 3 1 | 43 1
CATOOSA COUNTY
| 0 0| 2 0| 5 0| 1 0| 8 0 | 0 0| 0 0| 0 0| 0 0| 0 0 | 8 0
CHARLTON COUNTY
| 0 0| 1 0| 0 0| 0 0| 1 0 | 0 0| 1 1| 0 0| 0 0| 1 0 | 2 0
CHATHAM COUNTY
| 8 4| 149 5| 95 5| 14 4| 266 5 | 0 0| 2 2| 1 1| 1 4| 4 2 | 270 5
CHATTAHOOCHEE COUNTY| 0 0| 0 0| 1 0| 0 0| 1 0 | 0 0| 0 0| 0 0| 0 0| 0 0 | 1 0
CHATTOOGA COUNTY | 0 0| 3 0| 6 0| 0 0| 9 0 | 0 0| 0 0| 1 1| 1 4| 2 1 | 11 0
CHEROKEE COUNTY
| 2 1| 7 0| 17 1| 1 0| 27 1 | 0 0| 2 2| 0 0| 0 0| 2 1 | 29 1
CLARKE COUNTY
| 2 1| 50 2| 18 1| 5 1| 75 1 | 0 0| 2 2| 0 0| 2 8| 4 2 | 79 1
CLAY COUNTY
| 0 0| 1 0| 0 0| 0 0| 1 0 | 0 0| 0 0| 0 0| 0 0| 0 0 | 1 0
CLAYTON COUNTY
| 6 3| 57 2| 44 2| 8 2| 115 2 | 0 0| 2 2| 2 3| 0 0| 4 2 | 119 2
CLINCH COUNTY
| 0 0| 1 0| 2 0| 0 0| 3 0 | 0 0| 0 0| 0 0| 0 0| 0 0 | 3 0
COBB COUNTY
| 6 3| 91 3| 67 4| 7 2| 171 3 | 0 0| 5 4| 1 1| 0 0| 6 3 | 177 3
COFFEE COUNTY
| 0 0| 11 0| 4 0| 3 1| 18 0 | 0 0| 1 1| 2 3| 1 4| 4 2 | 22 0
COLQUITT COUNTY
| 6 3| 29 1| 17 1| 1 0| 53 1 | 0 0| 1 1| 0 0| 0 0| 1 0 | 54 1
COLUMBIA COUNTY
| 0 0| 9 0| 7 0| 0 0| 16 0 | 0 0| 1 1| 1 1| 0 0| 2 1 | 18 0
------------------------------------------------------------------------------------------------------------------------------------
(continued)
Page 32 Run 08/21/00
Georgia Department of Corrections Office of Planning and Analysis
Inmate statistical profile
Sample: ACTIVE PRISONERS SERVING LIFE EXCLUDING JAIL
Requestor:
Active inmates 08/21/2000
Home County by current age & sex
Statistics (CONTINUED)
|
MEN
|
WOMEN
|
| Age | Age | Age | Age | Men
| Age | Age | Age | Age |Women
|Grand
Home County
|00-21 %|22-39 %|40-54 %|55-99 %|Total % |00-21 %|22-39 %|40-54 %|55-99 %|Total % |Total %
------------------------------------------------------------------------------------------------------------------------------------
COOK COUNTY
| 0 0| 6 0| 3 0| 1 0| 10 0 | 0 0| 2 2| 0 0| 0 0| 2 1 | 12 0
COWETA COUNTY
| 5 3| 17 1| 10 1| 1 0| 33 1 | 0 0| 2 2| 1 1| 0 0| 3 1 | 36 1
CRAWFORD COUNTY
| 0 0| 1 0| 1 0| 0 0| 2 0 | 0 0| 0 0| 0 0| 0 0| 0 0 | 2 0
CRISP COUNTY
| 3 2| 13 0| 7 0| 1 0| 24 0 | 0 0| 3 3| 0 0| 1 4| 4 2 | 28 1
DADE COUNTY
| 1 1| 4 0| 3 0| 2 1| 10 0 | 0 0| 0 0| 0 0| 0 0| 0 0 | 10 0
DAWSON COUNTY
| 0 0| 2 0| 1 0| 0 0| 3 0 | 0 0| 0 0| 0 0| 0 0| 0 0 | 3 0
DECATUR COUNTY
| 4 2| 13 0| 4 0| 0 0| 21 0 | 0 0| 0 0| 0 0| 0 0| 0 0 | 21 0
DEKALB COUNTY
| 14 7| 214 8| 128 7| 24 7| 380 7 | 1 13| 4 3| 1 1| 2 8| 8 4 | 388 7
DODGE COUNTY
| 0 0| 7 0| 7 0| 0 0| 14 0 | 0 0| 0 0| 0 0| 0 0| 0 0 | 14 0
DOOLY COUNTY
| 2 1| 7 0| 3 0| 0 0| 12 0 | 0 0| 0 0| 0 0| 0 0| 0 0 | 12 0
DOUGHERTY COUNTY | 5 3| 65 2| 41 2| 2 1| 113 2 | 0 0| 5 4| 1 1| 1 4| 7 3 | 120 2
DOUGLAS COUNTY
| 0 0| 22 1| 13 1| 2 1| 37 1 | 0 0| 1 1| 1 1| 0 0| 2 1 | 39 1
EARLY COUNTY
| 0 0| 7 0| 5 0| 1 0| 13 0 | 0 0| 0 0| 0 0| 0 0| 0 0 | 13 0
ECHOLS COUNTY.
| 0 0| 0 0| 0 0| 0 0| 0 0 | 0 0| 0 0| 0 0| 0 0| 0 0 | 0 0
EFFINGHAM COUNTY | 0 0| 4 0| 3 0| 0 0| 7 0 | 0 0| 0 0| 0 0| 0 0| 0 0 | 7 0
ELBERT COUNTY
| 0 0| 11 0| 8 0| 1 0| 20 0 | 0 0| 1 1| 0 0| 0 0| 1 0 | 21 0
EMANUEL COUNTY
| 1 1| 10 0| 5 0| 1 0| 17 0 | 0 0| 0 0| 1 1| 0 0| 1 0 | 18 0
EVANS COUNTY
| 0 0| 8 0| 4 0| 1 0| 13 0 | 0 0| 0 0| 0 0| 0 0| 0 0 | 13 0
FANNIN COUNTY
| 0 0| 5 0| 3 0| 1 0| 9 0 | 0 0| 0 0| 0 0| 0 0| 0 0 | 9 0
FAYETTE COUNTY
| 0 0| 3 0| 3 0| 0 0| 6 0 | 0 0| 0 0| 0 0| 0 0| 0 0 | 6 0
FLOYD COUNTY
| 2 1| 33 1| 21 1| 1 0| 57 1 | 1 13| 3 3| 2 3| 1 4| 7 3 | 64 1
FORSYTH COUNTY
| 0 0| 7 0| 2 0| 2 1| 11 0 | 0 0| 0 0| 1 1| 0 0| 1 0 | 12 0
FRANKLIN COUNTY
| 0 0| 2 0| 4 0| 0 0| 6 0 | 0 0| 0 0| 0 0| 1 4| 1 0 | 7 0
FULTON COUNTY
| 27 14| 505 18| 341 18| 55 15| 928 18 | 1 13| 15 13| 6 9| 4 16| 26 12 | 954 18
GILMER COUNTY
| 0 0| 1 0| 3 0| 1 0| 5 0 | 0 0| 0 0| 0 0| 0 0| 0 0 | 5 0
GLASCOCK COUNTY
| 0 0| 1 0| 0 0| 0 0| 1 0 | 0 0| 0 0| 0 0| 0 0| 0 0 | 1 0
GLYNN COUNTY
| 4 2| 30 1| 26 1| 3 1| 63 1 | 0 0| 1 1| 2 3| 0 0| 3 1 | 66 1
GORDON COUNTY
| 0 0| 23 1| 11 1| 3 1| 37 1 | 0 0| 1 1| 0 0| 0 0| 1 0 | 38 1
GRADY COUNTY
| 1 1| 14 1| 7 0| 0 0| 22 0 | 0 0| 0 0| 0 0| 0 0| 0 0 | 22 0
GREENE COUNTY
| 1 1| 3 0| 3 0| 1 0| 8 0 | 0 0| 0 0| 1 1| 0 0| 1 0 | 9 0
GWINNETT COUNTY
| 3 2| 67 2| 39 2| 9 2| 118 2 | 0 0| 3 3| 2 3| 0 0| 5 2 | 123 2
HABERSHAM COUNTY | 0 0| 9 0| 7 0| 0 0| 16 0 | 0 0| 0 0| 0 0| 0 0| 0 0 | 16 0
HALL COUNTY
| 2 1| 33 1| 33 2| 11 3| 79 2 | 1 13| 2 2| 1 1| 1 4| 5 2 | 84 2
HANCOCK COUNTY
| 0 0| 2 0| 2 0| 1 0| 5 0 | 0 0| 0 0| 1 1| 0 0| 1 0 | 6 0
HARALSON COUNTY
| 0 0| 1 0| 2 0| 1 0| 4 0 | 0 0| 0 0| 0 0| 0 0| 0 0 | 4 0
------------------------------------------------------------------------------------------------------------------------------------
(continued)
Page 33 Run 08/21/00
Georgia Department of Corrections Office of Planning and Analysis
Inmate statistical profile
Sample: ACTIVE PRISONERS SERVING LIFE EXCLUDING JAIL
Requestor:
Active inmates 08/21/2000
Home County by current age & sex
Statistics (CONTINUED)
|
MEN
|
WOMEN
|
| Age | Age | Age | Age | Men
| Age | Age | Age | Age |Women
|Grand
Home County
|00-21 %|22-39 %|40-54 %|55-99 %|Total % |00-21 %|22-39 %|40-54 %|55-99 %|Total % |Total %
------------------------------------------------------------------------------------------------------------------------------------
HARRIS COUNTY
| 1 1| 6 0| 2 0| 0 0| 9 0 | 0 0| 0 0| 0 0| 0 0| 0 0 | 9 0
HART COUNTY
| 0 0| 1 0| 2 0| 0 0| 3 0 | 0 0| 0 0| 1 1| 0 0| 1 0 | 4 0
HEARD COUNTY
| 0 0| 1 0| 1 0| 2 1| 4 0 | 0 0| 0 0| 0 0| 0 0| 0 0 | 4 0
HENRY COUNTY
| 1 1| 19 1| 8 0| 5 1| 33 1 | 0 0| 1 1| 2 3| 0 0| 3 1 | 36 1
HOUSTON COUNTY
| 0 0| 42 2| 22 1| 5 1| 69 1 | 0 0| 3 3| 4 6| 0 0| 7 3 | 76 1
IRWIN COUNTY
| 1 1| 4 0| 3 0| 0 0| 8 0 | 0 0| 0 0| 0 0| 0 0| 0 0 | 8 0
JACKSON COUNTY
| 1 1| 9 0| 10 1| 5 1| 25 0 | 0 0| 0 0| 0 0| 0 0| 0 0 | 25 0
JASPER COUNTY
| 2 1| 8 0| 0 0| 1 0| 11 0 | 0 0| 0 0| 0 0| 0 0| 0 0 | 11 0
JEFF DAVIS COUNTY | 1 1| 5 0| 2 0| 1 0| 9 0 | 0 0| 0 0| 0 0| 0 0| 0 0 | 9 0
JEFFERSON COUNTY | 0 0| 4 0| 2 0| 2 1| 8 0 | 0 0| 1 1| 0 0| 0 0| 1 0 | 9 0
JENKINS COUNTY
| 0 0| 0 0| 6 0| 0 0| 6 0 | 0 0| 0 0| 0 0| 0 0| 0 0 | 6 0
JOHNSON COUNTY
| 0 0| 3 0| 2 0| 0 0| 5 0 | 0 0| 0 0| 0 0| 0 0| 0 0 | 5 0
JONES COUNTY
| 0 0| 0 0| 4 0| 1 0| 5 0 | 0 0| 1 1| 0 0| 0 0| 1 0 | 6 0
LAMAR COUNTY
| 0 0| 9 0| 9 0| 3 1| 21 0 | 0 0| 0 0| 1 1| 0 0| 1 0 | 22 0
LANIER COUNTY
| 0 0| 0 0| 0 0| 0 0| 0 0 | 0 0| 0 0| 0 0| 0 0| 0 0 | 0 0
LAURENS COUNTY
| 1 1| 15 1| 7 0| 2 1| 25 0 | 0 0| 1 1| 1 1| 0 0| 2 1 | 27 0
LEE COUNTY
| 0 0| 3 0| 0 0| 0 0| 3 0 | 0 0| 0 0| 0 0| 0 0| 0 0 | 3 0
LIBERTY COUNTY
| 1 1| 24 1| 8 0| 4 1| 37 1 | 0 0| 2 2| 0 0| 0 0| 2 1 | 39 1
LINCOLN COUNTY
| 1 1| 1 0| 3 0| 0 0| 5 0 | 0 0| 0 0| 0 0| 0 0| 0 0 | 5 0
LONG COUNTY
| 0 0| 5 0| 2 0| 1 0| 8 0 | 0 0| 1 1| 0 0| 0 0| 1 0 | 9 0
LOWNDES COUNTY
| 0 0| 34 1| 21 1| 3 1| 58 1 | 0 0| 0 0| 2 3| 1 4| 3 1 | 61 1
LUMPKIN COUNTY
| 1 1| 5 0| 4 0| 1 0| 11 0 | 0 0| 0 0| 0 0| 0 0| 0 0 | 11 0
MACON COUNTY
| 0 0| 13 0| 4 0| 0 0| 17 0 | 0 0| 0 0| 1 1| 0 0| 1 0 | 18 0
MADISON COUNTY
| 0 0| 6 0| 6 0| 2 1| 14 0 | 0 0| 2 2| 0 0| 0 0| 2 1 | 16 0
MARION COUNTY
| 1 1| 1 0| 1 0| 1 0| 4 0 | 0 0| 0 0| 0 0| 0 0| 0 0 | 4 0
MCDUFFIE COUNTY
| 0 0| 22 1| 10 1| 4 1| 36 1 | 1 13| 1 1| 0 0| 0 0| 2 1 | 38 1
MCINTOSH COUNTY
| 1 1| 4 0| 3 0| 0 0| 8 0 | 0 0| 0 0| 0 0| 0 0| 0 0 | 8 0
MERIWETHER COUNTY | 1 1| 7 0| 7 0| 3 1| 18 0 | 0 0| 1 1| 0 0| 1 4| 2 1 | 20 0
MILLER COUNTY
| 0 0| 3 0| 3 0| 0 0| 6 0 | 0 0| 0 0| 0 0| 0 0| 0 0 | 6 0
MITCHELL COUNTY
| 0 0| 12 0| 10 1| 3 1| 25 0 | 0 0| 1 1| 0 0| 0 0| 1 0 | 26 0
MONROE COUNTY
| 0 0| 11 0| 3 0| 0 0| 14 0 | 0 0| 0 0| 0 0| 0 0| 0 0 | 14 0
MONTGOMERY COUNTY | 0 0| 0 0| 0 0| 0 0| 0 0 | 0 0| 1 1| 0 0| 0 0| 1 0 | 1 0
MORGAN COUNTY
| 0 0| 8 0| 2 0| 0 0| 10 0 | 0 0| 0 0| 0 0| 0 0| 0 0 | 10 0
MURRAY COUNTY
| 2 1| 6 0| 4 0| 4 1| 16 0 | 0 0| 1 1| 0 0| 0 0| 1 0 | 17 0
MUSCOGEE COUNTY
| 5 3| 66 2| 58 3| 9 2| 138 3 | 0 0| 4 3| 2 3| 0 0| 6 3 | 144 3
------------------------------------------------------------------------------------------------------------------------------------
(continued)
Page 34 Run 08/21/00
Georgia Department of Corrections Office of Planning and Analysis
Inmate statistical profile
Sample: ACTIVE PRISONERS SERVING LIFE EXCLUDING JAIL
Requestor:
Active inmates 08/21/2000
Home County by current age & sex
Statistics (CONTINUED)
|
MEN
|
WOMEN
|
| Age | Age | Age | Age | Men
| Age | Age | Age | Age |Women
|Grand
Home County
|00-21 %|22-39 %|40-54 %|55-99 %|Total % |00-21 %|22-39 %|40-54 %|55-99 %|Total % |Total %
------------------------------------------------------------------------------------------------------------------------------------
NEWTON COUNTY
| 2 1| 37 1| 13 1| 2 1| 54 1 | 0 0| 2 2| 0 0| 1 4| 3 1 | 57 1
OCONEE COUNTY
| 0 0| 3 0| 2 0| 0 0| 5 0 | 0 0| 0 0| 1 1| 0 0| 1 0 | 6 0
OGLETHORPE COUNTY | 0 0| 4 0| 0 0| 0 0| 4 0 | 0 0| 0 0| 0 0| 0 0| 0 0 | 4 0
PAULDING COUNTY
| 0 0| 9 0| 5 0| 3 1| 17 0 | 0 0| 0 0| 1 1| 1 4| 2 1 | 19 0
PEACH COUNTY
| 0 0| 7 0| 2 0| 0 0| 9 0 | 0 0| 1 1| 0 0| 0 0| 1 0 | 10 0
PICKENS COUNTY
| 0 0| 3 0| 0 0| 0 0| 3 0 | 0 0| 0 0| 1 1| 0 0| 1 0 | 4 0
PIERCE COUNTY
| 2 1| 2 0| 2 0| 0 0| 6 0 | 0 0| 0 0| 0 0| 0 0| 0 0 | 6 0
PIKE COUNTY
| 0 0| 1 0| 0 0| 0 0| 1 0 | 0 0| 0 0| 0 0| 0 0| 0 0 | 1 0
POLK COUNTY
| 1 1| 12 0| 5 0| 3 1| 21 0 | 0 0| 0 0| 0 0| 0 0| 0 0 | 21 0
PULASKI COUNTY
| 1 1| 3 0| 3 0| 0 0| 7 0 | 0 0| 1 1| 0 0| 0 0| 1 0 | 8 0
PUTNAM COUNTY
| 0 0| 15 1| 13 1| 1 0| 29 1 | 0 0| 0 0| 0 0| 0 0| 0 0 | 29 1
QUITMAN COUNTY
| 0 0| 2 0| 0 0| 0 0| 2 0 | 0 0| 0 0| 0 0| 0 0| 0 0 | 2 0
RABUN COUNTY
| 0 0| 7 0| 1 0| 0 0| 8 0 | 0 0| 0 0| 0 0| 0 0| 0 0 | 8 0
RANDOLPH COUNTY
| 0 0| 3 0| 3 0| 1 0| 7 0 | 0 0| 0 0| 0 0| 0 0| 0 0 | 7 0
RICHMOND COUNTY
| 16 9| 143 5| 66 3| 7 2| 232 4 | 0 0| 8 7| 8 11| 1 4| 17 8 | 249 5
ROCKDALE COUNTY
| 1 1| 10 0| 7 0| 5 1| 23 0 | 0 0| 1 1| 0 0| 0 0| 1 0 | 24 0
SCHLEY COUNTY
| 0 0| 3 0| 1 0| 0 0| 4 0 | 0 0| 0 0| 0 0| 0 0| 0 0 | 4 0
SCREVEN COUNTY
| 0 0| 3 0| 2 0| 2 1| 7 0 | 0 0| 0 0| 0 0| 0 0| 0 0 | 7 0
SEMINOLE COUNTY
| 1 1| 5 0| 5 0| 1 0| 12 0 | 0 0| 1 1| 0 0| 0 0| 1 0 | 13 0
SPALDING COUNTY
| 3 2| 36 1| 21 1| 5 1| 65 1 | 1 13| 1 1| 0 0| 1 4| 3 1 | 68 1
STEPHENS COUNTY
| 0 0| 5 0| 6 0| 4 1| 15 0 | 0 0| 0 0| 0 0| 0 0| 0 0 | 15 0
STEWART COUNTY
| 0 0| 2 0| 2 0| 0 0| 4 0 | 0 0| 0 0| 0 0| 0 0| 0 0 | 4 0
SUMTER COUNTY
| 0 0| 3 0| 15 1| 2 1| 20 0 | 0 0| 0 0| 1 1| 0 0| 1 0 | 21 0
TALBOT COUNTY
| 2 1| 2 0| 1 0| 0 0| 5 0 | 0 0| 0 0| 1 1| 0 0| 1 0 | 6 0
TALIAFERRO COUNTY | 0 0| 0 0| 1 0| 0 0| 1 0 | 0 0| 0 0| 0 0| 0 0| 0 0 | 1 0
TATTNALL COUNTY
| 1 1| 15 1| 4 0| 0 0| 20 0 | 0 0| 0 0| 1 1| 0 0| 1 0 | 21 0
TAYLOR COUNTY
| 1 1| 10 0| 3 0| 1 0| 15 0 | 0 0| 0 0| 0 0| 0 0| 0 0 | 15 0
TELFAIR COUNTY
| 1 1| 6 0| 3 0| 0 0| 10 0 | 0 0| 0 0| 1 1| 0 0| 1 0 | 11 0
TERRELL COUNTY
| 2 1| 11 0| 1 0| 0 0| 14 0 | 0 0| 0 0| 0 0| 0 0| 0 0 | 14 0
THOMAS COUNTY
| 2 1| 15 1| 15 1| 4 1| 36 1 | 0 0| 2 2| 0 0| 0 0| 2 1 | 38 1
TIFT COUNTY
| 3 2| 29 1| 20 1| 4 1| 56 1 | 0 0| 0 0| 0 0| 1 4| 1 0 | 57 1
TOOMBS COUNTY
| 2 1| 14 1| 9 0| 0 0| 25 0 | 0 0| 1 1| 0 0| 0 0| 1 0 | 26 0
TOWNS COUNTY
| 0 0| 0 0| 0 0| 0 0| 0 0 | 0 0| 0 0| 0 0| 0 0| 0 0 | 0 0
TREUTLEN COUNTY
| 0 0| 2 0| 3 0| 0 0| 5 0 | 0 0| 0 0| 0 0| 0 0| 0 0 | 5 0
TROUP COUNTY
| 2 1| 21 1| 18 1| 4 1| 45 1 | 0 0| 1 1| 1 1| 0 0| 2 1 | 47 1
------------------------------------------------------------------------------------------------------------------------------------
(continued)
Page 35 Run 08/21/00
Georgia Department of Corrections Office of Planning and Analysis
Inmate statistical profile
Sample: ACTIVE PRISONERS SERVING LIFE EXCLUDING JAIL
Requestor:
Active inmates 08/21/2000
Home County by current age & sex
Statistics (CONTINUED)
|
MEN
|
WOMEN
|
| Age | Age | Age | Age | Men
| Age | Age | Age | Age |Women
|Grand
Home County
|00-21 %|22-39 %|40-54 %|55-99 %|Total % |00-21 %|22-39 %|40-54 %|55-99 %|Total % |Total %
------------------------------------------------------------------------------------------------------------------------------------
TURNER COUNTY
| 0 0| 7 0| 4 0| 0 0| 11 0 | 0 0| 0 0| 0 0| 0 0| 0 0 | 11 0
TWIGGS COUNTY
| 0 0| 5 0| 4 0| 0 0| 9 0 | 0 0| 0 0| 0 0| 0 0| 0 0 | 9 0
UNION COUNTY
| 0 0| 0 0| 0 0| 0 0| 0 0 | 0 0| 0 0| 0 0| 0 0| 0 0 | 0 0
UPSON COUNTY
| 0 0| 6 0| 5 0| 0 0| 11 0 | 0 0| 0 0| 1 1| 0 0| 1 0 | 12 0
WALKER COUNTY
| 1 1| 15 1| 7 0| 2 1| 25 0 | 0 0| 1 1| 1 1| 0 0| 2 1 | 27 0
WALTON COUNTY
| 2 1| 27 1| 17 1| 3 1| 49 1 | 0 0| 1 1| 0 0| 0 0| 1 0 | 50 1
WARE COUNTY
| 1 1| 15 1| 14 1| 2 1| 32 1 | 0 0| 0 0| 0 0| 0 0| 0 0 | 32 1
WARREN COUNTY
| 0 0| 3 0| 5 0| 1 0| 9 0 | 0 0| 0 0| 0 0| 0 0| 0 0 | 9 0
WASHINGTON COUNTY | 0 0| 13 0| 8 0| 0 0| 21 0 | 0 0| 1 1| 0 0| 0 0| 1 0 | 22 0
WAYNE COUNTY
| 0 0| 7 0| 13 1| 2 1| 22 0 | 0 0| 1 1| 0 0| 0 0| 1 0 | 23 0
WEBSTER COUNTY
| 0 0| 2 0| 0 0| 0 0| 2 0 | 0 0| 0 0| 0 0| 0 0| 0 0 | 2 0
WHEELER COUNTY
| 0 0| 1 0| 3 0| 1 0| 5 0 | 0 0| 0 0| 0 0| 0 0| 0 0 | 5 0
WHITE COUNTY
| 0 0| 3 0| 3 0| 1 0| 7 0 | 0 0| 0 0| 0 0| 0 0| 0 0 | 7 0
WHITFIELD COUNTY | 0 0| 11 0| 25 1| 6 2| 42 1 | 0 0| 2 2| 0 0| 0 0| 2 1 | 44 1
WILCOX COUNTY
| 0 0| 0 0| 6 0| 0 0| 6 0 | 0 0| 0 0| 0 0| 0 0| 0 0 | 6 0
WILKES COUNTY
| 0 0| 2 0| 3 0| 2 1| 7 0 | 0 0| 0 0| 0 0| 0 0| 0 0 | 7 0
WILKINSON COUNTY | 0 0| 7 0| 3 0| 0 0| 10 0 | 0 0| 0 0| 0 0| 0 0| 0 0 | 10 0
WORTH COUNTY
| 3 2| 12 0| 2 0| 0 0| 17 0 | 0 0| 1 1| 0 0| 0 0| 1 0 | 18 0
OUT OF STATE
| 0 2| 12 0| 57 3| 17 5| 86 2 | 0 0| 0 1| 0 0| 0 0| 0 0 | 86 2
------------------------------------------------------------------------------------------------------------------------------------
Total reported
| 187 100| 2764 100| 1892 100| 366 100| 5209 100 | 8 100| 120 100| 70 100| 25 100| 223 100 | 5432 100
|
|
|
|
|
|
|
|
|
|
|
Percent reported |
94.9|
91.0|
92.4|
91.3|
91.6 |
88.9|
93.0|
89.7|
96.2|
92.1 |
91.7
|
|
|
|
|
|
|
|
|
|
|
|
|
|
|
|
|
|
|
|
|
|
UNKNOWN
| 10 | 275 | 155 | 35 | 475
| 1 | 9 | 8 | 1 | 19
| 494
------------------------------------------------------------------------------------------------------------------------------------
Total
| 197 | 3039 | 2047 | 401 | 5684
| 9 | 129 | 78 | 26 | 242
| 5926
Georgia Department of Corrections
Page 36 Run 08/21/00
Office of Planning and Analysis
Inmate statistical profile
Sample: ACTIVE PRISONERS SERVING LIFE EXCLUDING JAIL
Requestor: Statistics
Active inmates 08/21/2000
Prison Sentence In Years by current age & sex
|
MEN
|
WOMEN
|
| Age | Age | Age | Age | Men
| Age | Age | Age | Age |Women
|Grand
Sentence In Years |00-21 %|22-39 %|40-54 %|55-99 %|Total % |00-21 %|22-39 %|40-54 %|55-99 %|Total % |Total %
------------------------------------------------------------------------------------------------------------------------------------
0-1
| 0 0| 0 0| 0 0| 0 0| 0 0 | 0 0| 0 0| 0 0| 0 0| 0 0 | 0 0
1.1-2
| 0 0| 0 0| 0 0| 0 0| 0 0 | 0 0| 0 0| 0 0| 0 0| 0 0 | 0 0
2.1-3
| 0 0| 0 0| 0 0| 0 0| 0 0 | 0 0| 0 0| 0 0| 0 0| 0 0 | 0 0
3.1-4
| 0 0| 0 0| 0 0| 0 0| 0 0 | 0 0| 0 0| 0 0| 0 0| 0 0 | 0 0
4.1-5
| 0 0| 0 0| 0 0| 0 0| 0 0 | 0 0| 0 0| 0 0| 0 0| 0 0 | 0 0
5.1-6
| 0 0| 0 0| 0 0| 0 0| 0 0 | 0 0| 0 0| 0 0| 0 0| 0 0 | 0 0
6.1-7
| 0 0| 0 0| 0 0| 0 0| 0 0 | 0 0| 0 0| 0 0| 0 0| 0 0 | 0 0
7.1-8
| 0 0| 0 0| 0 0| 0 0| 0 0 | 0 0| 0 0| 0 0| 0 0| 0 0 | 0 0
8.1-9
| 0 0| 0 0| 0 0| 0 0| 0 0 | 0 0| 0 0| 0 0| 0 0| 0 0 | 0 0
9.1-10
| 0 0| 0 0| 0 0| 0 0| 0 0 | 0 0| 0 0| 0 0| 0 0| 0 0 | 0 0
10.1-12
| 0 0| 0 0| 0 0| 0 0| 0 0 | 0 0| 0 0| 0 0| 0 0| 0 0 | 0 0
12.1-15
| 0 0| 0 0| 0 0| 0 0| 0 0 | 0 0| 0 0| 0 0| 0 0| 0 0 | 0 0
15.1-20
| 0 0| 0 0| 0 0| 0 0| 0 0 | 0 0| 0 0| 0 0| 0 0| 0 0 | 0 0
20.1-OVER
| 0 0| 0 0| 0 0| 0 0| 0 0 | 0 0| 0 0| 0 0| 0 0| 0 0 | 0 0
LIFE
| 197 100| 3039 100| 2047 100| 401 100| 5684 100 | 9 100| 129 100| 78 100| 26 100| 242 100 | 5926 100
DEATH
| 0 0| 0 0| 0 0| 0 0| 0 0 | 0 0| 0 0| 0 0| 0 0| 0 0 | 0 0
LIFE W/O PAROLE
| 0 0| 0 0| 0 0| 0 0| 0 0 | 0 0| 0 0| 0 0| 0 0| 0 0 | 0 0
YOUTHFUL OFFENDERS | 0 0| 0 0| 0 0| 0 0| 0 0 | 0 0| 0 0| 0 0| 0 0| 0 0 | 0 0
------------------------------------------------------------------------------------------------------------------------------------
Total reported
| 197 100| 3039 100| 2047 100| 401 100| 5684 100 | 9 100| 129 100| 78 100| 26 100| 242 100 | 5926 100
|
|
|
|
|
|
|
|
|
|
|
Percent reported | 100.0| 100.0| 100.0| 100.0| 100.0 | 100.0| 100.0| 100.0| 100.0| 100.0 | 100.0
|
|
|
|
|
|
|
|
|
|
|
|
|
|
|
|
|
|
|
|
|
|
NOT REPORTED
|0|0|0|0|0
|0|0|0|0|0
|0
------------------------------------------------------------------------------------------------------------------------------------
Total
| 197 | 3039 | 2047 | 401 | 5684
| 9 | 129 | 78 | 26 | 242
| 5926
|
|
|
|
|
|
|
|
|
|
|
|
|
|
|
|
|
|
|
|
|
|
|
|
|
|
|
|
|
|
|
|
|
|
|
|
|
|
|
|
|
|
|
|
|
|
|
|
|
|
|
|
|
|
|
AVG EXCLUDING
|
|
|
|
|
|
|
|
|
|
|
LIFE, DEATH, YO
| .00 | .00 | .00 | .00 | .00 | .00 | .00 | .00 | .00 | .00 | .00
|
|
|
|
|
|
|
|
|
|
|
|
|
|
|
|
|
|
|
|
|
|
|
|
|
|
|
|
|
|
|
|
|
|
|
|
|
|
|
|
|
|
|
|
|
|
|
|
|
|
|
|
|
|
|
AVG INCLUDING
|
|
|
|
|
|
|
|
|
|
|
LIFE=21, YO=3 YRS | 21.00 | 21.00 | 21.00 | 21.00 | 21.00 | 21.00 | 21.00 | 21.00 | 21.00 | 21.00 | 21.00
Page 37 Run 08/21/00
Georgia Department of Corrections Office of Planning and Analysis
Inmate statistical profile
Sample: ACTIVE PRISONERS SERVING LIFE EXCLUDING JAIL
Requestor: Statistics
Active inmates 08/21/2000
Probation To Follow Prison by current age & sex
|
MEN
|
WOMEN
|
| Age | Age | Age | Age | Men
| Age | Age | Age | Age |Women
|Grand
Prob After Prison |00-21 %|22-39 %|40-54 %|55-99 %|Total % |00-21 %|22-39 %|40-54 %|55-99 %|Total % |Total %
------------------------------------------------------------------------------------------------------------------------------------
PROBATION TO FOLLOW | 10 5| 91 3| 60 3| 6 1| 167 3 | 0 0| 3 2| 3 4| 1 4| 7 3 | 174 3
NO PROBATION
| 187 95| 2948 97| 1987 97| 395 99| 5517 97 | 9 100| 126 98| 75 96| 25 96| 235 97 | 5752 97
------------------------------------------------------------------------------------------------------------------------------------
Total reported
| 197 100| 3039 100| 2047 100| 401 100| 5684 100 | 9 100| 129 100| 78 100| 26 100| 242 100 | 5926 100
|
|
|
|
|
|
|
|
|
|
|
Percent reported | 100.0| 100.0| 100.0| 100.0| 100.0 | 100.0| 100.0| 100.0| 100.0| 100.0 | 100.0
|
|
|
|
|
|
|
|
|
|
|
|
|
|
|
|
|
|
|
|
|
|
NOT REPORTED
|0|0|0|0|0
|0|0|0|0|0
|0
------------------------------------------------------------------------------------------------------------------------------------
Total
| 197 | 3039 | 2047 | 401 | 5684
| 9 | 129 | 78 | 26 | 242
| 5926
Page 38 Run 08/21/00
Georgia Department of Corrections Office of Planning and Analysis
Inmate statistical profile
Sample: ACTIVE PRISONERS SERVING LIFE EXCLUDING JAIL
Requestor: Statistics
Active inmates 08/21/2000
Admission Type by current age & sex
|
MEN
|
WOMEN
|
| Age | Age | Age | Age | Men
| Age | Age | Age | Age |Women
|Grand
Admission Type
|00-21 %|22-39 %|40-54 %|55-99 %|Total % |00-21 %|22-39 %|40-54 %|55-99 %|Total % |Total %
------------------------------------------------------------------------------------------------------------------------------------
COMMITTED FROM COURT| 195 99| 2452 81| 1497 73| 287 72| 4431 78 | 9 100| 118 91| 66 85| 26 100| 219 90 | 4650 78
RETURN APPEAL/BOND | 0 0| 0 0| 1 0| 0 0| 1 0 | 0 0| 0 0| 0 0| 0 0| 0 0 | 1 0
PAROLE REV/NEW SENT | 0 0| 371 12| 343 17| 71 18| 785 14 | 0 0| 7 5| 7 9| 0 0| 14 6 | 799 13
PAR REV/NO NEW SENT | 0 0| 23 1| 66 3| 8 2| 97 2 | 0 0| 1 1| 1 1| 0 0| 2 1 | 99 2
PROB VIOL/TOTAL REV | 0 0| 0 0| 0 0| 0 0| 0 0 | 0 0| 0 0| 0 0| 0 0| 0 0 | 0 0
PROB VIOL/PARTIAL | 0 0| 39 1| 38 2| 3 1| 80 1 | 0 0| 0 0| 2 3| 0 0| 2 1 | 82 1
ADMIT FM OTHER CUST | 0 0| 1 0| 2 0| 4 1| 7 0 | 0 0| 0 0| 0 0| 0 0| 0 0 | 7 0
SHOCK INCARCERATION | 0 0| 0 0| 0 0| 0 0| 0 0 | 0 0| 0 0| 0 0| 0 0| 0 0 | 0 0
PROB REV/REMAINDER | 1 1| 118 4| 44 2| 7 2| 170 3 | 0 0| 3 2| 2 3| 0 0| 5 2 | 175 3
NEW SENT/PAR REV PND| 0 0| 2 0| 4 0| 1 0| 7 0 | 0 0| 0 0| 0 0| 0 0| 0 0 | 7 0
LIFE W/O PAROLE
| 1 1| 9 0| 4 0| 0 0| 14 0 | 0 0| 0 0| 0 0| 0 0| 0 0 | 14 0
PAROLE REV BOOT CAMP| 0 0| 2 0| 1 0| 0 0| 3 0 | 0 0| 0 0| 0 0| 0 0| 0 0 | 3 0
PAR REV/RSN UNKNOWN | 0 0| 18 1| 39 2| 19 5| 76 1 | 0 0| 0 0| 0 0| 0 0| 0 0 | 76 1
PROBATION/PAROLE REV| 0 0| 0 0| 0 0| 0 0| 0 0 | 0 0| 0 0| 0 0| 0 0| 0 0 | 0 0
PB PAROLE RESCINDED | 0 0| 0 0| 0 0| 0 0| 0 0 | 0 0| 0 0| 0 0| 0 0| 0 0 | 0 0
PROB REVOCATION/SC | 0 0| 0 0| 0 0| 0 0| 0 0 | 0 0| 0 0| 0 0| 0 0| 0 0 | 0 0
PAR REV/REVOC CENTER| 0 0| 3 0| 7 0| 1 0| 11 0 | 0 0| 0 0| 0 0| 0 0| 0 0 | 11 0
INFORMATION ONLY | 0 0| 0 0| 0 0| 0 0| 0 0 | 0 0| 0 0| 0 0| 0 0| 0 0 | 0 0
INCOMPLETE SENT PKG | 0 0| 0 0| 0 0| 0 0| 0 0 | 0 0| 0 0| 0 0| 0 0| 0 0 | 0 0
HANCOCK REVOC CENTER| 0 0| 0 0| 0 0| 0 0| 0 0 | 0 0| 0 0| 0 0| 0 0| 0 0 | 0 0
WHITWORTH DETENTION | 0 0| 0 0| 1 0| 0 0| 1 0 | 0 0| 0 0| 0 0| 0 0| 0 0 | 1 0
DCYS AT RISK
| 0 0| 0 0| 0 0| 0 0| 0 0 | 0 0| 0 0| 0 0| 0 0| 0 0 | 0 0
OTHER
| 0 0| 0 0| 0 0| 0 0| 0 0 | 0 0| 0 0| 0 0| 0 0| 0 0 | 0 0
------------------------------------------------------------------------------------------------------------------------------------
Total reported
| 197 100| 3038 100| 2047 100| 401 100| 5683 100 | 9 100| 129 100| 78 100| 26 100| 242 100 | 5925 100
|
|
|
|
|
|
|
|
|
|
|
Percent reported | 100.0| 100.0| 100.0| 100.0| 100.0 | 100.0| 100.0| 100.0| 100.0| 100.0 | 100.0
|
|
|
|
|
|
|
|
|
|
|
|
|
|
|
|
|
|
|
|
|
|
UNKNOWN
|0|1|0|0|1
|0|0|0|0|0
|1
------------------------------------------------------------------------------------------------------------------------------------
Total
| 197 | 3039 | 2047 | 401 | 5684
| 9 | 129 | 78 | 26 | 242
| 5926
Page 39 Run 08/21/00
Georgia Department of Corrections Office of Planning and Analysis
Inmate statistical profile
Sample: ACTIVE PRISONERS SERVING LIFE EXCLUDING JAIL
Requestor: Statistics
Active inmates 08/21/2000
Release Type by current age & sex
|
MEN
|
WOMEN
|
| Age | Age | Age | Age | Men
| Age | Age | Age | Age |Women
|Grand
Release Type
|00-21 %|22-39 %|40-54 %|55-99 %|Total % |00-21 %|22-39 %|40-54 %|55-99 %|Total % |Total %
------------------------------------------------------------------------------------------------------------------------------------
PAROLE
| 0 0| 1 0| 0 0| 0 0| 1 0 | 0 0| 0 0| 0 0| 0 0| 0 0 | 1 0
Active
| 197 100| 3039 100| 2047 100| 401 100| 5684 100 | 9 100| 129 100| 78 100| 26 100| 242 100 | 5926 100
------------------------------------------------------------------------------------------------------------------------------------
Total
| 197 | 3039 | 2047 | 401 | 5684
| 9 | 129 | 78 | 26 | 242
| 5926
Page 40 Run 08/21/00
Georgia Department of Corrections Office of Planning and Analysis
Inmate statistical profile
Sample: ACTIVE PRISONERS SERVING LIFE EXCLUDING JAIL
Requestor: Statistics
Active inmates 08/21/2000
Inst By Group by current age & sex
|
MEN
|
WOMEN
|
| Age | Age | Age | Age | Men
| Age | Age | Age | Age |Women
|Grand
Inst By Group
|00-21 %|22-39 %|40-54 %|55-99 %|Total % |00-21 %|22-39 %|40-54 %|55-99 %|Total % |Total %
------------------------------------------------------------------------------------------------------------------------------------
County jails
| 0 0| 0 0| 0 0| 0 0| 0 0 | 0 0| 0 0| 0 0| 0 0| 0 0 | 0 0
Transitional centers| 0 0| 18 1| 25 1| 6 1| 49 1 | 0 0| 0 0| 0 0| 1 4| 1 0 | 50 1
County camps
| 0 0| 13 0| 9 0| 4 1| 26 0 | 0 0| 0 0| 0 0| 0 0| 0 0 | 26 0
Inmate boot camps | 0 0| 0 0| 0 0| 0 0| 0 0 | 0 0| 0 0| 0 0| 0 0| 0 0 | 0 0
State prisons
| 197 100| 2909 96| 1954 95| 380 95| 5440 96 | 9 100| 129 100| 78 100| 25 96| 241 100 | 5681 96
Private prisons
| 0 0| 99 3| 59 3| 11 3| 169 3 | 0 0| 0 0| 0 0| 0 0| 0 0 | 169 3
Other
| 0 0| 0 0| 0 0| 0 0| 0 0 | 0 0| 0 0| 0 0| 0 0| 0 0 | 0 0
------------------------------------------------------------------------------------------------------------------------------------
Total reported
| 197 100| 3039 100| 2047 100| 401 100| 5684 100 | 9 100| 129 100| 78 100| 26 100| 242 100 | 5926 100
|
|
|
|
|
|
|
|
|
|
|
Percent reported | 100.0| 100.0| 100.0| 100.0| 100.0 | 100.0| 100.0| 100.0| 100.0| 100.0 | 100.0
|
|
|
|
|
|
|
|
|
|
|
|
|
|
|
|
|
|
|
|
|
|
Not reported
|0|0|0|0|0
|0|0|0|0|0
|0
------------------------------------------------------------------------------------------------------------------------------------
Total
| 197 | 3039 | 2047 | 401 | 5684
| 9 | 129 | 78 | 26 | 242
| 5926
Page 41 Run 08/21/00
Georgia Department of Corrections Office of Planning and Analysis
Inmate statistical profile
Sample: ACTIVE PRISONERS SERVING LIFE EXCLUDING JAIL
Requestor: Statistics
Active inmates 08/21/2000
Institution by current age & sex
|
MEN
|
WOMEN
|
| Age | Age | Age | Age | Men
| Age | Age | Age | Age |Women
|Grand
Institution
|00-21 %|22-39 %|40-54 %|55-99 %|Total % |00-21 %|22-39 %|40-54 %|55-99 %|Total % |Total %
------------------------------------------------------------------------------------------------------------------------------------
Albany Trans Ctr | 0 0| 0 0| 2 0| 0 0| 2 0 | 0 0| 0 0| 0 0| 0 0| 0 0 | 2 0
Atlanta Trans Ctr(M)| 0 0| 12 0| 15 1| 5 1| 32 1 | 0 0| 0 0| 0 0| 0 0| 0 0 | 32 1
Macon Trans Ctr
| 0 0| 3 0| 4 0| 0 0| 7 0 | 0 0| 0 0| 0 0| 0 0| 0 0 | 7 0
Metro Trans Ctr (W) | 0 0| 0 0| 0 0| 0 0| 0 0 | 0 0| 0 0| 0 0| 1 4| 1 0 | 1 0
Savannah Trans Ctr | 0 0| 3 0| 4 0| 1 0| 8 0 | 0 0| 0 0| 0 0| 0 0| 0 0 | 8 0
Carroll County
| 0 0| 0 0| 0 0| 1 0| 1 0 | 0 0| 0 0| 0 0| 0 0| 0 0 | 1 0
Clarke County
| 0 0| 1 0| 0 0| 0 0| 1 0 | 0 0| 0 0| 0 0| 0 0| 0 0 | 1 0
Colquitt County
| 0 0| 0 0| 1 0| 0 0| 1 0 | 0 0| 0 0| 0 0| 0 0| 0 0 | 1 0
Coweta County
| 0 0| 3 0| 1 0| 0 0| 4 0 | 0 0| 0 0| 0 0| 0 0| 0 0 | 4 0
Floyd County
| 0 0| 0 0| 1 0| 0 0| 1 0 | 0 0| 0 0| 0 0| 0 0| 0 0 | 1 0
Hall County
| 0 0| 2 0| 2 0| 0 0| 4 0 | 0 0| 0 0| 0 0| 0 0| 0 0 | 4 0
Jackson County
| 0 0| 1 0| 2 0| 1 0| 4 0 | 0 0| 0 0| 0 0| 0 0| 0 0 | 4 0
Jefferson County | 0 0| 2 0| 1 0| 0 0| 3 0 | 0 0| 0 0| 0 0| 0 0| 0 0 | 3 0
Mitchell County
| 0 0| 0 0| 1 0| 0 0| 1 0 | 0 0| 0 0| 0 0| 0 0| 0 0 | 1 0
Screven County
| 0 0| 1 0| 0 0| 0 0| 1 0 | 0 0| 0 0| 0 0| 0 0| 0 0 | 1 0
Stewart County
| 0 0| 0 0| 0 0| 1 0| 1 0 | 0 0| 0 0| 0 0| 0 0| 0 0 | 1 0
Terrell County
| 0 0| 0 0| 0 0| 1 0| 1 0 | 0 0| 0 0| 0 0| 0 0| 0 0 | 1 0
Clayton County
| 0 0| 3 0| 0 0| 0 0| 3 0 | 0 0| 0 0| 0 0| 0 0| 0 0 | 3 0
Ware Prison
| 14 7| 214 7| 103 5| 10 2| 341 6 | 0 0| 0 0| 0 0| 0 0| 0 0 | 341 6
Lowndes Prison
| 0 0| 5 0| 8 0| 1 0| 14 0 | 0 0| 0 0| 0 0| 0 0| 0 0 | 14 0
Dodge Prison
| 0 0| 55 2| 64 3| 5 1| 124 2 | 0 0| 0 0| 0 0| 0 0| 0 0 | 124 2
Phillips Prison
| 7 4| 129 4| 87 4| 21 5| 244 4 | 0 0| 0 0| 0 0| 0 0| 0 0 | 244 4
Walker Prison
| 0 0| 23 1| 28 1| 4 1| 55 1 | 0 0| 0 0| 0 0| 0 0| 0 0 | 55 1
Wayne Prison
| 0 0| 3 0| 4 0| 0 0| 7 0 | 0 0| 0 0| 0 0| 0 0| 0 0 | 7 0
Arrendale Prison | 52 26| 101 3| 22 1| 1 0| 176 3 | 0 0| 0 0| 0 0| 0 0| 0 0 | 176 3
Montgomery Prison | 0 0| 15 0| 15 1| 3 1| 33 1 | 0 0| 0 0| 0 0| 0 0| 0 0 | 33 1
Lee Prison
| 1 1| 24 1| 16 1| 1 0| 42 1 | 0 0| 0 0| 0 0| 0 0| 0 0 | 42 1
Putnam Prison
| 0 0| 6 0| 0 0| 0 0| 6 0 | 0 0| 0 0| 0 0| 0 0| 0 0 | 6 0
Georgia State Prison| 6 3| 282 9| 208 10| 16 4| 512 9 | 0 0| 0 0| 0 0| 0 0| 0 0 | 512 9
Mens Prison
| 0 0| 14 0| 33 2| 76 19| 123 2 | 0 0| 0 0| 0 0| 0 0| 0 0 | 123 2
Jackson Prison-Diag | 7 4| 24 1| 4 0| 2 0| 37 1 | 0 0| 0 0| 0 0| 0 0| 0 0 | 37 1
Jackson Prison-Perm | 0 0| 3 0| 1 0| 0 0| 4 0 | 0 0| 0 0| 0 0| 0 0| 0 0 | 4 0
Coastal Prison
| 6 3| 36 1| 16 1| 1 0| 59 1 | 0 0| 0 0| 0 0| 0 0| 0 0 | 59 1
Scott Prison
| 0 0| 68 2| 49 2| 11 3| 128 2 | 0 0| 0 0| 0 0| 0 0| 0 0 | 128 2
Rivers Prison
| 0 0| 71 2| 67 3| 8 2| 146 3 | 0 0| 0 0| 0 0| 0 0| 0 0 | 146 2
Rutledge Prison
| 0 0| 45 1| 63 3| 19 5| 127 2 | 0 0| 0 0| 0 0| 0 0| 0 0 | 127 2
------------------------------------------------------------------------------------------------------------------------------------
(continued)
Page 42 Run 08/21/00
Georgia Department of Corrections Office of Planning and Analysis
Inmate statistical profile
Sample: ACTIVE PRISONERS SERVING LIFE EXCLUDING JAIL
Requestor:
Active inmates 08/21/2000
Institution by current age & sex
Statistics (CONTINUED)
|
MEN
|
WOMEN
|
| Age | Age | Age | Age | Men
| Age | Age | Age | Age |Women
|Grand
Institution
|00-21 %|22-39 %|40-54 %|55-99 %|Total % |00-21 %|22-39 %|40-54 %|55-99 %|Total % |Total %
------------------------------------------------------------------------------------------------------------------------------------
Central Prison
| 0 0| 91 3| 113 6| 19 5| 223 4 | 0 0| 0 0| 0 0| 0 0| 0 0 | 223 4
Augusta Med Prison | 3 2| 74 2| 75 4| 22 5| 174 3 | 0 0| 0 0| 0 0| 0 0| 0 0 | 174 3
Rogers Prison
| 0 0| 28 1| 20 1| 0 0| 48 1 | 0 0| 0 0| 0 0| 0 0| 0 0 | 48 1
Burruss Prison
| 0 0| 5 0| 10 0| 2 0| 17 0 | 0 0| 0 0| 0 0| 0 0| 0 0 | 17 0
Bostick Prison
| 0 0| 10 0| 27 1| 28 7| 65 1 | 0 0| 0 0| 0 0| 0 0| 0 0 | 65 1
Valdosta Prison
| 7 4| 158 5| 99 5| 14 3| 278 5 | 0 0| 0 0| 0 0| 0 0| 0 0 | 278 5
Hays Prison
| 8 4| 164 5| 110 5| 16 4| 298 5 | 0 0| 0 0| 0 0| 0 0| 0 0 | 298 5
Hancock Prison
| 7 4| 222 7| 108 5| 18 4| 355 6 | 0 0| 0 0| 0 0| 0 0| 0 0 | 355 6
Telfair Prison
| 14 7| 202 7| 100 5| 11 3| 327 6 | 0 0| 0 0| 0 0| 0 0| 0 0 | 327 6
Autry Prison
| 9 5| 148 5| 97 5| 18 4| 272 5 | 0 0| 0 0| 0 0| 0 0| 0 0 | 272 5
Wilcox Prison
| 0 0| 69 2| 73 4| 6 1| 148 3 | 0 0| 0 0| 0 0| 0 0| 0 0 | 148 2
Calhoun Prison
| 10 5| 77 3| 56 3| 5 1| 148 3 | 0 0| 0 0| 0 0| 0 0| 0 0 | 148 2
Dooly Prison
| 0 0| 59 2| 76 4| 7 2| 142 2 | 0 0| 0 0| 0 0| 0 0| 0 0 | 142 2
Macon Prison
| 24 12| 266 9| 95 5| 21 5| 406 7 | 0 0| 0 0| 0 0| 0 0| 0 0 | 406 7
Smith Prison
| 17 9| 193 6| 78 4| 10 2| 298 5 | 0 0| 0 0| 0 0| 0 0| 0 0 | 298 5
Homerville Prison | 0 0| 1 0| 2 0| 0 0| 3 0 | 0 0| 0 0| 0 0| 0 0| 0 0 | 3 0
Washingtn Women Pris| 0 0| 0 0| 0 0| 0 0| 0 0 | 2 22| 36 28| 23 29| 8 31| 69 29 | 69 1
Baldwin Prison
| 5 3| 19 1| 19 1| 4 1| 47 1 | 0 0| 0 0| 0 0| 0 0| 0 0 | 47 1
Metro Womens Prison | 0 0| 0 0| 0 0| 0 0| 0 0 | 3 33| 29 22| 26 33| 8 31| 66 27 | 66 1
Pulaski Womens Pris | 0 0| 0 0| 0 0| 0 0| 0 0 | 4 44| 64 50| 29 37| 9 35| 106 44 | 106 2
Pelham PreTrans Unit| 0 0| 2 0| 6 0| 0 0| 8 0 | 0 0| 0 0| 0 0| 0 0| 0 0 | 8 0
Milan Prison
| 0 0| 0 0| 1 0| 0 0| 1 0 | 0 0| 0 0| 0 0| 0 0| 0 0 | 1 0
West Central Prison | 0 0| 3 0| 1 0| 0 0| 4 0 | 0 0| 0 0| 0 0| 0 0| 0 0 | 4 0
D Ray James Prison | 0 0| 36 1| 20 1| 3 1| 59 1 | 0 0| 0 0| 0 0| 0 0| 0 0 | 59 1
Coffee Corr Facility| 0 0| 31 1| 20 1| 4 1| 55 1 | 0 0| 0 0| 0 0| 0 0| 0 0 | 55 1
Wheeler Corr Facilty| 0 0| 32 1| 19 1| 4 1| 55 1 | 0 0| 0 0| 0 0| 0 0| 0 0 | 55 1
------------------------------------------------------------------------------------------------------------------------------------
Total reported
| 197 100| 3039 100| 2047 100| 401 100| 5684 100 | 9 100| 129 100| 78 100| 26 100| 242 100 | 5926 100
|
|
|
|
|
|
|
|
|
|
|
Percent reported | 100.0| 100.0| 100.0| 100.0| 100.0 | 100.0| 100.0| 100.0| 100.0| 100.0 | 100.0
|
|
|
|
|
|
|
|
|
|
|
|
|
|
|
|
|
|
|
|
|
|
Not Reported
|0|0|0|0|0
|0|0|0|0|0
|0
------------------------------------------------------------------------------------------------------------------------------------
Total
| 197 | 3039 | 2047 | 401 | 5684
| 9 | 129 | 78 | 26 | 242
| 5926
Page 43 Run 08/21/00
Georgia Department of Corrections Office of Planning and Analysis
Inmate statistical profile
Sample: ACTIVE PRISONERS SERVING LIFE EXCLUDING JAIL
Requestor: Statistics
Active inmates 08/21/2000
Misdemeanors And Felonies by current age & sex
|
MEN
|
WOMEN
|
| Age | Age | Age | Age | Men
| Age | Age | Age | Age |Women
|Grand
Crime Type
|00-21 %|22-39 %|40-54 %|55-99 %|Total % |00-21 %|22-39 %|40-54 %|55-99 %|Total % |Total %
------------------------------------------------------------------------------------------------------------------------------------
MISDEMEANOR
| 0 0| 0 0| 0 0| 0 0| 0 0 | 0 0| 0 0| 0 0| 0 0| 0 0 | 0 0
FELONY
| 197 100| 3039 100| 2047 100| 401 100| 5684 100 | 9 100| 129 100| 78 100| 26 100| 242 100 | 5926 100
------------------------------------------------------------------------------------------------------------------------------------
Total reported
| 197 100| 3039 100| 2047 100| 401 100| 5684 100 | 9 100| 129 100| 78 100| 26 100| 242 100 | 5926 100
|
|
|
|
|
|
|
|
|
|
|
Percent reported | 100.0| 100.0| 100.0| 100.0| 100.0 | 100.0| 100.0| 100.0| 100.0| 100.0 | 100.0
|
|
|
|
|
|
|
|
|
|
|
|
|
|
|
|
|
|
|
|
|
|
NOT REPORTED
|0|0|0|0|0
|0|0|0|0|0
|0
------------------------------------------------------------------------------------------------------------------------------------
Total
| 197 | 3039 | 2047 | 401 | 5684
| 9 | 129 | 78 | 26 | 242
| 5926
Page 44 Run 08/21/00
Georgia Department of Corrections Office of Planning and Analysis
Inmate statistical profile
Sample: ACTIVE PRISONERS SERVING LIFE EXCLUDING JAIL
Requestor: Statistics
Active inmates 08/21/2000
Crimes By Group by current age & sex
|
MEN
|
WOMEN
|
| Age | Age | Age | Age | Men
| Age | Age | Age | Age |Women
|Grand
Crimes By Group
|00-21 %|22-39 %|40-54 %|55-99 %|Total % |00-21 %|22-39 %|40-54 %|55-99 %|Total % |Total %
------------------------------------------------------------------------------------------------------------------------------------
HOMICIDE
| 151 77| 1873 62| 1210 59| 300 75| 3534 62 | 9 100| 113 88| 61 78| 25 96| 208 86 | 3742 63
ABORTION
| 0 0| 0 0| 0 0| 0 0| 0 0 | 0 0| 0 0| 0 0| 0 0| 0 0 | 0 0
BODILY INJRY&REL OFF| 15 8| 183 6| 94 5| 5 1| 297 5 | 0 0| 2 2| 5 6| 0 0| 7 3 | 304 5
ARSON & REL OFF
| 0 0| 1 0| 0 0| 0 0| 1 0 | 0 0| 0 0| 0 0| 0 0| 0 0 | 1 0
DAMAGE OF PROPERTY | 0 0| 1 0| 0 0| 0 0| 1 0 | 0 0| 0 0| 0 0| 0 0| 0 0 | 1 0
BURGLARY & REL OFF | 0 0| 20 1| 6 0| 0 0| 26 0 | 0 0| 0 0| 1 1| 0 0| 1 0 | 27 0
FORGERY & REL OFF | 0 0| 7 0| 4 0| 1 0| 12 0 | 0 0| 0 0| 0 0| 0 0| 0 0 | 12 0
THEFT
| 0 0| 7 0| 5 0| 0 0| 12 0 | 0 0| 0 0| 0 0| 0 0| 0 0 | 12 0
ROBBERY
| 21 11| 354 12| 237 12| 28 7| 640 11 | 0 0| 2 2| 1 1| 0 0| 3 1 | 643 11
SEXUAL OFFENSES
| 9 5| 345 11| 344 17| 53 13| 751 13 | 0 0| 0 0| 2 3| 0 0| 2 1 | 753 13
OBSCENITY CRIMES | 0 0| 0 0| 0 0| 0 0| 0 0 | 0 0| 0 0| 0 0| 0 0| 0 0 | 0 0
TREASON & REL OFF | 0 0| 0 0| 0 0| 0 0| 0 0 | 0 0| 0 0| 0 0| 0 0| 0 0 | 0 0
CRIMES INVOLVNG GOVT| 0 0| 7 0| 5 0| 1 0| 13 0 | 0 0| 0 0| 0 0| 0 0| 0 0 | 13 0
FALSIFICATIONS
| 0 0| 0 0| 0 0| 0 0| 0 0 | 0 0| 0 0| 0 0| 0 0| 0 0 | 0 0
OBSTRUCT LAW ENFORCE| 0 0| 1 0| 1 0| 0 0| 2 0 | 0 0| 0 0| 0 0| 0 0| 0 0 | 2 0
DISORDERLY CONDUCT | 0 0| 0 0| 0 0| 0 0| 0 0 | 0 0| 0 0| 0 0| 0 0| 0 0 | 0 0
GAMBLING & REL OFF | 0 0| 0 0| 0 0| 0 0| 0 0 | 0 0| 0 0| 0 0| 0 0| 0 0 | 0 0
CRUELTY TO CHILDREN | 0 0| 0 0| 0 0| 0 0| 0 0 | 0 0| 0 0| 0 0| 0 0| 0 0 | 0 0
CRIMES WITH GUNS | 0 0| 0 0| 1 0| 0 0| 1 0 | 0 0| 0 0| 0 0| 0 0| 0 0 | 1 0
INVASION PRIVACY | 0 0| 0 0| 0 0| 0 0| 0 0 | 0 0| 0 0| 0 0| 0 0| 0 0 | 0 0
RACKETEERING
| 0 0| 0 0| 0 0| 0 0| 0 0 | 0 0| 0 0| 0 0| 0 0| 0 0 | 0 0
DRUG ABUSE OFFENSES | 1 1| 220 7| 132 6| 11 3| 364 6 | 0 0| 12 9| 8 10| 1 4| 21 9 | 385 6
DRUG TRAFFICKING | 0 0| 18 1| 8 0| 1 0| 27 0 | 0 0| 0 0| 0 0| 0 0| 0 0 | 27 0
AUTO CRIMES
| 0 0| 0 0| 0 0| 0 0| 0 0 | 0 0| 0 0| 0 0| 0 0| 0 0 | 0 0
REVENUE & CONTRABAND| 0 0| 0 0| 0 0| 0 0| 0 0 | 0 0| 0 0| 0 0| 0 0| 0 0 | 0 0
CRIMES OF OTH STATES| 0 0| 0 0| 0 0| 0 0| 0 0 | 0 0| 0 0| 0 0| 0 0| 0 0 | 0 0
MISC. FELONIES
| 0 0| 1 0| 0 0| 1 0| 2 0 | 0 0| 0 0| 0 0| 0 0| 0 0 | 2 0
MISDEMEANORS
| 0 0| 0 0| 0 0| 0 0| 0 0 | 0 0| 0 0| 0 0| 0 0| 0 0 | 0 0
------------------------------------------------------------------------------------------------------------------------------------
Total reported
| 197 100| 3038 100| 2047 100| 401 100| 5683 100 | 9 100| 129 100| 78 100| 26 100| 242 100 | 5925 100
|
|
|
|
|
|
|
|
|
|
|
Percent reported | 100.0| 100.0| 100.0| 100.0| 100.0 | 100.0| 100.0| 100.0| 100.0| 100.0 | 100.0
|
|
|
|
|
|
|
|
|
|
|
|
|
|
|
|
|
|
|
|
|
|
NOT REPORTED
|0|1|0|0|1
|0|0|0|0|0
|1
------------------------------------------------------------------------------------------------------------------------------------
Total
| 197 | 3039 | 2047 | 401 | 5684
| 9 | 129 | 78 | 26 | 242
| 5926
Page 45 Run 08/21/00
Georgia Department of Corrections Office of Planning and Analysis
Inmate statistical profile
Sample: ACTIVE PRISONERS SERVING LIFE EXCLUDING JAIL
Requestor: Statistics
Active inmates 08/21/2000
Most Serious Offense by current age & sex
|
MEN
|
WOMEN
|
| Age | Age | Age | Age | Men
| Age | Age | Age | Age |Women
|Grand
Most Serious Offense|00-21 %|22-39 %|40-54 %|55-99 %|Total % |00-21 %|22-39 %|40-54 %|55-99 %|Total % |Total %
------------------------------------------------------------------------------------------------------------------------------------
Misdemeanors
|
|
|
------------------------------------------------------------------------------------------------------------------------------------
------------------------------------------------------------------------------------------------------------------------------------
------------------------------------------------------------------------------------------------------------------------------------
FELONIES
|
|
|
------------------------------------------------------------------------------------------------------------------------------------
------------------------------------------------------------------------------------------------------------------------------------
MISC. HOMICIDE OFFEN| 0 0| 1 0| 0 0| 0 0| 1 0 | 0 0| 0 0| 0 0| 0 0| 0 0 | 1 0
MURDER
| 151 77| 1872 62| 1210 59| 299 75| 3532 62 | 9 100| 113 88| 61 78| 25 96| 208 86 | 3740 63
VOLUNTARY MANSLAUGHT| 0 0| 1 0| 0 0| 1 0| 2 0 | 0 0| 0 0| 0 0| 0 0| 0 0 | 2 0
AGGRAVATED ASSAULT | 0 0| 9 0| 0 0| 0 0| 9 0 | 0 0| 0 0| 0 0| 0 0| 0 0 | 9 0
AGGRAVATED BATTERY | 0 0| 1 0| 0 0| 0 0| 1 0 | 0 0| 0 0| 0 0| 0 0| 0 0 | 1 0
KIDNAPPING
| 15 8| 173 6| 92 4| 5 1| 285 5 | 0 0| 2 2| 5 6| 0 0| 7 3 | 292 5
AGG ASSLT ON POLICE | 0 0| 0 0| 2 0| 0 0| 2 0 | 0 0| 0 0| 0 0| 0 0| 0 0 | 2 0
SECOND DEGREE ARSON | 0 0| 1 0| 0 0| 0 0| 1 0 | 0 0| 0 0| 0 0| 0 0| 0 0 | 1 0
CRIM. DAMAGE 2ND DEG| 0 0| 1 0| 0 0| 0 0| 1 0 | 0 0| 0 0| 0 0| 0 0| 0 0 | 1 0
BURGLARY
| 0 0| 20 1| 6 0| 0 0| 26 0 | 0 0| 0 0| 1 1| 0 0| 1 0 | 27 0
FORGERY 1ST DEGREE | 0 0| 7 0| 4 0| 1 0| 12 0 | 0 0| 0 0| 0 0| 0 0| 0 0 | 12 0
THEFT BY TAKING
| 0 0| 2 0| 3 0| 0 0| 5 0 | 0 0| 0 0| 0 0| 0 0| 0 0 | 5 0
THEFT BY REC STOLEN | 0 0| 3 0| 1 0| 0 0| 4 0 | 0 0| 0 0| 0 0| 0 0| 0 0 | 4 0
THEFT BY CONVERSION | 0 0| 1 0| 1 0| 0 0| 2 0 | 0 0| 0 0| 0 0| 0 0| 0 0 | 2 0
THEFT OF MOTOR VEH, | 0 0| 1 0| 0 0| 0 0| 1 0 | 0 0| 0 0| 0 0| 0 0| 0 0 | 1 0
ROBBERY
| 0 0| 5 0| 6 0| 4 1| 15 0 | 0 0| 0 0| 0 0| 0 0| 0 0 | 15 0
ARMED ROBBERY
| 21 11| 349 11| 231 11| 24 6| 625 11 | 0 0| 2 2| 1 1| 0 0| 3 1 | 628 11
MISC. SEXUAL
| 0 0| 1 0| 0 0| 0 0| 1 0 | 0 0| 0 0| 0 0| 0 0| 0 0 | 1 0
RAPE
| 9 5| 321 11| 309 15| 42 10| 681 12 | 0 0| 0 0| 2 3| 0 0| 2 1 | 683 12
AGGRAVATED SODOMY | 0 0| 17 1| 22 1| 8 2| 47 1 | 0 0| 0 0| 0 0| 0 0| 0 0 | 47 1
CHILD MOLESTATION | 0 0| 1 0| 3 0| 1 0| 5 0 | 0 0| 0 0| 0 0| 0 0| 0 0 | 5 0
AGGRAV. CHILD MOLEST| 0 0| 5 0| 10 0| 2 0| 17 0 | 0 0| 0 0| 0 0| 0 0| 0 0 | 17 0
OBSTR OF LAW ENF OFF| 0 0| 7 0| 5 0| 1 0| 13 0 | 0 0| 0 0| 0 0| 0 0| 0 0 | 13 0
ESCAPE
| 0 0| 1 0| 1 0| 0 0| 2 0 | 0 0| 0 0| 0 0| 0 0| 0 0 | 2 0
POSS OF CERTAIN WEAP| 0 0| 0 0| 1 0| 0 0| 1 0 | 0 0| 0 0| 0 0| 0 0| 0 0 | 1 0
S/D NARCOTICS, OPIAT| 0 0| 13 0| 13 1| 1 0| 27 0 | 0 0| 1 1| 1 1| 0 0| 2 1 | 29 0
S/D DEP,STIM,CNTRF D| 0 0| 4 0| 2 0| 0 0| 6 0 | 0 0| 0 0| 0 0| 0 0| 0 0 | 6 0
SALE/DIST OF MARIJUA| 0 0| 6 0| 5 0| 1 0| 12 0 | 0 0| 0 0| 0 0| 0 0| 0 0 | 12 0
POSS NARCOTICS, OPIA| 0 0| 5 0| 2 0| 0 0| 7 0 | 0 0| 0 0| 0 0| 1 4| 1 0 | 8 0
------------------------------------------------------------------------------------------------------------------------------------
(continued)
Page 46 Run 08/21/00
Georgia Department of Corrections Office of Planning and Analysis
Inmate statistical profile
Sample: ACTIVE PRISONERS SERVING LIFE EXCLUDING JAIL
Requestor:
Active inmates 08/21/2000
Most Serious Offense by current age & sex
Statistics (CONTINUED)
|
MEN
|
WOMEN
|
| Age | Age | Age | Age | Men
| Age | Age | Age | Age |Women
|Grand
Most Serious Offense|00-21 %|22-39 %|40-54 %|55-99 %|Total % |00-21 %|22-39 %|40-54 %|55-99 %|Total % |Total %
------------------------------------------------------------------------------------------------------------------------------------
POSS DEP,STIM,CNTRF | 0 0| 0 0| 1 0| 0 0| 1 0 | 0 0| 0 0| 0 0| 0 0| 0 0 | 1 0
VIOLATE GA CNTRL SBS| 0 0| 14 0| 7 0| 0 0| 21 0 | 0 0| 1 1| 1 1| 0 0| 2 1 | 23 0
UNLWFL MFG/DEL/DIST | 0 0| 7 0| 1 0| 0 0| 8 0 | 0 0| 0 0| 0 0| 0 0| 0 0 | 8 0
SALE/DIST CONT SUB P| 0 0| 2 0| 1 0| 0 0| 3 0 | 0 0| 0 0| 0 0| 0 0| 0 0 | 3 0
SALE/DIST CONT SUB S| 0 0| 1 0| 0 0| 0 0| 1 0 | 0 0| 0 0| 0 0| 0 0| 0 0 | 1 0
SALE/DISTRIBUTION CO| 1 1| 143 5| 84 4| 6 1| 234 4 | 0 0| 10 8| 6 8| 0 0| 16 7 | 250 4
POSSESSION OF COCAIN| 0 0| 25 1| 16 1| 3 1| 44 1 | 0 0| 0 0| 0 0| 0 0| 0 0 | 44 1
COCAINE LESS 200 GRA| 0 0| 12 0| 7 0| 1 0| 20 0 | 0 0| 0 0| 0 0| 0 0| 0 0 | 20 0
COCAINE 401 OR MORE | 0 0| 5 0| 0 0| 0 0| 5 0 | 0 0| 0 0| 0 0| 0 0| 0 0 | 5 0
NARCOTICS LESS 14 GR| 0 0| 0 0| 1 0| 0 0| 1 0 | 0 0| 0 0| 0 0| 0 0| 0 0 | 1 0
ATT/CONSPRCY COMMT C| 0 0| 1 0| 0 0| 0 0| 1 0 | 0 0| 0 0| 0 0| 0 0| 0 0 | 1 0
CONSPIRACY
| 0 0| 1 0| 0 0| 0 0| 1 0 | 0 0| 0 0| 0 0| 0 0| 0 0 | 1 0
CRIMINAL ATTEMPT | 0 0| 0 0| 0 0| 1 0| 1 0 | 0 0| 0 0| 0 0| 0 0| 0 0 | 1 0
------------------------------------------------------------------------------------------------------------------------------------
Total reported
| 197 100| 3039 100| 2047 100| 401 100| 5684 100 | 9 100| 129 100| 78 100| 26 100| 242 100 | 5926 100
|
|
|
|
|
|
|
|
|
|
|
Percent reported | 100.0| 100.0| 100.0| 100.0| 100.0 | 100.0| 100.0| 100.0| 100.0| 100.0 | 100.0
|
|
|
|
|
|
|
|
|
|
|
|
|
|
|
|
|
|
|
|
|
|
NOT REPORTED
|0|0|0|0|0
|0|0|0|0|0
|0
------------------------------------------------------------------------------------------------------------------------------------
Total
| 197 | 3039 | 2047 | 401 | 5684
| 9 | 129 | 78 | 26 | 242
| 5926
Page 47 Run 08/21/00
Georgia Department of Corrections Office of Planning and Analysis
Inmate statistical profile
Sample: ACTIVE PRISONERS SERVING LIFE EXCLUDING JAIL
Requestor: Statistics
Active inmates 08/21/2000
Most Serious Crime Type by current age & sex
|
MEN
|
WOMEN
|
| Age | Age | Age | Age | Men
| Age | Age | Age | Age |Women
|Grand
Crime Type
|00-21 %|22-39 %|40-54 %|55-99 %|Total % |00-21 %|22-39 %|40-54 %|55-99 %|Total % |Total %
------------------------------------------------------------------------------------------------------------------------------------
VIOL/PERSN
| 187 95| 2411 79| 1541 75| 333 83| 4472 79 | 9 100| 117 91| 67 86| 25 96| 218 90 | 4690 79
NVIOL/PERS
| 0 0| 0 0| 0 0| 0 0| 0 0 | 0 0| 0 0| 0 0| 0 0| 0 0 | 0 0
PROPERTY
| 0 0| 36 1| 15 1| 1 0| 52 1 | 0 0| 0 0| 1 1| 0 0| 1 0 | 53 1
DRUG SALES
| 1 1| 194 6| 114 6| 9 2| 318 6 | 0 0| 11 9| 7 9| 0 0| 18 7 | 336 6
DRUG POSSN
| 0 0| 44 1| 26 1| 3 1| 73 1 | 0 0| 1 1| 1 1| 1 4| 3 1 | 76 1
ALCOHOL
| 0 0| 0 0| 0 0| 0 0| 0 0 | 0 0| 0 0| 0 0| 0 0| 0 0 | 0 0
HABIT/DUI
| 0 0| 0 0| 0 0| 0 0| 0 0 | 0 0| 0 0| 0 0| 0 0| 0 0 | 0 0
SEX OFFEND
| 9 5| 345 11| 344 17| 53 13| 751 13 | 0 0| 0 0| 2 3| 0 0| 2 1 | 753 13
OTHER
| 0 0| 9 0| 7 0| 2 0| 18 0 | 0 0| 0 0| 0 0| 0 0| 0 0 | 18 0
------------------------------------------------------------------------------------------------------------------------------------
Total reported
| 197 100| 3039 100| 2047 100| 401 100| 5684 100 | 9 100| 129 100| 78 100| 26 100| 242 100 | 5926 100
|
|
|
|
|
|
|
|
|
|
|
Percent reported | 100.0| 100.0| 100.0| 100.0| 100.0 | 100.0| 100.0| 100.0| 100.0| 100.0 | 100.0
|
|
|
|
|
|
|
|
|
|
|
|
|
|
|
|
|
|
|
|
|
|
NOT REPORTED
|0|0|0|0|0
|0|0|0|0|0
|0
------------------------------------------------------------------------------------------------------------------------------------
Total
| 197 | 3039 | 2047 | 401 | 5684
| 9 | 129 | 78 | 26 | 242
| 5926