- Collection:
- Georgia Government Publications
- Title:
- Inmate statistical profile: active lifers, 2000-06-01
- Creator:
- Georgia. Department of Corrections. Planning and Analysis Section
- Publisher:
- Atlanta, GA. : Georgia Dept. of Corrections, Office of Planning and Analysis, 2000-06-01
- Date of Original:
- 2000-06-01
- Subject:
- Prisoners--Georgia
- Location:
- United States, Georgia, 32.75042, -83.50018
- Medium:
- state government records
- Type:
- Text
- Format:
- application/pdf
- External Identifiers:
- Call Number GA R300.P5 P1 L5 2000/6
- Metadata URL:
- https://dlg.galileo.usg.edu/id:dlg_ggpd_i-ga-br300-pp5-bp1-bl5-b2000-s6-belec-p-btext
- Digital Object URL:
- https://dlg.galileo.usg.edu/do:dlg_ggpd_i-ga-br300-pp5-bp1-bl5-b2000-s6-belec-p-btext
- Language:
- eng
- Holding Institution:
- University of Georgia. Map and Government Information Library
- Rights:
-

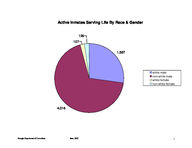
Active Inmates Serving Life By Race & Gender
129 107
1,597
white male non-white male white female non-white female
4,016
Georgia Department of Corrections
June, 2000
1
Active Inmates Serving Life By Crime Type
17 749 76 343 52
4640
viol/persn
property
drug sales
drug possn
sex offend
other
Georgia Department of Corrections
June, 2000
2
Number of Inmates
Prior Incarcerations of Active Inmates Serving A Life Sentence
4000
3,539
3500
3000
2500
2000
1500 1000
500 0
zero
1,215
one
603 322
two
three
Priors
127
71
four
five or more
Georgia Department of Corrections
June, 2000
3
Georgia Department of Corrections
Page 1 Run 06/20/00
Office of Planning and Analysis
Inmate statistical profile TABLE OF CONTENTS FOR ACTIVE PRISONERS WITH LIFE SENTENCES EXCLUDING JAIL
TITLE ----RACE AND SEX............................ 2 Culture Fair IQ Scores.................. 3 Self-Rpt Socioeconomic Class............ 4 Self-Rpt Environment To Age 16.......... 5
Self-Rpt Education Level................ 6 Functional Reading Level (WRAT Scores).. 7 Functional Math Level (WRAT Scores)..... 8 Functional Spelling Level (WRAT Scores). 9 Self-Rpt Guardian Status To Age 16......10 Self-Rpt Employment Status Before Prison11 Self-Rpt Marital Status At Admission....12 Self-Rpt Number Of Children At Admission13 Self-Rpt Religious Affiliation..........14 Self-Rpt Family Behavior Patterns *.....15 Inmate Diagnostic Behavior Problem *....16 Physical Profile (General Condition)....17
Security Status.........................18 Number Of Sentences.....................19 Number Of Disciplinaries................20 Number Of Escapes.......................21 Number Of Prior Georgia Incarcerations *22 Number Of Transfers.....................23 County Of Conviction....................24 Circuit Of Conviction...................29 Home County.............................31 Prison Sentence In Years................36 Probation To Follow Prison..............37 Admission Type..........................38
Release Type............................39 Inst By Group...........................40 Institution.............................41 Misdemeanors And Felonies...............43 Crimes By Group.........................44 Most Serious Offense....................45 Most Serious Crime Type.................47
PAGE ----
Georgia Department of Corrections
June, 2000
4
Page 2 Run 06/20/00
Georgia Department of Corrections Office of Planning and Analysis
Inmate statistical profile
Sample: ACTIVE PRISONERS WITH LIFE SENTENCES EXCLUDING JAIL Active inmates 06/20/2000
RACE AND SEX by current age & sex
Requestor: Statistics
|
MEN
|
WOMEN
|
| Age | Age | Age | Age | Men
| Age | Age | Age | Age |Women
|Grand
RACE AND SEX
|00-21 %|22-39 %|40-54 %|55-99 %|Total % |00-21 %|22-39 %|40-54 %|55-99 %|Total % |Total %
------------------------------------------------------------------------------------------------------------------------------------
WHITE MALE
| 36 18| 691 23| 679 34| 198 51| 1604 28 | 0 0| 0 0| 0 0| 0 0| 0 0 | 1604 27
NON WHITE MALE
| 162 82| 2336 77| 1342 66| 194 49| 4034 72 | 0 0| 0 0| 0 0| 0 0| 0 0 | 4034 69
WHITE FEMALE
| 0 0| 0 0| 0 0| 0 0| 0 0 | 4 40| 48 37| 38 51| 17 65| 107 45 | 107 2
NON WHITE FEMALE | 0 0| 0 0| 0 0| 0 0| 0 0 | 6 60| 81 63| 36 49| 9 35| 132 55 | 132 2
------------------------------------------------------------------------------------------------------------------------------------
Total reported
| 198 100| 3027 100| 2021 100| 392 100| 5638 100 | 10 100| 129 100| 74 100| 26 100| 239 100 | 5877 100
|
|
|
|
|
|
|
|
|
|
|
Percent reported | 100.0| 100.0| 100.0| 100.0| 100.0 | 100.0| 100.0| 100.0| 100.0| 100.0 | 100.0
|
|
|
|
|
|
|
|
|
|
|
|
|
|
|
|
|
|
|
|
|
|
NOT REPORTED
|0|0|0|0|0
|0|0|0|0|0
|0
------------------------------------------------------------------------------------------------------------------------------------
Total
| 198 | 3027 | 2021 | 392 | 5638
| 10 | 129 | 74 | 26 | 239
| 5877
|
|
|
|
|
|
|
|
|
|
|
|
|
|
|
|
|
|
|
|
|
|
|
|
|
|
|
|
|
|
|
|
|
|
|
|
|
|
|
|
|
|
|
|
|
|
|
|
|
|
|
|
|
|
|
AVERAGE AGE
| 20.00 | 31.16 | 45.69 | 61.31 | 38.07 | 19.30 | 31.81 | 45.36 | 60.27 | 38.58 | 38.09
Georgia Department of Corrections
June, 2000
5
Page 3 Run 06/20/00
Georgia Department of Corrections Office of Planning and Analysis
Inmate statistical profile
Sample: ACTIVE PRISONERS WITH LIFE SENTENCES EXCLUDING JAIL
Requestor:
Active inmates 06/20/2000
Culture Fair IQ Scores by current age & sex
Statistics
|
MEN
|
WOMEN
|
| Age | Age | Age | Age | Men
| Age | Age | Age | Age |Women
|Grand
IQ Score
|00-21 %|22-39 %|40-54 %|55-99 %|Total % |00-21 %|22-39 %|40-54 %|55-99 %|Total % |Total %
------------------------------------------------------------------------------------------------------------------------------------
LESS THAN 70
| 2 1| 88 3| 154 8| 36 10| 280 5 | 0 0| 10 8| 10 14| 2 9| 22 10 | 302 5
70 AND UP
| 187 99| 2801 97| 1731 92| 307 90| 5026 95 | 9 100| 116 92| 61 86| 21 91| 207 90 | 5233 95
------------------------------------------------------------------------------------------------------------------------------------
Total reported
| 189 100| 2889 100| 1885 100| 343 100| 5306 100 | 9 100| 126 100| 71 100| 23 100| 229 100 | 5535 100
|
|
|
|
|
|
|
|
|
|
|
Percent reported |
95.5|
95.4|
93.3|
87.5|
94.1 |
90.0|
97.7|
95.9|
88.5|
95.8 |
94.2
|
|
|
|
|
|
|
|
|
|
|
|
|
|
|
|
|
|
|
|
|
|
NOT REPORTED
| 9 | 138 | 136 | 49 | 332
| 1 | 3 | 3 | 3 | 10
| 342
------------------------------------------------------------------------------------------------------------------------------------
Total
| 198 | 3027 | 2021 | 392 | 5638
| 10 | 129 | 74 | 26 | 239
| 5877
|
|
|
|
|
|
|
|
|
|
|
|
|
|
|
|
|
|
|
|
|
|
|
|
|
|
|
|
|
|
|
|
|
|
|
|
|
|
|
|
|
|
|
|
|
|
|
|
|
|
|
|
|
|
|
AVERAGE IQ
| 98.73 | 101.34 | 96.84 | 93.44 | 99.14 | 93.33 | 95.25 | 89.85 | 88.00 | 92.77 | 98.87
Georgia Department of Corrections
June, 2000
6
Page 4 Run 06/20/00
Georgia Department of Corrections Office of Planning and Analysis
Inmate statistical profile
Sample: ACTIVE PRISONERS WITH LIFE SENTENCES EXCLUDING JAIL
Requestor:
Active inmates 06/20/2000
Self-Rpt Socioeconomic Class by current age & sex
Statistics
|
MEN
|
WOMEN
|
| Age | Age | Age | Age | Men
| Age | Age | Age | Age |Women
|Grand
Socioeconomic Class |00-21 %|22-39 %|40-54 %|55-99 %|Total % |00-21 %|22-39 %|40-54 %|55-99 %|Total % |Total %
------------------------------------------------------------------------------------------------------------------------------------
WELFARE
| 22 12| 350 12| 195 10| 22 6| 589 11 | 1 10| 19 15| 8 11| 0 0| 28 12 | 617 11
OCC EMPLOY
| 12 7| 189 6| 67 3| 5 1| 273 5 | 0 0| 4 3| 0 0| 1 4| 5 2 | 278 5
MINIMUM STD
| 75 41| 987 34| 874 45| 213 58| 2149 40 | 4 40| 46 36| 21 28| 8 35| 79 34 | 2228 39
MIDDLE
| 71 39| 1355 47| 818 42| 127 34| 2371 44 | 5 50| 56 44| 43 58| 13 57| 117 50 | 2488 44
OTHER
| 1 1| 27 1| 5 0| 3 1| 36 1 | 0 0| 2 2| 2 3| 1 4| 5 2 | 41 1
------------------------------------------------------------------------------------------------------------------------------------
Total reported
| 181 100| 2908 100| 1959 100| 370 100| 5418 100 | 10 100| 127 100| 74 100| 23 100| 234 100 | 5652 100
|
|
|
|
|
|
|
|
|
|
|
Percent reported |
91.4|
96.1|
96.9|
94.4|
96.1 | 100.0|
98.4| 100.0|
88.5|
97.9 |
96.2
|
|
|
|
|
|
|
|
|
|
|
|
|
|
|
|
|
|
|
|
|
|
NOT RPTD
| 17 | 119 | 62 | 22 | 220
|0|2|0|3|5
| 225
------------------------------------------------------------------------------------------------------------------------------------
Total
| 198 | 3027 | 2021 | 392 | 5638
| 10 | 129 | 74 | 26 | 239
| 5877
Georgia Department of Corrections
June, 2000
7
Page 5 Run 06/20/00
Georgia Department of Corrections Office of Planning and Analysis
Inmate statistical profile
Sample: ACTIVE PRISONERS WITH LIFE SENTENCES EXCLUDING JAIL
Requestor:
Active inmates 06/20/2000
Self-Rpt Environment To Age 16 by current age & sex
Statistics
|
MEN
|
WOMEN
|
| Age | Age | Age | Age | Men
| Age | Age | Age | Age |Women
|Grand
Environment
|00-21 %|22-39 %|40-54 %|55-99 %|Total % |00-21 %|22-39 %|40-54 %|55-99 %|Total % |Total %
------------------------------------------------------------------------------------------------------------------------------------
RURAL/FARM
| 0 0| 113 4| 169 9| 95 25| 377 7 | 0 0| 8 6| 4 5| 3 14| 15 6 | 392 7
RURAL/NFARM
| 3 2| 217 7| 167 8| 32 8| 419 8 | 0 0| 8 6| 2 3| 0 0| 10 4 | 429 7
S.M.S.A
| 87 45| 1210 41| 702 36| 94 25| 2093 38 | 3 30| 26 20| 20 27| 6 27| 55 24 | 2148 37
URBAN
| 37 19| 515 17| 357 18| 47 12| 956 17 | 4 40| 30 24| 19 26| 3 14| 56 24 | 1012 18
SMALL TOWN
| 66 34| 889 30| 564 29| 109 29| 1628 30 | 3 30| 55 43| 27 36| 9 41| 94 40 | 1722 30
OTHER
| 1 1| 15 1| 9 0| 0 0| 25 0 | 0 0| 0 0| 2 3| 1 5| 3 1 | 28 0
------------------------------------------------------------------------------------------------------------------------------------
Total reported
| 194 100| 2959 100| 1968 100| 377 100| 5498 100 | 10 100| 127 100| 74 100| 22 100| 233 100 | 5731 100
|
|
|
|
|
|
|
|
|
|
|
Percent reported |
98.0|
97.8|
97.4|
96.2|
97.5 | 100.0|
98.4| 100.0|
84.6|
97.5 |
97.5
|
|
|
|
|
|
|
|
|
|
|
|
|
|
|
|
|
|
|
|
|
|
NOT RPTD
| 4 | 68 | 53 | 15 | 140
|0|2|0|4|6
| 146
------------------------------------------------------------------------------------------------------------------------------------
Total
| 198 | 3027 | 2021 | 392 | 5638
| 10 | 129 | 74 | 26 | 239
| 5877
Georgia Department of Corrections
June, 2000
8
Page 6 Run 06/20/00
Georgia Department of Corrections Office of Planning and Analysis Inmate statistical profile
Sample: ACTIVE PRISONERS WITH LIFE SENTENCES EXCLUDING JAIL
Requestor:
Active inmates 06/20/2000
Self-Rpt Education Level by current age & sex
Statistics
|
MEN
|
WOMEN
|
| Age | Age | Age | Age | Men
| Age | Age | Age | Age |Women
|Grand
Education Level
|00-21 %|22-39 %|40-54 %|55-99 %|Total % |00-21 %|22-39 %|40-54 %|55-99 %|Total % |Total %
------------------------------------------------------------------------------------------------------------------------------------
LESS THAN GRADE 7 | 6 3| 48 2| 105 5| 83 22| 242 4 | 0 0| 1 1| 3 4| 5 20| 9 4 | 251 4
GRADE 7
| 9 5| 82 3| 64 3| 34 9| 189 3 | 0 0| 6 5| 3 4| 1 4| 10 4 | 199 3
GRADE 8
| 42 22| 269 9| 195 10| 37 10| 543 10 | 3 30| 13 10| 8 11| 1 4| 25 11 | 568 10
GRADE 9
| 43 22| 444 15| 243 12| 32 8| 762 14 | 4 40| 18 14| 4 5| 0 0| 26 11 | 788 14
GRADE 10
| 46 24| 593 20| 280 14| 33 9| 952 17 | 2 20| 23 18| 8 11| 3 12| 36 15 | 988 17
GRADE 11
| 38 20| 543 18| 217 11| 25 7| 823 15 | 1 10| 17 13| 4 5| 2 8| 24 10 | 847 15
GRADE 12
| 7 4| 754 25| 638 32| 94 25| 1493 27 | 0 0| 30 24| 25 34| 9 36| 64 27 | 1557 27
MORE THAN GRADE 12 | 2 1| 254 9| 251 13| 45 12| 552 10 | 0 0| 19 15| 19 26| 4 16| 42 18 | 594 10
------------------------------------------------------------------------------------------------------------------------------------
Total reported
| 193 100| 2987 100| 1993 100| 383 100| 5556 100 | 10 100| 127 100| 74 100| 25 100| 236 100 | 5792 100
|
|
|
|
|
|
|
|
|
|
|
Percent reported |
97.5|
98.7|
98.6|
97.7|
98.5 | 100.0|
98.4| 100.0|
96.2|
98.7 |
98.6
|
|
|
|
|
|
|
|
|
|
|
|
|
|
|
|
|
|
|
|
|
|
NOT REPORTED
| 5 | 40 | 28 | 9 | 82
|0|2|0|1|3
| 85
------------------------------------------------------------------------------------------------------------------------------------
Total
| 198 | 3027 | 2021 | 392 | 5638
| 10 | 129 | 74 | 26 | 239
| 5877
|
|
|
|
|
|
|
|
|
|
|
|
|
|
|
|
|
|
|
|
|
|
|
|
|
|
|
|
|
|
|
|
|
|
|
|
|
|
|
|
|
|
|
|
|
|
|
|
|
|
|
|
|
|
|
AVG EDUCATION LEVEL | 9.38 | 11.04 | 11.20 | 9.63 | 10.94 | 9.10 | 11.54 | 11.91 | 11.12 | 11.51 | 10.97
* NOTE: THE FIELD LABLED "LESS THAN GRADE 7" WAS CORRECTED IN MARCH 1989: MISSING DATA FOR INMATES STILL IN DIAGNOSTICS NOW HAS BEEN REMOVED FROM THIS FIELD AND IDENTIFIED AS "NOT REPORTED" INFORMATION.
Georgia Department of Corrections
June, 2000
9
Page 7 Run 06/20/00
Georgia Department of Corrections Office of Planning and Analysis
Inmate statistical profile
Sample: ACTIVE PRISONERS WITH LIFE SENTENCES EXCLUDING JAIL
Requestor:
Active inmates 06/20/2000
Functional Reading Level (WRAT Scores) by current age & sex
Statistics
|
MEN
|
WOMEN
|
| Age | Age | Age | Age | Men
| Age | Age | Age | Age |Women
|Grand
WRAT Reading Score |00-21 %|22-39 %|40-54 %|55-99 %|Total % |00-21 %|22-39 %|40-54 %|55-99 %|Total % |Total %
------------------------------------------------------------------------------------------------------------------------------------
LESS THAN GRADE 6 | 79 42| 1147 40| 816 46| 159 49| 2201 42 | 3 33| 51 40| 19 28| 10 42| 83 36 | 2284 42
6TH THRU 8TH GRADE | 40 21| 664 23| 406 23| 56 17| 1166 22 | 2 22| 28 22| 16 23| 4 17| 50 22 | 1216 22
GRADE 9
| 12 6| 209 7| 103 6| 19 6| 343 7 | 1 11| 5 4| 6 9| 3 13| 15 7 | 358 7
GRADE 10
| 13 7| 129 4| 73 4| 14 4| 229 4 | 1 11| 2 2| 5 7| 2 8| 10 4 | 239 4
GRADE 11
| 6 3| 113 4| 80 5| 8 2| 207 4 | 0 0| 5 4| 4 6| 1 4| 10 4 | 217 4
GRADE 12
| 30 16| 532 18| 274 15| 66 20| 902 17 | 1 11| 7 6| 2 3| 1 4| 11 5 | 913 17
MORE THAN GRADE 12 | 9 5| 99 3| 25 1| 4 1| 137 3 | 1 11| 28 22| 17 25| 3 13| 49 21 | 186 3
------------------------------------------------------------------------------------------------------------------------------------
Total reported
| 189 100| 2893 100| 1777 100| 326 100| 5185 100 | 9 100| 126 100| 69 100| 24 100| 228 100 | 5413 100
|
|
|
|
|
|
|
|
|
|
|
Percent reported |
95.5|
95.6|
87.9|
83.2|
92.0 |
90.0|
97.7|
93.2|
92.3|
95.4 |
92.1
|
|
|
|
|
|
|
|
|
|
|
|
|
|
|
|
|
|
|
|
|
|
NOT REPORTED
| 9 | 134 | 244 | 66 | 453
| 1 | 3 | 5 | 2 | 11
| 464
------------------------------------------------------------------------------------------------------------------------------------
Total
| 198 | 3027 | 2021 | 392 | 5638
| 10 | 129 | 74 | 26 | 239
| 5877
|
|
|
|
|
|
|
|
|
|
|
|
|
|
|
|
|
|
|
|
|
|
|
|
|
|
|
|
|
|
|
|
|
|
|
|
|
|
|
|
|
|
|
|
|
|
|
|
|
|
|
|
|
|
|
AVG READING SCORE | 7.51 | 7.65 | 6.98 | 6.92 | 7.37 | 8.14 | 7.73 | 8.39 | 7.32 | 7.90 | 7.39
Georgia Department of Corrections
June, 2000
10
Page 8 Run 06/20/00
Georgia Department of Corrections Office of Planning and Analysis
Inmate statistical profile
Sample: ACTIVE PRISONERS WITH LIFE SENTENCES EXCLUDING JAIL
Requestor:
Active inmates 06/20/2000
Functional Math Level (WRAT Scores) by current age & sex
Statistics
|
MEN
|
WOMEN
|
| Age | Age | Age | Age | Men
| Age | Age | Age | Age |Women
|Grand
WRAT Math Score
|00-21 %|22-39 %|40-54 %|55-99 %|Total % |00-21 %|22-39 %|40-54 %|55-99 %|Total % |Total %
------------------------------------------------------------------------------------------------------------------------------------
LESS THAN GRADE 6 | 68 36| 878 30| 783 44| 168 52| 1897 37 | 3 33| 51 40| 26 37| 11 46| 91 40 | 1988 37
6TH THRU 8TH GRADE | 91 48| 1444 50| 658 37| 89 27| 2282 44 | 6 67| 50 40| 27 39| 9 38| 92 40 | 2374 44
GRADE 9
| 13 7| 223 8| 113 6| 23 7| 372 7 | 0 0| 11 9| 4 6| 2 8| 17 7 | 389 7
GRADE 10
| 11 6| 137 5| 95 5| 14 4| 257 5 | 0 0| 7 6| 3 4| 1 4| 11 5 | 268 5
GRADE 11
| 4 2| 96 3| 50 3| 12 4| 162 3 | 0 0| 1 1| 3 4| 1 4| 5 2 | 167 3
GRADE 12
| 0 0| 102 4| 81 5| 18 6| 201 4 | 0 0| 2 2| 3 4| 0 0| 5 2 | 206 4
MORE THAN GRADE 12 | 2 1| 17 1| 3 0| 2 1| 24 0 | 0 0| 4 3| 4 6| 0 0| 8 3 | 32 1
------------------------------------------------------------------------------------------------------------------------------------
Total reported
| 189 100| 2897 100| 1783 100| 326 100| 5195 100 | 9 100| 126 100| 70 100| 24 100| 229 100 | 5424 100
|
|
|
|
|
|
|
|
|
|
|
Percent reported |
95.5|
95.7|
88.2|
83.2|
92.1 |
90.0|
97.7|
94.6|
92.3|
95.8 |
92.3
|
|
|
|
|
|
|
|
|
|
|
|
|
|
|
|
|
|
|
|
|
|
NOT REPORTED
| 9 | 130 | 238 | 66 | 443
| 1 | 3 | 4 | 2 | 10
| 453
------------------------------------------------------------------------------------------------------------------------------------
Total
| 198 | 3027 | 2021 | 392 | 5638
| 10 | 129 | 74 | 26 | 239
| 5877
|
|
|
|
|
|
|
|
|
|
|
|
|
|
|
|
|
|
|
|
|
|
|
|
|
|
|
|
|
|
|
|
|
|
|
|
|
|
|
|
|
|
|
|
|
|
|
|
|
|
|
|
|
|
|
AVG MATH SCORE
| 6.86 | 7.10 | 6.57 | 6.29 | 6.86 | 6.21 | 6.92 | 7.24 | 5.98 | 6.89 | 6.86
Georgia Department of Corrections
June, 2000
11
Page 9 Run 06/20/00
Georgia Department of Corrections Office of Planning and Analysis
Inmate statistical profile
Sample: ACTIVE PRISONERS WITH LIFE SENTENCES EXCLUDING JAIL
Requestor:
Active inmates 06/20/2000
Functional Spelling Level (WRAT Scores) by current age & sex
Statistics
|
MEN
|
WOMEN
|
| Age | Age | Age | Age | Men
| Age | Age | Age | Age |Women
|Grand
WRAT Spelling Score |00-21 %|22-39 %|40-54 %|55-99 %|Total % |00-21 %|22-39 %|40-54 %|55-99 %|Total % |Total %
------------------------------------------------------------------------------------------------------------------------------------
LESS THAN GRADE 6 | 78 41| 1325 46| 1034 58| 191 59| 2628 51 | 3 33| 48 38| 24 34| 12 50| 87 38 | 2715 50
6TH THRU 8TH GRADE | 62 33| 762 26| 356 20| 63 19| 1243 24 | 5 56| 30 24| 17 24| 4 17| 56 24 | 1299 24
GRADE 9
| 13 7| 164 6| 103 6| 13 4| 293 6 | 0 0| 7 6| 3 4| 3 13| 13 6 | 306 6
GRADE 10
| 14 7| 176 6| 66 4| 15 5| 271 5 | 0 0| 10 8| 4 6| 0 0| 14 6 | 285 5
GRADE 11
| 7 4| 140 5| 42 2| 5 2| 194 4 | 1 11| 5 4| 3 4| 2 8| 11 5 | 205 4
GRADE 12
| 10 5| 288 10| 164 9| 37 11| 499 10 | 0 0| 7 6| 4 6| 0 0| 11 5 | 510 9
MORE THAN GRADE 12 | 5 3| 39 1| 13 1| 2 1| 59 1 | 0 0| 19 15| 15 21| 3 13| 37 16 | 96 2
------------------------------------------------------------------------------------------------------------------------------------
Total reported
| 189 100| 2894 100| 1778 100| 326 100| 5187 100 | 9 100| 126 100| 70 100| 24 100| 229 100 | 5416 100
|
|
|
|
|
|
|
|
|
|
|
Percent reported |
95.5|
95.6|
88.0|
83.2|
92.0 |
90.0|
97.7|
94.6|
92.3|
95.8 |
92.2
|
|
|
|
|
|
|
|
|
|
|
|
|
|
|
|
|
|
|
|
|
|
NOT REPORTED
| 9 | 133 | 243 | 66 | 451
| 1 | 3 | 4 | 2 | 10
| 461
------------------------------------------------------------------------------------------------------------------------------------
Total
| 198 | 3027 | 2021 | 392 | 5638
| 10 | 129 | 74 | 26 | 239
| 5877
|
|
|
|
|
|
|
|
|
|
|
|
|
|
|
|
|
|
|
|
|
|
|
|
|
|
|
|
|
|
|
|
|
|
|
|
|
|
|
|
|
|
|
|
|
|
|
|
|
|
|
|
|
|
|
AVG SPELLING SCORE | 6.89 | 6.86 | 6.02 | 5.90 | 6.52 | 7.28 | 7.74 | 8.08 | 6.60 | 7.71 | 6.57
Georgia Department of Corrections
June, 2000
12
Page 10 Run 06/20/00
Georgia Department of Corrections Office of Planning and Analysis
Inmate statistical profile
Sample: ACTIVE PRISONERS WITH LIFE SENTENCES EXCLUDING JAIL
Requestor:
Active inmates 06/20/2000
Self-Rpt Guardian Status To Age 16 by current age & sex
Statistics
|
MEN
|
WOMEN
|
| Age | Age | Age | Age | Men
| Age | Age | Age | Age |Women
|Grand
Guardian Status
|00-21 %|22-39 %|40-54 %|55-99 %|Total % |00-21 %|22-39 %|40-54 %|55-99 %|Total % |Total %
------------------------------------------------------------------------------------------------------------------------------------
ORPHANAGE
| 0 0| 6 0| 2 0| 3 1| 11 0 | 0 0| 0 0| 0 0| 0 0| 0 0 | 11 0
FATHER ONLY
| 10 5| 82 3| 54 3| 6 2| 152 3 | 0 0| 2 2| 2 3| 1 4| 5 2 | 157 3
FTR MTR HD
| 10 5| 112 4| 66 3| 5 1| 193 3 | 0 0| 3 2| 3 4| 0 0| 6 3 | 199 3
MOTHER ONLY
| 104 54| 1372 46| 635 32| 101 27| 2212 40 | 5 50| 45 35| 23 32| 9 38| 82 35 | 2294 40
MTR FTR HD
| 42 22| 971 33| 950 48| 210 55| 2173 39 | 4 40| 51 40| 38 53| 13 54| 106 45 | 2279 40
OTH FEMALE
| 3 2| 53 2| 50 3| 14 4| 120 2 | 0 0| 4 3| 2 3| 0 0| 6 3 | 126 2
OTH MALE
| 1 1| 7 0| 11 1| 1 0| 20 0 | 0 0| 2 2| 1 1| 0 0| 3 1 | 23 0
STEP-PARNTS
| 3 2| 52 2| 25 1| 6 2| 86 2 | 0 0| 0 0| 0 0| 0 0| 0 0 | 86 1
FOSTER HOME
| 2 1| 27 1| 31 2| 7 2| 67 1 | 0 0| 3 2| 0 0| 0 0| 3 1 | 70 1
GRAND PRNTS
| 14 7| 233 8| 133 7| 23 6| 403 7 | 1 10| 13 10| 3 4| 1 4| 18 8 | 421 7
OTHER
| 4 2| 63 2| 24 1| 4 1| 95 2 | 0 0| 4 3| 0 0| 0 0| 4 2 | 99 2
------------------------------------------------------------------------------------------------------------------------------------
Total reported
| 193 100| 2978 100| 1981 100| 380 100| 5532 100 | 10 100| 127 100| 72 100| 24 100| 233 100 | 5765 100
|
|
|
|
|
|
|
|
|
|
|
Percent reported |
97.5|
98.4|
98.0|
96.9|
98.1 | 100.0|
98.4|
97.3|
92.3|
97.5 |
98.1
|
|
|
|
|
|
|
|
|
|
|
|
|
|
|
|
|
|
|
|
|
|
NOT RPTD
| 5 | 49 | 40 | 12 | 106
|0|2|2|2|6
| 112
------------------------------------------------------------------------------------------------------------------------------------
Total
| 198 | 3027 | 2021 | 392 | 5638
| 10 | 129 | 74 | 26 | 239
| 5877
Georgia Department of Corrections
June, 2000
13
Page 11 Run 06/20/00
Georgia Department of Corrections Office of Planning and Analysis Inmate statistical profile
Sample: ACTIVE PRISONERS WITH LIFE SENTENCES EXCLUDING JAIL
Requestor:
Active inmates 06/20/2000
Self-Rpt Employment Status Before Prison by current age & sex
Statistics
|
MEN
|
WOMEN
|
| Age | Age | Age | Age | Men
| Age | Age | Age | Age |Women
|Grand
Employment
|00-21 %|22-39 %|40-54 %|55-99 %|Total % |00-21 %|22-39 %|40-54 %|55-99 %|Total % |Total %
------------------------------------------------------------------------------------------------------------------------------------
FULL TIME
| 42 23| 957 33| 731 38| 150 42| 1880 35 | 1 10| 25 20| 13 18| 4 17| 43 19 | 1923 34
PART TIME
| 14 8| 227 8| 107 6| 17 5| 365 7 | 0 0| 6 5| 3 4| 0 0| 9 4 | 374 7
UNEMPL < 6M
| 14 8| 470 16| 329 17| 52 14| 865 16 | 0 0| 27 22| 16 23| 4 17| 47 21 | 912 16
UNEMPL > 6M
| 19 10| 931 32| 685 35| 110 30| 1745 33 | 2 20| 42 34| 31 44| 13 57| 88 39 | 1833 33
NEVER WORKD
| 71 39| 232 8| 21 1| 2 1| 326 6 | 4 40| 22 18| 4 6| 0 0| 30 13 | 356 6
STUDENT
| 22 12| 30 1| 5 0| 1 0| 58 1 | 3 30| 1 1| 2 3| 0 0| 6 3 | 64 1
INCAPABLE
| 1 1| 32 1| 52 3| 29 8| 114 2 | 0 0| 0 0| 2 3| 2 9| 4 2 | 118 2
OTHER
| 0 0| 0 0| 0 0| 0 0| 0 0 | 0 0| 0 0| 0 0| 0 0| 0 0 | 0 0
------------------------------------------------------------------------------------------------------------------------------------
Total reported
| 183 100| 2879 100| 1930 100| 361 100| 5353 100 | 10 100| 123 100| 71 100| 23 100| 227 100 | 5580 100
|
|
|
|
|
|
|
|
|
|
|
Percent reported |
92.4|
95.1|
95.5|
92.1|
94.9 | 100.0|
95.3|
95.9|
88.5|
95.0 |
94.9
|
|
|
|
|
|
|
|
|
|
|
|
|
|
|
|
|
|
|
|
|
|
NOT RPTD
| 15 | 148 | 91 | 31 | 285
| 0 | 6 | 3 | 3 | 12
| 297
------------------------------------------------------------------------------------------------------------------------------------
Total
| 198 | 3027 | 2021 | 392 | 5638
| 10 | 129 | 74 | 26 | 239
| 5877
* NOTE: THE FIELD LABELD "OTHER" WAS CORRECTED IN APRIL 1989; INMATES CODED "PRE-OTIS NOT REPORTED" NOW HAVE BEEN REMOVED FROM THIS FIELD AND IDENTIFIED AS "NOT REPORTED".
Georgia Department of Corrections
June, 2000
14
Page 12 Run 06/20/00
Georgia Department of Corrections Office of Planning and Analysis
Inmate statistical profile
Sample: ACTIVE PRISONERS WITH LIFE SENTENCES EXCLUDING JAIL
Requestor:
Active inmates 06/20/2000
Self-Rpt Marital Status At Admission by current age & sex
Statistics
|
MEN
|
WOMEN
|
| Age | Age | Age | Age | Men
| Age | Age | Age | Age |Women
|Grand
Marital Status
|00-21 %|22-39 %|40-54 %|55-99 %|Total % |00-21 %|22-39 %|40-54 %|55-99 %|Total % |Total %
------------------------------------------------------------------------------------------------------------------------------------
SINGLE
| 185 95| 1993 67| 676 34| 50 13| 2904 52 | 10 100| 71 55| 12 16| 3 13| 96 41 | 3000 52
MARRIED
| 2 1| 254 9| 375 19| 107 28| 738 13 | 0 0| 15 12| 14 19| 3 13| 32 14 | 770 13
SEPARATED
| 0 0| 108 4| 167 8| 39 10| 314 6 | 0 0| 11 9| 7 10| 2 8| 20 9 | 334 6
DIVORCED
| 0 0| 150 5| 352 18| 86 23| 588 11 | 0 0| 9 7| 14 19| 6 25| 29 12 | 617 11
WIDOWED
| 1 1| 38 1| 91 5| 53 14| 183 3 | 0 0| 6 5| 18 25| 9 38| 33 14 | 216 4
COMMON LAW
| 6 3| 430 14| 324 16| 47 12| 807 15 | 0 0| 16 13| 8 11| 1 4| 25 11 | 832 14
OTHER
| 0 0| 2 0| 1 0| 0 0| 3 0 | 0 0| 0 0| 0 0| 0 0| 0 0 | 3 0
------------------------------------------------------------------------------------------------------------------------------------
Total reported
| 194 100| 2975 100| 1986 100| 382 100| 5537 100 | 10 100| 128 100| 73 100| 24 100| 235 100 | 5772 100
|
|
|
|
|
|
|
|
|
|
|
Percent reported |
98.0|
98.3|
98.3|
97.4|
98.2 | 100.0|
99.2|
98.6|
92.3|
98.3 |
98.2
|
|
|
|
|
|
|
|
|
|
|
|
|
|
|
|
|
|
|
|
|
|
NOT RPTD
| 4 | 52 | 35 | 10 | 101
|0|1|1|2|4
| 105
------------------------------------------------------------------------------------------------------------------------------------
Total
| 198 | 3027 | 2021 | 392 | 5638
| 10 | 129 | 74 | 26 | 239
| 5877
Georgia Department of Corrections
June, 2000
15
Page 13 Run 06/20/00
Georgia Department of Corrections Office of Planning and Analysis
Inmate statistical profile
Sample: ACTIVE PRISONERS WITH LIFE SENTENCES EXCLUDING JAIL
Requestor:
Active inmates 06/20/2000
Self-Rpt Number Of Children At Admission by current age & sex
Statistics
|
MEN
|
WOMEN
|
| Age | Age | Age | Age | Men
| Age | Age | Age | Age |Women
|Grand
Number Of Children |00-21 %|22-39 %|40-54 %|55-99 %|Total % |00-21 %|22-39 %|40-54 %|55-99 %|Total % |Total %
------------------------------------------------------------------------------------------------------------------------------------
NO CHILDREN
| 0 0| 461 23| 262 17| 38 11| 761 19 | 0 0| 4 4| 2 3| 1 4| 7 4 | 768 18
ONE CHILD
| 43 73| 754 37| 463 30| 54 16| 1314 33 | 2 100| 30 29| 12 18| 2 8| 46 24 | 1360 33
TWO CHILDREN
| 13 22| 427 21| 358 23| 75 22| 873 22 | 0 0| 35 34| 19 29| 8 33| 62 32 | 935 22
THREE CHILDREN
| 2 3| 243 12| 230 15| 66 20| 541 14 | 0 0| 20 20| 13 20| 7 29| 40 21 | 581 14
FOUR CHILDREN
| 0 0| 85 4| 117 8| 41 12| 243 6 | 0 0| 7 7| 10 15| 4 17| 21 11 | 264 6
FIVE CHILDREN
| 1 2| 32 2| 69 4| 22 7| 124 3 | 0 0| 4 4| 4 6| 1 4| 9 5 | 133 3
MORE THAN 5 CHILDREN| 0 0| 35 2| 60 4| 39 12| 134 3 | 0 0| 2 2| 5 8| 1 4| 8 4 | 142 3
------------------------------------------------------------------------------------------------------------------------------------
Total reported
| 59 100| 2037 100| 1559 100| 335 100| 3990 100 | 2 100| 102 100| 65 100| 24 100| 193 100 | 4183 100
|
|
|
|
|
|
|
|
|
|
|
Percent reported |
29.8|
67.3|
77.1|
85.5|
70.8 |
20.0|
79.1|
87.8|
92.3|
80.8 |
71.2
|
|
|
|
|
|
|
|
|
|
|
|
|
|
|
|
|
|
|
|
|
|
NOT REPORTED
| 139 | 990 | 462 | 57 | 1648
| 8 | 27 | 9 | 2 | 46
| 1694
------------------------------------------------------------------------------------------------------------------------------------
Total
| 198 | 3027 | 2021 | 392 | 5638
| 10 | 129 | 74 | 26 | 239
| 5877
|
|
|
|
|
|
|
|
|
|
|
|
|
|
|
|
|
|
|
|
|
|
|
|
|
|
|
|
|
|
|
|
|
|
|
|
|
|
|
|
|
|
|
|
|
|
|
|
|
|
|
|
|
|
|
AVG NUM CHILDREN | 1.36 | 1.60 | 2.07 | 2.87 | 1.89 | 1.00 | 2.16 | 2.80 | 2.79 | 2.44 | 1.92
* NOTE: THE FIELD LABLED "NO CHILDREN" WAS CORRECTED IN MARCH 1989: MISSING DATA FOR INMATES STILL IN DIAGNOSTICS NOW HAS BEEN REMOVED FROM THIS FIELD AND IDENTIFIED AS "NOT REPORTED" INFORMATION.
Georgia Department of Corrections
June, 2000
16
Page 14 Run 06/20/00
Georgia Department of Corrections Office of Planning and Analysis
Inmate statistical profile
Sample: ACTIVE PRISONERS WITH LIFE SENTENCES EXCLUDING JAIL
Requestor:
Active inmates 06/20/2000
Self-Rpt Religious Affiliation by current age & sex
Statistics
|
MEN
|
WOMEN
|
| Age | Age | Age | Age | Men
| Age | Age | Age | Age |Women
|Grand
Religion
|00-21 %|22-39 %|40-54 %|55-99 %|Total % |00-21 %|22-39 %|40-54 %|55-99 %|Total % |Total %
------------------------------------------------------------------------------------------------------------------------------------
ISLAM
| 1 1| 153 5| 65 4| 10 3| 229 4 | 0 0| 1 1| 0 0| 0 0| 1 0 | 230 4
CATHOLIC
| 3 2| 90 3| 61 3| 17 5| 171 3 | 0 0| 8 7| 2 3| 1 4| 11 5 | 182 3
BAPTIST
| 89 47| 1490 52| 1161 63| 212 58| 2952 56 | 6 60| 68 55| 41 58| 16 70| 131 58 | 3083 56
METHODIST
| 2 1| 71 2| 86 5| 26 7| 185 4 | 0 0| 6 5| 5 7| 1 4| 12 5 | 197 4
EPISCOPLN
| 1 1| 4 0| 4 0| 3 1| 12 0 | 0 0| 1 1| 2 3| 0 0| 3 1 | 15 0
PRESBYTRN
| 0 0| 8 0| 7 0| 3 1| 18 0 | 0 0| 0 0| 0 0| 2 9| 2 1 | 20 0
CHC OF GOD
| 0 0| 32 1| 24 1| 9 2| 65 1 | 0 0| 4 3| 1 1| 0 0| 5 2 | 70 1
HOLINESS
| 6 3| 134 5| 92 5| 22 6| 254 5 | 1 10| 16 13| 10 14| 0 0| 27 12 | 281 5
JEWISH
| 0 0| 1 0| 3 0| 1 0| 5 0 | 0 0| 0 0| 0 0| 0 0| 0 0 | 5 0
ANGLICAN
| 0 0| 0 0| 0 0| 0 0| 0 0 | 0 0| 1 1| 0 0| 0 0| 1 0 | 1 0
GRK ORTHDX
| 0 0| 0 0| 0 0| 0 0| 0 0 | 0 0| 0 0| 0 0| 0 0| 0 0 | 0 0
HINDU
| 0 0| 0 0| 0 0| 0 0| 0 0 | 0 0| 0 0| 0 0| 0 0| 0 0 | 0 0
BUDDHIST
| 2 1| 3 0| 1 0| 0 0| 6 0 | 0 0| 0 0| 0 0| 0 0| 0 0 | 6 0
TAOIST
| 0 0| 0 0| 0 0| 0 0| 0 0 | 0 0| 0 0| 0 0| 0 0| 0 0 | 0 0
SHINTOIST
| 0 0| 0 0| 0 0| 0 0| 0 0 | 0 0| 0 0| 0 0| 0 0| 0 0 | 0 0
SEVEN D AD
| 0 0| 5 0| 4 0| 1 0| 10 0 | 0 0| 0 0| 0 0| 0 0| 0 0 | 10 0
JEHOVAH WT
| 1 1| 26 1| 10 1| 0 0| 37 1 | 0 0| 0 0| 0 0| 0 0| 0 0 | 37 1
LATR DAY S
| 0 0| 3 0| 0 0| 0 0| 3 0 | 0 0| 0 0| 0 0| 0 0| 0 0 | 3 0
QUAKER
| 0 0| 0 0| 0 0| 0 0| 0 0 | 0 0| 0 0| 0 0| 0 0| 0 0 | 0 0
OTHER PROD
| 18 10| 206 7| 58 3| 16 4| 298 6 | 0 0| 5 4| 6 8| 1 4| 12 5 | 310 6
NONE
| 45 24| 417 15| 135 7| 12 3| 609 12 | 1 10| 5 4| 1 1| 0 0| 7 3 | 616 11
OTHER
| 20 11| 204 7| 139 8| 31 9| 394 8 | 2 20| 8 7| 3 4| 2 9| 15 7 | 409 7
------------------------------------------------------------------------------------------------------------------------------------
Total reported
| 188 100| 2847 100| 1850 100| 363 100| 5248 100 | 10 100| 123 100| 71 100| 23 100| 227 100 | 5475 100
|
|
|
|
|
|
|
|
|
|
|
Percent reported |
94.9|
94.1|
91.5|
92.6|
93.1 | 100.0|
95.3|
95.9|
88.5|
95.0 |
93.2
|
|
|
|
|
|
|
|
|
|
|
|
|
|
|
|
|
|
|
|
|
|
NOT RPTD
| 10 | 180 | 171 | 29 | 390
| 0 | 6 | 3 | 3 | 12
| 402
------------------------------------------------------------------------------------------------------------------------------------
Total
| 198 | 3027 | 2021 | 392 | 5638
| 10 | 129 | 74 | 26 | 239
| 5877
Georgia Department of Corrections
June, 2000
17
Page 15 Run 06/20/00
Georgia Department of Corrections Office of Planning and Analysis
Inmate statistical profile
Sample: ACTIVE PRISONERS WITH LIFE SENTENCES EXCLUDING JAIL
Requestor:
Active inmates 06/20/2000
Self-Rpt Family Behavior Patterns * by current age & sex
Statistics
|
MEN
|
WOMEN
|
| Age | Age | Age | Age | Men
| Age | Age | Age | Age |Women
|Grand
Family Behavior
|00-21 %|22-39 %|40-54 %|55-99 %|Total % |00-21 %|22-39 %|40-54 %|55-99 %|Total % |Total %
------------------------------------------------------------------------------------------------------------------------------------
CRIMINLTY
| 56 22| 792 24| 508 29| 64 24| 1420 26 | 5 17| 33 18| 18 25| 2 13| 58 19 | 1478 25
ALCOHOLISM
| 19 7| 327 10| 273 16| 42 16| 661 12 | 3 10| 28 16| 13 18| 1 6| 45 15 | 706 12
DRUG ABUSE
| 16 6| 165 5| 68 4| 5 2| 254 5 | 2 7| 16 9| 5 7| 0 0| 23 8 | 277 5
DOMINERING
| 1 0| 13 0| 12 1| 0 0| 26 0 | 5 17| 10 6| 5 7| 2 13| 22 7 | 48 1
MIGRANT
| 3 1| 47 1| 42 2| 0 0| 92 2 | 1 3| 2 1| 2 3| 0 0| 5 2 | 97 2
INFL BTGS
| 7 3| 137 4| 66 4| 16 6| 226 4 | 2 7| 19 11| 5 7| 2 13| 28 9 | 254 4
PERMISSIVE
| 0 0| 8 0| 14 1| 2 1| 24 0 | 2 7| 4 2| 2 3| 0 0| 8 3 | 32 1
FATH ABSNT
| 119 47| 1432 44| 628 36| 109 41| 2288 41 | 6 20| 46 26| 15 21| 7 44| 74 25 | 2362 41
MOTH ABSNT
| 28 11| 289 9| 136 8| 30 11| 483 9 | 2 7| 14 8| 2 3| 1 6| 19 6 | 502 9
NONE
| 5 2| 38 1| 11 1| 0 0| 54 1 | 2 7| 7 4| 6 8| 1 6| 16 5 | 70 1
------------------------------------------------------------------------------------------------------------------------------------
Total reported
| 254 100| 3248 100| 1758 100| 268 100| 5528 100 | 30 100| 179 100| 73 100| 16 100| 298 100 | 5826 100
|
|
|
|
|
|
|
|
|
|
|
Percent reported |
77.3|
68.7|
60.7|
49.0|
64.8 | 100.0|
67.4|
60.8|
42.3|
64.0 |
64.7
|
|
|
|
|
|
|
|
|
|
|
|
|
|
|
|
|
|
|
|
|
|
OTHER
| 45 | 947 | 794 | 200 | 1986
| 0 | 42 | 29 | 15 | 86
| 2072
------------------------------------------------------------------------------------------------------------------------------------
Total
| 198 | 3027 | 2021 | 392 | 5638
| 10 | 129 | 74 | 26 | 239
| 5877
* NOTE: SINCE THERE CAN BE UP TO FIVE BEHAVIOR CODES PER INMATE, THE NUMBER OF CASES REPORTED IN THE DETAIL LINES AND THE TOTAL REPORTED LINE MAY EXCEED THE TOTAL NUMBER OF CASES. IN SHORT, THIS TABLE COUNTS THE NUMBER OF BEHAVIOR PROBLEMS, NOT INMATES.
Georgia Department of Corrections
June, 2000
18
Page 16 Run 06/20/00
Georgia Department of Corrections Office of Planning and Analysis Inmate statistical profile
Sample: ACTIVE PRISONERS WITH LIFE SENTENCES EXCLUDING JAIL
Requestor:
Active inmates 06/20/2000
Inmate Diagnostic Behavior Problem * by current age & sex
Statistics
|
MEN
|
WOMEN
|
| Age | Age | Age | Age | Men
| Age | Age | Age | Age |Women
|Grand
Diagnostic Problem |00-21 %|22-39 %|40-54 %|55-99 %|Total % |00-21 %|22-39 %|40-54 %|55-99 %|Total % |Total %
------------------------------------------------------------------------------------------------------------------------------------
ALCOHOLIC
| 1 0| 140 3| 137 4| 37 6| 315 3 | 1 4| 3 1| 13 10| 1 3| 18 5 | 333 3
ALCOH ABSE
| 40 10| 900 17| 622 17| 108 18| 1670 17 | 1 4| 32 15| 13 10| 6 18| 52 13 | 1722 17
DRUG EXP
| 68 18| 742 14| 343 10| 35 6| 1188 12 | 2 8| 22 10| 11 9| 0 0| 35 9 | 1223 12
DRUG ABSE
| 69 18| 967 18| 630 18| 36 6| 1702 17 | 5 21| 44 21| 21 17| 1 3| 71 18 | 1773 17
NARC ADDCT
| 1 0| 103 2| 93 3| 4 1| 201 2 | 0 0| 5 2| 1 1| 1 3| 7 2 | 208 2
EPILEPTIC
| 1 0| 27 1| 25 1| 3 1| 56 1 | 0 0| 0 0| 2 2| 0 0| 2 1 | 58 1
MANIPULTVE
| 22 6| 207 4| 102 3| 19 3| 350 4 | 1 4| 2 1| 0 0| 1 3| 4 1 | 354 3
ASSAULTIVE
| 133 35| 1283 24| 894 25| 161 27| 2471 25 | 7 29| 51 24| 27 22| 6 18| 91 23 | 2562 25
ESCPE TEND
| 7 2| 115 2| 207 6| 38 6| 367 4 | 0 0| 3 1| 3 2| 0 0| 6 2 | 373 4
SUICIDAL
| 12 3| 140 3| 104 3| 13 2| 269 3 | 4 17| 15 7| 7 6| 2 6| 28 7 | 297 3
WITHDRAWN
| 0 0| 35 1| 19 1| 8 1| 62 1 | 1 4| 2 1| 3 2| 0 0| 6 2 | 68 1
PR RLTY CT
| 1 0| 37 1| 48 1| 10 2| 96 1 | 1 4| 1 0| 2 2| 1 3| 5 1 | 101 1
HOMOSEXUAL
| 1 0| 12 0| 9 0| 5 1| 27 0 | 1 4| 4 2| 2 2| 0 0| 7 2 | 34 0
NONE
| 1 0| 312 6| 234 7| 67 11| 614 6 | 0 0| 12 6| 13 10| 10 29| 35 9 | 649 6
OTHER
| 4 1| 74 1| 57 2| 22 4| 157 2 | 0 0| 0 0| 0 0| 3 9| 3 1 | 160 2
NOT RPTD
| 20 5| 186 4| 65 2| 24 4| 295 3 | 0 0| 18 8| 6 5| 2 6| 26 7 | 321 3
------------------------------------------------------------------------------------------------------------------------------------
Total reported
| 381 100| 5289 100| 3590 100| 591 100| 9851 100 | 24 100| 214 100| 125 100| 34 100| 397 100 |10248 100
|
|
|
|
|
|
|
|
|
|
|
Percent reported | 100.0|
99.7| 100.0|
99.7|
99.8 | 100.0| 100.0|
98.6| 100.0|
99.6 |
99.8
|
|
|
|
|
|
|
|
|
|
|
|
|
|
|
|
|
|
|
|
|
|
UNKNOWN
| 0 | 9 | 1 | 1 | 11
|0|0|1|0|1
| 12
------------------------------------------------------------------------------------------------------------------------------------
Total
| 198 | 3027 | 2021 | 392 | 5638
| 10 | 129 | 74 | 26 | 239
| 5877
* NOTE: SINCE THERE CAN BE UP TO FIVE BEHAVIOR CODES PER INMATE, THE NUMBER OF CASES REPORTED IN THE DETAIL LINES AND THE TOTAL REPORTED LINE MAY EXCEED THE TOTAL NUMBER OF CASES. IN SHORT, THIS TABLE COUNTS THE NUMBER OF BEHAVIOR PROBLEMS, NOT INMATES.
Georgia Department of Corrections
June, 2000
19
Page 17 Run 06/20/00
Georgia Department of Corrections Office of Planning and Analysis Inmate statistical profile
Sample: ACTIVE PRISONERS WITH LIFE SENTENCES EXCLUDING JAIL
Requestor:
Active inmates 06/20/2000
Physical Profile (General Condition) by current age & sex
Statistics
|
MEN
|
WOMEN
|
| Age | Age | Age | Age | Men
| Age | Age | Age | Age |Women
|Grand
Physical Profile |00-21 %|22-39 %|40-54 %|55-99 %|Total % |00-21 %|22-39 %|40-54 %|55-99 %|Total % |Total %
------------------------------------------------------------------------------------------------------------------------------------
NO LIMITATION
| 170 88| 2224 74| 1012 50| 70 18| 3476 62 | 9 100| 93 74| 34 47| 1 4| 137 60 | 3613 62
DEFECT NO MAJOR LIMT| 15 8| 420 14| 459 23| 98 25| 992 18 | 0 0| 5 4| 10 14| 5 22| 20 9 | 1012 17
DEFECT MAJOR LIMIT | 8 4| 342 11| 526 26| 189 49| 1065 19 | 0 0| 27 22| 28 38| 16 70| 71 31 | 1136 20
VERY MAJOR DEFECT | 0 0| 5 0| 12 1| 30 8| 47 1 | 0 0| 0 0| 1 1| 1 4| 2 1 | 49 1
------------------------------------------------------------------------------------------------------------------------------------
Total reported
| 193 100| 2991 100| 2009 100| 387 100| 5580 100 | 9 100| 125 100| 73 100| 23 100| 230 100 | 5810 100
|
|
|
|
|
|
|
|
|
|
|
Percent reported |
97.5|
98.8|
99.4|
98.7|
99.0 |
90.0|
96.9|
98.6|
88.5|
96.2 |
98.9
|
|
|
|
|
|
|
|
|
|
|
|
|
|
|
|
|
|
|
|
|
|
NOT REPORTED
| 5 | 36 | 12 | 5 | 58
|1|4|1|3|9
| 67
------------------------------------------------------------------------------------------------------------------------------------
Total
| 198 | 3027 | 2021 | 392 | 5638
| 10 | 129 | 74 | 26 | 239
| 5877
Georgia Department of Corrections
June, 2000
20
Page 18 Run 06/20/00
Georgia Department of Corrections Office of Planning and Analysis
Inmate statistical profile
Sample: ACTIVE PRISONERS WITH LIFE SENTENCES EXCLUDING JAIL Active inmates 06/20/2000
Security Status by current age & sex
Requestor: Statistics
|
MEN
|
WOMEN
|
| Age | Age | Age | Age | Men
| Age | Age | Age | Age |Women
|Grand
Security
|00-21 %|22-39 %|40-54 %|55-99 %|Total % |00-21 %|22-39 %|40-54 %|55-99 %|Total % |Total %
------------------------------------------------------------------------------------------------------------------------------------
DIAG INCOM
| 0 0| 3 0| 0 0| 0 0| 3 0 | 0 0| 0 0| 0 0| 0 0| 0 0 | 3 0
WRK RELEAS
| 0 0| 0 0| 0 0| 1 0| 1 0 | 0 0| 0 0| 0 0| 0 0| 0 0 | 1 0
TRUSTY
| 0 0| 69 2| 39 2| 4 1| 112 2 | 0 0| 0 0| 2 3| 1 4| 3 1 | 115 2
MINIMUM
| 0 0| 360 12| 417 21| 76 19| 853 15 | 0 0| 31 24| 22 30| 12 46| 65 27 | 918 16
MEDIUM
| 20 10| 1258 42| 1069 53| 240 61| 2587 46 | 0 0| 67 52| 41 55| 12 46| 120 50 | 2707 46
CLOSE
| 161 81| 1144 38| 391 19| 64 16| 1760 31 | 8 80| 31 24| 7 9| 1 4| 47 20 | 1807 31
MAXIMUM
| 7 4| 182 6| 102 5| 6 2| 297 5 | 1 10| 0 0| 2 3| 0 0| 3 1 | 300 5
DIAGNOSTIC
| 10 5| 11 0| 3 0| 1 0| 25 0 | 1 10| 0 0| 0 0| 0 0| 1 0 | 26 0
------------------------------------------------------------------------------------------------------------------------------------
Total reported
| 198 100| 3027 100| 2021 100| 392 100| 5638 100 | 10 100| 129 100| 74 100| 26 100| 239 100 | 5877 100
|
|
|
|
|
|
|
|
|
|
|
Percent reported | 100.0| 100.0| 100.0| 100.0| 100.0 | 100.0| 100.0| 100.0| 100.0| 100.0 | 100.0
|
|
|
|
|
|
|
|
|
|
|
|
|
|
|
|
|
|
|
|
|
|
NOT RPTD
|0|0|0|0|0
|0|0|0|0|0
|0
------------------------------------------------------------------------------------------------------------------------------------
Total
| 198 | 3027 | 2021 | 392 | 5638
| 10 | 129 | 74 | 26 | 239
| 5877
* NOTE: BEGINNING IN JULY 1987, THE FACILITIES DIVISION NO LONGER CODED INMATES AS BEING WORK RELEASE
Georgia Department of Corrections
June, 2000
21
Page 19 Run 06/20/00
Georgia Department of Corrections Office of Planning and Analysis
Inmate statistical profile
Sample: ACTIVE PRISONERS WITH LIFE SENTENCES EXCLUDING JAIL
Requestor:
Active inmates 06/20/2000
Number Of Sentences by current age & sex
Statistics
|
MEN
|
WOMEN
|
| Age | Age | Age | Age | Men
| Age | Age | Age | Age |Women
|Grand
Number Of Sentences |00-21 %|22-39 %|40-54 %|55-99 %|Total % |00-21 %|22-39 %|40-54 %|55-99 %|Total % |Total %
------------------------------------------------------------------------------------------------------------------------------------
ONE
| 63 32| 737 24| 531 26| 137 35| 1468 26 | 5 50| 51 40| 33 45| 13 50| 102 43 | 1570 27
TWO
| 51 26| 712 24| 465 23| 101 26| 1329 24 | 2 20| 40 31| 18 24| 8 31| 68 28 | 1397 24
THREE
| 32 16| 508 17| 364 18| 49 13| 953 17 | 1 10| 17 13| 11 15| 5 19| 34 14 | 987 17
FOUR
| 19 10| 357 12| 226 11| 39 10| 641 11 | 1 10| 9 7| 4 5| 0 0| 14 6 | 655 11
FIVE
| 9 5| 221 7| 143 7| 20 5| 393 7 | 1 10| 6 5| 3 4| 0 0| 10 4 | 403 7
MORE THAN FIVE
| 24 12| 492 16| 292 14| 46 12| 854 15 | 0 0| 6 5| 5 7| 0 0| 11 5 | 865 15
------------------------------------------------------------------------------------------------------------------------------------
Total reported
| 198 100| 3027 100| 2021 100| 392 100| 5638 100 | 10 100| 129 100| 74 100| 26 100| 239 100 | 5877 100
|
|
|
|
|
|
|
|
|
|
|
Percent reported | 100.0| 100.0| 100.0| 100.0| 100.0 | 100.0| 100.0| 100.0| 100.0| 100.0 | 100.0
|
|
|
|
|
|
|
|
|
|
|
|
|
|
|
|
|
|
|
|
|
|
NOT REPORTED
|0|0|0|0|0
|0|0|0|0|0
|0
------------------------------------------------------------------------------------------------------------------------------------
Total
| 198 | 3027 | 2021 | 392 | 5638
| 10 | 129 | 74 | 26 | 239
| 5877
|
|
|
|
|
|
|
|
|
|
|
|
|
|
|
|
|
|
|
|
|
|
|
|
|
|
|
|
|
|
|
|
|
|
|
|
|
|
|
|
|
|
|
|
|
|
|
|
|
|
|
|
|
|
|
AVG NUM SENTENCES | 2.89 | 3.41 | 3.30 | 2.88 | 3.32 | 2.10 | 2.34 | 2.28 | 1.69 | 2.24 | 3.27
Georgia Department of Corrections
June, 2000
22
Page 20 Run 06/20/00
Georgia Department of Corrections Office of Planning and Analysis Inmate statistical profile
Sample: ACTIVE PRISONERS WITH LIFE SENTENCES EXCLUDING JAIL
Requestor:
Active inmates 06/20/2000
Number Of Disciplinaries by current age & sex
Statistics
|
MEN
|
WOMEN
|
| Age | Age | Age | Age | Men
| Age | Age | Age | Age |Women
|Grand
Disciplinaries
|00-21 %|22-39 %|40-54 %|55-99 %|Total % |00-21 %|22-39 %|40-54 %|55-99 %|Total % |Total %
------------------------------------------------------------------------------------------------------------------------------------
ZERO
| 48 24| 486 16| 346 17| 116 30| 996 18 | 3 30| 24 19| 26 35| 12 46| 65 27 | 1061 18
ONE
| 21 11| 317 10| 268 13| 66 17| 672 12 | 0 0| 15 12| 9 12| 6 23| 30 13 | 702 12
TWO
| 18 9| 240 8| 179 9| 48 12| 485 9 | 1 10| 15 12| 10 14| 1 4| 27 11 | 512 9
THREE
| 9 5| 200 7| 149 7| 33 8| 391 7 | 0 0| 7 5| 8 11| 2 8| 17 7 | 408 7
FOUR
| 6 3| 176 6| 109 5| 24 6| 315 6 | 2 20| 10 8| 2 3| 2 8| 16 7 | 331 6
FIVE
| 9 5| 147 5| 89 4| 10 3| 255 5 | 0 0| 2 2| 3 4| 0 0| 5 2 | 260 4
MORE THAN FIVE
| 87 44| 1459 48| 880 44| 95 24| 2521 45 | 4 40| 56 43| 16 22| 3 12| 79 33 | 2600 44
------------------------------------------------------------------------------------------------------------------------------------
Total reported
| 198 100| 3025 100| 2020 100| 392 100| 5635 100 | 10 100| 129 100| 74 100| 26 100| 239 100 | 5874 100
|
|
|
|
|
|
|
|
|
|
|
Percent reported | 100.0|
99.9| 100.0| 100.0|
99.9 | 100.0| 100.0| 100.0| 100.0| 100.0 |
99.9
|
|
|
|
|
|
|
|
|
|
|
|
|
|
|
|
|
|
|
|
|
|
NOT REPORTED
|0|2|1|0|3
|0|0|0|0|0
|3
------------------------------------------------------------------------------------------------------------------------------------
Total
| 198 | 3027 | 2021 | 392 | 5638
| 10 | 129 | 74 | 26 | 239
| 5877
|
|
|
|
|
|
|
|
|
|
|
|
|
|
|
|
|
|
|
|
|
|
|
|
|
|
|
|
|
|
|
|
|
|
|
|
|
|
|
|
|
|
|
|
|
|
|
|
|
|
|
|
|
|
|
AVG NUM DISCIP
| 9.82 | 10.29 | 9.88 | 5.04 | 9.76 | 4.40 | 8.61 | 3.30 | 1.88 | 6.06 | 9.61
Georgia Department of Corrections
June, 2000
23
Page 21 Run 06/20/00
Georgia Department of Corrections Office of Planning and Analysis
Inmate statistical profile
Sample: ACTIVE PRISONERS WITH LIFE SENTENCES EXCLUDING JAIL Active inmates 06/20/2000
Number Of Escapes by current age & sex
Requestor: Statistics
|
MEN
|
WOMEN
|
| Age | Age | Age | Age | Men
| Age | Age | Age | Age |Women
|Grand
Escapes
|00-21 %|22-39 %|40-54 %|55-99 %|Total % |00-21 %|22-39 %|40-54 %|55-99 %|Total % |Total %
------------------------------------------------------------------------------------------------------------------------------------
ZERO
| 198 100| 2990 99| 1935 96| 375 96| 5498 98 | 10 100| 129 100| 72 97| 26 100| 237 99 | 5735 98
ONE
| 0 0| 36 1| 67 3| 12 3| 115 2 | 0 0| 0 0| 2 3| 0 0| 2 1 | 117 2
TWO
| 0 0| 1 0| 15 1| 3 1| 19 0 | 0 0| 0 0| 0 0| 0 0| 0 0 | 19 0
THREE
| 0 0| 0 0| 3 0| 2 1| 5 0 | 0 0| 0 0| 0 0| 0 0| 0 0 | 5 0
FOUR
| 0 0| 0 0| 1 0| 0 0| 1 0 | 0 0| 0 0| 0 0| 0 0| 0 0 | 1 0
FIVE
| 0 0| 0 0| 0 0| 0 0| 0 0 | 0 0| 0 0| 0 0| 0 0| 0 0 | 0 0
MORE THAN FIVE
| 0 0| 0 0| 0 0| 0 0| 0 0 | 0 0| 0 0| 0 0| 0 0| 0 0 | 0 0
------------------------------------------------------------------------------------------------------------------------------------
Total reported
| 198 100| 3027 100| 2021 100| 392 100| 5638 100 | 10 100| 129 100| 74 100| 26 100| 239 100 | 5877 100
|
|
|
|
|
|
|
|
|
|
|
Percent reported | 100.0| 100.0| 100.0| 100.0| 100.0 | 100.0| 100.0| 100.0| 100.0| 100.0 | 100.0
|
|
|
|
|
|
|
|
|
|
|
|
|
|
|
|
|
|
|
|
|
|
NOT REPORTED
|0|0|0|0|0
|0|0|0|0|0
|0
------------------------------------------------------------------------------------------------------------------------------------
Total
| 198 | 3027 | 2021 | 392 | 5638
| 10 | 129 | 74 | 26 | 239
| 5877
|
|
|
|
|
|
|
|
|
|
|
|
|
|
|
|
|
|
|
|
|
|
|
|
|
|
|
|
|
|
|
|
|
|
|
|
|
|
|
|
|
|
|
|
|
|
|
|
|
|
|
|
|
|
|
AVG NUM ESCAPES
| .00 | .01 | .05 | .06 | .03 | .00 | .00 | .03 | .00 | .01 | .03
Georgia Department of Corrections
June, 2000
24
Page 22 Run 06/20/00
Georgia Department of Corrections Office of Planning and Analysis
Inmate statistical profile
Sample: ACTIVE PRISONERS WITH LIFE SENTENCES EXCLUDING JAIL
Requestor:
Active inmates 06/20/2000
Number Of Prior Georgia Incarcerations * by current age & sex
Statistics
|
MEN
|
WOMEN
|
| Age | Age | Age | Age | Men
| Age | Age | Age | Age |Women
|Grand
Prior Incarcerations|00-21 %|22-39 %|40-54 %|55-99 %|Total % |00-21 %|22-39 %|40-54 %|55-99 %|Total % |Total %
------------------------------------------------------------------------------------------------------------------------------------
ZERO
| 192 97| 2024 67| 907 45| 220 56| 3343 59 | 10 100| 105 81| 58 78| 23 88| 196 82 | 3539 60
ONE
| 6 3| 580 19| 508 25| 92 23| 1186 21 | 0 0| 17 13| 10 14| 2 8| 29 12 | 1215 21
TWO
| 0 0| 230 8| 325 16| 38 10| 593 11 | 0 0| 4 3| 5 7| 1 4| 10 4 | 603 10
THREE
| 0 0| 127 4| 166 8| 27 7| 320 6 | 0 0| 2 2| 0 0| 0 0| 2 1 | 322 5
FOUR
| 0 0| 50 2| 66 3| 11 3| 127 2 | 0 0| 0 0| 0 0| 0 0| 0 0 | 127 2
FIVE
| 0 0| 12 0| 31 2| 2 1| 45 1 | 0 0| 0 0| 0 0| 0 0| 0 0 | 45 1
MORE THAN FIVE
| 0 0| 4 0| 18 1| 2 1| 24 0 | 0 0| 1 1| 1 1| 0 0| 2 1 | 26 0
------------------------------------------------------------------------------------------------------------------------------------
Total reported
| 198 100| 3027 100| 2021 100| 392 100| 5638 100 | 10 100| 129 100| 74 100| 26 100| 239 100 | 5877 100
|
|
|
|
|
|
|
|
|
|
|
Percent reported | 100.0| 100.0| 100.0| 100.0| 100.0 | 100.0| 100.0| 100.0| 100.0| 100.0 | 100.0
|
|
|
|
|
|
|
|
|
|
|
|
|
|
|
|
|
|
|
|
|
|
NOT REPORTED
|0|0|0|0|0
|0|0|0|0|0
|0
------------------------------------------------------------------------------------------------------------------------------------
Total
| 198 | 3027 | 2021 | 392 | 5638
| 10 | 129 | 74 | 26 | 239
| 5877
|
|
|
|
|
|
|
|
|
|
|
|
|
|
|
|
|
|
|
|
|
|
|
|
|
|
|
|
|
|
|
|
|
|
|
|
|
|
|
|
|
|
|
|
|
|
|
|
|
|
|
|
|
|
|
AVG # INCARCERATIONS| .03 | .56 | 1.08 | .81 | .75 | .00 | .29 | .36 | .15 | .29 | .73
* This data counts a parole revocation on an existing sentenCE AS A prior incarceration. Also, this data counts, for any cohort of inmates, the total number of Georgia incarcerations the inmate has had during his entire criminal career. For example, if an inmate was admitted to prison first in FY72, and then re-admitted in FY79 and FY85, he had two prior incarcerations before the FY85 admission. This inmate's records show two prior incarcerations in all three of his records since he has had two prior incarcerations in his criminal career. If the cohort of FY72 admissions is selected for analysis, two
prior incarcerations will be listed for this inmate even though in FY72, he had no prior incarcerations.
Georgia Department of Corrections
June, 2000
25
Page 23 Run 06/20/00
Georgia Department of Corrections Office of Planning and Analysis
Inmate statistical profile
Sample: ACTIVE PRISONERS WITH LIFE SENTENCES EXCLUDING JAIL
Requestor:
Active inmates 06/20/2000
Number Of Transfers by current age & sex
Statistics
|
MEN
|
WOMEN
|
| Age | Age | Age | Age | Men
| Age | Age | Age | Age |Women
|Grand
Transfers
|00-21 %|22-39 %|40-54 %|55-99 %|Total % |00-21 %|22-39 %|40-54 %|55-99 %|Total % |Total %
------------------------------------------------------------------------------------------------------------------------------------
ZERO
| 47 24| 79 3| 15 1| 3 1| 144 3 | 3 30| 5 4| 5 7| 0 0| 13 5 | 157 3
ONE
| 98 49| 903 30| 397 20| 83 21| 1481 26 | 5 50| 37 29| 27 36| 5 19| 74 31 | 1555 26
TWO
| 39 20| 646 21| 362 18| 69 18| 1116 20 | 1 10| 42 33| 13 18| 6 23| 62 26 | 1178 20
THREE
| 10 5| 474 16| 276 14| 64 16| 824 15 | 1 10| 20 16| 14 19| 5 19| 40 17 | 864 15
FOUR
| 2 1| 325 11| 216 11| 35 9| 578 10 | 0 0| 12 9| 6 8| 4 15| 22 9 | 600 10
FIVE
| 2 1| 215 7| 158 8| 32 8| 407 7 | 0 0| 6 5| 3 4| 3 12| 12 5 | 419 7
MORE THAN FIVE
| 0 0| 385 13| 597 30| 106 27| 1088 19 | 0 0| 7 5| 6 8| 3 12| 16 7 | 1104 19
------------------------------------------------------------------------------------------------------------------------------------
Total reported
| 198 100| 3027 100| 2021 100| 392 100| 5638 100 | 10 100| 129 100| 74 100| 26 100| 239 100 | 5877 100
|
|
|
|
|
|
|
|
|
|
|
Percent reported | 100.0| 100.0| 100.0| 100.0| 100.0 | 100.0| 100.0| 100.0| 100.0| 100.0 | 100.0
|
|
|
|
|
|
|
|
|
|
|
|
|
|
|
|
|
|
|
|
|
|
NOT REPORTED
|0|0|0|0|0
|0|0|0|0|0
|0
------------------------------------------------------------------------------------------------------------------------------------
Total
| 198 | 3027 | 2021 | 392 | 5638
| 10 | 129 | 74 | 26 | 239
| 5877
|
|
|
|
|
|
|
|
|
|
|
|
|
|
|
|
|
|
|
|
|
|
|
|
|
|
|
|
|
|
|
|
|
|
|
|
|
|
|
|
|
|
|
|
|
|
|
|
|
|
|
|
|
|
|
AVG NUM TRANSFERS | 1.13 | 2.98 | 4.47 | 4.38 | 3.55 | 1.00 | 2.40 | 2.36 | 3.42 | 2.44 | 3.50
Georgia Department of Corrections
June, 2000
26
Georgia Department of Corrections
Page 24 Run 06/20/00
Office of Planning and Analysis
Inmate statistical profile
Sample: ACTIVE PRISONERS WITH LIFE SENTENCES EXCLUDING JAIL
Active inmates 06/20/2000
County Of Conviction by current age & sex
Requestor:
Statistics
|
MEN
|
WOMEN
|
| Age | Age | Age | Age | Men
| Age | Age | Age | Age |Women
|Grand
County Of Conviction|00-21 %|22-39 %|40-54 %|55-99 %|Total % |00-21 %|22-39 %|40-54 %|55-99 %|Total % |Total %
------------------------------------------------------------------------------------------------------------------------------------
APPLING COUNTY
| 0 0| 4 0| 5 0| 0 0| 9 0 | 0 0| 0 0| 0 0| 0 0| 0 0 | 9 0
ATKINSON COUNTY
| 0 0| 1 0| 2 0| 2 1| 5 0 | 0 0| 0 0| 1 1| 0 0| 1 0 | 6 0
BACON COUNTY
| 0 0| 7 0| 3 0| 0 0| 10 0 | 0 0| 0 0| 0 0| 0 0| 0 0 | 10 0
BAKER COUNTY
| 0 0| 1 0| 1 0| 0 0| 2 0 | 0 0| 0 0| 0 0| 0 0| 0 0 | 2 0
BALDWIN COUNTY
| 2 1| 16 1| 11 1| 2 1| 31 1 | 0 0| 1 1| 0 0| 0 0| 1 0 | 32 1
BANKS COUNTY
| 0 0| 2 0| 8 0| 2 1| 12 0 | 0 0| 0 0| 0 0| 0 0| 0 0 | 12 0
BARROW COUNTY
| 0 0| 3 0| 10 0| 4 1| 17 0 | 0 0| 0 0| 1 1| 0 0| 1 0 | 18 0
BARTOW COUNTY
| 2 1| 29 1| 21 1| 3 1| 55 1 | 0 0| 2 2| 0 0| 0 0| 2 1 | 57 1
BEN HILL COUNTY
| 0 0| 7 0| 9 0| 3 1| 19 0 | 0 0| 0 0| 0 0| 0 0| 0 0 | 19 0
BERRIEN COUNTY
| 0 0| 4 0| 1 0| 0 0| 5 0 | 0 0| 0 0| 0 0| 0 0| 0 0 | 5 0
BIBB COUNTY
| 4 2| 89 3| 85 4| 14 4| 192 3 | 1 10| 2 2| 1 1| 1 4| 5 2 | 197 3
BLECKLEY COUNTY
| 0 0| 7 0| 4 0| 1 0| 12 0 | 0 0| 0 0| 1 1| 0 0| 1 0 | 13 0
BRANTLEY COUNTY
| 0 0| 1 0| 4 0| 2 1| 7 0 | 0 0| 0 0| 0 0| 0 0| 0 0 | 7 0
BROOKS COUNTY
| 0 0| 6 0| 5 0| 1 0| 12 0 | 0 0| 0 0| 0 0| 0 0| 0 0 | 12 0
BRYAN COUNTY
| 1 1| 8 0| 6 0| 1 0| 16 0 | 0 0| 0 0| 0 0| 1 4| 1 0 | 17 0
BULLOCH COUNTY
| 1 1| 19 1| 16 1| 0 0| 36 1 | 0 0| 1 1| 1 1| 1 4| 3 1 | 39 1
BURKE COUNTY
| 1 1| 14 0| 12 1| 1 0| 28 0 | 0 0| 0 0| 0 0| 0 0| 0 0 | 28 0
BUTTS COUNTY
| 4 2| 22 1| 9 0| 2 1| 37 1 | 0 0| 3 2| 0 0| 0 0| 3 1 | 40 1
CALHOUN COUNTY
| 1 1| 2 0| 3 0| 1 0| 7 0 | 0 0| 0 0| 0 0| 0 0| 0 0 | 7 0
CAMDEN COUNTY
| 1 1| 21 1| 7 0| 0 0| 29 1 | 0 0| 0 0| 1 1| 0 0| 1 0 | 30 1
CANDLER COUNTY
| 0 0| 1 0| 1 0| 0 0| 2 0 | 0 0| 0 0| 0 0| 0 0| 0 0 | 2 0
CARROLL COUNTY
| 1 1| 16 1| 12 1| 6 2| 35 1 | 0 0| 2 2| 1 1| 0 0| 3 1 | 38 1
CATOOSA COUNTY
| 0 0| 5 0| 8 0| 0 0| 13 0 | 0 0| 0 0| 0 0| 0 0| 0 0 | 13 0
CHARLTON COUNTY
| 0 0| 1 0| 0 0| 0 0| 1 0 | 0 0| 2 2| 0 0| 0 0| 2 1 | 3 0
CHATHAM COUNTY
| 7 4| 161 5| 102 5| 14 4| 284 5 | 0 0| 3 2| 0 0| 0 0| 3 1 | 287 5
CHATTAHOOCHEE COUNTY| 0 0| 0 0| 2 0| 0 0| 2 0 | 0 0| 0 0| 0 0| 0 0| 0 0 | 2 0
CHATTOOGA COUNTY | 0 0| 5 0| 6 0| 1 0| 12 0 | 0 0| 0 0| 1 1| 1 4| 2 1 | 14 0
CHEROKEE COUNTY
| 2 1| 8 0| 21 1| 2 1| 33 1 | 0 0| 3 2| 0 0| 0 0| 3 1 | 36 1
CLARKE COUNTY
| 2 1| 42 1| 23 1| 8 2| 75 1 | 0 0| 2 2| 0 0| 1 4| 3 1 | 78 1
CLAY COUNTY
| 0 0| 1 0| 1 0| 0 0| 2 0 | 0 0| 0 0| 0 0| 0 0| 0 0 | 2 0
CLAYTON COUNTY
| 5 3| 69 2| 36 2| 10 3| 120 2 | 0 0| 2 2| 3 4| 0 0| 5 2 | 125 2
CLINCH COUNTY
| 0 0| 2 0| 3 0| 0 0| 5 0 | 0 0| 0 0| 0 0| 0 0| 0 0 | 5 0
COBB COUNTY
| 5 3| 112 4| 73 4| 14 4| 204 4 | 0 0| 5 4| 3 4| 1 4| 9 4 | 213 4
COFFEE COUNTY
| 0 0| 8 0| 10 0| 3 1| 21 0 | 0 0| 1 1| 1 1| 0 0| 2 1 | 23 0
COLQUITT COUNTY
| 3 2| 40 1| 22 1| 3 1| 68 1 | 0 0| 1 1| 0 0| 1 4| 2 1 | 70 1
COLUMBIA COUNTY
| 0 0| 6 0| 9 0| 2 1| 17 0 | 0 0| 0 0| 1 1| 0 0| 1 0 | 18 0
------------------------------------------------------------------------------------------------------------------------------------
(continued)
Georgia Department of Corrections
June, 2000
27
Georgia Department of Corrections
Page 25 Run 06/20/00
Office of Planning and Analysis
Inmate statistical profile
Sample: ACTIVE PRISONERS WITH LIFE SENTENCES EXCLUDING JAIL Active inmates 06/20/2000
County Of Conviction by current age & sex
Requestor: (CONTINUED)
Statistics
|
MEN
|
WOMEN
|
| Age | Age | Age | Age | Men
| Age | Age | Age | Age |Women
|Grand
County Of Conviction|00-21 %|22-39 %|40-54 %|55-99 %|Total % |00-21 %|22-39 %|40-54 %|55-99 %|Total % |Total %
------------------------------------------------------------------------------------------------------------------------------------
COOK COUNTY
| 0 0| 7 0| 3 0| 0 0| 10 0 | 0 0| 2 2| 0 0| 0 0| 2 1 | 12 0
COWETA COUNTY
| 5 3| 23 1| 9 0| 3 1| 40 1 | 0 0| 2 2| 1 1| 0 0| 3 1 | 43 1
CRAWFORD COUNTY
| 0 0| 3 0| 0 0| 0 0| 3 0 | 0 0| 0 0| 0 0| 0 0| 0 0 | 3 0
CRISP COUNTY
| 3 2| 14 0| 12 1| 1 0| 30 1 | 0 0| 3 2| 0 0| 2 8| 5 2 | 35 1
DADE COUNTY
| 0 0| 5 0| 6 0| 2 1| 13 0 | 0 0| 0 0| 0 0| 0 0| 0 0 | 13 0
DAWSON COUNTY
| 0 0| 3 0| 3 0| 1 0| 7 0 | 0 0| 0 0| 0 0| 0 0| 0 0 | 7 0
DECATUR COUNTY
| 2 1| 21 1| 5 0| 1 0| 29 1 | 0 0| 1 1| 0 0| 0 0| 1 0 | 30 1
DEKALB COUNTY
| 16 8| 247 8| 156 8| 18 5| 437 8 | 1 10| 3 2| 3 4| 1 4| 8 3 | 445 8
DODGE COUNTY
| 0 0| 6 0| 5 0| 1 0| 12 0 | 0 0| 0 0| 0 0| 0 0| 0 0 | 12 0
DOOLY COUNTY
| 2 1| 8 0| 7 0| 0 0| 17 0 | 0 0| 0 0| 0 0| 0 0| 0 0 | 17 0
DOUGHERTY COUNTY | 6 3| 71 2| 38 2| 4 1| 119 2 | 0 0| 5 4| 0 0| 0 0| 5 2 | 124 2
DOUGLAS COUNTY
| 3 2| 48 2| 18 1| 5 1| 74 1 | 0 0| 1 1| 1 1| 0 0| 2 1 | 76 1
EARLY COUNTY
| 0 0| 10 0| 5 0| 2 1| 17 0 | 0 0| 0 0| 0 0| 0 0| 0 0 | 17 0
ECHOLS COUNTY.
| 0 0| 0 0| 0 0| 0 0| 0 0 | 0 0| 0 0| 0 0| 0 0| 0 0 | 0 0
EFFINGHAM COUNTY | 0 0| 5 0| 3 0| 0 0| 8 0 | 0 0| 0 0| 0 0| 0 0| 0 0 | 8 0
ELBERT COUNTY
| 0 0| 13 0| 8 0| 1 0| 22 0 | 0 0| 1 1| 0 0| 0 0| 1 0 | 23 0
EMANUEL COUNTY
| 1 1| 8 0| 10 0| 2 1| 21 0 | 0 0| 1 1| 0 0| 0 0| 1 0 | 22 0
EVANS COUNTY
| 0 0| 7 0| 4 0| 2 1| 13 0 | 0 0| 0 0| 0 0| 0 0| 0 0 | 13 0
FANNIN COUNTY
| 0 0| 4 0| 5 0| 1 0| 10 0 | 0 0| 0 0| 0 0| 0 0| 0 0 | 10 0
FAYETTE COUNTY
| 1 1| 6 0| 5 0| 0 0| 12 0 | 0 0| 0 0| 0 0| 0 0| 0 0 | 12 0
FLOYD COUNTY
| 2 1| 31 1| 26 1| 4 1| 63 1 | 1 10| 3 2| 2 3| 1 4| 7 3 | 70 1
FORSYTH COUNTY
| 0 0| 6 0| 8 0| 3 1| 17 0 | 0 0| 1 1| 1 1| 0 0| 2 1 | 19 0
FRANKLIN COUNTY
| 1 1| 2 0| 3 0| 1 0| 7 0 | 0 0| 0 0| 2 3| 1 4| 3 1 | 10 0
FULTON COUNTY
| 27 14| 463 15| 305 15| 60 15| 855 15 | 3 30| 12 9| 6 8| 5 19| 26 11 | 881 15
GILMER COUNTY
| 0 0| 1 0| 1 0| 3 1| 5 0 | 0 0| 0 0| 0 0| 0 0| 0 0 | 5 0
GLASCOCK COUNTY
| 0 0| 0 0| 0 0| 0 0| 0 0 | 0 0| 0 0| 0 0| 0 0| 0 0 | 0 0
GLYNN COUNTY
| 6 3| 33 1| 26 1| 3 1| 68 1 | 0 0| 2 2| 2 3| 0 0| 4 2 | 72 1
GORDON COUNTY
| 0 0| 22 1| 13 1| 2 1| 37 1 | 0 0| 1 1| 0 0| 0 0| 1 0 | 38 1
GRADY COUNTY
| 3 2| 15 0| 10 0| 1 0| 29 1 | 0 0| 0 0| 0 0| 0 0| 0 0 | 29 0
GREENE COUNTY
| 1 1| 2 0| 5 0| 1 0| 9 0 | 0 0| 0 0| 0 0| 0 0| 0 0 | 9 0
GWINNETT COUNTY
| 2 1| 73 2| 39 2| 7 2| 121 2 | 0 0| 2 2| 4 5| 1 4| 7 3 | 128 2
HABERSHAM COUNTY | 2 1| 12 0| 9 0| 0 0| 23 0 | 0 0| 0 0| 0 0| 0 0| 0 0 | 23 0
HALL COUNTY
| 2 1| 43 1| 35 2| 10 3| 90 2 | 1 10| 3 2| 1 1| 1 4| 6 3 | 96 2
HANCOCK COUNTY
| 0 0| 3 0| 1 0| 0 0| 4 0 | 0 0| 0 0| 1 1| 0 0| 1 0 | 5 0
HARALSON COUNTY
| 0 0| 4 0| 2 0| 2 1| 8 0 | 0 0| 0 0| 0 0| 0 0| 0 0 | 8 0
------------------------------------------------------------------------------------------------------------------------------------
(continued)
Georgia Department of Corrections
June, 2000
28
Page 26 Run 06/20/00
Georgia Department of Corrections Office of Planning and Analysis
Inmate statistical profile
Sample: ACTIVE PRISONERS WITH LIFE SENTENCES EXCLUDING JAIL Active inmates 06/20/2000
County Of Conviction by current age & sex
Requestor: (CONTINUED)
Statistics
|
MEN
|
WOMEN
|
| Age | Age | Age | Age | Men
| Age | Age | Age | Age |Women
|Grand
County Of Conviction|00-21 %|22-39 %|40-54 %|55-99 %|Total % |00-21 %|22-39 %|40-54 %|55-99 %|Total % |Total %
------------------------------------------------------------------------------------------------------------------------------------
HARRIS COUNTY
| 1 1| 8 0| 3 0| 0 0| 12 0 | 0 0| 0 0| 0 0| 0 0| 0 0 | 12 0
HART COUNTY
| 0 0| 3 0| 2 0| 0 0| 5 0 | 0 0| 0 0| 0 0| 0 0| 0 0 | 5 0
HEARD COUNTY
| 0 0| 2 0| 0 0| 3 1| 5 0 | 0 0| 0 0| 0 0| 0 0| 0 0 | 5 0
HENRY COUNTY
| 0 0| 23 1| 9 0| 1 0| 33 1 | 0 0| 1 1| 0 0| 0 0| 1 0 | 34 1
HOUSTON COUNTY
| 0 0| 41 1| 18 1| 3 1| 62 1 | 0 0| 4 3| 3 4| 1 4| 8 3 | 70 1
IRWIN COUNTY
| 0 0| 3 0| 1 0| 1 0| 5 0 | 0 0| 0 0| 0 0| 0 0| 0 0 | 5 0
JACKSON COUNTY
| 1 1| 6 0| 14 1| 1 0| 22 0 | 0 0| 1 1| 0 0| 0 0| 1 0 | 23 0
JASPER COUNTY
| 0 0| 8 0| 0 0| 0 0| 8 0 | 0 0| 0 0| 1 1| 0 0| 1 0 | 9 0
JEFF DAVIS COUNTY | 0 0| 4 0| 4 0| 2 1| 10 0 | 0 0| 0 0| 0 0| 0 0| 0 0 | 10 0
JEFFERSON COUNTY | 0 0| 9 0| 4 0| 4 1| 17 0 | 0 0| 0 0| 0 0| 0 0| 0 0 | 17 0
JENKINS COUNTY
| 0 0| 2 0| 4 0| 0 0| 6 0 | 0 0| 0 0| 0 0| 0 0| 0 0 | 6 0
JOHNSON COUNTY
| 0 0| 9 0| 2 0| 1 0| 12 0 | 0 0| 1 1| 0 0| 0 0| 1 0 | 13 0
JONES COUNTY
| 0 0| 1 0| 6 0| 3 1| 10 0 | 0 0| 0 0| 0 0| 0 0| 0 0 | 10 0
LAMAR COUNTY
| 0 0| 9 0| 10 0| 3 1| 22 0 | 0 0| 0 0| 1 1| 0 0| 1 0 | 23 0
LANIER COUNTY
| 0 0| 1 0| 0 0| 0 0| 1 0 | 0 0| 0 0| 0 0| 0 0| 0 0 | 1 0
LAURENS COUNTY
| 1 1| 13 0| 7 0| 1 0| 22 0 | 0 0| 1 1| 2 3| 0 0| 3 1 | 25 0
LEE COUNTY
| 0 0| 2 0| 0 0| 0 0| 2 0 | 1 10| 0 0| 0 0| 0 0| 1 0 | 3 0
LIBERTY COUNTY
| 2 1| 22 1| 9 0| 4 1| 37 1 | 0 0| 3 2| 0 0| 0 0| 3 1 | 40 1
LINCOLN COUNTY
| 1 1| 2 0| 2 0| 0 0| 5 0 | 0 0| 0 0| 0 0| 0 0| 0 0 | 5 0
LONG COUNTY
| 1 1| 7 0| 3 0| 2 1| 13 0 | 0 0| 1 1| 0 0| 0 0| 1 0 | 14 0
LOWNDES COUNTY
| 0 0| 40 1| 26 1| 1 0| 67 1 | 0 0| 0 0| 2 3| 1 4| 3 1 | 70 1
LUMPKIN COUNTY
| 1 1| 3 0| 0 0| 2 1| 6 0 | 0 0| 0 0| 0 0| 0 0| 0 0 | 6 0
MACON COUNTY
| 1 1| 16 1| 7 0| 0 0| 24 0 | 0 0| 0 0| 0 0| 0 0| 0 0 | 24 0
MADISON COUNTY
| 0 0| 6 0| 3 0| 3 1| 12 0 | 0 0| 2 2| 0 0| 0 0| 2 1 | 14 0
MARION COUNTY
| 0 0| 2 0| 1 0| 0 0| 3 0 | 0 0| 0 0| 1 1| 0 0| 1 0 | 4 0
MCDUFFIE COUNTY
| 1 1| 30 1| 10 0| 4 1| 45 1 | 1 10| 1 1| 0 0| 0 0| 2 1 | 47 1
MCINTOSH COUNTY
| 1 1| 8 0| 8 0| 0 0| 17 0 | 0 0| 0 0| 0 0| 0 0| 0 0 | 17 0
MERIWETHER COUNTY | 0 0| 9 0| 9 0| 3 1| 21 0 | 0 0| 2 2| 0 0| 1 4| 3 1 | 24 0
MILLER COUNTY
| 0 0| 2 0| 2 0| 0 0| 4 0 | 0 0| 0 0| 0 0| 0 0| 0 0 | 4 0
MITCHELL COUNTY
| 0 0| 11 0| 9 0| 2 1| 22 0 | 0 0| 2 2| 0 0| 0 0| 2 1 | 24 0
MONROE COUNTY
| 0 0| 10 0| 7 0| 2 1| 19 0 | 0 0| 1 1| 0 0| 0 0| 1 0 | 20 0
MONTGOMERY COUNTY | 0 0| 0 0| 4 0| 0 0| 4 0 | 0 0| 0 0| 0 0| 0 0| 0 0 | 4 0
MORGAN COUNTY
| 0 0| 12 0| 2 0| 0 0| 14 0 | 0 0| 1 1| 0 0| 0 0| 1 0 | 15 0
MURRAY COUNTY
| 1 1| 4 0| 5 0| 4 1| 14 0 | 0 0| 0 0| 0 0| 0 0| 0 0 | 14 0
MUSCOGEE COUNTY
| 6 3| 74 2| 74 4| 10 3| 164 3 | 0 0| 4 3| 1 1| 0 0| 5 2 | 169 3
------------------------------------------------------------------------------------------------------------------------------------
(continued)
Georgia Department of Corrections
June, 2000
29
Georgia Department of Corrections
Page 27 Run 06/20/00
Office of Planning and Analysis Inmate statistical profile
Sample: ACTIVE PRISONERS WITH LIFE SENTENCES EXCLUDING JAIL Active inmates 06/20/2000
County Of Conviction by current age & sex
Requestor: Statistics (CONTINUED)
|
MEN
|
WOMEN
|
| Age | Age | Age | Age | Men
| Age | Age | Age | Age |Women
|Grand
County Of Conviction|00-21 %|22-39 %|40-54 %|55-99 %|Total % |00-21 %|22-39 %|40-54 %|55-99 %|Total % |Total %
------------------------------------------------------------------------------------------------------------------------------------
NEWTON COUNTY
| 4 2| 46 2| 16 1| 4 1| 70 1 | 0 0| 2 2| 0 0| 0 0| 2 1 | 72 1
OCONEE COUNTY
| 0 0| 9 0| 2 0| 0 0| 11 0 | 0 0| 0 0| 0 0| 0 0| 0 0 | 11 0
OGLETHORPE COUNTY | 0 0| 5 0| 3 0| 1 0| 9 0 | 0 0| 0 0| 0 0| 0 0| 0 0 | 9 0
PAULDING COUNTY
| 0 0| 4 0| 6 0| 3 1| 13 0 | 0 0| 0 0| 0 0| 0 0| 0 0 | 13 0
PEACH COUNTY
| 0 0| 6 0| 3 0| 0 0| 9 0 | 0 0| 0 0| 1 1| 0 0| 1 0 | 10 0
PICKENS COUNTY
| 0 0| 4 0| 0 0| 1 0| 5 0 | 0 0| 0 0| 1 1| 0 0| 1 0 | 6 0
PIERCE COUNTY
| 3 2| 2 0| 5 0| 0 0| 10 0 | 0 0| 0 0| 0 0| 0 0| 0 0 | 10 0
PIKE COUNTY
| 0 0| 1 0| 1 0| 0 0| 2 0 | 0 0| 0 0| 0 0| 0 0| 0 0 | 2 0
POLK COUNTY
| 1 1| 11 0| 8 0| 2 1| 22 0 | 0 0| 0 0| 0 0| 0 0| 0 0 | 22 0
PULASKI COUNTY
| 1 1| 6 0| 1 0| 0 0| 8 0 | 0 0| 1 1| 0 0| 0 0| 1 0 | 9 0
PUTNAM COUNTY
| 0 0| 21 1| 15 1| 3 1| 39 1 | 0 0| 0 0| 0 0| 0 0| 0 0 | 39 1
QUITMAN COUNTY
| 0 0| 4 0| 0 0| 0 0| 4 0 | 0 0| 0 0| 0 0| 0 0| 0 0 | 4 0
RABUN COUNTY
| 0 0| 8 0| 1 0| 0 0| 9 0 | 0 0| 0 0| 0 0| 0 0| 0 0 | 9 0
RANDOLPH COUNTY
| 0 0| 3 0| 2 0| 2 1| 7 0 | 0 0| 0 0| 0 0| 0 0| 0 0 | 7 0
RICHMOND COUNTY
| 14 7| 155 5| 71 4| 12 3| 252 4 | 0 0| 9 7| 8 11| 1 4| 18 8 | 270 5
ROCKDALE COUNTY
| 1 1| 10 0| 10 0| 5 1| 26 0 | 0 0| 1 1| 0 0| 0 0| 1 0 | 27 0
SCHLEY COUNTY
| 0 0| 4 0| 2 0| 0 0| 6 0 | 0 0| 0 0| 0 0| 0 0| 0 0 | 6 0
SCREVEN COUNTY
| 0 0| 5 0| 5 0| 2 1| 12 0 | 0 0| 0 0| 0 0| 0 0| 0 0 | 12 0
SEMINOLE COUNTY
| 1 1| 4 0| 4 0| 2 1| 11 0 | 0 0| 1 1| 0 0| 0 0| 1 0 | 12 0
SPALDING COUNTY
| 2 1| 42 1| 23 1| 6 2| 73 1 | 1 10| 1 1| 1 1| 1 4| 4 2 | 77 1
STEPHENS COUNTY
| 0 0| 4 0| 4 0| 3 1| 11 0 | 0 0| 0 0| 0 0| 0 0| 0 0 | 11 0
STEWART COUNTY
| 0 0| 2 0| 1 0| 0 0| 3 0 | 0 0| 0 0| 2 3| 0 0| 2 1 | 5 0
SUMTER COUNTY
| 0 0| 5 0| 13 1| 1 0| 19 0 | 0 0| 0 0| 1 1| 0 0| 1 0 | 20 0
TALBOT COUNTY
| 2 1| 3 0| 1 0| 0 0| 6 0 | 0 0| 0 0| 1 1| 0 0| 1 0 | 7 0
TALIAFERRO COUNTY | 0 0| 0 0| 3 0| 0 0| 3 0 | 0 0| 0 0| 0 0| 0 0| 0 0 | 3 0
TATTNALL COUNTY
| 1 1| 17 1| 13 1| 3 1| 34 1 | 0 0| 0 0| 1 1| 0 0| 1 0 | 35 1
TAYLOR COUNTY
| 1 1| 8 0| 4 0| 0 0| 13 0 | 0 0| 0 0| 0 0| 0 0| 0 0 | 13 0
TELFAIR COUNTY
| 1 1| 6 0| 2 0| 0 0| 9 0 | 0 0| 0 0| 1 1| 0 0| 1 0 | 10 0
TERRELL COUNTY
| 1 1| 12 0| 3 0| 1 0| 17 0 | 0 0| 0 0| 0 0| 0 0| 0 0 | 17 0
THOMAS COUNTY
| 2 1| 19 1| 19 1| 3 1| 43 1 | 0 0| 2 2| 0 0| 0 0| 2 1 | 45 1
TIFT COUNTY
| 6 3| 33 1| 21 1| 5 1| 65 1 | 0 0| 0 0| 2 3| 1 4| 3 1 | 68 1
TOOMBS COUNTY
| 4 2| 23 1| 8 0| 1 0| 36 1 | 0 0| 2 2| 0 0| 0 0| 2 1 | 38 1
TOWNS COUNTY
| 0 0| 1 0| 1 0| 0 0| 2 0 | 0 0| 0 0| 0 0| 0 0| 0 0 | 2 0
TREUTLEN COUNTY
| 0 0| 3 0| 4 0| 0 0| 7 0 | 0 0| 0 0| 0 0| 0 0| 0 0 | 7 0
TROUP COUNTY
| 3 2| 25 1| 25 1| 6 2| 59 1 | 0 0| 2 2| 1 1| 0 0| 3 1 | 62 1
------------------------------------------------------------------------------------------------------------------------------------
(continued)
Georgia Department of Corrections
June, 2000
30
Page 28 Run 06/20/00
Georgia Department of Corrections Office of Planning and Analysis
Inmate statistical profile
Sample: ACTIVE PRISONERS WITH LIFE SENTENCES EXCLUDING JAIL Active inmates 06/20/2000
County Of Conviction by current age & sex
Requestor: (CONTINUED)
Statistics
|
MEN
|
WOMEN
|
| Age | Age | Age | Age | Men
| Age | Age | Age | Age |Women
|Grand
County Of Conviction|00-21 %|22-39 %|40-54 %|55-99 %|Total % |00-21 %|22-39 %|40-54 %|55-99 %|Total % |Total %
------------------------------------------------------------------------------------------------------------------------------------
TURNER COUNTY
| 0 0| 7 0| 7 0| 0 0| 14 0 | 0 0| 0 0| 0 0| 0 0| 0 0 | 14 0
TWIGGS COUNTY
| 0 0| 3 0| 5 0| 1 0| 9 0 | 0 0| 0 0| 0 0| 0 0| 0 0 | 9 0
UNION COUNTY
| 0 0| 0 0| 1 0| 0 0| 1 0 | 0 0| 0 0| 0 0| 0 0| 0 0 | 1 0
UPSON COUNTY
| 0 0| 7 0| 5 0| 1 0| 13 0 | 0 0| 0 0| 1 1| 0 0| 1 0 | 14 0
WALKER COUNTY
| 0 0| 15 0| 10 0| 3 1| 28 0 | 0 0| 1 1| 1 1| 0 0| 2 1 | 30 1
WALTON COUNTY
| 1 1| 30 1| 18 1| 2 1| 51 1 | 0 0| 1 1| 0 0| 0 0| 1 0 | 52 1
WARE COUNTY
| 0 0| 13 0| 11 1| 3 1| 27 0 | 0 0| 1 1| 0 0| 0 0| 1 0 | 28 0
WARREN COUNTY
| 0 0| 4 0| 6 0| 1 0| 11 0 | 0 0| 0 0| 0 0| 0 0| 0 0 | 11 0
WASHINGTON COUNTY | 0 0| 8 0| 6 0| 1 0| 15 0 | 0 0| 1 1| 0 0| 0 0| 1 0 | 16 0
WAYNE COUNTY
| 0 0| 7 0| 8 0| 2 1| 17 0 | 0 0| 1 1| 0 0| 0 0| 1 0 | 18 0
WEBSTER COUNTY
| 0 0| 0 0| 0 0| 0 0| 0 0 | 0 0| 0 0| 0 0| 0 0| 0 0 | 0 0
WHEELER COUNTY
| 0 0| 3 0| 3 0| 1 0| 7 0 | 0 0| 0 0| 0 0| 1 4| 1 0 | 8 0
WHITE COUNTY
| 0 0| 3 0| 2 0| 0 0| 5 0 | 0 0| 0 0| 0 0| 0 0| 0 0 | 5 0
WHITFIELD COUNTY | 0 0| 26 1| 24 1| 5 1| 55 1 | 0 0| 5 4| 1 1| 0 0| 6 3 | 61 1
WILCOX COUNTY
| 0 0| 1 0| 7 0| 0 0| 8 0 | 0 0| 0 0| 0 0| 0 0| 0 0 | 8 0
WILKES COUNTY
| 0 0| 8 0| 2 0| 1 0| 11 0 | 0 0| 0 0| 0 0| 0 0| 0 0 | 11 0
WILKINSON COUNTY | 0 0| 7 0| 1 0| 0 0| 8 0 | 0 0| 0 0| 0 0| 0 0| 0 0 | 8 0
WORTH COUNTY
| 4 2| 13 0| 4 0| 2 1| 23 0 | 0 0| 0 0| 0 0| 0 0| 0 0 | 23 0
CONVERSION
| 0 2| 0 0| 0 0| 0 1| 0 0 | 0 0| 0 0| 0 0| 0 0| 0 0 | 0 0
------------------------------------------------------------------------------------------------------------------------------------
Total reported
| 198 100| 3027 100| 2021 100| 392 100| 5638 100 | 10 100| 129 100| 74 100| 26 100| 239 100 | 5877 100
|
|
|
|
|
|
|
|
|
|
|
Percent reported | 100.0| 100.0| 100.0| 100.0| 100.0 | 100.0| 100.0| 100.0| 100.0| 100.0 | 100.0
|
|
|
|
|
|
|
|
|
|
|
|
|
|
|
|
|
|
|
|
|
|
UNKNOWN
|0|0|0|0|0
|0|0|0|0|0
|0
------------------------------------------------------------------------------------------------------------------------------------
Total
| 198 | 3027 | 2021 | 392 | 5638
| 10 | 129 | 74 | 26 | 239
| 5877
Georgia Department of Corrections
June, 2000
31
Page 29 Run 06/20/00
Georgia Department of Corrections Office of Planning and Analysis Inmate statistical profile
Sample: ACTIVE PRISONERS WITH LIFE SENTENCES EXCLUDING JAIL
Requestor:
Active inmates 06/20/2000
Circuit Of Conviction by current age & sex
Statistics
|
MEN
|
WOMEN
|
| Age | Age | Age | Age | Men
| Age | Age | Age | Age |Women
|Grand
Circ Of Conviction |00-21 %|22-39 %|40-54 %|55-99 %|Total % |00-21 %|22-39 %|40-54 %|55-99 %|Total % |Total %
------------------------------------------------------------------------------------------------------------------------------------
ALAPAHA CIRCUIT
| 0 0| 15 0| 9 0| 2 1| 26 0 | 0 0| 2 2| 1 1| 0 0| 3 1 | 29 0
ALCOVY CIRCUIT
| 5 3| 76 3| 34 2| 6 2| 121 2 | 0 0| 3 2| 0 0| 0 0| 3 1 | 124 2
ATLANTA CIRCUIT
| 27 14| 463 15| 305 15| 60 15| 855 15 | 3 30| 12 9| 6 8| 5 19| 26 11 | 881 15
ATLANTIC CIRCUIT | 6 3| 69 2| 43 2| 12 3| 130 2 | 0 0| 4 3| 1 1| 1 4| 6 3 | 136 2
AUGUSTA CIRCUIT
| 15 8| 175 6| 92 5| 15 4| 297 5 | 0 0| 9 7| 9 12| 1 4| 19 8 | 316 5
BLUE RIDGE CIRCUIT | 2 1| 13 0| 29 1| 5 1| 49 1 | 0 0| 4 3| 1 1| 0 0| 5 2 | 54 1
BRUNSWICK CIRCUIT | 7 4| 69 2| 50 2| 7 2| 133 2 | 0 0| 3 2| 3 4| 0 0| 6 3 | 139 2
CHATTAHOOCHEE CIRCUI| 10 5| 95 3| 85 4| 10 3| 200 4 | 0 0| 4 3| 3 4| 0 0| 7 3 | 207 4
CHEROKEE CIRCUIT | 2 1| 51 2| 34 2| 5 1| 92 2 | 0 0| 3 2| 0 0| 0 0| 3 1 | 95 2
CLAYTON CIRCUIT
| 5 3| 69 2| 36 2| 10 3| 120 2 | 0 0| 2 2| 3 4| 0 0| 5 2 | 125 2
COBB CIRCUIT
| 5 3| 112 4| 73 4| 14 4| 204 4 | 0 0| 5 4| 3 4| 1 4| 9 4 | 213 4
CONASAUGA CIRCUIT | 1 1| 30 1| 29 1| 9 2| 69 1 | 0 0| 5 4| 1 1| 0 0| 6 3 | 75 1
CORDELE CIRCUIT
| 5 3| 30 1| 35 2| 4 1| 74 1 | 0 0| 3 2| 0 0| 2 8| 5 2 | 79 1
COWETA CIRCUIT
| 9 5| 75 2| 55 3| 21 5| 160 3 | 0 0| 8 6| 3 4| 1 4| 12 5 | 172 3
DOUGHERTY CIRCUIT | 6 3| 71 2| 38 2| 4 1| 119 2 | 0 0| 5 4| 0 0| 0 0| 5 2 | 124 2
DUBLIN CIRCUIT
| 1 1| 28 1| 18 1| 3 1| 50 1 | 0 0| 2 2| 2 3| 0 0| 4 2 | 54 1
EASTERN CIRCUIT
| 7 4| 161 5| 102 5| 14 4| 284 5 | 0 0| 3 2| 0 0| 0 0| 3 1 | 287 5
FLINT CIRCUIT
| 3 2| 62 2| 35 2| 8 2| 108 2 | 0 0| 5 4| 1 1| 0 0| 6 3 | 114 2
GRIFFIN CIRCUIT
| 3 2| 56 2| 34 2| 7 2| 100 2 | 1 10| 1 1| 2 3| 1 4| 5 2 | 105 2
GWINNETT CIRCUIT | 2 1| 73 2| 39 2| 7 2| 121 2 | 0 0| 2 2| 4 5| 1 4| 7 3 | 128 2
HOUSTON CIRCUIT
| 0 0| 41 1| 18 1| 3 1| 62 1 | 0 0| 4 3| 3 4| 1 4| 8 3 | 70 1
LOOKOUT MOUNTAIN CIR| 0 0| 30 1| 30 1| 6 2| 66 1 | 0 0| 1 1| 2 3| 1 4| 4 2 | 70 1
MACON CIRCUIT
| 4 2| 98 3| 88 4| 14 4| 204 4 | 1 10| 2 2| 2 3| 1 4| 6 3 | 210 4
MIDDLE CIRCUIT
| 5 3| 49 2| 29 1| 8 2| 91 2 | 0 0| 4 3| 0 0| 0 0| 4 2 | 95 2
MOUNTAIN CIRCUIT | 2 1| 24 1| 14 1| 3 1| 43 1 | 0 0| 0 0| 0 0| 0 0| 0 0 | 43 1
NORTHEASTERN CIRCUIT| 2 1| 46 2| 38 2| 11 3| 97 2 | 1 10| 3 2| 1 1| 1 4| 6 3 | 103 2
NORTHERN CIRCUIT | 1 1| 29 1| 19 1| 6 2| 55 1 | 0 0| 3 2| 2 3| 1 4| 6 3 | 61 1
OCMULGEE CIRCUIT | 3 2| 70 2| 41 2| 9 2| 123 2 | 0 0| 2 2| 2 3| 0 0| 4 2 | 127 2
OCONEE CIRCUIT
| 2 1| 28 1| 19 1| 3 1| 52 1 | 0 0| 1 1| 2 3| 1 4| 4 2 | 56 1
OGEECHEE CIRCUIT | 1 1| 31 1| 28 1| 2 1| 62 1 | 0 0| 1 1| 1 1| 1 4| 3 1 | 65 1
PATAULA CIRCUIT
| 2 1| 36 1| 17 1| 7 2| 62 1 | 0 0| 1 1| 0 0| 0 0| 1 0 | 63 1
PIEDMONT CIRCUIT | 1 1| 11 0| 32 2| 7 2| 51 1 | 0 0| 1 1| 1 1| 0 0| 2 1 | 53 1
ROME CIRCUIT
| 2 1| 31 1| 26 1| 4 1| 63 1 | 1 10| 3 2| 2 3| 1 4| 7 3 | 70 1
SOUTH GEORGIA CIRCUI| 6 3| 50 2| 28 1| 5 1| 89 2 | 0 0| 3 2| 0 0| 0 0| 3 1 | 92 2
SOUTHERN CIRCUIT | 5 3| 105 3| 72 4| 8 2| 190 3 | 0 0| 3 2| 2 3| 2 8| 7 3 | 197 3
------------------------------------------------------------------------------------------------------------------------------------
(continued)
Georgia Department of Corrections
June, 2000
32
Page 30 Run 06/20/00
Georgia Department of Corrections Office of Planning and Analysis Inmate statistical profile
Sample: ACTIVE PRISONERS WITH LIFE SENTENCES EXCLUDING JAIL Active inmates 06/20/2000
Circuit Of Conviction by current age & sex
Requestor: (Continued)
Statistics
|
MEN
|
WOMEN
|
| Age | Age | Age | Age | Men
| Age | Age | Age | Age |Women
|Grand
Circ Of Conviction |00-21 %|22-39 %|40-54 %|55-99 %|Total % |00-21 %|22-39 %|40-54 %|55-99 %|Total % |Total %
------------------------------------------------------------------------------------------------------------------------------------
SOUTHWESTERN CIRCUIT| 1 1| 29 1| 23 1| 1 0| 54 1 | 1 10| 0 0| 3 4| 0 0| 4 2 | 58 1
STONE MOUNTAIN CIRCU| 16 8| 247 8| 156 8| 18 5| 437 8 | 1 10| 3 2| 3 4| 1 4| 8 3 | 445 8
TALLAPOOSA CIRCUIT | 1 1| 19 1| 16 1| 7 2| 43 1 | 0 0| 0 0| 0 0| 0 0| 0 0 | 43 1
TIFTON CIRCUIT
| 10 5| 56 2| 33 2| 8 2| 107 2 | 0 0| 0 0| 2 3| 1 4| 3 1 | 110 2
TOOMBS CIRCUIT
| 2 1| 44 1| 23 1| 6 2| 75 1 | 1 10| 1 1| 0 0| 0 0| 2 1 | 77 1
WAYCROSS CIRCUIT | 3 2| 32 1| 33 2| 8 2| 76 1 | 0 0| 4 3| 1 1| 0 0| 5 2 | 81 1
WESTERN CIRCUIT
| 2 1| 51 2| 25 1| 8 2| 86 2 | 0 0| 2 2| 0 0| 1 4| 3 1 | 89 2
ROCKDALE CIRCUIT | 1 1| 10 0| 10 0| 5 1| 26 0 | 0 0| 1 1| 0 0| 0 0| 1 0 | 27 0
DOUGLAS CIRCUIT
| 3 2| 48 2| 18 1| 5 1| 74 1 | 0 0| 1 1| 1 1| 0 0| 2 1 | 76 1
APPALACHIAN CIRCUIT | 0 0| 9 0| 6 0| 5 1| 20 0 | 0 0| 0 0| 1 1| 0 0| 1 0 | 21 0
ENOTAH CIRCUIT
| 1 1| 7 0| 4 0| 2 1| 14 0 | 0 0| 0 0| 0 0| 0 0| 0 0 | 14 0
BELL-FORSYTH CIRCUIT| 0 0| 1 0| 0 0| 0 0| 1 0 | 0 0| 0 0| 0 0| 0 0| 0 0 | 1 0
------------------------------------------------------------------------------------------------------------------------------------
Total reported
| 197 100| 3025 100| 2021 100| 392 100| 5635 100 | 10 100| 129 100| 74 100| 26 100| 239 100 | 5874 100
|
|
|
|
|
|
|
|
|
|
|
Percent reported |
99.5|
99.9| 100.0| 100.0|
99.9 | 100.0| 100.0| 100.0| 100.0| 100.0 |
99.9
|
|
|
|
|
|
|
|
|
|
|
|
|
|
|
|
|
|
|
|
|
|
NOT REPORTED
|1|2|0|0|3
|0|0|0|0|0
|3
------------------------------------------------------------------------------------------------------------------------------------
Total
| 198 | 3027 | 2021 | 392 | 5638
| 10 | 129 | 74 | 26 | 239
| 5877
Georgia Department of Corrections
June, 2000
33
Page 31 Run 06/20/00
Georgia Department of Corrections
Office of Planning and Analysis Inmate statistical profile
Sample: ACTIVE PRISONERS WITH LIFE SENTENCES EXCLUDING JAIL Active inmates 06/20/2000
Home County by current age & sex
Requestor: Statistics
|
MEN
|
WOMEN
|
| Age | Age | Age | Age | Men
| Age | Age | Age | Age |Women
|Grand
Home County
|00-21 %|22-39 %|40-54 %|55-99 %|Total % |00-21 %|22-39 %|40-54 %|55-99 %|Total % |Total %
------------------------------------------------------------------------------------------------------------------------------------
APPLING COUNTY
| 0 0| 4 0| 5 0| 1 0| 10 0 | 0 0| 0 0| 0 0| 0 0| 0 0 | 10 0
ATKINSON COUNTY
| 0 0| 1 0| 1 0| 3 1| 5 0 | 0 0| 0 0| 0 0| 0 0| 0 0 | 5 0
BACON COUNTY
| 0 0| 5 0| 4 0| 1 0| 10 0 | 0 0| 0 0| 0 0| 0 0| 0 0 | 10 0
BAKER COUNTY
| 0 0| 1 0| 2 0| 0 0| 3 0 | 0 0| 0 0| 0 0| 0 0| 0 0 | 3 0
BALDWIN COUNTY
| 0 0| 16 1| 6 0| 1 0| 23 0 | 0 0| 1 1| 0 0| 1 4| 2 1 | 25 0
BANKS COUNTY
| 0 0| 1 0| 4 0| 1 0| 6 0 | 0 0| 1 1| 0 0| 0 0| 1 0 | 7 0
BARROW COUNTY
| 0 0| 6 0| 8 0| 2 1| 16 0 | 0 0| 0 0| 1 2| 0 0| 1 0 | 17 0
BARTOW COUNTY
| 2 1| 20 1| 19 1| 5 1| 46 1 | 1 11| 3 3| 0 0| 0 0| 4 2 | 50 1
BEN HILL COUNTY
| 0 0| 5 0| 7 0| 3 1| 15 0 | 0 0| 0 0| 1 2| 0 0| 1 0 | 16 0
BERRIEN COUNTY
| 0 0| 4 0| 1 0| 1 0| 6 0 | 0 0| 0 0| 0 0| 0 0| 0 0 | 6 0
BIBB COUNTY
| 4 2| 80 3| 79 4| 16 4| 179 3 | 1 11| 5 4| 2 3| 0 0| 8 4 | 187 3
BLECKLEY COUNTY
| 0 0| 8 0| 4 0| 1 0| 13 0 | 0 0| 0 0| 1 2| 0 0| 1 0 | 14 0
BRANTLEY COUNTY
| 0 0| 1 0| 2 0| 0 0| 3 0 | 0 0| 0 0| 0 0| 0 0| 0 0 | 3 0
BROOKS COUNTY
| 0 0| 8 0| 3 0| 1 0| 12 0 | 0 0| 0 0| 0 0| 0 0| 0 0 | 12 0
BRYAN COUNTY
| 0 0| 8 0| 5 0| 1 0| 14 0 | 0 0| 0 0| 0 0| 0 0| 0 0 | 14 0
BULLOCH COUNTY
| 1 1| 13 0| 11 1| 0 0| 25 0 | 0 0| 0 0| 1 2| 1 4| 2 1 | 27 1
BURKE COUNTY
| 0 0| 8 0| 7 0| 2 1| 17 0 | 0 0| 0 0| 0 0| 0 0| 0 0 | 17 0
BUTTS COUNTY
| 2 1| 22 1| 7 0| 2 1| 33 1 | 0 0| 2 2| 0 0| 0 0| 2 1 | 35 1
CALHOUN COUNTY
| 1 1| 2 0| 3 0| 1 0| 7 0 | 0 0| 0 0| 0 0| 0 0| 0 0 | 7 0
CAMDEN COUNTY
| 2 1| 17 1| 5 0| 0 0| 24 0 | 0 0| 0 0| 1 2| 0 0| 1 0 | 25 0
CANDLER COUNTY
| 0 0| 2 0| 1 0| 0 0| 3 0 | 0 0| 0 0| 0 0| 0 0| 0 0 | 3 0
CARROLL COUNTY
| 1 1| 19 1| 11 1| 8 2| 39 1 | 0 0| 2 2| 1 2| 0 0| 3 1 | 42 1
CATOOSA COUNTY
| 0 0| 2 0| 5 0| 1 0| 8 0 | 0 0| 0 0| 0 0| 0 0| 0 0 | 8 0
CHARLTON COUNTY
| 0 0| 1 0| 0 0| 0 0| 1 0 | 0 0| 1 1| 0 0| 0 0| 1 0 | 2 0
CHATHAM COUNTY
| 9 5| 148 5| 94 5| 14 4| 265 5 | 0 0| 3 3| 0 0| 1 4| 4 2 | 269 5
CHATTAHOOCHEE COUNTY| 0 0| 0 0| 1 0| 0 0| 1 0 | 0 0| 0 0| 0 0| 0 0| 0 0 | 1 0
CHATTOOGA COUNTY | 0 0| 3 0| 6 0| 0 0| 9 0 | 0 0| 0 0| 1 2| 1 4| 2 1 | 11 0
CHEROKEE COUNTY
| 2 1| 8 0| 16 1| 1 0| 27 1 | 0 0| 2 2| 0 0| 0 0| 2 1 | 29 1
CLARKE COUNTY
| 3 2| 47 2| 18 1| 5 1| 73 1 | 0 0| 2 2| 0 0| 2 8| 4 2 | 77 1
CLAY COUNTY
| 0 0| 1 0| 0 0| 0 0| 1 0 | 0 0| 0 0| 0 0| 0 0| 0 0 | 1 0
CLAYTON COUNTY
| 5 3| 56 2| 44 2| 8 2| 113 2 | 0 0| 3 3| 1 2| 0 0| 4 2 | 117 2
CLINCH COUNTY
| 0 0| 1 0| 2 0| 0 0| 3 0 | 0 0| 0 0| 0 0| 0 0| 0 0 | 3 0
COBB COUNTY
| 4 2| 89 3| 68 4| 7 2| 168 3 | 0 0| 4 3| 1 2| 0 0| 5 2 | 173 3
COFFEE COUNTY
| 0 0| 11 0| 4 0| 3 1| 18 0 | 0 0| 1 1| 2 3| 1 4| 4 2 | 22 0
COLQUITT COUNTY
| 5 3| 29 1| 17 1| 1 0| 52 1 | 0 0| 1 1| 0 0| 0 0| 1 0 | 53 1
COLUMBIA COUNTY
| 0 0| 9 0| 7 0| 0 0| 16 0 | 0 0| 1 1| 1 2| 0 0| 2 1 | 18 0
------------------------------------------------------------------------------------------------------------------------------------
(continued)
Georgia Department of Corrections
June, 2000
34
Page 32 Run 06/20/00
Georgia Department of Corrections Office of Planning and Analysis
Inmate statistical profile
Sample: ACTIVE PRISONERS WITH LIFE SENTENCES EXCLUDING JAIL Active inmates 06/20/2000
Home County by current age & sex
Requestor: (CONTINUED)
Statistics
|
MEN
|
WOMEN
|
| Age | Age | Age | Age | Men
| Age | Age | Age | Age |Women
|Grand
Home County
|00-21 %|22-39 %|40-54 %|55-99 %|Total % |00-21 %|22-39 %|40-54 %|55-99 %|Total % |Total %
------------------------------------------------------------------------------------------------------------------------------------
COOK COUNTY
| 0 0| 6 0| 3 0| 1 0| 10 0 | 0 0| 2 2| 0 0| 0 0| 2 1 | 12 0
COWETA COUNTY
| 5 3| 18 1| 9 0| 1 0| 33 1 | 0 0| 2 2| 1 2| 0 0| 3 1 | 36 1
CRAWFORD COUNTY
| 0 0| 1 0| 1 0| 0 0| 2 0 | 0 0| 0 0| 0 0| 0 0| 0 0 | 2 0
CRISP COUNTY
| 3 2| 13 0| 7 0| 1 0| 24 0 | 0 0| 3 3| 0 0| 1 4| 4 2 | 28 1
DADE COUNTY
| 0 0| 4 0| 3 0| 2 1| 9 0 | 0 0| 0 0| 0 0| 0 0| 0 0 | 9 0
DAWSON COUNTY
| 0 0| 2 0| 1 0| 0 0| 3 0 | 0 0| 0 0| 0 0| 0 0| 0 0 | 3 0
DECATUR COUNTY
| 4 2| 13 0| 4 0| 0 0| 21 0 | 0 0| 0 0| 0 0| 0 0| 0 0 | 21 0
DEKALB COUNTY
| 17 9| 213 8| 130 7| 20 6| 380 7 | 1 11| 3 3| 1 2| 2 8| 7 3 | 387 7
DODGE COUNTY
| 0 0| 7 0| 7 0| 0 0| 14 0 | 0 0| 0 0| 0 0| 0 0| 0 0 | 14 0
DOOLY COUNTY
| 2 1| 7 0| 3 0| 0 0| 12 0 | 0 0| 0 0| 0 0| 0 0| 0 0 | 12 0
DOUGHERTY COUNTY | 6 3| 65 2| 40 2| 2 1| 113 2 | 0 0| 5 4| 1 2| 1 4| 7 3 | 120 2
DOUGLAS COUNTY
| 1 1| 23 1| 11 1| 2 1| 37 1 | 0 0| 1 1| 1 2| 0 0| 2 1 | 39 1
EARLY COUNTY
| 0 0| 7 0| 5 0| 1 0| 13 0 | 0 0| 0 0| 0 0| 0 0| 0 0 | 13 0
ECHOLS COUNTY.
| 0 0| 0 0| 0 0| 0 0| 0 0 | 0 0| 0 0| 0 0| 0 0| 0 0 | 0 0
EFFINGHAM COUNTY | 0 0| 4 0| 3 0| 0 0| 7 0 | 0 0| 0 0| 0 0| 0 0| 0 0 | 7 0
ELBERT COUNTY
| 0 0| 12 0| 7 0| 1 0| 20 0 | 0 0| 1 1| 0 0| 0 0| 1 0 | 21 0
EMANUEL COUNTY
| 1 1| 10 0| 5 0| 1 0| 17 0 | 0 0| 1 1| 0 0| 0 0| 1 0 | 18 0
EVANS COUNTY
| 0 0| 8 0| 4 0| 1 0| 13 0 | 0 0| 0 0| 0 0| 0 0| 0 0 | 13 0
FANNIN COUNTY
| 0 0| 5 0| 3 0| 1 0| 9 0 | 0 0| 0 0| 0 0| 0 0| 0 0 | 9 0
FAYETTE COUNTY
| 0 0| 3 0| 3 0| 0 0| 6 0 | 0 0| 0 0| 0 0| 0 0| 0 0 | 6 0
FLOYD COUNTY
| 2 1| 34 1| 21 1| 1 0| 58 1 | 0 0| 3 3| 2 3| 1 4| 6 3 | 64 1
FORSYTH COUNTY
| 0 0| 7 0| 2 0| 2 1| 11 0 | 0 0| 0 0| 1 2| 0 0| 1 0 | 12 0
FRANKLIN COUNTY
| 0 0| 2 0| 4 0| 0 0| 6 0 | 0 0| 0 0| 0 0| 1 4| 1 0 | 7 0
FULTON COUNTY
| 26 14| 501 18| 337 18| 55 15| 919 18 | 3 33| 14 12| 7 11| 4 16| 28 13 | 947 18
GILMER COUNTY
| 0 0| 1 0| 2 0| 1 0| 4 0 | 0 0| 0 0| 0 0| 0 0| 0 0 | 4 0
GLASCOCK COUNTY
| 0 0| 1 0| 0 0| 0 0| 1 0 | 0 0| 0 0| 0 0| 0 0| 0 0 | 1 0
GLYNN COUNTY
| 4 2| 31 1| 25 1| 3 1| 63 1 | 0 0| 1 1| 2 3| 0 0| 3 1 | 66 1
GORDON COUNTY
| 0 0| 22 1| 11 1| 3 1| 36 1 | 0 0| 1 1| 0 0| 0 0| 1 0 | 37 1
GRADY COUNTY
| 1 1| 14 1| 7 0| 0 0| 22 0 | 0 0| 0 0| 0 0| 0 0| 0 0 | 22 0
GREENE COUNTY
| 1 1| 3 0| 3 0| 1 0| 8 0 | 0 0| 0 0| 1 2| 0 0| 1 0 | 9 0
GWINNETT COUNTY
| 4 2| 67 2| 37 2| 8 2| 116 2 | 0 0| 3 3| 1 2| 0 0| 4 2 | 120 2
HABERSHAM COUNTY | 0 0| 9 0| 7 0| 0 0| 16 0 | 0 0| 0 0| 0 0| 0 0| 0 0 | 16 0
HALL COUNTY
| 2 1| 32 1| 33 2| 11 3| 78 2 | 1 11| 2 2| 1 2| 1 4| 5 2 | 83 2
HANCOCK COUNTY
| 0 0| 2 0| 2 0| 1 0| 5 0 | 0 0| 0 0| 1 2| 0 0| 1 0 | 6 0
HARALSON COUNTY
| 0 0| 1 0| 2 0| 2 1| 5 0 | 0 0| 0 0| 0 0| 0 0| 0 0 | 5 0
------------------------------------------------------------------------------------------------------------------------------------
(continued)
Georgia Department of Corrections
June, 2000
35
Page 33 Run 06/20/00
Georgia Department of Corrections
Office of Planning and Analysis Inmate statistical profile
Sample: ACTIVE PRISONERS WITH LIFE SENTENCES EXCLUDING JAIL Active inmates 06/20/2000
Home County by current age & sex
Requestor: (CONTINUED)
Statistics
|
MEN
|
WOMEN
|
| Age | Age | Age | Age | Men
| Age | Age | Age | Age |Women
|Grand
Home County
|00-21 %|22-39 %|40-54 %|55-99 %|Total % |00-21 %|22-39 %|40-54 %|55-99 %|Total % |Total %
------------------------------------------------------------------------------------------------------------------------------------
HARRIS COUNTY
| 1 1| 6 0| 2 0| 0 0| 9 0 | 0 0| 0 0| 0 0| 0 0| 0 0 | 9 0
HART COUNTY
| 0 0| 1 0| 2 0| 0 0| 3 0 | 0 0| 0 0| 1 2| 0 0| 1 0 | 4 0
HEARD COUNTY
| 0 0| 1 0| 1 0| 2 1| 4 0 | 0 0| 0 0| 0 0| 0 0| 0 0 | 4 0
HENRY COUNTY
| 1 1| 19 1| 8 0| 5 1| 33 1 | 0 0| 1 1| 2 3| 0 0| 3 1 | 36 1
HOUSTON COUNTY
| 0 0| 43 2| 21 1| 5 1| 69 1 | 0 0| 3 3| 4 6| 0 0| 7 3 | 76 1
IRWIN COUNTY
| 1 1| 4 0| 3 0| 0 0| 8 0 | 0 0| 0 0| 0 0| 0 0| 0 0 | 8 0
JACKSON COUNTY
| 1 1| 9 0| 10 1| 5 1| 25 0 | 0 0| 0 0| 0 0| 0 0| 0 0 | 25 0
JASPER COUNTY
| 2 1| 8 0| 0 0| 1 0| 11 0 | 0 0| 0 0| 0 0| 0 0| 0 0 | 11 0
JEFF DAVIS COUNTY | 1 1| 5 0| 2 0| 1 0| 9 0 | 0 0| 0 0| 0 0| 0 0| 0 0 | 9 0
JEFFERSON COUNTY | 0 0| 4 0| 2 0| 2 1| 8 0 | 0 0| 1 1| 0 0| 0 0| 1 0 | 9 0
JENKINS COUNTY
| 0 0| 0 0| 6 0| 0 0| 6 0 | 0 0| 0 0| 0 0| 0 0| 0 0 | 6 0
JOHNSON COUNTY
| 0 0| 3 0| 2 0| 0 0| 5 0 | 0 0| 0 0| 0 0| 0 0| 0 0 | 5 0
JONES COUNTY
| 0 0| 0 0| 4 0| 1 0| 5 0 | 0 0| 1 1| 0 0| 0 0| 1 0 | 6 0
LAMAR COUNTY
| 0 0| 9 0| 9 0| 3 1| 21 0 | 0 0| 0 0| 1 2| 0 0| 1 0 | 22 0
LANIER COUNTY
| 0 0| 0 0| 0 0| 0 0| 0 0 | 0 0| 0 0| 0 0| 0 0| 0 0 | 0 0
LAURENS COUNTY
| 1 1| 15 1| 7 0| 2 1| 25 0 | 0 0| 1 1| 1 2| 0 0| 2 1 | 27 1
LEE COUNTY
| 0 0| 3 0| 0 0| 0 0| 3 0 | 0 0| 0 0| 0 0| 0 0| 0 0 | 3 0
LIBERTY COUNTY
| 1 1| 24 1| 8 0| 4 1| 37 1 | 0 0| 3 3| 0 0| 0 0| 3 1 | 40 1
LINCOLN COUNTY
| 1 1| 1 0| 3 0| 0 0| 5 0 | 0 0| 0 0| 0 0| 0 0| 0 0 | 5 0
LONG COUNTY
| 0 0| 6 0| 2 0| 1 0| 9 0 | 0 0| 0 0| 0 0| 0 0| 0 0 | 9 0
LOWNDES COUNTY
| 0 0| 33 1| 22 1| 2 1| 57 1 | 0 0| 0 0| 2 3| 1 4| 3 1 | 60 1
LUMPKIN COUNTY
| 1 1| 5 0| 4 0| 1 0| 11 0 | 0 0| 0 0| 0 0| 0 0| 0 0 | 11 0
MACON COUNTY
| 0 0| 13 0| 4 0| 0 0| 17 0 | 0 0| 0 0| 1 2| 0 0| 1 0 | 18 0
MADISON COUNTY
| 0 0| 7 0| 4 0| 2 1| 13 0 | 0 0| 2 2| 0 0| 0 0| 2 1 | 15 0
MARION COUNTY
| 1 1| 0 0| 2 0| 1 0| 4 0 | 0 0| 0 0| 0 0| 0 0| 0 0 | 4 0
MCDUFFIE COUNTY
| 1 1| 21 1| 10 1| 4 1| 36 1 | 1 11| 1 1| 0 0| 0 0| 2 1 | 38 1
MCINTOSH COUNTY
| 1 1| 4 0| 3 0| 0 0| 8 0 | 0 0| 0 0| 0 0| 0 0| 0 0 | 8 0
MERIWETHER COUNTY | 0 0| 7 0| 7 0| 3 1| 17 0 | 0 0| 1 1| 0 0| 1 4| 2 1 | 19 0
MILLER COUNTY
| 0 0| 3 0| 3 0| 0 0| 6 0 | 0 0| 0 0| 0 0| 0 0| 0 0 | 6 0
MITCHELL COUNTY
| 0 0| 12 0| 10 1| 3 1| 25 0 | 0 0| 1 1| 0 0| 0 0| 1 0 | 26 0
MONROE COUNTY
| 0 0| 11 0| 2 0| 0 0| 13 0 | 0 0| 0 0| 0 0| 0 0| 0 0 | 13 0
MONTGOMERY COUNTY | 0 0| 0 0| 0 0| 0 0| 0 0 | 0 0| 1 1| 0 0| 0 0| 1 0 | 1 0
MORGAN COUNTY
| 0 0| 8 0| 2 0| 0 0| 10 0 | 0 0| 0 0| 0 0| 0 0| 0 0 | 10 0
MURRAY COUNTY
| 1 1| 7 0| 3 0| 4 1| 15 0 | 0 0| 1 1| 0 0| 0 0| 1 0 | 16 0
MUSCOGEE COUNTY
| 6 3| 63 2| 57 3| 9 3| 135 3 | 0 0| 3 3| 2 3| 0 0| 5 2 | 140 3
------------------------------------------------------------------------------------------------------------------------------------
(continued)
Georgia Department of Corrections
June, 2000
36
Page 34 Run 06/20/00
Georgia Department of Corrections
Office of Planning and Analysis Inmate statistical profile
Sample: ACTIVE PRISONERS WITH LIFE SENTENCES EXCLUDING JAIL Active inmates 06/20/2000
Home County by current age & sex
Requestor: (CONTINUED)
Statistics
|
MEN
|
WOMEN
|
| Age | Age | Age | Age | Men
| Age | Age | Age | Age |Women
|Grand
Home County
|00-21 %|22-39 %|40-54 %|55-99 %|Total % |00-21 %|22-39 %|40-54 %|55-99 %|Total % |Total %
------------------------------------------------------------------------------------------------------------------------------------
NEWTON COUNTY
| 2 1| 37 1| 13 1| 2 1| 54 1 | 0 0| 2 2| 0 0| 1 4| 3 1 | 57 1
OCONEE COUNTY
| 0 0| 3 0| 1 0| 0 0| 4 0 | 0 0| 0 0| 1 2| 0 0| 1 0 | 5 0
OGLETHORPE COUNTY | 0 0| 4 0| 0 0| 0 0| 4 0 | 0 0| 0 0| 0 0| 0 0| 0 0 | 4 0
PAULDING COUNTY
| 0 0| 9 0| 5 0| 3 1| 17 0 | 0 0| 0 0| 1 2| 1 4| 2 1 | 19 0
PEACH COUNTY
| 0 0| 7 0| 2 0| 0 0| 9 0 | 0 0| 1 1| 0 0| 0 0| 1 0 | 10 0
PICKENS COUNTY
| 0 0| 3 0| 0 0| 0 0| 3 0 | 0 0| 0 0| 1 2| 0 0| 1 0 | 4 0
PIERCE COUNTY
| 2 1| 2 0| 2 0| 0 0| 6 0 | 0 0| 0 0| 0 0| 0 0| 0 0 | 6 0
PIKE COUNTY
| 0 0| 1 0| 0 0| 0 0| 1 0 | 0 0| 0 0| 0 0| 0 0| 0 0 | 1 0
POLK COUNTY
| 1 1| 12 0| 5 0| 3 1| 21 0 | 0 0| 0 0| 0 0| 0 0| 0 0 | 21 0
PULASKI COUNTY
| 1 1| 3 0| 3 0| 0 0| 7 0 | 0 0| 1 1| 0 0| 0 0| 1 0 | 8 0
PUTNAM COUNTY
| 0 0| 15 1| 13 1| 1 0| 29 1 | 0 0| 0 0| 0 0| 0 0| 0 0 | 29 1
QUITMAN COUNTY
| 0 0| 2 0| 0 0| 0 0| 2 0 | 0 0| 0 0| 0 0| 0 0| 0 0 | 2 0
RABUN COUNTY
| 0 0| 7 0| 1 0| 0 0| 8 0 | 0 0| 0 0| 0 0| 0 0| 0 0 | 8 0
RANDOLPH COUNTY
| 0 0| 3 0| 3 0| 1 0| 7 0 | 0 0| 0 0| 0 0| 0 0| 0 0 | 7 0
RICHMOND COUNTY
| 15 8| 142 5| 64 3| 7 2| 228 4 | 0 0| 8 7| 8 12| 1 4| 17 8 | 245 5
ROCKDALE COUNTY
| 1 1| 9 0| 8 0| 4 1| 22 0 | 0 0| 1 1| 0 0| 0 0| 1 0 | 23 0
SCHLEY COUNTY
| 0 0| 3 0| 1 0| 0 0| 4 0 | 0 0| 0 0| 0 0| 0 0| 0 0 | 4 0
SCREVEN COUNTY
| 0 0| 3 0| 2 0| 2 1| 7 0 | 0 0| 0 0| 0 0| 0 0| 0 0 | 7 0
SEMINOLE COUNTY
| 1 1| 5 0| 5 0| 1 0| 12 0 | 0 0| 1 1| 0 0| 0 0| 1 0 | 13 0
SPALDING COUNTY
| 3 2| 36 1| 21 1| 5 1| 65 1 | 1 11| 1 1| 0 0| 1 4| 3 1 | 68 1
STEPHENS COUNTY
| 0 0| 5 0| 6 0| 4 1| 15 0 | 0 0| 0 0| 0 0| 0 0| 0 0 | 15 0
STEWART COUNTY
| 0 0| 2 0| 2 0| 0 0| 4 0 | 0 0| 0 0| 0 0| 0 0| 0 0 | 4 0
SUMTER COUNTY
| 0 0| 3 0| 15 1| 2 1| 20 0 | 0 0| 0 0| 1 2| 0 0| 1 0 | 21 0
TALBOT COUNTY
| 2 1| 2 0| 1 0| 0 0| 5 0 | 0 0| 0 0| 1 2| 0 0| 1 0 | 6 0
TALIAFERRO COUNTY | 0 0| 0 0| 1 0| 0 0| 1 0 | 0 0| 0 0| 0 0| 0 0| 0 0 | 1 0
TATTNALL COUNTY
| 1 1| 15 1| 4 0| 0 0| 20 0 | 0 0| 0 0| 1 2| 0 0| 1 0 | 21 0
TAYLOR COUNTY
| 1 1| 10 0| 3 0| 1 0| 15 0 | 0 0| 0 0| 0 0| 0 0| 0 0 | 15 0
TELFAIR COUNTY
| 1 1| 6 0| 3 0| 0 0| 10 0 | 0 0| 0 0| 1 2| 0 0| 1 0 | 11 0
TERRELL COUNTY
| 2 1| 11 0| 1 0| 0 0| 14 0 | 0 0| 0 0| 0 0| 0 0| 0 0 | 14 0
THOMAS COUNTY
| 1 1| 15 1| 14 1| 4 1| 34 1 | 0 0| 2 2| 0 0| 0 0| 2 1 | 36 1
TIFT COUNTY
| 2 1| 29 1| 20 1| 4 1| 55 1 | 0 0| 0 0| 0 0| 1 4| 1 0 | 56 1
TOOMBS COUNTY
| 2 1| 14 1| 9 0| 0 0| 25 0 | 0 0| 1 1| 0 0| 0 0| 1 0 | 26 0
TOWNS COUNTY
| 0 0| 0 0| 0 0| 0 0| 0 0 | 0 0| 0 0| 0 0| 0 0| 0 0 | 0 0
TREUTLEN COUNTY
| 0 0| 2 0| 3 0| 0 0| 5 0 | 0 0| 0 0| 0 0| 0 0| 0 0 | 5 0
TROUP COUNTY
| 3 2| 20 1| 18 1| 4 1| 45 1 | 0 0| 1 1| 1 2| 0 0| 2 1 | 47 1
------------------------------------------------------------------------------------------------------------------------------------
(continued)
Georgia Department of Corrections
June, 2000
37
Page 35 Run 06/20/00
Georgia Department of Corrections Office of Planning and Analysis Inmate statistical profile
Sample: ACTIVE PRISONERS WITH LIFE SENTENCES EXCLUDING JAIL Active inmates 06/20/2000
Home County by current age & sex
Requestor: (CONTINUED)
Statistics
|
MEN
|
WOMEN
|
| Age | Age | Age | Age | Men
| Age | Age | Age | Age |Women
|Grand
Home County
|00-21 %|22-39 %|40-54 %|55-99 %|Total % |00-21 %|22-39 %|40-54 %|55-99 %|Total % |Total %
------------------------------------------------------------------------------------------------------------------------------------
TURNER COUNTY
| 0 0| 7 0| 4 0| 0 0| 11 0 | 0 0| 0 0| 0 0| 0 0| 0 0 | 11 0
TWIGGS COUNTY
| 0 0| 5 0| 4 0| 0 0| 9 0 | 0 0| 0 0| 0 0| 0 0| 0 0 | 9 0
UNION COUNTY
| 0 0| 0 0| 0 0| 0 0| 0 0 | 0 0| 0 0| 0 0| 0 0| 0 0 | 0 0
UPSON COUNTY
| 0 0| 6 0| 5 0| 0 0| 11 0 | 0 0| 0 0| 1 2| 0 0| 1 0 | 12 0
WALKER COUNTY
| 0 0| 16 1| 6 0| 2 1| 24 0 | 0 0| 1 1| 1 2| 0 0| 2 1 | 26 0
WALTON COUNTY
| 1 1| 27 1| 16 1| 3 1| 47 1 | 0 0| 1 1| 0 0| 0 0| 1 0 | 48 1
WARE COUNTY
| 1 1| 15 1| 14 1| 2 1| 32 1 | 0 0| 0 0| 0 0| 0 0| 0 0 | 32 1
WARREN COUNTY
| 0 0| 3 0| 5 0| 1 0| 9 0 | 0 0| 0 0| 0 0| 0 0| 0 0 | 9 0
WASHINGTON COUNTY | 0 0| 14 1| 7 0| 0 0| 21 0 | 0 0| 1 1| 0 0| 0 0| 1 0 | 22 0
WAYNE COUNTY
| 0 0| 7 0| 13 1| 2 1| 22 0 | 0 0| 1 1| 0 0| 0 0| 1 0 | 23 0
WEBSTER COUNTY
| 0 0| 2 0| 0 0| 0 0| 2 0 | 0 0| 0 0| 0 0| 0 0| 0 0 | 2 0
WHEELER COUNTY
| 0 0| 1 0| 3 0| 1 0| 5 0 | 0 0| 0 0| 0 0| 0 0| 0 0 | 5 0
WHITE COUNTY
| 0 0| 3 0| 3 0| 1 0| 7 0 | 0 0| 0 0| 0 0| 0 0| 0 0 | 7 0
WHITFIELD COUNTY | 0 0| 11 0| 25 1| 5 1| 41 1 | 0 0| 2 2| 0 0| 0 0| 2 1 | 43 1
WILCOX COUNTY
| 0 0| 0 0| 6 0| 0 0| 6 0 | 0 0| 0 0| 0 0| 0 0| 0 0 | 6 0
WILKES COUNTY
| 0 0| 3 0| 2 0| 2 1| 7 0 | 0 0| 0 0| 0 0| 0 0| 0 0 | 7 0
WILKINSON COUNTY | 0 0| 7 0| 3 0| 0 0| 10 0 | 0 0| 0 0| 0 0| 0 0| 0 0 | 10 0
WORTH COUNTY
| 3 2| 12 0| 2 0| 0 0| 17 0 | 0 0| 1 1| 0 0| 0 0| 1 0 | 18 0
OUT OF STATE
| 0 2| 12 0| 58 3| 16 4| 86 2 | 0 0| 0 1| 0 0| 0 0| 0 0 | 86 2
------------------------------------------------------------------------------------------------------------------------------------
Total reported
| 187 100| 2750 100| 1869 100| 356 100| 5162 100 | 9 100| 120 100| 66 100| 25 100| 220 100 | 5382 100
|
|
|
|
|
|
|
|
|
|
|
Percent reported |
94.4|
90.8|
92.5|
90.8|
91.6 |
90.0|
93.0|
89.2|
96.2|
92.1 |
91.6
|
|
|
|
|
|
|
|
|
|
|
|
|
|
|
|
|
|
|
|
|
|
UNKNOWN
| 11 | 277 | 152 | 36 | 476
| 1 | 9 | 8 | 1 | 19
| 495
------------------------------------------------------------------------------------------------------------------------------------
Total
| 198 | 3027 | 2021 | 392 | 5638
| 10 | 129 | 74 | 26 | 239
| 5877
Georgia Department of Corrections
June, 2000
38
Georgia Department of Corrections
Page 36 Run 06/20/00
Office of Planning and Analysis
Inmate statistical profile
Sample: ACTIVE PRISONERS WITH LIFE SENTENCES EXCLUDING JAIL
Requestor:
Active inmates 06/20/2000
Prison Sentence In Years by current age & sex
Statistics
|
MEN
|
WOMEN
|
| Age | Age | Age | Age | Men
| Age | Age | Age | Age |Women
|Grand
Sentence In Years |00-21 %|22-39 %|40-54 %|55-99 %|Total % |00-21 %|22-39 %|40-54 %|55-99 %|Total % |Total %
------------------------------------------------------------------------------------------------------------------------------------
0-1
| 0 0| 0 0| 0 0| 0 0| 0 0 | 0 0| 0 0| 0 0| 0 0| 0 0 | 0 0
1.1-2
| 0 0| 0 0| 0 0| 0 0| 0 0 | 0 0| 0 0| 0 0| 0 0| 0 0 | 0 0
2.1-3
| 0 0| 0 0| 0 0| 0 0| 0 0 | 0 0| 0 0| 0 0| 0 0| 0 0 | 0 0
3.1-4
| 0 0| 0 0| 0 0| 0 0| 0 0 | 0 0| 0 0| 0 0| 0 0| 0 0 | 0 0
4.1-5
| 0 0| 0 0| 0 0| 0 0| 0 0 | 0 0| 0 0| 0 0| 0 0| 0 0 | 0 0
5.1-6
| 0 0| 0 0| 0 0| 0 0| 0 0 | 0 0| 0 0| 0 0| 0 0| 0 0 | 0 0
6.1-7
| 0 0| 0 0| 0 0| 0 0| 0 0 | 0 0| 0 0| 0 0| 0 0| 0 0 | 0 0
7.1-8
| 0 0| 0 0| 0 0| 0 0| 0 0 | 0 0| 0 0| 0 0| 0 0| 0 0 | 0 0
8.1-9
| 0 0| 0 0| 0 0| 0 0| 0 0 | 0 0| 0 0| 0 0| 0 0| 0 0 | 0 0
9.1-10
| 0 0| 0 0| 0 0| 0 0| 0 0 | 0 0| 0 0| 0 0| 0 0| 0 0 | 0 0
10.1-12
| 0 0| 0 0| 0 0| 0 0| 0 0 | 0 0| 0 0| 0 0| 0 0| 0 0 | 0 0
12.1-15
| 0 0| 0 0| 0 0| 0 0| 0 0 | 0 0| 0 0| 0 0| 0 0| 0 0 | 0 0
15.1-20
| 0 0| 0 0| 0 0| 0 0| 0 0 | 0 0| 0 0| 0 0| 0 0| 0 0 | 0 0
20.1-OVER
| 0 0| 0 0| 0 0| 0 0| 0 0 | 0 0| 0 0| 0 0| 0 0| 0 0 | 0 0
LIFE
| 198 100| 3027 100| 2021 100| 392 100| 5638 100 | 10 100| 129 100| 74 100| 26 100| 239 100 | 5877 100
DEATH
| 0 0| 0 0| 0 0| 0 0| 0 0 | 0 0| 0 0| 0 0| 0 0| 0 0 | 0 0
LIFE W/O PAROLE
| 0 0| 0 0| 0 0| 0 0| 0 0 | 0 0| 0 0| 0 0| 0 0| 0 0 | 0 0
YOUTHFUL OFFENDERS | 0 0| 0 0| 0 0| 0 0| 0 0 | 0 0| 0 0| 0 0| 0 0| 0 0 | 0 0
------------------------------------------------------------------------------------------------------------------------------------
Total reported
| 198 100| 3027 100| 2021 100| 392 100| 5638 100 | 10 100| 129 100| 74 100| 26 100| 239 100 | 5877 100
|
|
|
|
|
|
|
|
|
|
|
Percent reported | 100.0| 100.0| 100.0| 100.0| 100.0 | 100.0| 100.0| 100.0| 100.0| 100.0 | 100.0
|
|
|
|
|
|
|
|
|
|
|
|
|
|
|
|
|
|
|
|
|
|
NOT REPORTED
|0|0|0|0|0
|0|0|0|0|0
|0
------------------------------------------------------------------------------------------------------------------------------------
Total
| 198 | 3027 | 2021 | 392 | 5638
| 10 | 129 | 74 | 26 | 239
| 5877
|
|
|
|
|
|
|
|
|
|
|
|
|
|
|
|
|
|
|
|
|
|
|
|
|
|
|
|
|
|
|
|
|
|
|
|
|
|
|
|
|
|
|
|
|
|
|
|
|
|
|
|
|
|
|
AVG EXCLUDING
|
|
|
|
|
|
|
|
|
|
|
LIFE, DEATH, YO
| .00 | .00 | .00 | .00 | .00 | .00 | .00 | .00 | .00 | .00 | .00
|
|
|
|
|
|
|
|
|
|
|
|
|
|
|
|
|
|
|
|
|
|
|
|
|
|
|
|
|
|
|
|
|
|
|
|
|
|
|
|
|
|
|
|
|
|
|
|
|
|
|
|
|
|
|
AVG INCLUDING
|
|
|
|
|
|
|
|
|
|
|
LIFE=21, YO=3 YRS | 21.00 | 21.00 | 21.00 | 21.00 | 21.00 | 21.00 | 21.00 | 21.00 | 21.00 | 21.00 | 21.00
Georgia Department of Corrections
June, 2000
39
Page 37 Run 06/20/00
Georgia Department of Corrections Office of Planning and Analysis
Inmate statistical profile
Sample: ACTIVE PRISONERS WITH LIFE SENTENCES EXCLUDING JAIL
Requestor:
Active inmates 06/20/2000
Probation To Follow Prison by current age & sex
Statistics
|
MEN
|
WOMEN
|
| Age | Age | Age | Age | Men
| Age | Age | Age | Age |Women
|Grand
Prob After Prison |00-21 %|22-39 %|40-54 %|55-99 %|Total % |00-21 %|22-39 %|40-54 %|55-99 %|Total % |Total %
------------------------------------------------------------------------------------------------------------------------------------
PROBATION TO FOLLOW | 11 6| 90 3| 60 3| 5 1| 166 3 | 0 0| 3 2| 3 4| 1 4| 7 3 | 173 3
NO PROBATION
| 187 94| 2937 97| 1961 97| 387 99| 5472 97 | 10 100| 126 98| 71 96| 25 96| 232 97 | 5704 97
------------------------------------------------------------------------------------------------------------------------------------
Total reported
| 198 100| 3027 100| 2021 100| 392 100| 5638 100 | 10 100| 129 100| 74 100| 26 100| 239 100 | 5877 100
|
|
|
|
|
|
|
|
|
|
|
Percent reported | 100.0| 100.0| 100.0| 100.0| 100.0 | 100.0| 100.0| 100.0| 100.0| 100.0 | 100.0
|
|
|
|
|
|
|
|
|
|
|
|
|
|
|
|
|
|
|
|
|
|
NOT REPORTED
|0|0|0|0|0
|0|0|0|0|0
|0
------------------------------------------------------------------------------------------------------------------------------------
Total
| 198 | 3027 | 2021 | 392 | 5638
| 10 | 129 | 74 | 26 | 239
| 5877
Georgia Department of Corrections
June, 2000
40
Page 38 Run 06/20/00
Georgia Department of Corrections Office of Planning and Analysis
Inmate statistical profile
Sample: ACTIVE PRISONERS WITH LIFE SENTENCES EXCLUDING JAIL Active inmates 06/20/2000
Admission Type by current age & sex
Requestor: Statistics
|
MEN
|
WOMEN
|
| Age | Age | Age | Age | Men
| Age | Age | Age | Age |Women
|Grand
Admission Type
|00-21 %|22-39 %|40-54 %|55-99 %|Total % |00-21 %|22-39 %|40-54 %|55-99 %|Total % |Total %
------------------------------------------------------------------------------------------------------------------------------------
COMMITTED FROM COURT| 195 98| 2434 80| 1477 73| 281 72| 4387 78 | 10 100| 116 90| 63 85| 26 100| 215 90 | 4602 78
RETURN APPEAL/BOND | 0 0| 0 0| 1 0| 0 0| 1 0 | 0 0| 0 0| 0 0| 0 0| 0 0 | 1 0
PAROLE REV/NEW SENT | 0 0| 375 12| 341 17| 68 17| 784 14 | 0 0| 10 8| 6 8| 0 0| 16 7 | 800 14
PAR REV/NO NEW SENT | 0 0| 23 1| 65 3| 9 2| 97 2 | 0 0| 0 0| 1 1| 0 0| 1 0 | 98 2
PROB VIOL/TOTAL REV | 0 0| 0 0| 0 0| 0 0| 0 0 | 0 0| 0 0| 0 0| 0 0| 0 0 | 0 0
PROB VIOL/PARTIAL | 0 0| 39 1| 37 2| 3 1| 79 1 | 0 0| 0 0| 2 3| 0 0| 2 1 | 81 1
ADMIT FM OTHER CUST | 0 0| 1 0| 2 0| 4 1| 7 0 | 0 0| 0 0| 0 0| 0 0| 0 0 | 7 0
SHOCK INCARCERATION | 0 0| 0 0| 0 0| 0 0| 0 0 | 0 0| 0 0| 0 0| 0 0| 0 0 | 0 0
PROB REV/REMAINDER | 2 1| 117 4| 44 2| 7 2| 170 3 | 0 0| 3 2| 2 3| 0 0| 5 2 | 175 3
NEW SENT/PAR REV PND| 0 0| 2 0| 4 0| 1 0| 7 0 | 0 0| 0 0| 0 0| 0 0| 0 0 | 7 0
LIFE W/O PAROLE
| 1 1| 11 0| 3 0| 0 0| 15 0 | 0 0| 0 0| 0 0| 0 0| 0 0 | 15 0
PAROLE REV BOOT CAMP| 0 0| 2 0| 1 0| 0 0| 3 0 | 0 0| 0 0| 0 0| 0 0| 0 0 | 3 0
PAR REV/RSN UNKNOWN | 0 0| 19 1| 39 2| 18 5| 76 1 | 0 0| 0 0| 0 0| 0 0| 0 0 | 76 1
PROBATION/PAROLE REV| 0 0| 0 0| 0 0| 0 0| 0 0 | 0 0| 0 0| 0 0| 0 0| 0 0 | 0 0
PB PAROLE RESCINDED | 0 0| 0 0| 0 0| 0 0| 0 0 | 0 0| 0 0| 0 0| 0 0| 0 0 | 0 0
PROB REVOCATION/SC | 0 0| 0 0| 0 0| 0 0| 0 0 | 0 0| 0 0| 0 0| 0 0| 0 0 | 0 0
PAR REV/REVOC CENTER| 0 0| 3 0| 6 0| 1 0| 10 0 | 0 0| 0 0| 0 0| 0 0| 0 0 | 10 0
INFORMATION ONLY | 0 0| 0 0| 0 0| 0 0| 0 0 | 0 0| 0 0| 0 0| 0 0| 0 0 | 0 0
INCOMPLETE SENT PKG | 0 0| 0 0| 0 0| 0 0| 0 0 | 0 0| 0 0| 0 0| 0 0| 0 0 | 0 0
HANCOCK REVOC CENTER| 0 0| 0 0| 0 0| 0 0| 0 0 | 0 0| 0 0| 0 0| 0 0| 0 0 | 0 0
WHITWORTH DETENTION | 0 0| 0 0| 1 0| 0 0| 1 0 | 0 0| 0 0| 0 0| 0 0| 0 0 | 1 0
DCYS AT RISK
| 0 0| 0 0| 0 0| 0 0| 0 0 | 0 0| 0 0| 0 0| 0 0| 0 0 | 0 0
OTHER
| 0 0| 0 0| 0 0| 0 0| 0 0 | 0 0| 0 0| 0 0| 0 0| 0 0 | 0 0
------------------------------------------------------------------------------------------------------------------------------------
Total reported
| 198 100| 3026 100| 2021 100| 392 100| 5637 100 | 10 100| 129 100| 74 100| 26 100| 239 100 | 5876 100
|
|
|
|
|
|
|
|
|
|
|
Percent reported | 100.0| 100.0| 100.0| 100.0| 100.0 | 100.0| 100.0| 100.0| 100.0| 100.0 | 100.0
|
|
|
|
|
|
|
|
|
|
|
|
|
|
|
|
|
|
|
|
|
|
UNKNOWN
|0|1|0|0|1
|0|0|0|0|0
|1
------------------------------------------------------------------------------------------------------------------------------------
Total
| 198 | 3027 | 2021 | 392 | 5638
| 10 | 129 | 74 | 26 | 239
| 5877
Georgia Department of Corrections
June, 2000
41
Page 39 Run 06/20/00
Georgia Department of Corrections Office of Planning and Analysis Inmate statistical profile
Sample: ACTIVE PRISONERS WITH LIFE SENTENCES EXCLUDING JAIL Active inmates 06/20/2000
Release Type by current age & sex
Requestor: Statistics
|
MEN
|
WOMEN
|
| Age | Age | Age | Age | Men
| Age | Age | Age | Age |Women
|Grand
Release Type
|00-21 %|22-39 %|40-54 %|55-99 %|Total % |00-21 %|22-39 %|40-54 %|55-99 %|Total % |Total %
------------------------------------------------------------------------------------------------------------------------------------
PAROLE
| 0 0| 1 0| 0 0| 0 0| 1 0 | 0 0| 0 0| 0 0| 0 0| 0 0 | 1 0
Active
| 198 100| 3027 100| 2021 100| 392 100| 5638 100 | 10 100| 129 100| 74 100| 26 100| 239 100 | 5877 100
------------------------------------------------------------------------------------------------------------------------------------
Total
| 198 | 3027 | 2021 | 392 | 5638
| 10 | 129 | 74 | 26 | 239
| 5877
Georgia Department of Corrections
June, 2000
42
Page 40 Run 06/20/00
Georgia Department of Corrections Office of Planning and Analysis Inmate statistical profile
Sample: ACTIVE PRISONERS WITH LIFE SENTENCES EXCLUDING JAIL Active inmates 06/20/2000
Inst By Group by current age & sex
Requestor: Statistics
|
MEN
|
WOMEN
|
| Age | Age | Age | Age | Men
| Age | Age | Age | Age |Women
|Grand
Inst By Group
|00-21 %|22-39 %|40-54 %|55-99 %|Total % |00-21 %|22-39 %|40-54 %|55-99 %|Total % |Total %
------------------------------------------------------------------------------------------------------------------------------------
County jails
| 0 0| 0 0| 0 0| 0 0| 0 0 | 0 0| 0 0| 0 0| 0 0| 0 0 | 0 0
Transitional centers| 0 0| 18 1| 22 1| 7 2| 47 1 | 0 0| 0 0| 0 0| 1 4| 1 0 | 48 1
County camps
| 0 0| 13 0| 10 0| 4 1| 27 0 | 0 0| 0 0| 0 0| 0 0| 0 0 | 27 0
Inmate boot camps | 0 0| 0 0| 0 0| 0 0| 0 0 | 0 0| 0 0| 0 0| 0 0| 0 0 | 0 0
State prisons
| 198 100| 2904 96| 1938 96| 372 95| 5412 96 | 10 100| 129 100| 74 100| 25 96| 238 100 | 5650 96
Private prisons
| 0 0| 92 3| 51 3| 9 2| 152 3 | 0 0| 0 0| 0 0| 0 0| 0 0 | 152 3
Other
| 0 0| 0 0| 0 0| 0 0| 0 0 | 0 0| 0 0| 0 0| 0 0| 0 0 | 0 0
------------------------------------------------------------------------------------------------------------------------------------
Total reported
| 198 100| 3027 100| 2021 100| 392 100| 5638 100 | 10 100| 129 100| 74 100| 26 100| 239 100 | 5877 100
|
|
|
|
|
|
|
|
|
|
|
Percent reported | 100.0| 100.0| 100.0| 100.0| 100.0 | 100.0| 100.0| 100.0| 100.0| 100.0 | 100.0
|
|
|
|
|
|
|
|
|
|
|
|
|
|
|
|
|
|
|
|
|
|
Not reported
|0|0|0|0|0
|0|0|0|0|0
|0
------------------------------------------------------------------------------------------------------------------------------------
Total
| 198 | 3027 | 2021 | 392 | 5638
| 10 | 129 | 74 | 26 | 239
| 5877
Georgia Department of Corrections
June, 2000
43
Georgia Department of Corrections p
Page 41 Run 06/20/00
Office of Planning and Analysis
Inmate statistical profile
Sample: ACTIVE PRISONERS WITH LIFE SENTENCES EXCLUDING JAIL Active inmates 06/20/2000
Institution by current age & sex
Requestor: Statistics
|
MEN
|
WOMEN
|
| Age | Age | Age | Age | Men
| Age | Age | Age | Age |Women
|Grand
Institution
|00-21 %|22-39 %|40-54 %|55-99 %|Total % |00-21 %|22-39 %|40-54 %|55-99 %|Total % |Total %
------------------------------------------------------------------------------------------------------------------------------------
Albany Trans Ctr | 0 0| 0 0| 1 0| 1 0| 2 0 | 0 0| 0 0| 0 0| 0 0| 0 0 | 2 0
Atlanta Trans Ctr(M)| 0 0| 12 0| 13 1| 5 1| 30 1 | 0 0| 0 0| 0 0| 0 0| 0 0 | 30 1
Macon Trans Ctr
| 0 0| 3 0| 4 0| 0 0| 7 0 | 0 0| 0 0| 0 0| 0 0| 0 0 | 7 0
Metro Trans Ctr (W) | 0 0| 0 0| 0 0| 0 0| 0 0 | 0 0| 0 0| 0 0| 1 4| 1 0 | 1 0
Savannah Trans Ctr | 0 0| 3 0| 4 0| 1 0| 8 0 | 0 0| 0 0| 0 0| 0 0| 0 0 | 8 0
Carroll County
| 0 0| 0 0| 0 0| 1 0| 1 0 | 0 0| 0 0| 0 0| 0 0| 0 0 | 1 0
Clarke County
| 0 0| 1 0| 0 0| 0 0| 1 0 | 0 0| 0 0| 0 0| 0 0| 0 0 | 1 0
Colquitt County
| 0 0| 0 0| 1 0| 0 0| 1 0 | 0 0| 0 0| 0 0| 0 0| 0 0 | 1 0
Coweta County
| 0 0| 3 0| 1 0| 0 0| 4 0 | 0 0| 0 0| 0 0| 0 0| 0 0 | 4 0
Floyd County
| 0 0| 0 0| 1 0| 0 0| 1 0 | 0 0| 0 0| 0 0| 0 0| 0 0 | 1 0
Hall County
| 0 0| 2 0| 2 0| 0 0| 4 0 | 0 0| 0 0| 0 0| 0 0| 0 0 | 4 0
Jackson County
| 0 0| 1 0| 3 0| 1 0| 5 0 | 0 0| 0 0| 0 0| 0 0| 0 0 | 5 0
Jefferson County | 0 0| 2 0| 1 0| 0 0| 3 0 | 0 0| 0 0| 0 0| 0 0| 0 0 | 3 0
Mitchell County
| 0 0| 0 0| 1 0| 0 0| 1 0 | 0 0| 0 0| 0 0| 0 0| 0 0 | 1 0
Screven County
| 0 0| 1 0| 0 0| 0 0| 1 0 | 0 0| 0 0| 0 0| 0 0| 0 0 | 1 0
Stewart County
| 0 0| 0 0| 0 0| 1 0| 1 0 | 0 0| 0 0| 0 0| 0 0| 0 0 | 1 0
Terrell County
| 0 0| 0 0| 0 0| 1 0| 1 0 | 0 0| 0 0| 0 0| 0 0| 0 0 | 1 0
Clayton County
| 0 0| 3 0| 0 0| 0 0| 3 0 | 0 0| 0 0| 0 0| 0 0| 0 0 | 3 0
Ware Prison
| 16 8| 213 7| 101 5| 9 2| 339 6 | 0 0| 0 0| 0 0| 0 0| 0 0 | 339 6
Lowndes Prison
| 0 0| 5 0| 7 0| 1 0| 13 0 | 0 0| 0 0| 0 0| 0 0| 0 0 | 13 0
Dodge Prison
| 0 0| 55 2| 67 3| 5 1| 127 2 | 0 0| 0 0| 0 0| 0 0| 0 0 | 127 2
Phillips Prison
| 7 4| 139 5| 79 4| 20 5| 245 4 | 0 0| 0 0| 0 0| 0 0| 0 0 | 245 4
Walker Prison
| 0 0| 23 1| 28 1| 4 1| 55 1 | 0 0| 0 0| 0 0| 0 0| 0 0 | 55 1
Wayne Prison
| 0 0| 3 0| 5 0| 0 0| 8 0 | 0 0| 0 0| 0 0| 0 0| 0 0 | 8 0
Arrendale Prison | 50 25| 99 3| 22 1| 2 1| 173 3 | 0 0| 0 0| 0 0| 0 0| 0 0 | 173 3
Montgomery Prison | 0 0| 14 0| 15 1| 3 1| 32 1 | 0 0| 0 0| 0 0| 0 0| 0 0 | 32 1
Lee Prison
| 1 1| 28 1| 19 1| 2 1| 50 1 | 0 0| 0 0| 0 0| 0 0| 0 0 | 50 1
Putnam Prison
| 0 0| 5 0| 0 0| 0 0| 5 0 | 0 0| 0 0| 0 0| 0 0| 0 0 | 5 0
Georgia State Prison| 7 4| 286 9| 214 11| 17 4| 524 9 | 0 0| 0 0| 0 0| 0 0| 0 0 | 524 9
Mens Prison
| 0 0| 13 0| 37 2| 75 19| 125 2 | 0 0| 0 0| 0 0| 0 0| 0 0 | 125 2
Jackson Prison-Diag | 4 2| 16 1| 3 0| 0 0| 23 0 | 0 0| 0 0| 0 0| 0 0| 0 0 | 23 0
Jackson Prison-Perm | 0 0| 3 0| 1 0| 0 0| 4 0 | 0 0| 0 0| 0 0| 0 0| 0 0 | 4 0
Coastal Prison
| 5 3| 30 1| 15 1| 3 1| 53 1 | 0 0| 0 0| 0 0| 0 0| 0 0 | 53 1
Scott Prison
| 0 0| 68 2| 50 2| 11 3| 129 2 | 0 0| 0 0| 0 0| 0 0| 0 0 | 129 2
Rivers Prison
| 0 0| 76 3| 67 3| 9 2| 152 3 | 0 0| 0 0| 0 0| 0 0| 0 0 | 152 3
Rutledge Prison
| 0 0| 48 2| 64 3| 17 4| 129 2 | 0 0| 0 0| 0 0| 0 0| 0 0 | 129 2
------------------------------------------------------------------------------------------------------------------------------------
(continued)
Georgia Department of Corrections
June, 2000
44
Page 42 Run 06/20/00
Georgia Department of Corrections Office of Planning and Analysis
Inmate statistical profile
Sample: ACTIVE PRISONERS WITH LIFE SENTENCES EXCLUDING JAIL Active inmates 06/20/2000
Institution by current age & sex
Requestor: (CONTINUED)
Statistics
|
MEN
|
WOMEN
|
| Age | Age | Age | Age | Men
| Age | Age | Age | Age |Women
|Grand
Institution
|00-21 %|22-39 %|40-54 %|55-99 %|Total % |00-21 %|22-39 %|40-54 %|55-99 %|Total % |Total %
------------------------------------------------------------------------------------------------------------------------------------
Central Prison
| 0 0| 92 3| 110 5| 17 4| 219 4 | 0 0| 0 0| 0 0| 0 0| 0 0 | 219 4
Augusta Med Prison | 2 1| 71 2| 70 3| 20 5| 163 3 | 0 0| 0 0| 0 0| 0 0| 0 0 | 163 3
Rogers Prison
| 0 0| 27 1| 18 1| 0 0| 45 1 | 0 0| 0 0| 0 0| 0 0| 0 0 | 45 1
Burruss Prison
| 0 0| 7 0| 9 0| 2 1| 18 0 | 0 0| 0 0| 0 0| 0 0| 0 0 | 18 0
Bostick Prison
| 0 0| 10 0| 28 1| 30 8| 68 1 | 0 0| 0 0| 0 0| 0 0| 0 0 | 68 1
Valdosta Prison
| 5 3| 161 5| 92 5| 13 3| 271 5 | 0 0| 0 0| 0 0| 0 0| 0 0 | 271 5
Hays Prison
| 11 6| 162 5| 108 5| 16 4| 297 5 | 0 0| 0 0| 0 0| 0 0| 0 0 | 297 5
Hancock Prison
| 11 6| 226 7| 108 5| 18 5| 363 6 | 0 0| 0 0| 0 0| 0 0| 0 0 | 363 6
Telfair Prison
| 16 8| 203 7| 102 5| 10 3| 331 6 | 0 0| 0 0| 0 0| 0 0| 0 0 | 331 6
Autry Prison
| 9 5| 149 5| 93 5| 19 5| 270 5 | 0 0| 0 0| 0 0| 0 0| 0 0 | 270 5
Wilcox Prison
| 0 0| 72 2| 73 4| 6 2| 151 3 | 0 0| 0 0| 0 0| 0 0| 0 0 | 151 3
Calhoun Prison
| 9 5| 75 2| 54 3| 7 2| 145 3 | 0 0| 0 0| 0 0| 0 0| 0 0 | 145 2
Dooly Prison
| 0 0| 61 2| 76 4| 6 2| 143 3 | 0 0| 0 0| 0 0| 0 0| 0 0 | 143 2
Macon Prison
| 27 14| 252 8| 97 5| 20 5| 396 7 | 0 0| 0 0| 0 0| 0 0| 0 0 | 396 7
Smith Prison
| 16 8| 189 6| 81 4| 8 2| 294 5 | 0 0| 0 0| 0 0| 0 0| 0 0 | 294 5
Homerville Prison | 0 0| 1 0| 2 0| 0 0| 3 0 | 0 0| 0 0| 0 0| 0 0| 0 0 | 3 0
Washingtn Women Pris| 0 0| 0 0| 0 0| 0 0| 0 0 | 0 0| 36 28| 26 35| 7 27| 69 29 | 69 1
Baldwin Prison
| 2 1| 16 1| 18 1| 2 1| 38 1 | 0 0| 0 0| 0 0| 0 0| 0 0 | 38 1
Metro Womens Prison | 0 0| 0 0| 0 0| 0 0| 0 0 | 5 50| 28 22| 25 34| 9 35| 67 28 | 67 1
Pulaski Womens Pris | 0 0| 0 0| 0 0| 0 0| 0 0 | 5 50| 65 50| 23 31| 9 35| 102 43 | 102 2
Pelham PreTrans Unit| 0 0| 2 0| 3 0| 0 0| 5 0 | 0 0| 0 0| 0 0| 0 0| 0 0 | 5 0
Milan Prison
| 0 0| 0 0| 1 0| 0 0| 1 0 | 0 0| 0 0| 0 0| 0 0| 0 0 | 1 0
West Central Prison | 0 0| 4 0| 1 0| 0 0| 5 0 | 0 0| 0 0| 0 0| 0 0| 0 0 | 5 0
D Ray James Prison | 0 0| 32 1| 20 1| 3 1| 55 1 | 0 0| 0 0| 0 0| 0 0| 0 0 | 55 1
Coffee Corr Facility| 0 0| 29 1| 18 1| 3 1| 50 1 | 0 0| 0 0| 0 0| 0 0| 0 0 | 50 1
Wheeler Corr Facilty| 0 0| 31 1| 13 1| 3 1| 47 1 | 0 0| 0 0| 0 0| 0 0| 0 0 | 47 1
------------------------------------------------------------------------------------------------------------------------------------
Total reported
| 198 100| 3027 100| 2021 100| 392 100| 5638 100 | 10 100| 129 100| 74 100| 26 100| 239 100 | 5877 100
|
|
|
|
|
|
|
|
|
|
|
Percent reported | 100.0| 100.0| 100.0| 100.0| 100.0 | 100.0| 100.0| 100.0| 100.0| 100.0 | 100.0
|
|
|
|
|
|
|
|
|
|
|
|
|
|
|
|
|
|
|
|
|
|
Not Reported
|0|0|0|0|0
|0|0|0|0|0
|0
------------------------------------------------------------------------------------------------------------------------------------
Total
| 198 | 3027 | 2021 | 392 | 5638
| 10 | 129 | 74 | 26 | 239
| 5877
Georgia Department of Corrections
June, 2000
45
Page 43 Run 06/20/00
Georgia Department of Corrections Office of Planning and Analysis
Inmate statistical profile
Sample: ACTIVE PRISONERS WITH LIFE SENTENCES EXCLUDING JAIL
Requestor:
Active inmates 06/20/2000
Misdemeanors And Felonies by current age & sex
Statistics
|
MEN
|
WOMEN
|
| Age | Age | Age | Age | Men
| Age | Age | Age | Age |Women
|Grand
Crime Type
|00-21 %|22-39 %|40-54 %|55-99 %|Total % |00-21 %|22-39 %|40-54 %|55-99 %|Total % |Total %
------------------------------------------------------------------------------------------------------------------------------------
MISDEMEANOR
| 0 0| 0 0| 0 0| 0 0| 0 0 | 0 0| 0 0| 0 0| 0 0| 0 0 | 0 0
FELONY
| 198 100| 3027 100| 2021 100| 392 100| 5638 100 | 10 100| 129 100| 74 100| 26 100| 239 100 | 5877 100
------------------------------------------------------------------------------------------------------------------------------------
Total reported
| 198 100| 3027 100| 2021 100| 392 100| 5638 100 | 10 100| 129 100| 74 100| 26 100| 239 100 | 5877 100
|
|
|
|
|
|
|
|
|
|
|
Percent reported | 100.0| 100.0| 100.0| 100.0| 100.0 | 100.0| 100.0| 100.0| 100.0| 100.0 | 100.0
|
|
|
|
|
|
|
|
|
|
|
|
|
|
|
|
|
|
|
|
|
|
NOT REPORTED
|0|0|0|0|0
|0|0|0|0|0
|0
------------------------------------------------------------------------------------------------------------------------------------
Total
| 198 | 3027 | 2021 | 392 | 5638
| 10 | 129 | 74 | 26 | 239
| 5877
Georgia Department of Corrections
June, 2000
46
Page 44 Run 06/20/00
Georgia Department of Corrections Office of Planning and Analysis
Inmate statistical profile
Sample: ACTIVE PRISONERS WITH LIFE SENTENCES EXCLUDING JAIL Active inmates 06/20/2000
Crimes By Group by current age & sex
Requestor: Statistics
|
MEN
|
WOMEN
|
| Age | Age | Age | Age | Men
| Age | Age | Age | Age |Women
|Grand
Crimes By Group
|00-21 %|22-39 %|40-54 %|55-99 %|Total % |00-21 %|22-39 %|40-54 %|55-99 %|Total % |Total %
------------------------------------------------------------------------------------------------------------------------------------
HOMICIDE
| 154 78| 1857 61| 1196 59| 295 75| 3502 62 | 10 100| 110 85| 60 81| 25 96| 205 86 | 3707 63
ABORTION
| 0 0| 0 0| 0 0| 0 0| 0 0 | 0 0| 0 0| 0 0| 0 0| 0 0 | 0 0
BODILY INJRY&REL OFF| 13 7| 182 6| 91 5| 5 1| 291 5 | 0 0| 3 2| 3 4| 0 0| 6 3 | 297 5
ARSON & REL OFF
| 0 0| 1 0| 0 0| 0 0| 1 0 | 0 0| 0 0| 0 0| 0 0| 0 0 | 1 0
DAMAGE OF PROPERTY | 0 0| 1 0| 0 0| 0 0| 1 0 | 0 0| 0 0| 0 0| 0 0| 0 0 | 1 0
BURGLARY & REL OFF | 0 0| 20 1| 6 0| 0 0| 26 0 | 0 0| 0 0| 1 1| 0 0| 1 0 | 27 0
FORGERY & REL OFF | 0 0| 6 0| 4 0| 1 0| 11 0 | 0 0| 0 0| 0 0| 0 0| 0 0 | 11 0
THEFT
| 0 0| 7 0| 5 0| 0 0| 12 0 | 0 0| 0 0| 0 0| 0 0| 0 0 | 12 0
ROBBERY
| 19 10| 350 12| 237 12| 26 7| 632 11 | 0 0| 2 2| 1 1| 0 0| 3 1 | 635 11
SEXUAL OFFENSES
| 11 6| 347 11| 337 17| 52 13| 747 13 | 0 0| 0 0| 2 3| 0 0| 2 1 | 749 13
OBSCENITY CRIMES | 0 0| 0 0| 0 0| 0 0| 0 0 | 0 0| 0 0| 0 0| 0 0| 0 0 | 0 0
TREASON & REL OFF | 0 0| 0 0| 0 0| 0 0| 0 0 | 0 0| 0 0| 0 0| 0 0| 0 0 | 0 0
CRIMES INVOLVNG GOVT| 0 0| 7 0| 5 0| 1 0| 13 0 | 0 0| 0 0| 0 0| 0 0| 0 0 | 13 0
FALSIFICATIONS
| 0 0| 0 0| 0 0| 0 0| 0 0 | 0 0| 0 0| 0 0| 0 0| 0 0 | 0 0
OBSTRUCT LAW ENFORCE| 0 0| 1 0| 1 0| 0 0| 2 0 | 0 0| 0 0| 0 0| 0 0| 0 0 | 2 0
DISORDERLY CONDUCT | 0 0| 0 0| 0 0| 0 0| 0 0 | 0 0| 0 0| 0 0| 0 0| 0 0 | 0 0
GAMBLING & REL OFF | 0 0| 0 0| 0 0| 0 0| 0 0 | 0 0| 0 0| 0 0| 0 0| 0 0 | 0 0
CRUELTY TO CHILDREN | 0 0| 0 0| 0 0| 0 0| 0 0 | 0 0| 0 0| 0 0| 0 0| 0 0 | 0 0
CRIMES WITH GUNS | 0 0| 0 0| 1 0| 0 0| 1 0 | 0 0| 0 0| 0 0| 0 0| 0 0 | 1 0
INVASION PRIVACY | 0 0| 0 0| 0 0| 0 0| 0 0 | 0 0| 0 0| 0 0| 0 0| 0 0 | 0 0
RACKETEERING
| 0 0| 0 0| 0 0| 0 0| 0 0 | 0 0| 0 0| 0 0| 0 0| 0 0 | 0 0
DRUG ABUSE OFFENSES | 1 1| 228 8| 131 6| 11 3| 371 7 | 0 0| 14 11| 7 9| 1 4| 22 9 | 393 7
DRUG TRAFFICKING | 0 0| 18 1| 7 0| 1 0| 26 0 | 0 0| 0 0| 0 0| 0 0| 0 0 | 26 0
AUTO CRIMES
| 0 0| 0 0| 0 0| 0 0| 0 0 | 0 0| 0 0| 0 0| 0 0| 0 0 | 0 0
REVENUE & CONTRABAND| 0 0| 0 0| 0 0| 0 0| 0 0 | 0 0| 0 0| 0 0| 0 0| 0 0 | 0 0
CRIMES OF OTH STATES| 0 0| 0 0| 0 0| 0 0| 0 0 | 0 0| 0 0| 0 0| 0 0| 0 0 | 0 0
MISC. FELONIES
| 0 0| 1 0| 0 0| 0 0| 1 0 | 0 0| 0 0| 0 0| 0 0| 0 0 | 1 0
MISDEMEANORS
| 0 0| 0 0| 0 0| 0 0| 0 0 | 0 0| 0 0| 0 0| 0 0| 0 0 | 0 0
------------------------------------------------------------------------------------------------------------------------------------
Total reported
| 198 100| 3026 100| 2021 100| 392 100| 5637 100 | 10 100| 129 100| 74 100| 26 100| 239 100 | 5876 100
|
|
|
|
|
|
|
|
|
|
|
Percent reported | 100.0| 100.0| 100.0| 100.0| 100.0 | 100.0| 100.0| 100.0| 100.0| 100.0 | 100.0
|
|
|
|
|
|
|
|
|
|
|
|
|
|
|
|
|
|
|
|
|
|
NOT REPORTED
|0|1|0|0|1
|0|0|0|0|0
|1
------------------------------------------------------------------------------------------------------------------------------------
Total
| 198 | 3027 | 2021 | 392 | 5638
| 10 | 129 | 74 | 26 | 239
| 5877
Georgia Department of Corrections
June, 2000
47
Page 45 Run 06/20/00
Georgia Department of Corrections Office of Planning and Analysis
Inmate statistical profile
Sample: ACTIVE PRISONERS WITH LIFE SENTENCES EXCLUDING JAIL
Requestor:
Active inmates 06/20/2000
Most Serious Offense by current age & sex
Statistics
|
MEN
|
WOMEN
|
| Age | Age | Age | Age | Men
| Age | Age | Age | Age |Women
|Grand
Most Serious Offense|00-21 %|22-39 %|40-54 %|55-99 %|Total % |00-21 %|22-39 %|40-54 %|55-99 %|Total % |Total %
------------------------------------------------------------------------------------------------------------------------------------
Misdemeanors
|
|
|
------------------------------------------------------------------------------------------------------------------------------------
------------------------------------------------------------------------------------------------------------------------------------
------------------------------------------------------------------------------------------------------------------------------------
FELONIES
|
|
|
------------------------------------------------------------------------------------------------------------------------------------
------------------------------------------------------------------------------------------------------------------------------------
MISC. HOMICIDE OFFEN| 0 0| 1 0| 0 0| 0 0| 1 0 | 0 0| 0 0| 0 0| 0 0| 0 0 | 1 0
MURDER
| 154 78| 1856 61| 1196 59| 294 75| 3500 62 | 10 100| 110 85| 60 81| 25 96| 205 86 | 3705 63
VOLUNTARY MANSLAUGHT| 0 0| 1 0| 0 0| 1 0| 2 0 | 0 0| 0 0| 0 0| 0 0| 0 0 | 2 0
AGGRAVATED ASSAULT | 0 0| 9 0| 0 0| 0 0| 9 0 | 0 0| 0 0| 0 0| 0 0| 0 0 | 9 0
AGGRAVATED BATTERY | 0 0| 1 0| 0 0| 0 0| 1 0 | 0 0| 0 0| 0 0| 0 0| 0 0 | 1 0
KIDNAPPING
| 13 7| 172 6| 89 4| 5 1| 279 5 | 0 0| 3 2| 3 4| 0 0| 6 3 | 285 5
AGG ASSLT ON POLICE | 0 0| 0 0| 2 0| 0 0| 2 0 | 0 0| 0 0| 0 0| 0 0| 0 0 | 2 0
SECOND DEGREE ARSON | 0 0| 1 0| 0 0| 0 0| 1 0 | 0 0| 0 0| 0 0| 0 0| 0 0 | 1 0
CRIM. DAMAGE 2ND DEG| 0 0| 1 0| 0 0| 0 0| 1 0 | 0 0| 0 0| 0 0| 0 0| 0 0 | 1 0
BURGLARY
| 0 0| 20 1| 6 0| 0 0| 26 0 | 0 0| 0 0| 1 1| 0 0| 1 0 | 27 0
FORGERY 1ST DEGREE | 0 0| 6 0| 4 0| 1 0| 11 0 | 0 0| 0 0| 0 0| 0 0| 0 0 | 11 0
THEFT BY TAKING
| 0 0| 2 0| 3 0| 0 0| 5 0 | 0 0| 0 0| 0 0| 0 0| 0 0 | 5 0
THEFT BY REC STOLEN | 0 0| 3 0| 1 0| 0 0| 4 0 | 0 0| 0 0| 0 0| 0 0| 0 0 | 4 0
THEFT BY CONVERSION | 0 0| 1 0| 1 0| 0 0| 2 0 | 0 0| 0 0| 0 0| 0 0| 0 0 | 2 0
THEFT OF MOTOR VEH, | 0 0| 1 0| 0 0| 0 0| 1 0 | 0 0| 0 0| 0 0| 0 0| 0 0 | 1 0
ROBBERY
| 0 0| 5 0| 6 0| 4 1| 15 0 | 0 0| 0 0| 0 0| 0 0| 0 0 | 15 0
ARMED ROBBERY
| 19 10| 345 11| 231 11| 22 6| 617 11 | 0 0| 2 2| 1 1| 0 0| 3 1 | 620 11
MISC. SEXUAL
| 0 0| 1 0| 0 0| 0 0| 1 0 | 0 0| 0 0| 0 0| 0 0| 0 0 | 1 0
RAPE
| 11 6| 322 11| 304 15| 41 10| 678 12 | 0 0| 0 0| 2 3| 0 0| 2 1 | 680 12
AGGRAVATED SODOMY | 0 0| 18 1| 21 1| 8 2| 47 1 | 0 0| 0 0| 0 0| 0 0| 0 0 | 47 1
CHILD MOLESTATION | 0 0| 1 0| 3 0| 1 0| 5 0 | 0 0| 0 0| 0 0| 0 0| 0 0 | 5 0
AGGRAV. CHILD MOLEST| 0 0| 5 0| 9 0| 2 1| 16 0 | 0 0| 0 0| 0 0| 0 0| 0 0 | 16 0
OBSTR OF LAW ENF OFF| 0 0| 7 0| 5 0| 1 0| 13 0 | 0 0| 0 0| 0 0| 0 0| 0 0 | 13 0
ESCAPE
| 0 0| 1 0| 1 0| 0 0| 2 0 | 0 0| 0 0| 0 0| 0 0| 0 0 | 2 0
POSS OF CERTAIN WEAP| 0 0| 0 0| 1 0| 0 0| 1 0 | 0 0| 0 0| 0 0| 0 0| 0 0 | 1 0
S/D NARCOTICS, OPIAT| 0 0| 17 1| 11 1| 1 0| 29 1 | 0 0| 1 1| 1 1| 0 0| 2 1 | 31 1
S/D DEP,STIM,CNTRF D| 0 0| 4 0| 2 0| 0 0| 6 0 | 0 0| 0 0| 0 0| 0 0| 0 0 | 6 0
SALE/DIST OF MARIJUA| 0 0| 6 0| 5 0| 1 0| 12 0 | 0 0| 0 0| 0 0| 0 0| 0 0 | 12 0
POSS NARCOTICS, OPIA| 0 0| 6 0| 2 0| 0 0| 8 0 | 0 0| 0 0| 0 0| 1 4| 1 0 | 9 0
------------------------------------------------------------------------------------------------------------------------------------
(continued)
Georgia Department of Corrections
June, 2000
48
Page 46 Run 06/20/00
Georgia Department of Corrections Office of Planning and Analysis
Inmate statistical profile
Sample: ACTIVE PRISONERS WITH LIFE SENTENCES EXCLUDING JAIL Active inmates 06/20/2000
Most Serious Offense by current age & sex
Requestor: (CONTINUED)
Statistics
|
MEN
|
WOMEN
|
| Age | Age | Age | Age | Men
| Age | Age | Age | Age |Women
|Grand
Most Serious Offense|00-21 %|22-39 %|40-54 %|55-99 %|Total % |00-21 %|22-39 %|40-54 %|55-99 %|Total % |Total %
------------------------------------------------------------------------------------------------------------------------------------
POSS DEP,STIM,CNTRF | 0 0| 0 0| 1 0| 0 0| 1 0 | 0 0| 0 0| 0 0| 0 0| 0 0 | 1 0
VIOLATE GA CNTRL SBS| 0 0| 14 0| 7 0| 0 0| 21 0 | 0 0| 1 1| 1 1| 0 0| 2 1 | 23 0
UNLWFL MFG/DEL/DIST | 0 0| 7 0| 1 0| 0 0| 8 0 | 0 0| 0 0| 0 0| 0 0| 0 0 | 8 0
SALE/DIST CONT SUB P| 0 0| 2 0| 1 0| 0 0| 3 0 | 0 0| 0 0| 0 0| 0 0| 0 0 | 3 0
SALE/DIST CONT SUB S| 0 0| 1 0| 0 0| 0 0| 1 0 | 0 0| 0 0| 0 0| 0 0| 0 0 | 1 0
SALE/DISTRIBUTION CO| 1 1| 147 5| 85 4| 6 2| 239 4 | 0 0| 12 9| 5 7| 0 0| 17 7 | 256 4
POSSESSION OF COCAIN| 0 0| 24 1| 16 1| 3 1| 43 1 | 0 0| 0 0| 0 0| 0 0| 0 0 | 43 1
COCAINE LESS 200 GRA| 0 0| 12 0| 6 0| 1 0| 19 0 | 0 0| 0 0| 0 0| 0 0| 0 0 | 19 0
COCAINE 401 OR MORE | 0 0| 5 0| 0 0| 0 0| 5 0 | 0 0| 0 0| 0 0| 0 0| 0 0 | 5 0
NARCOTICS LESS 14 GR| 0 0| 0 0| 1 0| 0 0| 1 0 | 0 0| 0 0| 0 0| 0 0| 0 0 | 1 0
ATT/CONSPRCY COMMT C| 0 0| 1 0| 0 0| 0 0| 1 0 | 0 0| 0 0| 0 0| 0 0| 0 0 | 1 0
CONSPIRACY
| 0 0| 1 0| 0 0| 0 0| 1 0 | 0 0| 0 0| 0 0| 0 0| 0 0 | 1 0
------------------------------------------------------------------------------------------------------------------------------------
Total reported
| 198 100| 3027 100| 2021 100| 392 100| 5638 100 | 10 100| 129 100| 74 100| 26 100| 239 100 | 5877 100
|
|
|
|
|
|
|
|
|
|
|
Percent reported | 100.0| 100.0| 100.0| 100.0| 100.0 | 100.0| 100.0| 100.0| 100.0| 100.0 | 100.0
|
|
|
|
|
|
|
|
|
|
|
|
|
|
|
|
|
|
|
|
|
|
NOT REPORTED
|0|0|0|0|0
|0|0|0|0|0
|0
------------------------------------------------------------------------------------------------------------------------------------
Total
| 198 | 3027 | 2021 | 392 | 5638
| 10 | 129 | 74 | 26 | 239
| 5877
Georgia Department of Corrections
June, 2000
49
Page 47 Run 06/20/00
Georgia Department of Corrections Office of Planning and Analysis
Inmate statistical profile
Sample: ACTIVE PRISONERS WITH LIFE SENTENCES EXCLUDING JAIL
Requestor:
Active inmates 06/20/2000
Most Serious Crime Type by current age & sex
Statistics
|
MEN
|
WOMEN
|
| Age | Age | Age | Age | Men
| Age | Age | Age | Age |Women
|Grand
Crime Type
|00-21 %|22-39 %|40-54 %|55-99 %|Total % |00-21 %|22-39 %|40-54 %|55-99 %|Total % |Total %
------------------------------------------------------------------------------------------------------------------------------------
VIOL/PERSN
| 186 94| 2390 79| 1524 75| 326 83| 4426 79 | 10 100| 115 89| 64 86| 25 96| 214 90 | 4640 79
NVIOL/PERS
| 0 0| 0 0| 0 0| 0 0| 0 0 | 0 0| 0 0| 0 0| 0 0| 0 0 | 0 0
PROPERTY
| 0 0| 35 1| 15 1| 1 0| 51 1 | 0 0| 0 0| 1 1| 0 0| 1 0 | 52 1
DRUG SALES
| 1 1| 202 7| 112 6| 9 2| 324 6 | 0 0| 13 10| 6 8| 0 0| 19 8 | 343 6
DRUG POSSN
| 0 0| 44 1| 26 1| 3 1| 73 1 | 0 0| 1 1| 1 1| 1 4| 3 1 | 76 1
ALCOHOL
| 0 0| 0 0| 0 0| 0 0| 0 0 | 0 0| 0 0| 0 0| 0 0| 0 0 | 0 0
HABIT/DUI
| 0 0| 0 0| 0 0| 0 0| 0 0 | 0 0| 0 0| 0 0| 0 0| 0 0 | 0 0
SEX OFFEND
| 11 6| 347 11| 337 17| 52 13| 747 13 | 0 0| 0 0| 2 3| 0 0| 2 1 | 749 13
OTHER
| 0 0| 9 0| 7 0| 1 0| 17 0 | 0 0| 0 0| 0 0| 0 0| 0 0 | 17 0
------------------------------------------------------------------------------------------------------------------------------------
Total reported
| 198 100| 3027 100| 2021 100| 392 100| 5638 100 | 10 100| 129 100| 74 100| 26 100| 239 100 | 5877 100
|
|
|
|
|
|
|
|
|
|
|
Percent reported | 100.0| 100.0| 100.0| 100.0| 100.0 | 100.0| 100.0| 100.0| 100.0| 100.0 | 100.0
|
|
|
|
|
|
|
|
|
|
|
|
|
|
|
|
|
|
|
|
|
|
NOT REPORTED
|0|0|0|0|0
|0|0|0|0|0
|0
------------------------------------------------------------------------------------------------------------------------------------
Total
| 198 | 3027 | 2021 | 392 | 5638
| 10 | 129 | 74 | 26 | 239
| 5877
Georgia Department of Corrections
June, 2000
50
Georgia Department of Corrections
June, 2000
51