- Collection:
- Georgia Government Publications
- Title:
- Inmate statistical profile: active lifers, 2000-05-01
- Creator:
- Georgia. Department of Corrections. Planning and Analysis Section
- Publisher:
- Atlanta, GA. : Georgia Dept. of Corrections, Office of Planning and Analysis, 2000-05-01
- Date of Original:
- 2000-05-01
- Subject:
- Prisoners--Georgia
- Location:
- United States, Georgia, 32.75042, -83.50018
- Medium:
- state government records
- Type:
- Text
- Format:
- application/pdf
- External Identifiers:
- Call Number GA R300.P5 P1 L5 2000/5
- Metadata URL:
- https://dlg.galileo.usg.edu/id:dlg_ggpd_i-ga-br300-pp5-bp1-bl5-b2000-s5-belec-p-btext
- Digital Object URL:
- https://dlg.galileo.usg.edu/do:dlg_ggpd_i-ga-br300-pp5-bp1-bl5-b2000-s5-belec-p-btext
- Language:
- eng
- Holding Institution:
- University of Georgia. Map and Government Information Library
- Rights:
-

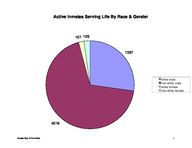
Active Inmates Serving Life By Race & Gender
107 129
1597
white male non-white male white female non-white female
4016
Georgia Dept. of Corrections
1
Number of Inmates
Prior Georgia Incarcerations of Active Inmates Serving A Life Sentence
4000
3510
3500
3000
2500
2000
1500
1000
500
0 zero
Georgia Dept. of Corrections
1219
one
604 320
two
three
Priors
125
four
71
five or more
2
Active Inmates Serving Life By Crime Type
17 745 78 350 53
4606
viol/persn
property
drug sales
drug possn
sex offend
other
Georgia Dept. of Corrections
3
Georgia Department of Corrections
Page 1 Run 05/01/00
Office of Planning and Analysis
LIFERS Inmate statistical profile TABLE OF CONTENTS FOR ACTIVE PRISONERS EXCLUDING JAIL
TITLE ----RACE AND SEX............................ 2 Culture Fair IQ Scores.................. 3 Self-Rpt Socioeconomic Class............ 4 Self-Rpt Environment To Age 16.......... 5 Self-Rpt Education Level................ 6 Functional Reading Level (WRAT Scores).. 7 Functional Math Level (WRAT Scores)..... 8 Functional Spelling Level (WRAT Scores). 9 Self-Rpt Guardian Status To Age 16......10 Self-Rpt Employment Status Before Prison11 Self-Rpt Marital Status At Admission....12 Self-Rpt Number Of Children At Admission13 Self-Rpt Religious Affiliation..........14 Self-Rpt Family Behavior Patterns *.....15 Inmate Diagnostic Behavior Problem *....16 Physical Profile (General Condition)....17 Security Status.........................18 Number Of Sentences.....................19 Number Of Disciplinaries................20 Number Of Escapes.......................21 Number Of Prior Georgia Incarcerations *22 Number Of Transfers.....................23 County Of Conviction....................24 Circuit Of Conviction...................29 Home County.............................31 Prison Sentence In Years................36 Probation To Follow Prison..............37 Admission Type..........................38 Release Type............................39 Inst By Group...........................40 Institution.............................41 Misdemeanors And Felonies...............43 Crimes By Group.........................44 Most Serious Offense....................45 Most Serious Crime Type.................47
PAGE ----
Georgia Dept. of Corrections
4
Page 2 Run 05/01/00
Georgia Department of Corrections Office of Planning and Analysis
LIFERS Inmate statistical profile
Sample: ACTIVE PRISONERS EXCLUDING JAIL Active inmates 05/01/2000
Requestor: Statistics RACE AND SEX by current age & sex
|
MEN
|
WOMEN
|
| Age | Age | Age | Age | Men
| Age | Age | Age | Age |Women
|Grand
RACE AND SEX
|00-21 %|22-39 %|40-54 %|55-99 %|Total % |00-21 %|22-39 %|40-54 %|55-99 %|Total % |Total %
------------------------------------------------------------------------------------------------------------------------------------
WHITE MALE
| 34 17| 701 23| 668 34| 194 50| 1597 28 | 0 0| 0 0| 0 0| 0 0| 0 0 | 1597 27
NON WHITE MALE
| 170 83| 2335 77| 1320 66| 191 50| 4016 72 | 0 0| 0 0| 0 0| 0 0| 0 0 | 4016 69
WHITE FEMALE
| 0 0| 0 0| 0 0| 0 0| 0 0 | 5 50| 48 38| 37 51| 17 65| 107 45 | 107 2
NON WHITE FEMALE | 0 0| 0 0| 0 0| 0 0| 0 0 | 5 50| 80 63| 35 49| 9 35| 129 55 | 129 2
------------------------------------------------------------------------------------------------------------------------------------
Total reported
| 204 100| 3036 100| 1988 100| 385 100| 5613 100 | 10 100| 128 100| 72 100| 26 100| 236 100 | 5849 100
|
|
|
|
|
|
|
|
|
|
|
Percent reported | 100.0| 100.0| 100.0| 100.0| 100.0 | 100.0| 100.0| 100.0| 100.0| 100.0 | 100.0
|
|
|
|
|
|
|
|
|
|
|
|
|
|
|
|
|
|
|
|
|
|
NOT REPORTED
|0|0|0|0|0
|0|0|0|0|0
|0
------------------------------------------------------------------------------------------------------------------------------------
Total
| 204 | 3036 | 1988 | 385 | 5613
| 10 | 128 | 72 | 26 | 236
| 5849
|
|
|
|
|
|
|
|
|
|
|
|
|
|
|
|
|
|
|
|
|
|
|
|
|
|
|
|
|
|
|
|
|
|
|
|
|
|
|
|
|
|
|
|
|
|
|
|
|
|
|
|
|
|
|
AVERAGE AGE
| 20.01 | 31.25 | 45.73 | 61.29 | 38.03 | 19.50 | 31.82 | 45.35 | 60.08 | 38.54 | 38.05
Georgia Dept. of Corrections
5
Page
3 Run 05/01/00
Georgia Department of Corrections Office of Planning and Analysis
LIFERS Inmate statistical profile
Sample: ACTIVE PRISONERS EXCLUDING JAIL Active inmates 05/01/2000
Requestor: Statistics Culture Fair IQ Scores by current age & sex
|
MEN
|
WOMEN
|
| Age | Age | Age | Age | Men
| Age | Age | Age | Age |Women
|Grand
IQ Score
|00-21 %|22-39 %|40-54 %|55-99 %|Total % |00-21 %|22-39 %|40-54 %|55-99 %|Total % |Total %
------------------------------------------------------------------------------------------------------------------------------------
LESS THAN 70
| 3 2| 89 3| 152 8| 36 11| 280 5 | 0 0| 10 8| 10 14| 2 9| 22 10 | 302 5
70 AND UP
| 194 98| 2807 97| 1698 92| 300 89| 4999 95 | 9 100| 115 92| 59 86| 21 91| 204 90 | 5203 95
------------------------------------------------------------------------------------------------------------------------------------
Total reported
| 197 100| 2896 100| 1850 100| 336 100| 5279 100 | 9 100| 125 100| 69 100| 23 100| 226 100 | 5505 100
|
|
|
|
|
|
|
|
|
|
|
Percent reported |
96.6|
95.4|
93.1|
87.3|
94.0 |
90.0|
97.7|
95.8|
88.5|
95.8 |
94.1
|
|
|
|
|
|
|
|
|
|
|
|
|
|
|
|
|
|
|
|
|
|
NOT REPORTED
| 7 | 140 | 138 | 49 | 334
| 1 | 3 | 3 | 3 | 10
| 344
------------------------------------------------------------------------------------------------------------------------------------
Total
| 204 | 3036 | 1988 | 385 | 5613
| 10 | 128 | 72 | 26 | 236
| 5849
|
|
|
|
|
|
|
|
|
|
|
|
|
|
|
|
|
|
|
|
|
|
|
|
|
|
|
|
|
|
|
|
|
|
|
|
|
|
|
|
|
|
|
|
|
|
|
|
|
|
|
|
|
|
|
AVERAGE IQ
| 98.77 | 101.26 | 96.78 | 93.54 | 99.11 | 93.33 | 95.32 | 89.29 | 88.00 | 92.65 | 98.84
Georgia Dept. of Corrections
6
Page
4 Run 05/01/00
Georgia Department of Corrections Office of Planning and Analysis LIFERS Inmate statistical profile
Sample: ACTIVE PRISONERS EXCLUDING JAIL
Requestor: Statistics
Active inmates 05/01/2000
Self-Rpt Socioeconomic Class by current age & sex
|
MEN
|
WOMEN
|
| Age | Age | Age | Age | Men
| Age | Age | Age | Age |Women
|Grand
Socioeconomic Class |00-21 %|22-39 %|40-54 %|55-99 %|Total % |00-21 %|22-39 %|40-54 %|55-99 %|Total % |Total %
------------------------------------------------------------------------------------------------------------------------------------
WELFARE
| 24 13| 353 12| 192 10| 22 6| 591 11 | 1 10| 19 15| 8 11| 0 0| 28 12 | 619 11
OCC EMPLOY
| 11 6| 195 7| 61 3| 5 1| 272 5 | 0 0| 4 3| 0 0| 1 4| 5 2 | 277 5
MINIMUM STD
| 80 42| 986 34| 859 45| 209 57| 2134 40 | 3 30| 46 37| 20 28| 8 35| 77 33 | 2211 39
MIDDLE
| 73 39| 1358 47| 806 42| 126 35| 2363 44 | 6 60| 55 44| 42 58| 13 57| 116 50 | 2479 44
OTHER
| 1 1| 27 1| 6 0| 2 1| 36 1 | 0 0| 2 2| 2 3| 1 4| 5 2 | 41 1
------------------------------------------------------------------------------------------------------------------------------------
Total reported
| 189 100| 2919 100| 1924 100| 364 100| 5396 100 | 10 100| 126 100| 72 100| 23 100| 231 100 | 5627 100
|
|
|
|
|
|
|
|
|
|
|
Percent reported |
92.6|
96.1|
96.8|
94.5|
96.1 | 100.0|
98.4| 100.0|
88.5|
97.9 |
96.2
|
|
|
|
|
|
|
|
|
|
|
|
|
|
|
|
|
|
|
|
|
|
NOT RPTD
| 15 | 117 | 64 | 21 | 217
|0|2|0|3|5
| 222
------------------------------------------------------------------------------------------------------------------------------------
Total
| 204 | 3036 | 1988 | 385 | 5613
| 10 | 128 | 72 | 26 | 236
| 5849
Georgia Dept. of Corrections
7
Page
5 Run 05/01/00
Georgia Department of Corrections Office of Planning and Analysis LIFERS Inmate statistical profile
Sample: ACTIVE PRISONERS EXCLUDING JAIL
Requestor: Statistics
Active inmates 05/01/2000
Self-Rpt Environment To Age 16 by current age & sex
|
MEN
|
WOMEN
|
| Age | Age | Age | Age | Men
| Age | Age | Age | Age |Women
|Grand
Environment
|00-21 %|22-39 %|40-54 %|55-99 %|Total % |00-21 %|22-39 %|40-54 %|55-99 %|Total % |Total %
------------------------------------------------------------------------------------------------------------------------------------
RURAL/FARM
| 0 0| 115 4| 170 9| 94 25| 379 7 | 0 0| 8 6| 4 6| 3 14| 15 7 | 394 7
RURAL/NFARM
| 4 2| 219 7| 164 8| 31 8| 418 8 | 0 0| 8 6| 2 3| 0 0| 10 4 | 428 8
S.M.S.A
| 97 48| 1193 40| 697 36| 92 25| 2079 38 | 3 30| 27 21| 19 26| 6 27| 55 24 | 2134 37
URBAN
| 37 18| 523 18| 342 18| 47 13| 949 17 | 3 30| 29 23| 18 25| 3 14| 53 23 | 1002 18
SMALL TOWN
| 65 32| 902 30| 551 29| 106 29| 1624 30 | 4 40| 54 43| 27 38| 9 41| 94 41 | 1718 30
OTHER
| 1 0| 15 1| 9 0| 0 0| 25 0 | 0 0| 0 0| 2 3| 1 5| 3 1 | 28 0
------------------------------------------------------------------------------------------------------------------------------------
Total reported
| 204 100| 2967 100| 1933 100| 370 100| 5474 100 | 10 100| 126 100| 72 100| 22 100| 230 100 | 5704 100
|
|
|
|
|
|
|
|
|
|
|
Percent reported | 100.0|
97.7|
97.2|
96.1|
97.5 | 100.0|
98.4| 100.0|
84.6|
97.5 |
97.5
|
|
|
|
|
|
|
|
|
|
|
|
|
|
|
|
|
|
|
|
|
|
NOT RPTD
| 0 | 69 | 55 | 15 | 139
|0|2|0|4|6
| 145
------------------------------------------------------------------------------------------------------------------------------------
Total
| 204 | 3036 | 1988 | 385 | 5613
| 10 | 128 | 72 | 26 | 236
| 5849
Georgia Dept. of Corrections
8
Page
6 Run 05/01/00
Georgia Department of Corrections Office of Planning and Analysis
LIFERS Inmate statistical profile
Sample: ACTIVE PRISONERS EXCLUDING JAIL Active inmates 05/01/2000
Requestor: Statistics Self-Rpt Education Level by current age & sex
|
MEN
|
WOMEN
|
| Age | Age | Age | Age | Men
| Age | Age | Age | Age |Women
|Grand
Education Level
|00-21 %|22-39 %|40-54 %|55-99 %|Total % |00-21 %|22-39 %|40-54 %|55-99 %|Total % |Total %
------------------------------------------------------------------------------------------------------------------------------------
LESS THAN GRADE 7 | 6 3| 48 2| 109 6| 79 21| 242 4 | 0 0| 1 1| 3 4| 5 20| 9 4 | 251 4
GRADE 7
| 12 6| 81 3| 62 3| 34 9| 189 3 | 1 10| 5 4| 3 4| 1 4| 10 4 | 199 3
GRADE 8
| 48 24| 265 9| 190 10| 37 10| 540 10 | 2 20| 13 10| 8 11| 1 4| 24 10 | 564 10
GRADE 9
| 46 23| 445 15| 236 12| 33 9| 760 14 | 4 40| 18 14| 4 6| 0 0| 26 11 | 786 14
GRADE 10
| 45 22| 595 20| 276 14| 32 9| 948 17 | 2 20| 23 18| 8 11| 3 12| 36 15 | 984 17
GRADE 11
| 37 18| 536 18| 217 11| 24 6| 814 15 | 1 10| 17 13| 4 6| 2 8| 24 10 | 838 15
GRADE 12
| 7 3| 770 26| 623 32| 92 24| 1492 27 | 0 0| 29 23| 25 35| 9 36| 63 27 | 1555 27
MORE THAN GRADE 12 | 2 1| 256 9| 245 13| 45 12| 548 10 | 0 0| 20 16| 17 24| 4 16| 41 18 | 589 10
------------------------------------------------------------------------------------------------------------------------------------
Total reported
| 203 100| 2996 100| 1958 100| 376 100| 5533 100 | 10 100| 126 100| 72 100| 25 100| 233 100 | 5766 100
|
|
|
|
|
|
|
|
|
|
|
Percent reported |
99.5|
98.7|
98.5|
97.7|
98.6 | 100.0|
98.4| 100.0|
96.2|
98.7 |
98.6
|
|
|
|
|
|
|
|
|
|
|
|
|
|
|
|
|
|
|
|
|
|
NOT REPORTED
| 1 | 40 | 30 | 9 | 80
|0|2|0|1|3
| 83
------------------------------------------------------------------------------------------------------------------------------------
Total
| 204 | 3036 | 1988 | 385 | 5613
| 10 | 128 | 72 | 26 | 236
| 5849
|
|
|
|
|
|
|
|
|
|
|
|
|
|
|
|
|
|
|
|
|
|
|
|
|
|
|
|
|
|
|
|
|
|
|
|
|
|
|
|
|
|
|
|
|
|
|
|
|
|
|
|
|
|
|
AVG EDUCATION LEVEL | 9.29 | 11.07 | 11.18 | 9.65 | 10.95 | 9.00 | 11.60 | 11.86 | 11.12 | 11.52 | 10.97
* NOTE: THE FIELD LABLED "LESS THAN GRADE 7" WAS CORRECTED IN MARCH 1989: MISSING DATA FOR INMATES STILL IN DIAGNOSTICS NOW HAS BEEN REMOVED FROM THIS FIELD AND IDENTIFIED AS "NOT REPORTED" INFORMATION.
Georgia Dept. of Corrections
9
Page
7 Run 05/01/00
Georgia Department of Corrections Office of Planning and Analysis LIFERS Inmate statistical profile
Sample: ACTIVE PRISONERS EXCLUDING JAIL
Requestor: Statistics
Active inmates 05/01/2000
Functional Reading Level (WRAT Scores) by current age & sex
|
MEN
|
WOMEN
|
| Age | Age | Age | Age | Men
| Age | Age | Age | Age |Women
|Grand
WRAT Reading Score |00-21 %|22-39 %|40-54 %|55-99 %|Total % |00-21 %|22-39 %|40-54 %|55-99 %|Total % |Total %
------------------------------------------------------------------------------------------------------------------------------------
LESS THAN GRADE 6 | 81 41| 1163 40| 803 46| 154 48| 2201 43 | 3 33| 50 40| 19 28| 10 42| 82 36 | 2283 42
6TH THRU 8TH GRADE | 42 21| 655 23| 402 23| 56 18| 1155 22 | 2 22| 28 22| 16 24| 4 17| 50 22 | 1205 22
GRADE 9
| 15 8| 207 7| 96 6| 19 6| 337 7 | 1 11| 4 3| 5 7| 3 13| 13 6 | 350 7
GRADE 10
| 14 7| 131 5| 71 4| 14 4| 230 4 | 1 11| 2 2| 5 7| 2 8| 10 4 | 240 4
GRADE 11
| 5 3| 116 4| 76 4| 8 3| 205 4 | 0 0| 5 4| 4 6| 1 4| 10 4 | 215 4
GRADE 12
| 32 16| 531 18| 271 16| 65 20| 899 17 | 1 11| 8 6| 1 1| 1 4| 11 5 | 910 17
MORE THAN GRADE 12 | 8 4| 97 3| 24 1| 3 1| 132 3 | 1 11| 28 22| 17 25| 3 13| 49 22 | 181 3
------------------------------------------------------------------------------------------------------------------------------------
Total reported
| 197 100| 2900 100| 1743 100| 319 100| 5159 100 | 9 100| 125 100| 67 100| 24 100| 225 100 | 5384 100
|
|
|
|
|
|
|
|
|
|
|
Percent reported |
96.6|
95.5|
87.7|
82.9|
91.9 |
90.0|
97.7|
93.1|
92.3|
95.3 |
92.0
|
|
|
|
|
|
|
|
|
|
|
|
|
|
|
|
|
|
|
|
|
|
NOT REPORTED
| 7 | 136 | 245 | 66 | 454
| 1 | 3 | 5 | 2 | 11
| 465
------------------------------------------------------------------------------------------------------------------------------------
Total
| 204 | 3036 | 1988 | 385 | 5613
| 10 | 128 | 72 | 26 | 236
| 5849
|
|
|
|
|
|
|
|
|
|
|
|
|
|
|
|
|
|
|
|
|
|
|
|
|
|
|
|
|
|
|
|
|
|
|
|
|
|
|
|
|
|
|
|
|
|
|
|
|
|
|
|
|
|
|
AVG READING SCORE | 7.53 | 7.62 | 6.96 | 6.95 | 7.35 | 8.33 | 7.78 | 8.30 | 7.32 | 7.91 | 7.38
Georgia Dept. of Corrections
10
Page
8 Run 05/01/00
Georgia Department of Corrections Office of Planning and Analysis LIFERS Inmate statistical profile
Sample: ACTIVE PRISONERS EXCLUDING JAIL
Requestor: Statistics
Active inmates 05/01/2000
Functional Math Level (WRAT Scores) by current age & sex
|
MEN
|
WOMEN
|
| Age | Age | Age | Age | Men
| Age | Age | Age | Age |Women
|Grand
WRAT Math Score
|00-21 %|22-39 %|40-54 %|55-99 %|Total % |00-21 %|22-39 %|40-54 %|55-99 %|Total % |Total %
------------------------------------------------------------------------------------------------------------------------------------
LESS THAN GRADE 6 | 74 38| 891 31| 764 44| 164 51| 1893 37 | 3 33| 50 40| 26 38| 11 46| 90 40 | 1983 37
6TH THRU 8TH GRADE | 92 47| 1435 49| 651 37| 87 27| 2265 44 | 6 67| 50 40| 27 40| 9 38| 92 41 | 2357 44
GRADE 9
| 14 7| 226 8| 109 6| 23 7| 372 7 | 0 0| 10 8| 4 6| 2 8| 16 7 | 388 7
GRADE 10
| 11 6| 136 5| 95 5| 13 4| 255 5 | 0 0| 8 6| 2 3| 1 4| 11 5 | 266 5
GRADE 11
| 3 2| 97 3| 47 3| 12 4| 159 3 | 0 0| 1 1| 3 4| 1 4| 5 2 | 164 3
GRADE 12
| 1 1| 102 4| 80 5| 18 6| 201 4 | 0 0| 2 2| 2 3| 0 0| 4 2 | 205 4
MORE THAN GRADE 12 | 2 1| 17 1| 3 0| 2 1| 24 0 | 0 0| 4 3| 4 6| 0 0| 8 4 | 32 1
------------------------------------------------------------------------------------------------------------------------------------
Total reported
| 197 100| 2904 100| 1749 100| 319 100| 5169 100 | 9 100| 125 100| 68 100| 24 100| 226 100 | 5395 100
|
|
|
|
|
|
|
|
|
|
|
Percent reported |
96.6|
95.7|
88.0|
82.9|
92.1 |
90.0|
97.7|
94.4|
92.3|
95.8 |
92.2
|
|
|
|
|
|
|
|
|
|
|
|
|
|
|
|
|
|
|
|
|
|
NOT REPORTED
| 7 | 132 | 239 | 66 | 444
| 1 | 3 | 4 | 2 | 10
| 454
------------------------------------------------------------------------------------------------------------------------------------
Total
| 204 | 3036 | 1988 | 385 | 5613
| 10 | 128 | 72 | 26 | 236
| 5849
|
|
|
|
|
|
|
|
|
|
|
|
|
|
|
|
|
|
|
|
|
|
|
|
|
|
|
|
|
|
|
|
|
|
|
|
|
|
|
|
|
|
|
|
|
|
|
|
|
|
|
|
|
|
|
AVG MATH SCORE
| 6.80 | 7.08 | 6.58 | 6.31 | 6.85 | 6.21 | 6.94 | 7.12 | 5.98 | 6.87 | 6.85
Georgia Dept. of Corrections
11
Page 9 Run 05/01/00
Georgia Department of Corrections Office of Planning and Analysis
LIFERS Inmate statistical profile
Sample: ACTIVE PRISONERS EXCLUDING JAIL
Requestor: Statistics
Active inmates 05/01/2000
Functional Spelling Level (WRAT Scores) by current age & sex
|
MEN
|
WOMEN
|
| Age | Age | Age | Age | Men
| Age | Age | Age | Age |Women
|Grand
WRAT Spelling Score |00-21 %|22-39 %|40-54 %|55-99 %|Total % |00-21 %|22-39 %|40-54 %|55-99 %|Total % |Total %
------------------------------------------------------------------------------------------------------------------------------------
LESS THAN GRADE 6 | 81 41| 1341 46| 1017 58| 188 59| 2627 51 | 3 33| 47 38| 24 35| 12 50| 86 38 | 2713 50
6TH THRU 8TH GRADE | 68 35| 753 26| 346 20| 61 19| 1228 24 | 5 56| 29 23| 17 25| 4 17| 55 24 | 1283 24
GRADE 9
| 11 6| 166 6| 101 6| 13 4| 291 6 | 0 0| 7 6| 3 4| 3 13| 13 6 | 304 6
GRADE 10
| 13 7| 177 6| 64 4| 15 5| 269 5 | 0 0| 10 8| 4 6| 0 0| 14 6 | 283 5
GRADE 11
| 7 4| 138 5| 42 2| 5 2| 192 4 | 1 11| 5 4| 3 4| 2 8| 11 5 | 203 4
GRADE 12
| 12 6| 288 10| 161 9| 36 11| 497 10 | 0 0| 7 6| 4 6| 0 0| 11 5 | 508 9
MORE THAN GRADE 12 | 5 3| 38 1| 13 1| 1 0| 57 1 | 0 0| 20 16| 13 19| 3 13| 36 16 | 93 2
------------------------------------------------------------------------------------------------------------------------------------
Total reported
| 197 100| 2901 100| 1744 100| 319 100| 5161 100 | 9 100| 125 100| 68 100| 24 100| 226 100 | 5387 100
|
|
|
|
|
|
|
|
|
|
|
Percent reported |
96.6|
95.6|
87.7|
82.9|
91.9 |
90.0|
97.7|
94.4|
92.3|
95.8 |
92.1
|
|
|
|
|
|
|
|
|
|
|
|
|
|
|
|
|
|
|
|
|
|
NOT REPORTED
| 7 | 135 | 244 | 66 | 452
| 1 | 3 | 4 | 2 | 10
| 462
------------------------------------------------------------------------------------------------------------------------------------
Total
| 204 | 3036 | 1988 | 385 | 5613
| 10 | 128 | 72 | 26 | 236
| 5849
|
|
|
|
|
|
|
|
|
|
|
|
|
|
|
|
|
|
|
|
|
|
|
|
|
|
|
|
|
|
|
|
|
|
|
|
|
|
|
|
|
|
|
|
|
|
|
|
|
|
|
|
|
|
|
AVG SPELLING SCORE | 6.88 | 6.83 | 6.02 | 5.89 | 6.50 | 7.30 | 7.80 | 7.93 | 6.60 | 7.69 | 6.55
Georgia Dept. of Corrections
12
Page 10 Run 05/01/00
Georgia Department of Corrections Office of Planning and Analysis
LIFERS Inmate statistical profile
Sample: ACTIVE PRISONERS EXCLUDING JAIL
Requestor: Statistics
Active inmates 05/01/2000
Self-Rpt Guardian Status To Age 16 by current age & sex
|
MEN
|
WOMEN
|
| Age | Age | Age | Age | Men
| Age | Age | Age | Age |Women
|Grand
Guardian Status
|00-21 %|22-39 %|40-54 %|55-99 %|Total % |00-21 %|22-39 %|40-54 %|55-99 %|Total % |Total %
------------------------------------------------------------------------------------------------------------------------------------
ORPHANAGE
| 0 0| 6 0| 2 0| 3 1| 11 0 | 0 0| 0 0| 0 0| 0 0| 0 0 | 11 0
FATHER ONLY
| 8 4| 82 3| 53 3| 6 2| 149 3 | 0 0| 2 2| 2 3| 1 4| 5 2 | 154 3
FTR MTR HD
| 10 5| 109 4| 66 3| 5 1| 190 3 | 0 0| 3 2| 3 4| 0 0| 6 3 | 196 3
MOTHER ONLY
| 116 57| 1372 46| 620 32| 98 26| 2206 40 | 4 40| 44 35| 22 31| 9 38| 79 34 | 2285 40
MTR FTR HD
| 44 22| 981 33| 937 48| 208 56| 2170 39 | 4 40| 52 41| 37 53| 13 54| 106 46 | 2276 40
OTH FEMALE
| 3 1| 52 2| 49 3| 14 4| 118 2 | 0 0| 4 3| 2 3| 0 0| 6 3 | 124 2
OTH MALE
| 1 0| 7 0| 11 1| 1 0| 20 0 | 0 0| 2 2| 1 1| 0 0| 3 1 | 23 0
STEP-PARNTS
| 3 1| 52 2| 25 1| 6 2| 86 2 | 0 0| 0 0| 0 0| 0 0| 0 0 | 86 1
FOSTER HOME
| 1 0| 25 1| 32 2| 6 2| 64 1 | 0 0| 3 2| 0 0| 0 0| 3 1 | 67 1
GRAND PRNTS
| 13 6| 238 8| 129 7| 22 6| 402 7 | 1 10| 13 10| 3 4| 1 4| 18 8 | 420 7
OTHER
| 4 2| 63 2| 23 1| 4 1| 94 2 | 1 10| 3 2| 0 0| 0 0| 4 2 | 98 2
------------------------------------------------------------------------------------------------------------------------------------
Total reported
| 203 100| 2987 100| 1947 100| 373 100| 5510 100 | 10 100| 126 100| 70 100| 24 100| 230 100 | 5740 100
|
|
|
|
|
|
|
|
|
|
|
Percent reported |
99.5|
98.4|
97.9|
96.9|
98.2 | 100.0|
98.4|
97.2|
92.3|
97.5 |
98.1
|
|
|
|
|
|
|
|
|
|
|
|
|
|
|
|
|
|
|
|
|
|
NOT RPTD
| 1 | 49 | 41 | 12 | 103
|0|2|2|2|6
| 109
------------------------------------------------------------------------------------------------------------------------------------
Total
| 204 | 3036 | 1988 | 385 | 5613
| 10 | 128 | 72 | 26 | 236
| 5849
Georgia Dept. of Corrections
13
Page 11 Run 05/01/00
Georgia Department of Corrections Office of Planning and Analysis
LIFERS Inmate statistical profile
Sample: ACTIVE PRISONERS EXCLUDING JAIL
Requestor: Statistics
Active inmates 05/01/2000
Self-Rpt Employment Status Before Prison by current age & sex
|
MEN
|
WOMEN
|
| Age | Age | Age | Age | Men
| Age | Age | Age | Age |Women
|Grand
Employment
|00-21 %|22-39 %|40-54 %|55-99 %|Total % |00-21 %|22-39 %|40-54 %|55-99 %|Total % |Total %
------------------------------------------------------------------------------------------------------------------------------------
FULL TIME
| 46 24| 961 33| 719 38| 148 42| 1874 35 | 1 10| 24 20| 13 19| 4 17| 42 19 | 1916 34
PART TIME
| 16 8| 223 8| 106 6| 15 4| 360 7 | 0 0| 6 5| 3 4| 0 0| 9 4 | 369 7
UNEMPL < 6M
| 17 9| 478 17| 320 17| 51 14| 866 16 | 0 0| 27 22| 15 22| 4 17| 46 21 | 912 16
UNEMPL > 6M
| 18 9| 943 33| 675 36| 111 31| 1747 33 | 1 10| 43 35| 30 43| 13 57| 87 39 | 1834 33
NEVER WORKD
| 72 37| 227 8| 20 1| 2 1| 321 6 | 5 50| 21 17| 4 6| 0 0| 30 13 | 351 6
STUDENT
| 23 12| 29 1| 5 0| 1 0| 58 1 | 3 30| 1 1| 2 3| 0 0| 6 3 | 64 1
INCAPABLE
| 1 1| 32 1| 54 3| 27 8| 114 2 | 0 0| 0 0| 2 3| 2 9| 4 2 | 118 2
OTHER
| 0 0| 0 0| 0 0| 0 0| 0 0 | 0 0| 0 0| 0 0| 0 0| 0 0 | 0 0
------------------------------------------------------------------------------------------------------------------------------------
Total reported
| 193 100| 2893 100| 1899 100| 355 100| 5340 100 | 10 100| 122 100| 69 100| 23 100| 224 100 | 5564 100
|
|
|
|
|
|
|
|
|
|
|
Percent reported |
94.6|
95.3|
95.5|
92.2|
95.1 | 100.0|
95.3|
95.8|
88.5|
94.9 |
95.1
|
|
|
|
|
|
|
|
|
|
|
|
|
|
|
|
|
|
|
|
|
|
NOT RPTD
| 11 | 143 | 89 | 30 | 273
| 0 | 6 | 3 | 3 | 12
| 285
------------------------------------------------------------------------------------------------------------------------------------
Total
| 204 | 3036 | 1988 | 385 | 5613
| 10 | 128 | 72 | 26 | 236
| 5849
* NOTE: THE FIELD LABELD "OTHER" WAS CORRECTED IN APRIL 1989; INMATES CODED "PRE-OTIS NOT REPORTED" NOW HAVE BEEN REMOVED FROM THIS FIELD AND IDENTIFIED AS "NOT REPORTED".
Georgia Dept. of Corrections
14
Page
12 Run 05/01/00
Georgia Department of Corrections Office of Planning and Analysis
LIFERS Inmate statistical profile
Sample: ACTIVE PRISONERS EXCLUDING JAIL
Requestor: Statistics
Active inmates 05/01/2000
Self-Rpt Marital Status At Admission by current age & sex
|
MEN
|
WOMEN
|
| Age | Age | Age | Age | Men
| Age | Age | Age | Age |Women
|Grand
Marital Status
|00-21 %|22-39 %|40-54 %|55-99 %|Total % |00-21 %|22-39 %|40-54 %|55-99 %|Total % |Total %
------------------------------------------------------------------------------------------------------------------------------------
SINGLE
| 194 95| 1983 66| 657 34| 49 13| 2883 52 | 10 100| 70 55| 11 15| 3 13| 94 41 | 2977 52
MARRIED
| 3 1| 259 9| 369 19| 106 28| 737 13 | 0 0| 15 12| 14 20| 3 13| 32 14 | 769 13
SEPARATED
| 0 0| 108 4| 165 8| 38 10| 311 6 | 0 0| 11 9| 7 10| 2 8| 20 9 | 331 6
DIVORCED
| 0 0| 154 5| 349 18| 85 23| 588 11 | 0 0| 9 7| 14 20| 6 25| 29 13 | 617 11
WIDOWED
| 1 0| 39 1| 91 5| 51 14| 182 3 | 0 0| 6 5| 17 24| 9 38| 32 14 | 214 4
COMMON LAW
| 6 3| 439 15| 319 16| 46 12| 810 15 | 0 0| 16 13| 8 11| 1 4| 25 11 | 835 15
OTHER
| 0 0| 2 0| 1 0| 0 0| 3 0 | 0 0| 0 0| 0 0| 0 0| 0 0 | 3 0
------------------------------------------------------------------------------------------------------------------------------------
Total reported
| 204 100| 2984 100| 1951 100| 375 100| 5514 100 | 10 100| 127 100| 71 100| 24 100| 232 100 | 5746 100
|
|
|
|
|
|
|
|
|
|
|
Percent reported | 100.0|
98.3|
98.1|
97.4|
98.2 | 100.0|
99.2|
98.6|
92.3|
98.3 |
98.2
|
|
|
|
|
|
|
|
|
|
|
|
|
|
|
|
|
|
|
|
|
|
NOT RPTD
| 0 | 52 | 37 | 10 | 99
|0|1|1|2|4
| 103
------------------------------------------------------------------------------------------------------------------------------------
Total
| 204 | 3036 | 1988 | 385 | 5613
| 10 | 128 | 72 | 26 | 236
| 5849
Georgia Dept. of Corrections
15
Page
13 Run 05/01/00
Georgia Department of Corrections Office of Planning and Analysis
LIFERS Inmate statistical profile
Sample: ACTIVE PRISONERS EXCLUDING JAIL
Requestor: Statistics
Active inmates 05/01/2000
Self-Rpt Number Of Children At Admission by current age & sex
|
MEN
|
WOMEN
|
| Age | Age | Age | Age | Men
| Age | Age | Age | Age |Women
|Grand
Number Of Children |00-21 %|22-39 %|40-54 %|55-99 %|Total % |00-21 %|22-39 %|40-54 %|55-99 %|Total % |Total %
------------------------------------------------------------------------------------------------------------------------------------
NO CHILDREN
| 0 0| 467 23| 260 17| 37 11| 764 19 | 0 0| 4 4| 2 3| 1 4| 7 4 | 771 19
ONE CHILD
| 44 73| 763 37| 452 29| 52 16| 1311 33 | 2 100| 29 28| 12 19| 2 8| 45 24 | 1356 33
TWO CHILDREN
| 12 20| 433 21| 350 23| 75 23| 870 22 | 0 0| 35 34| 19 30| 8 33| 62 32 | 932 22
THREE CHILDREN
| 3 5| 238 12| 229 15| 65 20| 535 13 | 0 0| 21 21| 11 17| 7 29| 39 20 | 574 14
FOUR CHILDREN
| 0 0| 85 4| 115 7| 40 12| 240 6 | 0 0| 7 7| 10 16| 4 17| 21 11 | 261 6
FIVE CHILDREN
| 1 2| 32 2| 70 5| 21 6| 124 3 | 0 0| 4 4| 4 6| 1 4| 9 5 | 133 3
MORE THAN 5 CHILDREN| 0 0| 34 2| 59 4| 39 12| 132 3 | 0 0| 2 2| 5 8| 1 4| 8 4 | 140 3
------------------------------------------------------------------------------------------------------------------------------------
Total reported
| 60 100| 2052 100| 1535 100| 329 100| 3976 100 | 2 100| 102 100| 63 100| 24 100| 191 100 | 4167 100
|
|
|
|
|
|
|
|
|
|
|
Percent reported |
29.4|
67.6|
77.2|
85.5|
70.8 |
20.0|
79.7|
87.5|
92.3|
80.9 |
71.2
|
|
|
|
|
|
|
|
|
|
|
|
|
|
|
|
|
|
|
|
|
|
NOT REPORTED
| 144 | 984 | 453 | 56 | 1637
| 8 | 26 | 9 | 2 | 45
| 1682
------------------------------------------------------------------------------------------------------------------------------------
Total
| 204 | 3036 | 1988 | 385 | 5613
| 10 | 128 | 72 | 26 | 236
| 5849
|
|
|
|
|
|
|
|
|
|
|
|
|
|
|
|
|
|
|
|
|
|
|
|
|
|
|
|
|
|
|
|
|
|
|
|
|
|
|
|
|
|
|
|
|
|
|
|
|
|
|
|
|
|
|
AVG NUM CHILDREN | 1.37 | 1.59 | 2.08 | 2.88 | 1.88 | 1.00 | 2.18 | 2.79 | 2.79 | 2.45 | 1.91
* NOTE: THE FIELD LABLED "NO CHILDREN" WAS CORRECTED IN MARCH 1989: MISSING DATA FOR INMATES STILL IN DIAGNOSTICS NOW HAS BEEN REMOVED FROM THIS FIELD AND IDENTIFIED AS "NOT REPORTED" INFORMATION.
Georgia Dept. of Corrections
16
Page
14 Run 05/01/00
Georgia Department of Corrections Office of Planning and Analysis
LIFERS Inmate statistical profile
Sample: ACTIVE PRISONERS EXCLUDING JAIL
Requestor: Statistics
Active inmates 05/01/2000
Self-Rpt Religious Affiliation by current age & sex
|
MEN
|
WOMEN
|
| Age | Age | Age | Age | Men
| Age | Age | Age | Age |Women
|Grand
Religion
|00-21 %|22-39 %|40-54 %|55-99 %|Total % |00-21 %|22-39 %|40-54 %|55-99 %|Total % |Total %
------------------------------------------------------------------------------------------------------------------------------------
ISLAM
| 4 2| 149 5| 63 3| 10 3| 226 4 | 0 0| 1 1| 0 0| 0 0| 1 0 | 227 4
CATHOLIC
| 2 1| 91 3| 59 3| 16 4| 168 3 | 0 0| 8 7| 2 3| 1 4| 11 5 | 179 3
BAPTIST
| 96 48| 1490 52| 1148 63| 208 58| 2942 56 | 5 50| 68 56| 39 57| 16 70| 128 57 | 3070 56
METHODIST
| 2 1| 72 3| 85 5| 26 7| 185 4 | 0 0| 6 5| 5 7| 1 4| 12 5 | 197 4
EPISCOPLN
| 1 1| 4 0| 4 0| 3 1| 12 0 | 0 0| 1 1| 2 3| 0 0| 3 1 | 15 0
PRESBYTRN
| 0 0| 8 0| 7 0| 3 1| 18 0 | 0 0| 0 0| 0 0| 2 9| 2 1 | 20 0
CHC OF GOD
| 0 0| 33 1| 23 1| 9 3| 65 1 | 0 0| 4 3| 1 1| 0 0| 5 2 | 70 1
HOLINESS
| 6 3| 139 5| 89 5| 21 6| 255 5 | 1 10| 16 13| 10 14| 0 0| 27 12 | 282 5
JEWISH
| 0 0| 1 0| 3 0| 1 0| 5 0 | 0 0| 0 0| 0 0| 0 0| 0 0 | 5 0
ANGLICAN
| 0 0| 0 0| 0 0| 0 0| 0 0 | 0 0| 1 1| 0 0| 0 0| 1 0 | 1 0
GRK ORTHDX
| 0 0| 0 0| 0 0| 0 0| 0 0 | 0 0| 0 0| 0 0| 0 0| 0 0 | 0 0
HINDU
| 0 0| 0 0| 0 0| 0 0| 0 0 | 0 0| 0 0| 0 0| 0 0| 0 0 | 0 0
BUDDHIST
| 2 1| 3 0| 1 0| 0 0| 6 0 | 0 0| 0 0| 0 0| 0 0| 0 0 | 6 0
TAOIST
| 0 0| 0 0| 0 0| 0 0| 0 0 | 0 0| 0 0| 0 0| 0 0| 0 0 | 0 0
SHINTOIST
| 0 0| 0 0| 0 0| 0 0| 0 0 | 0 0| 0 0| 0 0| 0 0| 0 0 | 0 0
SEVEN D AD
| 0 0| 5 0| 4 0| 1 0| 10 0 | 0 0| 0 0| 0 0| 0 0| 0 0 | 10 0
JEHOVAH WT
| 1 1| 28 1| 9 0| 0 0| 38 1 | 0 0| 0 0| 0 0| 0 0| 0 0 | 38 1
LATR DAY S
| 0 0| 3 0| 0 0| 0 0| 3 0 | 0 0| 0 0| 0 0| 0 0| 0 0 | 3 0
QUAKER
| 0 0| 0 0| 0 0| 0 0| 0 0 | 0 0| 0 0| 0 0| 0 0| 0 0 | 0 0
OTHER PROD
| 19 10| 202 7| 57 3| 15 4| 293 6 | 1 10| 4 3| 6 9| 1 4| 12 5 | 305 6
NONE
| 46 23| 415 15| 135 7| 12 3| 608 12 | 1 10| 5 4| 1 1| 0 0| 7 3 | 615 11
OTHER
| 19 10| 208 7| 133 7| 31 9| 391 7 | 2 20| 8 7| 3 4| 2 9| 15 7 | 406 7
------------------------------------------------------------------------------------------------------------------------------------
Total reported
| 198 100| 2851 100| 1820 100| 356 100| 5225 100 | 10 100| 122 100| 69 100| 23 100| 224 100 | 5449 100
|
|
|
|
|
|
|
|
|
|
|
Percent reported |
97.1|
93.9|
91.5|
92.5|
93.1 | 100.0|
95.3|
95.8|
88.5|
94.9 |
93.2
|
|
|
|
|
|
|
|
|
|
|
|
|
|
|
|
|
|
|
|
|
|
NOT RPTD
| 6 | 185 | 168 | 29 | 388
| 0 | 6 | 3 | 3 | 12
| 400
------------------------------------------------------------------------------------------------------------------------------------
Total
| 204 | 3036 | 1988 | 385 | 5613
| 10 | 128 | 72 | 26 | 236
| 5849
Georgia Dept. of Corrections
17
Page
15 Run 05/01/00
Georgia Department of Corrections Office of Planning and Analysis
LIFERS Inmate statistical profile
Sample: ACTIVE PRISONERS EXCLUDING JAIL
Requestor: Statistics
Active inmates 05/01/2000
Self-Rpt Family Behavior Patterns * by current age & sex
|
MEN
|
WOMEN
|
| Age | Age | Age | Age | Men
| Age | Age | Age | Age |Women
|Grand
Family Behavior
|00-21 %|22-39 %|40-54 %|55-99 %|Total % |00-21 %|22-39 %|40-54 %|55-99 %|Total % |Total %
------------------------------------------------------------------------------------------------------------------------------------
CRIMINLTY
| 58 22| 793 24| 498 29| 60 24| 1409 26 | 4 12| 33 19| 18 25| 2 13| 57 19 | 1466 25
ALCOHOLISM
| 20 8| 329 10| 273 16| 39 15| 661 12 | 4 12| 27 16| 12 17| 1 6| 44 15 | 705 12
DRUG ABUSE
| 14 5| 162 5| 67 4| 5 2| 248 5 | 3 9| 15 9| 5 7| 0 0| 23 8 | 271 5
DOMINERING
| 1 0| 14 0| 11 1| 0 0| 26 0 | 5 15| 10 6| 5 7| 2 13| 22 7 | 48 1
MIGRANT
| 3 1| 48 1| 41 2| 0 0| 92 2 | 1 3| 2 1| 2 3| 0 0| 5 2 | 97 2
INFL BTGS
| 7 3| 137 4| 65 4| 15 6| 224 4 | 3 9| 19 11| 4 6| 2 13| 28 10 | 252 4
PERMISSIVE
| 0 0| 8 0| 15 1| 1 0| 24 0 | 2 6| 4 2| 2 3| 0 0| 8 3 | 32 1
FATH ABSNT
| 127 49| 1431 44| 610 35| 106 42| 2274 41 | 6 18| 44 25| 15 21| 7 44| 72 24 | 2346 41
MOTH ABSNT
| 25 10| 289 9| 133 8| 29 11| 476 9 | 3 9| 13 7| 2 3| 1 6| 19 6 | 495 9
NONE
| 6 2| 37 1| 11 1| 0 0| 54 1 | 2 6| 7 4| 6 8| 1 6| 16 5 | 70 1
------------------------------------------------------------------------------------------------------------------------------------
Total reported
| 261 100| 3248 100| 1724 100| 255 100| 5488 100 | 33 100| 174 100| 71 100| 16 100| 294 100 | 5782 100
|
|
|
|
|
|
|
|
|
|
|
Percent reported |
79.9|
68.8|
60.4|
48.3|
64.8 | 100.0|
67.2|
59.7|
42.3|
63.6 |
64.8
|
|
|
|
|
|
|
|
|
|
|
|
|
|
|
|
|
|
|
|
|
|
OTHER
| 41 | 948 | 787 | 199 | 1975
| 0 | 42 | 29 | 15 | 86
| 2061
------------------------------------------------------------------------------------------------------------------------------------
Total
| 204 | 3036 | 1988 | 385 | 5613
| 10 | 128 | 72 | 26 | 236
| 5849
* NOTE: SINCE THERE CAN BE UP TO FIVE BEHAVIOR CODES PER INMATE, THE NUMBER OF CASES REPORTED IN THE DETAIL LINES AND THE TOTAL REPORTED LINE MAY EXCEED THE TOTAL NUMBER OF CASES. IN SHORT, THIS TABLE COUNTS THE NUMBER OF BEHAVIOR PROBLEMS, NOT INMATES.
Georgia Dept. of Corrections
18
Page 16 Run 05/01/00
Georgia Department of Corrections Office of Planning and Analysis
LIFERS Inmate statistical profile
Sample: ACTIVE PRISONERS EXCLUDING JAIL
Requestor: Statistics
Active inmates 05/01/2000
Inmate Diagnostic Behavior Problem * by current age & sex
|
MEN
|
WOMEN
|
| Age | Age | Age | Age | Men
| Age | Age | Age | Age |Women
|Grand
Diagnostic Problem |00-21 %|22-39 %|40-54 %|55-99 %|Total % |00-21 %|22-39 %|40-54 %|55-99 %|Total % |Total %
------------------------------------------------------------------------------------------------------------------------------------
ALCOHOLIC
| 1 0| 141 3| 136 4| 36 6| 314 3 | 1 4| 3 1| 13 11| 1 3| 18 5 | 332 3
ALCOH ABSE
| 43 11| 910 17| 610 17| 107 19| 1670 17 | 2 8| 32 15| 11 9| 6 18| 51 13 | 1721 17
DRUG EXP
| 70 18| 738 14| 342 10| 32 6| 1182 12 | 2 8| 23 11| 9 8| 0 0| 34 9 | 1216 12
DRUG ABSE
| 72 18| 967 18| 619 18| 33 6| 1691 17 | 6 23| 43 20| 21 18| 1 3| 71 18 | 1762 17
NARC ADDCT
| 1 0| 106 2| 92 3| 3 1| 202 2 | 0 0| 5 2| 1 1| 1 3| 7 2 | 209 2
EPILEPTIC
| 2 1| 26 0| 24 1| 3 1| 55 1 | 0 0| 0 0| 2 2| 0 0| 2 1 | 57 1
MANIPULTVE
| 23 6| 198 4| 98 3| 17 3| 336 3 | 1 4| 2 1| 0 0| 1 3| 4 1 | 340 3
ASSAULTIVE
| 140 35| 1278 24| 872 25| 159 28| 2449 25 | 7 27| 50 24| 26 22| 6 18| 89 23 | 2538 25
ESCPE TEND
| 8 2| 119 2| 201 6| 38 7| 366 4 | 0 0| 3 1| 3 3| 0 0| 6 2 | 372 4
SUICIDAL
| 10 3| 142 3| 100 3| 13 2| 265 3 | 4 15| 15 7| 7 6| 2 6| 28 7 | 293 3
WITHDRAWN
| 0 0| 35 1| 19 1| 8 1| 62 1 | 1 4| 2 1| 3 3| 0 0| 6 2 | 68 1
PR RLTY CT
| 1 0| 38 1| 47 1| 10 2| 96 1 | 1 4| 1 0| 2 2| 1 3| 5 1 | 101 1
HOMOSEXUAL
| 1 0| 12 0| 9 0| 5 1| 27 0 | 1 4| 4 2| 2 2| 0 0| 7 2 | 34 0
NONE
| 1 0| 317 6| 233 7| 67 12| 618 6 | 0 0| 12 6| 13 11| 10 29| 35 9 | 653 6
OTHER
| 3 1| 76 1| 56 2| 22 4| 157 2 | 0 0| 0 0| 0 0| 3 9| 3 1 | 160 2
NOT RPTD
| 20 5| 187 4| 63 2| 24 4| 294 3 | 0 0| 17 8| 6 5| 2 6| 25 6 | 319 3
------------------------------------------------------------------------------------------------------------------------------------
Total reported
| 396 100| 5298 100| 3522 100| 578 100| 9794 100 | 26 100| 212 100| 120 100| 34 100| 392 100 |10186 100
|
|
|
|
|
|
|
|
|
|
|
Percent reported | 100.0|
99.7|
99.9|
99.7|
99.8 | 100.0| 100.0|
98.6| 100.0|
99.6 |
99.8
|
|
|
|
|
|
|
|
|
|
|
|
|
|
|
|
|
|
|
|
|
|
UNKNOWN
| 0 | 8 | 1 | 1 | 10
|0|0|1|0|1
| 11
------------------------------------------------------------------------------------------------------------------------------------
Total
| 204 | 3036 | 1988 | 385 | 5613
| 10 | 128 | 72 | 26 | 236
| 5849
* NOTE: SINCE THERE CAN BE UP TO FIVE BEHAVIOR CODES PER INMATE, THE NUMBER OF CASES REPORTED IN THE DETAIL LINES AND THE TOTAL REPORTED LINE MAY EXCEED THE TOTAL NUMBER OF CASES. IN SHORT, THIS TABLE COUNTS THE NUMBER OF BEHAVIOR PROBLEMS, NOT INMATES.
Georgia Dept. of Corrections
19
Page 17 Run 05/01/00
Georgia Department of Corrections Office of Planning and Analysis
LIFERS Inmate statistical profile
Sample: ACTIVE PRISONERS EXCLUDING JAIL
Requestor: Statistics
Active inmates 05/01/2000
Physical Profile (General Condition) by current age & sex
|
MEN
|
WOMEN
|
| Age | Age | Age | Age | Men
| Age | Age | Age | Age |Women
|Grand
Physical Profile |00-21 %|22-39 %|40-54 %|55-99 %|Total % |00-21 %|22-39 %|40-54 %|55-99 %|Total % |Total %
------------------------------------------------------------------------------------------------------------------------------------
NO LIMITATION
| 177 88| 2223 74| 983 50| 70 18| 3453 62 | 9 100| 92 74| 30 42| 1 4| 132 58 | 3585 62
DEFECT NO MAJOR LIMT| 17 8| 429 14| 460 23| 98 26| 1004 18 | 0 0| 5 4| 11 15| 5 22| 21 9 | 1025 18
DEFECT MAJOR LIMIT | 7 3| 343 11| 520 26| 182 48| 1052 19 | 0 0| 27 22| 29 41| 16 70| 72 32 | 1124 19
VERY MAJOR DEFECT | 0 0| 4 0| 13 1| 30 8| 47 1 | 0 0| 0 0| 1 1| 1 4| 2 1 | 49 1
------------------------------------------------------------------------------------------------------------------------------------
Total reported
| 201 100| 2999 100| 1976 100| 380 100| 5556 100 | 9 100| 124 100| 71 100| 23 100| 227 100 | 5783 100
|
|
|
|
|
|
|
|
|
|
|
Percent reported |
98.5|
98.8|
99.4|
98.7|
99.0 |
90.0|
96.9|
98.6|
88.5|
96.2 |
98.9
|
|
|
|
|
|
|
|
|
|
|
|
|
|
|
|
|
|
|
|
|
|
NOT REPORTED
| 3 | 37 | 12 | 5 | 57
|1|4|1|3|9
| 66
------------------------------------------------------------------------------------------------------------------------------------
Total
| 204 | 3036 | 1988 | 385 | 5613
| 10 | 128 | 72 | 26 | 236
| 5849
Georgia Dept. of Corrections
20
Page
18 Run 05/01/00
Georgia Department of Corrections Office of Planning and Analysis
LIFERS Inmate statistical profile
Sample: ACTIVE PRISONERS EXCLUDING JAIL Active inmates 05/01/2000
Requestor: Statistics Security Status by current age & sex
|
MEN
|
WOMEN
|
| Age | Age | Age | Age | Men
| Age | Age | Age | Age |Women
|Grand
Security
|00-21 %|22-39 %|40-54 %|55-99 %|Total % |00-21 %|22-39 %|40-54 %|55-99 %|Total % |Total %
------------------------------------------------------------------------------------------------------------------------------------
DIAG INCOM
| 0 0| 3 0| 0 0| 0 0| 3 0 | 0 0| 0 0| 0 0| 0 0| 0 0 | 3 0
WRK RELEAS
| 0 0| 0 0| 0 0| 1 0| 1 0 | 0 0| 0 0| 0 0| 0 0| 0 0 | 1 0
TRUSTY
| 0 0| 68 2| 39 2| 4 1| 111 2 | 0 0| 0 0| 2 3| 1 4| 3 1 | 114 2
MINIMUM
| 0 0| 361 12| 398 20| 74 19| 833 15 | 0 0| 29 23| 20 28| 12 46| 61 26 | 894 15
MEDIUM
| 18 9| 1262 42| 1062 53| 237 62| 2579 46 | 1 10| 66 52| 40 56| 11 42| 118 50 | 2697 46
CLOSE
| 175 86| 1146 38| 378 19| 61 16| 1760 31 | 8 80| 33 26| 8 11| 2 8| 51 22 | 1811 31
MAXIMUM
| 10 5| 183 6| 103 5| 6 2| 302 5 | 1 10| 0 0| 2 3| 0 0| 3 1 | 305 5
DIAGNOSTIC
| 1 0| 13 0| 8 0| 2 1| 24 0 | 0 0| 0 0| 0 0| 0 0| 0 0 | 24 0
------------------------------------------------------------------------------------------------------------------------------------
Total reported
| 204 100| 3036 100| 1988 100| 385 100| 5613 100 | 10 100| 128 100| 72 100| 26 100| 236 100 | 5849 100
|
|
|
|
|
|
|
|
|
|
|
Percent reported | 100.0| 100.0| 100.0| 100.0| 100.0 | 100.0| 100.0| 100.0| 100.0| 100.0 | 100.0
|
|
|
|
|
|
|
|
|
|
|
|
|
|
|
|
|
|
|
|
|
|
NOT RPTD
|0|0|0|0|0
|0|0|0|0|0
|0
------------------------------------------------------------------------------------------------------------------------------------
Total
| 204 | 3036 | 1988 | 385 | 5613
| 10 | 128 | 72 | 26 | 236
| 5849
* NOTE: BEGINNING IN JULY 1987, THE FACILITIES DIVISION NO LONGER CODED INMATES AS BEING WORK RELEASE
Georgia Dept. of Corrections
21
Page
19 Run 05/01/00
Georgia Department of Corrections Office of Planning and Analysis
LIFERS Inmate statistical profile
Sample: ACTIVE PRISONERS EXCLUDING JAIL Active inmates 05/01/2000
Requestor: Statistics Number Of Sentences by current age & sex
|
MEN
|
WOMEN
|
| Age | Age | Age | Age | Men
| Age | Age | Age | Age |Women
|Grand
Number Of Sentences |00-21 %|22-39 %|40-54 %|55-99 %|Total % |00-21 %|22-39 %|40-54 %|55-99 %|Total % |Total %
------------------------------------------------------------------------------------------------------------------------------------
ONE
| 68 33| 733 24| 519 26| 136 35| 1456 26 | 4 40| 50 39| 33 46| 13 50| 100 42 | 1556 27
TWO
| 50 25| 724 24| 459 23| 98 25| 1331 24 | 3 30| 39 30| 17 24| 8 31| 67 28 | 1398 24
THREE
| 32 16| 499 16| 365 18| 49 13| 945 17 | 1 10| 17 13| 11 15| 5 19| 34 14 | 979 17
FOUR
| 19 9| 359 12| 221 11| 38 10| 637 11 | 1 10| 10 8| 3 4| 0 0| 14 6 | 651 11
FIVE
| 11 5| 223 7| 143 7| 18 5| 395 7 | 1 10| 6 5| 3 4| 0 0| 10 4 | 405 7
MORE THAN FIVE
| 24 12| 498 16| 281 14| 46 12| 849 15 | 0 0| 6 5| 5 7| 0 0| 11 5 | 860 15
------------------------------------------------------------------------------------------------------------------------------------
Total reported
| 204 100| 3036 100| 1988 100| 385 100| 5613 100 | 10 100| 128 100| 72 100| 26 100| 236 100 | 5849 100
|
|
|
|
|
|
|
|
|
|
|
Percent reported | 100.0| 100.0| 100.0| 100.0| 100.0 | 100.0| 100.0| 100.0| 100.0| 100.0 | 100.0
|
|
|
|
|
|
|
|
|
|
|
|
|
|
|
|
|
|
|
|
|
|
NOT REPORTED
|0|0|0|0|0
|0|0|0|0|0
|0
------------------------------------------------------------------------------------------------------------------------------------
Total
| 204 | 3036 | 1988 | 385 | 5613
| 10 | 128 | 72 | 26 | 236
| 5849
|
|
|
|
|
|
|
|
|
|
|
|
|
|
|
|
|
|
|
|
|
|
|
|
|
|
|
|
|
|
|
|
|
|
|
|
|
|
|
|
|
|
|
|
|
|
|
|
|
|
|
|
|
|
|
AVG NUM SENTENCES | 2.87 | 3.43 | 3.28 | 2.88 | 3.32 | 2.20 | 2.37 | 2.26 | 1.69 | 2.25 | 3.27
Georgia Dept. of Corrections
22
Page 20 Run 05/01/00
Georgia Department of Corrections Office of Planning and Analysis
LIFERS Inmate statistical profile
Sample: ACTIVE PRISONERS EXCLUDING JAIL Active inmates 05/01/2000
Requestor: Statistics Number Of Disciplinaries by current age & sex
|
MEN
|
WOMEN
|
| Age | Age | Age | Age | Men
| Age | Age | Age | Age |Women
|Grand
Disciplinaries
|00-21 %|22-39 %|40-54 %|55-99 %|Total % |00-21 %|22-39 %|40-54 %|55-99 %|Total % |Total %
------------------------------------------------------------------------------------------------------------------------------------
ZERO
| 50 25| 493 16| 352 18| 113 29| 1008 18 | 2 20| 27 21| 24 33| 12 46| 65 28 | 1073 18
ONE
| 16 8| 319 11| 257 13| 65 17| 657 12 | 0 0| 14 11| 9 13| 6 23| 29 12 | 686 12
TWO
| 16 8| 245 8| 181 9| 46 12| 488 9 | 1 10| 13 10| 10 14| 1 4| 25 11 | 513 9
THREE
| 13 6| 201 7| 144 7| 32 8| 390 7 | 0 0| 7 6| 8 11| 2 8| 17 7 | 407 7
FOUR
| 7 3| 182 6| 108 5| 24 6| 321 6 | 2 20| 9 7| 2 3| 3 12| 16 7 | 337 6
FIVE
| 7 3| 139 5| 88 4| 11 3| 245 4 | 0 0| 2 2| 5 7| 0 0| 7 3 | 252 4
MORE THAN FIVE
| 95 47| 1455 48| 858 43| 94 24| 2502 45 | 5 50| 55 43| 14 19| 2 8| 76 32 | 2578 44
------------------------------------------------------------------------------------------------------------------------------------
Total reported
| 204 100| 3034 100| 1988 100| 385 100| 5611 100 | 10 100| 127 100| 72 100| 26 100| 235 100 | 5846 100
|
|
|
|
|
|
|
|
|
|
|
Percent reported | 100.0|
99.9| 100.0| 100.0| 100.0 | 100.0|
99.2| 100.0| 100.0|
99.6 |
99.9
|
|
|
|
|
|
|
|
|
|
|
|
|
|
|
|
|
|
|
|
|
|
NOT REPORTED
|0|2|0|0|2
|0|1|0|0|1
|3
------------------------------------------------------------------------------------------------------------------------------------
Total
| 204 | 3036 | 1988 | 385 | 5613
| 10 | 128 | 72 | 26 | 236
| 5849
|
|
|
|
|
|
|
|
|
|
|
|
|
|
|
|
|
|
|
|
|
|
|
|
|
|
|
|
|
|
|
|
|
|
|
|
|
|
|
|
|
|
|
|
|
|
|
|
|
|
|
|
|
|
|
AVG NUM DISCIP
| 9.88 | 10.25 | 9.82 | 5.12 | 9.73 | 5.10 | 8.50 | 3.31 | 1.81 | 6.02 | 9.58
Georgia Dept. of Corrections
23
Page 21 Run 05/01/00
Georgia Department of Corrections Office of Planning and Analysis
LIFERS Inmate statistical profile
Sample: ACTIVE PRISONERS EXCLUDING JAIL Active inmates 05/01/2000
Requestor: Statistics Number Of Escapes by current age & sex
|
MEN
|
WOMEN
|
| Age | Age | Age | Age | Men
| Age | Age | Age | Age |Women
|Grand
Escapes
|00-21 %|22-39 %|40-54 %|55-99 %|Total % |00-21 %|22-39 %|40-54 %|55-99 %|Total % |Total %
------------------------------------------------------------------------------------------------------------------------------------
ZERO
| 204 100| 2997 99| 1905 96| 368 96| 5474 98 | 10 100| 128 100| 70 97| 26 100| 234 99 | 5708 98
ONE
| 0 0| 37 1| 65 3| 12 3| 114 2 | 0 0| 0 0| 2 3| 0 0| 2 1 | 116 2
TWO
| 0 0| 2 0| 14 1| 3 1| 19 0 | 0 0| 0 0| 0 0| 0 0| 0 0 | 19 0
THREE
| 0 0| 0 0| 3 0| 2 1| 5 0 | 0 0| 0 0| 0 0| 0 0| 0 0 | 5 0
FOUR
| 0 0| 0 0| 1 0| 0 0| 1 0 | 0 0| 0 0| 0 0| 0 0| 0 0 | 1 0
FIVE
| 0 0| 0 0| 0 0| 0 0| 0 0 | 0 0| 0 0| 0 0| 0 0| 0 0 | 0 0
MORE THAN FIVE
| 0 0| 0 0| 0 0| 0 0| 0 0 | 0 0| 0 0| 0 0| 0 0| 0 0 | 0 0
------------------------------------------------------------------------------------------------------------------------------------
Total reported
| 204 100| 3036 100| 1988 100| 385 100| 5613 100 | 10 100| 128 100| 72 100| 26 100| 236 100 | 5849 100
|
|
|
|
|
|
|
|
|
|
|
Percent reported | 100.0| 100.0| 100.0| 100.0| 100.0 | 100.0| 100.0| 100.0| 100.0| 100.0 | 100.0
|
|
|
|
|
|
|
|
|
|
|
|
|
|
|
|
|
|
|
|
|
|
NOT REPORTED
|0|0|0|0|0
|0|0|0|0|0
|0
------------------------------------------------------------------------------------------------------------------------------------
Total
| 204 | 3036 | 1988 | 385 | 5613
| 10 | 128 | 72 | 26 | 236
| 5849
|
|
|
|
|
|
|
|
|
|
|
|
|
|
|
|
|
|
|
|
|
|
|
|
|
|
|
|
|
|
|
|
|
|
|
|
|
|
|
|
|
|
|
|
|
|
|
|
|
|
|
|
|
|
|
AVG NUM ESCAPES
| .00 | .01 | .05 | .06 | .03 | .00 | .00 | .03 | .00 | .01 | .03
Georgia Dept. of Corrections
24
Page 22 Run 05/01/00
Georgia Department of Corrections Office of Planning and Analysis
LIFERS Inmate statistical profile
Sample: ACTIVE PRISONERS EXCLUDING JAIL
Requestor: Statistics
Active inmates 05/01/2000
Number Of Prior Georgia Incarcerations * by current age & sex
|
MEN
|
WOMEN
|
| Age | Age | Age | Age | Men
| Age | Age | Age | Age |Women
|Grand
Prior Incarcerations|00-21 %|22-39 %|40-54 %|55-99 %|Total % |00-21 %|22-39 %|40-54 %|55-99 %|Total % |Total %
------------------------------------------------------------------------------------------------------------------------------------
ZERO
| 197 97| 2012 66| 890 45| 218 57| 3317 59 | 10 100| 104 81| 56 78| 23 88| 193 82 | 3510 60
ONE
| 7 3| 592 19| 503 25| 88 23| 1190 21 | 0 0| 17 13| 10 14| 2 8| 29 12 | 1219 21
TWO
| 0 0| 234 8| 322 16| 38 10| 594 11 | 0 0| 4 3| 5 7| 1 4| 10 4 | 604 10
THREE
| 0 0| 127 4| 165 8| 26 7| 318 6 | 0 0| 2 2| 0 0| 0 0| 2 1 | 320 5
FOUR
| 0 0| 54 2| 60 3| 11 3| 125 2 | 0 0| 0 0| 0 0| 0 0| 0 0 | 125 2
FIVE
| 0 0| 13 0| 30 2| 2 1| 45 1 | 0 0| 0 0| 0 0| 0 0| 0 0 | 45 1
MORE THAN FIVE
| 0 0| 4 0| 18 1| 2 1| 24 0 | 0 0| 1 1| 1 1| 0 0| 2 1 | 26 0
------------------------------------------------------------------------------------------------------------------------------------
Total reported
| 204 100| 3036 100| 1988 100| 385 100| 5613 100 | 10 100| 128 100| 72 100| 26 100| 236 100 | 5849 100
|
|
|
|
|
|
|
|
|
|
|
Percent reported | 100.0| 100.0| 100.0| 100.0| 100.0 | 100.0| 100.0| 100.0| 100.0| 100.0 | 100.0
|
|
|
|
|
|
|
|
|
|
|
|
|
|
|
|
|
|
|
|
|
|
NOT REPORTED
|0|0|0|0|0
|0|0|0|0|0
|0
------------------------------------------------------------------------------------------------------------------------------------
Total
| 204 | 3036 | 1988 | 385 | 5613
| 10 | 128 | 72 | 26 | 236
| 5849
|
|
|
|
|
|
|
|
|
|
|
|
|
|
|
|
|
|
|
|
|
|
|
|
|
|
|
|
|
|
|
|
|
|
|
|
|
|
|
|
|
|
|
|
|
|
|
|
|
|
|
|
|
|
|
AVG # INCARCERATIONS| .03 | .58 | 1.08 | .81 | .75 | .00 | .30 | .38 | .15 | .29 | .73
* This data counts a parole revocation on an existing sentenCE AS A prior incarceration. Also, this data counts, for any cohort of inmates, the total number of Georgia incarcerations the inmate has had during his entire criminal career. For example, if an inmate was admitted to prison first in FY72, and then re-admitted in FY79 and FY85, he had two prior incarcerations before the FY85 admission. This inmate's records show two prior incarcerations in all three of his records since he has had two prior incarcerations in his criminal career. If the cohort of FY72 admissions is selected for analysis, two prior incarcerations will be listed for this inmate even though in FY72, he had no prior incarcerations.
Georgia Dept. of Corrections
25
Page 23 Run 05/01/00
Georgia Department of Corrections Office of Planning and Analysis
LIFERS Inmate statistical profile
Sample: ACTIVE PRISONERS EXCLUDING JAIL Active inmates 05/01/2000
Requestor: Statistics Number Of Transfers by current age & sex
|
MEN
|
WOMEN
|
| Age | Age | Age | Age | Men
| Age | Age | Age | Age |Women
|Grand
Transfers
|00-21 %|22-39 %|40-54 %|55-99 %|Total % |00-21 %|22-39 %|40-54 %|55-99 %|Total % |Total %
------------------------------------------------------------------------------------------------------------------------------------
ZERO
| 39 19| 74 2| 19 1| 3 1| 135 2 | 2 20| 5 4| 5 7| 0 0| 12 5 | 147 3
ONE
| 110 54| 899 30| 395 20| 79 21| 1483 26 | 6 60| 36 28| 25 35| 5 19| 72 31 | 1555 27
TWO
| 39 19| 654 22| 360 18| 68 18| 1121 20 | 1 10| 42 33| 13 18| 6 23| 62 26 | 1183 20
THREE
| 13 6| 478 16| 266 13| 62 16| 819 15 | 1 10| 21 16| 14 19| 5 19| 41 17 | 860 15
FOUR
| 1 0| 327 11| 218 11| 38 10| 584 10 | 0 0| 11 9| 6 8| 4 15| 21 9 | 605 10
FIVE
| 2 1| 218 7| 156 8| 30 8| 406 7 | 0 0| 6 5| 3 4| 3 12| 12 5 | 418 7
MORE THAN FIVE
| 0 0| 386 13| 574 29| 105 27| 1065 19 | 0 0| 7 5| 6 8| 3 12| 16 7 | 1081 18
------------------------------------------------------------------------------------------------------------------------------------
Total reported
| 204 100| 3036 100| 1988 100| 385 100| 5613 100 | 10 100| 128 100| 72 100| 26 100| 236 100 | 5849 100
|
|
|
|
|
|
|
|
|
|
|
Percent reported | 100.0| 100.0| 100.0| 100.0| 100.0 | 100.0| 100.0| 100.0| 100.0| 100.0 | 100.0
|
|
|
|
|
|
|
|
|
|
|
|
|
|
|
|
|
|
|
|
|
|
NOT REPORTED
|0|0|0|0|0
|0|0|0|0|0
|0
------------------------------------------------------------------------------------------------------------------------------------
Total
| 204 | 3036 | 1988 | 385 | 5613
| 10 | 128 | 72 | 26 | 236
| 5849
|
|
|
|
|
|
|
|
|
|
|
|
|
|
|
|
|
|
|
|
|
|
|
|
|
|
|
|
|
|
|
|
|
|
|
|
|
|
|
|
|
|
|
|
|
|
|
|
|
|
|
|
|
|
|
AVG NUM TRANSFERS | 1.18 | 3.00 | 4.41 | 4.39 | 3.53 | 1.10 | 2.41 | 2.39 | 3.42 | 2.46 | 3.48
Georgia Dept. of Corrections
26
Page 24 Run 05/01/00
Georgia Department of Corrections Office of Planning and Analysis
LIFERS Inmate statistical profile
Sample: ACTIVE PRISONERS EXCLUDING JAIL Active inmates 05/01/2000
Requestor: Statistics County Of Conviction by current age & sex
|
MEN
|
WOMEN
|
| Age | Age | Age | Age | Men
| Age | Age | Age | Age |Women
|Grand
County Of Conviction|00-21 %|22-39 %|40-54 %|55-99 %|Total % |00-21 %|22-39 %|40-54 %|55-99 %|Total % |Total %
------------------------------------------------------------------------------------------------------------------------------------
APPLING COUNTY
| 0 0| 4 0| 5 0| 0 0| 9 0 | 0 0| 0 0| 0 0| 0 0| 0 0 | 9 0
ATKINSON COUNTY
| 0 0| 1 0| 2 0| 2 1| 5 0 | 0 0| 0 0| 1 1| 0 0| 1 0 | 6 0
BACON COUNTY
| 0 0| 9 0| 2 0| 0 0| 11 0 | 0 0| 0 0| 0 0| 0 0| 0 0 | 11 0
BAKER COUNTY
| 0 0| 1 0| 1 0| 0 0| 2 0 | 0 0| 0 0| 0 0| 0 0| 0 0 | 2 0
BALDWIN COUNTY
| 2 1| 16 1| 11 1| 2 1| 31 1 | 0 0| 1 1| 0 0| 0 0| 1 0 | 32 1
BANKS COUNTY
| 0 0| 2 0| 8 0| 2 1| 12 0 | 0 0| 0 0| 0 0| 0 0| 0 0 | 12 0
BARROW COUNTY
| 0 0| 3 0| 10 1| 4 1| 17 0 | 0 0| 0 0| 1 1| 0 0| 1 0 | 18 0
BARTOW COUNTY
| 2 1| 30 1| 21 1| 3 1| 56 1 | 0 0| 2 2| 0 0| 0 0| 2 1 | 58 1
BEN HILL COUNTY
| 0 0| 7 0| 9 0| 3 1| 19 0 | 0 0| 0 0| 0 0| 0 0| 0 0 | 19 0
BERRIEN COUNTY
| 0 0| 4 0| 1 0| 0 0| 5 0 | 0 0| 0 0| 0 0| 0 0| 0 0 | 5 0
BIBB COUNTY
| 5 2| 90 3| 82 4| 14 4| 191 3 | 0 0| 2 2| 1 1| 1 4| 4 2 | 195 3
BLECKLEY COUNTY
| 0 0| 8 0| 3 0| 1 0| 12 0 | 0 0| 0 0| 1 1| 0 0| 1 0 | 13 0
BRANTLEY COUNTY
| 0 0| 1 0| 4 0| 2 1| 7 0 | 0 0| 0 0| 0 0| 0 0| 0 0 | 7 0
BROOKS COUNTY
| 0 0| 6 0| 5 0| 1 0| 12 0 | 0 0| 0 0| 0 0| 0 0| 0 0 | 12 0
BRYAN COUNTY
| 1 0| 8 0| 6 0| 1 0| 16 0 | 0 0| 0 0| 0 0| 1 4| 1 0 | 17 0
BULLOCH COUNTY
| 1 0| 19 1| 16 1| 0 0| 36 1 | 0 0| 1 1| 1 1| 1 4| 3 1 | 39 1
BURKE COUNTY
| 1 0| 14 0| 12 1| 0 0| 27 0 | 0 0| 0 0| 0 0| 0 0| 0 0 | 27 0
BUTTS COUNTY
| 4 2| 24 1| 8 0| 2 1| 38 1 | 0 0| 3 2| 0 0| 0 0| 3 1 | 41 1
CALHOUN COUNTY
| 1 0| 2 0| 3 0| 1 0| 7 0 | 0 0| 0 0| 0 0| 0 0| 0 0 | 7 0
CAMDEN COUNTY
| 1 0| 21 1| 7 0| 0 0| 29 1 | 0 0| 0 0| 1 1| 0 0| 1 0 | 30 1
CANDLER COUNTY
| 0 0| 1 0| 1 0| 0 0| 2 0 | 0 0| 0 0| 0 0| 0 0| 0 0 | 2 0
CARROLL COUNTY
| 1 0| 16 1| 12 1| 6 2| 35 1 | 0 0| 2 2| 1 1| 0 0| 3 1 | 38 1
CATOOSA COUNTY
| 0 0| 5 0| 8 0| 0 0| 13 0 | 0 0| 0 0| 0 0| 0 0| 0 0 | 13 0
CHARLTON COUNTY
| 0 0| 1 0| 0 0| 0 0| 1 0 | 0 0| 2 2| 0 0| 0 0| 2 1 | 3 0
CHATHAM COUNTY
| 9 4| 160 5| 101 5| 13 3| 283 5 | 0 0| 3 2| 0 0| 0 0| 3 1 | 286 5
CHATTAHOOCHEE COUNTY| 0 0| 0 0| 2 0| 0 0| 2 0 | 0 0| 0 0| 0 0| 0 0| 0 0 | 2 0
CHATTOOGA COUNTY | 0 0| 5 0| 6 0| 1 0| 12 0 | 0 0| 0 0| 1 1| 1 4| 2 1 | 14 0
CHEROKEE COUNTY
| 2 1| 8 0| 21 1| 2 1| 33 1 | 0 0| 3 2| 0 0| 0 0| 3 1 | 36 1
CLARKE COUNTY
| 1 0| 42 1| 22 1| 8 2| 73 1 | 0 0| 2 2| 0 0| 1 4| 3 1 | 76 1
CLAY COUNTY
| 0 0| 1 0| 1 0| 0 0| 2 0 | 0 0| 0 0| 0 0| 0 0| 0 0 | 2 0
CLAYTON COUNTY
| 5 2| 69 2| 34 2| 11 3| 119 2 | 0 0| 2 2| 3 4| 0 0| 5 2 | 124 2
CLINCH COUNTY
| 0 0| 2 0| 3 0| 0 0| 5 0 | 0 0| 0 0| 0 0| 0 0| 0 0 | 5 0
COBB COUNTY
| 6 3| 111 4| 73 4| 14 4| 204 4 | 0 0| 5 4| 3 4| 1 4| 9 4 | 213 4
COFFEE COUNTY
| 0 0| 8 0| 11 1| 3 1| 22 0 | 0 0| 1 1| 1 1| 0 0| 2 1 | 24 0
COLQUITT COUNTY
| 2 1| 40 1| 22 1| 3 1| 67 1 | 0 0| 1 1| 0 0| 1 4| 2 1 | 69 1
COLUMBIA COUNTY
| 0 0| 6 0| 9 0| 2 1| 17 0 | 0 0| 0 0| 1 1| 0 0| 1 0 | 18 0
------------------------------------------------------------------------------------------------------------------------------------
(continued)
Georgia Dept. of Corrections
27
Page
25 Run 05/01/00
Georgia Department of Corrections Office of Planning and Analysis LIFERS Inmate statistical profile
Sample: ACTIVE PRISONERS EXCLUDING JAIL
Requestor:
Active inmates 05/01/2000
County Of Conviction by current age & sex
Statistics (CONTINUED)
|
MEN
|
WOMEN
|
| Age | Age | Age | Age | Men
| Age | Age | Age | Age |Women
|Grand
County Of Conviction|00-21 %|22-39 %|40-54 %|55-99 %|Total % |00-21 %|22-39 %|40-54 %|55-99 %|Total % |Total %
------------------------------------------------------------------------------------------------------------------------------------
COOK COUNTY
| 0 0| 6 0| 2 0| 0 0| 8 0 | 0 0| 2 2| 0 0| 0 0| 2 1 | 10 0
COWETA COUNTY
| 6 3| 22 1| 10 1| 3 1| 41 1 | 0 0| 2 2| 1 1| 0 0| 3 1 | 44 1
CRAWFORD COUNTY
| 0 0| 3 0| 0 0| 0 0| 3 0 | 0 0| 0 0| 0 0| 0 0| 0 0 | 3 0
CRISP COUNTY
| 3 1| 13 0| 12 1| 1 0| 29 1 | 0 0| 3 2| 0 0| 2 8| 5 2 | 34 1
DADE COUNTY
| 0 0| 5 0| 6 0| 2 1| 13 0 | 0 0| 0 0| 0 0| 0 0| 0 0 | 13 0
DAWSON COUNTY
| 0 0| 3 0| 3 0| 1 0| 7 0 | 0 0| 0 0| 0 0| 0 0| 0 0 | 7 0
DECATUR COUNTY
| 2 1| 20 1| 5 0| 1 0| 28 0 | 0 0| 1 1| 0 0| 0 0| 1 0 | 29 0
DEKALB COUNTY
| 20 10| 242 8| 153 8| 18 5| 433 8 | 1 10| 2 2| 3 4| 1 4| 7 3 | 440 8
DODGE COUNTY
| 0 0| 7 0| 4 0| 1 0| 12 0 | 0 0| 0 0| 0 0| 0 0| 0 0 | 12 0
DOOLY COUNTY
| 2 1| 8 0| 7 0| 0 0| 17 0 | 0 0| 0 0| 0 0| 0 0| 0 0 | 17 0
DOUGHERTY COUNTY | 7 3| 70 2| 37 2| 4 1| 118 2 | 0 0| 5 4| 0 0| 0 0| 5 2 | 123 2
DOUGLAS COUNTY
| 3 1| 50 2| 16 1| 5 1| 74 1 | 0 0| 1 1| 0 0| 0 0| 1 0 | 75 1
EARLY COUNTY
| 0 0| 10 0| 6 0| 1 0| 17 0 | 0 0| 0 0| 0 0| 0 0| 0 0 | 17 0
ECHOLS COUNTY.
| 0 0| 0 0| 0 0| 0 0| 0 0 | 0 0| 0 0| 0 0| 0 0| 0 0 | 0 0
EFFINGHAM COUNTY | 0 0| 4 0| 3 0| 0 0| 7 0 | 0 0| 0 0| 0 0| 0 0| 0 0 | 7 0
ELBERT COUNTY
| 0 0| 13 0| 8 0| 1 0| 22 0 | 0 0| 1 1| 0 0| 0 0| 1 0 | 23 0
EMANUEL COUNTY
| 1 0| 8 0| 10 1| 2 1| 21 0 | 0 0| 1 1| 0 0| 0 0| 1 0 | 22 0
EVANS COUNTY
| 0 0| 8 0| 4 0| 2 1| 14 0 | 0 0| 0 0| 0 0| 0 0| 0 0 | 14 0
FANNIN COUNTY
| 0 0| 4 0| 5 0| 1 0| 10 0 | 0 0| 0 0| 0 0| 0 0| 0 0 | 10 0
FAYETTE COUNTY
| 1 0| 6 0| 5 0| 0 0| 12 0 | 0 0| 0 0| 0 0| 0 0| 0 0 | 12 0
FLOYD COUNTY
| 2 1| 32 1| 25 1| 4 1| 63 1 | 1 10| 3 2| 2 3| 1 4| 7 3 | 70 1
FORSYTH COUNTY
| 0 0| 6 0| 8 0| 3 1| 17 0 | 0 0| 1 1| 1 1| 0 0| 2 1 | 19 0
FRANKLIN COUNTY
| 1 0| 2 0| 3 0| 1 0| 7 0 | 0 0| 0 0| 2 3| 1 4| 3 1 | 10 0
FULTON COUNTY
| 27 13| 461 15| 300 15| 60 16| 848 15 | 3 30| 12 9| 6 8| 5 19| 26 11 | 874 15
GILMER COUNTY
| 0 0| 1 0| 1 0| 3 1| 5 0 | 0 0| 0 0| 0 0| 0 0| 0 0 | 5 0
GLASCOCK COUNTY
| 0 0| 0 0| 0 0| 0 0| 0 0 | 0 0| 0 0| 0 0| 0 0| 0 0 | 0 0
GLYNN COUNTY
| 6 3| 35 1| 24 1| 3 1| 68 1 | 0 0| 2 2| 2 3| 0 0| 4 2 | 72 1
GORDON COUNTY
| 0 0| 22 1| 13 1| 2 1| 37 1 | 0 0| 1 1| 0 0| 0 0| 1 0 | 38 1
GRADY COUNTY
| 3 1| 15 0| 10 1| 0 0| 28 0 | 0 0| 0 0| 0 0| 0 0| 0 0 | 28 0
GREENE COUNTY
| 1 0| 2 0| 5 0| 1 0| 9 0 | 0 0| 0 0| 0 0| 0 0| 0 0 | 9 0
GWINNETT COUNTY
| 1 0| 77 3| 36 2| 7 2| 121 2 | 0 0| 3 2| 3 4| 1 4| 7 3 | 128 2
HABERSHAM COUNTY | 2 1| 12 0| 9 0| 0 0| 23 0 | 0 0| 0 0| 0 0| 0 0| 0 0 | 23 0
HALL COUNTY
| 2 1| 43 1| 36 2| 9 2| 90 2 | 2 20| 2 2| 1 1| 1 4| 6 3 | 96 2
HANCOCK COUNTY
| 0 0| 3 0| 2 0| 0 0| 5 0 | 0 0| 0 0| 1 1| 0 0| 1 0 | 6 0
HARALSON COUNTY
| 0 0| 4 0| 2 0| 2 1| 8 0 | 0 0| 0 0| 0 0| 0 0| 0 0 | 8 0
------------------------------------------------------------------------------------------------------------------------------------
(continued)
Georgia Dept. of Corrections
28
Page 26 Run 05/01/00
Georgia Department of Corrections Office of Planning and Analysis LIFERS Inmate statistical profile
Sample: ACTIVE PRISONERS EXCLUDING JAIL
Requestor:
Active inmates 05/01/2000
County Of Conviction by current age & sex
Statistics (CONTINUED)
|
MEN
|
WOMEN
|
| Age | Age | Age | Age | Men
| Age | Age | Age | Age |Women
|Grand
County Of Conviction|00-21 %|22-39 %|40-54 %|55-99 %|Total % |00-21 %|22-39 %|40-54 %|55-99 %|Total % |Total %
------------------------------------------------------------------------------------------------------------------------------------
HARRIS COUNTY
| 2 1| 7 0| 3 0| 0 0| 12 0 | 0 0| 0 0| 0 0| 0 0| 0 0 | 12 0
HART COUNTY
| 0 0| 3 0| 2 0| 0 0| 5 0 | 0 0| 0 0| 0 0| 0 0| 0 0 | 5 0
HEARD COUNTY
| 0 0| 2 0| 0 0| 3 1| 5 0 | 0 0| 0 0| 0 0| 0 0| 0 0 | 5 0
HENRY COUNTY
| 0 0| 23 1| 9 0| 1 0| 33 1 | 0 0| 1 1| 0 0| 0 0| 1 0 | 34 1
HOUSTON COUNTY
| 0 0| 41 1| 18 1| 3 1| 62 1 | 0 0| 4 3| 3 4| 1 4| 8 3 | 70 1
IRWIN COUNTY
| 0 0| 3 0| 1 0| 1 0| 5 0 | 0 0| 0 0| 0 0| 0 0| 0 0 | 5 0
JACKSON COUNTY
| 0 0| 5 0| 14 1| 1 0| 20 0 | 0 0| 1 1| 0 0| 0 0| 1 0 | 21 0
JASPER COUNTY
| 0 0| 8 0| 0 0| 0 0| 8 0 | 0 0| 0 0| 1 1| 0 0| 1 0 | 9 0
JEFF DAVIS COUNTY | 0 0| 4 0| 5 0| 1 0| 10 0 | 0 0| 0 0| 0 0| 0 0| 0 0 | 10 0
JEFFERSON COUNTY | 0 0| 9 0| 4 0| 4 1| 17 0 | 0 0| 0 0| 0 0| 0 0| 0 0 | 17 0
JENKINS COUNTY
| 0 0| 2 0| 4 0| 0 0| 6 0 | 0 0| 0 0| 0 0| 0 0| 0 0 | 6 0
JOHNSON COUNTY
| 0 0| 9 0| 2 0| 1 0| 12 0 | 0 0| 1 1| 0 0| 0 0| 1 0 | 13 0
JONES COUNTY
| 0 0| 1 0| 6 0| 3 1| 10 0 | 0 0| 0 0| 0 0| 0 0| 0 0 | 10 0
LAMAR COUNTY
| 0 0| 10 0| 10 1| 3 1| 23 0 | 0 0| 0 0| 1 1| 0 0| 1 0 | 24 0
LANIER COUNTY
| 0 0| 1 0| 0 0| 0 0| 1 0 | 0 0| 0 0| 0 0| 0 0| 0 0 | 1 0
LAURENS COUNTY
| 1 0| 13 0| 7 0| 1 0| 22 0 | 0 0| 1 1| 2 3| 0 0| 3 1 | 25 0
LEE COUNTY
| 0 0| 2 0| 0 0| 0 0| 2 0 | 1 10| 0 0| 0 0| 0 0| 1 0 | 3 0
LIBERTY COUNTY
| 1 0| 22 1| 9 0| 4 1| 36 1 | 0 0| 3 2| 0 0| 0 0| 3 1 | 39 1
LINCOLN COUNTY
| 1 0| 2 0| 2 0| 0 0| 5 0 | 0 0| 0 0| 0 0| 0 0| 0 0 | 5 0
LONG COUNTY
| 1 0| 7 0| 3 0| 2 1| 13 0 | 0 0| 1 1| 0 0| 0 0| 1 0 | 14 0
LOWNDES COUNTY
| 0 0| 44 1| 22 1| 1 0| 67 1 | 0 0| 0 0| 2 3| 1 4| 3 1 | 70 1
LUMPKIN COUNTY
| 1 0| 3 0| 0 0| 2 1| 6 0 | 0 0| 0 0| 0 0| 0 0| 0 0 | 6 0
MACON COUNTY
| 1 0| 16 1| 7 0| 0 0| 24 0 | 0 0| 0 0| 0 0| 0 0| 0 0 | 24 0
MADISON COUNTY
| 0 0| 6 0| 3 0| 3 1| 12 0 | 0 0| 2 2| 0 0| 0 0| 2 1 | 14 0
MARION COUNTY
| 0 0| 2 0| 1 0| 0 0| 3 0 | 0 0| 0 0| 1 1| 0 0| 1 0 | 4 0
MCDUFFIE COUNTY
| 1 0| 30 1| 10 1| 4 1| 45 1 | 1 10| 1 1| 0 0| 0 0| 2 1 | 47 1
MCINTOSH COUNTY
| 1 0| 8 0| 8 0| 0 0| 17 0 | 0 0| 0 0| 0 0| 0 0| 0 0 | 17 0
MERIWETHER COUNTY | 0 0| 9 0| 9 0| 3 1| 21 0 | 0 0| 2 2| 0 0| 1 4| 3 1 | 24 0
MILLER COUNTY
| 0 0| 2 0| 2 0| 0 0| 4 0 | 0 0| 0 0| 0 0| 0 0| 0 0 | 4 0
MITCHELL COUNTY
| 0 0| 11 0| 9 0| 2 1| 22 0 | 0 0| 2 2| 0 0| 0 0| 2 1 | 24 0
MONROE COUNTY
| 0 0| 12 0| 6 0| 1 0| 19 0 | 0 0| 1 1| 0 0| 0 0| 1 0 | 20 0
MONTGOMERY COUNTY | 0 0| 0 0| 4 0| 0 0| 4 0 | 0 0| 0 0| 0 0| 0 0| 0 0 | 4 0
MORGAN COUNTY
| 0 0| 13 0| 2 0| 0 0| 15 0 | 0 0| 1 1| 0 0| 0 0| 1 0 | 16 0
MURRAY COUNTY
| 0 0| 4 0| 5 0| 4 1| 13 0 | 0 0| 0 0| 0 0| 0 0| 0 0 | 13 0
MUSCOGEE COUNTY
| 6 3| 72 2| 74 4| 10 3| 162 3 | 0 0| 4 3| 1 1| 0 0| 5 2 | 167 3
------------------------------------------------------------------------------------------------------------------------------------
(continued)
Georgia Dept. of Corrections
29
Page 27 Run 05/01/00
Georgia Department of Corrections Office of Planning and Analysis LIFERS Inmate statistical profile
Sample: ACTIVE PRISONERS EXCLUDING JAIL
Requestor:
Active inmates 05/01/2000
County Of Conviction by current age & sex
Statistics (CONTINUED)
|
MEN
|
WOMEN
|
| Age | Age | Age | Age | Men
| Age | Age | Age | Age |Women
|Grand
County Of Conviction|00-21 %|22-39 %|40-54 %|55-99 %|Total % |00-21 %|22-39 %|40-54 %|55-99 %|Total % |Total %
------------------------------------------------------------------------------------------------------------------------------------
NEWTON COUNTY
| 4 2| 46 2| 16 1| 4 1| 70 1 | 0 0| 2 2| 0 0| 0 0| 2 1 | 72 1
OCONEE COUNTY
| 1 0| 8 0| 2 0| 0 0| 11 0 | 0 0| 0 0| 0 0| 0 0| 0 0 | 11 0
OGLETHORPE COUNTY | 0 0| 5 0| 3 0| 1 0| 9 0 | 0 0| 0 0| 0 0| 0 0| 0 0 | 9 0
PAULDING COUNTY
| 0 0| 4 0| 6 0| 3 1| 13 0 | 0 0| 0 0| 0 0| 0 0| 0 0 | 13 0
PEACH COUNTY
| 0 0| 6 0| 3 0| 0 0| 9 0 | 0 0| 0 0| 1 1| 0 0| 1 0 | 10 0
PICKENS COUNTY
| 0 0| 4 0| 0 0| 1 0| 5 0 | 0 0| 0 0| 1 1| 0 0| 1 0 | 6 0
PIERCE COUNTY
| 2 1| 2 0| 5 0| 0 0| 9 0 | 0 0| 0 0| 0 0| 0 0| 0 0 | 9 0
PIKE COUNTY
| 0 0| 1 0| 1 0| 0 0| 2 0 | 0 0| 0 0| 0 0| 0 0| 0 0 | 2 0
POLK COUNTY
| 1 0| 11 0| 8 0| 2 1| 22 0 | 0 0| 0 0| 0 0| 0 0| 0 0 | 22 0
PULASKI COUNTY
| 1 0| 6 0| 1 0| 0 0| 8 0 | 0 0| 1 1| 0 0| 0 0| 1 0 | 9 0
PUTNAM COUNTY
| 0 0| 22 1| 15 1| 3 1| 40 1 | 0 0| 0 0| 0 0| 0 0| 0 0 | 40 1
QUITMAN COUNTY
| 0 0| 4 0| 0 0| 0 0| 4 0 | 0 0| 0 0| 0 0| 0 0| 0 0 | 4 0
RABUN COUNTY
| 0 0| 8 0| 1 0| 0 0| 9 0 | 0 0| 0 0| 0 0| 0 0| 0 0 | 9 0
RANDOLPH COUNTY
| 0 0| 3 0| 2 0| 2 1| 7 0 | 0 0| 0 0| 0 0| 0 0| 0 0 | 7 0
RICHMOND COUNTY
| 15 7| 155 5| 70 4| 11 3| 251 4 | 0 0| 9 7| 8 11| 1 4| 18 8 | 269 5
ROCKDALE COUNTY
| 1 0| 10 0| 10 1| 5 1| 26 0 | 0 0| 1 1| 0 0| 0 0| 1 0 | 27 0
SCHLEY COUNTY
| 0 0| 4 0| 2 0| 0 0| 6 0 | 0 0| 0 0| 0 0| 0 0| 0 0 | 6 0
SCREVEN COUNTY
| 0 0| 6 0| 4 0| 2 1| 12 0 | 0 0| 0 0| 0 0| 0 0| 0 0 | 12 0
SEMINOLE COUNTY
| 1 0| 5 0| 4 0| 2 1| 12 0 | 0 0| 1 1| 0 0| 0 0| 1 0 | 13 0
SPALDING COUNTY
| 3 1| 42 1| 23 1| 6 2| 74 1 | 1 10| 1 1| 1 1| 1 4| 4 2 | 78 1
STEPHENS COUNTY
| 0 0| 4 0| 4 0| 3 1| 11 0 | 0 0| 0 0| 0 0| 0 0| 0 0 | 11 0
STEWART COUNTY
| 0 0| 2 0| 1 0| 0 0| 3 0 | 0 0| 0 0| 2 3| 0 0| 2 1 | 5 0
SUMTER COUNTY
| 0 0| 5 0| 13 1| 1 0| 19 0 | 0 0| 0 0| 1 1| 0 0| 1 0 | 20 0
TALBOT COUNTY
| 2 1| 3 0| 1 0| 0 0| 6 0 | 0 0| 0 0| 1 1| 0 0| 1 0 | 7 0
TALIAFERRO COUNTY | 0 0| 0 0| 3 0| 0 0| 3 0 | 0 0| 0 0| 0 0| 0 0| 0 0 | 3 0
TATTNALL COUNTY
| 1 0| 16 1| 13 1| 3 1| 33 1 | 0 0| 0 0| 1 1| 0 0| 1 0 | 34 1
TAYLOR COUNTY
| 1 0| 7 0| 4 0| 0 0| 12 0 | 0 0| 0 0| 0 0| 0 0| 0 0 | 12 0
TELFAIR COUNTY
| 1 0| 6 0| 2 0| 0 0| 9 0 | 0 0| 0 0| 1 1| 0 0| 1 0 | 10 0
TERRELL COUNTY
| 1 0| 10 0| 2 0| 1 0| 14 0 | 0 0| 0 0| 0 0| 0 0| 0 0 | 14 0
THOMAS COUNTY
| 1 0| 18 1| 19 1| 3 1| 41 1 | 0 0| 2 2| 0 0| 0 0| 2 1 | 43 1
TIFT COUNTY
| 6 3| 35 1| 20 1| 5 1| 66 1 | 0 0| 0 0| 2 3| 1 4| 3 1 | 69 1
TOOMBS COUNTY
| 4 2| 23 1| 8 0| 1 0| 36 1 | 0 0| 2 2| 0 0| 0 0| 2 1 | 38 1
TOWNS COUNTY
| 0 0| 1 0| 1 0| 0 0| 2 0 | 0 0| 0 0| 0 0| 0 0| 0 0 | 2 0
TREUTLEN COUNTY
| 0 0| 3 0| 4 0| 0 0| 7 0 | 0 0| 0 0| 0 0| 0 0| 0 0 | 7 0
TROUP COUNTY
| 3 1| 25 1| 25 1| 6 2| 59 1 | 0 0| 2 2| 1 1| 0 0| 3 1 | 62 1
------------------------------------------------------------------------------------------------------------------------------------
(continued)
Georgia Dept. of Corrections
30
Page 28 Run 05/01/00
Georgia Department of Corrections Office of Planning and Analysis
LIFERS Inmate statistical profile
Sample: ACTIVE PRISONERS EXCLUDING JAIL
Requestor:
Active inmates 05/01/2000
County Of Conviction by current age & sex
Statistics (CONTINUED)
|
MEN
|
WOMEN
|
| Age | Age | Age | Age | Men
| Age | Age | Age | Age |Women
|Grand
County Of Conviction|00-21 %|22-39 %|40-54 %|55-99 %|Total % |00-21 %|22-39 %|40-54 %|55-99 %|Total % |Total %
------------------------------------------------------------------------------------------------------------------------------------
TURNER COUNTY
| 0 0| 7 0| 7 0| 0 0| 14 0 | 0 0| 0 0| 0 0| 0 0| 0 0 | 14 0
TWIGGS COUNTY
| 0 0| 3 0| 5 0| 1 0| 9 0 | 0 0| 0 0| 0 0| 0 0| 0 0 | 9 0
UNION COUNTY
| 0 0| 0 0| 1 0| 0 0| 1 0 | 0 0| 0 0| 0 0| 0 0| 0 0 | 1 0
UPSON COUNTY
| 0 0| 7 0| 5 0| 1 0| 13 0 | 0 0| 0 0| 1 1| 0 0| 1 0 | 14 0
WALKER COUNTY
| 0 0| 15 0| 10 1| 3 1| 28 0 | 0 0| 1 1| 1 1| 0 0| 2 1 | 30 1
WALTON COUNTY
| 1 0| 31 1| 17 1| 2 1| 51 1 | 0 0| 1 1| 0 0| 0 0| 1 0 | 52 1
WARE COUNTY
| 0 0| 13 0| 11 1| 3 1| 27 0 | 0 0| 1 1| 0 0| 0 0| 1 0 | 28 0
WARREN COUNTY
| 0 0| 4 0| 6 0| 1 0| 11 0 | 0 0| 0 0| 0 0| 0 0| 0 0 | 11 0
WASHINGTON COUNTY | 0 0| 8 0| 6 0| 1 0| 15 0 | 0 0| 1 1| 0 0| 0 0| 1 0 | 16 0
WAYNE COUNTY
| 0 0| 7 0| 8 0| 2 1| 17 0 | 0 0| 1 1| 0 0| 0 0| 1 0 | 18 0
WEBSTER COUNTY
| 0 0| 0 0| 0 0| 0 0| 0 0 | 0 0| 0 0| 0 0| 0 0| 0 0 | 0 0
WHEELER COUNTY
| 0 0| 3 0| 3 0| 1 0| 7 0 | 0 0| 0 0| 0 0| 1 4| 1 0 | 8 0
WHITE COUNTY
| 0 0| 3 0| 2 0| 0 0| 5 0 | 0 0| 0 0| 0 0| 0 0| 0 0 | 5 0
WHITFIELD COUNTY | 0 0| 27 1| 24 1| 5 1| 56 1 | 0 0| 5 4| 1 1| 0 0| 6 3 | 62 1
WILCOX COUNTY
| 0 0| 1 0| 7 0| 0 0| 8 0 | 0 0| 0 0| 0 0| 0 0| 0 0 | 8 0
WILKES COUNTY
| 0 0| 8 0| 2 0| 1 0| 11 0 | 0 0| 0 0| 0 0| 0 0| 0 0 | 11 0
WILKINSON COUNTY | 0 0| 7 0| 1 0| 0 0| 8 0 | 0 0| 0 0| 0 0| 0 0| 0 0 | 8 0
WORTH COUNTY
| 4 2| 13 0| 4 0| 2 1| 23 0 | 0 0| 0 0| 0 0| 0 0| 0 0 | 23 0
CONVERSION
| 0 2| 0 0| 0 0| 0 1| 0 0 | 0 0| 0 0| 0 0| 0 0| 0 0 | 0 0
------------------------------------------------------------------------------------------------------------------------------------
Total reported
| 204 100| 3035 100| 1988 100| 385 100| 5612 100 | 10 100| 128 100| 72 100| 26 100| 236 100 | 5848 100
|
|
|
|
|
|
|
|
|
|
|
Percent reported | 100.0| 100.0| 100.0| 100.0| 100.0 | 100.0| 100.0| 100.0| 100.0| 100.0 | 100.0
|
|
|
|
|
|
|
|
|
|
|
|
|
|
|
|
|
|
|
|
|
|
UNKNOWN
|0|1|0|0|1
|0|0|0|0|0
|1
------------------------------------------------------------------------------------------------------------------------------------
Total
| 204 | 3036 | 1988 | 385 | 5613
| 10 | 128 | 72 | 26 | 236
| 5849
Georgia Dept. of Corrections
31
Page
29 Run 05/01/00
Georgia Department of Corrections Office of Planning and Analysis LIFERS Inmate statistical profile
Sample: ACTIVE PRISONERS EXCLUDING JAIL Active inmates 05/01/2000
Requestor: Statistics Circuit Of Conviction by current age & sex
|
MEN
|
WOMEN
|
| Age | Age | Age | Age | Men
| Age | Age | Age | Age |Women
|Grand
Circ Of Conviction |00-21 %|22-39 %|40-54 %|55-99 %|Total % |00-21 %|22-39 %|40-54 %|55-99 %|Total % |Total %
------------------------------------------------------------------------------------------------------------------------------------
ALAPAHA CIRCUIT
| 0 0| 14 0| 8 0| 2 1| 24 0 | 0 0| 2 2| 1 1| 0 0| 3 1 | 27 0
ALCOVY CIRCUIT
| 5 2| 77 3| 33 2| 6 2| 121 2 | 0 0| 3 2| 0 0| 0 0| 3 1 | 124 2
ATLANTA CIRCUIT
| 27 13| 461 15| 300 15| 60 16| 848 15 | 3 30| 12 9| 6 8| 5 19| 26 11 | 874 15
ATLANTIC CIRCUIT | 5 2| 69 2| 43 2| 12 3| 129 2 | 0 0| 4 3| 1 1| 1 4| 6 3 | 135 2
AUGUSTA CIRCUIT
| 16 8| 175 6| 91 5| 13 3| 295 5 | 0 0| 9 7| 9 13| 1 4| 19 8 | 314 5
BLUE RIDGE CIRCUIT | 2 1| 13 0| 29 1| 5 1| 49 1 | 0 0| 4 3| 1 1| 0 0| 5 2 | 54 1
BRUNSWICK CIRCUIT | 7 3| 71 2| 49 2| 6 2| 133 2 | 0 0| 3 2| 3 4| 0 0| 6 3 | 139 2
CHATTAHOOCHEE CIRCUI| 11 5| 91 3| 85 4| 10 3| 197 4 | 0 0| 4 3| 3 4| 0 0| 7 3 | 204 3
CHEROKEE CIRCUIT | 2 1| 52 2| 34 2| 5 1| 93 2 | 0 0| 3 2| 0 0| 0 0| 3 1 | 96 2
CLAYTON CIRCUIT
| 5 2| 69 2| 34 2| 11 3| 119 2 | 0 0| 2 2| 3 4| 0 0| 5 2 | 124 2
COBB CIRCUIT
| 6 3| 111 4| 73 4| 14 4| 204 4 | 0 0| 5 4| 3 4| 1 4| 9 4 | 213 4
CONASAUGA CIRCUIT | 0 0| 31 1| 29 1| 9 2| 69 1 | 0 0| 5 4| 1 1| 0 0| 6 3 | 75 1
CORDELE CIRCUIT
| 5 2| 29 1| 35 2| 4 1| 73 1 | 0 0| 3 2| 0 0| 2 8| 5 2 | 78 1
COWETA CIRCUIT
| 10 5| 74 2| 56 3| 21 5| 161 3 | 0 0| 8 6| 3 4| 1 4| 12 5 | 173 3
DOUGHERTY CIRCUIT | 7 3| 70 2| 37 2| 4 1| 118 2 | 0 0| 5 4| 0 0| 0 0| 5 2 | 123 2
DUBLIN CIRCUIT
| 1 0| 28 1| 18 1| 3 1| 50 1 | 0 0| 2 2| 2 3| 0 0| 4 2 | 54 1
EASTERN CIRCUIT
| 9 4| 160 5| 101 5| 13 3| 283 5 | 0 0| 3 2| 0 0| 0 0| 3 1 | 286 5
FLINT CIRCUIT
| 3 1| 67 2| 33 2| 7 2| 110 2 | 0 0| 5 4| 1 1| 0 0| 6 3 | 116 2
GRIFFIN CIRCUIT
| 4 2| 56 2| 34 2| 7 2| 101 2 | 1 10| 1 1| 2 3| 1 4| 5 2 | 106 2
GWINNETT CIRCUIT | 1 0| 77 3| 36 2| 7 2| 121 2 | 0 0| 3 2| 3 4| 1 4| 7 3 | 128 2
HOUSTON CIRCUIT
| 0 0| 41 1| 18 1| 3 1| 62 1 | 0 0| 4 3| 3 4| 1 4| 8 3 | 70 1
LOOKOUT MOUNTAIN CIR| 0 0| 30 1| 30 2| 6 2| 66 1 | 0 0| 1 1| 2 3| 1 4| 4 2 | 70 1
MACON CIRCUIT
| 5 2| 99 3| 85 4| 14 4| 203 4 | 0 0| 2 2| 2 3| 1 4| 5 2 | 208 4
MIDDLE CIRCUIT
| 5 2| 49 2| 29 1| 8 2| 91 2 | 0 0| 4 3| 0 0| 0 0| 4 2 | 95 2
MOUNTAIN CIRCUIT | 2 1| 24 1| 14 1| 3 1| 43 1 | 0 0| 0 0| 0 0| 0 0| 0 0 | 43 1
NORTHEASTERN CIRCUIT| 2 1| 46 2| 39 2| 10 3| 97 2 | 2 20| 2 2| 1 1| 1 4| 6 3 | 103 2
NORTHERN CIRCUIT | 1 0| 29 1| 19 1| 6 2| 55 1 | 0 0| 3 2| 2 3| 1 4| 6 3 | 61 1
OCMULGEE CIRCUIT | 3 1| 72 2| 42 2| 9 2| 126 2 | 0 0| 2 2| 2 3| 0 0| 4 2 | 130 2
OCONEE CIRCUIT
| 2 1| 30 1| 17 1| 3 1| 52 1 | 0 0| 1 1| 2 3| 1 4| 4 2 | 56 1
OGEECHEE CIRCUIT | 1 0| 31 1| 27 1| 2 1| 61 1 | 0 0| 1 1| 1 1| 1 4| 3 1 | 64 1
PATAULA CIRCUIT
| 2 1| 35 1| 17 1| 6 2| 60 1 | 0 0| 1 1| 0 0| 0 0| 1 0 | 61 1
PIEDMONT CIRCUIT | 0 0| 10 0| 32 2| 7 2| 49 1 | 0 0| 1 1| 1 1| 0 0| 2 1 | 51 1
ROME CIRCUIT
| 2 1| 32 1| 25 1| 4 1| 63 1 | 1 10| 3 2| 2 3| 1 4| 7 3 | 70 1
SOUTH GEORGIA CIRCUI| 6 3| 49 2| 28 1| 4 1| 87 2 | 0 0| 3 2| 0 0| 0 0| 3 1 | 90 2
SOUTHERN CIRCUIT | 3 1| 108 4| 68 3| 8 2| 187 3 | 0 0| 3 2| 2 3| 2 8| 7 3 | 194 3
------------------------------------------------------------------------------------------------------------------------------------
(continued)
Georgia Dept. of Corrections
32
Page
30 Run 05/01/00
Georgia Department of Corrections Office of Planning and Analysis
LIFERS Inmate statistical profile
Sample: ACTIVE PRISONERS EXCLUDING JAIL
Requestor:
Active inmates 05/01/2000
Circuit Of Conviction by current age & sex
Statistics (Continued)
|
MEN
|
WOMEN
|
| Age | Age | Age | Age | Men
| Age | Age | Age | Age |Women
|Grand
Circ Of Conviction |00-21 %|22-39 %|40-54 %|55-99 %|Total % |00-21 %|22-39 %|40-54 %|55-99 %|Total % |Total %
------------------------------------------------------------------------------------------------------------------------------------
SOUTHWESTERN CIRCUIT| 1 0| 29 1| 23 1| 1 0| 54 1 | 1 10| 0 0| 3 4| 0 0| 4 2 | 58 1
STONE MOUNTAIN CIRCU| 20 10| 242 8| 153 8| 18 5| 433 8 | 1 10| 2 2| 3 4| 1 4| 7 3 | 440 8
TALLAPOOSA CIRCUIT | 1 0| 19 1| 16 1| 7 2| 43 1 | 0 0| 0 0| 0 0| 0 0| 0 0 | 43 1
TIFTON CIRCUIT
| 10 5| 58 2| 32 2| 8 2| 108 2 | 0 0| 0 0| 2 3| 1 4| 3 1 | 111 2
TOOMBS CIRCUIT
| 2 1| 44 1| 23 1| 6 2| 75 1 | 1 10| 1 1| 0 0| 0 0| 2 1 | 77 1
WAYCROSS CIRCUIT | 2 1| 34 1| 33 2| 8 2| 77 1 | 0 0| 4 3| 1 1| 0 0| 5 2 | 82 1
WESTERN CIRCUIT
| 2 1| 50 2| 24 1| 8 2| 84 1 | 0 0| 2 2| 0 0| 1 4| 3 1 | 87 1
ROCKDALE CIRCUIT | 1 0| 10 0| 10 1| 5 1| 26 0 | 0 0| 1 1| 0 0| 0 0| 1 0 | 27 0
DOUGLAS CIRCUIT
| 3 1| 50 2| 16 1| 5 1| 74 1 | 0 0| 1 1| 0 0| 0 0| 1 0 | 75 1
APPALACHIAN CIRCUIT | 0 0| 9 0| 6 0| 5 1| 20 0 | 0 0| 0 0| 1 1| 0 0| 1 0 | 21 0
ENOTAH CIRCUIT
| 1 0| 7 0| 4 0| 2 1| 14 0 | 0 0| 0 0| 0 0| 0 0| 0 0 | 14 0
BELL-FORSYTH CIRCUIT| 0 0| 1 0| 0 0| 0 0| 1 0 | 0 0| 0 0| 0 0| 0 0| 0 0 | 1 0
------------------------------------------------------------------------------------------------------------------------------------
Total reported
| 203 100| 3033 100| 1988 100| 385 100| 5609 100 | 10 100| 128 100| 72 100| 26 100| 236 100 | 5845 100
|
|
|
|
|
|
|
|
|
|
|
Percent reported |
99.5|
99.9| 100.0| 100.0|
99.9 | 100.0| 100.0| 100.0| 100.0| 100.0 |
99.9
|
|
|
|
|
|
|
|
|
|
|
|
|
|
|
|
|
|
|
|
|
|
NOT REPORTED
|1|3|0|0|4
|0|0|0|0|0
|4
------------------------------------------------------------------------------------------------------------------------------------
Total
| 204 | 3036 | 1988 | 385 | 5613
| 10 | 128 | 72 | 26 | 236
| 5849
Georgia Dept. of Corrections
33
Page 31 Run 05/01/00
Georgia Department of Corrections Office of Planning and Analysis
LIFERS Inmate statistical profile
Sample: ACTIVE PRISONERS EXCLUDING JAIL Active inmates 05/01/2000
Requestor: Statistics Home County by current age & sex
|
MEN
|
WOMEN
|
| Age | Age | Age | Age | Men
| Age | Age | Age | Age |Women
|Grand
Home County
|00-21 %|22-39 %|40-54 %|55-99 %|Total % |00-21 %|22-39 %|40-54 %|55-99 %|Total % |Total %
------------------------------------------------------------------------------------------------------------------------------------
APPLING COUNTY
| 0 0| 5 0| 5 0| 1 0| 11 0 | 0 0| 0 0| 0 0| 0 0| 0 0 | 11 0
ATKINSON COUNTY
| 0 0| 1 0| 1 0| 3 1| 5 0 | 0 0| 0 0| 0 0| 0 0| 0 0 | 5 0
BACON COUNTY
| 0 0| 6 0| 3 0| 1 0| 10 0 | 0 0| 0 0| 0 0| 0 0| 0 0 | 10 0
BAKER COUNTY
| 0 0| 1 0| 2 0| 0 0| 3 0 | 0 0| 0 0| 0 0| 0 0| 0 0 | 3 0
BALDWIN COUNTY
| 0 0| 17 1| 4 0| 1 0| 22 0 | 0 0| 1 1| 0 0| 1 4| 2 1 | 24 0
BANKS COUNTY
| 0 0| 1 0| 4 0| 1 0| 6 0 | 0 0| 1 1| 0 0| 0 0| 1 0 | 7 0
BARROW COUNTY
| 0 0| 6 0| 8 0| 2 1| 16 0 | 0 0| 0 0| 1 2| 0 0| 1 0 | 17 0
BARTOW COUNTY
| 2 1| 21 1| 19 1| 5 1| 47 1 | 1 11| 3 3| 0 0| 0 0| 4 2 | 51 1
BEN HILL COUNTY
| 0 0| 5 0| 7 0| 3 1| 15 0 | 0 0| 0 0| 1 2| 0 0| 1 0 | 16 0
BERRIEN COUNTY
| 0 0| 4 0| 1 0| 1 0| 6 0 | 0 0| 0 0| 0 0| 0 0| 0 0 | 6 0
BIBB COUNTY
| 5 3| 83 3| 76 4| 15 4| 179 3 | 1 11| 4 3| 2 3| 0 0| 7 3 | 186 3
BLECKLEY COUNTY
| 0 0| 9 0| 3 0| 1 0| 13 0 | 0 0| 0 0| 1 2| 0 0| 1 0 | 14 0
BRANTLEY COUNTY
| 0 0| 1 0| 2 0| 0 0| 3 0 | 0 0| 0 0| 0 0| 0 0| 0 0 | 3 0
BROOKS COUNTY
| 0 0| 8 0| 3 0| 1 0| 12 0 | 0 0| 0 0| 0 0| 0 0| 0 0 | 12 0
BRYAN COUNTY
| 0 0| 8 0| 5 0| 1 0| 14 0 | 0 0| 0 0| 0 0| 0 0| 0 0 | 14 0
BULLOCH COUNTY
| 1 1| 14 1| 10 1| 0 0| 25 0 | 0 0| 0 0| 1 2| 1 4| 2 1 | 27 1
BURKE COUNTY
| 0 0| 8 0| 7 0| 1 0| 16 0 | 0 0| 0 0| 0 0| 0 0| 0 0 | 16 0
BUTTS COUNTY
| 3 2| 22 1| 7 0| 2 1| 34 1 | 0 0| 2 2| 0 0| 0 0| 2 1 | 36 1
CALHOUN COUNTY
| 1 1| 2 0| 3 0| 1 0| 7 0 | 0 0| 0 0| 0 0| 0 0| 0 0 | 7 0
CAMDEN COUNTY
| 2 1| 17 1| 5 0| 0 0| 24 0 | 0 0| 0 0| 1 2| 0 0| 1 0 | 25 0
CANDLER COUNTY
| 0 0| 2 0| 1 0| 0 0| 3 0 | 0 0| 0 0| 0 0| 0 0| 0 0 | 3 0
CARROLL COUNTY
| 1 1| 19 1| 11 1| 8 2| 39 1 | 0 0| 2 2| 1 2| 0 0| 3 1 | 42 1
CATOOSA COUNTY
| 0 0| 2 0| 5 0| 1 0| 8 0 | 0 0| 0 0| 0 0| 0 0| 0 0 | 8 0
CHARLTON COUNTY
| 0 0| 1 0| 0 0| 0 0| 1 0 | 0 0| 1 1| 0 0| 0 0| 1 0 | 2 0
CHATHAM COUNTY
| 10 5| 147 5| 94 5| 12 3| 263 5 | 0 0| 3 3| 0 0| 1 4| 4 2 | 267 5
CHATTAHOOCHEE COUNTY| 0 0| 0 0| 1 0| 0 0| 1 0 | 0 0| 0 0| 0 0| 0 0| 0 0 | 1 0
CHATTOOGA COUNTY | 0 0| 3 0| 6 0| 0 0| 9 0 | 0 0| 0 0| 1 2| 1 4| 2 1 | 11 0
CHEROKEE COUNTY
| 2 1| 8 0| 16 1| 1 0| 27 1 | 0 0| 2 2| 0 0| 0 0| 2 1 | 29 1
CLARKE COUNTY
| 3 2| 47 2| 17 1| 5 1| 72 1 | 0 0| 2 2| 0 0| 2 8| 4 2 | 76 1
CLAY COUNTY
| 0 0| 1 0| 0 0| 0 0| 1 0 | 0 0| 0 0| 0 0| 0 0| 0 0 | 1 0
CLAYTON COUNTY
| 5 3| 56 2| 44 2| 8 2| 113 2 | 0 0| 3 3| 1 2| 0 0| 4 2 | 117 2
CLINCH COUNTY
| 0 0| 1 0| 2 0| 0 0| 3 0 | 0 0| 0 0| 0 0| 0 0| 0 0 | 3 0
COBB COUNTY
| 5 3| 89 3| 67 4| 7 2| 168 3 | 0 0| 4 3| 1 2| 0 0| 5 2 | 173 3
COFFEE COUNTY
| 0 0| 11 0| 4 0| 3 1| 18 0 | 0 0| 1 1| 2 3| 1 4| 4 2 | 22 0
COLQUITT COUNTY
| 5 3| 30 1| 16 1| 1 0| 52 1 | 0 0| 1 1| 0 0| 0 0| 1 0 | 53 1
COLUMBIA COUNTY
| 0 0| 9 0| 7 0| 0 0| 16 0 | 0 0| 1 1| 1 2| 0 0| 2 1 | 18 0
------------------------------------------------------------------------------------------------------------------------------------
(continued)
Georgia Dept. of Corrections
34
Page 32 Run 05/01/00
Georgia Department of Corrections Office of Planning and Analysis LIFERS Inmate statistical profile
Sample: ACTIVE PRISONERS EXCLUDING JAIL
Requestor:
Active inmates 05/01/2000
Home County by current age & sex
Statistics (CONTINUED)
|
MEN
|
WOMEN
|
| Age | Age | Age | Age | Men
| Age | Age | Age | Age |Women
|Grand
Home County
|00-21 %|22-39 %|40-54 %|55-99 %|Total % |00-21 %|22-39 %|40-54 %|55-99 %|Total % |Total %
------------------------------------------------------------------------------------------------------------------------------------
COOK COUNTY
| 0 0| 6 0| 2 0| 1 0| 9 0 | 0 0| 2 2| 0 0| 0 0| 2 1 | 11 0
COWETA COUNTY
| 6 3| 17 1| 9 0| 1 0| 33 1 | 0 0| 2 2| 1 2| 0 0| 3 1 | 36 1
CRAWFORD COUNTY
| 0 0| 1 0| 1 0| 0 0| 2 0 | 0 0| 0 0| 0 0| 0 0| 0 0 | 2 0
CRISP COUNTY
| 3 2| 12 0| 7 0| 1 0| 23 0 | 0 0| 3 3| 0 0| 1 4| 4 2 | 27 1
DADE COUNTY
| 0 0| 4 0| 3 0| 2 1| 9 0 | 0 0| 0 0| 0 0| 0 0| 0 0 | 9 0
DAWSON COUNTY
| 0 0| 2 0| 1 0| 0 0| 3 0 | 0 0| 0 0| 0 0| 0 0| 0 0 | 3 0
DECATUR COUNTY
| 4 2| 13 0| 4 0| 0 0| 21 0 | 0 0| 0 0| 0 0| 0 0| 0 0 | 21 0
DEKALB COUNTY
| 19 10| 209 8| 128 7| 20 6| 376 7 | 1 11| 2 2| 1 2| 2 8| 6 3 | 382 7
DODGE COUNTY
| 0 0| 8 0| 6 0| 0 0| 14 0 | 0 0| 0 0| 0 0| 0 0| 0 0 | 14 0
DOOLY COUNTY
| 2 1| 7 0| 3 0| 0 0| 12 0 | 0 0| 0 0| 0 0| 0 0| 0 0 | 12 0
DOUGHERTY COUNTY | 7 4| 65 2| 38 2| 2 1| 112 2 | 0 0| 5 4| 1 2| 1 4| 7 3 | 119 2
DOUGLAS COUNTY
| 1 1| 24 1| 10 1| 2 1| 37 1 | 0 0| 1 1| 0 0| 0 0| 1 0 | 38 1
EARLY COUNTY
| 0 0| 7 0| 6 0| 0 0| 13 0 | 0 0| 0 0| 0 0| 0 0| 0 0 | 13 0
ECHOLS COUNTY.
| 0 0| 0 0| 0 0| 0 0| 0 0 | 0 0| 0 0| 0 0| 0 0| 0 0 | 0 0
EFFINGHAM COUNTY | 0 0| 4 0| 3 0| 0 0| 7 0 | 0 0| 0 0| 0 0| 0 0| 0 0 | 7 0
ELBERT COUNTY
| 0 0| 12 0| 7 0| 1 0| 20 0 | 0 0| 1 1| 0 0| 0 0| 1 0 | 21 0
EMANUEL COUNTY
| 1 1| 10 0| 5 0| 1 0| 17 0 | 0 0| 1 1| 0 0| 0 0| 1 0 | 18 0
EVANS COUNTY
| 0 0| 9 0| 4 0| 1 0| 14 0 | 0 0| 0 0| 0 0| 0 0| 0 0 | 14 0
FANNIN COUNTY
| 0 0| 5 0| 3 0| 1 0| 9 0 | 0 0| 0 0| 0 0| 0 0| 0 0 | 9 0
FAYETTE COUNTY
| 0 0| 3 0| 3 0| 1 0| 7 0 | 0 0| 0 0| 0 0| 0 0| 0 0 | 7 0
FLOYD COUNTY
| 2 1| 35 1| 20 1| 1 0| 58 1 | 0 0| 3 3| 2 3| 1 4| 6 3 | 64 1
FORSYTH COUNTY
| 0 0| 7 0| 2 0| 2 1| 11 0 | 0 0| 0 0| 1 2| 0 0| 1 0 | 12 0
FRANKLIN COUNTY
| 0 0| 2 0| 4 0| 0 0| 6 0 | 0 0| 0 0| 0 0| 1 4| 1 0 | 7 0
FULTON COUNTY
| 29 15| 498 18| 332 18| 55 16| 914 18 | 3 33| 14 12| 7 11| 4 16| 28 13 | 942 18
GILMER COUNTY
| 0 0| 1 0| 2 0| 1 0| 4 0 | 0 0| 0 0| 0 0| 0 0| 0 0 | 4 0
GLASCOCK COUNTY
| 0 0| 1 0| 0 0| 0 0| 1 0 | 0 0| 0 0| 0 0| 0 0| 0 0 | 1 0
GLYNN COUNTY
| 4 2| 33 1| 23 1| 3 1| 63 1 | 0 0| 1 1| 2 3| 0 0| 3 1 | 66 1
GORDON COUNTY
| 0 0| 22 1| 11 1| 3 1| 36 1 | 0 0| 1 1| 0 0| 0 0| 1 0 | 37 1
GRADY COUNTY
| 1 1| 14 1| 7 0| 0 0| 22 0 | 0 0| 0 0| 0 0| 0 0| 0 0 | 22 0
GREENE COUNTY
| 1 1| 3 0| 3 0| 1 0| 8 0 | 0 0| 0 0| 1 2| 0 0| 1 0 | 9 0
GWINNETT COUNTY
| 3 2| 68 2| 36 2| 8 2| 115 2 | 0 0| 3 3| 1 2| 0 0| 4 2 | 119 2
HABERSHAM COUNTY | 0 0| 9 0| 7 0| 0 0| 16 0 | 0 0| 0 0| 0 0| 0 0| 0 0 | 16 0
HALL COUNTY
| 2 1| 32 1| 34 2| 10 3| 78 2 | 1 11| 2 2| 1 2| 1 4| 5 2 | 83 2
HANCOCK COUNTY
| 0 0| 2 0| 2 0| 1 0| 5 0 | 0 0| 0 0| 1 2| 0 0| 1 0 | 6 0
HARALSON COUNTY
| 0 0| 1 0| 2 0| 2 1| 5 0 | 0 0| 0 0| 0 0| 0 0| 0 0 | 5 0
------------------------------------------------------------------------------------------------------------------------------------
(continued)
Georgia Dept. of Corrections
35
Page 33 Run 05/01/00
Georgia Department of Corrections Office of Planning and Analysis LIFERS Inmate statistical profile
Sample: ACTIVE PRISONERS EXCLUDING JAIL
Requestor:
Active inmates 05/01/2000
Home County by current age & sex
Statistics (CONTINUED)
|
MEN
|
WOMEN
|
| Age | Age | Age | Age | Men
| Age | Age | Age | Age |Women
|Grand
Home County
|00-21 %|22-39 %|40-54 %|55-99 %|Total % |00-21 %|22-39 %|40-54 %|55-99 %|Total % |Total %
------------------------------------------------------------------------------------------------------------------------------------
HARRIS COUNTY
| 1 1| 6 0| 2 0| 0 0| 9 0 | 0 0| 0 0| 0 0| 0 0| 0 0 | 9 0
HART COUNTY
| 0 0| 1 0| 2 0| 0 0| 3 0 | 0 0| 0 0| 1 2| 0 0| 1 0 | 4 0
HEARD COUNTY
| 0 0| 1 0| 1 0| 2 1| 4 0 | 0 0| 0 0| 0 0| 0 0| 0 0 | 4 0
HENRY COUNTY
| 1 1| 19 1| 8 0| 5 1| 33 1 | 0 0| 1 1| 2 3| 0 0| 3 1 | 36 1
HOUSTON COUNTY
| 0 0| 44 2| 20 1| 5 1| 69 1 | 0 0| 3 3| 4 6| 0 0| 7 3 | 76 1
IRWIN COUNTY
| 1 1| 4 0| 3 0| 0 0| 8 0 | 0 0| 0 0| 0 0| 0 0| 0 0 | 8 0
JACKSON COUNTY
| 0 0| 8 0| 10 1| 5 1| 23 0 | 0 0| 0 0| 0 0| 0 0| 0 0 | 23 0
JASPER COUNTY
| 2 1| 8 0| 0 0| 1 0| 11 0 | 0 0| 0 0| 0 0| 0 0| 0 0 | 11 0
JEFF DAVIS COUNTY | 1 1| 5 0| 3 0| 0 0| 9 0 | 0 0| 0 0| 0 0| 0 0| 0 0 | 9 0
JEFFERSON COUNTY | 0 0| 4 0| 2 0| 2 1| 8 0 | 0 0| 1 1| 0 0| 0 0| 1 0 | 9 0
JENKINS COUNTY
| 0 0| 0 0| 6 0| 0 0| 6 0 | 0 0| 0 0| 0 0| 0 0| 0 0 | 6 0
JOHNSON COUNTY
| 0 0| 3 0| 2 0| 0 0| 5 0 | 0 0| 0 0| 0 0| 0 0| 0 0 | 5 0
JONES COUNTY
| 0 0| 0 0| 3 0| 1 0| 4 0 | 0 0| 1 1| 0 0| 0 0| 1 0 | 5 0
LAMAR COUNTY
| 0 0| 9 0| 9 0| 3 1| 21 0 | 0 0| 0 0| 1 2| 0 0| 1 0 | 22 0
LANIER COUNTY
| 0 0| 1 0| 0 0| 0 0| 1 0 | 0 0| 0 0| 0 0| 0 0| 0 0 | 1 0
LAURENS COUNTY
| 1 1| 15 1| 7 0| 2 1| 25 0 | 0 0| 1 1| 1 2| 0 0| 2 1 | 27 1
LEE COUNTY
| 0 0| 3 0| 0 0| 0 0| 3 0 | 0 0| 0 0| 0 0| 0 0| 0 0 | 3 0
LIBERTY COUNTY
| 1 1| 24 1| 8 0| 4 1| 37 1 | 0 0| 3 3| 0 0| 0 0| 3 1 | 40 1
LINCOLN COUNTY
| 1 1| 1 0| 3 0| 0 0| 5 0 | 0 0| 0 0| 0 0| 0 0| 0 0 | 5 0
LONG COUNTY
| 0 0| 6 0| 2 0| 1 0| 9 0 | 0 0| 0 0| 0 0| 0 0| 0 0 | 9 0
LOWNDES COUNTY
| 0 0| 35 1| 20 1| 2 1| 57 1 | 0 0| 0 0| 2 3| 1 4| 3 1 | 60 1
LUMPKIN COUNTY
| 1 1| 5 0| 4 0| 1 0| 11 0 | 0 0| 0 0| 0 0| 0 0| 0 0 | 11 0
MACON COUNTY
| 0 0| 13 0| 5 0| 0 0| 18 0 | 0 0| 0 0| 1 2| 0 0| 1 0 | 19 0
MADISON COUNTY
| 0 0| 7 0| 4 0| 2 1| 13 0 | 0 0| 2 2| 0 0| 0 0| 2 1 | 15 0
MARION COUNTY
| 1 1| 0 0| 2 0| 1 0| 4 0 | 0 0| 0 0| 0 0| 0 0| 0 0 | 4 0
MCDUFFIE COUNTY
| 1 1| 21 1| 10 1| 4 1| 36 1 | 1 11| 1 1| 0 0| 0 0| 2 1 | 38 1
MCINTOSH COUNTY
| 1 1| 4 0| 3 0| 0 0| 8 0 | 0 0| 0 0| 0 0| 0 0| 0 0 | 8 0
MERIWETHER COUNTY | 0 0| 7 0| 7 0| 3 1| 17 0 | 0 0| 1 1| 0 0| 1 4| 2 1 | 19 0
MILLER COUNTY
| 0 0| 3 0| 3 0| 0 0| 6 0 | 0 0| 0 0| 0 0| 0 0| 0 0 | 6 0
MITCHELL COUNTY
| 0 0| 12 0| 10 1| 3 1| 25 0 | 0 0| 1 1| 0 0| 0 0| 1 0 | 26 0
MONROE COUNTY
| 0 0| 11 0| 2 0| 0 0| 13 0 | 0 0| 0 0| 0 0| 0 0| 0 0 | 13 0
MONTGOMERY COUNTY | 0 0| 0 0| 0 0| 0 0| 0 0 | 0 0| 1 1| 0 0| 0 0| 1 0 | 1 0
MORGAN COUNTY
| 0 0| 9 0| 2 0| 0 0| 11 0 | 0 0| 0 0| 0 0| 0 0| 0 0 | 11 0
MURRAY COUNTY
| 0 0| 7 0| 3 0| 4 1| 14 0 | 0 0| 1 1| 0 0| 0 0| 1 0 | 15 0
MUSCOGEE COUNTY
| 6 3| 62 2| 57 3| 9 3| 134 3 | 0 0| 3 3| 2 3| 0 0| 5 2 | 139 3
------------------------------------------------------------------------------------------------------------------------------------
(continued)
Georgia Dept. of Corrections
36
Page 34 Run 05/01/00
Georgia Department of Corrections Office of Planning and Analysis LIFERS Inmate statistical profile
Sample: ACTIVE PRISONERS EXCLUDING JAIL
Requestor:
Active inmates 05/01/2000
Home County by current age & sex
Statistics (CONTINUED)
|
MEN
|
WOMEN
|
| Age | Age | Age | Age | Men
| Age | Age | Age | Age |Women
|Grand
Home County
|00-21 %|22-39 %|40-54 %|55-99 %|Total % |00-21 %|22-39 %|40-54 %|55-99 %|Total % |Total %
------------------------------------------------------------------------------------------------------------------------------------
NEWTON COUNTY
| 2 1| 37 1| 13 1| 2 1| 54 1 | 0 0| 2 2| 0 0| 1 4| 3 1 | 57 1
OCONEE COUNTY
| 0 0| 3 0| 1 0| 0 0| 4 0 | 0 0| 0 0| 1 2| 0 0| 1 0 | 5 0
OGLETHORPE COUNTY | 0 0| 4 0| 0 0| 0 0| 4 0 | 0 0| 0 0| 0 0| 0 0| 0 0 | 4 0
PAULDING COUNTY
| 0 0| 9 0| 5 0| 3 1| 17 0 | 0 0| 0 0| 1 2| 1 4| 2 1 | 19 0
PEACH COUNTY
| 0 0| 7 0| 2 0| 0 0| 9 0 | 0 0| 1 1| 0 0| 0 0| 1 0 | 10 0
PICKENS COUNTY
| 0 0| 3 0| 0 0| 0 0| 3 0 | 0 0| 0 0| 1 2| 0 0| 1 0 | 4 0
PIERCE COUNTY
| 1 1| 2 0| 2 0| 0 0| 5 0 | 0 0| 0 0| 0 0| 0 0| 0 0 | 5 0
PIKE COUNTY
| 0 0| 1 0| 0 0| 0 0| 1 0 | 0 0| 0 0| 0 0| 0 0| 0 0 | 1 0
POLK COUNTY
| 1 1| 12 0| 5 0| 3 1| 21 0 | 0 0| 0 0| 0 0| 0 0| 0 0 | 21 0
PULASKI COUNTY
| 1 1| 3 0| 3 0| 0 0| 7 0 | 0 0| 1 1| 0 0| 0 0| 1 0 | 8 0
PUTNAM COUNTY
| 0 0| 15 1| 14 1| 1 0| 30 1 | 0 0| 0 0| 0 0| 0 0| 0 0 | 30 1
QUITMAN COUNTY
| 0 0| 2 0| 0 0| 0 0| 2 0 | 0 0| 0 0| 0 0| 0 0| 0 0 | 2 0
RABUN COUNTY
| 0 0| 7 0| 1 0| 0 0| 8 0 | 0 0| 0 0| 0 0| 0 0| 0 0 | 8 0
RANDOLPH COUNTY
| 0 0| 3 0| 3 0| 1 0| 7 0 | 0 0| 0 0| 0 0| 0 0| 0 0 | 7 0
RICHMOND COUNTY
| 16 8| 142 5| 62 3| 7 2| 227 4 | 0 0| 8 7| 8 12| 1 4| 17 8 | 244 5
ROCKDALE COUNTY
| 1 1| 9 0| 8 0| 4 1| 22 0 | 0 0| 1 1| 0 0| 0 0| 1 0 | 23 0
SCHLEY COUNTY
| 0 0| 3 0| 1 0| 0 0| 4 0 | 0 0| 0 0| 0 0| 0 0| 0 0 | 4 0
SCREVEN COUNTY
| 0 0| 3 0| 2 0| 2 1| 7 0 | 0 0| 0 0| 0 0| 0 0| 0 0 | 7 0
SEMINOLE COUNTY
| 1 1| 6 0| 5 0| 1 0| 13 0 | 0 0| 1 1| 0 0| 0 0| 1 0 | 14 0
SPALDING COUNTY
| 3 2| 37 1| 21 1| 5 1| 66 1 | 1 11| 1 1| 0 0| 1 4| 3 1 | 69 1
STEPHENS COUNTY
| 0 0| 5 0| 6 0| 4 1| 15 0 | 0 0| 0 0| 0 0| 0 0| 0 0 | 15 0
STEWART COUNTY
| 0 0| 2 0| 2 0| 0 0| 4 0 | 0 0| 0 0| 0 0| 0 0| 0 0 | 4 0
SUMTER COUNTY
| 0 0| 3 0| 15 1| 2 1| 20 0 | 0 0| 0 0| 1 2| 0 0| 1 0 | 21 0
TALBOT COUNTY
| 2 1| 3 0| 1 0| 0 0| 6 0 | 0 0| 0 0| 1 2| 0 0| 1 0 | 7 0
TALIAFERRO COUNTY | 0 0| 0 0| 1 0| 0 0| 1 0 | 0 0| 0 0| 0 0| 0 0| 0 0 | 1 0
TATTNALL COUNTY
| 1 1| 13 0| 4 0| 0 0| 18 0 | 0 0| 0 0| 1 2| 0 0| 1 0 | 19 0
TAYLOR COUNTY
| 1 1| 9 0| 3 0| 1 0| 14 0 | 0 0| 0 0| 0 0| 0 0| 0 0 | 14 0
TELFAIR COUNTY
| 1 1| 6 0| 3 0| 0 0| 10 0 | 0 0| 0 0| 1 2| 0 0| 1 0 | 11 0
TERRELL COUNTY
| 2 1| 8 0| 1 0| 0 0| 11 0 | 0 0| 0 0| 0 0| 0 0| 0 0 | 11 0
THOMAS COUNTY
| 1 1| 15 1| 14 1| 4 1| 34 1 | 0 0| 2 2| 0 0| 0 0| 2 1 | 36 1
TIFT COUNTY
| 2 1| 30 1| 19 1| 4 1| 55 1 | 0 0| 0 0| 0 0| 1 4| 1 0 | 56 1
TOOMBS COUNTY
| 2 1| 14 1| 9 0| 0 0| 25 0 | 0 0| 1 1| 0 0| 0 0| 1 0 | 26 0
TOWNS COUNTY
| 0 0| 0 0| 0 0| 0 0| 0 0 | 0 0| 0 0| 0 0| 0 0| 0 0 | 0 0
TREUTLEN COUNTY
| 0 0| 2 0| 3 0| 0 0| 5 0 | 0 0| 0 0| 0 0| 0 0| 0 0 | 5 0
TROUP COUNTY
| 4 2| 19 1| 18 1| 4 1| 45 1 | 0 0| 1 1| 1 2| 0 0| 2 1 | 47 1
------------------------------------------------------------------------------------------------------------------------------------
(continued)
Georgia Dept. of Corrections
37
Page 35 Run 05/01/00
Georgia Department of Corrections Office of Planning and Analysis
LIFERS Inmate statistical profile
Sample: ACTIVE PRISONERS EXCLUDING JAIL
Requestor:
Active inmates 05/01/2000
Home County by current age & sex
Statistics (CONTINUED)
|
MEN
|
WOMEN
|
| Age | Age | Age | Age | Men
| Age | Age | Age | Age |Women
|Grand
Home County
|00-21 %|22-39 %|40-54 %|55-99 %|Total % |00-21 %|22-39 %|40-54 %|55-99 %|Total % |Total %
------------------------------------------------------------------------------------------------------------------------------------
TURNER COUNTY
| 0 0| 7 0| 4 0| 0 0| 11 0 | 0 0| 0 0| 0 0| 0 0| 0 0 | 11 0
TWIGGS COUNTY
| 0 0| 5 0| 4 0| 0 0| 9 0 | 0 0| 0 0| 0 0| 0 0| 0 0 | 9 0
UNION COUNTY
| 0 0| 0 0| 0 0| 0 0| 0 0 | 0 0| 0 0| 0 0| 0 0| 0 0 | 0 0
UPSON COUNTY
| 0 0| 6 0| 5 0| 0 0| 11 0 | 0 0| 0 0| 1 2| 0 0| 1 0 | 12 0
WALKER COUNTY
| 0 0| 16 1| 6 0| 2 1| 24 0 | 0 0| 1 1| 1 2| 0 0| 2 1 | 26 0
WALTON COUNTY
| 1 1| 28 1| 15 1| 3 1| 47 1 | 0 0| 1 1| 0 0| 0 0| 1 0 | 48 1
WARE COUNTY
| 1 1| 15 1| 14 1| 2 1| 32 1 | 0 0| 0 0| 0 0| 0 0| 0 0 | 32 1
WARREN COUNTY
| 0 0| 3 0| 5 0| 1 0| 9 0 | 0 0| 0 0| 0 0| 0 0| 0 0 | 9 0
WASHINGTON COUNTY | 0 0| 14 1| 7 0| 0 0| 21 0 | 0 0| 1 1| 0 0| 0 0| 1 0 | 22 0
WAYNE COUNTY
| 0 0| 7 0| 13 1| 2 1| 22 0 | 0 0| 1 1| 0 0| 0 0| 1 0 | 23 0
WEBSTER COUNTY
| 0 0| 2 0| 0 0| 0 0| 2 0 | 0 0| 0 0| 0 0| 0 0| 0 0 | 2 0
WHEELER COUNTY
| 0 0| 1 0| 3 0| 1 0| 5 0 | 0 0| 0 0| 0 0| 0 0| 0 0 | 5 0
WHITE COUNTY
| 0 0| 3 0| 3 0| 1 0| 7 0 | 0 0| 0 0| 0 0| 0 0| 0 0 | 7 0
WHITFIELD COUNTY | 0 0| 12 0| 25 1| 5 1| 42 1 | 0 0| 2 2| 0 0| 0 0| 2 1 | 44 1
WILCOX COUNTY
| 0 0| 0 0| 6 0| 0 0| 6 0 | 0 0| 0 0| 0 0| 0 0| 0 0 | 6 0
WILKES COUNTY
| 0 0| 3 0| 2 0| 2 1| 7 0 | 0 0| 0 0| 0 0| 0 0| 0 0 | 7 0
WILKINSON COUNTY | 0 0| 7 0| 3 0| 0 0| 10 0 | 0 0| 0 0| 0 0| 0 0| 0 0 | 10 0
WORTH COUNTY
| 3 2| 12 0| 2 0| 0 0| 17 0 | 0 0| 1 1| 0 0| 0 0| 1 0 | 18 0
OUT OF STATE
| 0 2| 16 1| 54 3| 16 5| 86 2 | 0 0| 0 1| 0 0| 0 0| 0 0 | 86 2
------------------------------------------------------------------------------------------------------------------------------------
Total reported
| 196 100| 2763 100| 1835 100| 350 100| 5144 100 | 9 100| 118 100| 65 100| 25 100| 217 100 | 5361 100
|
|
|
|
|
|
|
|
|
|
|
Percent reported |
96.1|
91.0|
92.3|
90.9|
91.6 |
90.0|
92.2|
90.3|
96.2|
91.9 |
91.7
|
|
|
|
|
|
|
|
|
|
|
|
|
|
|
|
|
|
|
|
|
|
UNKNOWN
| 8 | 273 | 153 | 35 | 469
| 1 | 10 | 7 | 1 | 19
| 488
------------------------------------------------------------------------------------------------------------------------------------
Total
| 204 | 3036 | 1988 | 385 | 5613
| 10 | 128 | 72 | 26 | 236
| 5849
Georgia Dept. of Corrections
38
Georgia Department of Corrections
Page 36 Run 05/01/00
Office of Planning and Analysis
LIFERS Inmate statistical profile
Sample: ACTIVE PRISONERS EXCLUDING JAIL
Requestor: Statistics
Active inmates 05/01/2000
Prison Sentence In Years by current age & sex
|
MEN
|
WOMEN
|
| Age | Age | Age | Age | Men
| Age | Age | Age | Age |Women
|Grand
Sentence In Years |00-21 %|22-39 %|40-54 %|55-99 %|Total % |00-21 %|22-39 %|40-54 %|55-99 %|Total % |Total %
------------------------------------------------------------------------------------------------------------------------------------
0-1
| 0 0| 0 0| 0 0| 0 0| 0 0 | 0 0| 0 0| 0 0| 0 0| 0 0 | 0 0
1.1-2
| 0 0| 0 0| 0 0| 0 0| 0 0 | 0 0| 0 0| 0 0| 0 0| 0 0 | 0 0
2.1-3
| 0 0| 0 0| 0 0| 0 0| 0 0 | 0 0| 0 0| 0 0| 0 0| 0 0 | 0 0
3.1-4
| 0 0| 0 0| 0 0| 0 0| 0 0 | 0 0| 0 0| 0 0| 0 0| 0 0 | 0 0
4.1-5
| 0 0| 0 0| 0 0| 0 0| 0 0 | 0 0| 0 0| 0 0| 0 0| 0 0 | 0 0
5.1-6
| 0 0| 0 0| 0 0| 0 0| 0 0 | 0 0| 0 0| 0 0| 0 0| 0 0 | 0 0
6.1-7
| 0 0| 0 0| 0 0| 0 0| 0 0 | 0 0| 0 0| 0 0| 0 0| 0 0 | 0 0
7.1-8
| 0 0| 0 0| 0 0| 0 0| 0 0 | 0 0| 0 0| 0 0| 0 0| 0 0 | 0 0
8.1-9
| 0 0| 0 0| 0 0| 0 0| 0 0 | 0 0| 0 0| 0 0| 0 0| 0 0 | 0 0
9.1-10
| 0 0| 0 0| 0 0| 0 0| 0 0 | 0 0| 0 0| 0 0| 0 0| 0 0 | 0 0
10.1-12
| 0 0| 0 0| 0 0| 0 0| 0 0 | 0 0| 0 0| 0 0| 0 0| 0 0 | 0 0
12.1-15
| 0 0| 0 0| 0 0| 0 0| 0 0 | 0 0| 0 0| 0 0| 0 0| 0 0 | 0 0
15.1-20
| 0 0| 0 0| 0 0| 0 0| 0 0 | 0 0| 0 0| 0 0| 0 0| 0 0 | 0 0
20.1-OVER
| 0 0| 1 0| 0 0| 0 0| 1 0 | 0 0| 0 0| 0 0| 0 0| 0 0 | 1 0
LIFE
| 204 100| 3035 100| 1988 100| 385 100| 5612 100 | 10 100| 128 100| 72 100| 26 100| 236 100 | 5848 100
DEATH
| 0 0| 0 0| 0 0| 0 0| 0 0 | 0 0| 0 0| 0 0| 0 0| 0 0 | 0 0
LIFE W/O PAROLE
| 0 0| 0 0| 0 0| 0 0| 0 0 | 0 0| 0 0| 0 0| 0 0| 0 0 | 0 0
YOUTHFUL OFFENDERS | 0 0| 0 0| 0 0| 0 0| 0 0 | 0 0| 0 0| 0 0| 0 0| 0 0 | 0 0
------------------------------------------------------------------------------------------------------------------------------------
Total reported
| 204 100| 3036 100| 1988 100| 385 100| 5613 100 | 10 100| 128 100| 72 100| 26 100| 236 100 | 5849 100
|
|
|
|
|
|
|
|
|
|
|
Percent reported | 100.0| 100.0| 100.0| 100.0| 100.0 | 100.0| 100.0| 100.0| 100.0| 100.0 | 100.0
|
|
|
|
|
|
|
|
|
|
|
|
|
|
|
|
|
|
|
|
|
|
NOT REPORTED
|0|0|0|0|0
|0|0|0|0|0
|0
------------------------------------------------------------------------------------------------------------------------------------
Total
| 204 | 3036 | 1988 | 385 | 5613
| 10 | 128 | 72 | 26 | 236
| 5849
|
|
|
|
|
|
|
|
|
|
|
|
|
|
|
|
|
|
|
|
|
|
|
|
|
|
|
|
|
|
|
|
|
|
|
|
|
|
|
|
|
|
|
|
|
|
|
|
|
|
|
|
|
|
|
AVG EXCLUDING
|
|
|
|
|
|
|
|
|
|
|
LIFE, DEATH, YO
| .00 | 243.53 | .00 | .00 | 243.53 | .00 | .00 | .00 | .00 | .00 | 243.53
|
|
|
|
|
|
|
|
|
|
|
|
|
|
|
|
|
|
|
|
|
|
|
|
|
|
|
|
|
|
|
|
|
|
|
|
|
|
|
|
|
|
|
|
|
|
|
|
|
|
|
|
|
|
|
AVG INCLUDING
|
|
|
|
|
|
|
|
|
|
|
LIFE=21, YO=3 YRS | 21.00 | 21.07 | 21.00 | 21.00 | 21.04 | 21.00 | 21.00 | 21.00 | 21.00 | 21.00 | 21.04
Georgia Dept. of Corrections
39
Page 37 Run 05/01/00
Georgia Department of Corrections Office of Planning and Analysis
LIFERS Inmate statistical profile
Sample: ACTIVE PRISONERS EXCLUDING JAIL Active inmates 05/01/2000
Requestor: Statistics Probation To Follow Prison by current age & sex
|
MEN
|
WOMEN
|
| Age | Age | Age | Age | Men
| Age | Age | Age | Age |Women
|Grand
Prob After Prison |00-21 %|22-39 %|40-54 %|55-99 %|Total % |00-21 %|22-39 %|40-54 %|55-99 %|Total % |Total %
------------------------------------------------------------------------------------------------------------------------------------
PROBATION TO FOLLOW | 10 5| 92 3| 58 3| 5 1| 165 3 | 0 0| 3 2| 2 3| 1 4| 6 3 | 171 3
NO PROBATION
| 194 95| 2944 97| 1930 97| 380 99| 5448 97 | 10 100| 125 98| 70 97| 25 96| 230 97 | 5678 97
------------------------------------------------------------------------------------------------------------------------------------
Total reported
| 204 100| 3036 100| 1988 100| 385 100| 5613 100 | 10 100| 128 100| 72 100| 26 100| 236 100 | 5849 100
|
|
|
|
|
|
|
|
|
|
|
Percent reported | 100.0| 100.0| 100.0| 100.0| 100.0 | 100.0| 100.0| 100.0| 100.0| 100.0 | 100.0
|
|
|
|
|
|
|
|
|
|
|
|
|
|
|
|
|
|
|
|
|
|
NOT REPORTED
|0|0|0|0|0
|0|0|0|0|0
|0
------------------------------------------------------------------------------------------------------------------------------------
Total
| 204 | 3036 | 1988 | 385 | 5613
| 10 | 128 | 72 | 26 | 236
| 5849
Georgia Dept. of Corrections
40
Page
38 Run 05/01/00
Georgia Department of Corrections Office of Planning and Analysis
LIFERS Inmate statistical profile
Sample: ACTIVE PRISONERS EXCLUDING JAIL Active inmates 05/01/2000
Requestor: Statistics Admission Type by current age & sex
|
MEN
|
WOMEN
|
| Age | Age | Age | Age | Men
| Age | Age | Age | Age |Women
|Grand
Admission Type
|00-21 %|22-39 %|40-54 %|55-99 %|Total % |00-21 %|22-39 %|40-54 %|55-99 %|Total % |Total %
------------------------------------------------------------------------------------------------------------------------------------
COMMITTED FROM COURT| 199 98| 2433 80| 1449 73| 276 72| 4357 78 | 10 100| 115 90| 61 85| 26 100| 212 90 | 4569 78
RETURN APPEAL/BOND | 0 0| 0 0| 1 0| 0 0| 1 0 | 0 0| 0 0| 0 0| 0 0| 0 0 | 1 0
PAROLE REV/NEW SENT | 0 0| 384 13| 334 17| 67 17| 785 14 | 0 0| 10 8| 6 8| 0 0| 16 7 | 801 14
PAR REV/NO NEW SENT | 0 0| 24 1| 68 3| 8 2| 100 2 | 0 0| 0 0| 1 1| 0 0| 1 0 | 101 2
PROB VIOL/TOTAL REV | 0 0| 0 0| 0 0| 0 0| 0 0 | 0 0| 0 0| 0 0| 0 0| 0 0 | 0 0
PROB VIOL/PARTIAL | 0 0| 40 1| 36 2| 3 1| 79 1 | 0 0| 0 0| 2 3| 0 0| 2 1 | 81 1
ADMIT FM OTHER CUST | 0 0| 1 0| 2 0| 4 1| 7 0 | 0 0| 0 0| 0 0| 0 0| 0 0 | 7 0
SHOCK INCARCERATION | 0 0| 0 0| 0 0| 0 0| 0 0 | 0 0| 0 0| 0 0| 0 0| 0 0 | 0 0
PROB REV/REMAINDER | 3 1| 116 4| 44 2| 7 2| 170 3 | 0 0| 3 2| 2 3| 0 0| 5 2 | 175 3
NEW SENT/PAR REV PND| 0 0| 2 0| 4 0| 1 0| 7 0 | 0 0| 0 0| 0 0| 0 0| 0 0 | 7 0
LIFE W/O PAROLE
| 1 0| 12 0| 3 0| 0 0| 16 0 | 0 0| 0 0| 0 0| 0 0| 0 0 | 16 0
PAROLE REV BOOT CAMP| 0 0| 2 0| 1 0| 0 0| 3 0 | 0 0| 0 0| 0 0| 0 0| 0 0 | 3 0
PAR REV/RSN UNKNOWN | 0 0| 19 1| 39 2| 18 5| 76 1 | 0 0| 0 0| 0 0| 0 0| 0 0 | 76 1
PROBATION/PAROLE REV| 0 0| 0 0| 0 0| 0 0| 0 0 | 0 0| 0 0| 0 0| 0 0| 0 0 | 0 0
PB PAROLE RESCINDED | 0 0| 0 0| 0 0| 0 0| 0 0 | 0 0| 0 0| 0 0| 0 0| 0 0 | 0 0
PROB REVOCATION/SC | 0 0| 0 0| 0 0| 0 0| 0 0 | 0 0| 0 0| 0 0| 0 0| 0 0 | 0 0
PAR REV/REVOC CENTER| 0 0| 3 0| 6 0| 1 0| 10 0 | 0 0| 0 0| 0 0| 0 0| 0 0 | 10 0
INFORMATION ONLY | 0 0| 0 0| 0 0| 0 0| 0 0 | 0 0| 0 0| 0 0| 0 0| 0 0 | 0 0
INCOMPLETE SENT PKG | 0 0| 0 0| 0 0| 0 0| 0 0 | 0 0| 0 0| 0 0| 0 0| 0 0 | 0 0
HANCOCK REVOC CENTER| 0 0| 0 0| 0 0| 0 0| 0 0 | 0 0| 0 0| 0 0| 0 0| 0 0 | 0 0
WHITWORTH DETENTION | 0 0| 0 0| 1 0| 0 0| 1 0 | 0 0| 0 0| 0 0| 0 0| 0 0 | 1 0
DCYS AT RISK
| 0 0| 0 0| 0 0| 0 0| 0 0 | 0 0| 0 0| 0 0| 0 0| 0 0 | 0 0
OTHER
| 0 0| 0 0| 0 0| 0 0| 0 0 | 0 0| 0 0| 0 0| 0 0| 0 0 | 0 0
------------------------------------------------------------------------------------------------------------------------------------
Total reported
| 203 100| 3036 100| 1988 100| 385 100| 5612 100 | 10 100| 128 100| 72 100| 26 100| 236 100 | 5848 100
|
|
|
|
|
|
|
|
|
|
|
Percent reported |
99.5| 100.0| 100.0| 100.0| 100.0 | 100.0| 100.0| 100.0| 100.0| 100.0 | 100.0
|
|
|
|
|
|
|
|
|
|
|
|
|
|
|
|
|
|
|
|
|
|
UNKNOWN
|1|0|0|0|1
|0|0|0|0|0
|1
------------------------------------------------------------------------------------------------------------------------------------
Total
| 204 | 3036 | 1988 | 385 | 5613
| 10 | 128 | 72 | 26 | 236
| 5849
Georgia Dept. of Corrections
41
Page 39 Run 05/01/00
Georgia Department of Corrections Office of Planning and Analysis LIFERS Inmate statistical profile
Sample: ACTIVE PRISONERS EXCLUDING JAIL Active inmates 05/01/2000
Requestor: Statistics Release Type by current age & sex
|
MEN
|
WOMEN
|
| Age | Age | Age | Age | Men
| Age | Age | Age | Age |Women
|Grand
Release Type
|00-21 %|22-39 %|40-54 %|55-99 %|Total % |00-21 %|22-39 %|40-54 %|55-99 %|Total % |Total %
------------------------------------------------------------------------------------------------------------------------------------
PAROLE
| 1 0| 0 0| 0 0| 0 0| 1 0 | 0 0| 0 0| 0 0| 0 0| 0 0 | 1 0
Active
| 204 100| 3036 100| 1988 100| 385 100| 5613 100 | 10 100| 128 100| 72 100| 26 100| 236 100 | 5849 100
------------------------------------------------------------------------------------------------------------------------------------
Total
| 204 | 3036 | 1988 | 385 | 5613
| 10 | 128 | 72 | 26 | 236
| 5849
Georgia Dept. of Corrections
42
Page 40 Run 05/01/00
Georgia Department of Corrections Office of Planning and Analysis LIFERS Inmate statistical profile
Sample: ACTIVE PRISONERS EXCLUDING JAIL Active inmates 05/01/2000
Requestor: Statistics Inst By Group by current age & sex
|
MEN
|
WOMEN
|
| Age | Age | Age | Age | Men
| Age | Age | Age | Age |Women
|Grand
Inst By Group
|00-21 %|22-39 %|40-54 %|55-99 %|Total % |00-21 %|22-39 %|40-54 %|55-99 %|Total % |Total %
------------------------------------------------------------------------------------------------------------------------------------
County jails
| 0 0| 0 0| 0 0| 0 0| 0 0 | 0 0| 0 0| 0 0| 0 0| 0 0 | 0 0
Transitional centers| 0 0| 17 1| 20 1| 3 1| 40 1 | 0 0| 0 0| 0 0| 1 4| 1 0 | 41 1
County camps
| 0 0| 15 0| 10 1| 4 1| 29 1 | 0 0| 0 0| 0 0| 0 0| 0 0 | 29 0
Inmate boot camps | 0 0| 0 0| 0 0| 0 0| 0 0 | 0 0| 0 0| 0 0| 0 0| 0 0 | 0 0
State prisons
| 204 100| 2918 96| 1910 96| 369 96| 5401 96 | 10 100| 128 100| 72 100| 25 96| 235 100 | 5636 96
Private prisons
| 0 0| 85 3| 48 2| 9 2| 142 3 | 0 0| 0 0| 0 0| 0 0| 0 0 | 142 2
Other
| 0 0| 1 0| 0 0| 0 0| 1 0 | 0 0| 0 0| 0 0| 0 0| 0 0 | 1 0
------------------------------------------------------------------------------------------------------------------------------------
Total reported
| 204 100| 3036 100| 1988 100| 385 100| 5613 100 | 10 100| 128 100| 72 100| 26 100| 236 100 | 5849 100
|
|
|
|
|
|
|
|
|
|
|
Percent reported | 100.0| 100.0| 100.0| 100.0| 100.0 | 100.0| 100.0| 100.0| 100.0| 100.0 | 100.0
|
|
|
|
|
|
|
|
|
|
|
|
|
|
|
|
|
|
|
|
|
|
Not reported
|0|0|0|0|0
|0|0|0|0|0
|0
------------------------------------------------------------------------------------------------------------------------------------
Total
| 204 | 3036 | 1988 | 385 | 5613
| 10 | 128 | 72 | 26 | 236
| 5849
Georgia Dept. of Corrections
43
Page 41 Run 05/01/00
Georgia Department of Corrections Office of Planning and Analysis
LIFERS Inmate statistical profile
Sample: ACTIVE PRISONERS EXCLUDING JAIL Active inmates 05/01/2000
Requestor: Statistics Institution by current age & sex
|
MEN
|
WOMEN
|
| Age | Age | Age | Age | Men
| Age | Age | Age | Age |Women
|Grand
Institution
|00-21 %|22-39 %|40-54 %|55-99 %|Total % |00-21 %|22-39 %|40-54 %|55-99 %|Total % |Total %
------------------------------------------------------------------------------------------------------------------------------------
Albany Trans Ctr | 0 0| 1 0| 0 0| 1 0| 2 0 | 0 0| 0 0| 0 0| 0 0| 0 0 | 2 0
Atlanta Trans Ctr(M)| 0 0| 12 0| 12 1| 2 1| 26 0 | 0 0| 0 0| 0 0| 0 0| 0 0 | 26 0
Macon Trans Ctr
| 0 0| 2 0| 4 0| 0 0| 6 0 | 0 0| 0 0| 0 0| 0 0| 0 0 | 6 0
Metro Trans Ctr (W) | 0 0| 0 0| 0 0| 0 0| 0 0 | 0 0| 0 0| 0 0| 1 4| 1 0 | 1 0
Savannah Trans Ctr | 0 0| 2 0| 4 0| 0 0| 6 0 | 0 0| 0 0| 0 0| 0 0| 0 0 | 6 0
Central State Hosp | 0 0| 1 0| 0 0| 0 0| 1 0 | 0 0| 0 0| 0 0| 0 0| 0 0 | 1 0
Carroll County
| 0 0| 1 0| 0 0| 1 0| 2 0 | 0 0| 0 0| 0 0| 0 0| 0 0 | 2 0
Clarke County
| 0 0| 2 0| 0 0| 0 0| 2 0 | 0 0| 0 0| 0 0| 0 0| 0 0 | 2 0
Colquitt County
| 0 0| 0 0| 1 0| 0 0| 1 0 | 0 0| 0 0| 0 0| 0 0| 0 0 | 1 0
Coweta County
| 0 0| 3 0| 1 0| 0 0| 4 0 | 0 0| 0 0| 0 0| 0 0| 0 0 | 4 0
Floyd County
| 0 0| 0 0| 1 0| 0 0| 1 0 | 0 0| 0 0| 0 0| 0 0| 0 0 | 1 0
Hall County
| 0 0| 2 0| 2 0| 0 0| 4 0 | 0 0| 0 0| 0 0| 0 0| 0 0 | 4 0
Jackson County
| 0 0| 1 0| 3 0| 1 0| 5 0 | 0 0| 0 0| 0 0| 0 0| 0 0 | 5 0
Jefferson County | 0 0| 2 0| 1 0| 0 0| 3 0 | 0 0| 0 0| 0 0| 0 0| 0 0 | 3 0
Mitchell County
| 0 0| 0 0| 1 0| 0 0| 1 0 | 0 0| 0 0| 0 0| 0 0| 0 0 | 1 0
Screven County
| 0 0| 1 0| 0 0| 0 0| 1 0 | 0 0| 0 0| 0 0| 0 0| 0 0 | 1 0
Stewart County
| 0 0| 0 0| 0 0| 1 0| 1 0 | 0 0| 0 0| 0 0| 0 0| 0 0 | 1 0
Terrell County
| 0 0| 0 0| 0 0| 1 0| 1 0 | 0 0| 0 0| 0 0| 0 0| 0 0 | 1 0
Clayton County
| 0 0| 3 0| 0 0| 0 0| 3 0 | 0 0| 0 0| 0 0| 0 0| 0 0 | 3 0
Ware Prison
| 18 9| 213 7| 98 5| 8 2| 337 6 | 0 0| 0 0| 0 0| 0 0| 0 0 | 337 6
Lowndes Prison
| 0 0| 7 0| 7 0| 1 0| 15 0 | 0 0| 0 0| 0 0| 0 0| 0 0 | 15 0
Dodge Prison
| 0 0| 59 2| 66 3| 5 1| 130 2 | 0 0| 0 0| 0 0| 0 0| 0 0 | 130 2
Phillips Prison
| 8 4| 138 5| 83 4| 17 4| 246 4 | 0 0| 0 0| 0 0| 0 0| 0 0 | 246 4
Walker Prison
| 0 0| 25 1| 29 1| 4 1| 58 1 | 0 0| 0 0| 0 0| 0 0| 0 0 | 58 1
Wayne Prison
| 0 0| 3 0| 4 0| 0 0| 7 0 | 0 0| 0 0| 0 0| 0 0| 0 0 | 7 0
Arrendale Prison | 47 23| 103 3| 19 1| 2 1| 171 3 | 0 0| 0 0| 0 0| 0 0| 0 0 | 171 3
Montgomery Prison | 0 0| 15 0| 15 1| 3 1| 33 1 | 0 0| 0 0| 0 0| 0 0| 0 0 | 33 1
Lee Prison
| 1 0| 27 1| 18 1| 2 1| 48 1 | 0 0| 0 0| 0 0| 0 0| 0 0 | 48 1
Putnam Prison
| 0 0| 4 0| 0 0| 0 0| 4 0 | 0 0| 0 0| 0 0| 0 0| 0 0 | 4 0
Georgia State Prison| 10 5| 294 10| 208 10| 17 4| 529 9 | 0 0| 0 0| 0 0| 0 0| 0 0 | 529 9
Mens Prison
| 0 0| 12 0| 35 2| 75 19| 122 2 | 0 0| 0 0| 0 0| 0 0| 0 0 | 122 2
Jackson Prison-Diag | 3 1| 11 0| 4 0| 1 0| 19 0 | 0 0| 0 0| 0 0| 0 0| 0 0 | 19 0
Jackson Prison-Perm | 0 0| 3 0| 1 0| 0 0| 4 0 | 0 0| 0 0| 0 0| 0 0| 0 0 | 4 0
Coastal Prison
| 1 0| 26 1| 16 1| 2 1| 45 1 | 0 0| 0 0| 0 0| 0 0| 0 0 | 45 1
Scott Prison
| 0 0| 74 2| 48 2| 11 3| 133 2 | 0 0| 0 0| 0 0| 0 0| 0 0 | 133 2
Rivers Prison
| 0 0| 68 2| 69 3| 10 3| 147 3 | 0 0| 0 0| 0 0| 0 0| 0 0 | 147 3
------------------------------------------------------------------------------------------------------------------------------------
(continued)
Georgia Dept. of Corrections
44
Page 42 Run 05/01/00
Georgia Department of Corrections
Office of Planning and Analysis LIFERS Inmate statistical profile
Sample: ACTIVE PRISONERS EXCLUDING JAIL
Requestor:
Active inmates 05/01/2000
Institution by current age & sex
Statistics (CONTINUED)
|
MEN
|
WOMEN
|
| Age | Age | Age | Age | Men
| Age | Age | Age | Age |Women
|Grand
Institution
|00-21 %|22-39 %|40-54 %|55-99 %|Total % |00-21 %|22-39 %|40-54 %|55-99 %|Total % |Total %
------------------------------------------------------------------------------------------------------------------------------------
Rutledge Prison
| 0 0| 49 2| 61 3| 16 4| 126 2 | 0 0| 0 0| 0 0| 0 0| 0 0 | 126 2
Central Prison
| 0 0| 95 3| 105 5| 18 5| 218 4 | 0 0| 0 0| 0 0| 0 0| 0 0 | 218 4
Augusta Med Prison | 2 1| 76 3| 65 3| 19 5| 162 3 | 0 0| 0 0| 0 0| 0 0| 0 0 | 162 3
Rogers Prison
| 0 0| 29 1| 19 1| 0 0| 48 1 | 0 0| 0 0| 0 0| 0 0| 0 0 | 48 1
Burruss Prison
| 0 0| 8 0| 10 1| 2 1| 20 0 | 0 0| 0 0| 0 0| 0 0| 0 0 | 20 0
Bostick Prison
| 0 0| 10 0| 28 1| 31 8| 69 1 | 0 0| 0 0| 0 0| 0 0| 0 0 | 69 1
Valdosta Prison
| 5 2| 166 5| 89 4| 13 3| 273 5 | 0 0| 0 0| 0 0| 0 0| 0 0 | 273 5
Hays Prison
| 14 7| 167 6| 109 5| 16 4| 306 5 | 0 0| 0 0| 0 0| 0 0| 0 0 | 306 5
Hancock Prison
| 13 6| 230 8| 110 6| 18 5| 371 7 | 0 0| 0 0| 0 0| 0 0| 0 0 | 371 6
Telfair Prison
| 19 9| 199 7| 103 5| 8 2| 329 6 | 0 0| 0 0| 0 0| 0 0| 0 0 | 329 6
Autry Prison
| 7 3| 142 5| 90 5| 18 5| 257 5 | 0 0| 0 0| 0 0| 0 0| 0 0 | 257 4
Wilcox Prison
| 0 0| 68 2| 74 4| 6 2| 148 3 | 0 0| 0 0| 0 0| 0 0| 0 0 | 148 3
Calhoun Prison
| 9 4| 71 2| 50 3| 7 2| 137 2 | 0 0| 0 0| 0 0| 0 0| 0 0 | 137 2
Dooly Prison
| 0 0| 60 2| 75 4| 7 2| 142 3 | 0 0| 0 0| 0 0| 0 0| 0 0 | 142 2
Macon Prison
| 31 15| 252 8| 98 5| 19 5| 400 7 | 0 0| 0 0| 0 0| 0 0| 0 0 | 400 7
Smith Prison
| 16 8| 191 6| 76 4| 8 2| 291 5 | 0 0| 0 0| 0 0| 0 0| 0 0 | 291 5
Homerville Prison | 0 0| 1 0| 0 0| 0 0| 1 0 | 0 0| 0 0| 0 0| 0 0| 0 0 | 1 0
Washingtn Women Pris| 0 0| 0 0| 0 0| 0 0| 0 0 | 0 0| 35 27| 25 35| 7 27| 67 28 | 67 1
Baldwin Prison
| 0 0| 13 0| 22 1| 2 1| 37 1 | 0 0| 0 0| 0 0| 0 0| 0 0 | 37 1
Metro Womens Prison | 0 0| 0 0| 0 0| 0 0| 0 0 | 4 40| 29 23| 23 32| 9 35| 65 28 | 65 1
Pulaski Womens Pris | 0 0| 0 0| 0 0| 0 0| 0 0 | 6 60| 64 50| 24 33| 9 35| 103 44 | 103 2
Pelham PreTrans Unit| 0 0| 5 0| 4 0| 3 1| 12 0 | 0 0| 0 0| 0 0| 0 0| 0 0 | 12 0
Milan Prison
| 0 0| 0 0| 1 0| 0 0| 1 0 | 0 0| 0 0| 0 0| 0 0| 0 0 | 1 0
West Central Prison | 0 0| 4 0| 1 0| 0 0| 5 0 | 0 0| 0 0| 0 0| 0 0| 0 0 | 5 0
D Ray James Prison | 0 0| 30 1| 20 1| 3 1| 53 1 | 0 0| 0 0| 0 0| 0 0| 0 0 | 53 1
Coffee Corr Facility| 0 0| 28 1| 16 1| 3 1| 47 1 | 0 0| 0 0| 0 0| 0 0| 0 0 | 47 1
Wheeler Corr Facilty| 0 0| 27 1| 12 1| 3 1| 42 1 | 0 0| 0 0| 0 0| 0 0| 0 0 | 42 1
------------------------------------------------------------------------------------------------------------------------------------
Total reported
| 204 100| 3036 100| 1988 100| 385 100| 5613 100 | 10 100| 128 100| 72 100| 26 100| 236 100 | 5849 100
|
|
|
|
|
|
|
|
|
|
|
Percent reported | 100.0| 100.0| 100.0| 100.0| 100.0 | 100.0| 100.0| 100.0| 100.0| 100.0 | 100.0
|
|
|
|
|
|
|
|
|
|
|
|
|
|
|
|
|
|
|
|
|
|
Not Reported
|0|0|0|0|0
|0|0|0|0|0
|0
------------------------------------------------------------------------------------------------------------------------------------
Total
| 204 | 3036 | 1988 | 385 | 5613
| 10 | 128 | 72 | 26 | 236
| 5849
Georgia Dept. of Corrections
45
Page 43 Run 05/01/00
Georgia Department of Corrections Office of Planning and Analysis LIFERS Inmate statistical profile
Sample: ACTIVE PRISONERS EXCLUDING JAIL Active inmates 05/01/2000
Requestor: Statistics Misdemeanors And Felonies by current age & sex
|
MEN
|
WOMEN
|
| Age | Age | Age | Age | Men
| Age | Age | Age | Age |Women
|Grand
Crime Type
|00-21 %|22-39 %|40-54 %|55-99 %|Total % |00-21 %|22-39 %|40-54 %|55-99 %|Total % |Total %
------------------------------------------------------------------------------------------------------------------------------------
MISDEMEANOR
| 0 0| 0 0| 0 0| 0 0| 0 0 | 0 0| 0 0| 0 0| 0 0| 0 0 | 0 0
FELONY
| 204 100| 3036 100| 1988 100| 385 100| 5613 100 | 10 100| 128 100| 72 100| 26 100| 236 100 | 5849 100
------------------------------------------------------------------------------------------------------------------------------------
Total reported
| 204 100| 3036 100| 1988 100| 385 100| 5613 100 | 10 100| 128 100| 72 100| 26 100| 236 100 | 5849 100
|
|
|
|
|
|
|
|
|
|
|
Percent reported | 100.0| 100.0| 100.0| 100.0| 100.0 | 100.0| 100.0| 100.0| 100.0| 100.0 | 100.0
|
|
|
|
|
|
|
|
|
|
|
|
|
|
|
|
|
|
|
|
|
|
NOT REPORTED
|0|0|0|0|0
|0|0|0|0|0
|0
------------------------------------------------------------------------------------------------------------------------------------
Total
| 204 | 3036 | 1988 | 385 | 5613
| 10 | 128 | 72 | 26 | 236
| 5849
Georgia Dept. of Corrections
46
Georgia Department of Corrections
Page 44 Run 05/01/00
Office of Planning and Analysis
LIFERS Inmate statistical profile
Sample: ACTIVE PRISONERS EXCLUDING JAIL
Requestor: Statistics
Active inmates 05/01/2000
Crimes By Group by current age & sex
|
MEN
|
WOMEN
|
| Age | Age | Age | Age | Men
| Age | Age | Age | Age |Women
|Grand
Crimes By Group
|00-21 %|22-39 %|40-54 %|55-99 %|Total % |00-21 %|22-39 %|40-54 %|55-99 %|Total % |Total %
------------------------------------------------------------------------------------------------------------------------------------
HOMICIDE
| 159 78| 1849 61| 1179 59| 290 75| 3477 62 | 10 100| 108 84| 59 82| 25 96| 202 86 | 3679 63
ABORTION
| 0 0| 0 0| 0 0| 0 0| 0 0 | 0 0| 0 0| 0 0| 0 0| 0 0 | 0 0
BODILY INJRY&REL OFF| 15 7| 180 6| 88 4| 5 1| 288 5 | 0 0| 3 2| 3 4| 0 0| 6 3 | 294 5
ARSON & REL OFF
| 0 0| 1 0| 0 0| 0 0| 1 0 | 0 0| 0 0| 0 0| 0 0| 0 0 | 1 0
DAMAGE OF PROPERTY | 0 0| 1 0| 0 0| 0 0| 1 0 | 0 0| 0 0| 0 0| 0 0| 0 0 | 1 0
BURGLARY & REL OFF | 0 0| 20 1| 6 0| 0 0| 26 0 | 0 0| 0 0| 1 1| 0 0| 1 0 | 27 0
FORGERY & REL OFF | 0 0| 6 0| 5 0| 1 0| 12 0 | 0 0| 0 0| 0 0| 0 0| 0 0 | 12 0
THEFT
| 0 0| 7 0| 5 0| 0 0| 12 0 | 0 0| 0 0| 0 0| 0 0| 0 0 | 12 0
ROBBERY
| 19 9| 351 12| 233 12| 26 7| 629 11 | 0 0| 2 2| 1 1| 0 0| 3 1 | 632 11
SEXUAL OFFENSES
| 10 5| 353 12| 329 17| 51 13| 743 13 | 0 0| 1 1| 1 1| 0 0| 2 1 | 745 13
OBSCENITY CRIMES | 0 0| 0 0| 0 0| 0 0| 0 0 | 0 0| 0 0| 0 0| 0 0| 0 0 | 0 0
TREASON & REL OFF | 0 0| 0 0| 0 0| 0 0| 0 0 | 0 0| 0 0| 0 0| 0 0| 0 0 | 0 0
CRIMES INVOLVNG GOVT| 0 0| 7 0| 5 0| 1 0| 13 0 | 0 0| 0 0| 0 0| 0 0| 0 0 | 13 0
FALSIFICATIONS
| 0 0| 0 0| 0 0| 0 0| 0 0 | 0 0| 0 0| 0 0| 0 0| 0 0 | 0 0
OBSTRUCT LAW ENFORCE| 0 0| 1 0| 1 0| 0 0| 2 0 | 0 0| 0 0| 0 0| 0 0| 0 0 | 2 0
DISORDERLY CONDUCT | 0 0| 0 0| 0 0| 0 0| 0 0 | 0 0| 0 0| 0 0| 0 0| 0 0 | 0 0
GAMBLING & REL OFF | 0 0| 0 0| 0 0| 0 0| 0 0 | 0 0| 0 0| 0 0| 0 0| 0 0 | 0 0
CRUELTY TO CHILDREN | 0 0| 0 0| 0 0| 0 0| 0 0 | 0 0| 0 0| 0 0| 0 0| 0 0 | 0 0
CRIMES WITH GUNS | 0 0| 0 0| 1 0| 0 0| 1 0 | 0 0| 0 0| 0 0| 0 0| 0 0 | 1 0
INVASION PRIVACY | 0 0| 0 0| 0 0| 0 0| 0 0 | 0 0| 0 0| 0 0| 0 0| 0 0 | 0 0
RACKETEERING
| 0 0| 0 0| 0 0| 0 0| 0 0 | 0 0| 0 0| 0 0| 0 0| 0 0 | 0 0
DRUG ABUSE OFFENSES | 1 0| 239 8| 130 7| 10 3| 380 7 | 0 0| 14 11| 7 10| 1 4| 22 9 | 402 7
DRUG TRAFFICKING | 0 0| 19 1| 6 0| 1 0| 26 0 | 0 0| 0 0| 0 0| 0 0| 0 0 | 26 0
AUTO CRIMES
| 0 0| 0 0| 0 0| 0 0| 0 0 | 0 0| 0 0| 0 0| 0 0| 0 0 | 0 0
REVENUE & CONTRABAND| 0 0| 0 0| 0 0| 0 0| 0 0 | 0 0| 0 0| 0 0| 0 0| 0 0 | 0 0
CRIMES OF OTH STATES| 0 0| 0 0| 0 0| 0 0| 0 0 | 0 0| 0 0| 0 0| 0 0| 0 0 | 0 0
MISC. FELONIES
| 0 0| 1 0| 0 0| 0 0| 1 0 | 0 0| 0 0| 0 0| 0 0| 0 0 | 1 0
MISDEMEANORS
| 0 0| 0 0| 0 0| 0 0| 0 0 | 0 0| 0 0| 0 0| 0 0| 0 0 | 0 0
------------------------------------------------------------------------------------------------------------------------------------
Total reported
| 204 100| 3035 100| 1988 100| 385 100| 5612 100 | 10 100| 128 100| 72 100| 26 100| 236 100 | 5848 100
|
|
|
|
|
|
|
|
|
|
|
Percent reported | 100.0| 100.0| 100.0| 100.0| 100.0 | 100.0| 100.0| 100.0| 100.0| 100.0 | 100.0
|
|
|
|
|
|
|
|
|
|
|
|
|
|
|
|
|
|
|
|
|
|
NOT REPORTED
|0|1|0|0|1
|0|0|0|0|0
|1
------------------------------------------------------------------------------------------------------------------------------------
Total
| 204 | 3036 | 1988 | 385 | 5613
| 10 | 128 | 72 | 26 | 236
| 5849
Georgia Dept. of Corrections
47
Page
45 Run 05/01/00
Georgia Department of Corrections Office of Planning and Analysis
Sample: ACTIVE PRISONERS EXCLUDING JAIL Active inmates 05/01/2000
LIFERS Inmate statistical profile Requestor: Statistics
Most Serious Offense by current age & sex
|
MEN
|
WOMEN
|
| Age | Age | Age | Age | Men
| Age | Age | Age | Age |Women
|Grand
Most Serious Offense|00-21 %|22-39 %|40-54 %|55-99 %|Total % |00-21 %|22-39 %|40-54 %|55-99 %|Total % |Total %
------------------------------------------------------------------------------------------------------------------------------------
Misdemeanors
|
|
|
------------------------------------------------------------------------------------------------------------------------------------
------------------------------------------------------------------------------------------------------------------------------------
------------------------------------------------------------------------------------------------------------------------------------
FELONIES
|
|
|
------------------------------------------------------------------------------------------------------------------------------------
------------------------------------------------------------------------------------------------------------------------------------
MISC. HOMICIDE OFFEN| 0 0| 1 0| 0 0| 0 0| 1 0 | 0 0| 0 0| 0 0| 0 0| 0 0 | 1 0
MURDER
| 159 78| 1848 61| 1179 59| 289 75| 3475 62 | 10 100| 108 84| 59 82| 25 96| 202 86 | 3677 63
VOLUNTARY MANSLAUGHT| 0 0| 1 0| 0 0| 1 0| 2 0 | 0 0| 0 0| 0 0| 0 0| 0 0 | 2 0
AGGRAVATED ASSAULT | 0 0| 9 0| 0 0| 0 0| 9 0 | 0 0| 0 0| 0 0| 0 0| 0 0 | 9 0
AGGRAVATED BATTERY | 0 0| 1 0| 0 0| 0 0| 1 0 | 0 0| 0 0| 0 0| 0 0| 0 0 | 1 0
KIDNAPPING
| 15 7| 170 6| 86 4| 5 1| 276 5 | 0 0| 3 2| 3 4| 0 0| 6 3 | 282 5
AGG ASSLT ON POLICE | 0 0| 0 0| 2 0| 0 0| 2 0 | 0 0| 0 0| 0 0| 0 0| 0 0 | 2 0
SECOND DEGREE ARSON | 0 0| 1 0| 0 0| 0 0| 1 0 | 0 0| 0 0| 0 0| 0 0| 0 0 | 1 0
CRIM. DAMAGE 2ND DEG| 0 0| 1 0| 0 0| 0 0| 1 0 | 0 0| 0 0| 0 0| 0 0| 0 0 | 1 0
BURGLARY
| 0 0| 20 1| 6 0| 0 0| 26 0 | 0 0| 0 0| 1 1| 0 0| 1 0 | 27 0
FORGERY 1ST DEGREE | 0 0| 6 0| 5 0| 1 0| 12 0 | 0 0| 0 0| 0 0| 0 0| 0 0 | 12 0
THEFT BY TAKING
| 0 0| 2 0| 3 0| 0 0| 5 0 | 0 0| 0 0| 0 0| 0 0| 0 0 | 5 0
THEFT BY REC STOLEN | 0 0| 3 0| 1 0| 0 0| 4 0 | 0 0| 0 0| 0 0| 0 0| 0 0 | 4 0
THEFT BY CONVERSION | 0 0| 1 0| 1 0| 0 0| 2 0 | 0 0| 0 0| 0 0| 0 0| 0 0 | 2 0
THEFT OF MOTOR VEH, | 0 0| 1 0| 0 0| 0 0| 1 0 | 0 0| 0 0| 0 0| 0 0| 0 0 | 1 0
ROBBERY
| 0 0| 5 0| 6 0| 4 1| 15 0 | 0 0| 0 0| 0 0| 0 0| 0 0 | 15 0
ARMED ROBBERY
| 19 9| 346 11| 227 11| 22 6| 614 11 | 0 0| 2 2| 1 1| 0 0| 3 1 | 617 11
MISC. SEXUAL
| 0 0| 1 0| 0 0| 0 0| 1 0 | 0 0| 0 0| 0 0| 0 0| 0 0 | 1 0
RAPE
| 10 5| 326 11| 298 15| 40 10| 674 12 | 0 0| 1 1| 1 1| 0 0| 2 1 | 676 12
AGGRAVATED SODOMY | 0 0| 19 1| 20 1| 8 2| 47 1 | 0 0| 0 0| 0 0| 0 0| 0 0 | 47 1
CHILD MOLESTATION | 0 0| 1 0| 3 0| 1 0| 5 0 | 0 0| 0 0| 0 0| 0 0| 0 0 | 5 0
AGGRAV. CHILD MOLEST| 0 0| 6 0| 8 0| 2 1| 16 0 | 0 0| 0 0| 0 0| 0 0| 0 0 | 16 0
OBSTR OF LAW ENF OFF| 0 0| 7 0| 5 0| 1 0| 13 0 | 0 0| 0 0| 0 0| 0 0| 0 0 | 13 0
ESCAPE
| 0 0| 1 0| 1 0| 0 0| 2 0 | 0 0| 0 0| 0 0| 0 0| 0 0 | 2 0
POSS OF CERTAIN WEAP| 0 0| 0 0| 1 0| 0 0| 1 0 | 0 0| 0 0| 0 0| 0 0| 0 0 | 1 0
S/D NARCOTICS, OPIAT| 0 0| 19 1| 12 1| 1 0| 32 1 | 0 0| 1 1| 1 1| 0 0| 2 1 | 34 1
S/D DEP,STIM,CNTRF D| 0 0| 4 0| 2 0| 0 0| 6 0 | 0 0| 0 0| 0 0| 0 0| 0 0 | 6 0
SALE/DIST OF MARIJUA| 0 0| 6 0| 5 0| 1 0| 12 0 | 0 0| 0 0| 0 0| 0 0| 0 0 | 12 0
POSS NARCOTICS, OPIA| 0 0| 6 0| 2 0| 0 0| 8 0 | 0 0| 0 0| 0 0| 1 4| 1 0 | 9 0
------------------------------------------------------------------------------------------------------------------------------------
(continued)
Georgia Dept. of Corrections
48
Page 46 Run 05/01/00
Georgia Department of Corrections Office of Planning and Analysis LIFERS Inmate statistical profile
Sample: ACTIVE PRISONERS EXCLUDING JAIL
Requestor:
Active inmates 05/01/2000
Most Serious Offense by current age & sex
Statistics (CONTINUED)
|
MEN
|
WOMEN
|
| Age | Age | Age | Age | Men
| Age | Age | Age | Age |Women
|Grand
Most Serious Offense|00-21 %|22-39 %|40-54 %|55-99 %|Total % |00-21 %|22-39 %|40-54 %|55-99 %|Total % |Total %
------------------------------------------------------------------------------------------------------------------------------------
POSS DEP,STIM,CNTRF | 0 0| 0 0| 1 0| 0 0| 1 0 | 0 0| 0 0| 0 0| 0 0| 0 0 | 1 0
VIOLATE GA CNTRL SBS| 0 0| 14 0| 7 0| 0 0| 21 0 | 0 0| 1 1| 1 1| 0 0| 2 1 | 23 0
UNLWFL MFG/DEL/DIST | 0 0| 7 0| 1 0| 0 0| 8 0 | 0 0| 0 0| 0 0| 0 0| 0 0 | 8 0
SALE/DIST CONT SUB P| 0 0| 2 0| 1 0| 0 0| 3 0 | 0 0| 0 0| 0 0| 0 0| 0 0 | 3 0
SALE/DIST CONT SUB S| 0 0| 1 0| 0 0| 0 0| 1 0 | 0 0| 0 0| 0 0| 0 0| 0 0 | 1 0
SALE/DISTRIBUTION CO| 1 0| 153 5| 84 4| 5 1| 243 4 | 0 0| 12 9| 5 7| 0 0| 17 7 | 260 4
POSSESSION OF COCAIN| 0 0| 27 1| 15 1| 3 1| 45 1 | 0 0| 0 0| 0 0| 0 0| 0 0 | 45 1
COCAINE LESS 200 GRA| 0 0| 13 0| 5 0| 1 0| 19 0 | 0 0| 0 0| 0 0| 0 0| 0 0 | 19 0
COCAINE 401 OR MORE | 0 0| 5 0| 0 0| 0 0| 5 0 | 0 0| 0 0| 0 0| 0 0| 0 0 | 5 0
NARCOTICS LESS 14 GR| 0 0| 0 0| 1 0| 0 0| 1 0 | 0 0| 0 0| 0 0| 0 0| 0 0 | 1 0
ATT/CONSPRCY COMMT C| 0 0| 1 0| 0 0| 0 0| 1 0 | 0 0| 0 0| 0 0| 0 0| 0 0 | 1 0
CONSPIRACY
| 0 0| 1 0| 0 0| 0 0| 1 0 | 0 0| 0 0| 0 0| 0 0| 0 0 | 1 0
------------------------------------------------------------------------------------------------------------------------------------
Total reported
| 204 100| 3036 100| 1988 100| 385 100| 5613 100 | 10 100| 128 100| 72 100| 26 100| 236 100 | 5849 100
|
|
|
|
|
|
|
|
|
|
|
Percent reported | 100.0| 100.0| 100.0| 100.0| 100.0 | 100.0| 100.0| 100.0| 100.0| 100.0 | 100.0
|
|
|
|
|
|
|
|
|
|
|
|
|
|
|
|
|
|
|
|
|
|
NOT REPORTED
|0|0|0|0|0
|0|0|0|0|0
|0
------------------------------------------------------------------------------------------------------------------------------------
Total
| 204 | 3036 | 1988 | 385 | 5613
| 10 | 128 | 72 | 26 | 236
| 5849
Georgia Dept. of Corrections
49
Page
47 Run 05/01/00
Georgia Department of Corrections Office of Planning and Analysis
LIFERS Inmate statistical profile
Sample: ACTIVE PRISONERS EXCLUDING JAIL Active inmates 05/01/2000
Requestor: Statistics Most Serious Crime Type by current age & sex
|
MEN
|
WOMEN
|
| Age | Age | Age | Age | Men
| Age | Age | Age | Age |Women
|Grand
Crime Type
|00-21 %|22-39 %|40-54 %|55-99 %|Total % |00-21 %|22-39 %|40-54 %|55-99 %|Total % |Total %
------------------------------------------------------------------------------------------------------------------------------------
VIOL/PERSN
| 193 95| 2381 78| 1500 75| 321 83| 4395 78 | 10 100| 113 88| 63 88| 25 96| 211 89 | 4606 79
NVIOL/PERS
| 0 0| 0 0| 0 0| 0 0| 0 0 | 0 0| 0 0| 0 0| 0 0| 0 0 | 0 0
PROPERTY
| 0 0| 35 1| 16 1| 1 0| 52 1 | 0 0| 0 0| 1 1| 0 0| 1 0 | 53 1
DRUG SALES
| 1 0| 211 7| 111 6| 8 2| 331 6 | 0 0| 13 10| 6 8| 0 0| 19 8 | 350 6
DRUG POSSN
| 0 0| 47 2| 25 1| 3 1| 75 1 | 0 0| 1 1| 1 1| 1 4| 3 1 | 78 1
ALCOHOL
| 0 0| 0 0| 0 0| 0 0| 0 0 | 0 0| 0 0| 0 0| 0 0| 0 0 | 0 0
HABIT/DUI
| 0 0| 0 0| 0 0| 0 0| 0 0 | 0 0| 0 0| 0 0| 0 0| 0 0 | 0 0
SEX OFFEND
| 10 5| 353 12| 329 17| 51 13| 743 13 | 0 0| 1 1| 1 1| 0 0| 2 1 | 745 13
OTHER
| 0 0| 9 0| 7 0| 1 0| 17 0 | 0 0| 0 0| 0 0| 0 0| 0 0 | 17 0
------------------------------------------------------------------------------------------------------------------------------------
Total reported
| 204 100| 3036 100| 1988 100| 385 100| 5613 100 | 10 100| 128 100| 72 100| 26 100| 236 100 | 5849 100
|
|
|
|
|
|
|
|
|
|
|
Percent reported | 100.0| 100.0| 100.0| 100.0| 100.0 | 100.0| 100.0| 100.0| 100.0| 100.0 | 100.0
|
|
|
|
|
|
|
|
|
|
|
|
|
|
|
|
|
|
|
|
|
|
NOT REPORTED
|0|0|0|0|0
|0|0|0|0|0
|0
------------------------------------------------------------------------------------------------------------------------------------
Total
| 204 | 3036 | 1988 | 385 | 5613
| 10 | 128 | 72 | 26 | 236
| 5849
Georgia Dept. of Corrections
50
Georgia Dept. of Corrections
51