- Collection:
- Georgia Government Publications
- Title:
- Inmate statistical profile: active lifers, Nov. 2000
- Creator:
- Georgia. Department of Corrections. Planning and Analysis Section
- Publisher:
- Atlanta, GA. : Georgia Dept. of Corrections, Office of Planning and Analysis, 2000-11
- Date of Original:
- 2000-11
- Subject:
- Prisoners--Georgia
- Location:
- United States, Georgia, 32.75042, -83.50018
- Medium:
- state government records
- Type:
- Text
- Format:
- application/pdf
- External Identifiers:
- Call Number GA R300.P5 P1 L5 2000/11
- Metadata URL:
- https://dlg.galileo.usg.edu/id:dlg_ggpd_i-ga-br300-pp5-bp1-bl5-b2000-s11-belec-p-btext
- Digital Object URL:
- https://dlg.galileo.usg.edu/do:dlg_ggpd_i-ga-br300-pp5-bp1-bl5-b2000-s11-belec-p-btext
- Language:
- eng
- Holding Institution:
- University of Georgia. Map and Government Information Library
- Rights:
-

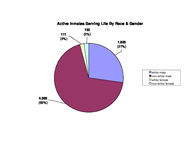
Active Inmates Serving Life By Race & Gender
111 (2%)
133 (2%)
1,620 (27%)
4,082 (69%)
white male non-white male white female non-white female
Prior Incarcerations of Active Inmates Serving A Life Sentence
4000
3,592
(60%)
3500
3000
Number of Inmates
2500
2000 1500 1000
500 0
zero
1,219 (21%)
one
609 (10%)
325 (5%)
two
three
Priors
130 (2%)
four
71 (1%)
five or more
Active Inmates Serving Life By Crime Type
73 (1%)
755 (13%)
18 (<1%)
329 (6%)
50 (1%)
4,721 (79%)
viol/persn
property
drug sales
drug possn
sex offend
other
Georgia Department of Corrections
Page 1 Run 11/22/00
Office of Planning and Analysis
Inmate statistical profile TABLE OF CONTENTS FOR ACTIVE PRISONERS SERVING LIFE EXCLUDING JAIL
TITLE ----RACE AND SEX............................ 2 Culture Fair IQ Scores.................. 3 Self-Rpt Socioeconomic Class............ 4 Self-Rpt Environment To Age 16.......... 5 Self-Rpt Education Level................ 6 Functional Reading Level (WRAT Scores).. 7 Functional Math Level (WRAT Scores)..... 8 Functional Spelling Level (WRAT Scores). 9 Self-Rpt Guardian Status To Age 16......10 Self-Rpt Employment Status Before Prison11 Self-Rpt Marital Status At Admission....12 Self-Rpt Number Of Children At Admission13 Self-Rpt Religious Affiliation..........14 Self-Rpt Family Behavior Patterns *.....15 Inmate Diagnostic Behavior Problem *....16 Physical Profile (General Condition)....17 Security Status.........................18 Number Of Sentences.....................19 Number Of Disciplinaries................20 Number Of Escapes.......................21 Number Of Prior Georgia Incarcerations *22 Number Of Transfers.....................23 County Of Conviction....................24 Circuit Of Conviction...................29 Home County.............................31 Prison Sentence In Years................36 Probation To Follow Prison..............37 Admission Type..........................38 Release Type............................39 Inst By Group...........................40 Institution.............................41 Misdemeanors And Felonies...............43 Crimes By Group.........................44 Most Serious Offense....................45 Most Serious Crime Type.................47
PAGE ----
Georgia Department of Corrections
Page 2 Run 11/22/00
Office of Planning and Analysis
Inmate statistical profile
Sample: ACTIVE PRISONERS SERVING LIFE EXCLUDING JAIL
Requestor: Statistics
Active inmates 11/22/2000
RACE AND SEX by current age & sex
|
MEN
|
WOMEN
|
| Age | Age | Age | Age | Men
| Age | Age | Age | Age |Women
|Grand
RACE AND SEX
|00-21 %|22-39 %|40-54 %|55-99 %|Total % |00-21 %|22-39 %|40-54 %|55-99 %|Total % |Total %
------------------------------------------------------------------------------------------------------------------------------------
WHITE MALE
| 36 19| 680 22| 697 34| 207 51| 1620 28 | 0 0| 0 0| 0 0| 0 0| 0 0 | 1620 27
NON WHITE MALE
| 151 81| 2351 78| 1380 66| 200 49| 4082 72 | 0 0| 0 0| 0 0| 0 0| 0 0 | 4082 69
WHITE FEMALE
| 0 0| 0 0| 0 0| 0 0| 0 0 | 4 40| 47 38| 43 51| 17 68| 111 45 | 111 2
NON WHITE FEMALE | 0 0| 0 0| 0 0| 0 0| 0 0 | 6 60| 77 62| 42 49| 8 32| 133 55 | 133 2
------------------------------------------------------------------------------------------------------------------------------------
Total reported
| 187 100| 3031 100| 2077 100| 407 100| 5702 100 | 10 100| 124 100| 85 100| 25 100| 244 100 | 5946 100
|
|
|
|
|
|
|
|
|
|
|
Percent reported | 100.0| 100.0| 100.0| 100.0| 100.0 | 100.0| 100.0| 100.0| 100.0| 100.0 | 100.0
|
|
|
|
|
|
|
|
|
|
|
|
|
|
|
|
|
|
|
|
|
|
NOT REPORTED
|0|0|0|0|0
|0|0|0|0|0
|0
------------------------------------------------------------------------------------------------------------------------------------
Total
| 187 | 3031 | 2077 | 407 | 5702
| 10 | 124 | 85 | 25 | 244
| 5946
|
|
|
|
|
|
|
|
|
|
|
|
|
|
|
|
|
|
|
|
|
|
|
|
|
|
|
|
|
|
|
|
|
|
|
|
|
|
|
|
|
|
|
|
|
|
|
|
|
|
|
|
|
|
|
AVERAGE AGE
| 19.83 | 31.17 | 45.77 | 61.28 | 38.26 | 19.50 | 31.44 | 45.24 | 60.80 | 38.76 | 38.28
Page 3 Run 11/22/00
Georgia Department of Corrections Office of Planning and Analysis
Inmate statistical profile
Sample: ACTIVE PRISONERS SERVING LIFE EXCLUDING JAIL
Requestor: Statistics
Active inmates 11/22/2000
Culture Fair IQ Scores by current age & sex
|
MEN
|
WOMEN
|
| Age | Age | Age | Age | Men
| Age | Age | Age | Age |Women
|Grand
IQ Score
|00-21 %|22-39 %|40-54 %|55-99 %|Total % |00-21 %|22-39 %|40-54 %|55-99 %|Total % |Total %
------------------------------------------------------------------------------------------------------------------------------------
LESS THAN 70
| 3 2| 78 3| 158 8| 38 11| 277 5 | 0 0| 9 7| 10 12| 2 9| 21 9 | 298 5
70 AND UP
| 173 98| 2811 97| 1779 92| 323 89| 5086 95 | 9 100| 112 93| 72 88| 20 91| 213 91 | 5299 95
------------------------------------------------------------------------------------------------------------------------------------
Total reported
| 176 100| 2889 100| 1937 100| 361 100| 5363 100 | 9 100| 121 100| 82 100| 22 100| 234 100 | 5597 100
|
|
|
|
|
|
|
|
|
|
|
Percent reported |
94.1|
95.3|
93.3|
88.7|
94.1 |
90.0|
97.6|
96.5|
88.0|
95.9 |
94.1
|
|
|
|
|
|
|
|
|
|
|
|
|
|
|
|
|
|
|
|
|
|
NOT REPORTED
| 11 | 142 | 140 | 46 | 339
| 1 | 3 | 3 | 3 | 10
| 349
------------------------------------------------------------------------------------------------------------------------------------
Total
| 187 | 3031 | 2077 | 407 | 5702
| 10 | 124 | 85 | 25 | 244
| 5946
|
|
|
|
|
|
|
|
|
|
|
|
|
|
|
|
|
|
|
|
|
|
|
|
|
|
|
|
|
|
|
|
|
|
|
|
|
|
|
|
|
|
|
|
|
|
|
|
|
|
|
|
|
|
|
AVERAGE IQ
| 99.01 | 101.44 | 97.01 | 93.59 | 99.23 | 97.67 | 95.70 | 90.38 | 88.09 | 93.20 | 98.98
Page 4 Run 11/22/00
Georgia Department of Corrections Office of Planning and Analysis
Inmate statistical profile
Sample: ACTIVE PRISONERS SERVING LIFE EXCLUDING JAIL
Requestor: Statistics
Active inmates 11/22/2000
Self-Rpt Socioeconomic Class by current age & sex
|
MEN
|
WOMEN
|
| Age | Age | Age | Age | Men
| Age | Age | Age | Age |Women
|Grand
Socioeconomic Class |00-21 %|22-39 %|40-54 %|55-99 %|Total % |00-21 %|22-39 %|40-54 %|55-99 %|Total % |Total %
------------------------------------------------------------------------------------------------------------------------------------
WELFARE
| 19 11| 346 12| 201 10| 23 6| 589 11 | 0 0| 22 18| 7 8| 0 0| 29 12 | 618 11
OCC EMPLOY
| 15 9| 192 7| 64 3| 7 2| 278 5 | 0 0| 3 2| 0 0| 1 5| 4 2 | 282 5
MINIMUM STD
| 66 39| 1007 35| 888 44| 215 56| 2176 40 | 6 60| 42 34| 27 32| 8 36| 83 35 | 2259 40
MIDDLE
| 67 40| 1344 46| 852 42| 136 35| 2399 44 | 4 40| 54 44| 48 56| 12 55| 118 49 | 2517 44
OTHER
| 1 1| 27 1| 5 0| 3 1| 36 1 | 0 0| 1 1| 3 4| 1 5| 5 2 | 41 1
------------------------------------------------------------------------------------------------------------------------------------
Total reported
| 168 100| 2916 100| 2010 100| 384 100| 5478 100 | 10 100| 122 100| 85 100| 22 100| 239 100 | 5717 100
|
|
|
|
|
|
|
|
|
|
|
Percent reported |
89.8|
96.2|
96.8|
94.3|
96.1 | 100.0|
98.4| 100.0|
88.0|
98.0 |
96.1
|
|
|
|
|
|
|
|
|
|
|
|
|
|
|
|
|
|
|
|
|
|
NOT RPTD
| 19 | 115 | 67 | 23 | 224
|0|2|0|3|5
| 229
------------------------------------------------------------------------------------------------------------------------------------
Total
| 187 | 3031 | 2077 | 407 | 5702
| 10 | 124 | 85 | 25 | 244
| 5946
Page 5 Run 11/22/00
Georgia Department of Corrections Office of Planning and Analysis
Inmate statistical profile
Sample: ACTIVE PRISONERS SERVING LIFE EXCLUDING JAIL
Requestor: Statistics
Active inmates 11/22/2000
Self-Rpt Environment To Age 16 by current age & sex
|
MEN
|
WOMEN
|
| Age | Age | Age | Age | Men
| Age | Age | Age | Age |Women
|Grand
Environment
|00-21 %|22-39 %|40-54 %|55-99 %|Total % |00-21 %|22-39 %|40-54 %|55-99 %|Total % |Total %
------------------------------------------------------------------------------------------------------------------------------------
RURAL/FARM
| 1 1| 112 4| 175 9| 94 24| 382 7 | 0 0| 8 7| 4 5| 3 14| 15 6 | 397 7
RURAL/NFARM
| 4 2| 210 7| 171 8| 34 9| 419 8 | 0 0| 7 6| 3 4| 0 0| 10 4 | 429 7
S.M.S.A
| 73 40| 1222 41| 718 36| 100 26| 2113 38 | 2 20| 24 20| 22 26| 6 29| 54 23 | 2167 37
URBAN
| 34 19| 521 18| 366 18| 53 14| 974 18 | 4 40| 30 25| 24 28| 2 10| 60 25 | 1034 18
SMALL TOWN
| 69 38| 884 30| 580 29| 111 28| 1644 30 | 4 40| 53 43| 30 35| 9 43| 96 40 | 1740 30
OTHER
| 0 0| 17 1| 9 0| 0 0| 26 0 | 0 0| 0 0| 2 2| 1 5| 3 1 | 29 1
------------------------------------------------------------------------------------------------------------------------------------
Total reported
| 181 100| 2966 100| 2019 100| 392 100| 5558 100 | 10 100| 122 100| 85 100| 21 100| 238 100 | 5796 100
|
|
|
|
|
|
|
|
|
|
|
Percent reported |
96.8|
97.9|
97.2|
96.3|
97.5 | 100.0|
98.4| 100.0|
84.0|
97.5 |
97.5
|
|
|
|
|
|
|
|
|
|
|
|
|
|
|
|
|
|
|
|
|
|
NOT RPTD
| 6 | 65 | 58 | 15 | 144
|0|2|0|4|6
| 150
------------------------------------------------------------------------------------------------------------------------------------
Total
| 187 | 3031 | 2077 | 407 | 5702
| 10 | 124 | 85 | 25 | 244
| 5946
Page 6 Run 11/22/00
Georgia Department of Corrections Office of Planning and Analysis
Inmate statistical profile
Sample: ACTIVE PRISONERS SERVING LIFE EXCLUDING JAIL
Requestor: Statistics
Active inmates 11/22/2000
Self-Rpt Education Level by current age & sex
|
MEN
|
WOMEN
|
| Age | Age | Age | Age | Men
| Age | Age | Age | Age |Women
|Grand
Education Level
|00-21 %|22-39 %|40-54 %|55-99 %|Total % |00-21 %|22-39 %|40-54 %|55-99 %|Total % |Total %
------------------------------------------------------------------------------------------------------------------------------------
LESS THAN GRADE 7 | 6 3| 49 2| 108 5| 83 21| 246 4 | 0 0| 1 1| 3 4| 5 21| 9 4 | 255 4
GRADE 7
| 7 4| 84 3| 63 3| 35 9| 189 3 | 0 0| 6 5| 3 4| 1 4| 10 4 | 199 3
GRADE 8
| 41 23| 272 9| 199 10| 38 10| 550 10 | 4 40| 15 12| 8 9| 1 4| 28 12 | 578 10
GRADE 9
| 43 24| 453 15| 248 12| 34 9| 778 14 | 3 30| 16 13| 6 7| 0 0| 25 10 | 803 14
GRADE 10
| 37 21| 597 20| 289 14| 36 9| 959 17 | 2 20| 19 16| 11 13| 3 13| 35 15 | 994 17
GRADE 11
| 36 20| 553 18| 225 11| 27 7| 841 15 | 1 10| 19 16| 4 5| 2 8| 26 11 | 867 15
GRADE 12
| 7 4| 735 25| 654 32| 98 25| 1494 27 | 0 0| 27 22| 30 35| 8 33| 65 27 | 1559 27
MORE THAN GRADE 12 | 3 2| 248 8| 259 13| 48 12| 558 10 | 0 0| 19 16| 20 24| 4 17| 43 18 | 601 10
------------------------------------------------------------------------------------------------------------------------------------
Total reported
| 180 100| 2991 100| 2045 100| 399 100| 5615 100 | 10 100| 122 100| 85 100| 24 100| 241 100 | 5856 100
|
|
|
|
|
|
|
|
|
|
|
Percent reported |
96.3|
98.7|
98.5|
98.0|
98.5 | 100.0|
98.4| 100.0|
96.0|
98.8 |
98.5
|
|
|
|
|
|
|
|
|
|
|
|
|
|
|
|
|
|
|
|
|
|
NOT REPORTED
| 7 | 40 | 32 | 8 | 87
|0|2|0|1|3
| 90
------------------------------------------------------------------------------------------------------------------------------------
Total
| 187 | 3031 | 2077 | 407 | 5702
| 10 | 124 | 85 | 25 | 244
| 5946
|
|
|
|
|
|
|
|
|
|
|
|
|
|
|
|
|
|
|
|
|
|
|
|
|
|
|
|
|
|
|
|
|
|
|
|
|
|
|
|
|
|
|
|
|
|
|
|
|
|
|
|
|
|
|
AVG EDUCATION LEVEL | 9.48 | 10.99 | 11.23 | 9.74 | 10.94 | 9.00 | 11.56 | 11.80 | 11.08 | 11.49 | 10.96
* NOTE: THE FIELD LABLED "LESS THAN GRADE 7" WAS CORRECTED IN MARCH 1989: MISSING DATA FOR INMATES STILL IN DIAGNOSTICS NOW HAS BEEN REMOVED FROM THIS FIELD AND IDENTIFIED AS "NOT REPORTED" INFORMATION.
Page 7 Run 11/22/00
Georgia Department of Corrections Office of Planning and Analysis
Inmate statistical profile
Sample: ACTIVE PRISONERS SERVING LIFE EXCLUDING JAIL
Requestor: Statistics
Active inmates 11/22/2000
Functional Reading Level (WRAT Scores) by current age & sex
|
MEN
|
WOMEN
|
| Age | Age | Age | Age | Men
| Age | Age | Age | Age |Women
|Grand
WRAT Reading Score |00-21 %|22-39 %|40-54 %|55-99 %|Total % |00-21 %|22-39 %|40-54 %|55-99 %|Total % |Total %
------------------------------------------------------------------------------------------------------------------------------------
LESS THAN GRADE 6 | 76 43| 1137 39| 840 46| 166 49| 2219 42 | 3 33| 46 38| 23 29| 10 43| 82 35 | 2301 42
6TH THRU 8TH GRADE | 31 18| 673 23| 411 22| 59 17| 1174 22 | 2 22| 28 23| 18 23| 4 17| 52 22 | 1226 22
GRADE 9
| 12 7| 205 7| 110 6| 21 6| 348 7 | 1 11| 4 3| 7 9| 2 9| 14 6 | 362 7
GRADE 10
| 12 7| 131 5| 75 4| 14 4| 232 4 | 1 11| 2 2| 6 8| 2 9| 11 5 | 243 4
GRADE 11
| 6 3| 114 4| 83 5| 9 3| 212 4 | 0 0| 4 3| 5 6| 1 4| 10 4 | 222 4
GRADE 12
| 31 18| 530 18| 284 16| 67 20| 912 17 | 2 22| 7 6| 2 3| 1 4| 12 5 | 924 17
MORE THAN GRADE 12 | 9 5| 106 4| 28 2| 4 1| 147 3 | 0 0| 30 25| 19 24| 3 13| 52 22 | 199 4
------------------------------------------------------------------------------------------------------------------------------------
Total reported
| 177 100| 2896 100| 1831 100| 340 100| 5244 100 | 9 100| 121 100| 80 100| 23 100| 233 100 | 5477 100
|
|
|
|
|
|
|
|
|
|
|
Percent reported |
94.7|
95.5|
88.2|
83.5|
92.0 |
90.0|
97.6|
94.1|
92.0|
95.5 |
92.1
|
|
|
|
|
|
|
|
|
|
|
|
|
|
|
|
|
|
|
|
|
|
NOT REPORTED
| 10 | 135 | 246 | 67 | 458
| 1 | 3 | 5 | 2 | 11
| 469
------------------------------------------------------------------------------------------------------------------------------------
Total
| 187 | 3031 | 2077 | 407 | 5702
| 10 | 124 | 85 | 25 | 244
| 5946
|
|
|
|
|
|
|
|
|
|
|
|
|
|
|
|
|
|
|
|
|
|
|
|
|
|
|
|
|
|
|
|
|
|
|
|
|
|
|
|
|
|
|
|
|
|
|
|
|
|
|
|
|
|
|
AVG READING SCORE | 7.66 | 7.67 | 7.00 | 6.91 | 7.39 | 8.06 | 7.99 | 8.30 | 7.23 | 8.03 | 7.41
Page 8 Run 11/22/00
Georgia Department of Corrections Office of Planning and Analysis
Inmate statistical profile
Sample: ACTIVE PRISONERS SERVING LIFE EXCLUDING JAIL
Requestor: Statistics
Active inmates 11/22/2000
Functional Math Level (WRAT Scores) by current age & sex
|
MEN
|
WOMEN
|
| Age | Age | Age | Age | Men
| Age | Age | Age | Age |Women
|Grand
WRAT Math Score
|00-21 %|22-39 %|40-54 %|55-99 %|Total % |00-21 %|22-39 %|40-54 %|55-99 %|Total % |Total %
------------------------------------------------------------------------------------------------------------------------------------
LESS THAN GRADE 6 | 65 37| 869 30| 801 44| 171 50| 1906 36 | 2 22| 45 37| 30 37| 11 48| 88 38 | 1994 36
6TH THRU 8TH GRADE | 80 45| 1457 50| 676 37| 96 28| 2309 44 | 6 67| 50 41| 32 40| 8 35| 96 41 | 2405 44
GRADE 9
| 9 5| 225 8| 124 7| 24 7| 382 7 | 1 11| 12 10| 5 6| 2 9| 20 9 | 402 7
GRADE 10
| 14 8| 133 5| 100 5| 15 4| 262 5 | 0 0| 7 6| 3 4| 1 4| 11 5 | 273 5
GRADE 11
| 5 3| 96 3| 51 3| 12 4| 164 3 | 0 0| 1 1| 3 4| 1 4| 5 2 | 169 3
GRADE 12
| 2 1| 101 3| 81 4| 20 6| 204 4 | 0 0| 2 2| 3 4| 0 0| 5 2 | 209 4
MORE THAN GRADE 12 | 2 1| 19 1| 3 0| 2 1| 26 0 | 0 0| 4 3| 5 6| 0 0| 9 4 | 35 1
------------------------------------------------------------------------------------------------------------------------------------
Total reported
| 177 100| 2900 100| 1836 100| 340 100| 5253 100 | 9 100| 121 100| 81 100| 23 100| 234 100 | 5487 100
|
|
|
|
|
|
|
|
|
|
|
Percent reported |
94.7|
95.7|
88.4|
83.5|
92.1 |
90.0|
97.6|
95.3|
92.0|
95.9 |
92.3
|
|
|
|
|
|
|
|
|
|
|
|
|
|
|
|
|
|
|
|
|
|
NOT REPORTED
| 10 | 131 | 241 | 67 | 449
| 1 | 3 | 4 | 2 | 10
| 459
------------------------------------------------------------------------------------------------------------------------------------
Total
| 187 | 3031 | 2077 | 407 | 5702
| 10 | 124 | 85 | 25 | 244
| 5946
|
|
|
|
|
|
|
|
|
|
|
|
|
|
|
|
|
|
|
|
|
|
|
|
|
|
|
|
|
|
|
|
|
|
|
|
|
|
|
|
|
|
|
|
|
|
|
|
|
|
|
|
|
|
|
AVG MATH SCORE
| 6.82 | 7.11 | 6.59 | 6.35 | 6.87 | 6.77 | 7.06 | 7.21 | 5.94 | 6.99 | 6.88
Page 9 Run 11/22/00
Georgia Department of Corrections Office of Planning and Analysis
Inmate statistical profile
Sample: ACTIVE PRISONERS SERVING LIFE EXCLUDING JAIL
Requestor: Statistics
Active inmates 11/22/2000
Functional Spelling Level (WRAT Scores) by current age & sex
|
MEN
|
WOMEN
|
| Age | Age | Age | Age | Men
| Age | Age | Age | Age |Women
|Grand
WRAT Spelling Score |00-21 %|22-39 %|40-54 %|55-99 %|Total % |00-21 %|22-39 %|40-54 %|55-99 %|Total % |Total %
------------------------------------------------------------------------------------------------------------------------------------
LESS THAN GRADE 6 | 72 41| 1310 45| 1058 58| 199 59| 2639 50 | 2 22| 43 36| 28 35| 12 52| 85 36 | 2724 50
6TH THRU 8TH GRADE | 54 31| 774 27| 369 20| 68 20| 1265 24 | 5 56| 30 25| 18 22| 3 13| 56 24 | 1321 24
GRADE 9
| 12 7| 169 6| 106 6| 14 4| 301 6 | 1 11| 8 7| 3 4| 3 13| 15 6 | 316 6
GRADE 10
| 17 10| 175 6| 68 4| 13 4| 273 5 | 0 0| 9 7| 7 9| 0 0| 16 7 | 289 5
GRADE 11
| 5 3| 141 5| 46 3| 5 1| 197 4 | 1 11| 4 3| 5 6| 2 9| 12 5 | 209 4
GRADE 12
| 11 6| 287 10| 172 9| 39 11| 509 10 | 0 0| 8 7| 5 6| 0 0| 13 6 | 522 10
MORE THAN GRADE 12 | 6 3| 41 1| 13 1| 2 1| 62 1 | 0 0| 19 16| 15 19| 3 13| 37 16 | 99 2
------------------------------------------------------------------------------------------------------------------------------------
Total reported
| 177 100| 2897 100| 1832 100| 340 100| 5246 100 | 9 100| 121 100| 81 100| 23 100| 234 100 | 5480 100
|
|
|
|
|
|
|
|
|
|
|
Percent reported |
94.7|
95.6|
88.2|
83.5|
92.0 |
90.0|
97.6|
95.3|
92.0|
95.9 |
92.2
|
|
|
|
|
|
|
|
|
|
|
|
|
|
|
|
|
|
|
|
|
|
NOT REPORTED
| 10 | 134 | 245 | 67 | 456
| 1 | 3 | 4 | 2 | 10
| 466
------------------------------------------------------------------------------------------------------------------------------------
Total
| 187 | 3031 | 2077 | 407 | 5702
| 10 | 124 | 85 | 25 | 244
| 5946
|
|
|
|
|
|
|
|
|
|
|
|
|
|
|
|
|
|
|
|
|
|
|
|
|
|
|
|
|
|
|
|
|
|
|
|
|
|
|
|
|
|
|
|
|
|
|
|
|
|
|
|
|
|
|
AVG SPELLING SCORE | 7.09 | 6.89 | 6.04 | 5.87 | 6.54 | 7.60 | 7.91 | 8.11 | 6.55 | 7.83 | 6.59
Page 10 Run 11/22/00
Georgia Department of Corrections Office of Planning and Analysis
Inmate statistical profile
Sample: ACTIVE PRISONERS SERVING LIFE EXCLUDING JAIL
Requestor: Statistics
Active inmates 11/22/2000
Self-Rpt Guardian Status To Age 16 by current age & sex
|
MEN
|
WOMEN
|
| Age | Age | Age | Age | Men
| Age | Age | Age | Age |Women
|Grand
Guardian Status
|00-21 %|22-39 %|40-54 %|55-99 %|Total % |00-21 %|22-39 %|40-54 %|55-99 %|Total % |Total %
------------------------------------------------------------------------------------------------------------------------------------
ORPHANAGE
| 0 0| 5 0| 3 0| 3 1| 11 0 | 0 0| 0 0| 0 0| 0 0| 0 0 | 11 0
FATHER ONLY
| 9 5| 83 3| 59 3| 6 2| 157 3 | 0 0| 2 2| 2 2| 1 4| 5 2 | 162 3
FTR MTR HD
| 12 7| 118 4| 67 3| 6 2| 203 4 | 0 0| 2 2| 4 5| 0 0| 6 3 | 209 4
MOTHER ONLY
| 88 49| 1399 47| 652 32| 104 26| 2243 40 | 6 60| 45 37| 26 31| 9 39| 86 36 | 2329 40
MTR FTR HD
| 41 23| 941 32| 973 48| 219 55| 2174 39 | 4 40| 47 39| 45 54| 12 52| 108 45 | 2282 39
OTH FEMALE
| 1 1| 57 2| 48 2| 16 4| 122 2 | 0 0| 4 3| 2 2| 0 0| 6 3 | 128 2
OTH MALE
| 1 1| 6 0| 11 1| 1 0| 19 0 | 0 0| 2 2| 1 1| 0 0| 3 1 | 22 0
STEP-PARNTS
| 4 2| 54 2| 25 1| 6 2| 89 2 | 0 0| 0 0| 0 0| 0 0| 0 0 | 89 2
FOSTER HOME
| 4 2| 25 1| 31 2| 7 2| 67 1 | 0 0| 2 2| 0 0| 0 0| 2 1 | 69 1
GRAND PRNTS
| 16 9| 234 8| 136 7| 23 6| 409 7 | 0 0| 14 11| 3 4| 1 4| 18 8 | 427 7
OTHER
| 4 2| 61 2| 27 1| 4 1| 96 2 | 0 0| 4 3| 0 0| 0 0| 4 2 | 100 2
------------------------------------------------------------------------------------------------------------------------------------
Total reported
| 180 100| 2983 100| 2032 100| 395 100| 5590 100 | 10 100| 122 100| 83 100| 23 100| 238 100 | 5828 100
|
|
|
|
|
|
|
|
|
|
|
Percent reported |
96.3|
98.4|
97.8|
97.1|
98.0 | 100.0|
98.4|
97.6|
92.0|
97.5 |
98.0
|
|
|
|
|
|
|
|
|
|
|
|
|
|
|
|
|
|
|
|
|
|
NOT RPTD
| 7 | 48 | 45 | 12 | 112
|0|2|2|2|6
| 118
------------------------------------------------------------------------------------------------------------------------------------
Total
| 187 | 3031 | 2077 | 407 | 5702
| 10 | 124 | 85 | 25 | 244
| 5946
Page 11 Run 11/22/00
Georgia Department of Corrections Office of Planning and Analysis
Inmate statistical profile
Sample: ACTIVE PRISONERS SERVING LIFE EXCLUDING JAIL
Requestor: Statistics
Active inmates 11/22/2000
Self-Rpt Employment Status Before Prison by current age & sex
|
MEN
|
WOMEN
|
| Age | Age | Age | Age | Men
| Age | Age | Age | Age |Women
|Grand
Employment
|00-21 %|22-39 %|40-54 %|55-99 %|Total % |00-21 %|22-39 %|40-54 %|55-99 %|Total % |Total %
------------------------------------------------------------------------------------------------------------------------------------
FULL TIME
| 35 21| 970 34| 752 38| 158 42| 1915 35 | 0 0| 29 25| 14 17| 4 18| 47 20 | 1962 35
PART TIME
| 9 5| 227 8| 113 6| 18 5| 367 7 | 0 0| 6 5| 3 4| 0 0| 9 4 | 376 7
UNEMPL < 6M
| 10 6| 471 16| 333 17| 54 14| 868 16 | 0 0| 25 21| 19 23| 4 18| 48 21 | 916 16
UNEMPL > 6M
| 21 13| 907 31| 702 36| 110 29| 1740 32 | 2 22| 36 31| 37 45| 12 55| 87 38 | 1827 32
NEVER WORKD
| 73 43| 246 9| 21 1| 3 1| 343 6 | 4 44| 21 18| 4 5| 0 0| 29 13 | 372 7
STUDENT
| 20 12| 30 1| 6 0| 1 0| 57 1 | 3 33| 1 1| 2 2| 0 0| 6 3 | 63 1
INCAPABLE
| 0 0| 32 1| 49 2| 33 9| 114 2 | 0 0| 0 0| 3 4| 2 9| 5 2 | 119 2
OTHER
| 0 0| 0 0| 0 0| 0 0| 0 0 | 0 0| 0 0| 0 0| 0 0| 0 0 | 0 0
------------------------------------------------------------------------------------------------------------------------------------
Total reported
| 168 100| 2883 100| 1976 100| 377 100| 5404 100 | 9 100| 118 100| 82 100| 22 100| 231 100 | 5635 100
|
|
|
|
|
|
|
|
|
|
|
Percent reported |
89.8|
95.1|
95.1|
92.6|
94.8 |
90.0|
95.2|
96.5|
88.0|
94.7 |
94.8
|
|
|
|
|
|
|
|
|
|
|
|
|
|
|
|
|
|
|
|
|
|
NOT RPTD
| 19 | 148 | 101 | 30 | 298
| 1 | 6 | 3 | 3 | 13
| 311
------------------------------------------------------------------------------------------------------------------------------------
Total
| 187 | 3031 | 2077 | 407 | 5702
| 10 | 124 | 85 | 25 | 244
| 5946
* NOTE: THE FIELD LABELD "OTHER" WAS CORRECTED IN APRIL 1989; INMATES CODED "PRE-OTIS NOT REPORTED" NOW HAVE BEEN REMOVED FROM THIS FIELD AND IDENTIFIED AS "NOT REPORTED".
Page 12 Run 11/22/00
Georgia Department of Corrections Office of Planning and Analysis
Inmate statistical profile
Sample: ACTIVE PRISONERS SERVING LIFE EXCLUDING JAIL
Requestor: Statistics
Active inmates 11/22/2000
Self-Rpt Marital Status At Admission by current age & sex
|
MEN
|
WOMEN
|
| Age | Age | Age | Age | Men
| Age | Age | Age | Age |Women
|Grand
Marital Status
|00-21 %|22-39 %|40-54 %|55-99 %|Total % |00-21 %|22-39 %|40-54 %|55-99 %|Total % |Total %
------------------------------------------------------------------------------------------------------------------------------------
SINGLE
| 169 94| 2029 68| 697 34| 55 14| 2950 53 | 10 100| 69 56| 16 19| 3 13| 98 41 | 3048 52
MARRIED
| 2 1| 243 8| 387 19| 109 28| 741 13 | 0 0| 12 10| 17 20| 3 13| 32 13 | 773 13
SEPARATED
| 0 0| 108 4| 167 8| 40 10| 315 6 | 0 0| 12 10| 7 8| 2 9| 21 9 | 336 6
DIVORCED
| 1 1| 144 5| 355 17| 91 23| 591 11 | 0 0| 9 7| 16 19| 5 22| 30 13 | 621 11
WIDOWED
| 2 1| 38 1| 94 5| 53 13| 187 3 | 0 0| 5 4| 20 24| 9 39| 34 14 | 221 4
COMMON LAW
| 6 3| 418 14| 338 17| 48 12| 810 14 | 0 0| 16 13| 8 10| 1 4| 25 10 | 835 14
OTHER
| 0 0| 2 0| 1 0| 0 0| 3 0 | 0 0| 0 0| 0 0| 0 0| 0 0 | 3 0
------------------------------------------------------------------------------------------------------------------------------------
Total reported
| 180 100| 2982 100| 2039 100| 396 100| 5597 100 | 10 100| 123 100| 84 100| 23 100| 240 100 | 5837 100
|
|
|
|
|
|
|
|
|
|
|
Percent reported |
96.3|
98.4|
98.2|
97.3|
98.2 | 100.0|
99.2|
98.8|
92.0|
98.4 |
98.2
|
|
|
|
|
|
|
|
|
|
|
|
|
|
|
|
|
|
|
|
|
|
NOT RPTD
| 7 | 49 | 38 | 11 | 105
|0|1|1|2|4
| 109
------------------------------------------------------------------------------------------------------------------------------------
Total
| 187 | 3031 | 2077 | 407 | 5702
| 10 | 124 | 85 | 25 | 244
| 5946
Page 13 Run 11/22/00
Georgia Department of Corrections Office of Planning and Analysis
Inmate statistical profile
Sample: ACTIVE PRISONERS SERVING LIFE EXCLUDING JAIL
Requestor: Statistics
Active inmates 11/22/2000
Self-Rpt Number Of Children At Admission by current age & sex
|
MEN
|
WOMEN
|
| Age | Age | Age | Age | Men
| Age | Age | Age | Age |Women
|Grand
Number Of Children |00-21 %|22-39 %|40-54 %|55-99 %|Total % |00-21 %|22-39 %|40-54 %|55-99 %|Total % |Total %
------------------------------------------------------------------------------------------------------------------------------------
NO CHILDREN
| 0 0| 444 22| 269 17| 37 11| 750 19 | 0 0| 3 3| 3 4| 1 4| 7 4 | 757 18
ONE CHILD
| 35 73| 758 38| 470 29| 60 17| 1323 33 | 0 0| 31 32| 14 19| 1 4| 46 24 | 1369 33
TWO CHILDREN
| 9 19| 422 21| 374 23| 73 21| 878 22 | 0 0| 33 34| 23 31| 8 35| 64 33 | 942 22
THREE CHILDREN
| 3 6| 239 12| 238 15| 69 20| 549 14 | 0 0| 18 19| 15 20| 7 30| 40 21 | 589 14
FOUR CHILDREN
| 0 0| 84 4| 118 7| 43 12| 245 6 | 0 0| 7 7| 11 15| 4 17| 22 11 | 267 6
FIVE CHILDREN
| 1 2| 32 2| 67 4| 24 7| 124 3 | 0 0| 4 4| 3 4| 1 4| 8 4 | 132 3
MORE THAN 5 CHILDREN| 0 0| 34 2| 61 4| 39 11| 134 3 | 0 0| 1 1| 6 8| 1 4| 8 4 | 142 3
------------------------------------------------------------------------------------------------------------------------------------
Total reported
| 48 100| 2013 100| 1597 100| 345 100| 4003 100 | 0 0| 97 100| 75 100| 23 100| 195 100 | 4198 100
|
|
|
|
|
|
|
|
|
|
|
Percent reported |
25.7|
66.4|
76.9|
84.8|
70.2 |
.0|
78.2|
88.2|
92.0|
79.9 |
70.6
|
|
|
|
|
|
|
|
|
|
|
|
|
|
|
|
|
|
|
|
|
|
NOT REPORTED
| 139 | 1018 | 480 | 62 | 1699
| 10 | 27 | 10 | 2 | 49
| 1748
------------------------------------------------------------------------------------------------------------------------------------
Total
| 187 | 3031 | 2077 | 407 | 5702
| 10 | 124 | 85 | 25 | 244
| 5946
|
|
|
|
|
|
|
|
|
|
|
|
|
|
|
|
|
|
|
|
|
|
|
|
|
|
|
|
|
|
|
|
|
|
|
|
|
|
|
|
|
|
|
|
|
|
|
|
|
|
|
|
|
|
|
AVG NUM CHILDREN | 1.40 | 1.61 | 2.06 | 2.87 | 1.90 | .00 | 2.11 | 2.71 | 2.87 | 2.43 | 1.92
* NOTE: THE FIELD LABLED "NO CHILDREN" WAS CORRECTED IN MARCH 1989: MISSING DATA FOR INMATES STILL IN DIAGNOSTICS NOW HAS BEEN REMOVED FROM THIS FIELD AND IDENTIFIED AS "NOT REPORTED" INFORMATION.
Page 14 Run 11/22/00
Georgia Department of Corrections Office of Planning and Analysis
Inmate statistical profile
Sample: ACTIVE PRISONERS SERVING LIFE EXCLUDING JAIL
Requestor: Statistics
Active inmates 11/22/2000
Self-Rpt Religious Affiliation by current age & sex
|
MEN
|
WOMEN
|
| Age | Age | Age | Age | Men
| Age | Age | Age | Age |Women
|Grand
Religion
|00-21 %|22-39 %|40-54 %|55-99 %|Total % |00-21 %|22-39 %|40-54 %|55-99 %|Total % |Total %
------------------------------------------------------------------------------------------------------------------------------------
ISLAM
| 2 1| 151 5| 71 4| 10 3| 234 4 | 0 0| 1 1| 0 0| 0 0| 1 0 | 235 4
CATHOLIC
| 4 2| 90 3| 61 3| 19 5| 174 3 | 0 0| 7 6| 3 4| 1 5| 11 5 | 185 3
BAPTIST
| 80 45| 1482 52| 1189 63| 220 58| 2971 56 | 4 40| 66 56| 44 54| 15 68| 129 56 | 3100 56
METHODIST
| 3 2| 71 2| 86 5| 25 7| 185 3 | 0 0| 5 4| 8 10| 1 5| 14 6 | 199 4
EPISCOPLN
| 1 1| 4 0| 4 0| 3 1| 12 0 | 0 0| 1 1| 2 2| 0 0| 3 1 | 15 0
PRESBYTRN
| 0 0| 7 0| 8 0| 3 1| 18 0 | 0 0| 0 0| 0 0| 2 9| 2 1 | 20 0
CHC OF GOD
| 0 0| 32 1| 24 1| 9 2| 65 1 | 0 0| 4 3| 1 1| 0 0| 5 2 | 70 1
HOLINESS
| 7 4| 131 5| 90 5| 25 7| 253 5 | 2 20| 14 12| 12 15| 0 0| 28 12 | 281 5
JEWISH
| 0 0| 1 0| 3 0| 1 0| 5 0 | 0 0| 0 0| 0 0| 0 0| 0 0 | 5 0
ANGLICAN
| 0 0| 0 0| 0 0| 0 0| 0 0 | 0 0| 1 1| 0 0| 0 0| 1 0 | 1 0
GRK ORTHDX
| 0 0| 0 0| 0 0| 0 0| 0 0 | 0 0| 0 0| 0 0| 0 0| 0 0 | 0 0
HINDU
| 0 0| 0 0| 0 0| 0 0| 0 0 | 0 0| 0 0| 0 0| 0 0| 0 0 | 0 0
BUDDHIST
| 2 1| 2 0| 1 0| 0 0| 5 0 | 0 0| 0 0| 0 0| 0 0| 0 0 | 5 0
TAOIST
| 0 0| 0 0| 0 0| 0 0| 0 0 | 0 0| 0 0| 0 0| 0 0| 0 0 | 0 0
SHINTOIST
| 0 0| 0 0| 0 0| 0 0| 0 0 | 0 0| 0 0| 0 0| 0 0| 0 0 | 0 0
SEVEN D AD
| 0 0| 5 0| 4 0| 1 0| 10 0 | 0 0| 0 0| 0 0| 0 0| 0 0 | 10 0
JEHOVAH WT
| 1 1| 25 1| 11 1| 0 0| 37 1 | 0 0| 0 0| 0 0| 0 0| 0 0 | 37 1
LATR DAY S
| 0 0| 2 0| 1 0| 0 0| 3 0 | 0 0| 0 0| 0 0| 0 0| 0 0 | 3 0
QUAKER
| 0 0| 0 0| 0 0| 0 0| 0 0 | 0 0| 0 0| 0 0| 0 0| 0 0 | 0 0
OTHER PROD
| 16 9| 213 7| 63 3| 16 4| 308 6 | 0 0| 7 6| 6 7| 1 5| 14 6 | 322 6
NONE
| 45 25| 429 15| 141 7| 13 3| 628 12 | 2 20| 5 4| 1 1| 0 0| 8 3 | 636 11
OTHER
| 17 10| 209 7| 143 8| 33 9| 402 8 | 2 20| 7 6| 5 6| 2 9| 16 7 | 418 8
------------------------------------------------------------------------------------------------------------------------------------
Total reported
| 178 100| 2854 100| 1900 100| 378 100| 5310 100 | 10 100| 118 100| 82 100| 22 100| 232 100 | 5542 100
|
|
|
|
|
|
|
|
|
|
|
Percent reported |
95.2|
94.2|
91.5|
92.9|
93.1 | 100.0|
95.2|
96.5|
88.0|
95.1 |
93.2
|
|
|
|
|
|
|
|
|
|
|
|
|
|
|
|
|
|
|
|
|
|
NOT RPTD
| 9 | 177 | 177 | 29 | 392
| 0 | 6 | 3 | 3 | 12
| 404
------------------------------------------------------------------------------------------------------------------------------------
Total
| 187 | 3031 | 2077 | 407 | 5702
| 10 | 124 | 85 | 25 | 244
| 5946
Page 15 Run 11/22/00
Georgia Department of Corrections Office of Planning and Analysis
Inmate statistical profile
Sample: ACTIVE PRISONERS SERVING LIFE EXCLUDING JAIL
Requestor: Statistics
Active inmates 11/22/2000
Self-Rpt Family Behavior Patterns * by current age & sex
|
MEN
|
WOMEN
|
| Age | Age | Age | Age | Men
| Age | Age | Age | Age |Women
|Grand
Family Behavior
|00-21 %|22-39 %|40-54 %|55-99 %|Total % |00-21 %|22-39 %|40-54 %|55-99 %|Total % |Total %
------------------------------------------------------------------------------------------------------------------------------------
CRIMINLTY
| 50 21| 797 24| 518 29| 72 25| 1437 26 | 5 17| 34 18| 18 23| 2 13| 59 19 | 1496 25
ALCOHOLISM
| 15 6| 329 10| 279 16| 45 16| 668 12 | 3 10| 26 14| 17 21| 1 6| 47 15 | 715 12
DRUG ABUSE
| 18 8| 173 5| 66 4| 6 2| 263 5 | 3 10| 17 9| 6 8| 0 0| 26 8 | 289 5
DOMINERING
| 1 0| 14 0| 12 1| 0 0| 27 0 | 5 17| 12 6| 5 6| 2 13| 24 8 | 51 1
MIGRANT
| 1 0| 48 1| 43 2| 0 0| 92 2 | 1 3| 2 1| 2 3| 0 0| 5 2 | 97 2
INFL BTGS
| 6 3| 138 4| 69 4| 15 5| 228 4 | 2 7| 21 11| 5 6| 2 13| 30 10 | 258 4
PERMISSIVE
| 0 0| 7 0| 16 1| 2 1| 25 0 | 1 3| 4 2| 2 3| 0 0| 7 2 | 32 1
FATH ABSNT
| 107 46| 1465 44| 639 36| 116 41| 2327 41 | 6 21| 48 26| 16 20| 7 44| 77 25 | 2404 40
MOTH ABSNT
| 31 13| 298 9| 144 8| 29 10| 502 9 | 1 3| 15 8| 2 3| 1 6| 19 6 | 521 9
NONE
| 5 2| 38 1| 14 1| 0 0| 57 1 | 2 7| 8 4| 7 9| 1 6| 18 6 | 75 1
------------------------------------------------------------------------------------------------------------------------------------
Total reported
| 234 100| 3307 100| 1800 100| 285 100| 5626 100 | 29 100| 187 100| 80 100| 16 100| 312 100 | 5938 100
|
|
|
|
|
|
|
|
|
|
|
Percent reported |
73.8|
69.5|
60.4|
49.6|
64.9 | 100.0|
68.5|
60.0|
44.0|
64.3 |
64.9
|
|
|
|
|
|
|
|
|
|
|
|
|
|
|
|
|
|
|
|
|
|
OTHER
| 49 | 925 | 823 | 205 | 2002
| 0 | 39 | 34 | 14 | 87
| 2089
------------------------------------------------------------------------------------------------------------------------------------
Total
| 187 | 3031 | 2077 | 407 | 5702
| 10 | 124 | 85 | 25 | 244
| 5946
* NOTE: SINCE THERE CAN BE UP TO FIVE BEHAVIOR CODES PER INMATE, THE NUMBER OF CASES REPORTED IN THE DETAIL LINES AND THE TOTAL REPORTED LINE MAY EXCEED THE TOTAL NUMBER OF CASES. IN SHORT, THIS TABLE COUNTS THE NUMBER OF BEHAVIOR PROBLEMS, NOT INMATES.
Page 16 Run 11/22/00
Georgia Department of Corrections Office of Planning and Analysis
Inmate statistical profile
Sample: ACTIVE PRISONERS SERVING LIFE EXCLUDING JAIL
Requestor: Statistics
Active inmates 11/22/2000
Inmate Diagnostic Behavior Problem * by current age & sex
|
MEN
|
WOMEN
|
| Age | Age | Age | Age | Men
| Age | Age | Age | Age |Women
|Grand
Diagnostic Problem |00-21 %|22-39 %|40-54 %|55-99 %|Total % |00-21 %|22-39 %|40-54 %|55-99 %|Total % |Total %
------------------------------------------------------------------------------------------------------------------------------------
ALCOHOLIC
| 0 0| 137 3| 140 4| 36 6| 313 3 | 1 4| 3 1| 13 9| 1 3| 18 4 | 331 3
ALCOH ABSE
| 38 11| 882 17| 633 17| 112 18| 1665 17 | 1 4| 29 14| 17 12| 6 18| 53 13 | 1718 16
DRUG EXP
| 60 17| 765 14| 362 10| 36 6| 1223 12 | 3 12| 20 10| 16 11| 0 0| 39 10 | 1262 12
DRUG ABSE
| 67 19| 971 18| 645 17| 40 6| 1723 17 | 4 16| 41 20| 25 17| 1 3| 71 17 | 1794 17
NARC ADDCT
| 1 0| 103 2| 91 2| 6 1| 201 2 | 0 0| 4 2| 2 1| 1 3| 7 2 | 208 2
EPILEPTIC
| 1 0| 25 0| 25 1| 4 1| 55 1 | 0 0| 0 0| 2 1| 0 0| 2 0 | 57 1
MANIPULTVE
| 23 7| 230 4| 109 3| 19 3| 381 4 | 1 4| 2 1| 0 0| 1 3| 4 1 | 385 4
ASSAULTIVE
| 121 34| 1316 25| 929 25| 169 27| 2535 25 | 8 32| 52 25| 29 20| 6 18| 95 23 | 2630 25
ESCPE TEND
| 5 1| 115 2| 210 6| 40 6| 370 4 | 0 0| 2 1| 4 3| 0 0| 6 1 | 376 4
SUICIDAL
| 11 3| 143 3| 106 3| 15 2| 275 3 | 4 16| 16 8| 7 5| 2 6| 29 7 | 304 3
WITHDRAWN
| 0 0| 35 1| 20 1| 7 1| 62 1 | 1 4| 2 1| 3 2| 0 0| 6 1 | 68 1
PR RLTY CT
| 1 0| 35 1| 49 1| 12 2| 97 1 | 1 4| 1 0| 3 2| 1 3| 6 1 | 103 1
HOMOSEXUAL
| 2 1| 12 0| 9 0| 5 1| 28 0 | 1 4| 4 2| 2 1| 0 0| 7 2 | 35 0
NONE
| 1 0| 300 6| 235 6| 71 11| 607 6 | 0 0| 11 5| 14 10| 9 27| 34 8 | 641 6
OTHER
| 4 1| 74 1| 59 2| 22 4| 159 2 | 0 0| 0 0| 0 0| 3 9| 3 1 | 162 2
NOT RPTD
| 18 5| 193 4| 66 2| 24 4| 301 3 | 0 0| 18 9| 6 4| 2 6| 26 6 | 327 3
------------------------------------------------------------------------------------------------------------------------------------
Total reported
| 353 100| 5345 100| 3689 100| 619 100|10006 100 | 25 100| 205 100| 144 100| 33 100| 407 100 |10413 100
|
|
|
|
|
|
|
|
|
|
|
Percent reported | 100.0|
99.7| 100.0|
99.8|
99.8 | 100.0| 100.0|
98.8| 100.0|
99.6 |
99.8
|
|
|
|
|
|
|
|
|
|
|
|
|
|
|
|
|
|
|
|
|
|
UNKNOWN
| 0 | 9 | 1 | 1 | 11
|0|0|1|0|1
| 12
------------------------------------------------------------------------------------------------------------------------------------
Total
| 187 | 3031 | 2077 | 407 | 5702
| 10 | 124 | 85 | 25 | 244
| 5946
* NOTE: SINCE THERE CAN BE UP TO FIVE BEHAVIOR CODES PER INMATE, THE NUMBER OF CASES REPORTED IN THE DETAIL LINES AND THE TOTAL REPORTED LINE MAY EXCEED THE TOTAL NUMBER OF CASES. IN SHORT, THIS TABLE COUNTS THE NUMBER OF BEHAVIOR PROBLEMS, NOT INMATES.
Page 17 Run 11/22/00
Georgia Department of Corrections Office of Planning and Analysis
Inmate statistical profile
Sample: ACTIVE PRISONERS SERVING LIFE EXCLUDING JAIL
Requestor: Statistics
Active inmates 11/22/2000
Physical Profile (General Condition) by current age & sex
|
MEN
|
WOMEN
|
| Age | Age | Age | Age | Men
| Age | Age | Age | Age |Women
|Grand
Physical Profile |00-21 %|22-39 %|40-54 %|55-99 %|Total % |00-21 %|22-39 %|40-54 %|55-99 %|Total % |Total %
------------------------------------------------------------------------------------------------------------------------------------
NO LIMITATION
| 164 91| 2221 74| 1024 50| 74 18| 3483 62 | 9 90| 91 75| 41 49| 1 5| 142 60 | 3625 62
DEFECT NO MAJOR LIMT| 14 8| 407 14| 466 23| 97 24| 984 17 | 0 0| 4 3| 11 13| 5 23| 20 8 | 1004 17
DEFECT MAJOR LIMIT | 3 2| 362 12| 558 27| 201 50| 1124 20 | 1 10| 26 21| 31 37| 14 64| 72 30 | 1196 20
VERY MAJOR DEFECT | 0 0| 3 0| 13 1| 31 8| 47 1 | 0 0| 0 0| 1 1| 2 9| 3 1 | 50 1
------------------------------------------------------------------------------------------------------------------------------------
Total reported
| 181 100| 2993 100| 2061 100| 403 100| 5638 100 | 10 100| 121 100| 84 100| 22 100| 237 100 | 5875 100
|
|
|
|
|
|
|
|
|
|
|
Percent reported |
96.8|
98.7|
99.2|
99.0|
98.9 | 100.0|
97.6|
98.8|
88.0|
97.1 |
98.8
|
|
|
|
|
|
|
|
|
|
|
|
|
|
|
|
|
|
|
|
|
|
NOT REPORTED
| 6 | 38 | 16 | 4 | 64
|0|3|1|3|7
| 71
------------------------------------------------------------------------------------------------------------------------------------
Total
| 187 | 3031 | 2077 | 407 | 5702
| 10 | 124 | 85 | 25 | 244
| 5946
Page 18 Run 11/22/00
Georgia Department of Corrections Office of Planning and Analysis
Inmate statistical profile
Sample: ACTIVE PRISONERS SERVING LIFE EXCLUDING JAIL
Requestor: Statistics
Active inmates 11/22/2000
Security Status by current age & sex
|
MEN
|
WOMEN
|
| Age | Age | Age | Age | Men
| Age | Age | Age | Age |Women
|Grand
Security
|00-21 %|22-39 %|40-54 %|55-99 %|Total % |00-21 %|22-39 %|40-54 %|55-99 %|Total % |Total %
------------------------------------------------------------------------------------------------------------------------------------
DIAG INCOM
| 0 0| 6 0| 3 0| 0 0| 9 0 | 0 0| 0 0| 0 0| 0 0| 0 0 | 9 0
WRK RELEAS
| 0 0| 0 0| 0 0| 1 0| 1 0 | 0 0| 0 0| 0 0| 0 0| 0 0 | 1 0
TRUSTY
| 0 0| 60 2| 43 2| 5 1| 108 2 | 0 0| 1 1| 3 4| 1 4| 5 2 | 113 2
MINIMUM
| 1 1| 387 13| 463 22| 77 19| 928 16 | 0 0| 34 27| 29 34| 12 48| 75 31 | 1003 17
MEDIUM
| 21 11| 1262 42| 1077 52| 252 62| 2612 46 | 0 0| 57 46| 38 45| 11 44| 106 43 | 2718 46
CLOSE
| 147 79| 1137 38| 392 19| 64 16| 1740 31 | 8 80| 32 26| 13 15| 1 4| 54 22 | 1794 30
MAXIMUM
| 4 2| 170 6| 92 4| 7 2| 273 5 | 1 10| 0 0| 2 2| 0 0| 3 1 | 276 5
DIAGNOSTIC
| 14 7| 9 0| 7 0| 1 0| 31 1 | 1 10| 0 0| 0 0| 0 0| 1 0 | 32 1
------------------------------------------------------------------------------------------------------------------------------------
Total reported
| 187 100| 3031 100| 2077 100| 407 100| 5702 100 | 10 100| 124 100| 85 100| 25 100| 244 100 | 5946 100
|
|
|
|
|
|
|
|
|
|
|
Percent reported | 100.0| 100.0| 100.0| 100.0| 100.0 | 100.0| 100.0| 100.0| 100.0| 100.0 | 100.0
|
|
|
|
|
|
|
|
|
|
|
|
|
|
|
|
|
|
|
|
|
|
NOT RPTD
|0|0|0|0|0
|0|0|0|0|0
|0
------------------------------------------------------------------------------------------------------------------------------------
Total
| 187 | 3031 | 2077 | 407 | 5702
| 10 | 124 | 85 | 25 | 244
| 5946
* NOTE: BEGINNING IN JULY 1987, THE FACILITIES DIVISION NO LONGER CODED INMATES AS BEING WORK RELEASE
Page 19 Run 11/22/00
Georgia Department of Corrections Office of Planning and Analysis
Inmate statistical profile
Sample: ACTIVE PRISONERS SERVING LIFE EXCLUDING JAIL
Requestor: Statistics
Active inmates 11/22/2000
Number Of Sentences by current age & sex
|
MEN
|
WOMEN
|
| Age | Age | Age | Age | Men
| Age | Age | Age | Age |Women
|Grand
Number Of Sentences |00-21 %|22-39 %|40-54 %|55-99 %|Total % |00-21 %|22-39 %|40-54 %|55-99 %|Total % |Total %
------------------------------------------------------------------------------------------------------------------------------------
ONE
| 55 29| 736 24| 544 26| 140 34| 1475 26 | 5 50| 47 38| 37 44| 12 48| 101 41 | 1576 27
TWO
| 51 27| 717 24| 475 23| 104 26| 1347 24 | 2 20| 40 32| 24 28| 8 32| 74 30 | 1421 24
THREE
| 27 14| 514 17| 370 18| 57 14| 968 17 | 1 10| 19 15| 10 12| 5 20| 35 14 | 1003 17
FOUR
| 21 11| 347 11| 231 11| 37 9| 636 11 | 1 10| 9 7| 4 5| 0 0| 14 6 | 650 11
FIVE
| 9 5| 226 7| 151 7| 20 5| 406 7 | 1 10| 4 3| 4 5| 0 0| 9 4 | 415 7
MORE THAN FIVE
| 24 13| 491 16| 306 15| 49 12| 870 15 | 0 0| 5 4| 6 7| 0 0| 11 5 | 881 15
------------------------------------------------------------------------------------------------------------------------------------
Total reported
| 187 100| 3031 100| 2077 100| 407 100| 5702 100 | 10 100| 124 100| 85 100| 25 100| 244 100 | 5946 100
|
|
|
|
|
|
|
|
|
|
|
Percent reported | 100.0| 100.0| 100.0| 100.0| 100.0 | 100.0| 100.0| 100.0| 100.0| 100.0 | 100.0
|
|
|
|
|
|
|
|
|
|
|
|
|
|
|
|
|
|
|
|
|
|
NOT REPORTED
|0|0|0|0|0
|0|0|0|0|0
|0
------------------------------------------------------------------------------------------------------------------------------------
Total
| 187 | 3031 | 2077 | 407 | 5702
| 10 | 124 | 85 | 25 | 244
| 5946
|
|
|
|
|
|
|
|
|
|
|
|
|
|
|
|
|
|
|
|
|
|
|
|
|
|
|
|
|
|
|
|
|
|
|
|
|
|
|
|
|
|
|
|
|
|
|
|
|
|
|
|
|
|
|
AVG NUM SENTENCES | 2.94 | 3.41 | 3.31 | 2.89 | 3.32 | 2.10 | 2.30 | 2.31 | 1.72 | 2.23 | 3.28
Page 20 Run 11/22/00
Georgia Department of Corrections Office of Planning and Analysis
Inmate statistical profile
Sample: ACTIVE PRISONERS SERVING LIFE EXCLUDING JAIL
Requestor: Statistics
Active inmates 11/22/2000
Number Of Disciplinaries by current age & sex
|
MEN
|
WOMEN
|
| Age | Age | Age | Age | Men
| Age | Age | Age | Age |Women
|Grand
Disciplinaries
|00-21 %|22-39 %|40-54 %|55-99 %|Total % |00-21 %|22-39 %|40-54 %|55-99 %|Total % |Total %
------------------------------------------------------------------------------------------------------------------------------------
ZERO
| 43 23| 460 15| 352 17| 114 28| 969 17 | 3 30| 25 20| 30 35| 11 44| 69 28 | 1038 17
ONE
| 22 12| 305 10| 273 13| 68 17| 668 12 | 1 10| 13 10| 11 13| 7 28| 32 13 | 700 12
TWO
| 13 7| 262 9| 190 9| 42 10| 507 9 | 0 0| 14 11| 9 11| 1 4| 24 10 | 531 9
THREE
| 10 5| 189 6| 149 7| 39 10| 387 7 | 0 0| 10 8| 10 12| 2 8| 22 9 | 409 7
FOUR
| 11 6| 165 5| 114 5| 25 6| 315 6 | 1 10| 6 5| 2 2| 0 0| 9 4 | 324 5
FIVE
| 6 3| 154 5| 88 4| 15 4| 263 5 | 1 10| 4 3| 3 4| 2 8| 10 4 | 273 5
MORE THAN FIVE
| 82 44| 1495 49| 910 44| 104 26| 2591 45 | 4 40| 52 42| 20 24| 2 8| 78 32 | 2669 45
------------------------------------------------------------------------------------------------------------------------------------
Total reported
| 187 100| 3030 100| 2076 100| 407 100| 5700 100 | 10 100| 124 100| 85 100| 25 100| 244 100 | 5944 100
|
|
|
|
|
|
|
|
|
|
|
Percent reported | 100.0| 100.0| 100.0| 100.0| 100.0 | 100.0| 100.0| 100.0| 100.0| 100.0 | 100.0
|
|
|
|
|
|
|
|
|
|
|
|
|
|
|
|
|
|
|
|
|
|
NOT REPORTED
|0|1|1|0|2
|0|0|0|0|0
|2
------------------------------------------------------------------------------------------------------------------------------------
Total
| 187 | 3031 | 2077 | 407 | 5702
| 10 | 124 | 85 | 25 | 244
| 5946
|
|
|
|
|
|
|
|
|
|
|
|
|
|
|
|
|
|
|
|
|
|
|
|
|
|
|
|
|
|
|
|
|
|
|
|
|
|
|
|
|
|
|
|
|
|
|
|
|
|
|
|
|
|
|
AVG NUM DISCIP
| 9.79 | 10.61 | 9.88 | 5.41 | 9.95 | 4.90 | 8.06 | 4.91 | 1.68 | 6.18 | 9.79
Page 21 Run 11/22/00
Georgia Department of Corrections Office of Planning and Analysis
Inmate statistical profile
Sample: ACTIVE PRISONERS SERVING LIFE EXCLUDING JAIL
Requestor: Statistics
Active inmates 11/22/2000
Number Of Escapes by current age & sex
|
MEN
|
WOMEN
|
| Age | Age | Age | Age | Men
| Age | Age | Age | Age |Women
|Grand
Escapes
|00-21 %|22-39 %|40-54 %|55-99 %|Total % |00-21 %|22-39 %|40-54 %|55-99 %|Total % |Total %
------------------------------------------------------------------------------------------------------------------------------------
ZERO
| 187 100| 2996 99| 1989 96| 390 96| 5562 98 | 10 100| 124 100| 83 98| 25 100| 242 99 | 5804 98
ONE
| 0 0| 34 1| 70 3| 11 3| 115 2 | 0 0| 0 0| 2 2| 0 0| 2 1 | 117 2
TWO
| 0 0| 1 0| 14 1| 4 1| 19 0 | 0 0| 0 0| 0 0| 0 0| 0 0 | 19 0
THREE
| 0 0| 0 0| 3 0| 2 0| 5 0 | 0 0| 0 0| 0 0| 0 0| 0 0 | 5 0
FOUR
| 0 0| 0 0| 1 0| 0 0| 1 0 | 0 0| 0 0| 0 0| 0 0| 0 0 | 1 0
FIVE
| 0 0| 0 0| 0 0| 0 0| 0 0 | 0 0| 0 0| 0 0| 0 0| 0 0 | 0 0
MORE THAN FIVE
| 0 0| 0 0| 0 0| 0 0| 0 0 | 0 0| 0 0| 0 0| 0 0| 0 0 | 0 0
------------------------------------------------------------------------------------------------------------------------------------
Total reported
| 187 100| 3031 100| 2077 100| 407 100| 5702 100 | 10 100| 124 100| 85 100| 25 100| 244 100 | 5946 100
|
|
|
|
|
|
|
|
|
|
|
Percent reported | 100.0| 100.0| 100.0| 100.0| 100.0 | 100.0| 100.0| 100.0| 100.0| 100.0 | 100.0
|
|
|
|
|
|
|
|
|
|
|
|
|
|
|
|
|
|
|
|
|
|
NOT REPORTED
|0|0|0|0|0
|0|0|0|0|0
|0
------------------------------------------------------------------------------------------------------------------------------------
Total
| 187 | 3031 | 2077 | 407 | 5702
| 10 | 124 | 85 | 25 | 244
| 5946
|
|
|
|
|
|
|
|
|
|
|
|
|
|
|
|
|
|
|
|
|
|
|
|
|
|
|
|
|
|
|
|
|
|
|
|
|
|
|
|
|
|
|
|
|
|
|
|
|
|
|
|
|
|
|
AVG NUM ESCAPES
| .00 | .01 | .05 | .06 | .03 | .00 | .00 | .02 | .00 | .01 | .03
Page 22 Run 11/22/00
Georgia Department of Corrections Office of Planning and Analysis
Inmate statistical profile
Sample: ACTIVE PRISONERS SERVING LIFE EXCLUDING JAIL
Requestor: Statistics
Active inmates 11/22/2000
Number Of Prior Georgia Incarcerations * by current age & sex
|
MEN
|
WOMEN
|
| Age | Age | Age | Age | Men
| Age | Age | Age | Age |Women
|Grand
Prior Incarcerations|00-21 %|22-39 %|40-54 %|55-99 %|Total % |00-21 %|22-39 %|40-54 %|55-99 %|Total % |Total %
------------------------------------------------------------------------------------------------------------------------------------
ZERO
| 184 98| 2039 67| 937 45| 229 56| 3389 59 | 10 100| 105 85| 65 76| 23 92| 203 83 | 3592 60
ONE
| 3 2| 573 19| 522 25| 93 23| 1191 21 | 0 0| 14 11| 13 15| 1 4| 28 11 | 1219 21
TWO
| 0 0| 233 8| 323 16| 43 11| 599 11 | 0 0| 3 2| 6 7| 1 4| 10 4 | 609 10
THREE
| 0 0| 125 4| 169 8| 29 7| 323 6 | 0 0| 2 2| 0 0| 0 0| 2 1 | 325 5
FOUR
| 0 0| 46 2| 75 4| 9 2| 130 2 | 0 0| 0 0| 0 0| 0 0| 0 0 | 130 2
FIVE
| 0 0| 12 0| 31 1| 2 0| 45 1 | 0 0| 0 0| 0 0| 0 0| 0 0 | 45 1
MORE THAN FIVE
| 0 0| 3 0| 20 1| 2 0| 25 0 | 0 0| 0 0| 1 1| 0 0| 1 0 | 26 0
------------------------------------------------------------------------------------------------------------------------------------
Total reported
| 187 100| 3031 100| 2077 100| 407 100| 5702 100 | 10 100| 124 100| 85 100| 25 100| 244 100 | 5946 100
|
|
|
|
|
|
|
|
|
|
|
Percent reported | 100.0| 100.0| 100.0| 100.0| 100.0 | 100.0| 100.0| 100.0| 100.0| 100.0 | 100.0
|
|
|
|
|
|
|
|
|
|
|
|
|
|
|
|
|
|
|
|
|
|
NOT REPORTED
|0|0|0|0|0
|0|0|0|0|0
|0
------------------------------------------------------------------------------------------------------------------------------------
Total
| 187 | 3031 | 2077 | 407 | 5702
| 10 | 124 | 85 | 25 | 244
| 5946
|
|
|
|
|
|
|
|
|
|
|
|
|
|
|
|
|
|
|
|
|
|
|
|
|
|
|
|
|
|
|
|
|
|
|
|
|
|
|
|
|
|
|
|
|
|
|
|
|
|
|
|
|
|
|
AVG # INCARCERATIONS| .02 | .55 | 1.09 | .80 | .75 | .00 | .21 | .38 | .12 | .25 | .73
* This data counts a parole revocation on an existing sentenCE AS A prior incarceration. Also, this data counts, for any cohort of inmates, the total number of Georgia incarcerations the inmate has had during his entire criminal career. For example, if an inmate was admitted to prison first in FY72, and then re-admitted in FY79 and FY85, he had two prior incarcerations before the FY85 admission. This inmate's records show two prior incarcerations in all three of his records since he has had two prior incarcerations in his criminal career. If the cohort of FY72 admissions is selected for analysis, two prior incarcerations will be listed for this inmate even though in FY72, he had no prior incarcerations.
Page 23 Run 11/22/00
Georgia Department of Corrections Office of Planning and Analysis
Inmate statistical profile
Sample: ACTIVE PRISONERS SERVING LIFE EXCLUDING JAIL
Requestor: Statistics
Active inmates 11/22/2000
Number Of Transfers by current age & sex
|
MEN
|
WOMEN
|
| Age | Age | Age | Age | Men
| Age | Age | Age | Age |Women
|Grand
Transfers
|00-21 %|22-39 %|40-54 %|55-99 %|Total % |00-21 %|22-39 %|40-54 %|55-99 %|Total % |Total %
------------------------------------------------------------------------------------------------------------------------------------
ZERO
| 58 31| 88 3| 26 1| 4 1| 176 3 | 2 20| 4 3| 5 6| 0 0| 11 5 | 187 3
ONE
| 82 44| 873 29| 399 19| 84 21| 1438 25 | 6 60| 37 30| 30 35| 5 20| 78 32 | 1516 25
TWO
| 34 18| 671 22| 349 17| 71 17| 1125 20 | 0 0| 39 31| 16 19| 5 20| 60 25 | 1185 20
THREE
| 11 6| 468 15| 289 14| 64 16| 832 15 | 2 20| 19 15| 16 19| 6 24| 43 18 | 875 15
FOUR
| 0 0| 329 11| 227 11| 41 10| 597 10 | 0 0| 13 10| 7 8| 3 12| 23 9 | 620 10
FIVE
| 2 1| 222 7| 168 8| 31 8| 423 7 | 0 0| 7 6| 3 4| 3 12| 13 5 | 436 7
MORE THAN FIVE
| 0 0| 380 13| 619 30| 112 28| 1111 19 | 0 0| 5 4| 8 9| 3 12| 16 7 | 1127 19
------------------------------------------------------------------------------------------------------------------------------------
Total reported
| 187 100| 3031 100| 2077 100| 407 100| 5702 100 | 10 100| 124 100| 85 100| 25 100| 244 100 | 5946 100
|
|
|
|
|
|
|
|
|
|
|
Percent reported | 100.0| 100.0| 100.0| 100.0| 100.0 | 100.0| 100.0| 100.0| 100.0| 100.0 | 100.0
|
|
|
|
|
|
|
|
|
|
|
|
|
|
|
|
|
|
|
|
|
|
NOT REPORTED
|0|0|0|0|0
|0|0|0|0|0
|0
------------------------------------------------------------------------------------------------------------------------------------
Total
| 187 | 3031 | 2077 | 407 | 5702
| 10 | 124 | 85 | 25 | 244
| 5946
|
|
|
|
|
|
|
|
|
|
|
|
|
|
|
|
|
|
|
|
|
|
|
|
|
|
|
|
|
|
|
|
|
|
|
|
|
|
|
|
|
|
|
|
|
|
|
|
|
|
|
|
|
|
|
AVG NUM TRANSFERS | 1.03 | 2.99 | 4.51 | 4.41 | 3.58 | 1.20 | 2.38 | 2.47 | 3.44 | 2.47 | 3.54
Page 24 Run 11/22/00
Georgia Department of Corrections Office of Planning and Analysis
Inmate statistical profile
Sample: ACTIVE PRISONERS SERVING LIFE EXCLUDING JAIL
Requestor: Statistics
Active inmates 11/22/2000
County Of Conviction by current age & sex
|
MEN
|
WOMEN
|
| Age | Age | Age | Age | Men
| Age | Age | Age | Age |Women
|Grand
County Of Conviction|00-21 %|22-39 %|40-54 %|55-99 %|Total % |00-21 %|22-39 %|40-54 %|55-99 %|Total % |Total %
------------------------------------------------------------------------------------------------------------------------------------
APPLING COUNTY
| 0 0| 4 0| 4 0| 1 0| 9 0 | 0 0| 0 0| 0 0| 0 0| 0 0 | 9 0
ATKINSON COUNTY
| 0 0| 1 0| 2 0| 2 0| 5 0 | 0 0| 0 0| 1 1| 0 0| 1 0 | 6 0
BACON COUNTY
| 0 0| 6 0| 3 0| 0 0| 9 0 | 0 0| 0 0| 0 0| 0 0| 0 0 | 9 0
BAKER COUNTY
| 0 0| 1 0| 1 0| 0 0| 2 0 | 0 0| 0 0| 0 0| 0 0| 0 0 | 2 0
BALDWIN COUNTY
| 2 1| 15 0| 12 1| 2 0| 31 1 | 0 0| 1 1| 0 0| 0 0| 1 0 | 32 1
BANKS COUNTY
| 0 0| 2 0| 9 0| 2 0| 13 0 | 0 0| 0 0| 0 0| 0 0| 0 0 | 13 0
BARROW COUNTY
| 0 0| 3 0| 9 0| 4 1| 16 0 | 0 0| 0 0| 1 1| 0 0| 1 0 | 17 0
BARTOW COUNTY
| 1 1| 28 1| 22 1| 3 1| 54 1 | 0 0| 2 2| 0 0| 0 0| 2 1 | 56 1
BEN HILL COUNTY
| 0 0| 6 0| 9 0| 3 1| 18 0 | 0 0| 0 0| 0 0| 0 0| 0 0 | 18 0
BERRIEN COUNTY
| 0 0| 4 0| 1 0| 0 0| 5 0 | 0 0| 0 0| 0 0| 0 0| 0 0 | 5 0
BIBB COUNTY
| 3 2| 92 3| 84 4| 15 4| 194 3 | 1 10| 2 2| 1 1| 1 4| 5 2 | 199 3
BLECKLEY COUNTY
| 0 0| 7 0| 4 0| 1 0| 12 0 | 0 0| 0 0| 1 1| 0 0| 1 0 | 13 0
BRANTLEY COUNTY
| 0 0| 1 0| 4 0| 2 0| 7 0 | 0 0| 0 0| 0 0| 0 0| 0 0 | 7 0
BROOKS COUNTY
| 0 0| 5 0| 4 0| 1 0| 10 0 | 0 0| 0 0| 0 0| 0 0| 0 0 | 10 0
BRYAN COUNTY
| 0 0| 9 0| 6 0| 1 0| 16 0 | 0 0| 0 0| 0 0| 1 4| 1 0 | 17 0
BULLOCH COUNTY
| 1 1| 18 1| 15 1| 0 0| 34 1 | 0 0| 1 1| 1 1| 1 4| 3 1 | 37 1
BURKE COUNTY
| 1 1| 16 1| 12 1| 1 0| 30 1 | 0 0| 0 0| 0 0| 0 0| 0 0 | 30 1
BUTTS COUNTY
| 2 1| 22 1| 11 1| 2 0| 37 1 | 0 0| 2 2| 1 1| 0 0| 3 1 | 40 1
CALHOUN COUNTY
| 1 1| 1 0| 4 0| 1 0| 7 0 | 0 0| 0 0| 0 0| 0 0| 0 0 | 7 0
CAMDEN COUNTY
| 1 1| 21 1| 8 0| 0 0| 30 1 | 0 0| 0 0| 1 1| 0 0| 1 0 | 31 1
CANDLER COUNTY
| 0 0| 1 0| 1 0| 0 0| 2 0 | 0 0| 0 0| 0 0| 0 0| 0 0 | 2 0
CARROLL COUNTY
| 0 0| 18 1| 13 1| 6 1| 37 1 | 0 0| 2 2| 1 1| 0 0| 3 1 | 40 1
CATOOSA COUNTY
| 0 0| 5 0| 9 0| 0 0| 14 0 | 0 0| 0 0| 0 0| 0 0| 0 0 | 14 0
CHARLTON COUNTY
| 0 0| 1 0| 0 0| 0 0| 1 0 | 0 0| 2 2| 0 0| 0 0| 2 1 | 3 0
CHATHAM COUNTY
| 6 3| 162 5| 105 5| 14 3| 287 5 | 0 0| 2 2| 1 1| 0 0| 3 1 | 290 5
CHATTAHOOCHEE COUNTY| 0 0| 0 0| 2 0| 0 0| 2 0 | 0 0| 0 0| 0 0| 0 0| 0 0 | 2 0
CHATTOOGA COUNTY | 0 0| 5 0| 6 0| 1 0| 12 0 | 0 0| 0 0| 1 1| 1 4| 2 1 | 14 0
CHEROKEE COUNTY
| 2 1| 8 0| 21 1| 2 0| 33 1 | 0 0| 3 2| 0 0| 0 0| 3 1 | 36 1
CLARKE COUNTY
| 2 1| 41 1| 24 1| 7 2| 74 1 | 0 0| 2 2| 0 0| 1 4| 3 1 | 77 1
CLAY COUNTY
| 0 0| 1 0| 1 0| 0 0| 2 0 | 0 0| 0 0| 0 0| 0 0| 0 0 | 2 0
CLAYTON COUNTY
| 4 2| 72 2| 35 2| 11 3| 122 2 | 0 0| 2 2| 3 4| 0 0| 5 2 | 127 2
CLINCH COUNTY
| 0 0| 1 0| 3 0| 0 0| 4 0 | 0 0| 0 0| 0 0| 0 0| 0 0 | 4 0
COBB COUNTY
| 9 5| 110 4| 73 4| 14 3| 206 4 | 0 0| 5 4| 3 4| 1 4| 9 4 | 215 4
COFFEE COUNTY
| 0 0| 8 0| 9 0| 2 0| 19 0 | 0 0| 1 1| 1 1| 0 0| 2 1 | 21 0
COLQUITT COUNTY
| 3 2| 40 1| 23 1| 3 1| 69 1 | 0 0| 0 0| 1 1| 1 4| 2 1 | 71 1
COLUMBIA COUNTY
| 0 0| 6 0| 9 0| 2 0| 17 0 | 0 0| 0 0| 1 1| 0 0| 1 0 | 18 0
------------------------------------------------------------------------------------------------------------------------------------
(continued)
Page 25 Run 11/22/00
Georgia Department of Corrections Office of Planning and Analysis
Inmate statistical profile
Sample: ACTIVE PRISONERS SERVING LIFE EXCLUDING JAIL
Requestor:
Active inmates 11/22/2000
County Of Conviction by current age & sex
Statistics (CONTINUED)
|
MEN
|
WOMEN
|
| Age | Age | Age | Age | Men
| Age | Age | Age | Age |Women
|Grand
County Of Conviction|00-21 %|22-39 %|40-54 %|55-99 %|Total % |00-21 %|22-39 %|40-54 %|55-99 %|Total % |Total %
------------------------------------------------------------------------------------------------------------------------------------
COOK COUNTY
| 0 0| 7 0| 3 0| 0 0| 10 0 | 0 0| 2 2| 0 0| 0 0| 2 1 | 12 0
COWETA COUNTY
| 3 2| 23 1| 10 0| 3 1| 39 1 | 0 0| 2 2| 1 1| 0 0| 3 1 | 42 1
CRAWFORD COUNTY
| 0 0| 3 0| 0 0| 0 0| 3 0 | 0 0| 0 0| 0 0| 0 0| 0 0 | 3 0
CRISP COUNTY
| 4 2| 13 0| 11 1| 2 0| 30 1 | 0 0| 3 2| 0 0| 1 4| 4 2 | 34 1
DADE COUNTY
| 2 1| 7 0| 5 0| 3 1| 17 0 | 0 0| 0 0| 0 0| 0 0| 0 0 | 17 0
DAWSON COUNTY
| 0 0| 2 0| 4 0| 1 0| 7 0 | 0 0| 0 0| 0 0| 0 0| 0 0 | 7 0
DECATUR COUNTY
| 1 1| 22 1| 5 0| 1 0| 29 1 | 0 0| 1 1| 0 0| 0 0| 1 0 | 30 1
DEKALB COUNTY
| 12 6| 249 8| 160 8| 22 5| 443 8 | 1 10| 3 2| 4 5| 1 4| 9 4 | 452 8
DODGE COUNTY
| 0 0| 6 0| 5 0| 1 0| 12 0 | 0 0| 0 0| 0 0| 0 0| 0 0 | 12 0
DOOLY COUNTY
| 2 1| 8 0| 8 0| 0 0| 18 0 | 0 0| 0 0| 0 0| 0 0| 0 0 | 18 0
DOUGHERTY COUNTY | 6 3| 72 2| 39 2| 4 1| 121 2 | 0 0| 5 4| 0 0| 0 0| 5 2 | 126 2
DOUGLAS COUNTY
| 4 2| 47 2| 19 1| 5 1| 75 1 | 0 0| 1 1| 1 1| 0 0| 2 1 | 77 1
EARLY COUNTY
| 0 0| 10 0| 5 0| 2 0| 17 0 | 0 0| 0 0| 0 0| 0 0| 0 0 | 17 0
ECHOLS COUNTY.
| 0 0| 0 0| 0 0| 0 0| 0 0 | 0 0| 0 0| 0 0| 0 0| 0 0 | 0 0
EFFINGHAM COUNTY | 0 0| 5 0| 3 0| 0 0| 8 0 | 0 0| 0 0| 0 0| 0 0| 0 0 | 8 0
ELBERT COUNTY
| 0 0| 14 0| 8 0| 1 0| 23 0 | 0 0| 1 1| 0 0| 0 0| 1 0 | 24 0
EMANUEL COUNTY
| 1 1| 8 0| 10 0| 2 0| 21 0 | 0 0| 0 0| 1 1| 0 0| 1 0 | 22 0
EVANS COUNTY
| 0 0| 6 0| 4 0| 2 0| 12 0 | 0 0| 0 0| 0 0| 0 0| 0 0 | 12 0
FANNIN COUNTY
| 0 0| 4 0| 5 0| 1 0| 10 0 | 0 0| 0 0| 0 0| 0 0| 0 0 | 10 0
FAYETTE COUNTY
| 1 1| 6 0| 5 0| 0 0| 12 0 | 0 0| 0 0| 0 0| 0 0| 0 0 | 12 0
FLOYD COUNTY
| 2 1| 28 1| 27 1| 4 1| 61 1 | 2 20| 3 2| 2 2| 1 4| 8 3 | 69 1
FORSYTH COUNTY
| 0 0| 5 0| 9 0| 3 1| 17 0 | 0 0| 1 1| 1 1| 0 0| 2 1 | 19 0
FRANKLIN COUNTY
| 1 1| 2 0| 3 0| 1 0| 7 0 | 0 0| 0 0| 2 2| 1 4| 3 1 | 10 0
FULTON COUNTY
| 27 14| 468 15| 311 15| 59 14| 865 15 | 1 10| 12 10| 6 7| 5 20| 24 10 | 889 15
GILMER COUNTY
| 0 0| 1 0| 2 0| 3 1| 6 0 | 0 0| 0 0| 0 0| 0 0| 0 0 | 6 0
GLASCOCK COUNTY
| 0 0| 0 0| 0 0| 0 0| 0 0 | 0 0| 0 0| 0 0| 0 0| 0 0 | 0 0
GLYNN COUNTY
| 6 3| 32 1| 28 1| 3 1| 69 1 | 0 0| 2 2| 2 2| 0 0| 4 2 | 73 1
GORDON COUNTY
| 0 0| 21 1| 14 1| 2 0| 37 1 | 0 0| 1 1| 0 0| 0 0| 1 0 | 38 1
GRADY COUNTY
| 3 2| 16 1| 10 0| 1 0| 30 1 | 0 0| 0 0| 0 0| 0 0| 0 0 | 30 1
GREENE COUNTY
| 1 1| 2 0| 5 0| 1 0| 9 0 | 0 0| 0 0| 0 0| 0 0| 0 0 | 9 0
GWINNETT COUNTY
| 1 1| 70 2| 42 2| 8 2| 121 2 | 0 0| 2 2| 5 6| 1 4| 8 3 | 129 2
HABERSHAM COUNTY | 1 1| 13 0| 9 0| 0 0| 23 0 | 0 0| 0 0| 0 0| 0 0| 0 0 | 23 0
HALL COUNTY
| 3 2| 43 1| 38 2| 10 2| 94 2 | 1 10| 3 2| 1 1| 1 4| 6 2 | 100 2
HANCOCK COUNTY
| 0 0| 3 0| 1 0| 0 0| 4 0 | 0 0| 0 0| 1 1| 0 0| 1 0 | 5 0
HARALSON COUNTY
| 0 0| 4 0| 2 0| 1 0| 7 0 | 0 0| 0 0| 0 0| 0 0| 0 0 | 7 0
------------------------------------------------------------------------------------------------------------------------------------
(continued)
Page 26 Run 11/22/00
Georgia Department of Corrections Office of Planning and Analysis
Inmate statistical profile
Sample: ACTIVE PRISONERS SERVING LIFE EXCLUDING JAIL
Requestor:
Active inmates 11/22/2000
County Of Conviction by current age & sex
Statistics (CONTINUED)
|
MEN
|
WOMEN
|
| Age | Age | Age | Age | Men
| Age | Age | Age | Age |Women
|Grand
County Of Conviction|00-21 %|22-39 %|40-54 %|55-99 %|Total % |00-21 %|22-39 %|40-54 %|55-99 %|Total % |Total %
------------------------------------------------------------------------------------------------------------------------------------
HARRIS COUNTY
| 1 1| 8 0| 3 0| 0 0| 12 0 | 0 0| 0 0| 0 0| 0 0| 0 0 | 12 0
HART COUNTY
| 0 0| 3 0| 2 0| 0 0| 5 0 | 0 0| 0 0| 0 0| 0 0| 0 0 | 5 0
HEARD COUNTY
| 0 0| 2 0| 0 0| 3 1| 5 0 | 0 0| 0 0| 0 0| 0 0| 0 0 | 5 0
HENRY COUNTY
| 0 0| 23 1| 9 0| 1 0| 33 1 | 0 0| 1 1| 0 0| 0 0| 1 0 | 34 1
HOUSTON COUNTY
| 0 0| 39 1| 19 1| 3 1| 61 1 | 0 0| 4 3| 3 4| 1 4| 8 3 | 69 1
IRWIN COUNTY
| 0 0| 3 0| 1 0| 1 0| 5 0 | 0 0| 0 0| 0 0| 0 0| 0 0 | 5 0
JACKSON COUNTY
| 1 1| 6 0| 14 1| 1 0| 22 0 | 0 0| 1 1| 0 0| 0 0| 1 0 | 23 0
JASPER COUNTY
| 0 0| 8 0| 0 0| 0 0| 8 0 | 0 0| 0 0| 1 1| 0 0| 1 0 | 9 0
JEFF DAVIS COUNTY | 0 0| 4 0| 4 0| 2 0| 10 0 | 0 0| 0 0| 0 0| 0 0| 0 0 | 10 0
JEFFERSON COUNTY | 0 0| 9 0| 5 0| 4 1| 18 0 | 0 0| 0 0| 0 0| 0 0| 0 0 | 18 0
JENKINS COUNTY
| 0 0| 2 0| 4 0| 0 0| 6 0 | 0 0| 0 0| 0 0| 0 0| 0 0 | 6 0
JOHNSON COUNTY
| 0 0| 9 0| 2 0| 1 0| 12 0 | 0 0| 1 1| 0 0| 0 0| 1 0 | 13 0
JONES COUNTY
| 0 0| 1 0| 5 0| 3 1| 9 0 | 0 0| 0 0| 0 0| 0 0| 0 0 | 9 0
LAMAR COUNTY
| 0 0| 9 0| 10 0| 3 1| 22 0 | 0 0| 0 0| 1 1| 0 0| 1 0 | 23 0
LANIER COUNTY
| 0 0| 1 0| 0 0| 0 0| 1 0 | 0 0| 0 0| 0 0| 0 0| 0 0 | 1 0
LAURENS COUNTY
| 1 1| 13 0| 7 0| 1 0| 22 0 | 0 0| 1 1| 2 2| 0 0| 3 1 | 25 0
LEE COUNTY
| 0 0| 2 0| 0 0| 0 0| 2 0 | 1 10| 0 0| 0 0| 0 0| 1 0 | 3 0
LIBERTY COUNTY
| 1 1| 23 1| 9 0| 4 1| 37 1 | 0 0| 2 2| 0 0| 0 0| 2 1 | 39 1
LINCOLN COUNTY
| 1 1| 2 0| 2 0| 0 0| 5 0 | 0 0| 0 0| 0 0| 0 0| 0 0 | 5 0
LONG COUNTY
| 1 1| 5 0| 4 0| 2 0| 12 0 | 0 0| 2 2| 0 0| 0 0| 2 1 | 14 0
LOWNDES COUNTY
| 0 0| 40 1| 25 1| 2 0| 67 1 | 0 0| 0 0| 2 2| 1 4| 3 1 | 70 1
LUMPKIN COUNTY
| 1 1| 3 0| 0 0| 2 0| 6 0 | 0 0| 0 0| 0 0| 0 0| 0 0 | 6 0
MACON COUNTY
| 1 1| 15 0| 8 0| 0 0| 24 0 | 0 0| 0 0| 0 0| 0 0| 0 0 | 24 0
MADISON COUNTY
| 0 0| 9 0| 4 0| 3 1| 16 0 | 0 0| 2 2| 0 0| 0 0| 2 1 | 18 0
MARION COUNTY
| 0 0| 2 0| 1 0| 0 0| 3 0 | 0 0| 0 0| 1 1| 0 0| 1 0 | 4 0
MCDUFFIE COUNTY
| 0 0| 28 1| 11 1| 4 1| 43 1 | 1 10| 1 1| 0 0| 0 0| 2 1 | 45 1
MCINTOSH COUNTY
| 1 1| 7 0| 9 0| 0 0| 17 0 | 0 0| 0 0| 0 0| 0 0| 0 0 | 17 0
MERIWETHER COUNTY | 0 0| 10 0| 9 0| 3 1| 22 0 | 0 0| 2 2| 0 0| 1 4| 3 1 | 25 0
MILLER COUNTY
| 0 0| 2 0| 2 0| 0 0| 4 0 | 0 0| 0 0| 0 0| 0 0| 0 0 | 4 0
MITCHELL COUNTY
| 0 0| 11 0| 10 0| 2 0| 23 0 | 0 0| 2 2| 0 0| 0 0| 2 1 | 25 0
MONROE COUNTY
| 0 0| 10 0| 8 0| 2 0| 20 0 | 0 0| 1 1| 0 0| 0 0| 1 0 | 21 0
MONTGOMERY COUNTY | 0 0| 0 0| 3 0| 0 0| 3 0 | 0 0| 0 0| 0 0| 0 0| 0 0 | 3 0
MORGAN COUNTY
| 0 0| 12 0| 2 0| 0 0| 14 0 | 0 0| 1 1| 0 0| 0 0| 1 0 | 15 0
MURRAY COUNTY
| 2 1| 3 0| 6 0| 4 1| 15 0 | 0 0| 0 0| 0 0| 0 0| 0 0 | 15 0
MUSCOGEE COUNTY
| 5 3| 79 3| 77 4| 11 3| 172 3 | 0 0| 4 3| 2 2| 0 0| 6 2 | 178 3
------------------------------------------------------------------------------------------------------------------------------------
(continued)
Page 27 Run 11/22/00
Georgia Department of Corrections Office of Planning and Analysis
Inmate statistical profile
Sample: ACTIVE PRISONERS SERVING LIFE EXCLUDING JAIL
Requestor:
Active inmates 11/22/2000
County Of Conviction by current age & sex
Statistics (CONTINUED)
|
MEN
|
WOMEN
|
| Age | Age | Age | Age | Men
| Age | Age | Age | Age |Women
|Grand
County Of Conviction|00-21 %|22-39 %|40-54 %|55-99 %|Total % |00-21 %|22-39 %|40-54 %|55-99 %|Total % |Total %
------------------------------------------------------------------------------------------------------------------------------------
NEWTON COUNTY
| 3 2| 46 2| 15 1| 5 1| 69 1 | 0 0| 2 2| 0 0| 0 0| 2 1 | 71 1
OCONEE COUNTY
| 0 0| 9 0| 3 0| 0 0| 12 0 | 0 0| 0 0| 0 0| 0 0| 0 0 | 12 0
OGLETHORPE COUNTY | 0 0| 4 0| 4 0| 1 0| 9 0 | 0 0| 0 0| 0 0| 0 0| 0 0 | 9 0
PAULDING COUNTY
| 0 0| 4 0| 6 0| 2 0| 12 0 | 0 0| 1 1| 0 0| 0 0| 1 0 | 13 0
PEACH COUNTY
| 0 0| 6 0| 3 0| 0 0| 9 0 | 0 0| 0 0| 1 1| 0 0| 1 0 | 10 0
PICKENS COUNTY
| 0 0| 4 0| 0 0| 1 0| 5 0 | 0 0| 0 0| 1 1| 0 0| 1 0 | 6 0
PIERCE COUNTY
| 3 2| 2 0| 5 0| 0 0| 10 0 | 0 0| 0 0| 0 0| 0 0| 0 0 | 10 0
PIKE COUNTY
| 0 0| 1 0| 1 0| 0 0| 2 0 | 0 0| 0 0| 0 0| 0 0| 0 0 | 2 0
POLK COUNTY
| 1 1| 11 0| 8 0| 2 0| 22 0 | 0 0| 0 0| 0 0| 0 0| 0 0 | 22 0
PULASKI COUNTY
| 0 0| 7 0| 1 0| 0 0| 8 0 | 0 0| 1 1| 0 0| 0 0| 1 0 | 9 0
PUTNAM COUNTY
| 0 0| 21 1| 15 1| 3 1| 39 1 | 0 0| 0 0| 0 0| 0 0| 0 0 | 39 1
QUITMAN COUNTY
| 0 0| 4 0| 0 0| 0 0| 4 0 | 0 0| 0 0| 0 0| 0 0| 0 0 | 4 0
RABUN COUNTY
| 0 0| 6 0| 3 0| 0 0| 9 0 | 0 0| 0 0| 0 0| 0 0| 0 0 | 9 0
RANDOLPH COUNTY
| 0 0| 3 0| 2 0| 2 0| 7 0 | 0 0| 0 0| 0 0| 0 0| 0 0 | 7 0
RICHMOND COUNTY
| 12 6| 161 5| 73 4| 13 3| 259 5 | 0 0| 8 6| 9 11| 1 4| 18 7 | 277 5
ROCKDALE COUNTY
| 1 1| 10 0| 11 1| 5 1| 27 0 | 0 0| 1 1| 0 0| 0 0| 1 0 | 28 0
SCHLEY COUNTY
| 0 0| 3 0| 2 0| 0 0| 5 0 | 0 0| 0 0| 0 0| 0 0| 0 0 | 5 0
SCREVEN COUNTY
| 0 0| 5 0| 5 0| 2 0| 12 0 | 0 0| 0 0| 0 0| 0 0| 0 0 | 12 0
SEMINOLE COUNTY
| 1 1| 4 0| 4 0| 2 0| 11 0 | 0 0| 1 1| 0 0| 0 0| 1 0 | 12 0
SPALDING COUNTY
| 2 1| 41 1| 23 1| 6 1| 72 1 | 1 10| 1 1| 2 2| 1 4| 5 2 | 77 1
STEPHENS COUNTY
| 0 0| 4 0| 4 0| 3 1| 11 0 | 0 0| 0 0| 0 0| 0 0| 0 0 | 11 0
STEWART COUNTY
| 0 0| 2 0| 1 0| 0 0| 3 0 | 0 0| 0 0| 2 2| 0 0| 2 1 | 5 0
SUMTER COUNTY
| 0 0| 5 0| 13 1| 1 0| 19 0 | 0 0| 0 0| 1 1| 0 0| 1 0 | 20 0
TALBOT COUNTY
| 1 1| 4 0| 1 0| 0 0| 6 0 | 0 0| 0 0| 1 1| 0 0| 1 0 | 7 0
TALIAFERRO COUNTY | 0 0| 0 0| 3 0| 0 0| 3 0 | 0 0| 0 0| 0 0| 0 0| 0 0 | 3 0
TATTNALL COUNTY
| 0 0| 18 1| 13 1| 3 1| 34 1 | 0 0| 0 0| 1 1| 0 0| 1 0 | 35 1
TAYLOR COUNTY
| 3 2| 10 0| 4 0| 0 0| 17 0 | 0 0| 0 0| 0 0| 0 0| 0 0 | 17 0
TELFAIR COUNTY
| 1 1| 6 0| 2 0| 0 0| 9 0 | 0 0| 0 0| 1 1| 0 0| 1 0 | 10 0
TERRELL COUNTY
| 1 1| 12 0| 3 0| 1 0| 17 0 | 0 0| 0 0| 0 0| 0 0| 0 0 | 17 0
THOMAS COUNTY
| 2 1| 17 1| 21 1| 3 1| 43 1 | 0 0| 1 1| 1 1| 0 0| 2 1 | 45 1
TIFT COUNTY
| 7 4| 34 1| 22 1| 5 1| 68 1 | 0 0| 0 0| 2 2| 1 4| 3 1 | 71 1
TOOMBS COUNTY
| 5 3| 20 1| 11 1| 1 0| 37 1 | 0 0| 2 2| 0 0| 0 0| 2 1 | 39 1
TOWNS COUNTY
| 0 0| 1 0| 1 0| 0 0| 2 0 | 0 0| 0 0| 0 0| 0 0| 0 0 | 2 0
TREUTLEN COUNTY
| 0 0| 3 0| 4 0| 0 0| 7 0 | 0 0| 0 0| 0 0| 0 0| 0 0 | 7 0
TROUP COUNTY
| 2 1| 26 1| 24 1| 7 2| 59 1 | 0 0| 2 2| 1 1| 0 0| 3 1 | 62 1
------------------------------------------------------------------------------------------------------------------------------------
(continued)
Page 28 Run 11/22/00
Georgia Department of Corrections Office of Planning and Analysis
Inmate statistical profile
Sample: ACTIVE PRISONERS SERVING LIFE EXCLUDING JAIL
Requestor:
Active inmates 11/22/2000
County Of Conviction by current age & sex
Statistics (CONTINUED)
|
MEN
|
WOMEN
|
| Age | Age | Age | Age | Men
| Age | Age | Age | Age |Women
|Grand
County Of Conviction|00-21 %|22-39 %|40-54 %|55-99 %|Total % |00-21 %|22-39 %|40-54 %|55-99 %|Total % |Total %
------------------------------------------------------------------------------------------------------------------------------------
TURNER COUNTY
| 0 0| 8 0| 6 0| 1 0| 15 0 | 0 0| 0 0| 0 0| 0 0| 0 0 | 15 0
TWIGGS COUNTY
| 0 0| 3 0| 5 0| 1 0| 9 0 | 0 0| 0 0| 0 0| 0 0| 0 0 | 9 0
UNION COUNTY
| 0 0| 0 0| 1 0| 0 0| 1 0 | 0 0| 0 0| 0 0| 0 0| 0 0 | 1 0
UPSON COUNTY
| 1 1| 7 0| 5 0| 1 0| 14 0 | 0 0| 0 0| 1 1| 0 0| 1 0 | 15 0
WALKER COUNTY
| 0 0| 14 0| 10 0| 4 1| 28 0 | 0 0| 1 1| 1 1| 0 0| 2 1 | 30 1
WALTON COUNTY
| 3 2| 30 1| 20 1| 2 0| 55 1 | 0 0| 2 2| 0 0| 0 0| 2 1 | 57 1
WARE COUNTY
| 0 0| 13 0| 11 1| 3 1| 27 0 | 0 0| 0 0| 1 1| 0 0| 1 0 | 28 0
WARREN COUNTY
| 0 0| 4 0| 6 0| 1 0| 11 0 | 0 0| 0 0| 0 0| 0 0| 0 0 | 11 0
WASHINGTON COUNTY | 0 0| 7 0| 7 0| 1 0| 15 0 | 1 10| 1 1| 0 0| 0 0| 2 1 | 17 0
WAYNE COUNTY
| 0 0| 7 0| 8 0| 2 0| 17 0 | 0 0| 1 1| 0 0| 0 0| 1 0 | 18 0
WEBSTER COUNTY
| 0 0| 0 0| 0 0| 0 0| 0 0 | 0 0| 0 0| 0 0| 0 0| 0 0 | 0 0
WHEELER COUNTY
| 0 0| 3 0| 3 0| 1 0| 7 0 | 0 0| 0 0| 0 0| 1 4| 1 0 | 8 0
WHITE COUNTY
| 0 0| 3 0| 2 0| 0 0| 5 0 | 0 0| 0 0| 0 0| 0 0| 0 0 | 5 0
WHITFIELD COUNTY | 0 0| 25 1| 24 1| 8 2| 57 1 | 0 0| 5 4| 1 1| 0 0| 6 2 | 63 1
WILCOX COUNTY
| 0 0| 1 0| 7 0| 0 0| 8 0 | 0 0| 0 0| 0 0| 0 0| 0 0 | 8 0
WILKES COUNTY
| 0 0| 7 0| 3 0| 1 0| 11 0 | 0 0| 0 0| 0 0| 0 0| 0 0 | 11 0
WILKINSON COUNTY | 0 0| 7 0| 1 0| 0 0| 8 0 | 0 0| 0 0| 0 0| 0 0| 0 0 | 8 0
WORTH COUNTY
| 3 2| 14 0| 4 0| 2 0| 23 0 | 0 0| 0 0| 0 0| 0 0| 0 0 | 23 0
CONVERSION
| 0 2| 0 0| 0 0| 0 0| 0 0 | 0 0| 0 0| 0 0| 0 0| 0 0 | 0 0
------------------------------------------------------------------------------------------------------------------------------------
Total reported
| 187 100| 3031 100| 2077 100| 407 100| 5702 100 | 10 100| 124 100| 85 100| 25 100| 244 100 | 5946 100
|
|
|
|
|
|
|
|
|
|
|
Percent reported | 100.0| 100.0| 100.0| 100.0| 100.0 | 100.0| 100.0| 100.0| 100.0| 100.0 | 100.0
|
|
|
|
|
|
|
|
|
|
|
|
|
|
|
|
|
|
|
|
|
|
UNKNOWN
|0|0|0|0|0
|0|0|0|0|0
|0
------------------------------------------------------------------------------------------------------------------------------------
Total
| 187 | 3031 | 2077 | 407 | 5702
| 10 | 124 | 85 | 25 | 244
| 5946
Page 29 Run 11/22/00
Georgia Department of Corrections Office of Planning and Analysis
Inmate statistical profile
Sample: ACTIVE PRISONERS SERVING LIFE EXCLUDING JAIL
Requestor: Statistics
Active inmates 11/22/2000
Circuit Of Conviction by current age & sex
|
MEN
|
WOMEN
|
| Age | Age | Age | Age | Men
| Age | Age | Age | Age |Women
|Grand
Circ Of Conviction |00-21 %|22-39 %|40-54 %|55-99 %|Total % |00-21 %|22-39 %|40-54 %|55-99 %|Total % |Total %
------------------------------------------------------------------------------------------------------------------------------------
ALAPAHA CIRCUIT
| 0 0| 14 0| 9 0| 2 0| 25 0 | 0 0| 2 2| 1 1| 0 0| 3 1 | 28 0
ALCOVY CIRCUIT
| 6 3| 76 3| 35 2| 7 2| 124 2 | 0 0| 4 3| 0 0| 0 0| 4 2 | 128 2
ATLANTA CIRCUIT
| 27 15| 468 15| 311 15| 59 14| 865 15 | 1 10| 12 10| 6 7| 5 20| 24 10 | 889 15
ATLANTIC CIRCUIT | 3 2| 68 2| 45 2| 12 3| 128 2 | 0 0| 4 3| 1 1| 1 4| 6 2 | 134 2
AUGUSTA CIRCUIT
| 13 7| 183 6| 94 5| 16 4| 306 5 | 0 0| 8 6| 10 12| 1 4| 19 8 | 325 5
BLUE RIDGE CIRCUIT | 2 1| 12 0| 30 1| 5 1| 49 1 | 0 0| 4 3| 1 1| 0 0| 5 2 | 54 1
BRUNSWICK CIRCUIT | 7 4| 68 2| 52 3| 8 2| 135 2 | 0 0| 3 2| 3 4| 0 0| 6 2 | 141 2
CHATTAHOOCHEE CIRCUI| 10 5| 103 3| 88 4| 11 3| 212 4 | 0 0| 4 3| 4 5| 0 0| 8 3 | 220 4
CHEROKEE CIRCUIT | 1 1| 49 2| 36 2| 5 1| 91 2 | 0 0| 3 2| 0 0| 0 0| 3 1 | 94 2
CLAYTON CIRCUIT
| 4 2| 72 2| 35 2| 11 3| 122 2 | 0 0| 2 2| 3 4| 0 0| 5 2 | 127 2
COBB CIRCUIT
| 9 5| 110 4| 73 4| 14 3| 206 4 | 0 0| 5 4| 3 4| 1 4| 9 4 | 215 4
CONASAUGA CIRCUIT | 2 1| 28 1| 30 1| 12 3| 72 1 | 0 0| 5 4| 1 1| 0 0| 6 2 | 78 1
CORDELE CIRCUIT
| 6 3| 28 1| 35 2| 5 1| 74 1 | 0 0| 3 2| 0 0| 1 4| 4 2 | 78 1
COWETA CIRCUIT
| 5 3| 79 3| 56 3| 22 5| 162 3 | 0 0| 8 6| 3 4| 1 4| 12 5 | 174 3
DOUGHERTY CIRCUIT | 6 3| 72 2| 39 2| 4 1| 121 2 | 0 0| 5 4| 0 0| 0 0| 5 2 | 126 2
DUBLIN CIRCUIT
| 1 1| 28 1| 18 1| 3 1| 50 1 | 0 0| 2 2| 2 2| 0 0| 4 2 | 54 1
EASTERN CIRCUIT
| 6 3| 162 5| 105 5| 14 3| 287 5 | 0 0| 2 2| 1 1| 0 0| 3 1 | 290 5
FLINT CIRCUIT
| 1 1| 62 2| 37 2| 8 2| 108 2 | 0 0| 4 3| 2 2| 0 0| 6 2 | 114 2
GRIFFIN CIRCUIT
| 4 2| 55 2| 34 2| 7 2| 100 2 | 1 10| 1 1| 3 4| 1 4| 6 2 | 106 2
GWINNETT CIRCUIT | 1 1| 70 2| 42 2| 8 2| 121 2 | 0 0| 2 2| 5 6| 1 4| 8 3 | 129 2
HOUSTON CIRCUIT
| 0 0| 39 1| 19 1| 3 1| 61 1 | 0 0| 4 3| 3 4| 1 4| 8 3 | 69 1
LOOKOUT MOUNTAIN CIR| 2 1| 31 1| 30 1| 8 2| 71 1 | 0 0| 1 1| 2 2| 1 4| 4 2 | 75 1
MACON CIRCUIT
| 3 2| 101 3| 87 4| 15 4| 206 4 | 1 10| 2 2| 2 2| 1 4| 6 2 | 212 4
MIDDLE CIRCUIT
| 6 3| 45 1| 34 2| 8 2| 93 2 | 1 10| 3 2| 1 1| 0 0| 5 2 | 98 2
MOUNTAIN CIRCUIT | 1 1| 23 1| 16 1| 3 1| 43 1 | 0 0| 0 0| 0 0| 0 0| 0 0 | 43 1
NORTHEASTERN CIRCUIT| 3 2| 45 1| 42 2| 11 3| 101 2 | 1 10| 3 2| 1 1| 1 4| 6 2 | 107 2
NORTHERN CIRCUIT | 1 1| 32 1| 21 1| 6 1| 60 1 | 0 0| 3 2| 2 2| 1 4| 6 2 | 66 1
OCMULGEE CIRCUIT | 3 2| 69 2| 41 2| 9 2| 122 2 | 0 0| 2 2| 2 2| 0 0| 4 2 | 126 2
OCONEE CIRCUIT
| 1 1| 29 1| 18 1| 3 1| 51 1 | 0 0| 1 1| 2 2| 1 4| 4 2 | 55 1
OGEECHEE CIRCUIT | 1 1| 30 1| 27 1| 2 0| 60 1 | 0 0| 1 1| 1 1| 1 4| 3 1 | 63 1
PATAULA CIRCUIT
| 2 1| 36 1| 17 1| 7 2| 62 1 | 0 0| 1 1| 0 0| 0 0| 1 0 | 63 1
PIEDMONT CIRCUIT | 1 1| 11 0| 32 2| 7 2| 51 1 | 0 0| 1 1| 1 1| 0 0| 2 1 | 53 1
ROME CIRCUIT
| 2 1| 28 1| 27 1| 4 1| 61 1 | 2 20| 3 2| 2 2| 1 4| 8 3 | 69 1
SOUTH GEORGIA CIRCUI| 5 3| 51 2| 30 1| 5 1| 91 2 | 0 0| 3 2| 0 0| 0 0| 3 1 | 94 2
SOUTHERN CIRCUIT | 5 3| 102 3| 73 4| 9 2| 189 3 | 0 0| 1 1| 4 5| 2 8| 7 3 | 196 3
------------------------------------------------------------------------------------------------------------------------------------
(continued)
Page 30 Run 11/22/00
Georgia Department of Corrections Office of Planning and Analysis
Inmate statistical profile
Sample: ACTIVE PRISONERS SERVING LIFE EXCLUDING JAIL
Requestor:
Active inmates 11/22/2000
Circuit Of Conviction by current age & sex
Statistics (Continued)
|
MEN
|
WOMEN
|
| Age | Age | Age | Age | Men
| Age | Age | Age | Age |Women
|Grand
Circ Of Conviction |00-21 %|22-39 %|40-54 %|55-99 %|Total % |00-21 %|22-39 %|40-54 %|55-99 %|Total % |Total %
------------------------------------------------------------------------------------------------------------------------------------
SOUTHWESTERN CIRCUIT| 1 1| 27 1| 24 1| 1 0| 53 1 | 1 10| 0 0| 3 4| 0 0| 4 2 | 57 1
STONE MOUNTAIN CIRCU| 12 6| 249 8| 160 8| 22 5| 443 8 | 1 10| 3 2| 4 5| 1 4| 9 4 | 452 8
TALLAPOOSA CIRCUIT | 1 1| 19 1| 16 1| 5 1| 41 1 | 0 0| 1 1| 0 0| 0 0| 1 0 | 42 1
TIFTON CIRCUIT
| 10 5| 59 2| 33 2| 9 2| 111 2 | 0 0| 0 0| 2 2| 1 4| 3 1 | 114 2
TOOMBS CIRCUIT
| 1 1| 41 1| 25 1| 6 1| 73 1 | 1 10| 1 1| 0 0| 0 0| 2 1 | 75 1
WAYCROSS CIRCUIT | 3 2| 31 1| 32 2| 7 2| 73 1 | 0 0| 3 2| 2 2| 0 0| 5 2 | 78 1
WESTERN CIRCUIT
| 2 1| 50 2| 27 1| 7 2| 86 2 | 0 0| 2 2| 0 0| 1 4| 3 1 | 89 1
ROCKDALE CIRCUIT | 1 1| 10 0| 11 1| 5 1| 27 0 | 0 0| 1 1| 0 0| 0 0| 1 0 | 28 0
DOUGLAS CIRCUIT
| 4 2| 47 2| 19 1| 5 1| 75 1 | 0 0| 1 1| 1 1| 0 0| 2 1 | 77 1
APPALACHIAN CIRCUIT | 0 0| 9 0| 7 0| 5 1| 21 0 | 0 0| 0 0| 1 1| 0 0| 1 0 | 22 0
ENOTAH CIRCUIT
| 1 1| 7 0| 4 0| 2 0| 14 0 | 0 0| 0 0| 0 0| 0 0| 0 0 | 14 0
BELL-FORSYTH CIRCUIT| 0 0| 1 0| 0 0| 0 0| 1 0 | 0 0| 0 0| 0 0| 0 0| 0 0 | 1 0
------------------------------------------------------------------------------------------------------------------------------------
Total reported
| 186 100| 3029 100| 2076 100| 407 100| 5698 100 | 10 100| 124 100| 85 100| 25 100| 244 100 | 5942 100
|
|
|
|
|
|
|
|
|
|
|
Percent reported |
99.5|
99.9| 100.0| 100.0|
99.9 | 100.0| 100.0| 100.0| 100.0| 100.0 |
99.9
|
|
|
|
|
|
|
|
|
|
|
|
|
|
|
|
|
|
|
|
|
|
NOT REPORTED
|1|2|1|0|4
|0|0|0|0|0
|4
------------------------------------------------------------------------------------------------------------------------------------
Total
| 187 | 3031 | 2077 | 407 | 5702
| 10 | 124 | 85 | 25 | 244
| 5946
Page 31 Run 11/22/00
Georgia Department of Corrections Office of Planning and Analysis
Inmate statistical profile
Sample: ACTIVE PRISONERS SERVING LIFE EXCLUDING JAIL
Requestor: Statistics
Active inmates 11/22/2000
Home County by current age & sex
|
MEN
|
WOMEN
|
| Age | Age | Age | Age | Men
| Age | Age | Age | Age |Women
|Grand
Home County
|00-21 %|22-39 %|40-54 %|55-99 %|Total % |00-21 %|22-39 %|40-54 %|55-99 %|Total % |Total %
------------------------------------------------------------------------------------------------------------------------------------
APPLING COUNTY
| 0 0| 4 0| 5 0| 1 0| 10 0 | 0 0| 0 0| 0 0| 0 0| 0 0 | 10 0
ATKINSON COUNTY
| 0 0| 1 0| 1 0| 3 1| 5 0 | 0 0| 0 0| 0 0| 0 0| 0 0 | 5 0
BACON COUNTY
| 0 0| 5 0| 4 0| 1 0| 10 0 | 0 0| 0 0| 0 0| 0 0| 0 0 | 10 0
BAKER COUNTY
| 0 0| 1 0| 2 0| 0 0| 3 0 | 0 0| 0 0| 0 0| 0 0| 0 0 | 3 0
BALDWIN COUNTY
| 0 0| 15 1| 6 0| 1 0| 22 0 | 0 0| 1 1| 0 0| 1 4| 2 1 | 24 0
BANKS COUNTY
| 0 0| 2 0| 4 0| 1 0| 7 0 | 0 0| 1 1| 0 0| 0 0| 1 0 | 8 0
BARROW COUNTY
| 0 0| 6 0| 8 0| 2 1| 16 0 | 0 0| 0 0| 1 1| 0 0| 1 0 | 17 0
BARTOW COUNTY
| 1 1| 20 1| 18 1| 5 1| 44 1 | 1 11| 3 3| 0 0| 0 0| 4 2 | 48 1
BEN HILL COUNTY
| 0 0| 4 0| 7 0| 3 1| 14 0 | 0 0| 0 0| 1 1| 0 0| 1 0 | 15 0
BERRIEN COUNTY
| 0 0| 4 0| 1 0| 1 0| 6 0 | 0 0| 0 0| 0 0| 0 0| 0 0 | 6 0
BIBB COUNTY
| 3 2| 83 3| 78 4| 18 5| 182 3 | 1 11| 5 4| 2 3| 0 0| 8 4 | 190 3
BLECKLEY COUNTY
| 0 0| 8 0| 4 0| 1 0| 13 0 | 0 0| 0 0| 1 1| 0 0| 1 0 | 14 0
BRANTLEY COUNTY
| 0 0| 1 0| 2 0| 0 0| 3 0 | 0 0| 0 0| 0 0| 0 0| 0 0 | 3 0
BROOKS COUNTY
| 0 0| 7 0| 2 0| 1 0| 10 0 | 0 0| 0 0| 0 0| 0 0| 0 0 | 10 0
BRYAN COUNTY
| 0 0| 7 0| 5 0| 1 0| 13 0 | 0 0| 0 0| 0 0| 0 0| 0 0 | 13 0
BULLOCH COUNTY
| 1 1| 12 0| 10 1| 0 0| 23 0 | 0 0| 0 0| 1 1| 1 4| 2 1 | 25 0
BURKE COUNTY
| 0 0| 10 0| 7 0| 2 1| 19 0 | 0 0| 0 0| 0 0| 0 0| 0 0 | 19 0
BUTTS COUNTY
| 0 0| 23 1| 8 0| 2 1| 33 1 | 0 0| 1 1| 1 1| 0 0| 2 1 | 35 1
CALHOUN COUNTY
| 1 1| 3 0| 3 0| 1 0| 8 0 | 0 0| 0 0| 0 0| 0 0| 0 0 | 8 0
CAMDEN COUNTY
| 1 1| 17 1| 6 0| 0 0| 24 0 | 0 0| 0 0| 1 1| 0 0| 1 0 | 25 0
CANDLER COUNTY
| 0 0| 2 0| 1 0| 0 0| 3 0 | 0 0| 0 0| 0 0| 0 0| 0 0 | 3 0
CARROLL COUNTY
| 0 0| 21 1| 12 1| 8 2| 41 1 | 0 0| 2 2| 1 1| 0 0| 3 1 | 44 1
CATOOSA COUNTY
| 0 0| 2 0| 5 0| 1 0| 8 0 | 0 0| 0 0| 0 0| 0 0| 0 0 | 8 0
CHARLTON COUNTY
| 0 0| 1 0| 0 0| 0 0| 1 0 | 0 0| 1 1| 0 0| 0 0| 1 0 | 2 0
CHATHAM COUNTY
| 6 3| 150 5| 97 5| 14 4| 267 5 | 0 0| 2 2| 1 1| 1 4| 4 2 | 271 5
CHATTAHOOCHEE COUNTY| 0 0| 0 0| 1 0| 0 0| 1 0 | 0 0| 0 0| 0 0| 0 0| 0 0 | 1 0
CHATTOOGA COUNTY | 0 0| 3 0| 5 0| 0 0| 8 0 | 0 0| 0 0| 1 1| 1 4| 2 1 | 10 0
CHEROKEE COUNTY
| 2 1| 7 0| 17 1| 1 0| 27 1 | 0 0| 2 2| 0 0| 0 0| 2 1 | 29 1
CLARKE COUNTY
| 3 2| 47 2| 19 1| 4 1| 73 1 | 0 0| 2 2| 0 0| 2 8| 4 2 | 77 1
CLAY COUNTY
| 0 0| 0 0| 1 0| 0 0| 1 0 | 0 0| 0 0| 0 0| 0 0| 0 0 | 1 0
CLAYTON COUNTY
| 4 2| 59 2| 43 2| 9 2| 115 2 | 0 0| 2 2| 2 3| 0 0| 4 2 | 119 2
CLINCH COUNTY
| 0 0| 1 0| 1 0| 0 0| 2 0 | 0 0| 0 0| 0 0| 0 0| 0 0 | 2 0
COBB COUNTY
| 8 5| 90 3| 67 3| 8 2| 173 3 | 0 0| 4 3| 1 1| 0 0| 5 2 | 178 3
COFFEE COUNTY
| 0 0| 11 0| 3 0| 3 1| 17 0 | 0 0| 1 1| 2 3| 1 4| 4 2 | 21 0
COLQUITT COUNTY
| 6 3| 28 1| 18 1| 1 0| 53 1 | 0 0| 0 0| 1 1| 0 0| 1 0 | 54 1
COLUMBIA COUNTY
| 0 0| 9 0| 7 0| 0 0| 16 0 | 0 0| 0 0| 2 3| 0 0| 2 1 | 18 0
------------------------------------------------------------------------------------------------------------------------------------
(continued)
Page 32 Run 11/22/00
Georgia Department of Corrections Office of Planning and Analysis
Inmate statistical profile
Sample: ACTIVE PRISONERS SERVING LIFE EXCLUDING JAIL
Requestor:
Active inmates 11/22/2000
Home County by current age & sex
Statistics (CONTINUED)
|
MEN
|
WOMEN
|
| Age | Age | Age | Age | Men
| Age | Age | Age | Age |Women
|Grand
Home County
|00-21 %|22-39 %|40-54 %|55-99 %|Total % |00-21 %|22-39 %|40-54 %|55-99 %|Total % |Total %
------------------------------------------------------------------------------------------------------------------------------------
COOK COUNTY
| 0 0| 6 0| 3 0| 1 0| 10 0 | 0 0| 2 2| 0 0| 0 0| 2 1 | 12 0
COWETA COUNTY
| 3 2| 18 1| 10 1| 1 0| 32 1 | 0 0| 2 2| 1 1| 0 0| 3 1 | 35 1
CRAWFORD COUNTY
| 0 0| 1 0| 1 0| 0 0| 2 0 | 0 0| 0 0| 0 0| 0 0| 0 0 | 2 0
CRISP COUNTY
| 4 2| 12 0| 7 0| 2 1| 25 0 | 0 0| 3 3| 0 0| 0 0| 3 1 | 28 1
DADE COUNTY
| 1 1| 4 0| 2 0| 3 1| 10 0 | 0 0| 0 0| 0 0| 0 0| 0 0 | 10 0
DAWSON COUNTY
| 0 0| 2 0| 1 0| 0 0| 3 0 | 0 0| 0 0| 0 0| 0 0| 0 0 | 3 0
DECATUR COUNTY
| 3 2| 14 1| 4 0| 0 0| 21 0 | 0 0| 0 0| 0 0| 0 0| 0 0 | 21 0
DEKALB COUNTY
| 13 8| 214 8| 128 7| 25 7| 380 7 | 1 11| 4 3| 2 3| 2 8| 9 4 | 389 7
DODGE COUNTY
| 0 0| 7 0| 7 0| 0 0| 14 0 | 0 0| 0 0| 0 0| 0 0| 0 0 | 14 0
DOOLY COUNTY
| 2 1| 7 0| 4 0| 0 0| 13 0 | 0 0| 0 0| 0 0| 0 0| 0 0 | 13 0
DOUGHERTY COUNTY | 6 3| 66 2| 41 2| 2 1| 115 2 | 0 0| 5 4| 1 1| 1 4| 7 3 | 122 2
DOUGLAS COUNTY
| 1 1| 20 1| 13 1| 2 1| 36 1 | 0 0| 1 1| 1 1| 0 0| 2 1 | 38 1
EARLY COUNTY
| 0 0| 7 0| 5 0| 1 0| 13 0 | 0 0| 0 0| 0 0| 0 0| 0 0 | 13 0
ECHOLS COUNTY.
| 0 0| 0 0| 0 0| 0 0| 0 0 | 0 0| 0 0| 0 0| 0 0| 0 0 | 0 0
EFFINGHAM COUNTY | 0 0| 4 0| 3 0| 0 0| 7 0 | 0 0| 0 0| 0 0| 0 0| 0 0 | 7 0
ELBERT COUNTY
| 0 0| 11 0| 8 0| 1 0| 20 0 | 0 0| 1 1| 0 0| 0 0| 1 0 | 21 0
EMANUEL COUNTY
| 1 1| 9 0| 6 0| 1 0| 17 0 | 0 0| 0 0| 1 1| 0 0| 1 0 | 18 0
EVANS COUNTY
| 0 0| 7 0| 4 0| 1 0| 12 0 | 0 0| 0 0| 0 0| 0 0| 0 0 | 12 0
FANNIN COUNTY
| 0 0| 5 0| 3 0| 1 0| 9 0 | 0 0| 0 0| 0 0| 0 0| 0 0 | 9 0
FAYETTE COUNTY
| 0 0| 3 0| 3 0| 0 0| 6 0 | 0 0| 0 0| 0 0| 0 0| 0 0 | 6 0
FLOYD COUNTY
| 2 1| 30 1| 24 1| 1 0| 57 1 | 1 11| 3 3| 2 3| 1 4| 7 3 | 64 1
FORSYTH COUNTY
| 0 0| 6 0| 3 0| 2 1| 11 0 | 0 0| 0 0| 1 1| 0 0| 1 0 | 12 0
FRANKLIN COUNTY
| 0 0| 2 0| 4 0| 0 0| 6 0 | 0 0| 0 0| 0 0| 1 4| 1 0 | 7 0
FULTON COUNTY
| 24 14| 503 18| 349 18| 54 15| 930 18 | 1 11| 14 12| 7 9| 4 17| 26 12 | 956 18
GILMER COUNTY
| 0 0| 1 0| 3 0| 2 1| 6 0 | 0 0| 0 0| 0 0| 0 0| 0 0 | 6 0
GLASCOCK COUNTY
| 0 0| 0 0| 1 0| 0 0| 1 0 | 0 0| 0 0| 0 0| 0 0| 0 0 | 1 0
GLYNN COUNTY
| 4 2| 28 1| 28 1| 3 1| 63 1 | 0 0| 1 1| 2 3| 0 0| 3 1 | 66 1
GORDON COUNTY
| 0 0| 21 1| 12 1| 3 1| 36 1 | 0 0| 1 1| 0 0| 0 0| 1 0 | 37 1
GRADY COUNTY
| 1 1| 14 1| 7 0| 0 0| 22 0 | 0 0| 0 0| 0 0| 0 0| 0 0 | 22 0
GREENE COUNTY
| 1 1| 3 0| 3 0| 1 0| 8 0 | 0 0| 0 0| 1 1| 0 0| 1 0 | 9 0
GWINNETT COUNTY
| 2 1| 66 2| 40 2| 9 2| 117 2 | 0 0| 3 3| 2 3| 0 0| 5 2 | 122 2
HABERSHAM COUNTY | 0 0| 9 0| 7 0| 0 0| 16 0 | 0 0| 0 0| 0 0| 0 0| 0 0 | 16 0
HALL COUNTY
| 2 1| 30 1| 37 2| 11 3| 80 2 | 1 11| 2 2| 1 1| 1 4| 5 2 | 85 2
HANCOCK COUNTY
| 1 1| 2 0| 2 0| 1 0| 6 0 | 0 0| 0 0| 1 1| 0 0| 1 0 | 7 0
HARALSON COUNTY
| 0 0| 1 0| 2 0| 1 0| 4 0 | 0 0| 1 1| 0 0| 0 0| 1 0 | 5 0
------------------------------------------------------------------------------------------------------------------------------------
(continued)
Page 33 Run 11/22/00
Georgia Department of Corrections Office of Planning and Analysis
Inmate statistical profile
Sample: ACTIVE PRISONERS SERVING LIFE EXCLUDING JAIL
Requestor:
Active inmates 11/22/2000
Home County by current age & sex
Statistics (CONTINUED)
|
MEN
|
WOMEN
|
| Age | Age | Age | Age | Men
| Age | Age | Age | Age |Women
|Grand
Home County
|00-21 %|22-39 %|40-54 %|55-99 %|Total % |00-21 %|22-39 %|40-54 %|55-99 %|Total % |Total %
------------------------------------------------------------------------------------------------------------------------------------
HARRIS COUNTY
| 1 1| 6 0| 2 0| 0 0| 9 0 | 0 0| 0 0| 0 0| 0 0| 0 0 | 9 0
HART COUNTY
| 0 0| 2 0| 2 0| 0 0| 4 0 | 0 0| 0 0| 1 1| 0 0| 1 0 | 5 0
HEARD COUNTY
| 0 0| 1 0| 1 0| 2 1| 4 0 | 0 0| 0 0| 0 0| 0 0| 0 0 | 4 0
HENRY COUNTY
| 1 1| 19 1| 8 0| 5 1| 33 1 | 0 0| 1 1| 2 3| 0 0| 3 1 | 36 1
HOUSTON COUNTY
| 0 0| 41 1| 22 1| 5 1| 68 1 | 0 0| 3 3| 4 5| 0 0| 7 3 | 75 1
IRWIN COUNTY
| 1 1| 5 0| 3 0| 0 0| 9 0 | 0 0| 0 0| 0 0| 0 0| 0 0 | 9 0
JACKSON COUNTY
| 1 1| 9 0| 11 1| 5 1| 26 0 | 0 0| 0 0| 0 0| 0 0| 0 0 | 26 0
JASPER COUNTY
| 2 1| 8 0| 0 0| 1 0| 11 0 | 0 0| 0 0| 0 0| 0 0| 0 0 | 11 0
JEFF DAVIS COUNTY | 1 1| 5 0| 2 0| 1 0| 9 0 | 0 0| 0 0| 0 0| 0 0| 0 0 | 9 0
JEFFERSON COUNTY | 0 0| 5 0| 2 0| 2 1| 9 0 | 0 0| 1 1| 0 0| 0 0| 1 0 | 10 0
JENKINS COUNTY
| 0 0| 0 0| 6 0| 0 0| 6 0 | 0 0| 0 0| 0 0| 0 0| 0 0 | 6 0
JOHNSON COUNTY
| 0 0| 3 0| 2 0| 0 0| 5 0 | 0 0| 0 0| 0 0| 0 0| 0 0 | 5 0
JONES COUNTY
| 0 0| 0 0| 4 0| 1 0| 5 0 | 0 0| 1 1| 0 0| 0 0| 1 0 | 6 0
LAMAR COUNTY
| 0 0| 9 0| 9 0| 3 1| 21 0 | 0 0| 0 0| 1 1| 0 0| 1 0 | 22 0
LANIER COUNTY
| 0 0| 0 0| 0 0| 0 0| 0 0 | 0 0| 0 0| 0 0| 0 0| 0 0 | 0 0
LAURENS COUNTY
| 1 1| 15 1| 7 0| 2 1| 25 0 | 0 0| 1 1| 1 1| 0 0| 2 1 | 27 0
LEE COUNTY
| 0 0| 3 0| 0 0| 0 0| 3 0 | 0 0| 0 0| 0 0| 0 0| 0 0 | 3 0
LIBERTY COUNTY
| 0 0| 24 1| 9 0| 4 1| 37 1 | 0 0| 2 2| 0 0| 0 0| 2 1 | 39 1
LINCOLN COUNTY
| 1 1| 1 0| 3 0| 0 0| 5 0 | 0 0| 0 0| 0 0| 0 0| 0 0 | 5 0
LONG COUNTY
| 0 0| 5 0| 2 0| 1 0| 8 0 | 0 0| 1 1| 0 0| 0 0| 1 0 | 9 0
LOWNDES COUNTY
| 0 0| 34 1| 21 1| 3 1| 58 1 | 0 0| 0 0| 2 3| 1 4| 3 1 | 61 1
LUMPKIN COUNTY
| 2 1| 5 0| 4 0| 1 0| 12 0 | 0 0| 0 0| 0 0| 0 0| 0 0 | 12 0
MACON COUNTY
| 0 0| 12 0| 5 0| 0 0| 17 0 | 0 0| 0 0| 1 1| 0 0| 1 0 | 18 0
MADISON COUNTY
| 0 0| 7 0| 6 0| 2 1| 15 0 | 0 0| 2 2| 0 0| 0 0| 2 1 | 17 0
MARION COUNTY
| 1 1| 1 0| 1 0| 0 0| 3 0 | 0 0| 0 0| 0 0| 0 0| 0 0 | 3 0
MCDUFFIE COUNTY
| 0 0| 22 1| 10 1| 4 1| 36 1 | 1 11| 1 1| 0 0| 0 0| 2 1 | 38 1
MCINTOSH COUNTY
| 1 1| 4 0| 3 0| 0 0| 8 0 | 0 0| 0 0| 0 0| 0 0| 0 0 | 8 0
MERIWETHER COUNTY | 1 1| 8 0| 7 0| 2 1| 18 0 | 0 0| 1 1| 0 0| 1 4| 2 1 | 20 0
MILLER COUNTY
| 0 0| 3 0| 3 0| 0 0| 6 0 | 0 0| 0 0| 0 0| 0 0| 0 0 | 6 0
MITCHELL COUNTY
| 0 0| 12 0| 11 1| 3 1| 26 0 | 0 0| 1 1| 0 0| 0 0| 1 0 | 27 0
MONROE COUNTY
| 0 0| 11 0| 3 0| 0 0| 14 0 | 0 0| 0 0| 0 0| 0 0| 0 0 | 14 0
MONTGOMERY COUNTY | 0 0| 0 0| 0 0| 0 0| 0 0 | 0 0| 1 1| 0 0| 0 0| 1 0 | 1 0
MORGAN COUNTY
| 0 0| 8 0| 2 0| 0 0| 10 0 | 0 0| 0 0| 0 0| 0 0| 0 0 | 10 0
MURRAY COUNTY
| 2 1| 6 0| 4 0| 4 1| 16 0 | 0 0| 1 1| 0 0| 0 0| 1 0 | 17 0
MUSCOGEE COUNTY
| 5 3| 68 2| 59 3| 10 3| 142 3 | 0 0| 3 3| 3 4| 0 0| 6 3 | 148 3
------------------------------------------------------------------------------------------------------------------------------------
(continued)
Page 34 Run 11/22/00
Georgia Department of Corrections Office of Planning and Analysis
Inmate statistical profile
Sample: ACTIVE PRISONERS SERVING LIFE EXCLUDING JAIL
Requestor:
Active inmates 11/22/2000
Home County by current age & sex
Statistics (CONTINUED)
|
MEN
|
WOMEN
|
| Age | Age | Age | Age | Men
| Age | Age | Age | Age |Women
|Grand
Home County
|00-21 %|22-39 %|40-54 %|55-99 %|Total % |00-21 %|22-39 %|40-54 %|55-99 %|Total % |Total %
------------------------------------------------------------------------------------------------------------------------------------
NEWTON COUNTY
| 1 1| 38 1| 11 1| 3 1| 53 1 | 0 0| 2 2| 0 0| 1 4| 3 1 | 56 1
OCONEE COUNTY
| 0 0| 3 0| 2 0| 0 0| 5 0 | 0 0| 0 0| 1 1| 0 0| 1 0 | 6 0
OGLETHORPE COUNTY | 0 0| 3 0| 1 0| 0 0| 4 0 | 0 0| 0 0| 0 0| 0 0| 0 0 | 4 0
PAULDING COUNTY
| 0 0| 9 0| 5 0| 2 1| 16 0 | 0 0| 0 0| 1 1| 1 4| 2 1 | 18 0
PEACH COUNTY
| 0 0| 7 0| 2 0| 0 0| 9 0 | 0 0| 1 1| 0 0| 0 0| 1 0 | 10 0
PICKENS COUNTY
| 0 0| 3 0| 0 0| 0 0| 3 0 | 0 0| 0 0| 1 1| 0 0| 1 0 | 4 0
PIERCE COUNTY
| 2 1| 2 0| 2 0| 0 0| 6 0 | 0 0| 0 0| 0 0| 0 0| 0 0 | 6 0
PIKE COUNTY
| 0 0| 1 0| 0 0| 0 0| 1 0 | 0 0| 0 0| 0 0| 0 0| 0 0 | 1 0
POLK COUNTY
| 1 1| 12 0| 5 0| 3 1| 21 0 | 0 0| 0 0| 0 0| 0 0| 0 0 | 21 0
PULASKI COUNTY
| 0 0| 4 0| 3 0| 0 0| 7 0 | 0 0| 1 1| 0 0| 0 0| 1 0 | 8 0
PUTNAM COUNTY
| 0 0| 15 1| 13 1| 1 0| 29 1 | 0 0| 0 0| 0 0| 0 0| 0 0 | 29 1
QUITMAN COUNTY
| 0 0| 2 0| 0 0| 0 0| 2 0 | 0 0| 0 0| 0 0| 0 0| 0 0 | 2 0
RABUN COUNTY
| 0 0| 5 0| 3 0| 0 0| 8 0 | 0 0| 0 0| 0 0| 0 0| 0 0 | 8 0
RANDOLPH COUNTY
| 0 0| 3 0| 3 0| 1 0| 7 0 | 0 0| 0 0| 0 0| 0 0| 0 0 | 7 0
RICHMOND COUNTY
| 13 8| 148 5| 65 3| 8 2| 234 4 | 0 0| 8 7| 8 10| 1 4| 17 8 | 251 5
ROCKDALE COUNTY
| 1 1| 10 0| 7 0| 5 1| 23 0 | 0 0| 1 1| 0 0| 0 0| 1 0 | 24 0
SCHLEY COUNTY
| 0 0| 2 0| 2 0| 0 0| 4 0 | 0 0| 0 0| 0 0| 0 0| 0 0 | 4 0
SCREVEN COUNTY
| 0 0| 3 0| 2 0| 2 1| 7 0 | 0 0| 0 0| 0 0| 0 0| 0 0 | 7 0
SEMINOLE COUNTY
| 1 1| 5 0| 5 0| 1 0| 12 0 | 0 0| 1 1| 0 0| 0 0| 1 0 | 13 0
SPALDING COUNTY
| 3 2| 35 1| 22 1| 5 1| 65 1 | 1 11| 1 1| 1 1| 1 4| 4 2 | 69 1
STEPHENS COUNTY
| 0 0| 5 0| 6 0| 4 1| 15 0 | 0 0| 0 0| 0 0| 0 0| 0 0 | 15 0
STEWART COUNTY
| 0 0| 2 0| 2 0| 0 0| 4 0 | 0 0| 0 0| 0 0| 0 0| 0 0 | 4 0
SUMTER COUNTY
| 0 0| 3 0| 15 1| 2 1| 20 0 | 0 0| 0 0| 1 1| 0 0| 1 0 | 21 0
TALBOT COUNTY
| 1 1| 3 0| 1 0| 0 0| 5 0 | 0 0| 0 0| 1 1| 0 0| 1 0 | 6 0
TALIAFERRO COUNTY | 0 0| 0 0| 1 0| 0 0| 1 0 | 0 0| 0 0| 0 0| 0 0| 0 0 | 1 0
TATTNALL COUNTY
| 1 1| 16 1| 4 0| 0 0| 21 0 | 0 0| 0 0| 1 1| 0 0| 1 0 | 22 0
TAYLOR COUNTY
| 1 1| 11 0| 3 0| 1 0| 16 0 | 0 0| 0 0| 0 0| 0 0| 0 0 | 16 0
TELFAIR COUNTY
| 1 1| 6 0| 3 0| 0 0| 10 0 | 0 0| 0 0| 1 1| 0 0| 1 0 | 11 0
TERRELL COUNTY
| 2 1| 11 0| 1 0| 0 0| 14 0 | 0 0| 0 0| 0 0| 0 0| 0 0 | 14 0
THOMAS COUNTY
| 2 1| 14 1| 16 1| 4 1| 36 1 | 0 0| 1 1| 1 1| 0 0| 2 1 | 38 1
TIFT COUNTY
| 3 2| 28 1| 21 1| 4 1| 56 1 | 0 0| 0 0| 0 0| 1 4| 1 0 | 57 1
TOOMBS COUNTY
| 2 1| 12 0| 11 1| 0 0| 25 0 | 0 0| 1 1| 0 0| 0 0| 1 0 | 26 0
TOWNS COUNTY
| 0 0| 0 0| 0 0| 0 0| 0 0 | 0 0| 0 0| 0 0| 0 0| 0 0 | 0 0
TREUTLEN COUNTY
| 0 0| 2 0| 3 0| 0 0| 5 0 | 0 0| 0 0| 0 0| 0 0| 0 0 | 5 0
TROUP COUNTY
| 2 1| 21 1| 17 1| 5 1| 45 1 | 0 0| 1 1| 1 1| 0 0| 2 1 | 47 1
------------------------------------------------------------------------------------------------------------------------------------
(continued)
Page 35 Run 11/22/00
Georgia Department of Corrections Office of Planning and Analysis
Inmate statistical profile
Sample: ACTIVE PRISONERS SERVING LIFE EXCLUDING JAIL
Requestor:
Active inmates 11/22/2000
Home County by current age & sex
Statistics (CONTINUED)
|
MEN
|
WOMEN
|
| Age | Age | Age | Age | Men
| Age | Age | Age | Age |Women
|Grand
Home County
|00-21 %|22-39 %|40-54 %|55-99 %|Total % |00-21 %|22-39 %|40-54 %|55-99 %|Total % |Total %
------------------------------------------------------------------------------------------------------------------------------------
TURNER COUNTY
| 0 0| 8 0| 4 0| 0 0| 12 0 | 0 0| 0 0| 0 0| 0 0| 0 0 | 12 0
TWIGGS COUNTY
| 0 0| 5 0| 4 0| 0 0| 9 0 | 0 0| 0 0| 0 0| 0 0| 0 0 | 9 0
UNION COUNTY
| 0 0| 0 0| 0 0| 0 0| 0 0 | 0 0| 0 0| 0 0| 0 0| 0 0 | 0 0
UPSON COUNTY
| 1 1| 6 0| 5 0| 0 0| 12 0 | 0 0| 0 0| 1 1| 0 0| 1 0 | 13 0
WALKER COUNTY
| 1 1| 15 1| 7 0| 3 1| 26 0 | 0 0| 1 1| 1 1| 0 0| 2 1 | 28 1
WALTON COUNTY
| 2 1| 28 1| 17 1| 3 1| 50 1 | 0 0| 1 1| 0 0| 0 0| 1 0 | 51 1
WARE COUNTY
| 1 1| 14 1| 14 1| 2 1| 31 1 | 0 0| 0 0| 0 0| 0 0| 0 0 | 31 1
WARREN COUNTY
| 0 0| 3 0| 5 0| 1 0| 9 0 | 0 0| 0 0| 0 0| 0 0| 0 0 | 9 0
WASHINGTON COUNTY | 0 0| 13 0| 8 0| 0 0| 21 0 | 1 11| 1 1| 0 0| 0 0| 2 1 | 23 0
WAYNE COUNTY
| 0 0| 7 0| 13 1| 2 1| 22 0 | 0 0| 1 1| 0 0| 0 0| 1 0 | 23 0
WEBSTER COUNTY
| 0 0| 2 0| 0 0| 0 0| 2 0 | 0 0| 0 0| 0 0| 0 0| 0 0 | 2 0
WHEELER COUNTY
| 0 0| 1 0| 2 0| 2 1| 5 0 | 0 0| 0 0| 0 0| 0 0| 0 0 | 5 0
WHITE COUNTY
| 0 0| 3 0| 3 0| 1 0| 7 0 | 0 0| 0 0| 0 0| 0 0| 0 0 | 7 0
WHITFIELD COUNTY | 0 0| 11 0| 24 1| 6 2| 41 1 | 0 0| 2 2| 0 0| 0 0| 2 1 | 43 1
WILCOX COUNTY
| 0 0| 0 0| 6 0| 0 0| 6 0 | 0 0| 0 0| 0 0| 0 0| 0 0 | 6 0
WILKES COUNTY
| 0 0| 2 0| 3 0| 2 1| 7 0 | 0 0| 0 0| 0 0| 0 0| 0 0 | 7 0
WILKINSON COUNTY | 0 0| 7 0| 2 0| 0 0| 9 0 | 0 0| 0 0| 0 0| 0 0| 0 0 | 9 0
WORTH COUNTY
| 2 1| 13 0| 2 0| 0 0| 17 0 | 0 0| 1 1| 0 0| 0 0| 1 0 | 18 0
OUT OF STATE
| 0 1| 11 0| 56 3| 15 4| 82 2 | 0 0| 0 1| 0 0| 0 0| 0 0 | 82 2
------------------------------------------------------------------------------------------------------------------------------------
Total reported
| 172 100| 2752 100| 1919 100| 371 100| 5214 100 | 9 100| 115 100| 77 100| 24 100| 225 100 | 5439 100
|
|
|
|
|
|
|
|
|
|
|
Percent reported |
92.0|
90.8|
92.4|
91.2|
91.4 |
90.0|
92.7|
90.6|
96.0|
92.2 |
91.5
|
|
|
|
|
|
|
|
|
|
|
|
|
|
|
|
|
|
|
|
|
|
UNKNOWN
| 15 | 279 | 158 | 36 | 488
| 1 | 9 | 8 | 1 | 19
| 507
------------------------------------------------------------------------------------------------------------------------------------
Total
| 187 | 3031 | 2077 | 407 | 5702
| 10 | 124 | 85 | 25 | 244
| 5946
Georgia Department of Corrections
Page 36 Run 11/22/00
Office of Planning and Analysis
Inmate statistical profile
Sample: ACTIVE PRISONERS SERVING LIFE EXCLUDING JAIL
Requestor: Statistics
Active inmates 11/22/2000
Prison Sentence In Years by current age & sex
|
MEN
|
WOMEN
|
| Age | Age | Age | Age | Men
| Age | Age | Age | Age |Women
|Grand
Sentence In Years |00-21 %|22-39 %|40-54 %|55-99 %|Total % |00-21 %|22-39 %|40-54 %|55-99 %|Total % |Total %
------------------------------------------------------------------------------------------------------------------------------------
0-1
| 0 0| 0 0| 0 0| 0 0| 0 0 | 0 0| 0 0| 0 0| 0 0| 0 0 | 0 0
1.1-2
| 0 0| 0 0| 0 0| 0 0| 0 0 | 0 0| 0 0| 0 0| 0 0| 0 0 | 0 0
2.1-3
| 0 0| 0 0| 0 0| 0 0| 0 0 | 0 0| 0 0| 0 0| 0 0| 0 0 | 0 0
3.1-4
| 0 0| 0 0| 0 0| 0 0| 0 0 | 0 0| 0 0| 0 0| 0 0| 0 0 | 0 0
4.1-5
| 0 0| 0 0| 0 0| 0 0| 0 0 | 0 0| 0 0| 0 0| 0 0| 0 0 | 0 0
5.1-6
| 0 0| 0 0| 0 0| 0 0| 0 0 | 0 0| 0 0| 0 0| 0 0| 0 0 | 0 0
6.1-7
| 0 0| 0 0| 0 0| 0 0| 0 0 | 0 0| 0 0| 0 0| 0 0| 0 0 | 0 0
7.1-8
| 0 0| 0 0| 0 0| 0 0| 0 0 | 0 0| 0 0| 0 0| 0 0| 0 0 | 0 0
8.1-9
| 0 0| 0 0| 0 0| 0 0| 0 0 | 0 0| 0 0| 0 0| 0 0| 0 0 | 0 0
9.1-10
| 0 0| 0 0| 0 0| 0 0| 0 0 | 0 0| 0 0| 0 0| 0 0| 0 0 | 0 0
10.1-12
| 0 0| 0 0| 0 0| 0 0| 0 0 | 0 0| 0 0| 0 0| 0 0| 0 0 | 0 0
12.1-15
| 0 0| 0 0| 0 0| 0 0| 0 0 | 0 0| 0 0| 0 0| 0 0| 0 0 | 0 0
15.1-20
| 0 0| 0 0| 0 0| 0 0| 0 0 | 0 0| 0 0| 0 0| 0 0| 0 0 | 0 0
20.1-OVER
| 0 0| 0 0| 0 0| 0 0| 0 0 | 0 0| 0 0| 0 0| 0 0| 0 0 | 0 0
LIFE
| 187 100| 3031 100| 2077 100| 407 100| 5702 100 | 10 100| 124 100| 85 100| 25 100| 244 100 | 5946 100
DEATH
| 0 0| 0 0| 0 0| 0 0| 0 0 | 0 0| 0 0| 0 0| 0 0| 0 0 | 0 0
LIFE W/O PAROLE
| 0 0| 0 0| 0 0| 0 0| 0 0 | 0 0| 0 0| 0 0| 0 0| 0 0 | 0 0
YOUTHFUL OFFENDERS | 0 0| 0 0| 0 0| 0 0| 0 0 | 0 0| 0 0| 0 0| 0 0| 0 0 | 0 0
------------------------------------------------------------------------------------------------------------------------------------
Total reported
| 187 100| 3031 100| 2077 100| 407 100| 5702 100 | 10 100| 124 100| 85 100| 25 100| 244 100 | 5946 100
|
|
|
|
|
|
|
|
|
|
|
Percent reported | 100.0| 100.0| 100.0| 100.0| 100.0 | 100.0| 100.0| 100.0| 100.0| 100.0 | 100.0
|
|
|
|
|
|
|
|
|
|
|
|
|
|
|
|
|
|
|
|
|
|
NOT REPORTED
|0|0|0|0|0
|0|0|0|0|0
|0
------------------------------------------------------------------------------------------------------------------------------------
Total
| 187 | 3031 | 2077 | 407 | 5702
| 10 | 124 | 85 | 25 | 244
| 5946
|
|
|
|
|
|
|
|
|
|
|
|
|
|
|
|
|
|
|
|
|
|
|
|
|
|
|
|
|
|
|
|
|
|
|
|
|
|
|
|
|
|
|
|
|
|
|
|
|
|
|
|
|
|
|
AVG EXCLUDING
|
|
|
|
|
|
|
|
|
|
|
LIFE, DEATH, YO
| .00 | .00 | .00 | .00 | .00 | .00 | .00 | .00 | .00 | .00 | .00
|
|
|
|
|
|
|
|
|
|
|
|
|
|
|
|
|
|
|
|
|
|
|
|
|
|
|
|
|
|
|
|
|
|
|
|
|
|
|
|
|
|
|
|
|
|
|
|
|
|
|
|
|
|
|
AVG INCLUDING
|
|
|
|
|
|
|
|
|
|
|
LIFE=21, YO=3 YRS | 21.00 | 21.00 | 21.00 | 21.00 | 21.00 | 21.00 | 21.00 | 21.00 | 21.00 | 21.00 | 21.00
Page 37 Run 11/22/00
Georgia Department of Corrections Office of Planning and Analysis
Inmate statistical profile
Sample: ACTIVE PRISONERS SERVING LIFE EXCLUDING JAIL
Requestor: Statistics
Active inmates 11/22/2000
Probation To Follow Prison by current age & sex
|
MEN
|
WOMEN
|
| Age | Age | Age | Age | Men
| Age | Age | Age | Age |Women
|Grand
Prob After Prison |00-21 %|22-39 %|40-54 %|55-99 %|Total % |00-21 %|22-39 %|40-54 %|55-99 %|Total % |Total %
------------------------------------------------------------------------------------------------------------------------------------
PROBATION TO FOLLOW | 11 6| 92 3| 63 3| 6 1| 172 3 | 0 0| 3 2| 3 4| 1 4| 7 3 | 179 3
NO PROBATION
| 176 94| 2939 97| 2014 97| 401 99| 5530 97 | 10 100| 121 98| 82 96| 24 96| 237 97 | 5767 97
------------------------------------------------------------------------------------------------------------------------------------
Total reported
| 187 100| 3031 100| 2077 100| 407 100| 5702 100 | 10 100| 124 100| 85 100| 25 100| 244 100 | 5946 100
|
|
|
|
|
|
|
|
|
|
|
Percent reported | 100.0| 100.0| 100.0| 100.0| 100.0 | 100.0| 100.0| 100.0| 100.0| 100.0 | 100.0
|
|
|
|
|
|
|
|
|
|
|
|
|
|
|
|
|
|
|
|
|
|
NOT REPORTED
|0|0|0|0|0
|0|0|0|0|0
|0
------------------------------------------------------------------------------------------------------------------------------------
Total
| 187 | 3031 | 2077 | 407 | 5702
| 10 | 124 | 85 | 25 | 244
| 5946
Page 38 Run 11/22/00
Georgia Department of Corrections Office of Planning and Analysis
Inmate statistical profile
Sample: ACTIVE PRISONERS SERVING LIFE EXCLUDING JAIL
Requestor: Statistics
Active inmates 11/22/2000
Admission Type by current age & sex
|
MEN
|
WOMEN
|
| Age | Age | Age | Age | Men
| Age | Age | Age | Age |Women
|Grand
Admission Type
|00-21 %|22-39 %|40-54 %|55-99 %|Total % |00-21 %|22-39 %|40-54 %|55-99 %|Total % |Total %
------------------------------------------------------------------------------------------------------------------------------------
COMMITTED FROM COURT| 184 98| 2460 81| 1524 73| 294 72| 4462 78 | 10 100| 114 92| 72 85| 25 100| 221 91 | 4683 79
RETURN APPEAL/BOND | 0 0| 0 0| 1 0| 0 0| 1 0 | 0 0| 0 0| 0 0| 0 0| 0 0 | 1 0
PAROLE REV/NEW SENT | 0 0| 363 12| 340 16| 72 18| 775 14 | 0 0| 6 5| 8 9| 0 0| 14 6 | 789 13
PAR REV/NO NEW SENT | 0 0| 20 1| 68 3| 8 2| 96 2 | 0 0| 1 1| 1 1| 0 0| 2 1 | 98 2
PROB VIOL/TOTAL REV | 0 0| 0 0| 0 0| 0 0| 0 0 | 0 0| 0 0| 0 0| 0 0| 0 0 | 0 0
PROB VIOL/PARTIAL | 0 0| 36 1| 41 2| 2 0| 79 1 | 0 0| 0 0| 2 2| 0 0| 2 1 | 81 1
ADMIT FM OTHER CUST | 0 0| 1 0| 2 0| 4 1| 7 0 | 0 0| 0 0| 0 0| 0 0| 0 0 | 7 0
SHOCK INCARCERATION | 0 0| 0 0| 0 0| 0 0| 0 0 | 0 0| 0 0| 0 0| 0 0| 0 0 | 0 0
PROB REV/REMAINDER | 2 1| 116 4| 44 2| 7 2| 169 3 | 0 0| 3 2| 2 2| 0 0| 5 2 | 174 3
NEW SENT/PAR REV PND| 0 0| 2 0| 4 0| 1 0| 7 0 | 0 0| 0 0| 0 0| 0 0| 0 0 | 7 0
LIFE W/O PAROLE
| 1 1| 9 0| 3 0| 0 0| 13 0 | 0 0| 0 0| 0 0| 0 0| 0 0 | 13 0
PAROLE REV BOOT CAMP| 0 0| 2 0| 1 0| 0 0| 3 0 | 0 0| 0 0| 0 0| 0 0| 0 0 | 3 0
PAR REV/RSN UNKNOWN | 0 0| 18 1| 39 2| 19 5| 76 1 | 0 0| 0 0| 0 0| 0 0| 0 0 | 76 1
PROBATION/PAROLE REV| 0 0| 0 0| 0 0| 0 0| 0 0 | 0 0| 0 0| 0 0| 0 0| 0 0 | 0 0
PB PAROLE RESCINDED | 0 0| 0 0| 0 0| 0 0| 0 0 | 0 0| 0 0| 0 0| 0 0| 0 0 | 0 0
PROB REVOCATION/SC | 0 0| 0 0| 0 0| 0 0| 0 0 | 0 0| 0 0| 0 0| 0 0| 0 0 | 0 0
PAR REV/REVOC CENTER| 0 0| 3 0| 9 0| 0 0| 12 0 | 0 0| 0 0| 0 0| 0 0| 0 0 | 12 0
INFORMATION ONLY | 0 0| 0 0| 0 0| 0 0| 0 0 | 0 0| 0 0| 0 0| 0 0| 0 0 | 0 0
INCOMPLETE SENT PKG | 0 0| 0 0| 0 0| 0 0| 0 0 | 0 0| 0 0| 0 0| 0 0| 0 0 | 0 0
HANCOCK REVOC CENTER| 0 0| 0 0| 0 0| 0 0| 0 0 | 0 0| 0 0| 0 0| 0 0| 0 0 | 0 0
WHITWORTH DETENTION | 0 0| 0 0| 1 0| 0 0| 1 0 | 0 0| 0 0| 0 0| 0 0| 0 0 | 1 0
DCYS AT RISK
| 0 0| 0 0| 0 0| 0 0| 0 0 | 0 0| 0 0| 0 0| 0 0| 0 0 | 0 0
OTHER
| 0 0| 0 0| 0 0| 0 0| 0 0 | 0 0| 0 0| 0 0| 0 0| 0 0 | 0 0
------------------------------------------------------------------------------------------------------------------------------------
Total reported
| 187 100| 3030 100| 2077 100| 407 100| 5701 100 | 10 100| 124 100| 85 100| 25 100| 244 100 | 5945 100
|
|
|
|
|
|
|
|
|
|
|
Percent reported | 100.0| 100.0| 100.0| 100.0| 100.0 | 100.0| 100.0| 100.0| 100.0| 100.0 | 100.0
|
|
|
|
|
|
|
|
|
|
|
|
|
|
|
|
|
|
|
|
|
|
UNKNOWN
|0|1|0|0|1
|0|0|0|0|0
|1
------------------------------------------------------------------------------------------------------------------------------------
Total
| 187 | 3031 | 2077 | 407 | 5702
| 10 | 124 | 85 | 25 | 244
| 5946
Page 39 Run 11/22/00
Georgia Department of Corrections Office of Planning and Analysis
Inmate statistical profile
Sample: ACTIVE PRISONERS SERVING LIFE EXCLUDING JAIL
Requestor: Statistics
Active inmates 11/22/2000
Release Type by current age & sex
|
MEN
|
WOMEN
|
| Age | Age | Age | Age | Men
| Age | Age | Age | Age |Women
|Grand
Release Type
|00-21 %|22-39 %|40-54 %|55-99 %|Total % |00-21 %|22-39 %|40-54 %|55-99 %|Total % |Total %
------------------------------------------------------------------------------------------------------------------------------------
PAROLE
| 0 0| 1 0| 0 0| 0 0| 1 0 | 0 0| 0 0| 0 0| 0 0| 0 0 | 1 0
Active
| 187 100| 3031 100| 2077 100| 407 100| 5702 100 | 10 100| 124 100| 85 100| 25 100| 244 100 | 5946 100
------------------------------------------------------------------------------------------------------------------------------------
Total
| 187 | 3031 | 2077 | 407 | 5702
| 10 | 124 | 85 | 25 | 244
| 5946
Page 40 Run 11/22/00
Georgia Department of Corrections Office of Planning and Analysis
Inmate statistical profile
Sample: ACTIVE PRISONERS SERVING LIFE EXCLUDING JAIL
Requestor: Statistics
Active inmates 11/22/2000
Inst By Group by current age & sex
|
MEN
|
WOMEN
|
| Age | Age | Age | Age | Men
| Age | Age | Age | Age |Women
|Grand
Inst By Group
|00-21 %|22-39 %|40-54 %|55-99 %|Total % |00-21 %|22-39 %|40-54 %|55-99 %|Total % |Total %
------------------------------------------------------------------------------------------------------------------------------------
County jails
| 0 0| 0 0| 0 0| 0 0| 0 0 | 0 0| 0 0| 0 0| 0 0| 0 0 | 0 0
Transitional centers| 0 0| 12 0| 20 1| 5 1| 37 1 | 0 0| 2 2| 0 0| 1 4| 3 1 | 40 1
County camps
| 0 0| 13 0| 9 0| 4 1| 26 0 | 0 0| 0 0| 0 0| 0 0| 0 0 | 26 0
Inmate boot camps | 0 0| 0 0| 0 0| 0 0| 0 0 | 0 0| 0 0| 0 0| 0 0| 0 0 | 0 0
State prisons
| 187 100| 2903 96| 1977 95| 387 95| 5454 96 | 10 100| 122 98| 85 100| 24 96| 241 99 | 5695 96
Private prisons
| 0 0| 103 3| 71 3| 11 3| 185 3 | 0 0| 0 0| 0 0| 0 0| 0 0 | 185 3
Other
| 0 0| 0 0| 0 0| 0 0| 0 0 | 0 0| 0 0| 0 0| 0 0| 0 0 | 0 0
------------------------------------------------------------------------------------------------------------------------------------
Total reported
| 187 100| 3031 100| 2077 100| 407 100| 5702 100 | 10 100| 124 100| 85 100| 25 100| 244 100 | 5946 100
|
|
|
|
|
|
|
|
|
|
|
Percent reported | 100.0| 100.0| 100.0| 100.0| 100.0 | 100.0| 100.0| 100.0| 100.0| 100.0 | 100.0
|
|
|
|
|
|
|
|
|
|
|
|
|
|
|
|
|
|
|
|
|
|
Not reported
|0|0|0|0|0
|0|0|0|0|0
|0
------------------------------------------------------------------------------------------------------------------------------------
Total
| 187 | 3031 | 2077 | 407 | 5702
| 10 | 124 | 85 | 25 | 244
| 5946
Page 41 Run 11/22/00
Georgia Department of Corrections Office of Planning and Analysis
Inmate statistical profile
Sample: ACTIVE PRISONERS SERVING LIFE EXCLUDING JAIL
Requestor: Statistics
Active inmates 11/22/2000
Institution by current age & sex
|
MEN
|
WOMEN
|
| Age | Age | Age | Age | Men
| Age | Age | Age | Age |Women
|Grand
Institution
|00-21 %|22-39 %|40-54 %|55-99 %|Total % |00-21 %|22-39 %|40-54 %|55-99 %|Total % |Total %
------------------------------------------------------------------------------------------------------------------------------------
Albany Trans Ctr | 0 0| 1 0| 1 0| 0 0| 2 0 | 0 0| 0 0| 0 0| 0 0| 0 0 | 2 0
Atlanta Trans Ctr(M)| 0 0| 8 0| 12 1| 4 1| 24 0 | 0 0| 0 0| 0 0| 0 0| 0 0 | 24 0
Macon Trans Ctr
| 0 0| 1 0| 2 0| 0 0| 3 0 | 0 0| 0 0| 0 0| 0 0| 0 0 | 3 0
Metro Trans Ctr (W) | 0 0| 0 0| 0 0| 0 0| 0 0 | 0 0| 1 1| 0 0| 1 4| 2 1 | 2 0
Savannah Trans Ctr | 0 0| 2 0| 5 0| 1 0| 8 0 | 0 0| 0 0| 0 0| 0 0| 0 0 | 8 0
Savannah Womens TC | 0 0| 0 0| 0 0| 0 0| 0 0 | 0 0| 1 1| 0 0| 0 0| 1 0 | 1 0
Carroll County
| 0 0| 0 0| 0 0| 1 0| 1 0 | 0 0| 0 0| 0 0| 0 0| 0 0 | 1 0
Clarke County
| 0 0| 1 0| 0 0| 0 0| 1 0 | 0 0| 0 0| 0 0| 0 0| 0 0 | 1 0
Colquitt County
| 0 0| 0 0| 1 0| 0 0| 1 0 | 0 0| 0 0| 0 0| 0 0| 0 0 | 1 0
Coweta County
| 0 0| 3 0| 1 0| 0 0| 4 0 | 0 0| 0 0| 0 0| 0 0| 0 0 | 4 0
Floyd County
| 0 0| 0 0| 1 0| 0 0| 1 0 | 0 0| 0 0| 0 0| 0 0| 0 0 | 1 0
Hall County
| 0 0| 2 0| 2 0| 0 0| 4 0 | 0 0| 0 0| 0 0| 0 0| 0 0 | 4 0
Jackson County
| 0 0| 1 0| 2 0| 1 0| 4 0 | 0 0| 0 0| 0 0| 0 0| 0 0 | 4 0
Jefferson County | 0 0| 2 0| 1 0| 0 0| 3 0 | 0 0| 0 0| 0 0| 0 0| 0 0 | 3 0
Mitchell County
| 0 0| 0 0| 1 0| 0 0| 1 0 | 0 0| 0 0| 0 0| 0 0| 0 0 | 1 0
Screven County
| 0 0| 1 0| 0 0| 0 0| 1 0 | 0 0| 0 0| 0 0| 0 0| 0 0 | 1 0
Stewart County
| 0 0| 0 0| 0 0| 1 0| 1 0 | 0 0| 0 0| 0 0| 0 0| 0 0 | 1 0
Terrell County
| 0 0| 0 0| 0 0| 1 0| 1 0 | 0 0| 0 0| 0 0| 0 0| 0 0 | 1 0
Clayton County
| 0 0| 3 0| 0 0| 0 0| 3 0 | 0 0| 0 0| 0 0| 0 0| 0 0 | 3 0
Ware Prison
| 15 8| 202 7| 101 5| 10 2| 328 6 | 0 0| 0 0| 0 0| 0 0| 0 0 | 328 6
Lowndes Prison
| 0 0| 3 0| 8 0| 1 0| 12 0 | 0 0| 0 0| 0 0| 0 0| 0 0 | 12 0
Dodge Prison
| 0 0| 59 2| 68 3| 6 1| 133 2 | 0 0| 0 0| 0 0| 0 0| 0 0 | 133 2
Phillips Prison
| 6 3| 129 4| 91 4| 22 5| 248 4 | 0 0| 0 0| 0 0| 0 0| 0 0 | 248 4
Walker Prison
| 0 0| 23 1| 26 1| 4 1| 53 1 | 0 0| 0 0| 0 0| 0 0| 0 0 | 53 1
Wayne Prison
| 0 0| 2 0| 4 0| 0 0| 6 0 | 0 0| 0 0| 0 0| 0 0| 0 0 | 6 0
Arrendale Prison | 49 26| 102 3| 25 1| 1 0| 177 3 | 0 0| 0 0| 0 0| 0 0| 0 0 | 177 3
Montgomery Prison | 0 0| 14 0| 12 1| 2 0| 28 0 | 0 0| 0 0| 0 0| 0 0| 0 0 | 28 0
Lee Prison
| 1 1| 25 1| 19 1| 1 0| 46 1 | 0 0| 0 0| 0 0| 0 0| 0 0 | 46 1
Putnam Prison
| 0 0| 5 0| 0 0| 0 0| 5 0 | 0 0| 0 0| 0 0| 0 0| 0 0 | 5 0
Georgia State Prison| 4 2| 279 9| 208 10| 18 4| 509 9 | 0 0| 0 0| 0 0| 0 0| 0 0 | 509 9
Mens Prison
| 0 0| 15 0| 34 2| 72 18| 121 2 | 0 0| 0 0| 0 0| 0 0| 0 0 | 121 2
Jackson Prison-Diag | 8 4| 20 1| 11 1| 3 1| 42 1 | 0 0| 0 0| 0 0| 0 0| 0 0 | 42 1
Jackson Prison-Perm | 0 0| 3 0| 1 0| 0 0| 4 0 | 0 0| 0 0| 0 0| 0 0| 0 0 | 4 0
Coastal Prison
| 8 4| 40 1| 16 1| 2 0| 66 1 | 0 0| 0 0| 0 0| 0 0| 0 0 | 66 1
Scott Prison
| 0 0| 77 3| 45 2| 11 3| 133 2 | 0 0| 0 0| 0 0| 0 0| 0 0 | 133 2
Rivers Prison
| 0 0| 75 2| 68 3| 9 2| 152 3 | 0 0| 0 0| 0 0| 0 0| 0 0 | 152 3
------------------------------------------------------------------------------------------------------------------------------------
(continued)
Page 42 Run 11/22/00
Georgia Department of Corrections Office of Planning and Analysis
Inmate statistical profile
Sample: ACTIVE PRISONERS SERVING LIFE EXCLUDING JAIL
Requestor:
Active inmates 11/22/2000
Institution by current age & sex
Statistics (CONTINUED)
|
MEN
|
WOMEN
|
| Age | Age | Age | Age | Men
| Age | Age | Age | Age |Women
|Grand
Institution
|00-21 %|22-39 %|40-54 %|55-99 %|Total % |00-21 %|22-39 %|40-54 %|55-99 %|Total % |Total %
------------------------------------------------------------------------------------------------------------------------------------
Rutledge Prison
| 0 0| 42 1| 55 3| 16 4| 113 2 | 0 0| 0 0| 0 0| 0 0| 0 0 | 113 2
Central Prison
| 0 0| 86 3| 117 6| 20 5| 223 4 | 0 0| 0 0| 0 0| 0 0| 0 0 | 223 4
Augusta Med Prison | 1 1| 84 3| 80 4| 24 6| 189 3 | 0 0| 0 0| 0 0| 0 0| 0 0 | 189 3
Rogers Prison
| 0 0| 26 1| 21 1| 0 0| 47 1 | 0 0| 0 0| 0 0| 0 0| 0 0 | 47 1
Burruss Prison
| 0 0| 5 0| 10 0| 2 0| 17 0 | 0 0| 0 0| 0 0| 0 0| 0 0 | 17 0
Bostick Prison
| 0 0| 10 0| 25 1| 29 7| 64 1 | 0 0| 0 0| 0 0| 0 0| 0 0 | 64 1
Valdosta Prison
| 4 2| 148 5| 91 4| 17 4| 260 5 | 0 0| 0 0| 0 0| 0 0| 0 0 | 260 4
Hays Prison
| 7 4| 162 5| 113 5| 14 3| 296 5 | 0 0| 0 0| 0 0| 0 0| 0 0 | 296 5
Hancock Prison
| 8 4| 221 7| 113 5| 19 5| 361 6 | 0 0| 0 0| 0 0| 0 0| 0 0 | 361 6
Telfair Prison
| 14 7| 213 7| 98 5| 12 3| 337 6 | 0 0| 0 0| 0 0| 0 0| 0 0 | 337 6
Autry Prison
| 10 5| 135 4| 100 5| 18 4| 263 5 | 0 0| 0 0| 0 0| 0 0| 0 0 | 263 4
Wilcox Prison
| 0 0| 67 2| 73 4| 6 1| 146 3 | 0 0| 0 0| 0 0| 0 0| 0 0 | 146 2
Calhoun Prison
| 10 5| 79 3| 59 3| 5 1| 153 3 | 0 0| 0 0| 0 0| 0 0| 0 0 | 153 3
Dooly Prison
| 0 0| 51 2| 72 3| 6 1| 129 2 | 0 0| 0 0| 0 0| 0 0| 0 0 | 129 2
Macon Prison
| 24 13| 277 9| 100 5| 25 6| 426 7 | 0 0| 0 0| 0 0| 0 0| 0 0 | 426 7
Smith Prison
| 17 9| 199 7| 78 4| 9 2| 303 5 | 0 0| 0 0| 0 0| 0 0| 0 0 | 303 5
Homerville Prison | 0 0| 0 0| 4 0| 0 0| 4 0 | 0 0| 0 0| 0 0| 0 0| 0 0 | 4 0
Washingtn Women Pris| 0 0| 0 0| 0 0| 0 0| 0 0 | 2 20| 34 27| 27 32| 8 32| 71 29 | 71 1
Baldwin Prison
| 1 1| 15 0| 24 1| 3 1| 43 1 | 0 0| 0 0| 0 0| 0 0| 0 0 | 43 1
Metro Womens Prison | 0 0| 0 0| 0 0| 0 0| 0 0 | 3 30| 24 19| 26 31| 8 32| 61 25 | 61 1
Pulaski Womens Pris | 0 0| 0 0| 0 0| 0 0| 0 0 | 5 50| 64 52| 32 38| 8 32| 109 45 | 109 2
Pelham PreTrans Unit| 0 0| 7 0| 6 0| 0 0| 13 0 | 0 0| 0 0| 0 0| 0 0| 0 0 | 13 0
West Central Prison | 0 0| 3 0| 1 0| 0 0| 4 0 | 0 0| 0 0| 0 0| 0 0| 0 0 | 4 0
D Ray James Prison | 0 0| 37 1| 24 1| 3 1| 64 1 | 0 0| 0 0| 0 0| 0 0| 0 0 | 64 1
Coffee Corr Facility| 0 0| 32 1| 19 1| 4 1| 55 1 | 0 0| 0 0| 0 0| 0 0| 0 0 | 55 1
Wheeler Corr Facilty| 0 0| 34 1| 28 1| 4 1| 66 1 | 0 0| 0 0| 0 0| 0 0| 0 0 | 66 1
------------------------------------------------------------------------------------------------------------------------------------
Total reported
| 187 100| 3031 100| 2077 100| 407 100| 5702 100 | 10 100| 124 100| 85 100| 25 100| 244 100 | 5946 100
|
|
|
|
|
|
|
|
|
|
|
Percent reported | 100.0| 100.0| 100.0| 100.0| 100.0 | 100.0| 100.0| 100.0| 100.0| 100.0 | 100.0
|
|
|
|
|
|
|
|
|
|
|
|
|
|
|
|
|
|
|
|
|
|
Not Reported
|0|0|0|0|0
|0|0|0|0|0
|0
------------------------------------------------------------------------------------------------------------------------------------
Total
| 187 | 3031 | 2077 | 407 | 5702
| 10 | 124 | 85 | 25 | 244
| 5946
Page 43 Run 11/22/00
Georgia Department of Corrections Office of Planning and Analysis
Inmate statistical profile
Sample: ACTIVE PRISONERS SERVING LIFE EXCLUDING JAIL
Requestor: Statistics
Active inmates 11/22/2000
Misdemeanors And Felonies by current age & sex
|
MEN
|
WOMEN
|
| Age | Age | Age | Age | Men
| Age | Age | Age | Age |Women
|Grand
Crime Type
|00-21 %|22-39 %|40-54 %|55-99 %|Total % |00-21 %|22-39 %|40-54 %|55-99 %|Total % |Total %
------------------------------------------------------------------------------------------------------------------------------------
MISDEMEANOR
| 0 0| 0 0| 0 0| 0 0| 0 0 | 0 0| 0 0| 0 0| 0 0| 0 0 | 0 0
FELONY
| 187 100| 3031 100| 2077 100| 407 100| 5702 100 | 10 100| 124 100| 85 100| 25 100| 244 100 | 5946 100
------------------------------------------------------------------------------------------------------------------------------------
Total reported
| 187 100| 3031 100| 2077 100| 407 100| 5702 100 | 10 100| 124 100| 85 100| 25 100| 244 100 | 5946 100
|
|
|
|
|
|
|
|
|
|
|
Percent reported | 100.0| 100.0| 100.0| 100.0| 100.0 | 100.0| 100.0| 100.0| 100.0| 100.0 | 100.0
|
|
|
|
|
|
|
|
|
|
|
|
|
|
|
|
|
|
|
|
|
|
NOT REPORTED
|0|0|0|0|0
|0|0|0|0|0
|0
------------------------------------------------------------------------------------------------------------------------------------
Total
| 187 | 3031 | 2077 | 407 | 5702
| 10 | 124 | 85 | 25 | 244
| 5946
Page 44 Run 11/22/00
Georgia Department of Corrections Office of Planning and Analysis
Inmate statistical profile
Sample: ACTIVE PRISONERS SERVING LIFE EXCLUDING JAIL
Requestor: Statistics
Active inmates 11/22/2000
Crimes By Group by current age & sex
|
MEN
|
WOMEN
|
| Age | Age | Age | Age | Men
| Age | Age | Age | Age |Women
|Grand
Crimes By Group
|00-21 %|22-39 %|40-54 %|55-99 %|Total % |00-21 %|22-39 %|40-54 %|55-99 %|Total % |Total %
------------------------------------------------------------------------------------------------------------------------------------
HOMICIDE
| 138 74| 1887 62| 1230 59| 303 74| 3558 62 | 10 100| 108 87| 68 80| 25 100| 211 86 | 3769 63
ABORTION
| 0 0| 0 0| 0 0| 0 0| 0 0 | 0 0| 0 0| 0 0| 0 0| 0 0 | 0 0
BODILY INJRY&REL OFF| 15 8| 180 6| 99 5| 5 1| 299 5 | 0 0| 2 2| 5 6| 0 0| 7 3 | 306 5
ARSON & REL OFF
| 0 0| 1 0| 0 0| 0 0| 1 0 | 0 0| 0 0| 0 0| 0 0| 0 0 | 1 0
DAMAGE OF PROPERTY | 0 0| 1 0| 0 0| 0 0| 1 0 | 0 0| 0 0| 0 0| 0 0| 0 0 | 1 0
BURGLARY & REL OFF | 0 0| 18 1| 7 0| 0 0| 25 0 | 0 0| 0 0| 1 1| 0 0| 1 0 | 26 0
FORGERY & REL OFF | 0 0| 6 0| 4 0| 0 0| 10 0 | 0 0| 0 0| 0 0| 0 0| 0 0 | 10 0
THEFT
| 0 0| 7 0| 5 0| 0 0| 12 0 | 0 0| 0 0| 0 0| 0 0| 0 0 | 12 0
ROBBERY
| 23 12| 353 12| 235 11| 31 8| 642 11 | 0 0| 2 2| 1 1| 0 0| 3 1 | 645 11
SEXUAL OFFENSES
| 10 5| 334 11| 354 17| 55 14| 753 13 | 0 0| 0 0| 2 2| 0 0| 2 1 | 755 13
OBSCENITY CRIMES | 0 0| 0 0| 0 0| 0 0| 0 0 | 0 0| 0 0| 0 0| 0 0| 0 0 | 0 0
TREASON & REL OFF | 0 0| 0 0| 0 0| 0 0| 0 0 | 0 0| 0 0| 0 0| 0 0| 0 0 | 0 0
CRIMES INVOLVNG GOVT| 0 0| 7 0| 5 0| 1 0| 13 0 | 0 0| 0 0| 0 0| 0 0| 0 0 | 13 0
FALSIFICATIONS
| 0 0| 0 0| 0 0| 0 0| 0 0 | 0 0| 0 0| 0 0| 0 0| 0 0 | 0 0
OBSTRUCT LAW ENFORCE| 0 0| 1 0| 1 0| 0 0| 2 0 | 0 0| 0 0| 0 0| 0 0| 0 0 | 2 0
DISORDERLY CONDUCT | 0 0| 0 0| 0 0| 0 0| 0 0 | 0 0| 0 0| 0 0| 0 0| 0 0 | 0 0
GAMBLING & REL OFF | 0 0| 0 0| 0 0| 0 0| 0 0 | 0 0| 0 0| 0 0| 0 0| 0 0 | 0 0
CRUELTY TO CHILDREN | 0 0| 0 0| 0 0| 0 0| 0 0 | 0 0| 0 0| 0 0| 0 0| 0 0 | 0 0
CRIMES WITH GUNS | 0 0| 0 0| 1 0| 0 0| 1 0 | 0 0| 0 0| 0 0| 0 0| 0 0 | 1 0
INVASION PRIVACY | 0 0| 0 0| 0 0| 0 0| 0 0 | 0 0| 0 0| 0 0| 0 0| 0 0 | 0 0
RACKETEERING
| 0 0| 0 0| 0 0| 0 0| 0 0 | 0 0| 0 0| 0 0| 0 0| 0 0 | 0 0
DRUG ABUSE OFFENSES | 1 1| 216 7| 128 6| 10 2| 355 6 | 0 0| 12 10| 8 9| 0 0| 20 8 | 375 6
DRUG TRAFFICKING | 0 0| 18 1| 8 0| 1 0| 27 0 | 0 0| 0 0| 0 0| 0 0| 0 0 | 27 0
AUTO CRIMES
| 0 0| 0 0| 0 0| 0 0| 0 0 | 0 0| 0 0| 0 0| 0 0| 0 0 | 0 0
REVENUE & CONTRABAND| 0 0| 0 0| 0 0| 0 0| 0 0 | 0 0| 0 0| 0 0| 0 0| 0 0 | 0 0
CRIMES OF OTH STATES| 0 0| 0 0| 0 0| 0 0| 0 0 | 0 0| 0 0| 0 0| 0 0| 0 0 | 0 0
MISC. FELONIES
| 0 0| 1 0| 0 0| 1 0| 2 0 | 0 0| 0 0| 0 0| 0 0| 0 0 | 2 0
MISDEMEANORS
| 0 0| 0 0| 0 0| 0 0| 0 0 | 0 0| 0 0| 0 0| 0 0| 0 0 | 0 0
------------------------------------------------------------------------------------------------------------------------------------
Total reported
| 187 100| 3030 100| 2077 100| 407 100| 5701 100 | 10 100| 124 100| 85 100| 25 100| 244 100 | 5945 100
|
|
|
|
|
|
|
|
|
|
|
Percent reported | 100.0| 100.0| 100.0| 100.0| 100.0 | 100.0| 100.0| 100.0| 100.0| 100.0 | 100.0
|
|
|
|
|
|
|
|
|
|
|
|
|
|
|
|
|
|
|
|
|
|
NOT REPORTED
|0|1|0|0|1
|0|0|0|0|0
|1
------------------------------------------------------------------------------------------------------------------------------------
Total
| 187 | 3031 | 2077 | 407 | 5702
| 10 | 124 | 85 | 25 | 244
| 5946
Page 45 Run 11/22/00
Georgia Department of Corrections Office of Planning and Analysis
Inmate statistical profile
Sample: ACTIVE PRISONERS SERVING LIFE EXCLUDING JAIL
Requestor: Statistics
Active inmates 11/22/2000
Most Serious Offense by current age & sex
|
MEN
|
WOMEN
|
| Age | Age | Age | Age | Men
| Age | Age | Age | Age |Women
|Grand
Most Serious Offense|00-21 %|22-39 %|40-54 %|55-99 %|Total % |00-21 %|22-39 %|40-54 %|55-99 %|Total % |Total %
------------------------------------------------------------------------------------------------------------------------------------
Misdemeanors
|
|
|
------------------------------------------------------------------------------------------------------------------------------------
------------------------------------------------------------------------------------------------------------------------------------
------------------------------------------------------------------------------------------------------------------------------------
FELONIES
|
|
|
------------------------------------------------------------------------------------------------------------------------------------
------------------------------------------------------------------------------------------------------------------------------------
MISC. HOMICIDE OFFEN| 0 0| 1 0| 0 0| 0 0| 1 0 | 0 0| 0 0| 0 0| 0 0| 0 0 | 1 0
MURDER
| 138 74| 1886 62| 1230 59| 302 74| 3556 62 | 10 100| 108 87| 68 80| 25 100| 211 86 | 3767 63
VOLUNTARY MANSLAUGHT| 0 0| 1 0| 0 0| 1 0| 2 0 | 0 0| 0 0| 0 0| 0 0| 0 0 | 2 0
AGGRAVATED ASSAULT | 0 0| 7 0| 1 0| 0 0| 8 0 | 0 0| 0 0| 0 0| 0 0| 0 0 | 8 0
AGGRAVATED BATTERY | 0 0| 1 0| 0 0| 0 0| 1 0 | 0 0| 0 0| 0 0| 0 0| 0 0 | 1 0
KIDNAPPING
| 15 8| 172 6| 96 5| 5 1| 288 5 | 0 0| 2 2| 5 6| 0 0| 7 3 | 295 5
AGG ASSLT ON POLICE | 0 0| 0 0| 2 0| 0 0| 2 0 | 0 0| 0 0| 0 0| 0 0| 0 0 | 2 0
SECOND DEGREE ARSON | 0 0| 1 0| 0 0| 0 0| 1 0 | 0 0| 0 0| 0 0| 0 0| 0 0 | 1 0
CRIM. DAMAGE 2ND DEG| 0 0| 1 0| 0 0| 0 0| 1 0 | 0 0| 0 0| 0 0| 0 0| 0 0 | 1 0
BURGLARY
| 0 0| 18 1| 7 0| 0 0| 25 0 | 0 0| 0 0| 1 1| 0 0| 1 0 | 26 0
FORGERY 1ST DEGREE | 0 0| 6 0| 4 0| 0 0| 10 0 | 0 0| 0 0| 0 0| 0 0| 0 0 | 10 0
THEFT BY TAKING
| 0 0| 2 0| 3 0| 0 0| 5 0 | 0 0| 0 0| 0 0| 0 0| 0 0 | 5 0
THEFT BY REC STOLEN | 0 0| 3 0| 1 0| 0 0| 4 0 | 0 0| 0 0| 0 0| 0 0| 0 0 | 4 0
THEFT BY CONVERSION | 0 0| 1 0| 1 0| 0 0| 2 0 | 0 0| 0 0| 0 0| 0 0| 0 0 | 2 0
THEFT OF MOTOR VEH, | 0 0| 1 0| 0 0| 0 0| 1 0 | 0 0| 0 0| 0 0| 0 0| 0 0 | 1 0
ROBBERY
| 0 0| 5 0| 6 0| 4 1| 15 0 | 0 0| 0 0| 0 0| 0 0| 0 0 | 15 0
ARMED ROBBERY
| 23 12| 348 11| 229 11| 27 7| 627 11 | 0 0| 2 2| 1 1| 0 0| 3 1 | 630 11
MISC. SEXUAL
| 0 0| 1 0| 0 0| 0 0| 1 0 | 0 0| 0 0| 0 0| 0 0| 0 0 | 1 0
RAPE
| 10 5| 312 10| 320 15| 43 11| 685 12 | 0 0| 0 0| 2 2| 0 0| 2 1 | 687 12
AGGRAVATED SODOMY | 0 0| 16 1| 21 1| 9 2| 46 1 | 0 0| 0 0| 0 0| 0 0| 0 0 | 46 1
CHILD MOLESTATION | 0 0| 1 0| 3 0| 1 0| 5 0 | 0 0| 0 0| 0 0| 0 0| 0 0 | 5 0
AGGRAV. CHILD MOLEST| 0 0| 4 0| 10 0| 2 0| 16 0 | 0 0| 0 0| 0 0| 0 0| 0 0 | 16 0
OBSTR OF LAW ENF OFF| 0 0| 7 0| 5 0| 1 0| 13 0 | 0 0| 0 0| 0 0| 0 0| 0 0 | 13 0
ESCAPE
| 0 0| 1 0| 1 0| 0 0| 2 0 | 0 0| 0 0| 0 0| 0 0| 0 0 | 2 0
POSS OF CERTAIN WEAP| 0 0| 0 0| 1 0| 0 0| 1 0 | 0 0| 0 0| 0 0| 0 0| 0 0 | 1 0
S/D NARCOTICS, OPIAT| 0 0| 11 0| 13 1| 1 0| 25 0 | 0 0| 1 1| 1 1| 0 0| 2 1 | 27 0
S/D DEP,STIM,CNTRF D| 0 0| 4 0| 2 0| 0 0| 6 0 | 0 0| 0 0| 0 0| 0 0| 0 0 | 6 0
SALE/DIST OF MARIJUA| 0 0| 6 0| 5 0| 1 0| 12 0 | 0 0| 0 0| 0 0| 0 0| 0 0 | 12 0
POSS NARCOTICS, OPIA| 0 0| 4 0| 3 0| 0 0| 7 0 | 0 0| 0 0| 0 0| 0 0| 0 0 | 7 0
------------------------------------------------------------------------------------------------------------------------------------
(continued)
Page 46 Run 11/22/00
Georgia Department of Corrections Office of Planning and Analysis
Inmate statistical profile
Sample: ACTIVE PRISONERS SERVING LIFE EXCLUDING JAIL
Requestor:
Active inmates 11/22/2000
Most Serious Offense by current age & sex
Statistics (CONTINUED)
|
MEN
|
WOMEN
|
| Age | Age | Age | Age | Men
| Age | Age | Age | Age |Women
|Grand
Most Serious Offense|00-21 %|22-39 %|40-54 %|55-99 %|Total % |00-21 %|22-39 %|40-54 %|55-99 %|Total % |Total %
------------------------------------------------------------------------------------------------------------------------------------
POSS DEP,STIM,CNTRF | 0 0| 0 0| 1 0| 0 0| 1 0 | 0 0| 0 0| 0 0| 0 0| 0 0 | 1 0
VIOLATE GA CNTRL SBS| 0 0| 14 0| 6 0| 0 0| 20 0 | 0 0| 1 1| 1 1| 0 0| 2 1 | 22 0
UNLWFL MFG/DEL/DIST | 0 0| 6 0| 1 0| 0 0| 7 0 | 0 0| 0 0| 0 0| 0 0| 0 0 | 7 0
SALE/DIST CONT SUB P| 0 0| 3 0| 1 0| 0 0| 4 0 | 0 0| 0 0| 0 0| 0 0| 0 0 | 4 0
SALE/DIST CONT SUB S| 0 0| 1 0| 0 0| 0 0| 1 0 | 0 0| 0 0| 0 0| 0 0| 0 0 | 1 0
SALE/DISTRIBUTION CO| 1 1| 142 5| 80 4| 6 1| 229 4 | 0 0| 10 8| 6 7| 0 0| 16 7 | 245 4
POSSESSION OF COCAIN| 0 0| 25 1| 16 1| 2 0| 43 1 | 0 0| 0 0| 0 0| 0 0| 0 0 | 43 1
COCAINE LESS 200 GRA| 0 0| 12 0| 7 0| 1 0| 20 0 | 0 0| 0 0| 0 0| 0 0| 0 0 | 20 0
COCAINE 401 OR MORE | 0 0| 5 0| 0 0| 0 0| 5 0 | 0 0| 0 0| 0 0| 0 0| 0 0 | 5 0
NARCOTICS LESS 14 GR| 0 0| 0 0| 1 0| 0 0| 1 0 | 0 0| 0 0| 0 0| 0 0| 0 0 | 1 0
ATT/CONSPRCY COMMT C| 0 0| 1 0| 0 0| 0 0| 1 0 | 0 0| 0 0| 0 0| 0 0| 0 0 | 1 0
CONSPIRACY
| 0 0| 1 0| 0 0| 0 0| 1 0 | 0 0| 0 0| 0 0| 0 0| 0 0 | 1 0
CRIMINAL ATTEMPT | 0 0| 0 0| 0 0| 1 0| 1 0 | 0 0| 0 0| 0 0| 0 0| 0 0 | 1 0
------------------------------------------------------------------------------------------------------------------------------------
Total reported
| 187 100| 3031 100| 2077 100| 407 100| 5702 100 | 10 100| 124 100| 85 100| 25 100| 244 100 | 5946 100
|
|
|
|
|
|
|
|
|
|
|
Percent reported | 100.0| 100.0| 100.0| 100.0| 100.0 | 100.0| 100.0| 100.0| 100.0| 100.0 | 100.0
|
|
|
|
|
|
|
|
|
|
|
|
|
|
|
|
|
|
|
|
|
|
NOT REPORTED
|0|0|0|0|0
|0|0|0|0|0
|0
------------------------------------------------------------------------------------------------------------------------------------
Total
| 187 | 3031 | 2077 | 407 | 5702
| 10 | 124 | 85 | 25 | 244
| 5946
Page 47 Run 11/22/00
Georgia Department of Corrections Office of Planning and Analysis
Inmate statistical profile
Sample: ACTIVE PRISONERS SERVING LIFE EXCLUDING JAIL
Requestor: Statistics
Active inmates 11/22/2000
Most Serious Crime Type by current age & sex
|
MEN
|
WOMEN
|
| Age | Age | Age | Age | Men
| Age | Age | Age | Age |Women
|Grand
Crime Type
|00-21 %|22-39 %|40-54 %|55-99 %|Total % |00-21 %|22-39 %|40-54 %|55-99 %|Total % |Total %
------------------------------------------------------------------------------------------------------------------------------------
VIOL/PERSN
| 176 94| 2421 80| 1564 75| 339 83| 4500 79 | 10 100| 112 90| 74 87| 25 100| 221 91 | 4721 79
NVIOL/PERS
| 0 0| 0 0| 0 0| 0 0| 0 0 | 0 0| 0 0| 0 0| 0 0| 0 0 | 0 0
PROPERTY
| 0 0| 33 1| 16 1| 0 0| 49 1 | 0 0| 0 0| 1 1| 0 0| 1 0 | 50 1
DRUG SALES
| 1 1| 191 6| 110 5| 9 2| 311 5 | 0 0| 11 9| 7 8| 0 0| 18 7 | 329 6
DRUG POSSN
| 0 0| 43 1| 26 1| 2 0| 71 1 | 0 0| 1 1| 1 1| 0 0| 2 1 | 73 1
ALCOHOL
| 0 0| 0 0| 0 0| 0 0| 0 0 | 0 0| 0 0| 0 0| 0 0| 0 0 | 0 0
HABIT/DUI
| 0 0| 0 0| 0 0| 0 0| 0 0 | 0 0| 0 0| 0 0| 0 0| 0 0 | 0 0
SEX OFFEND
| 10 5| 334 11| 354 17| 55 14| 753 13 | 0 0| 0 0| 2 2| 0 0| 2 1 | 755 13
OTHER
| 0 0| 9 0| 7 0| 2 0| 18 0 | 0 0| 0 0| 0 0| 0 0| 0 0 | 18 0
------------------------------------------------------------------------------------------------------------------------------------
Total reported
| 187 100| 3031 100| 2077 100| 407 100| 5702 100 | 10 100| 124 100| 85 100| 25 100| 244 100 | 5946 100
|
|
|
|
|
|
|
|
|
|
|
Percent reported | 100.0| 100.0| 100.0| 100.0| 100.0 | 100.0| 100.0| 100.0| 100.0| 100.0 | 100.0
|
|
|
|
|
|
|
|
|
|
|
|
|
|
|
|
|
|
|
|
|
|
NOT REPORTED
|0|0|0|0|0
|0|0|0|0|0
|0
------------------------------------------------------------------------------------------------------------------------------------
Total
| 187 | 3031 | 2077 | 407 | 5702
| 10 | 124 | 85 | 25 | 244
| 5946