- Collection:
- Georgia Government Publications
- Title:
- Inmate statistical profile: active lifers, Oct. 2000
- Creator:
- Georgia. Department of Corrections. Planning and Analysis Section
- Publisher:
- Atlanta, GA. : Georgia Dept. of Corrections, Office of Planning and Analysis, 2000-10
- Date of Original:
- 2000-10
- Subject:
- Prisoners--Georgia
- Location:
- United States, Georgia, 32.75042, -83.50018
- Medium:
- state government records
- Type:
- Text
- Format:
- application/pdf
- External Identifiers:
- Call Number GA R300.P5 P1 L5 2000/10
- Metadata URL:
- https://dlg.galileo.usg.edu/id:dlg_ggpd_i-ga-br300-pp5-bp1-bl5-b2000-s10-belec-p-btext
- Digital Object URL:
- https://dlg.galileo.usg.edu/do:dlg_ggpd_i-ga-br300-pp5-bp1-bl5-b2000-s10-belec-p-btext
- Language:
- eng
- Holding Institution:
- University of Georgia. Map and Government Information Library
- Rights:
-

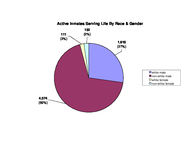
Active Inmates Serving Life By Race & Gender
111 (2%)
132 (2%)
1,618 (27%)
4,074 (69%)
white male non-white male white female non-white female
Prior Incarcerations of Active Inmates Serving A Life Sentence
4000
3,576
(60%)
3500
3000
Number of Inmates
2500
2000 1500 1000
500 0
zero
1,220 (21%)
one
611 (10%)
327 (6%)
two
three
Priors
130 (2%)
four
71 (1%)
five or more
Active Inmates Serving Life By Crime Type
73 (1%)
753 (13%)
18 (<1%)
332 (6%)
52 (1%)
4,707 (79%)
viol/persn
property
drug sales
drug possn
sex offend
other
Georgia Department of Corrections
Page 1 Run 10/24/00
Office of Planning and Analysis
Inmate statistical profile TABLE OF CONTENTS FOR ACTIVE PRISONERS SERVING LIFE EXCLUDING JAIL
TITLE ----RACE AND SEX............................ 2 Culture Fair IQ Scores.................. 3 Self-Rpt Socioeconomic Class............ 4 Self-Rpt Environment To Age 16.......... 5 Self-Rpt Education Level................ 6 Functional Reading Level (WRAT Scores).. 7 Functional Math Level (WRAT Scores)..... 8 Functional Spelling Level (WRAT Scores). 9 Self-Rpt Guardian Status To Age 16......10 Self-Rpt Employment Status Before Prison11 Self-Rpt Marital Status At Admission....12 Self-Rpt Number Of Children At Admission13 Self-Rpt Religious Affiliation..........14 Self-Rpt Family Behavior Patterns *.....15 Inmate Diagnostic Behavior Problem *....16 Physical Profile (General Condition)....17 Security Status.........................18 Number Of Sentences.....................19 Number Of Disciplinaries................20 Number Of Escapes.......................21 Number Of Prior Georgia Incarcerations *22 Number Of Transfers.....................23 County Of Conviction....................24 Circuit Of Conviction...................29 Home County.............................31 Prison Sentence In Years................36 Probation To Follow Prison..............37 Admission Type..........................38 Release Type............................39 Inst By Group...........................40 Institution.............................41 Misdemeanors And Felonies...............43 Crimes By Group.........................44 Most Serious Offense....................45 Most Serious Crime Type.................47
PAGE ----
Georgia Department of Corrections
Page 2 Run 10/24/00
Office of Planning and Analysis
Inmate statistical profile
Sample: ACTIVE PRISONERS SERVING LIFE EXCLUDING JAIL
Requestor: Statistics
Active inmates 10/24/2000
RACE AND SEX by current age & sex
|
MEN
|
WOMEN
|
| Age | Age | Age | Age | Men
| Age | Age | Age | Age |Women
|Grand
RACE AND SEX
|00-21 %|22-39 %|40-54 %|55-99 %|Total % |00-21 %|22-39 %|40-54 %|55-99 %|Total % |Total %
------------------------------------------------------------------------------------------------------------------------------------
WHITE MALE
| 37 20| 682 22| 693 34| 206 51| 1618 28 | 0 0| 0 0| 0 0| 0 0| 0 0 | 1618 27
NON WHITE MALE
| 152 80| 2351 78| 1370 66| 201 49| 4074 72 | 0 0| 0 0| 0 0| 0 0| 0 0 | 4074 69
WHITE FEMALE
| 0 0| 0 0| 0 0| 0 0| 0 0 | 4 44| 48 38| 42 51| 17 68| 111 46 | 111 2
NON WHITE FEMALE | 0 0| 0 0| 0 0| 0 0| 0 0 | 5 56| 78 62| 41 49| 8 32| 132 54 | 132 2
------------------------------------------------------------------------------------------------------------------------------------
Total reported
| 189 100| 3033 100| 2063 100| 407 100| 5692 100 | 9 100| 126 100| 83 100| 25 100| 243 100 | 5935 100
|
|
|
|
|
|
|
|
|
|
|
Percent reported | 100.0| 100.0| 100.0| 100.0| 100.0 | 100.0| 100.0| 100.0| 100.0| 100.0 | 100.0
|
|
|
|
|
|
|
|
|
|
|
|
|
|
|
|
|
|
|
|
|
|
NOT REPORTED
|0|0|0|0|0
|0|0|0|0|0
|0
------------------------------------------------------------------------------------------------------------------------------------
Total
| 189 | 3033 | 2063 | 407 | 5692
| 9 | 126 | 83 | 25 | 243
| 5935
|
|
|
|
|
|
|
|
|
|
|
|
|
|
|
|
|
|
|
|
|
|
|
|
|
|
|
|
|
|
|
|
|
|
|
|
|
|
|
|
|
|
|
|
|
|
|
|
|
|
|
|
|
|
|
AVERAGE AGE
| 19.87 | 31.16 | 45.76 | 61.28 | 38.23 | 19.22 | 31.45 | 45.33 | 60.72 | 38.75 | 38.25
Page 3 Run 10/24/00
Georgia Department of Corrections Office of Planning and Analysis
Inmate statistical profile
Sample: ACTIVE PRISONERS SERVING LIFE EXCLUDING JAIL
Requestor: Statistics
Active inmates 10/24/2000
Culture Fair IQ Scores by current age & sex
|
MEN
|
WOMEN
|
| Age | Age | Age | Age | Men
| Age | Age | Age | Age |Women
|Grand
IQ Score
|00-21 %|22-39 %|40-54 %|55-99 %|Total % |00-21 %|22-39 %|40-54 %|55-99 %|Total % |Total %
------------------------------------------------------------------------------------------------------------------------------------
LESS THAN 70
| 3 2| 82 3| 153 8| 38 11| 276 5 | 0 0| 9 7| 10 13| 2 9| 21 9 | 297 5
70 AND UP
| 177 98| 2811 97| 1770 92| 322 89| 5080 95 | 8 100| 114 93| 70 88| 20 91| 212 91 | 5292 95
------------------------------------------------------------------------------------------------------------------------------------
Total reported
| 180 100| 2893 100| 1923 100| 360 100| 5356 100 | 8 100| 123 100| 80 100| 22 100| 233 100 | 5589 100
|
|
|
|
|
|
|
|
|
|
|
Percent reported |
95.2|
95.4|
93.2|
88.5|
94.1 |
88.9|
97.6|
96.4|
88.0|
95.9 |
94.2
|
|
|
|
|
|
|
|
|
|
|
|
|
|
|
|
|
|
|
|
|
|
NOT REPORTED
| 9 | 140 | 140 | 47 | 336
| 1 | 3 | 3 | 3 | 10
| 346
------------------------------------------------------------------------------------------------------------------------------------
Total
| 189 | 3033 | 2063 | 407 | 5692
| 9 | 126 | 83 | 25 | 243
| 5935
|
|
|
|
|
|
|
|
|
|
|
|
|
|
|
|
|
|
|
|
|
|
|
|
|
|
|
|
|
|
|
|
|
|
|
|
|
|
|
|
|
|
|
|
|
|
|
|
|
|
|
|
|
|
|
AVERAGE IQ
| 98.73 | 101.40 | 97.03 | 93.57 | 99.21 | 97.50 | 95.63 | 90.35 | 88.09 | 93.17 | 98.96
Page 4 Run 10/24/00
Georgia Department of Corrections Office of Planning and Analysis
Inmate statistical profile
Sample: ACTIVE PRISONERS SERVING LIFE EXCLUDING JAIL
Requestor: Statistics
Active inmates 10/24/2000
Self-Rpt Socioeconomic Class by current age & sex
|
MEN
|
WOMEN
|
| Age | Age | Age | Age | Men
| Age | Age | Age | Age |Women
|Grand
Socioeconomic Class |00-21 %|22-39 %|40-54 %|55-99 %|Total % |00-21 %|22-39 %|40-54 %|55-99 %|Total % |Total %
------------------------------------------------------------------------------------------------------------------------------------
WELFARE
| 20 12| 346 12| 199 10| 23 6| 588 11 | 0 0| 22 18| 7 8| 0 0| 29 12 | 617 11
OCC EMPLOY
| 15 9| 192 7| 65 3| 7 2| 279 5 | 0 0| 3 2| 0 0| 1 5| 4 2 | 283 5
MINIMUM STD
| 70 41| 1008 35| 882 44| 215 56| 2175 40 | 5 56| 43 35| 26 31| 8 36| 82 34 | 2257 40
MIDDLE
| 66 38| 1345 46| 847 42| 136 35| 2394 44 | 4 44| 55 44| 47 57| 12 55| 118 50 | 2512 44
OTHER
| 1 1| 27 1| 5 0| 3 1| 36 1 | 0 0| 1 1| 3 4| 1 5| 5 2 | 41 1
------------------------------------------------------------------------------------------------------------------------------------
Total reported
| 172 100| 2918 100| 1998 100| 384 100| 5472 100 | 9 100| 124 100| 83 100| 22 100| 238 100 | 5710 100
|
|
|
|
|
|
|
|
|
|
|
Percent reported |
91.0|
96.2|
96.8|
94.3|
96.1 | 100.0|
98.4| 100.0|
88.0|
97.9 |
96.2
|
|
|
|
|
|
|
|
|
|
|
|
|
|
|
|
|
|
|
|
|
|
NOT RPTD
| 17 | 115 | 65 | 23 | 220
|0|2|0|3|5
| 225
------------------------------------------------------------------------------------------------------------------------------------
Total
| 189 | 3033 | 2063 | 407 | 5692
| 9 | 126 | 83 | 25 | 243
| 5935
Page 5 Run 10/24/00
Georgia Department of Corrections Office of Planning and Analysis
Inmate statistical profile
Sample: ACTIVE PRISONERS SERVING LIFE EXCLUDING JAIL
Requestor: Statistics
Active inmates 10/24/2000
Self-Rpt Environment To Age 16 by current age & sex
|
MEN
|
WOMEN
|
| Age | Age | Age | Age | Men
| Age | Age | Age | Age |Women
|Grand
Environment
|00-21 %|22-39 %|40-54 %|55-99 %|Total % |00-21 %|22-39 %|40-54 %|55-99 %|Total % |Total %
------------------------------------------------------------------------------------------------------------------------------------
RURAL/FARM
| 0 0| 113 4| 175 9| 94 24| 382 7 | 0 0| 8 6| 4 5| 3 14| 15 6 | 397 7
RURAL/NFARM
| 4 2| 210 7| 173 9| 34 9| 421 8 | 0 0| 7 6| 3 4| 0 0| 10 4 | 431 7
S.M.S.A
| 79 43| 1217 41| 716 36| 100 26| 2112 38 | 2 22| 24 19| 22 27| 6 29| 54 23 | 2166 37
URBAN
| 33 18| 525 18| 359 18| 53 14| 970 17 | 4 44| 30 24| 24 29| 2 10| 60 25 | 1030 18
SMALL TOWN
| 69 37| 888 30| 575 29| 111 28| 1643 30 | 3 33| 55 44| 28 34| 9 43| 95 40 | 1738 30
OTHER
| 0 0| 16 1| 9 0| 0 0| 25 0 | 0 0| 0 0| 2 2| 1 5| 3 1 | 28 0
------------------------------------------------------------------------------------------------------------------------------------
Total reported
| 185 100| 2969 100| 2007 100| 392 100| 5553 100 | 9 100| 124 100| 83 100| 21 100| 237 100 | 5790 100
|
|
|
|
|
|
|
|
|
|
|
Percent reported |
97.9|
97.9|
97.3|
96.3|
97.6 | 100.0|
98.4| 100.0|
84.0|
97.5 |
97.6
|
|
|
|
|
|
|
|
|
|
|
|
|
|
|
|
|
|
|
|
|
|
NOT RPTD
| 4 | 64 | 56 | 15 | 139
|0|2|0|4|6
| 145
------------------------------------------------------------------------------------------------------------------------------------
Total
| 189 | 3033 | 2063 | 407 | 5692
| 9 | 126 | 83 | 25 | 243
| 5935
Page 6 Run 10/24/00
Georgia Department of Corrections Office of Planning and Analysis
Inmate statistical profile
Sample: ACTIVE PRISONERS SERVING LIFE EXCLUDING JAIL
Requestor: Statistics
Active inmates 10/24/2000
Self-Rpt Education Level by current age & sex
|
MEN
|
WOMEN
|
| Age | Age | Age | Age | Men
| Age | Age | Age | Age |Women
|Grand
Education Level
|00-21 %|22-39 %|40-54 %|55-99 %|Total % |00-21 %|22-39 %|40-54 %|55-99 %|Total % |Total %
------------------------------------------------------------------------------------------------------------------------------------
LESS THAN GRADE 7 | 6 3| 48 2| 106 5| 84 21| 244 4 | 0 0| 1 1| 3 4| 5 21| 9 4 | 253 4
GRADE 7
| 9 5| 82 3| 64 3| 35 9| 190 3 | 0 0| 6 5| 3 4| 1 4| 10 4 | 200 3
GRADE 8
| 39 21| 271 9| 201 10| 37 9| 548 10 | 3 33| 15 12| 8 10| 1 4| 27 11 | 575 10
GRADE 9
| 45 24| 452 15| 244 12| 35 9| 776 14 | 3 33| 17 14| 5 6| 0 0| 25 10 | 801 14
GRADE 10
| 40 22| 599 20| 284 14| 37 9| 960 17 | 2 22| 20 16| 10 12| 3 13| 35 15 | 995 17
GRADE 11
| 35 19| 554 19| 224 11| 27 7| 840 15 | 1 11| 19 15| 4 5| 2 8| 26 11 | 866 15
GRADE 12
| 7 4| 736 25| 654 32| 95 24| 1492 27 | 0 0| 27 22| 30 36| 8 33| 65 27 | 1557 27
MORE THAN GRADE 12 | 3 2| 252 8| 256 13| 49 12| 560 10 | 0 0| 19 15| 20 24| 4 17| 43 18 | 603 10
------------------------------------------------------------------------------------------------------------------------------------
Total reported
| 184 100| 2994 100| 2033 100| 399 100| 5610 100 | 9 100| 124 100| 83 100| 24 100| 240 100 | 5850 100
|
|
|
|
|
|
|
|
|
|
|
Percent reported |
97.4|
98.7|
98.5|
98.0|
98.6 | 100.0|
98.4| 100.0|
96.0|
98.8 |
98.6
|
|
|
|
|
|
|
|
|
|
|
|
|
|
|
|
|
|
|
|
|
|
NOT REPORTED
| 5 | 39 | 30 | 8 | 82
|0|2|0|1|3
| 85
------------------------------------------------------------------------------------------------------------------------------------
Total
| 189 | 3033 | 2063 | 407 | 5692
| 9 | 126 | 83 | 25 | 243
| 5935
|
|
|
|
|
|
|
|
|
|
|
|
|
|
|
|
|
|
|
|
|
|
|
|
|
|
|
|
|
|
|
|
|
|
|
|
|
|
|
|
|
|
|
|
|
|
|
|
|
|
|
|
|
|
|
AVG EDUCATION LEVEL | 9.46 | 11.01 | 11.22 | 9.72 | 10.95 | 9.11 | 11.52 | 11.86 | 11.08 | 11.50 | 10.97
* NOTE: THE FIELD LABLED "LESS THAN GRADE 7" WAS CORRECTED IN MARCH 1989: MISSING DATA FOR INMATES STILL IN DIAGNOSTICS NOW HAS BEEN REMOVED FROM THIS FIELD AND IDENTIFIED AS "NOT REPORTED" INFORMATION.
Page 7 Run 10/24/00
Georgia Department of Corrections Office of Planning and Analysis
Inmate statistical profile
Sample: ACTIVE PRISONERS SERVING LIFE EXCLUDING JAIL
Requestor: Statistics
Active inmates 10/24/2000
Functional Reading Level (WRAT Scores) by current age & sex
|
MEN
|
WOMEN
|
| Age | Age | Age | Age | Men
| Age | Age | Age | Age |Women
|Grand
WRAT Reading Score |00-21 %|22-39 %|40-54 %|55-99 %|Total % |00-21 %|22-39 %|40-54 %|55-99 %|Total % |Total %
------------------------------------------------------------------------------------------------------------------------------------
LESS THAN GRADE 6 | 79 44| 1140 39| 836 46| 166 49| 2221 42 | 2 25| 47 38| 22 28| 10 43| 81 35 | 2302 42
6TH THRU 8TH GRADE | 31 17| 673 23| 411 23| 59 17| 1174 22 | 2 25| 29 24| 17 22| 4 17| 52 22 | 1226 22
GRADE 9
| 12 7| 207 7| 106 6| 21 6| 346 7 | 1 13| 4 3| 7 9| 2 9| 14 6 | 360 7
GRADE 10
| 13 7| 129 4| 75 4| 14 4| 231 4 | 1 13| 2 2| 6 8| 2 9| 11 5 | 242 4
GRADE 11
| 6 3| 113 4| 83 5| 9 3| 211 4 | 0 0| 4 3| 5 6| 1 4| 10 4 | 221 4
GRADE 12
| 32 18| 533 18| 282 15| 67 20| 914 17 | 2 25| 7 6| 2 3| 1 4| 12 5 | 926 17
MORE THAN GRADE 12 | 8 4| 104 4| 27 1| 4 1| 143 3 | 0 0| 30 24| 19 24| 3 13| 52 22 | 195 4
------------------------------------------------------------------------------------------------------------------------------------
Total reported
| 181 100| 2899 100| 1820 100| 340 100| 5240 100 | 8 100| 123 100| 78 100| 23 100| 232 100 | 5472 100
|
|
|
|
|
|
|
|
|
|
|
Percent reported |
95.8|
95.6|
88.2|
83.5|
92.1 |
88.9|
97.6|
94.0|
92.0|
95.5 |
92.2
|
|
|
|
|
|
|
|
|
|
|
|
|
|
|
|
|
|
|
|
|
|
NOT REPORTED
| 8 | 134 | 243 | 67 | 452
| 1 | 3 | 5 | 2 | 11
| 463
------------------------------------------------------------------------------------------------------------------------------------
Total
| 189 | 3033 | 2063 | 407 | 5692
| 9 | 126 | 83 | 25 | 243
| 5935
|
|
|
|
|
|
|
|
|
|
|
|
|
|
|
|
|
|
|
|
|
|
|
|
|
|
|
|
|
|
|
|
|
|
|
|
|
|
|
|
|
|
|
|
|
|
|
|
|
|
|
|
|
|
|
AVG READING SCORE | 7.60 | 7.66 | 6.99 | 6.90 | 7.38 | 8.41 | 7.96 | 8.36 | 7.23 | 8.04 | 7.41
Page 8 Run 10/24/00
Georgia Department of Corrections Office of Planning and Analysis
Inmate statistical profile
Sample: ACTIVE PRISONERS SERVING LIFE EXCLUDING JAIL
Requestor: Statistics
Active inmates 10/24/2000
Functional Math Level (WRAT Scores) by current age & sex
|
MEN
|
WOMEN
|
| Age | Age | Age | Age | Men
| Age | Age | Age | Age |Women
|Grand
WRAT Math Score
|00-21 %|22-39 %|40-54 %|55-99 %|Total % |00-21 %|22-39 %|40-54 %|55-99 %|Total % |Total %
------------------------------------------------------------------------------------------------------------------------------------
LESS THAN GRADE 6 | 65 36| 874 30| 795 44| 173 51| 1907 36 | 2 25| 47 38| 28 35| 11 48| 88 38 | 1995 36
6TH THRU 8TH GRADE | 85 47| 1455 50| 674 37| 94 28| 2308 44 | 5 63| 50 41| 32 41| 8 35| 95 41 | 2403 44
GRADE 9
| 11 6| 223 8| 122 7| 25 7| 381 7 | 1 13| 12 10| 5 6| 2 9| 20 9 | 401 7
GRADE 10
| 11 6| 133 5| 100 5| 15 4| 259 5 | 0 0| 7 6| 3 4| 1 4| 11 5 | 270 5
GRADE 11
| 5 3| 97 3| 50 3| 12 4| 164 3 | 0 0| 1 1| 3 4| 1 4| 5 2 | 169 3
GRADE 12
| 2 1| 103 4| 81 4| 19 6| 205 4 | 0 0| 2 2| 3 4| 0 0| 5 2 | 210 4
MORE THAN GRADE 12 | 2 1| 18 1| 3 0| 2 1| 25 0 | 0 0| 4 3| 5 6| 0 0| 9 4 | 34 1
------------------------------------------------------------------------------------------------------------------------------------
Total reported
| 181 100| 2903 100| 1825 100| 340 100| 5249 100 | 8 100| 123 100| 79 100| 23 100| 233 100 | 5482 100
|
|
|
|
|
|
|
|
|
|
|
Percent reported |
95.8|
95.7|
88.5|
83.5|
92.2 |
88.9|
97.6|
95.2|
92.0|
95.9 |
92.4
|
|
|
|
|
|
|
|
|
|
|
|
|
|
|
|
|
|
|
|
|
|
NOT REPORTED
| 8 | 130 | 238 | 67 | 443
| 1 | 3 | 4 | 2 | 10
| 453
------------------------------------------------------------------------------------------------------------------------------------
Total
| 189 | 3033 | 2063 | 407 | 5692
| 9 | 126 | 83 | 25 | 243
| 5935
|
|
|
|
|
|
|
|
|
|
|
|
|
|
|
|
|
|
|
|
|
|
|
|
|
|
|
|
|
|
|
|
|
|
|
|
|
|
|
|
|
|
|
|
|
|
|
|
|
|
|
|
|
|
|
AVG MATH SCORE
| 6.93 | 7.10 | 6.59 | 6.31 | 6.87 | 6.83 | 7.02 | 7.29 | 5.94 | 7.00 | 6.87
Page 9 Run 10/24/00
Georgia Department of Corrections Office of Planning and Analysis
Inmate statistical profile
Sample: ACTIVE PRISONERS SERVING LIFE EXCLUDING JAIL
Requestor: Statistics
Active inmates 10/24/2000
Functional Spelling Level (WRAT Scores) by current age & sex
|
MEN
|
WOMEN
|
| Age | Age | Age | Age | Men
| Age | Age | Age | Age |Women
|Grand
WRAT Spelling Score |00-21 %|22-39 %|40-54 %|55-99 %|Total % |00-21 %|22-39 %|40-54 %|55-99 %|Total % |Total %
------------------------------------------------------------------------------------------------------------------------------------
LESS THAN GRADE 6 | 76 42| 1312 45| 1053 58| 199 59| 2640 50 | 2 25| 45 37| 26 33| 12 52| 85 36 | 2725 50
6TH THRU 8TH GRADE | 54 30| 774 27| 368 20| 68 20| 1264 24 | 4 50| 30 24| 18 23| 3 13| 55 24 | 1319 24
GRADE 9
| 13 7| 168 6| 104 6| 13 4| 298 6 | 1 13| 8 7| 3 4| 3 13| 15 6 | 313 6
GRADE 10
| 16 9| 176 6| 68 4| 14 4| 274 5 | 0 0| 9 7| 7 9| 0 0| 16 7 | 290 5
GRADE 11
| 6 3| 140 5| 45 2| 5 1| 196 4 | 1 13| 4 3| 5 6| 2 9| 12 5 | 208 4
GRADE 12
| 11 6| 289 10| 170 9| 39 11| 509 10 | 0 0| 8 7| 5 6| 0 0| 13 6 | 522 10
MORE THAN GRADE 12 | 5 3| 41 1| 13 1| 2 1| 61 1 | 0 0| 19 15| 15 19| 3 13| 37 16 | 98 2
------------------------------------------------------------------------------------------------------------------------------------
Total reported
| 181 100| 2900 100| 1821 100| 340 100| 5242 100 | 8 100| 123 100| 79 100| 23 100| 233 100 | 5475 100
|
|
|
|
|
|
|
|
|
|
|
Percent reported |
95.8|
95.6|
88.3|
83.5|
92.1 |
88.9|
97.6|
95.2|
92.0|
95.9 |
92.2
|
|
|
|
|
|
|
|
|
|
|
|
|
|
|
|
|
|
|
|
|
|
NOT REPORTED
| 8 | 133 | 242 | 67 | 450
| 1 | 3 | 4 | 2 | 10
| 460
------------------------------------------------------------------------------------------------------------------------------------
Total
| 189 | 3033 | 2063 | 407 | 5692
| 9 | 126 | 83 | 25 | 243
| 5935
|
|
|
|
|
|
|
|
|
|
|
|
|
|
|
|
|
|
|
|
|
|
|
|
|
|
|
|
|
|
|
|
|
|
|
|
|
|
|
|
|
|
|
|
|
|
|
|
|
|
|
|
|
|
|
AVG SPELLING SCORE | 7.01 | 6.89 | 6.04 | 5.87 | 6.53 | 7.58 | 7.87 | 8.17 | 6.55 | 7.83 | 6.59
Page 10 Run 10/24/00
Georgia Department of Corrections Office of Planning and Analysis
Inmate statistical profile
Sample: ACTIVE PRISONERS SERVING LIFE EXCLUDING JAIL
Requestor: Statistics
Active inmates 10/24/2000
Self-Rpt Guardian Status To Age 16 by current age & sex
|
MEN
|
WOMEN
|
| Age | Age | Age | Age | Men
| Age | Age | Age | Age |Women
|Grand
Guardian Status
|00-21 %|22-39 %|40-54 %|55-99 %|Total % |00-21 %|22-39 %|40-54 %|55-99 %|Total % |Total %
------------------------------------------------------------------------------------------------------------------------------------
ORPHANAGE
| 0 0| 5 0| 3 0| 3 1| 11 0 | 0 0| 0 0| 0 0| 0 0| 0 0 | 11 0
FATHER ONLY
| 11 6| 81 3| 59 3| 6 2| 157 3 | 0 0| 2 2| 2 2| 1 4| 5 2 | 162 3
FTR MTR HD
| 13 7| 117 4| 67 3| 6 2| 203 4 | 0 0| 2 2| 4 5| 0 0| 6 3 | 209 4
MOTHER ONLY
| 89 48| 1399 47| 647 32| 104 26| 2239 40 | 5 56| 45 36| 26 32| 9 39| 85 36 | 2324 40
MTR FTR HD
| 43 23| 947 32| 967 48| 217 55| 2174 39 | 4 44| 49 40| 43 53| 12 52| 108 46 | 2282 39
OTH FEMALE
| 1 1| 57 2| 48 2| 17 4| 123 2 | 0 0| 4 3| 2 2| 0 0| 6 3 | 129 2
OTH MALE
| 1 1| 6 0| 11 1| 1 0| 19 0 | 0 0| 2 2| 1 1| 0 0| 3 1 | 22 0
STEP-PARNTS
| 4 2| 54 2| 25 1| 6 2| 89 2 | 0 0| 0 0| 0 0| 0 0| 0 0 | 89 2
FOSTER HOME
| 4 2| 25 1| 31 2| 7 2| 67 1 | 0 0| 2 2| 0 0| 0 0| 2 1 | 69 1
GRAND PRNTS
| 14 8| 234 8| 136 7| 24 6| 408 7 | 0 0| 14 11| 3 4| 1 4| 18 8 | 426 7
OTHER
| 4 2| 61 2| 27 1| 4 1| 96 2 | 0 0| 4 3| 0 0| 0 0| 4 2 | 100 2
------------------------------------------------------------------------------------------------------------------------------------
Total reported
| 184 100| 2986 100| 2021 100| 395 100| 5586 100 | 9 100| 124 100| 81 100| 23 100| 237 100 | 5823 100
|
|
|
|
|
|
|
|
|
|
|
Percent reported |
97.4|
98.5|
98.0|
97.1|
98.1 | 100.0|
98.4|
97.6|
92.0|
97.5 |
98.1
|
|
|
|
|
|
|
|
|
|
|
|
|
|
|
|
|
|
|
|
|
|
NOT RPTD
| 5 | 47 | 42 | 12 | 106
|0|2|2|2|6
| 112
------------------------------------------------------------------------------------------------------------------------------------
Total
| 189 | 3033 | 2063 | 407 | 5692
| 9 | 126 | 83 | 25 | 243
| 5935
Page 11 Run 10/24/00
Georgia Department of Corrections Office of Planning and Analysis
Inmate statistical profile
Sample: ACTIVE PRISONERS SERVING LIFE EXCLUDING JAIL
Requestor: Statistics
Active inmates 10/24/2000
Self-Rpt Employment Status Before Prison by current age & sex
|
MEN
|
WOMEN
|
| Age | Age | Age | Age | Men
| Age | Age | Age | Age |Women
|Grand
Employment
|00-21 %|22-39 %|40-54 %|55-99 %|Total % |00-21 %|22-39 %|40-54 %|55-99 %|Total % |Total %
------------------------------------------------------------------------------------------------------------------------------------
FULL TIME
| 33 19| 971 34| 752 38| 159 42| 1915 35 | 0 0| 29 24| 14 18| 4 18| 47 20 | 1962 35
PART TIME
| 11 6| 226 8| 111 6| 19 5| 367 7 | 0 0| 6 5| 3 4| 0 0| 9 4 | 376 7
UNEMPL < 6M
| 10 6| 472 16| 333 17| 53 14| 868 16 | 0 0| 25 21| 19 24| 4 18| 48 21 | 916 16
UNEMPL > 6M
| 22 13| 912 32| 695 35| 108 29| 1737 32 | 2 22| 38 32| 35 44| 12 55| 87 38 | 1824 32
NEVER WORKD
| 74 43| 243 8| 21 1| 3 1| 341 6 | 4 44| 21 18| 4 5| 0 0| 29 13 | 370 7
STUDENT
| 22 13| 28 1| 6 0| 1 0| 57 1 | 3 33| 1 1| 2 3| 0 0| 6 3 | 63 1
INCAPABLE
| 0 0| 32 1| 49 2| 33 9| 114 2 | 0 0| 0 0| 3 4| 2 9| 5 2 | 119 2
OTHER
| 0 0| 0 0| 0 0| 0 0| 0 0 | 0 0| 0 0| 0 0| 0 0| 0 0 | 0 0
------------------------------------------------------------------------------------------------------------------------------------
Total reported
| 172 100| 2884 100| 1967 100| 376 100| 5399 100 | 9 100| 120 100| 80 100| 22 100| 231 100 | 5630 100
|
|
|
|
|
|
|
|
|
|
|
Percent reported |
91.0|
95.1|
95.3|
92.4|
94.9 | 100.0|
95.2|
96.4|
88.0|
95.1 |
94.9
|
|
|
|
|
|
|
|
|
|
|
|
|
|
|
|
|
|
|
|
|
|
NOT RPTD
| 17 | 149 | 96 | 31 | 293
| 0 | 6 | 3 | 3 | 12
| 305
------------------------------------------------------------------------------------------------------------------------------------
Total
| 189 | 3033 | 2063 | 407 | 5692
| 9 | 126 | 83 | 25 | 243
| 5935
* NOTE: THE FIELD LABELD "OTHER" WAS CORRECTED IN APRIL 1989; INMATES CODED "PRE-OTIS NOT REPORTED" NOW HAVE BEEN REMOVED FROM THIS FIELD AND IDENTIFIED AS "NOT REPORTED".
Page 12 Run 10/24/00
Georgia Department of Corrections Office of Planning and Analysis
Inmate statistical profile
Sample: ACTIVE PRISONERS SERVING LIFE EXCLUDING JAIL
Requestor: Statistics
Active inmates 10/24/2000
Self-Rpt Marital Status At Admission by current age & sex
|
MEN
|
WOMEN
|
| Age | Age | Age | Age | Men
| Age | Age | Age | Age |Women
|Grand
Marital Status
|00-21 %|22-39 %|40-54 %|55-99 %|Total % |00-21 %|22-39 %|40-54 %|55-99 %|Total % |Total %
------------------------------------------------------------------------------------------------------------------------------------
SINGLE
| 174 95| 2022 68| 690 34| 57 14| 2943 53 | 9 100| 70 56| 15 18| 3 13| 97 41 | 3040 52
MARRIED
| 2 1| 246 8| 384 19| 108 27| 740 13 | 0 0| 12 10| 17 21| 3 13| 32 13 | 772 13
SEPARATED
| 0 0| 109 4| 166 8| 40 10| 315 6 | 0 0| 12 10| 7 9| 2 9| 21 9 | 336 6
DIVORCED
| 1 1| 146 5| 356 18| 90 23| 593 11 | 0 0| 9 7| 16 20| 5 22| 30 13 | 623 11
WIDOWED
| 2 1| 37 1| 94 5| 53 13| 186 3 | 0 0| 6 5| 19 23| 9 39| 34 14 | 220 4
COMMON LAW
| 5 3| 423 14| 336 17| 48 12| 812 15 | 0 0| 16 13| 8 10| 1 4| 25 10 | 837 14
OTHER
| 0 0| 2 0| 1 0| 0 0| 3 0 | 0 0| 0 0| 0 0| 0 0| 0 0 | 3 0
------------------------------------------------------------------------------------------------------------------------------------
Total reported
| 184 100| 2985 100| 2027 100| 396 100| 5592 100 | 9 100| 125 100| 82 100| 23 100| 239 100 | 5831 100
|
|
|
|
|
|
|
|
|
|
|
Percent reported |
97.4|
98.4|
98.3|
97.3|
98.2 | 100.0|
99.2|
98.8|
92.0|
98.4 |
98.2
|
|
|
|
|
|
|
|
|
|
|
|
|
|
|
|
|
|
|
|
|
|
NOT RPTD
| 5 | 48 | 36 | 11 | 100
|0|1|1|2|4
| 104
------------------------------------------------------------------------------------------------------------------------------------
Total
| 189 | 3033 | 2063 | 407 | 5692
| 9 | 126 | 83 | 25 | 243
| 5935
Page 13 Run 10/24/00
Georgia Department of Corrections Office of Planning and Analysis
Inmate statistical profile
Sample: ACTIVE PRISONERS SERVING LIFE EXCLUDING JAIL
Requestor: Statistics
Active inmates 10/24/2000
Self-Rpt Number Of Children At Admission by current age & sex
|
MEN
|
WOMEN
|
| Age | Age | Age | Age | Men
| Age | Age | Age | Age |Women
|Grand
Number Of Children |00-21 %|22-39 %|40-54 %|55-99 %|Total % |00-21 %|22-39 %|40-54 %|55-99 %|Total % |Total %
------------------------------------------------------------------------------------------------------------------------------------
NO CHILDREN
| 0 0| 447 22| 266 17| 37 11| 750 19 | 0 0| 3 3| 3 4| 1 4| 7 4 | 757 18
ONE CHILD
| 38 73| 758 38| 471 30| 60 17| 1327 33 | 0 0| 31 31| 14 19| 1 4| 46 24 | 1373 33
TWO CHILDREN
| 11 21| 423 21| 370 23| 75 22| 879 22 | 0 0| 33 33| 23 32| 8 35| 64 33 | 943 22
THREE CHILDREN
| 2 4| 240 12| 235 15| 69 20| 546 14 | 0 0| 19 19| 14 19| 7 30| 40 21 | 586 14
FOUR CHILDREN
| 0 0| 85 4| 119 7| 43 12| 247 6 | 0 0| 7 7| 11 15| 4 17| 22 11 | 269 6
FIVE CHILDREN
| 1 2| 31 2| 68 4| 23 7| 123 3 | 0 0| 4 4| 3 4| 1 4| 8 4 | 131 3
MORE THAN 5 CHILDREN| 0 0| 35 2| 60 4| 39 11| 134 3 | 0 0| 2 2| 5 7| 1 4| 8 4 | 142 3
------------------------------------------------------------------------------------------------------------------------------------
Total reported
| 52 100| 2019 100| 1589 100| 346 100| 4006 100 | 0 0| 99 100| 73 100| 23 100| 195 100 | 4201 100
|
|
|
|
|
|
|
|
|
|
|
Percent reported |
27.5|
66.6|
77.0|
85.0|
70.4 |
.0|
78.6|
88.0|
92.0|
80.2 |
70.8
|
|
|
|
|
|
|
|
|
|
|
|
|
|
|
|
|
|
|
|
|
|
NOT REPORTED
| 137 | 1014 | 474 | 61 | 1686
| 9 | 27 | 10 | 2 | 48
| 1734
------------------------------------------------------------------------------------------------------------------------------------
Total
| 189 | 3033 | 2063 | 407 | 5692
| 9 | 126 | 83 | 25 | 243
| 5935
|
|
|
|
|
|
|
|
|
|
|
|
|
|
|
|
|
|
|
|
|
|
|
|
|
|
|
|
|
|
|
|
|
|
|
|
|
|
|
|
|
|
|
|
|
|
|
|
|
|
|
|
|
|
|
AVG NUM CHILDREN | 1.37 | 1.61 | 2.06 | 2.86 | 1.89 | .00 | 2.16 | 2.66 | 2.87 | 2.43 | 1.92
* NOTE: THE FIELD LABLED "NO CHILDREN" WAS CORRECTED IN MARCH 1989: MISSING DATA FOR INMATES STILL IN DIAGNOSTICS NOW HAS BEEN REMOVED FROM THIS FIELD AND IDENTIFIED AS "NOT REPORTED" INFORMATION.
Page 14 Run 10/24/00
Georgia Department of Corrections Office of Planning and Analysis
Inmate statistical profile
Sample: ACTIVE PRISONERS SERVING LIFE EXCLUDING JAIL
Requestor: Statistics
Active inmates 10/24/2000
Self-Rpt Religious Affiliation by current age & sex
|
MEN
|
WOMEN
|
| Age | Age | Age | Age | Men
| Age | Age | Age | Age |Women
|Grand
Religion
|00-21 %|22-39 %|40-54 %|55-99 %|Total % |00-21 %|22-39 %|40-54 %|55-99 %|Total % |Total %
------------------------------------------------------------------------------------------------------------------------------------
ISLAM
| 2 1| 151 5| 71 4| 10 3| 234 4 | 0 0| 1 1| 0 0| 0 0| 1 0 | 235 4
CATHOLIC
| 4 2| 89 3| 61 3| 19 5| 173 3 | 0 0| 7 6| 3 4| 1 5| 11 5 | 184 3
BAPTIST
| 85 47| 1484 52| 1183 63| 220 58| 2972 56 | 4 44| 67 56| 43 54| 15 68| 129 56 | 3101 56
METHODIST
| 3 2| 72 3| 86 5| 25 7| 186 4 | 0 0| 5 4| 8 10| 1 5| 14 6 | 200 4
EPISCOPLN
| 1 1| 4 0| 4 0| 3 1| 12 0 | 0 0| 1 1| 2 3| 0 0| 3 1 | 15 0
PRESBYTRN
| 0 0| 7 0| 8 0| 3 1| 18 0 | 0 0| 0 0| 0 0| 2 9| 2 1 | 20 0
CHC OF GOD
| 0 0| 32 1| 24 1| 9 2| 65 1 | 0 0| 4 3| 1 1| 0 0| 5 2 | 70 1
HOLINESS
| 7 4| 132 5| 89 5| 25 7| 253 5 | 2 22| 15 13| 11 14| 0 0| 28 12 | 281 5
JEWISH
| 0 0| 1 0| 3 0| 1 0| 5 0 | 0 0| 0 0| 0 0| 0 0| 0 0 | 5 0
ANGLICAN
| 0 0| 0 0| 0 0| 0 0| 0 0 | 0 0| 1 1| 0 0| 0 0| 1 0 | 1 0
GRK ORTHDX
| 0 0| 0 0| 0 0| 0 0| 0 0 | 0 0| 0 0| 0 0| 0 0| 0 0 | 0 0
HINDU
| 0 0| 0 0| 0 0| 0 0| 0 0 | 0 0| 0 0| 0 0| 0 0| 0 0 | 0 0
BUDDHIST
| 2 1| 2 0| 1 0| 0 0| 5 0 | 0 0| 0 0| 0 0| 0 0| 0 0 | 5 0
TAOIST
| 0 0| 0 0| 0 0| 0 0| 0 0 | 0 0| 0 0| 0 0| 0 0| 0 0 | 0 0
SHINTOIST
| 0 0| 0 0| 0 0| 0 0| 0 0 | 0 0| 0 0| 0 0| 0 0| 0 0 | 0 0
SEVEN D AD
| 0 0| 5 0| 4 0| 1 0| 10 0 | 0 0| 0 0| 0 0| 0 0| 0 0 | 10 0
JEHOVAH WT
| 1 1| 25 1| 11 1| 0 0| 37 1 | 0 0| 0 0| 0 0| 0 0| 0 0 | 37 1
LATR DAY S
| 0 0| 3 0| 0 0| 0 0| 3 0 | 0 0| 0 0| 0 0| 0 0| 0 0 | 3 0
QUAKER
| 0 0| 0 0| 0 0| 0 0| 0 0 | 0 0| 0 0| 0 0| 0 0| 0 0 | 0 0
OTHER PROD
| 14 8| 215 8| 62 3| 16 4| 307 6 | 0 0| 7 6| 6 8| 1 5| 14 6 | 321 6
NONE
| 46 25| 429 15| 140 7| 13 3| 628 12 | 1 11| 5 4| 1 1| 0 0| 7 3 | 635 11
OTHER
| 16 9| 206 7| 142 8| 33 9| 397 7 | 2 22| 7 6| 5 6| 2 9| 16 7 | 413 7
------------------------------------------------------------------------------------------------------------------------------------
Total reported
| 181 100| 2857 100| 1889 100| 378 100| 5305 100 | 9 100| 120 100| 80 100| 22 100| 231 100 | 5536 100
|
|
|
|
|
|
|
|
|
|
|
Percent reported |
95.8|
94.2|
91.6|
92.9|
93.2 | 100.0|
95.2|
96.4|
88.0|
95.1 |
93.3
|
|
|
|
|
|
|
|
|
|
|
|
|
|
|
|
|
|
|
|
|
|
NOT RPTD
| 8 | 176 | 174 | 29 | 387
| 0 | 6 | 3 | 3 | 12
| 399
------------------------------------------------------------------------------------------------------------------------------------
Total
| 189 | 3033 | 2063 | 407 | 5692
| 9 | 126 | 83 | 25 | 243
| 5935
Page 15 Run 10/24/00
Georgia Department of Corrections Office of Planning and Analysis
Inmate statistical profile
Sample: ACTIVE PRISONERS SERVING LIFE EXCLUDING JAIL
Requestor: Statistics
Active inmates 10/24/2000
Self-Rpt Family Behavior Patterns * by current age & sex
|
MEN
|
WOMEN
|
| Age | Age | Age | Age | Men
| Age | Age | Age | Age |Women
|Grand
Family Behavior
|00-21 %|22-39 %|40-54 %|55-99 %|Total % |00-21 %|22-39 %|40-54 %|55-99 %|Total % |Total %
------------------------------------------------------------------------------------------------------------------------------------
CRIMINLTY
| 48 20| 798 24| 518 29| 71 25| 1435 26 | 4 15| 34 18| 18 23| 2 13| 58 19 | 1493 25
ALCOHOLISM
| 17 7| 331 10| 277 15| 45 16| 670 12 | 3 12| 28 15| 15 19| 1 6| 47 15 | 717 12
DRUG ABUSE
| 19 8| 173 5| 66 4| 6 2| 264 5 | 2 8| 17 9| 6 8| 0 0| 25 8 | 289 5
DOMINERING
| 1 0| 13 0| 12 1| 0 0| 26 0 | 5 19| 12 6| 5 6| 2 13| 24 8 | 50 1
MIGRANT
| 1 0| 48 1| 43 2| 0 0| 92 2 | 1 4| 2 1| 2 3| 0 0| 5 2 | 97 2
INFL BTGS
| 7 3| 138 4| 69 4| 15 5| 229 4 | 2 8| 21 11| 5 6| 2 13| 30 10 | 259 4
PERMISSIVE
| 0 0| 8 0| 14 1| 2 1| 24 0 | 1 4| 4 2| 2 3| 0 0| 7 2 | 31 1
FATH ABSNT
| 107 45| 1463 44| 634 35| 118 41| 2322 41 | 5 19| 48 25| 16 21| 7 44| 76 25 | 2398 40
MOTH ABSNT
| 31 13| 296 9| 144 8| 31 11| 502 9 | 1 4| 15 8| 2 3| 1 6| 19 6 | 521 9
NONE
| 6 3| 37 1| 14 1| 0 0| 57 1 | 2 8| 8 4| 7 9| 1 6| 18 6 | 75 1
------------------------------------------------------------------------------------------------------------------------------------
Total reported
| 237 100| 3305 100| 1791 100| 288 100| 5621 100 | 26 100| 189 100| 78 100| 16 100| 309 100 | 5930 100
|
|
|
|
|
|
|
|
|
|
|
Percent reported |
74.6|
69.3|
60.5|
49.9|
64.9 | 100.0|
69.0|
59.0|
44.0|
64.2 |
64.9
|
|
|
|
|
|
|
|
|
|
|
|
|
|
|
|
|
|
|
|
|
|
OTHER
| 48 | 931 | 815 | 204 | 1998
| 0 | 39 | 34 | 14 | 87
| 2085
------------------------------------------------------------------------------------------------------------------------------------
Total
| 189 | 3033 | 2063 | 407 | 5692
| 9 | 126 | 83 | 25 | 243
| 5935
* NOTE: SINCE THERE CAN BE UP TO FIVE BEHAVIOR CODES PER INMATE, THE NUMBER OF CASES REPORTED IN THE DETAIL LINES AND THE TOTAL REPORTED LINE MAY EXCEED THE TOTAL NUMBER OF CASES. IN SHORT, THIS TABLE COUNTS THE NUMBER OF BEHAVIOR PROBLEMS, NOT INMATES.
Page 16 Run 10/24/00
Georgia Department of Corrections Office of Planning and Analysis
Inmate statistical profile
Sample: ACTIVE PRISONERS SERVING LIFE EXCLUDING JAIL
Requestor: Statistics
Active inmates 10/24/2000
Inmate Diagnostic Behavior Problem * by current age & sex
|
MEN
|
WOMEN
|
| Age | Age | Age | Age | Men
| Age | Age | Age | Age |Women
|Grand
Diagnostic Problem |00-21 %|22-39 %|40-54 %|55-99 %|Total % |00-21 %|22-39 %|40-54 %|55-99 %|Total % |Total %
------------------------------------------------------------------------------------------------------------------------------------
ALCOHOLIC
| 0 0| 138 3| 139 4| 36 6| 313 3 | 1 4| 3 1| 13 9| 1 3| 18 4 | 331 3
ALCOH ABSE
| 41 11| 886 17| 630 17| 113 18| 1670 17 | 1 4| 30 14| 16 11| 6 18| 53 13 | 1723 17
DRUG EXP
| 62 17| 767 14| 358 10| 36 6| 1223 12 | 3 13| 21 10| 15 11| 0 0| 39 10 | 1262 12
DRUG ABSE
| 69 19| 969 18| 643 18| 40 6| 1721 17 | 4 17| 42 20| 24 17| 1 3| 71 17 | 1792 17
NARC ADDCT
| 1 0| 103 2| 90 2| 6 1| 200 2 | 0 0| 4 2| 2 1| 1 3| 7 2 | 207 2
EPILEPTIC
| 1 0| 25 0| 25 1| 4 1| 55 1 | 0 0| 0 0| 2 1| 0 0| 2 0 | 57 1
MANIPULTVE
| 23 6| 232 4| 105 3| 19 3| 379 4 | 1 4| 2 1| 0 0| 1 3| 4 1 | 383 4
ASSAULTIVE
| 124 34| 1315 25| 920 25| 170 27| 2529 25 | 7 29| 52 25| 29 21| 6 18| 94 23 | 2623 25
ESCPE TEND
| 4 1| 115 2| 209 6| 40 6| 368 4 | 0 0| 2 1| 4 3| 0 0| 6 1 | 374 4
SUICIDAL
| 12 3| 142 3| 104 3| 15 2| 273 3 | 4 17| 16 8| 7 5| 2 6| 29 7 | 302 3
WITHDRAWN
| 0 0| 35 1| 20 1| 7 1| 62 1 | 1 4| 2 1| 3 2| 0 0| 6 1 | 68 1
PR RLTY CT
| 1 0| 35 1| 48 1| 12 2| 96 1 | 1 4| 1 0| 3 2| 1 3| 6 1 | 102 1
HOMOSEXUAL
| 2 1| 12 0| 9 0| 5 1| 28 0 | 1 4| 4 2| 2 1| 0 0| 7 2 | 35 0
NONE
| 1 0| 303 6| 233 6| 70 11| 607 6 | 0 0| 11 5| 14 10| 9 27| 34 8 | 641 6
OTHER
| 4 1| 74 1| 59 2| 22 4| 159 2 | 0 0| 0 0| 0 0| 3 9| 3 1 | 162 2
NOT RPTD
| 17 5| 192 4| 66 2| 24 4| 299 3 | 0 0| 18 9| 6 4| 2 6| 26 6 | 325 3
------------------------------------------------------------------------------------------------------------------------------------
Total reported
| 362 100| 5352 100| 3659 100| 620 100| 9993 100 | 24 100| 208 100| 141 100| 33 100| 406 100 |10399 100
|
|
|
|
|
|
|
|
|
|
|
Percent reported | 100.0|
99.7| 100.0|
99.8|
99.8 | 100.0| 100.0|
98.8| 100.0|
99.6 |
99.8
|
|
|
|
|
|
|
|
|
|
|
|
|
|
|
|
|
|
|
|
|
|
UNKNOWN
| 0 | 9 | 1 | 1 | 11
|0|0|1|0|1
| 12
------------------------------------------------------------------------------------------------------------------------------------
Total
| 189 | 3033 | 2063 | 407 | 5692
| 9 | 126 | 83 | 25 | 243
| 5935
* NOTE: SINCE THERE CAN BE UP TO FIVE BEHAVIOR CODES PER INMATE, THE NUMBER OF CASES REPORTED IN THE DETAIL LINES AND THE TOTAL REPORTED LINE MAY EXCEED THE TOTAL NUMBER OF CASES. IN SHORT, THIS TABLE COUNTS THE NUMBER OF BEHAVIOR PROBLEMS, NOT INMATES.
Page 17 Run 10/24/00
Georgia Department of Corrections Office of Planning and Analysis
Inmate statistical profile
Sample: ACTIVE PRISONERS SERVING LIFE EXCLUDING JAIL
Requestor: Statistics
Active inmates 10/24/2000
Physical Profile (General Condition) by current age & sex
|
MEN
|
WOMEN
|
| Age | Age | Age | Age | Men
| Age | Age | Age | Age |Women
|Grand
Physical Profile |00-21 %|22-39 %|40-54 %|55-99 %|Total % |00-21 %|22-39 %|40-54 %|55-99 %|Total % |Total %
------------------------------------------------------------------------------------------------------------------------------------
NO LIMITATION
| 164 90| 2215 74| 1020 50| 78 19| 3477 62 | 8 89| 91 75| 40 49| 1 5| 140 60 | 3617 62
DEFECT NO MAJOR LIMT| 14 8| 412 14| 463 23| 96 24| 985 18 | 0 0| 5 4| 10 12| 5 23| 20 9 | 1005 17
DEFECT MAJOR LIMIT | 5 3| 364 12| 552 27| 199 49| 1120 20 | 1 11| 26 21| 31 38| 14 64| 72 31 | 1192 20
VERY MAJOR DEFECT | 0 0| 3 0| 13 1| 30 7| 46 1 | 0 0| 0 0| 1 1| 2 9| 3 1 | 49 1
------------------------------------------------------------------------------------------------------------------------------------
Total reported
| 183 100| 2994 100| 2048 100| 403 100| 5628 100 | 9 100| 122 100| 82 100| 22 100| 235 100 | 5863 100
|
|
|
|
|
|
|
|
|
|
|
Percent reported |
96.8|
98.7|
99.3|
99.0|
98.9 | 100.0|
96.8|
98.8|
88.0|
96.7 |
98.8
|
|
|
|
|
|
|
|
|
|
|
|
|
|
|
|
|
|
|
|
|
|
NOT REPORTED
| 6 | 39 | 15 | 4 | 64
|0|4|1|3|8
| 72
------------------------------------------------------------------------------------------------------------------------------------
Total
| 189 | 3033 | 2063 | 407 | 5692
| 9 | 126 | 83 | 25 | 243
| 5935
Page 18 Run 10/24/00
Georgia Department of Corrections Office of Planning and Analysis
Inmate statistical profile
Sample: ACTIVE PRISONERS SERVING LIFE EXCLUDING JAIL
Requestor: Statistics
Active inmates 10/24/2000
Security Status by current age & sex
|
MEN
|
WOMEN
|
| Age | Age | Age | Age | Men
| Age | Age | Age | Age |Women
|Grand
Security
|00-21 %|22-39 %|40-54 %|55-99 %|Total % |00-21 %|22-39 %|40-54 %|55-99 %|Total % |Total %
------------------------------------------------------------------------------------------------------------------------------------
DIAG INCOM
| 0 0| 7 0| 2 0| 0 0| 9 0 | 0 0| 0 0| 0 0| 0 0| 0 0 | 9 0
WRK RELEAS
| 0 0| 0 0| 0 0| 1 0| 1 0 | 0 0| 0 0| 0 0| 0 0| 0 0 | 1 0
TRUSTY
| 0 0| 63 2| 42 2| 4 1| 109 2 | 0 0| 1 1| 3 4| 1 4| 5 2 | 114 2
MINIMUM
| 1 1| 378 12| 454 22| 79 19| 912 16 | 0 0| 32 25| 28 34| 12 48| 72 30 | 984 17
MEDIUM
| 21 11| 1265 42| 1074 52| 251 62| 2611 46 | 0 0| 60 48| 38 46| 11 44| 109 45 | 2720 46
CLOSE
| 155 82| 1138 38| 387 19| 63 15| 1743 31 | 8 89| 33 26| 12 14| 1 4| 54 22 | 1797 30
MAXIMUM
| 6 3| 168 6| 94 5| 7 2| 275 5 | 1 11| 0 0| 2 2| 0 0| 3 1 | 278 5
DIAGNOSTIC
| 6 3| 14 0| 10 0| 2 0| 32 1 | 0 0| 0 0| 0 0| 0 0| 0 0 | 32 1
------------------------------------------------------------------------------------------------------------------------------------
Total reported
| 189 100| 3033 100| 2063 100| 407 100| 5692 100 | 9 100| 126 100| 83 100| 25 100| 243 100 | 5935 100
|
|
|
|
|
|
|
|
|
|
|
Percent reported | 100.0| 100.0| 100.0| 100.0| 100.0 | 100.0| 100.0| 100.0| 100.0| 100.0 | 100.0
|
|
|
|
|
|
|
|
|
|
|
|
|
|
|
|
|
|
|
|
|
|
NOT RPTD
|0|0|0|0|0
|0|0|0|0|0
|0
------------------------------------------------------------------------------------------------------------------------------------
Total
| 189 | 3033 | 2063 | 407 | 5692
| 9 | 126 | 83 | 25 | 243
| 5935
* NOTE: BEGINNING IN JULY 1987, THE FACILITIES DIVISION NO LONGER CODED INMATES AS BEING WORK RELEASE
Page 19 Run 10/24/00
Georgia Department of Corrections Office of Planning and Analysis
Inmate statistical profile
Sample: ACTIVE PRISONERS SERVING LIFE EXCLUDING JAIL
Requestor: Statistics
Active inmates 10/24/2000
Number Of Sentences by current age & sex
|
MEN
|
WOMEN
|
| Age | Age | Age | Age | Men
| Age | Age | Age | Age |Women
|Grand
Number Of Sentences |00-21 %|22-39 %|40-54 %|55-99 %|Total % |00-21 %|22-39 %|40-54 %|55-99 %|Total % |Total %
------------------------------------------------------------------------------------------------------------------------------------
ONE
| 59 31| 735 24| 538 26| 140 34| 1472 26 | 4 44| 47 37| 37 45| 12 48| 100 41 | 1572 26
TWO
| 50 26| 715 24| 475 23| 104 26| 1344 24 | 2 22| 41 33| 23 28| 8 32| 74 30 | 1418 24
THREE
| 30 16| 513 17| 370 18| 57 14| 970 17 | 1 11| 19 15| 10 12| 5 20| 35 14 | 1005 17
FOUR
| 19 10| 349 12| 229 11| 38 9| 635 11 | 1 11| 9 7| 4 5| 0 0| 14 6 | 649 11
FIVE
| 7 4| 230 8| 148 7| 20 5| 405 7 | 1 11| 5 4| 3 4| 0 0| 9 4 | 414 7
MORE THAN FIVE
| 24 13| 491 16| 303 15| 48 12| 866 15 | 0 0| 5 4| 6 7| 0 0| 11 5 | 877 15
------------------------------------------------------------------------------------------------------------------------------------
Total reported
| 189 100| 3033 100| 2063 100| 407 100| 5692 100 | 9 100| 126 100| 83 100| 25 100| 243 100 | 5935 100
|
|
|
|
|
|
|
|
|
|
|
Percent reported | 100.0| 100.0| 100.0| 100.0| 100.0 | 100.0| 100.0| 100.0| 100.0| 100.0 | 100.0
|
|
|
|
|
|
|
|
|
|
|
|
|
|
|
|
|
|
|
|
|
|
NOT REPORTED
|0|0|0|0|0
|0|0|0|0|0
|0
------------------------------------------------------------------------------------------------------------------------------------
Total
| 189 | 3033 | 2063 | 407 | 5692
| 9 | 126 | 83 | 25 | 243
| 5935
|
|
|
|
|
|
|
|
|
|
|
|
|
|
|
|
|
|
|
|
|
|
|
|
|
|
|
|
|
|
|
|
|
|
|
|
|
|
|
|
|
|
|
|
|
|
|
|
|
|
|
|
|
|
|
AVG NUM SENTENCES | 2.89 | 3.42 | 3.31 | 2.88 | 3.32 | 2.22 | 2.32 | 2.28 | 1.72 | 2.24 | 3.28
Page 20 Run 10/24/00
Georgia Department of Corrections Office of Planning and Analysis
Inmate statistical profile
Sample: ACTIVE PRISONERS SERVING LIFE EXCLUDING JAIL
Requestor: Statistics
Active inmates 10/24/2000
Number Of Disciplinaries by current age & sex
|
MEN
|
WOMEN
|
| Age | Age | Age | Age | Men
| Age | Age | Age | Age |Women
|Grand
Disciplinaries
|00-21 %|22-39 %|40-54 %|55-99 %|Total % |00-21 %|22-39 %|40-54 %|55-99 %|Total % |Total %
------------------------------------------------------------------------------------------------------------------------------------
ZERO
| 40 21| 476 16| 346 17| 116 29| 978 17 | 2 22| 26 21| 30 36| 12 48| 70 29 | 1048 18
ONE
| 20 11| 305 10| 271 13| 67 16| 663 12 | 1 11| 13 10| 11 13| 6 24| 31 13 | 694 12
TWO
| 15 8| 258 9| 193 9| 41 10| 507 9 | 0 0| 14 11| 10 12| 1 4| 25 10 | 532 9
THREE
| 13 7| 186 6| 148 7| 39 10| 386 7 | 0 0| 9 7| 9 11| 2 8| 20 8 | 406 7
FOUR
| 8 4| 174 6| 116 6| 26 6| 324 6 | 1 11| 9 7| 2 2| 1 4| 13 5 | 337 6
FIVE
| 4 2| 151 5| 88 4| 14 3| 257 5 | 1 11| 2 2| 3 4| 1 4| 7 3 | 264 4
MORE THAN FIVE
| 89 47| 1482 49| 900 44| 104 26| 2575 45 | 4 44| 53 42| 18 22| 2 8| 77 32 | 2652 45
------------------------------------------------------------------------------------------------------------------------------------
Total reported
| 189 100| 3032 100| 2062 100| 407 100| 5690 100 | 9 100| 126 100| 83 100| 25 100| 243 100 | 5933 100
|
|
|
|
|
|
|
|
|
|
|
Percent reported | 100.0| 100.0| 100.0| 100.0| 100.0 | 100.0| 100.0| 100.0| 100.0| 100.0 | 100.0
|
|
|
|
|
|
|
|
|
|
|
|
|
|
|
|
|
|
|
|
|
|
NOT REPORTED
|0|1|1|0|2
|0|0|0|0|0
|2
------------------------------------------------------------------------------------------------------------------------------------
Total
| 189 | 3033 | 2063 | 407 | 5692
| 9 | 126 | 83 | 25 | 243
| 5935
|
|
|
|
|
|
|
|
|
|
|
|
|
|
|
|
|
|
|
|
|
|
|
|
|
|
|
|
|
|
|
|
|
|
|
|
|
|
|
|
|
|
|
|
|
|
|
|
|
|
|
|
|
|
|
AVG NUM DISCIP
| 10.31 | 10.48 | 9.89 | 5.36 | 9.90 | 5.44 | 8.09 | 4.54 | 1.60 | 6.11 | 9.74
Page 21 Run 10/24/00
Georgia Department of Corrections Office of Planning and Analysis
Inmate statistical profile
Sample: ACTIVE PRISONERS SERVING LIFE EXCLUDING JAIL
Requestor: Statistics
Active inmates 10/24/2000
Number Of Escapes by current age & sex
|
MEN
|
WOMEN
|
| Age | Age | Age | Age | Men
| Age | Age | Age | Age |Women
|Grand
Escapes
|00-21 %|22-39 %|40-54 %|55-99 %|Total % |00-21 %|22-39 %|40-54 %|55-99 %|Total % |Total %
------------------------------------------------------------------------------------------------------------------------------------
ZERO
| 189 100| 2998 99| 1975 96| 390 96| 5552 98 | 9 100| 126 100| 81 98| 25 100| 241 99 | 5793 98
ONE
| 0 0| 34 1| 70 3| 11 3| 115 2 | 0 0| 0 0| 2 2| 0 0| 2 1 | 117 2
TWO
| 0 0| 1 0| 14 1| 4 1| 19 0 | 0 0| 0 0| 0 0| 0 0| 0 0 | 19 0
THREE
| 0 0| 0 0| 3 0| 2 0| 5 0 | 0 0| 0 0| 0 0| 0 0| 0 0 | 5 0
FOUR
| 0 0| 0 0| 1 0| 0 0| 1 0 | 0 0| 0 0| 0 0| 0 0| 0 0 | 1 0
FIVE
| 0 0| 0 0| 0 0| 0 0| 0 0 | 0 0| 0 0| 0 0| 0 0| 0 0 | 0 0
MORE THAN FIVE
| 0 0| 0 0| 0 0| 0 0| 0 0 | 0 0| 0 0| 0 0| 0 0| 0 0 | 0 0
------------------------------------------------------------------------------------------------------------------------------------
Total reported
| 189 100| 3033 100| 2063 100| 407 100| 5692 100 | 9 100| 126 100| 83 100| 25 100| 243 100 | 5935 100
|
|
|
|
|
|
|
|
|
|
|
Percent reported | 100.0| 100.0| 100.0| 100.0| 100.0 | 100.0| 100.0| 100.0| 100.0| 100.0 | 100.0
|
|
|
|
|
|
|
|
|
|
|
|
|
|
|
|
|
|
|
|
|
|
NOT REPORTED
|0|0|0|0|0
|0|0|0|0|0
|0
------------------------------------------------------------------------------------------------------------------------------------
Total
| 189 | 3033 | 2063 | 407 | 5692
| 9 | 126 | 83 | 25 | 243
| 5935
|
|
|
|
|
|
|
|
|
|
|
|
|
|
|
|
|
|
|
|
|
|
|
|
|
|
|
|
|
|
|
|
|
|
|
|
|
|
|
|
|
|
|
|
|
|
|
|
|
|
|
|
|
|
|
AVG NUM ESCAPES
| .00 | .01 | .05 | .06 | .03 | .00 | .00 | .02 | .00 | .01 | .03
Page 22 Run 10/24/00
Georgia Department of Corrections Office of Planning and Analysis
Inmate statistical profile
Sample: ACTIVE PRISONERS SERVING LIFE EXCLUDING JAIL
Requestor: Statistics
Active inmates 10/24/2000
Number Of Prior Georgia Incarcerations * by current age & sex
|
MEN
|
WOMEN
|
| Age | Age | Age | Age | Men
| Age | Age | Age | Age |Women
|Grand
Prior Incarcerations|00-21 %|22-39 %|40-54 %|55-99 %|Total % |00-21 %|22-39 %|40-54 %|55-99 %|Total % |Total %
------------------------------------------------------------------------------------------------------------------------------------
ZERO
| 184 97| 2037 67| 925 45| 228 56| 3374 59 | 9 100| 106 84| 64 77| 23 92| 202 83 | 3576 60
ONE
| 5 3| 576 19| 518 25| 93 23| 1192 21 | 0 0| 15 12| 12 14| 1 4| 28 12 | 1220 21
TWO
| 0 0| 233 8| 325 16| 43 11| 601 11 | 0 0| 3 2| 6 7| 1 4| 10 4 | 611 10
THREE
| 0 0| 126 4| 169 8| 30 7| 325 6 | 0 0| 2 2| 0 0| 0 0| 2 1 | 327 6
FOUR
| 0 0| 46 2| 75 4| 9 2| 130 2 | 0 0| 0 0| 0 0| 0 0| 0 0 | 130 2
FIVE
| 0 0| 12 0| 31 2| 2 0| 45 1 | 0 0| 0 0| 0 0| 0 0| 0 0 | 45 1
MORE THAN FIVE
| 0 0| 3 0| 20 1| 2 0| 25 0 | 0 0| 0 0| 1 1| 0 0| 1 0 | 26 0
------------------------------------------------------------------------------------------------------------------------------------
Total reported
| 189 100| 3033 100| 2063 100| 407 100| 5692 100 | 9 100| 126 100| 83 100| 25 100| 243 100 | 5935 100
|
|
|
|
|
|
|
|
|
|
|
Percent reported | 100.0| 100.0| 100.0| 100.0| 100.0 | 100.0| 100.0| 100.0| 100.0| 100.0 | 100.0
|
|
|
|
|
|
|
|
|
|
|
|
|
|
|
|
|
|
|
|
|
|
NOT REPORTED
|0|0|0|0|0
|0|0|0|0|0
|0
------------------------------------------------------------------------------------------------------------------------------------
Total
| 189 | 3033 | 2063 | 407 | 5692
| 9 | 126 | 83 | 25 | 243
| 5935
|
|
|
|
|
|
|
|
|
|
|
|
|
|
|
|
|
|
|
|
|
|
|
|
|
|
|
|
|
|
|
|
|
|
|
|
|
|
|
|
|
|
|
|
|
|
|
|
|
|
|
|
|
|
|
AVG # INCARCERATIONS| .03 | .56 | 1.09 | .81 | .75 | .00 | .21 | .37 | .12 | .25 | .73
* This data counts a parole revocation on an existing sentenCE AS A prior incarceration. Also, this data counts, for any cohort of inmates, the total number of Georgia incarcerations the inmate has had during his entire criminal career. For example, if an inmate was admitted to prison first in FY72, and then re-admitted in FY79 and FY85, he had two prior incarcerations before the FY85 admission. This inmate's records show two prior incarcerations in all three of his records since he has had two prior incarcerations in his criminal career. If the cohort of FY72 admissions is selected for analysis, two prior incarcerations will be listed for this inmate even though in FY72, he had no prior incarcerations.
Page 23 Run 10/24/00
Georgia Department of Corrections Office of Planning and Analysis
Inmate statistical profile
Sample: ACTIVE PRISONERS SERVING LIFE EXCLUDING JAIL
Requestor: Statistics
Active inmates 10/24/2000
Number Of Transfers by current age & sex
|
MEN
|
WOMEN
|
| Age | Age | Age | Age | Men
| Age | Age | Age | Age |Women
|Grand
Transfers
|00-21 %|22-39 %|40-54 %|55-99 %|Total % |00-21 %|22-39 %|40-54 %|55-99 %|Total % |Total %
------------------------------------------------------------------------------------------------------------------------------------
ZERO
| 54 29| 88 3| 24 1| 4 1| 170 3 | 1 11| 4 3| 5 6| 0 0| 10 4 | 180 3
ONE
| 84 44| 886 29| 397 19| 85 21| 1452 26 | 6 67| 38 30| 30 36| 5 20| 79 33 | 1531 26
TWO
| 39 21| 657 22| 349 17| 71 17| 1116 20 | 1 11| 39 31| 15 18| 5 20| 60 25 | 1176 20
THREE
| 10 5| 473 16| 292 14| 64 16| 839 15 | 1 11| 20 16| 15 18| 6 24| 42 17 | 881 15
FOUR
| 0 0| 332 11| 226 11| 40 10| 598 11 | 0 0| 13 10| 7 8| 3 12| 23 9 | 621 10
FIVE
| 2 1| 220 7| 162 8| 30 7| 414 7 | 0 0| 7 6| 3 4| 3 12| 13 5 | 427 7
MORE THAN FIVE
| 0 0| 377 12| 613 30| 113 28| 1103 19 | 0 0| 5 4| 8 10| 3 12| 16 7 | 1119 19
------------------------------------------------------------------------------------------------------------------------------------
Total reported
| 189 100| 3033 100| 2063 100| 407 100| 5692 100 | 9 100| 126 100| 83 100| 25 100| 243 100 | 5935 100
|
|
|
|
|
|
|
|
|
|
|
Percent reported | 100.0| 100.0| 100.0| 100.0| 100.0 | 100.0| 100.0| 100.0| 100.0| 100.0 | 100.0
|
|
|
|
|
|
|
|
|
|
|
|
|
|
|
|
|
|
|
|
|
|
NOT REPORTED
|0|0|0|0|0
|0|0|0|0|0
|0
------------------------------------------------------------------------------------------------------------------------------------
Total
| 189 | 3033 | 2063 | 407 | 5692
| 9 | 126 | 83 | 25 | 243
| 5935
|
|
|
|
|
|
|
|
|
|
|
|
|
|
|
|
|
|
|
|
|
|
|
|
|
|
|
|
|
|
|
|
|
|
|
|
|
|
|
|
|
|
|
|
|
|
|
|
|
|
|
|
|
|
|
AVG NUM TRANSFERS | 1.07 | 2.98 | 4.49 | 4.40 | 3.57 | 1.22 | 2.37 | 2.47 | 3.44 | 2.47 | 3.52
Page 24 Run 10/24/00
Georgia Department of Corrections Office of Planning and Analysis
Inmate statistical profile
Sample: ACTIVE PRISONERS SERVING LIFE EXCLUDING JAIL
Requestor: Statistics
Active inmates 10/24/2000
County Of Conviction by current age & sex
|
MEN
|
WOMEN
|
| Age | Age | Age | Age | Men
| Age | Age | Age | Age |Women
|Grand
County Of Conviction|00-21 %|22-39 %|40-54 %|55-99 %|Total % |00-21 %|22-39 %|40-54 %|55-99 %|Total % |Total %
------------------------------------------------------------------------------------------------------------------------------------
APPLING COUNTY
| 0 0| 4 0| 4 0| 1 0| 9 0 | 0 0| 0 0| 0 0| 0 0| 0 0 | 9 0
ATKINSON COUNTY
| 0 0| 1 0| 2 0| 2 0| 5 0 | 0 0| 0 0| 1 1| 0 0| 1 0 | 6 0
BACON COUNTY
| 0 0| 6 0| 3 0| 0 0| 9 0 | 0 0| 0 0| 0 0| 0 0| 0 0 | 9 0
BAKER COUNTY
| 0 0| 1 0| 1 0| 0 0| 2 0 | 0 0| 0 0| 0 0| 0 0| 0 0 | 2 0
BALDWIN COUNTY
| 2 1| 16 1| 11 1| 2 0| 31 1 | 0 0| 1 1| 0 0| 0 0| 1 0 | 32 1
BANKS COUNTY
| 0 0| 2 0| 9 0| 2 0| 13 0 | 0 0| 0 0| 0 0| 0 0| 0 0 | 13 0
BARROW COUNTY
| 0 0| 3 0| 9 0| 4 1| 16 0 | 0 0| 0 0| 1 1| 0 0| 1 0 | 17 0
BARTOW COUNTY
| 1 1| 28 1| 22 1| 3 1| 54 1 | 0 0| 2 2| 0 0| 0 0| 2 1 | 56 1
BEN HILL COUNTY
| 0 0| 6 0| 9 0| 3 1| 18 0 | 0 0| 0 0| 0 0| 0 0| 0 0 | 18 0
BERRIEN COUNTY
| 0 0| 4 0| 1 0| 0 0| 5 0 | 0 0| 0 0| 0 0| 0 0| 0 0 | 5 0
BIBB COUNTY
| 4 2| 91 3| 84 4| 15 4| 194 3 | 1 11| 2 2| 1 1| 1 4| 5 2 | 199 3
BLECKLEY COUNTY
| 0 0| 7 0| 4 0| 1 0| 12 0 | 0 0| 0 0| 1 1| 0 0| 1 0 | 13 0
BRANTLEY COUNTY
| 0 0| 1 0| 4 0| 2 0| 7 0 | 0 0| 0 0| 0 0| 0 0| 0 0 | 7 0
BROOKS COUNTY
| 0 0| 5 0| 4 0| 1 0| 10 0 | 0 0| 0 0| 0 0| 0 0| 0 0 | 10 0
BRYAN COUNTY
| 0 0| 9 0| 6 0| 1 0| 16 0 | 0 0| 0 0| 0 0| 1 4| 1 0 | 17 0
BULLOCH COUNTY
| 1 1| 18 1| 15 1| 0 0| 34 1 | 0 0| 1 1| 1 1| 1 4| 3 1 | 37 1
BURKE COUNTY
| 1 1| 16 1| 12 1| 1 0| 30 1 | 0 0| 0 0| 0 0| 0 0| 0 0 | 30 1
BUTTS COUNTY
| 2 1| 22 1| 11 1| 2 0| 37 1 | 0 0| 2 2| 1 1| 0 0| 3 1 | 40 1
CALHOUN COUNTY
| 1 1| 2 0| 3 0| 1 0| 7 0 | 0 0| 0 0| 0 0| 0 0| 0 0 | 7 0
CAMDEN COUNTY
| 1 1| 21 1| 8 0| 0 0| 30 1 | 0 0| 0 0| 1 1| 0 0| 1 0 | 31 1
CANDLER COUNTY
| 0 0| 1 0| 1 0| 0 0| 2 0 | 0 0| 0 0| 0 0| 0 0| 0 0 | 2 0
CARROLL COUNTY
| 1 1| 17 1| 14 1| 6 1| 38 1 | 0 0| 2 2| 1 1| 0 0| 3 1 | 41 1
CATOOSA COUNTY
| 0 0| 5 0| 8 0| 0 0| 13 0 | 0 0| 0 0| 0 0| 0 0| 0 0 | 13 0
CHARLTON COUNTY
| 0 0| 1 0| 0 0| 0 0| 1 0 | 0 0| 2 2| 0 0| 0 0| 2 1 | 3 0
CHATHAM COUNTY
| 5 3| 161 5| 105 5| 14 3| 285 5 | 0 0| 2 2| 1 1| 0 0| 3 1 | 288 5
CHATTAHOOCHEE COUNTY| 0 0| 0 0| 2 0| 0 0| 2 0 | 0 0| 0 0| 0 0| 0 0| 0 0 | 2 0
CHATTOOGA COUNTY | 0 0| 5 0| 6 0| 1 0| 12 0 | 0 0| 0 0| 1 1| 1 4| 2 1 | 14 0
CHEROKEE COUNTY
| 2 1| 8 0| 21 1| 2 0| 33 1 | 0 0| 3 2| 0 0| 0 0| 3 1 | 36 1
CLARKE COUNTY
| 2 1| 41 1| 24 1| 7 2| 74 1 | 0 0| 2 2| 0 0| 1 4| 3 1 | 77 1
CLAY COUNTY
| 0 0| 1 0| 1 0| 0 0| 2 0 | 0 0| 0 0| 0 0| 0 0| 0 0 | 2 0
CLAYTON COUNTY
| 5 3| 71 2| 36 2| 10 2| 122 2 | 0 0| 2 2| 3 4| 0 0| 5 2 | 127 2
CLINCH COUNTY
| 0 0| 1 0| 4 0| 0 0| 5 0 | 0 0| 0 0| 0 0| 0 0| 0 0 | 5 0
COBB COUNTY
| 8 4| 110 4| 74 4| 13 3| 205 4 | 0 0| 5 4| 3 4| 1 4| 9 4 | 214 4
COFFEE COUNTY
| 0 0| 8 0| 9 0| 2 0| 19 0 | 0 0| 1 1| 1 1| 0 0| 2 1 | 21 0
COLQUITT COUNTY
| 3 2| 40 1| 23 1| 3 1| 69 1 | 0 0| 0 0| 1 1| 1 4| 2 1 | 71 1
COLUMBIA COUNTY
| 0 0| 6 0| 9 0| 2 0| 17 0 | 0 0| 0 0| 1 1| 0 0| 1 0 | 18 0
------------------------------------------------------------------------------------------------------------------------------------
(continued)
Page 25 Run 10/24/00
Georgia Department of Corrections Office of Planning and Analysis
Inmate statistical profile
Sample: ACTIVE PRISONERS SERVING LIFE EXCLUDING JAIL
Requestor:
Active inmates 10/24/2000
County Of Conviction by current age & sex
Statistics (CONTINUED)
|
MEN
|
WOMEN
|
| Age | Age | Age | Age | Men
| Age | Age | Age | Age |Women
|Grand
County Of Conviction|00-21 %|22-39 %|40-54 %|55-99 %|Total % |00-21 %|22-39 %|40-54 %|55-99 %|Total % |Total %
------------------------------------------------------------------------------------------------------------------------------------
COOK COUNTY
| 0 0| 7 0| 3 0| 0 0| 10 0 | 0 0| 2 2| 0 0| 0 0| 2 1 | 12 0
COWETA COUNTY
| 3 2| 23 1| 10 0| 3 1| 39 1 | 0 0| 2 2| 1 1| 0 0| 3 1 | 42 1
CRAWFORD COUNTY
| 0 0| 3 0| 0 0| 0 0| 3 0 | 0 0| 0 0| 0 0| 0 0| 0 0 | 3 0
CRISP COUNTY
| 4 2| 13 0| 12 1| 1 0| 30 1 | 0 0| 3 2| 0 0| 1 4| 4 2 | 34 1
DADE COUNTY
| 2 1| 7 0| 5 0| 3 1| 17 0 | 0 0| 0 0| 0 0| 0 0| 0 0 | 17 0
DAWSON COUNTY
| 0 0| 3 0| 3 0| 1 0| 7 0 | 0 0| 0 0| 0 0| 0 0| 0 0 | 7 0
DECATUR COUNTY
| 1 1| 22 1| 5 0| 1 0| 29 1 | 0 0| 1 1| 0 0| 0 0| 1 0 | 30 1
DEKALB COUNTY
| 11 6| 251 8| 156 8| 22 5| 440 8 | 1 11| 3 2| 4 5| 1 4| 9 4 | 449 8
DODGE COUNTY
| 0 0| 6 0| 5 0| 1 0| 12 0 | 0 0| 0 0| 0 0| 0 0| 0 0 | 12 0
DOOLY COUNTY
| 2 1| 8 0| 8 0| 0 0| 18 0 | 0 0| 0 0| 0 0| 0 0| 0 0 | 18 0
DOUGHERTY COUNTY | 7 4| 72 2| 38 2| 4 1| 121 2 | 0 0| 5 4| 0 0| 0 0| 5 2 | 126 2
DOUGLAS COUNTY
| 3 2| 47 2| 18 1| 5 1| 73 1 | 0 0| 1 1| 1 1| 0 0| 2 1 | 75 1
EARLY COUNTY
| 0 0| 10 0| 5 0| 2 0| 17 0 | 0 0| 0 0| 0 0| 0 0| 0 0 | 17 0
ECHOLS COUNTY.
| 0 0| 0 0| 0 0| 0 0| 0 0 | 0 0| 0 0| 0 0| 0 0| 0 0 | 0 0
EFFINGHAM COUNTY | 0 0| 5 0| 3 0| 0 0| 8 0 | 0 0| 0 0| 0 0| 0 0| 0 0 | 8 0
ELBERT COUNTY
| 0 0| 14 0| 8 0| 1 0| 23 0 | 0 0| 1 1| 0 0| 0 0| 1 0 | 24 0
EMANUEL COUNTY
| 1 1| 8 0| 10 0| 2 0| 21 0 | 0 0| 0 0| 1 1| 0 0| 1 0 | 22 0
EVANS COUNTY
| 0 0| 6 0| 4 0| 2 0| 12 0 | 0 0| 0 0| 0 0| 0 0| 0 0 | 12 0
FANNIN COUNTY
| 0 0| 4 0| 5 0| 1 0| 10 0 | 0 0| 0 0| 0 0| 0 0| 0 0 | 10 0
FAYETTE COUNTY
| 1 1| 6 0| 5 0| 0 0| 12 0 | 0 0| 0 0| 0 0| 0 0| 0 0 | 12 0
FLOYD COUNTY
| 2 1| 29 1| 26 1| 4 1| 61 1 | 2 22| 3 2| 2 2| 1 4| 8 3 | 69 1
FORSYTH COUNTY
| 0 0| 6 0| 8 0| 3 1| 17 0 | 0 0| 1 1| 1 1| 0 0| 2 1 | 19 0
FRANKLIN COUNTY
| 1 1| 2 0| 3 0| 1 0| 7 0 | 0 0| 0 0| 2 2| 1 4| 3 1 | 10 0
FULTON COUNTY
| 28 15| 463 15| 309 15| 61 15| 861 15 | 1 11| 12 10| 6 7| 5 20| 24 10 | 885 15
GILMER COUNTY
| 0 0| 1 0| 2 0| 3 1| 6 0 | 0 0| 0 0| 0 0| 0 0| 0 0 | 6 0
GLASCOCK COUNTY
| 0 0| 0 0| 0 0| 0 0| 0 0 | 0 0| 0 0| 0 0| 0 0| 0 0 | 0 0
GLYNN COUNTY
| 7 4| 32 1| 27 1| 3 1| 69 1 | 0 0| 2 2| 2 2| 0 0| 4 2 | 73 1
GORDON COUNTY
| 0 0| 22 1| 14 1| 2 0| 38 1 | 0 0| 1 1| 0 0| 0 0| 1 0 | 39 1
GRADY COUNTY
| 3 2| 15 0| 10 0| 1 0| 29 1 | 0 0| 0 0| 0 0| 0 0| 0 0 | 29 0
GREENE COUNTY
| 1 1| 2 0| 5 0| 1 0| 9 0 | 0 0| 0 0| 0 0| 0 0| 0 0 | 9 0
GWINNETT COUNTY
| 1 1| 73 2| 41 2| 8 2| 123 2 | 0 0| 2 2| 5 6| 1 4| 8 3 | 131 2
HABERSHAM COUNTY | 1 1| 13 0| 9 0| 0 0| 23 0 | 0 0| 0 0| 0 0| 0 0| 0 0 | 23 0
HALL COUNTY
| 3 2| 43 1| 38 2| 10 2| 94 2 | 1 11| 3 2| 1 1| 1 4| 6 2 | 100 2
HANCOCK COUNTY
| 0 0| 3 0| 1 0| 0 0| 4 0 | 0 0| 0 0| 1 1| 0 0| 1 0 | 5 0
HARALSON COUNTY
| 0 0| 4 0| 2 0| 1 0| 7 0 | 0 0| 0 0| 0 0| 0 0| 0 0 | 7 0
------------------------------------------------------------------------------------------------------------------------------------
(continued)
Page 26 Run 10/24/00
Georgia Department of Corrections Office of Planning and Analysis
Inmate statistical profile
Sample: ACTIVE PRISONERS SERVING LIFE EXCLUDING JAIL
Requestor:
Active inmates 10/24/2000
County Of Conviction by current age & sex
Statistics (CONTINUED)
|
MEN
|
WOMEN
|
| Age | Age | Age | Age | Men
| Age | Age | Age | Age |Women
|Grand
County Of Conviction|00-21 %|22-39 %|40-54 %|55-99 %|Total % |00-21 %|22-39 %|40-54 %|55-99 %|Total % |Total %
------------------------------------------------------------------------------------------------------------------------------------
HARRIS COUNTY
| 1 1| 8 0| 3 0| 0 0| 12 0 | 0 0| 0 0| 0 0| 0 0| 0 0 | 12 0
HART COUNTY
| 0 0| 3 0| 2 0| 0 0| 5 0 | 0 0| 0 0| 0 0| 0 0| 0 0 | 5 0
HEARD COUNTY
| 0 0| 2 0| 0 0| 3 1| 5 0 | 0 0| 0 0| 0 0| 0 0| 0 0 | 5 0
HENRY COUNTY
| 0 0| 23 1| 9 0| 1 0| 33 1 | 0 0| 1 1| 0 0| 0 0| 1 0 | 34 1
HOUSTON COUNTY
| 0 0| 39 1| 19 1| 3 1| 61 1 | 0 0| 4 3| 3 4| 1 4| 8 3 | 69 1
IRWIN COUNTY
| 0 0| 3 0| 1 0| 1 0| 5 0 | 0 0| 0 0| 0 0| 0 0| 0 0 | 5 0
JACKSON COUNTY
| 1 1| 6 0| 14 1| 1 0| 22 0 | 0 0| 1 1| 0 0| 0 0| 1 0 | 23 0
JASPER COUNTY
| 0 0| 8 0| 0 0| 0 0| 8 0 | 0 0| 0 0| 1 1| 0 0| 1 0 | 9 0
JEFF DAVIS COUNTY | 0 0| 4 0| 4 0| 2 0| 10 0 | 0 0| 0 0| 0 0| 0 0| 0 0 | 10 0
JEFFERSON COUNTY | 0 0| 9 0| 5 0| 4 1| 18 0 | 0 0| 0 0| 0 0| 0 0| 0 0 | 18 0
JENKINS COUNTY
| 0 0| 2 0| 4 0| 0 0| 6 0 | 0 0| 0 0| 0 0| 0 0| 0 0 | 6 0
JOHNSON COUNTY
| 0 0| 9 0| 2 0| 1 0| 12 0 | 0 0| 1 1| 0 0| 0 0| 1 0 | 13 0
JONES COUNTY
| 0 0| 1 0| 6 0| 3 1| 10 0 | 0 0| 0 0| 0 0| 0 0| 0 0 | 10 0
LAMAR COUNTY
| 0 0| 9 0| 10 0| 3 1| 22 0 | 0 0| 0 0| 1 1| 0 0| 1 0 | 23 0
LANIER COUNTY
| 0 0| 1 0| 0 0| 0 0| 1 0 | 0 0| 0 0| 0 0| 0 0| 0 0 | 1 0
LAURENS COUNTY
| 1 1| 13 0| 7 0| 1 0| 22 0 | 0 0| 1 1| 2 2| 0 0| 3 1 | 25 0
LEE COUNTY
| 0 0| 2 0| 0 0| 0 0| 2 0 | 1 11| 0 0| 0 0| 0 0| 1 0 | 3 0
LIBERTY COUNTY
| 1 1| 23 1| 9 0| 4 1| 37 1 | 0 0| 2 2| 0 0| 0 0| 2 1 | 39 1
LINCOLN COUNTY
| 1 1| 2 0| 2 0| 0 0| 5 0 | 0 0| 0 0| 0 0| 0 0| 0 0 | 5 0
LONG COUNTY
| 1 1| 6 0| 3 0| 2 0| 12 0 | 0 0| 2 2| 0 0| 0 0| 2 1 | 14 0
LOWNDES COUNTY
| 0 0| 40 1| 25 1| 2 0| 67 1 | 0 0| 0 0| 2 2| 1 4| 3 1 | 70 1
LUMPKIN COUNTY
| 1 1| 3 0| 0 0| 2 0| 6 0 | 0 0| 0 0| 0 0| 0 0| 0 0 | 6 0
MACON COUNTY
| 1 1| 15 0| 8 0| 0 0| 24 0 | 0 0| 0 0| 0 0| 0 0| 0 0 | 24 0
MADISON COUNTY
| 0 0| 9 0| 4 0| 3 1| 16 0 | 0 0| 2 2| 0 0| 0 0| 2 1 | 18 0
MARION COUNTY
| 0 0| 2 0| 1 0| 0 0| 3 0 | 0 0| 0 0| 1 1| 0 0| 1 0 | 4 0
MCDUFFIE COUNTY
| 0 0| 28 1| 11 1| 4 1| 43 1 | 1 11| 1 1| 0 0| 0 0| 2 1 | 45 1
MCINTOSH COUNTY
| 1 1| 7 0| 9 0| 0 0| 17 0 | 0 0| 0 0| 0 0| 0 0| 0 0 | 17 0
MERIWETHER COUNTY | 0 0| 9 0| 9 0| 3 1| 21 0 | 0 0| 2 2| 0 0| 1 4| 3 1 | 24 0
MILLER COUNTY
| 0 0| 2 0| 2 0| 0 0| 4 0 | 0 0| 0 0| 0 0| 0 0| 0 0 | 4 0
MITCHELL COUNTY
| 0 0| 11 0| 10 0| 2 0| 23 0 | 0 0| 2 2| 0 0| 0 0| 2 1 | 25 0
MONROE COUNTY
| 0 0| 10 0| 8 0| 2 0| 20 0 | 0 0| 1 1| 0 0| 0 0| 1 0 | 21 0
MONTGOMERY COUNTY | 0 0| 0 0| 3 0| 0 0| 3 0 | 0 0| 0 0| 0 0| 0 0| 0 0 | 3 0
MORGAN COUNTY
| 0 0| 12 0| 2 0| 0 0| 14 0 | 0 0| 1 1| 0 0| 0 0| 1 0 | 15 0
MURRAY COUNTY
| 2 1| 3 0| 6 0| 4 1| 15 0 | 0 0| 0 0| 0 0| 0 0| 0 0 | 15 0
MUSCOGEE COUNTY
| 5 3| 78 3| 77 4| 10 2| 170 3 | 0 0| 4 3| 2 2| 0 0| 6 2 | 176 3
------------------------------------------------------------------------------------------------------------------------------------
(continued)
Page 27 Run 10/24/00
Georgia Department of Corrections Office of Planning and Analysis
Inmate statistical profile
Sample: ACTIVE PRISONERS SERVING LIFE EXCLUDING JAIL
Requestor:
Active inmates 10/24/2000
County Of Conviction by current age & sex
Statistics (CONTINUED)
|
MEN
|
WOMEN
|
| Age | Age | Age | Age | Men
| Age | Age | Age | Age |Women
|Grand
County Of Conviction|00-21 %|22-39 %|40-54 %|55-99 %|Total % |00-21 %|22-39 %|40-54 %|55-99 %|Total % |Total %
------------------------------------------------------------------------------------------------------------------------------------
NEWTON COUNTY
| 3 2| 46 2| 15 1| 6 1| 70 1 | 0 0| 2 2| 0 0| 0 0| 2 1 | 72 1
OCONEE COUNTY
| 0 0| 9 0| 3 0| 0 0| 12 0 | 0 0| 0 0| 0 0| 0 0| 0 0 | 12 0
OGLETHORPE COUNTY | 0 0| 4 0| 4 0| 1 0| 9 0 | 0 0| 0 0| 0 0| 0 0| 0 0 | 9 0
PAULDING COUNTY
| 0 0| 4 0| 6 0| 3 1| 13 0 | 0 0| 1 1| 0 0| 0 0| 1 0 | 14 0
PEACH COUNTY
| 0 0| 6 0| 3 0| 0 0| 9 0 | 0 0| 0 0| 1 1| 0 0| 1 0 | 10 0
PICKENS COUNTY
| 0 0| 4 0| 0 0| 1 0| 5 0 | 0 0| 0 0| 1 1| 0 0| 1 0 | 6 0
PIERCE COUNTY
| 3 2| 2 0| 5 0| 0 0| 10 0 | 0 0| 0 0| 0 0| 0 0| 0 0 | 10 0
PIKE COUNTY
| 0 0| 1 0| 1 0| 0 0| 2 0 | 0 0| 0 0| 0 0| 0 0| 0 0 | 2 0
POLK COUNTY
| 1 1| 11 0| 8 0| 2 0| 22 0 | 0 0| 0 0| 0 0| 0 0| 0 0 | 22 0
PULASKI COUNTY
| 0 0| 7 0| 1 0| 0 0| 8 0 | 0 0| 1 1| 0 0| 0 0| 1 0 | 9 0
PUTNAM COUNTY
| 0 0| 21 1| 15 1| 3 1| 39 1 | 0 0| 0 0| 0 0| 0 0| 0 0 | 39 1
QUITMAN COUNTY
| 0 0| 4 0| 0 0| 0 0| 4 0 | 0 0| 0 0| 0 0| 0 0| 0 0 | 4 0
RABUN COUNTY
| 0 0| 7 0| 3 0| 0 0| 10 0 | 0 0| 0 0| 0 0| 0 0| 0 0 | 10 0
RANDOLPH COUNTY
| 0 0| 3 0| 2 0| 2 0| 7 0 | 0 0| 0 0| 0 0| 0 0| 0 0 | 7 0
RICHMOND COUNTY
| 12 6| 159 5| 72 3| 13 3| 256 4 | 0 0| 9 7| 8 10| 1 4| 18 7 | 274 5
ROCKDALE COUNTY
| 1 1| 10 0| 11 1| 5 1| 27 0 | 0 0| 1 1| 0 0| 0 0| 1 0 | 28 0
SCHLEY COUNTY
| 0 0| 3 0| 2 0| 0 0| 5 0 | 0 0| 0 0| 0 0| 0 0| 0 0 | 5 0
SCREVEN COUNTY
| 0 0| 5 0| 5 0| 2 0| 12 0 | 0 0| 0 0| 0 0| 0 0| 0 0 | 12 0
SEMINOLE COUNTY
| 1 1| 4 0| 4 0| 2 0| 11 0 | 0 0| 1 1| 0 0| 0 0| 1 0 | 12 0
SPALDING COUNTY
| 2 1| 41 1| 23 1| 6 1| 72 1 | 1 11| 1 1| 2 2| 1 4| 5 2 | 77 1
STEPHENS COUNTY
| 0 0| 4 0| 4 0| 3 1| 11 0 | 0 0| 0 0| 0 0| 0 0| 0 0 | 11 0
STEWART COUNTY
| 0 0| 2 0| 1 0| 0 0| 3 0 | 0 0| 0 0| 2 2| 0 0| 2 1 | 5 0
SUMTER COUNTY
| 0 0| 5 0| 13 1| 1 0| 19 0 | 0 0| 0 0| 1 1| 0 0| 1 0 | 20 0
TALBOT COUNTY
| 1 1| 4 0| 1 0| 0 0| 6 0 | 0 0| 0 0| 1 1| 0 0| 1 0 | 7 0
TALIAFERRO COUNTY | 0 0| 0 0| 3 0| 0 0| 3 0 | 0 0| 0 0| 0 0| 0 0| 0 0 | 3 0
TATTNALL COUNTY
| 0 0| 18 1| 13 1| 3 1| 34 1 | 0 0| 0 0| 1 1| 0 0| 1 0 | 35 1
TAYLOR COUNTY
| 3 2| 10 0| 4 0| 0 0| 17 0 | 0 0| 0 0| 0 0| 0 0| 0 0 | 17 0
TELFAIR COUNTY
| 1 1| 6 0| 2 0| 0 0| 9 0 | 0 0| 0 0| 1 1| 0 0| 1 0 | 10 0
TERRELL COUNTY
| 1 1| 12 0| 3 0| 1 0| 17 0 | 0 0| 0 0| 0 0| 0 0| 0 0 | 17 0
THOMAS COUNTY
| 2 1| 18 1| 21 1| 3 1| 44 1 | 0 0| 2 2| 0 0| 0 0| 2 1 | 46 1
TIFT COUNTY
| 7 4| 35 1| 21 1| 5 1| 68 1 | 0 0| 0 0| 2 2| 1 4| 3 1 | 71 1
TOOMBS COUNTY
| 5 3| 21 1| 10 0| 1 0| 37 1 | 0 0| 2 2| 0 0| 0 0| 2 1 | 39 1
TOWNS COUNTY
| 0 0| 1 0| 1 0| 0 0| 2 0 | 0 0| 0 0| 0 0| 0 0| 0 0 | 2 0
TREUTLEN COUNTY
| 0 0| 3 0| 4 0| 0 0| 7 0 | 0 0| 0 0| 0 0| 0 0| 0 0 | 7 0
TROUP COUNTY
| 2 1| 26 1| 24 1| 7 2| 59 1 | 0 0| 2 2| 1 1| 0 0| 3 1 | 62 1
------------------------------------------------------------------------------------------------------------------------------------
(continued)
Page 28 Run 10/24/00
Georgia Department of Corrections Office of Planning and Analysis
Inmate statistical profile
Sample: ACTIVE PRISONERS SERVING LIFE EXCLUDING JAIL
Requestor:
Active inmates 10/24/2000
County Of Conviction by current age & sex
Statistics (CONTINUED)
|
MEN
|
WOMEN
|
| Age | Age | Age | Age | Men
| Age | Age | Age | Age |Women
|Grand
County Of Conviction|00-21 %|22-39 %|40-54 %|55-99 %|Total % |00-21 %|22-39 %|40-54 %|55-99 %|Total % |Total %
------------------------------------------------------------------------------------------------------------------------------------
TURNER COUNTY
| 0 0| 8 0| 6 0| 1 0| 15 0 | 0 0| 0 0| 0 0| 0 0| 0 0 | 15 0
TWIGGS COUNTY
| 0 0| 3 0| 5 0| 1 0| 9 0 | 0 0| 0 0| 0 0| 0 0| 0 0 | 9 0
UNION COUNTY
| 0 0| 0 0| 1 0| 0 0| 1 0 | 0 0| 0 0| 0 0| 0 0| 0 0 | 1 0
UPSON COUNTY
| 1 1| 7 0| 5 0| 1 0| 14 0 | 0 0| 0 0| 1 1| 0 0| 1 0 | 15 0
WALKER COUNTY
| 0 0| 14 0| 10 0| 4 1| 28 0 | 0 0| 1 1| 1 1| 0 0| 2 1 | 30 1
WALTON COUNTY
| 3 2| 30 1| 20 1| 2 0| 55 1 | 0 0| 2 2| 0 0| 0 0| 2 1 | 57 1
WARE COUNTY
| 0 0| 13 0| 11 1| 3 1| 27 0 | 0 0| 0 0| 1 1| 0 0| 1 0 | 28 0
WARREN COUNTY
| 0 0| 4 0| 6 0| 1 0| 11 0 | 0 0| 0 0| 0 0| 0 0| 0 0 | 11 0
WASHINGTON COUNTY | 0 0| 7 0| 7 0| 1 0| 15 0 | 0 0| 1 1| 0 0| 0 0| 1 0 | 16 0
WAYNE COUNTY
| 0 0| 7 0| 8 0| 2 0| 17 0 | 0 0| 1 1| 0 0| 0 0| 1 0 | 18 0
WEBSTER COUNTY
| 0 0| 0 0| 0 0| 0 0| 0 0 | 0 0| 0 0| 0 0| 0 0| 0 0 | 0 0
WHEELER COUNTY
| 0 0| 3 0| 3 0| 1 0| 7 0 | 0 0| 0 0| 0 0| 1 4| 1 0 | 8 0
WHITE COUNTY
| 0 0| 3 0| 2 0| 0 0| 5 0 | 0 0| 0 0| 0 0| 0 0| 0 0 | 5 0
WHITFIELD COUNTY | 0 0| 25 1| 24 1| 8 2| 57 1 | 0 0| 5 4| 1 1| 0 0| 6 2 | 63 1
WILCOX COUNTY
| 0 0| 1 0| 7 0| 0 0| 8 0 | 0 0| 0 0| 0 0| 0 0| 0 0 | 8 0
WILKES COUNTY
| 0 0| 7 0| 3 0| 1 0| 11 0 | 0 0| 0 0| 0 0| 0 0| 0 0 | 11 0
WILKINSON COUNTY | 0 0| 7 0| 1 0| 0 0| 8 0 | 0 0| 0 0| 0 0| 0 0| 0 0 | 8 0
WORTH COUNTY
| 3 2| 14 0| 4 0| 2 0| 23 0 | 0 0| 0 0| 0 0| 0 0| 0 0 | 23 0
CONVERSION
| 0 2| 0 0| 0 0| 0 0| 0 0 | 0 0| 0 0| 0 0| 0 0| 0 0 | 0 0
------------------------------------------------------------------------------------------------------------------------------------
Total reported
| 189 100| 3033 100| 2063 100| 407 100| 5692 100 | 9 100| 126 100| 83 100| 25 100| 243 100 | 5935 100
|
|
|
|
|
|
|
|
|
|
|
Percent reported | 100.0| 100.0| 100.0| 100.0| 100.0 | 100.0| 100.0| 100.0| 100.0| 100.0 | 100.0
|
|
|
|
|
|
|
|
|
|
|
|
|
|
|
|
|
|
|
|
|
|
UNKNOWN
|0|0|0|0|0
|0|0|0|0|0
|0
------------------------------------------------------------------------------------------------------------------------------------
Total
| 189 | 3033 | 2063 | 407 | 5692
| 9 | 126 | 83 | 25 | 243
| 5935
Page 29 Run 10/24/00
Georgia Department of Corrections Office of Planning and Analysis
Inmate statistical profile
Sample: ACTIVE PRISONERS SERVING LIFE EXCLUDING JAIL
Requestor: Statistics
Active inmates 10/24/2000
Circuit Of Conviction by current age & sex
|
MEN
|
WOMEN
|
| Age | Age | Age | Age | Men
| Age | Age | Age | Age |Women
|Grand
Circ Of Conviction |00-21 %|22-39 %|40-54 %|55-99 %|Total % |00-21 %|22-39 %|40-54 %|55-99 %|Total % |Total %
------------------------------------------------------------------------------------------------------------------------------------
ALAPAHA CIRCUIT
| 0 0| 14 0| 10 0| 2 0| 26 0 | 0 0| 2 2| 1 1| 0 0| 3 1 | 29 0
ALCOVY CIRCUIT
| 6 3| 76 3| 35 2| 8 2| 125 2 | 0 0| 4 3| 0 0| 0 0| 4 2 | 129 2
ATLANTA CIRCUIT
| 28 15| 463 15| 309 15| 61 15| 861 15 | 1 11| 12 10| 6 7| 5 20| 24 10 | 885 15
ATLANTIC CIRCUIT | 3 2| 69 2| 44 2| 12 3| 128 2 | 0 0| 4 3| 1 1| 1 4| 6 2 | 134 2
AUGUSTA CIRCUIT
| 13 7| 181 6| 93 5| 16 4| 303 5 | 0 0| 9 7| 9 11| 1 4| 19 8 | 322 5
BLUE RIDGE CIRCUIT | 2 1| 13 0| 29 1| 5 1| 49 1 | 0 0| 4 3| 1 1| 0 0| 5 2 | 54 1
BRUNSWICK CIRCUIT | 8 4| 68 2| 51 2| 8 2| 135 2 | 0 0| 3 2| 3 4| 0 0| 6 2 | 141 2
CHATTAHOOCHEE CIRCUI| 10 5| 102 3| 88 4| 10 2| 210 4 | 0 0| 4 3| 4 5| 0 0| 8 3 | 218 4
CHEROKEE CIRCUIT | 1 1| 50 2| 36 2| 5 1| 92 2 | 0 0| 3 2| 0 0| 0 0| 3 1 | 95 2
CLAYTON CIRCUIT
| 5 3| 71 2| 36 2| 10 2| 122 2 | 0 0| 2 2| 3 4| 0 0| 5 2 | 127 2
COBB CIRCUIT
| 8 4| 110 4| 74 4| 13 3| 205 4 | 0 0| 5 4| 3 4| 1 4| 9 4 | 214 4
CONASAUGA CIRCUIT | 2 1| 28 1| 30 1| 12 3| 72 1 | 0 0| 5 4| 1 1| 0 0| 6 2 | 78 1
CORDELE CIRCUIT
| 6 3| 28 1| 36 2| 4 1| 74 1 | 0 0| 3 2| 0 0| 1 4| 4 2 | 78 1
COWETA CIRCUIT
| 6 3| 77 3| 57 3| 22 5| 162 3 | 0 0| 8 6| 3 4| 1 4| 12 5 | 174 3
DOUGHERTY CIRCUIT | 7 4| 72 2| 38 2| 4 1| 121 2 | 0 0| 5 4| 0 0| 0 0| 5 2 | 126 2
DUBLIN CIRCUIT
| 1 1| 28 1| 18 1| 3 1| 50 1 | 0 0| 2 2| 2 2| 0 0| 4 2 | 54 1
EASTERN CIRCUIT
| 5 3| 161 5| 105 5| 14 3| 285 5 | 0 0| 2 2| 1 1| 0 0| 3 1 | 288 5
FLINT CIRCUIT
| 1 1| 62 2| 37 2| 8 2| 108 2 | 0 0| 4 3| 2 2| 0 0| 6 2 | 114 2
GRIFFIN CIRCUIT
| 4 2| 55 2| 34 2| 7 2| 100 2 | 1 11| 1 1| 3 4| 1 4| 6 2 | 106 2
GWINNETT CIRCUIT | 1 1| 73 2| 41 2| 8 2| 123 2 | 0 0| 2 2| 5 6| 1 4| 8 3 | 131 2
HOUSTON CIRCUIT
| 0 0| 39 1| 19 1| 3 1| 61 1 | 0 0| 4 3| 3 4| 1 4| 8 3 | 69 1
LOOKOUT MOUNTAIN CIR| 2 1| 31 1| 29 1| 8 2| 70 1 | 0 0| 1 1| 2 2| 1 4| 4 2 | 74 1
MACON CIRCUIT
| 4 2| 100 3| 87 4| 15 4| 206 4 | 1 11| 2 2| 2 2| 1 4| 6 2 | 212 4
MIDDLE CIRCUIT
| 6 3| 46 2| 33 2| 8 2| 93 2 | 0 0| 3 2| 1 1| 0 0| 4 2 | 97 2
MOUNTAIN CIRCUIT | 1 1| 24 1| 16 1| 3 1| 44 1 | 0 0| 0 0| 0 0| 0 0| 0 0 | 44 1
NORTHEASTERN CIRCUIT| 3 2| 46 2| 41 2| 11 3| 101 2 | 1 11| 3 2| 1 1| 1 4| 6 2 | 107 2
NORTHERN CIRCUIT | 1 1| 32 1| 21 1| 6 1| 60 1 | 0 0| 3 2| 2 2| 1 4| 6 2 | 66 1
OCMULGEE CIRCUIT | 3 2| 70 2| 41 2| 9 2| 123 2 | 0 0| 2 2| 2 2| 0 0| 4 2 | 127 2
OCONEE CIRCUIT
| 1 1| 29 1| 18 1| 3 1| 51 1 | 0 0| 1 1| 2 2| 1 4| 4 2 | 55 1
OGEECHEE CIRCUIT | 1 1| 30 1| 27 1| 2 0| 60 1 | 0 0| 1 1| 1 1| 1 4| 3 1 | 63 1
PATAULA CIRCUIT
| 2 1| 36 1| 17 1| 7 2| 62 1 | 0 0| 1 1| 0 0| 0 0| 1 0 | 63 1
PIEDMONT CIRCUIT | 1 1| 11 0| 32 2| 7 2| 51 1 | 0 0| 1 1| 1 1| 0 0| 2 1 | 53 1
ROME CIRCUIT
| 2 1| 29 1| 26 1| 4 1| 61 1 | 2 22| 3 2| 2 2| 1 4| 8 3 | 69 1
SOUTH GEORGIA CIRCUI| 5 3| 51 2| 29 1| 5 1| 90 2 | 0 0| 3 2| 0 0| 0 0| 3 1 | 93 2
SOUTHERN CIRCUIT | 5 3| 103 3| 73 4| 9 2| 190 3 | 0 0| 2 2| 3 4| 2 8| 7 3 | 197 3
------------------------------------------------------------------------------------------------------------------------------------
(continued)
Page 30 Run 10/24/00
Georgia Department of Corrections Office of Planning and Analysis
Inmate statistical profile
Sample: ACTIVE PRISONERS SERVING LIFE EXCLUDING JAIL
Requestor:
Active inmates 10/24/2000
Circuit Of Conviction by current age & sex
Statistics (Continued)
|
MEN
|
WOMEN
|
| Age | Age | Age | Age | Men
| Age | Age | Age | Age |Women
|Grand
Circ Of Conviction |00-21 %|22-39 %|40-54 %|55-99 %|Total % |00-21 %|22-39 %|40-54 %|55-99 %|Total % |Total %
------------------------------------------------------------------------------------------------------------------------------------
SOUTHWESTERN CIRCUIT| 1 1| 27 1| 24 1| 1 0| 53 1 | 1 11| 0 0| 3 4| 0 0| 4 2 | 57 1
STONE MOUNTAIN CIRCU| 11 6| 251 8| 156 8| 22 5| 440 8 | 1 11| 3 2| 4 5| 1 4| 9 4 | 449 8
TALLAPOOSA CIRCUIT | 1 1| 19 1| 16 1| 6 1| 42 1 | 0 0| 1 1| 0 0| 0 0| 1 0 | 43 1
TIFTON CIRCUIT
| 10 5| 60 2| 32 2| 9 2| 111 2 | 0 0| 0 0| 2 2| 1 4| 3 1 | 114 2
TOOMBS CIRCUIT
| 1 1| 41 1| 25 1| 6 1| 73 1 | 1 11| 1 1| 0 0| 0 0| 2 1 | 75 1
WAYCROSS CIRCUIT | 3 2| 31 1| 32 2| 7 2| 73 1 | 0 0| 3 2| 2 2| 0 0| 5 2 | 78 1
WESTERN CIRCUIT
| 2 1| 50 2| 27 1| 7 2| 86 2 | 0 0| 2 2| 0 0| 1 4| 3 1 | 89 2
ROCKDALE CIRCUIT | 1 1| 10 0| 11 1| 5 1| 27 0 | 0 0| 1 1| 0 0| 0 0| 1 0 | 28 0
DOUGLAS CIRCUIT
| 3 2| 47 2| 18 1| 5 1| 73 1 | 0 0| 1 1| 1 1| 0 0| 2 1 | 75 1
APPALACHIAN CIRCUIT | 0 0| 9 0| 7 0| 5 1| 21 0 | 0 0| 0 0| 1 1| 0 0| 1 0 | 22 0
ENOTAH CIRCUIT
| 1 1| 7 0| 4 0| 2 0| 14 0 | 0 0| 0 0| 0 0| 0 0| 0 0 | 14 0
BELL-FORSYTH CIRCUIT| 0 0| 1 0| 0 0| 0 0| 1 0 | 0 0| 0 0| 0 0| 0 0| 0 0 | 1 0
------------------------------------------------------------------------------------------------------------------------------------
Total reported
| 188 100| 3031 100| 2062 100| 407 100| 5688 100 | 9 100| 126 100| 83 100| 25 100| 243 100 | 5931 100
|
|
|
|
|
|
|
|
|
|
|
Percent reported |
99.5|
99.9| 100.0| 100.0|
99.9 | 100.0| 100.0| 100.0| 100.0| 100.0 |
99.9
|
|
|
|
|
|
|
|
|
|
|
|
|
|
|
|
|
|
|
|
|
|
NOT REPORTED
|1|2|1|0|4
|0|0|0|0|0
|4
------------------------------------------------------------------------------------------------------------------------------------
Total
| 189 | 3033 | 2063 | 407 | 5692
| 9 | 126 | 83 | 25 | 243
| 5935
Page 31 Run 10/24/00
Georgia Department of Corrections Office of Planning and Analysis
Inmate statistical profile
Sample: ACTIVE PRISONERS SERVING LIFE EXCLUDING JAIL
Requestor: Statistics
Active inmates 10/24/2000
Home County by current age & sex
|
MEN
|
WOMEN
|
| Age | Age | Age | Age | Men
| Age | Age | Age | Age |Women
|Grand
Home County
|00-21 %|22-39 %|40-54 %|55-99 %|Total % |00-21 %|22-39 %|40-54 %|55-99 %|Total % |Total %
------------------------------------------------------------------------------------------------------------------------------------
APPLING COUNTY
| 0 0| 4 0| 5 0| 1 0| 10 0 | 0 0| 0 0| 0 0| 0 0| 0 0 | 10 0
ATKINSON COUNTY
| 0 0| 1 0| 1 0| 3 1| 5 0 | 0 0| 0 0| 0 0| 0 0| 0 0 | 5 0
BACON COUNTY
| 0 0| 5 0| 4 0| 1 0| 10 0 | 0 0| 0 0| 0 0| 0 0| 0 0 | 10 0
BAKER COUNTY
| 0 0| 1 0| 2 0| 0 0| 3 0 | 0 0| 0 0| 0 0| 0 0| 0 0 | 3 0
BALDWIN COUNTY
| 0 0| 16 1| 6 0| 1 0| 23 0 | 0 0| 1 1| 0 0| 1 4| 2 1 | 25 0
BANKS COUNTY
| 0 0| 2 0| 4 0| 1 0| 7 0 | 0 0| 1 1| 0 0| 0 0| 1 0 | 8 0
BARROW COUNTY
| 0 0| 6 0| 8 0| 2 1| 16 0 | 0 0| 0 0| 1 1| 0 0| 1 0 | 17 0
BARTOW COUNTY
| 1 1| 20 1| 18 1| 5 1| 44 1 | 1 13| 3 3| 0 0| 0 0| 4 2 | 48 1
BEN HILL COUNTY
| 0 0| 4 0| 7 0| 3 1| 14 0 | 0 0| 0 0| 1 1| 0 0| 1 0 | 15 0
BERRIEN COUNTY
| 0 0| 4 0| 1 0| 1 0| 6 0 | 0 0| 0 0| 0 0| 0 0| 0 0 | 6 0
BIBB COUNTY
| 4 2| 82 3| 78 4| 18 5| 182 3 | 1 13| 5 4| 2 3| 0 0| 8 4 | 190 3
BLECKLEY COUNTY
| 0 0| 8 0| 4 0| 1 0| 13 0 | 0 0| 0 0| 1 1| 0 0| 1 0 | 14 0
BRANTLEY COUNTY
| 0 0| 1 0| 2 0| 0 0| 3 0 | 0 0| 0 0| 0 0| 0 0| 0 0 | 3 0
BROOKS COUNTY
| 0 0| 7 0| 2 0| 1 0| 10 0 | 0 0| 0 0| 0 0| 0 0| 0 0 | 10 0
BRYAN COUNTY
| 0 0| 7 0| 5 0| 1 0| 13 0 | 0 0| 0 0| 0 0| 0 0| 0 0 | 13 0
BULLOCH COUNTY
| 1 1| 12 0| 10 1| 0 0| 23 0 | 0 0| 0 0| 1 1| 1 4| 2 1 | 25 0
BURKE COUNTY
| 0 0| 10 0| 7 0| 2 1| 19 0 | 0 0| 0 0| 0 0| 0 0| 0 0 | 19 0
BUTTS COUNTY
| 0 0| 23 1| 8 0| 2 1| 33 1 | 0 0| 1 1| 1 1| 0 0| 2 1 | 35 1
CALHOUN COUNTY
| 1 1| 3 0| 3 0| 1 0| 8 0 | 0 0| 0 0| 0 0| 0 0| 0 0 | 8 0
CAMDEN COUNTY
| 2 1| 16 1| 6 0| 0 0| 24 0 | 0 0| 0 0| 1 1| 0 0| 1 0 | 25 0
CANDLER COUNTY
| 0 0| 2 0| 1 0| 0 0| 3 0 | 0 0| 0 0| 0 0| 0 0| 0 0 | 3 0
CARROLL COUNTY
| 1 1| 20 1| 13 1| 8 2| 42 1 | 0 0| 2 2| 1 1| 0 0| 3 1 | 45 1
CATOOSA COUNTY
| 0 0| 2 0| 5 0| 1 0| 8 0 | 0 0| 0 0| 0 0| 0 0| 0 0 | 8 0
CHARLTON COUNTY
| 0 0| 1 0| 0 0| 0 0| 1 0 | 0 0| 1 1| 0 0| 0 0| 1 0 | 2 0
CHATHAM COUNTY
| 6 3| 150 5| 97 5| 14 4| 267 5 | 0 0| 2 2| 1 1| 1 4| 4 2 | 271 5
CHATTAHOOCHEE COUNTY| 0 0| 0 0| 1 0| 0 0| 1 0 | 0 0| 0 0| 0 0| 0 0| 0 0 | 1 0
CHATTOOGA COUNTY | 0 0| 3 0| 5 0| 0 0| 8 0 | 0 0| 0 0| 1 1| 1 4| 2 1 | 10 0
CHEROKEE COUNTY
| 2 1| 7 0| 17 1| 1 0| 27 1 | 0 0| 2 2| 0 0| 0 0| 2 1 | 29 1
CLARKE COUNTY
| 2 1| 47 2| 19 1| 4 1| 72 1 | 0 0| 2 2| 0 0| 2 8| 4 2 | 76 1
CLAY COUNTY
| 0 0| 1 0| 0 0| 0 0| 1 0 | 0 0| 0 0| 0 0| 0 0| 0 0 | 1 0
CLAYTON COUNTY
| 5 3| 58 2| 44 2| 8 2| 115 2 | 0 0| 2 2| 2 3| 0 0| 4 2 | 119 2
CLINCH COUNTY
| 0 0| 1 0| 2 0| 0 0| 3 0 | 0 0| 0 0| 0 0| 0 0| 0 0 | 3 0
COBB COUNTY
| 7 4| 90 3| 68 4| 7 2| 172 3 | 0 0| 4 3| 1 1| 0 0| 5 2 | 177 3
COFFEE COUNTY
| 0 0| 11 0| 3 0| 3 1| 17 0 | 0 0| 1 1| 2 3| 1 4| 4 2 | 21 0
COLQUITT COUNTY
| 6 3| 28 1| 18 1| 1 0| 53 1 | 0 0| 0 0| 1 1| 0 0| 1 0 | 54 1
COLUMBIA COUNTY
| 0 0| 9 0| 7 0| 0 0| 16 0 | 0 0| 1 1| 1 1| 0 0| 2 1 | 18 0
------------------------------------------------------------------------------------------------------------------------------------
(continued)
Page 32 Run 10/24/00
Georgia Department of Corrections Office of Planning and Analysis
Inmate statistical profile
Sample: ACTIVE PRISONERS SERVING LIFE EXCLUDING JAIL
Requestor:
Active inmates 10/24/2000
Home County by current age & sex
Statistics (CONTINUED)
|
MEN
|
WOMEN
|
| Age | Age | Age | Age | Men
| Age | Age | Age | Age |Women
|Grand
Home County
|00-21 %|22-39 %|40-54 %|55-99 %|Total % |00-21 %|22-39 %|40-54 %|55-99 %|Total % |Total %
------------------------------------------------------------------------------------------------------------------------------------
COOK COUNTY
| 0 0| 6 0| 3 0| 1 0| 10 0 | 0 0| 2 2| 0 0| 0 0| 2 1 | 12 0
COWETA COUNTY
| 3 2| 18 1| 10 1| 1 0| 32 1 | 0 0| 2 2| 1 1| 0 0| 3 1 | 35 1
CRAWFORD COUNTY
| 0 0| 1 0| 1 0| 0 0| 2 0 | 0 0| 0 0| 0 0| 0 0| 0 0 | 2 0
CRISP COUNTY
| 4 2| 12 0| 8 0| 1 0| 25 0 | 0 0| 3 3| 0 0| 0 0| 3 1 | 28 1
DADE COUNTY
| 1 1| 4 0| 2 0| 3 1| 10 0 | 0 0| 0 0| 0 0| 0 0| 0 0 | 10 0
DAWSON COUNTY
| 0 0| 2 0| 1 0| 0 0| 3 0 | 0 0| 0 0| 0 0| 0 0| 0 0 | 3 0
DECATUR COUNTY
| 3 2| 14 1| 4 0| 0 0| 21 0 | 0 0| 0 0| 0 0| 0 0| 0 0 | 21 0
DEKALB COUNTY
| 14 8| 215 8| 126 7| 25 7| 380 7 | 1 13| 4 3| 2 3| 2 8| 9 4 | 389 7
DODGE COUNTY
| 0 0| 7 0| 7 0| 0 0| 14 0 | 0 0| 0 0| 0 0| 0 0| 0 0 | 14 0
DOOLY COUNTY
| 2 1| 7 0| 4 0| 0 0| 13 0 | 0 0| 0 0| 0 0| 0 0| 0 0 | 13 0
DOUGHERTY COUNTY | 7 4| 66 2| 40 2| 2 1| 115 2 | 0 0| 5 4| 1 1| 1 4| 7 3 | 122 2
DOUGLAS COUNTY
| 0 0| 20 1| 13 1| 2 1| 35 1 | 0 0| 1 1| 1 1| 0 0| 2 1 | 37 1
EARLY COUNTY
| 0 0| 7 0| 5 0| 1 0| 13 0 | 0 0| 0 0| 0 0| 0 0| 0 0 | 13 0
ECHOLS COUNTY.
| 0 0| 0 0| 0 0| 0 0| 0 0 | 0 0| 0 0| 0 0| 0 0| 0 0 | 0 0
EFFINGHAM COUNTY | 0 0| 4 0| 3 0| 0 0| 7 0 | 0 0| 0 0| 0 0| 0 0| 0 0 | 7 0
ELBERT COUNTY
| 0 0| 11 0| 8 0| 1 0| 20 0 | 0 0| 1 1| 0 0| 0 0| 1 0 | 21 0
EMANUEL COUNTY
| 1 1| 9 0| 6 0| 1 0| 17 0 | 0 0| 0 0| 1 1| 0 0| 1 0 | 18 0
EVANS COUNTY
| 0 0| 7 0| 4 0| 1 0| 12 0 | 0 0| 0 0| 0 0| 0 0| 0 0 | 12 0
FANNIN COUNTY
| 0 0| 5 0| 3 0| 1 0| 9 0 | 0 0| 0 0| 0 0| 0 0| 0 0 | 9 0
FAYETTE COUNTY
| 0 0| 3 0| 3 0| 0 0| 6 0 | 0 0| 0 0| 0 0| 0 0| 0 0 | 6 0
FLOYD COUNTY
| 2 1| 31 1| 23 1| 1 0| 57 1 | 1 13| 3 3| 2 3| 1 4| 7 3 | 64 1
FORSYTH COUNTY
| 0 0| 7 0| 2 0| 2 1| 11 0 | 0 0| 0 0| 1 1| 0 0| 1 0 | 12 0
FRANKLIN COUNTY
| 0 0| 2 0| 4 0| 0 0| 6 0 | 0 0| 0 0| 0 0| 1 4| 1 0 | 7 0
FULTON COUNTY
| 26 15| 502 18| 345 18| 55 15| 928 18 | 1 13| 14 12| 7 9| 4 17| 26 12 | 954 18
GILMER COUNTY
| 0 0| 1 0| 3 0| 2 1| 6 0 | 0 0| 0 0| 0 0| 0 0| 0 0 | 6 0
GLASCOCK COUNTY
| 0 0| 0 0| 1 0| 0 0| 1 0 | 0 0| 0 0| 0 0| 0 0| 0 0 | 1 0
GLYNN COUNTY
| 4 2| 29 1| 27 1| 3 1| 63 1 | 0 0| 1 1| 2 3| 0 0| 3 1 | 66 1
GORDON COUNTY
| 0 0| 22 1| 12 1| 3 1| 37 1 | 0 0| 1 1| 0 0| 0 0| 1 0 | 38 1
GRADY COUNTY
| 1 1| 14 1| 7 0| 0 0| 22 0 | 0 0| 0 0| 0 0| 0 0| 0 0 | 22 0
GREENE COUNTY
| 1 1| 3 0| 3 0| 1 0| 8 0 | 0 0| 0 0| 1 1| 0 0| 1 0 | 9 0
GWINNETT COUNTY
| 2 1| 67 2| 40 2| 9 2| 118 2 | 0 0| 3 3| 2 3| 0 0| 5 2 | 123 2
HABERSHAM COUNTY | 0 0| 9 0| 7 0| 0 0| 16 0 | 0 0| 0 0| 0 0| 0 0| 0 0 | 16 0
HALL COUNTY
| 2 1| 31 1| 36 2| 11 3| 80 2 | 1 13| 2 2| 1 1| 1 4| 5 2 | 85 2
HANCOCK COUNTY
| 1 1| 2 0| 2 0| 1 0| 6 0 | 0 0| 0 0| 1 1| 0 0| 1 0 | 7 0
HARALSON COUNTY
| 0 0| 1 0| 2 0| 1 0| 4 0 | 0 0| 1 1| 0 0| 0 0| 1 0 | 5 0
------------------------------------------------------------------------------------------------------------------------------------
(continued)
Page 33 Run 10/24/00
Georgia Department of Corrections Office of Planning and Analysis
Inmate statistical profile
Sample: ACTIVE PRISONERS SERVING LIFE EXCLUDING JAIL
Requestor:
Active inmates 10/24/2000
Home County by current age & sex
Statistics (CONTINUED)
|
MEN
|
WOMEN
|
| Age | Age | Age | Age | Men
| Age | Age | Age | Age |Women
|Grand
Home County
|00-21 %|22-39 %|40-54 %|55-99 %|Total % |00-21 %|22-39 %|40-54 %|55-99 %|Total % |Total %
------------------------------------------------------------------------------------------------------------------------------------
HARRIS COUNTY
| 1 1| 6 0| 2 0| 0 0| 9 0 | 0 0| 0 0| 0 0| 0 0| 0 0 | 9 0
HART COUNTY
| 0 0| 1 0| 2 0| 0 0| 3 0 | 0 0| 0 0| 1 1| 0 0| 1 0 | 4 0
HEARD COUNTY
| 0 0| 1 0| 1 0| 2 1| 4 0 | 0 0| 0 0| 0 0| 0 0| 0 0 | 4 0
HENRY COUNTY
| 1 1| 19 1| 8 0| 5 1| 33 1 | 0 0| 1 1| 2 3| 0 0| 3 1 | 36 1
HOUSTON COUNTY
| 0 0| 41 1| 22 1| 5 1| 68 1 | 0 0| 3 3| 4 5| 0 0| 7 3 | 75 1
IRWIN COUNTY
| 1 1| 5 0| 3 0| 0 0| 9 0 | 0 0| 0 0| 0 0| 0 0| 0 0 | 9 0
JACKSON COUNTY
| 1 1| 9 0| 11 1| 5 1| 26 0 | 0 0| 0 0| 0 0| 0 0| 0 0 | 26 0
JASPER COUNTY
| 2 1| 8 0| 0 0| 1 0| 11 0 | 0 0| 0 0| 0 0| 0 0| 0 0 | 11 0
JEFF DAVIS COUNTY | 1 1| 5 0| 2 0| 1 0| 9 0 | 0 0| 0 0| 0 0| 0 0| 0 0 | 9 0
JEFFERSON COUNTY | 0 0| 5 0| 2 0| 2 1| 9 0 | 0 0| 1 1| 0 0| 0 0| 1 0 | 10 0
JENKINS COUNTY
| 0 0| 0 0| 6 0| 0 0| 6 0 | 0 0| 0 0| 0 0| 0 0| 0 0 | 6 0
JOHNSON COUNTY
| 0 0| 3 0| 2 0| 0 0| 5 0 | 0 0| 0 0| 0 0| 0 0| 0 0 | 5 0
JONES COUNTY
| 0 0| 0 0| 4 0| 1 0| 5 0 | 0 0| 1 1| 0 0| 0 0| 1 0 | 6 0
LAMAR COUNTY
| 0 0| 9 0| 9 0| 3 1| 21 0 | 0 0| 0 0| 1 1| 0 0| 1 0 | 22 0
LANIER COUNTY
| 0 0| 0 0| 0 0| 0 0| 0 0 | 0 0| 0 0| 0 0| 0 0| 0 0 | 0 0
LAURENS COUNTY
| 1 1| 15 1| 7 0| 2 1| 25 0 | 0 0| 1 1| 1 1| 0 0| 2 1 | 27 0
LEE COUNTY
| 0 0| 3 0| 0 0| 0 0| 3 0 | 0 0| 0 0| 0 0| 0 0| 0 0 | 3 0
LIBERTY COUNTY
| 0 0| 25 1| 8 0| 4 1| 37 1 | 0 0| 2 2| 0 0| 0 0| 2 1 | 39 1
LINCOLN COUNTY
| 1 1| 1 0| 3 0| 0 0| 5 0 | 0 0| 0 0| 0 0| 0 0| 0 0 | 5 0
LONG COUNTY
| 0 0| 5 0| 2 0| 1 0| 8 0 | 0 0| 1 1| 0 0| 0 0| 1 0 | 9 0
LOWNDES COUNTY
| 0 0| 34 1| 21 1| 3 1| 58 1 | 0 0| 0 0| 2 3| 1 4| 3 1 | 61 1
LUMPKIN COUNTY
| 1 1| 5 0| 4 0| 1 0| 11 0 | 0 0| 0 0| 0 0| 0 0| 0 0 | 11 0
MACON COUNTY
| 0 0| 12 0| 5 0| 0 0| 17 0 | 0 0| 0 0| 1 1| 0 0| 1 0 | 18 0
MADISON COUNTY
| 0 0| 7 0| 6 0| 2 1| 15 0 | 0 0| 2 2| 0 0| 0 0| 2 1 | 17 0
MARION COUNTY
| 1 1| 1 0| 1 0| 0 0| 3 0 | 0 0| 0 0| 0 0| 0 0| 0 0 | 3 0
MCDUFFIE COUNTY
| 0 0| 22 1| 10 1| 4 1| 36 1 | 1 13| 1 1| 0 0| 0 0| 2 1 | 38 1
MCINTOSH COUNTY
| 1 1| 4 0| 3 0| 0 0| 8 0 | 0 0| 0 0| 0 0| 0 0| 0 0 | 8 0
MERIWETHER COUNTY | 1 1| 7 0| 7 0| 3 1| 18 0 | 0 0| 1 1| 0 0| 1 4| 2 1 | 20 0
MILLER COUNTY
| 0 0| 3 0| 3 0| 0 0| 6 0 | 0 0| 0 0| 0 0| 0 0| 0 0 | 6 0
MITCHELL COUNTY
| 0 0| 12 0| 11 1| 3 1| 26 0 | 0 0| 1 1| 0 0| 0 0| 1 0 | 27 0
MONROE COUNTY
| 0 0| 11 0| 3 0| 0 0| 14 0 | 0 0| 0 0| 0 0| 0 0| 0 0 | 14 0
MONTGOMERY COUNTY | 0 0| 0 0| 0 0| 0 0| 0 0 | 0 0| 1 1| 0 0| 0 0| 1 0 | 1 0
MORGAN COUNTY
| 0 0| 8 0| 2 0| 0 0| 10 0 | 0 0| 0 0| 0 0| 0 0| 0 0 | 10 0
MURRAY COUNTY
| 2 1| 6 0| 4 0| 4 1| 16 0 | 0 0| 1 1| 0 0| 0 0| 1 0 | 17 0
MUSCOGEE COUNTY
| 5 3| 67 2| 59 3| 9 2| 140 3 | 0 0| 3 3| 3 4| 0 0| 6 3 | 146 3
------------------------------------------------------------------------------------------------------------------------------------
(continued)
Page 34 Run 10/24/00
Georgia Department of Corrections Office of Planning and Analysis
Inmate statistical profile
Sample: ACTIVE PRISONERS SERVING LIFE EXCLUDING JAIL
Requestor:
Active inmates 10/24/2000
Home County by current age & sex
Statistics (CONTINUED)
|
MEN
|
WOMEN
|
| Age | Age | Age | Age | Men
| Age | Age | Age | Age |Women
|Grand
Home County
|00-21 %|22-39 %|40-54 %|55-99 %|Total % |00-21 %|22-39 %|40-54 %|55-99 %|Total % |Total %
------------------------------------------------------------------------------------------------------------------------------------
NEWTON COUNTY
| 1 1| 38 1| 11 1| 4 1| 54 1 | 0 0| 2 2| 0 0| 1 4| 3 1 | 57 1
OCONEE COUNTY
| 0 0| 3 0| 2 0| 0 0| 5 0 | 0 0| 0 0| 1 1| 0 0| 1 0 | 6 0
OGLETHORPE COUNTY | 0 0| 3 0| 1 0| 0 0| 4 0 | 0 0| 0 0| 0 0| 0 0| 0 0 | 4 0
PAULDING COUNTY
| 0 0| 9 0| 5 0| 3 1| 17 0 | 0 0| 0 0| 1 1| 1 4| 2 1 | 19 0
PEACH COUNTY
| 0 0| 7 0| 2 0| 0 0| 9 0 | 0 0| 1 1| 0 0| 0 0| 1 0 | 10 0
PICKENS COUNTY
| 0 0| 3 0| 0 0| 0 0| 3 0 | 0 0| 0 0| 1 1| 0 0| 1 0 | 4 0
PIERCE COUNTY
| 2 1| 2 0| 2 0| 0 0| 6 0 | 0 0| 0 0| 0 0| 0 0| 0 0 | 6 0
PIKE COUNTY
| 0 0| 1 0| 0 0| 0 0| 1 0 | 0 0| 0 0| 0 0| 0 0| 0 0 | 1 0
POLK COUNTY
| 1 1| 12 0| 5 0| 3 1| 21 0 | 0 0| 0 0| 0 0| 0 0| 0 0 | 21 0
PULASKI COUNTY
| 0 0| 4 0| 3 0| 0 0| 7 0 | 0 0| 1 1| 0 0| 0 0| 1 0 | 8 0
PUTNAM COUNTY
| 0 0| 15 1| 13 1| 1 0| 29 1 | 0 0| 0 0| 0 0| 0 0| 0 0 | 29 1
QUITMAN COUNTY
| 0 0| 2 0| 0 0| 0 0| 2 0 | 0 0| 0 0| 0 0| 0 0| 0 0 | 2 0
RABUN COUNTY
| 0 0| 6 0| 3 0| 0 0| 9 0 | 0 0| 0 0| 0 0| 0 0| 0 0 | 9 0
RANDOLPH COUNTY
| 0 0| 3 0| 3 0| 1 0| 7 0 | 0 0| 0 0| 0 0| 0 0| 0 0 | 7 0
RICHMOND COUNTY
| 13 7| 146 5| 65 3| 8 2| 232 4 | 0 0| 8 7| 8 11| 1 4| 17 8 | 249 5
ROCKDALE COUNTY
| 1 1| 10 0| 7 0| 5 1| 23 0 | 0 0| 1 1| 0 0| 0 0| 1 0 | 24 0
SCHLEY COUNTY
| 0 0| 2 0| 2 0| 0 0| 4 0 | 0 0| 0 0| 0 0| 0 0| 0 0 | 4 0
SCREVEN COUNTY
| 0 0| 3 0| 2 0| 2 1| 7 0 | 0 0| 0 0| 0 0| 0 0| 0 0 | 7 0
SEMINOLE COUNTY
| 1 1| 5 0| 5 0| 1 0| 12 0 | 0 0| 1 1| 0 0| 0 0| 1 0 | 13 0
SPALDING COUNTY
| 3 2| 35 1| 22 1| 5 1| 65 1 | 1 13| 1 1| 1 1| 1 4| 4 2 | 69 1
STEPHENS COUNTY
| 0 0| 5 0| 6 0| 4 1| 15 0 | 0 0| 0 0| 0 0| 0 0| 0 0 | 15 0
STEWART COUNTY
| 0 0| 2 0| 2 0| 0 0| 4 0 | 0 0| 0 0| 0 0| 0 0| 0 0 | 4 0
SUMTER COUNTY
| 0 0| 3 0| 15 1| 2 1| 20 0 | 0 0| 0 0| 1 1| 0 0| 1 0 | 21 0
TALBOT COUNTY
| 1 1| 3 0| 1 0| 0 0| 5 0 | 0 0| 0 0| 1 1| 0 0| 1 0 | 6 0
TALIAFERRO COUNTY | 0 0| 0 0| 1 0| 0 0| 1 0 | 0 0| 0 0| 0 0| 0 0| 0 0 | 1 0
TATTNALL COUNTY
| 1 1| 16 1| 4 0| 0 0| 21 0 | 0 0| 0 0| 1 1| 0 0| 1 0 | 22 0
TAYLOR COUNTY
| 1 1| 11 0| 3 0| 1 0| 16 0 | 0 0| 0 0| 0 0| 0 0| 0 0 | 16 0
TELFAIR COUNTY
| 1 1| 6 0| 3 0| 0 0| 10 0 | 0 0| 0 0| 1 1| 0 0| 1 0 | 11 0
TERRELL COUNTY
| 2 1| 11 0| 1 0| 0 0| 14 0 | 0 0| 0 0| 0 0| 0 0| 0 0 | 14 0
THOMAS COUNTY
| 2 1| 14 1| 16 1| 4 1| 36 1 | 0 0| 2 2| 0 0| 0 0| 2 1 | 38 1
TIFT COUNTY
| 3 2| 29 1| 20 1| 4 1| 56 1 | 0 0| 0 0| 0 0| 1 4| 1 0 | 57 1
TOOMBS COUNTY
| 2 1| 13 0| 9 0| 0 0| 24 0 | 0 0| 1 1| 0 0| 0 0| 1 0 | 25 0
TOWNS COUNTY
| 0 0| 0 0| 0 0| 0 0| 0 0 | 0 0| 0 0| 0 0| 0 0| 0 0 | 0 0
TREUTLEN COUNTY
| 0 0| 2 0| 3 0| 0 0| 5 0 | 0 0| 0 0| 0 0| 0 0| 0 0 | 5 0
TROUP COUNTY
| 2 1| 21 1| 17 1| 5 1| 45 1 | 0 0| 1 1| 1 1| 0 0| 2 1 | 47 1
------------------------------------------------------------------------------------------------------------------------------------
(continued)
Page 35 Run 10/24/00
Georgia Department of Corrections Office of Planning and Analysis
Inmate statistical profile
Sample: ACTIVE PRISONERS SERVING LIFE EXCLUDING JAIL
Requestor:
Active inmates 10/24/2000
Home County by current age & sex
Statistics (CONTINUED)
|
MEN
|
WOMEN
|
| Age | Age | Age | Age | Men
| Age | Age | Age | Age |Women
|Grand
Home County
|00-21 %|22-39 %|40-54 %|55-99 %|Total % |00-21 %|22-39 %|40-54 %|55-99 %|Total % |Total %
------------------------------------------------------------------------------------------------------------------------------------
TURNER COUNTY
| 0 0| 8 0| 4 0| 0 0| 12 0 | 0 0| 0 0| 0 0| 0 0| 0 0 | 12 0
TWIGGS COUNTY
| 0 0| 5 0| 4 0| 0 0| 9 0 | 0 0| 0 0| 0 0| 0 0| 0 0 | 9 0
UNION COUNTY
| 0 0| 0 0| 0 0| 0 0| 0 0 | 0 0| 0 0| 0 0| 0 0| 0 0 | 0 0
UPSON COUNTY
| 0 0| 6 0| 5 0| 0 0| 11 0 | 0 0| 0 0| 1 1| 0 0| 1 0 | 12 0
WALKER COUNTY
| 1 1| 15 1| 6 0| 3 1| 25 0 | 0 0| 1 1| 1 1| 0 0| 2 1 | 27 0
WALTON COUNTY
| 2 1| 28 1| 17 1| 3 1| 50 1 | 0 0| 1 1| 0 0| 0 0| 1 0 | 51 1
WARE COUNTY
| 1 1| 14 1| 14 1| 2 1| 31 1 | 0 0| 0 0| 0 0| 0 0| 0 0 | 31 1
WARREN COUNTY
| 0 0| 3 0| 5 0| 1 0| 9 0 | 0 0| 0 0| 0 0| 0 0| 0 0 | 9 0
WASHINGTON COUNTY | 0 0| 13 0| 8 0| 0 0| 21 0 | 0 0| 1 1| 0 0| 0 0| 1 0 | 22 0
WAYNE COUNTY
| 0 0| 7 0| 13 1| 2 1| 22 0 | 0 0| 1 1| 0 0| 0 0| 1 0 | 23 0
WEBSTER COUNTY
| 0 0| 2 0| 0 0| 0 0| 2 0 | 0 0| 0 0| 0 0| 0 0| 0 0 | 2 0
WHEELER COUNTY
| 0 0| 1 0| 2 0| 2 1| 5 0 | 0 0| 0 0| 0 0| 0 0| 0 0 | 5 0
WHITE COUNTY
| 0 0| 3 0| 3 0| 1 0| 7 0 | 0 0| 0 0| 0 0| 0 0| 0 0 | 7 0
WHITFIELD COUNTY | 0 0| 11 0| 24 1| 6 2| 41 1 | 0 0| 2 2| 0 0| 0 0| 2 1 | 43 1
WILCOX COUNTY
| 0 0| 0 0| 6 0| 0 0| 6 0 | 0 0| 0 0| 0 0| 0 0| 0 0 | 6 0
WILKES COUNTY
| 0 0| 2 0| 3 0| 2 1| 7 0 | 0 0| 0 0| 0 0| 0 0| 0 0 | 7 0
WILKINSON COUNTY | 0 0| 7 0| 3 0| 0 0| 10 0 | 0 0| 0 0| 0 0| 0 0| 0 0 | 10 0
WORTH COUNTY
| 2 1| 13 0| 2 0| 0 0| 17 0 | 0 0| 1 1| 0 0| 0 0| 1 0 | 18 0
OUT OF STATE
| 0 1| 11 0| 56 3| 15 4| 82 2 | 0 0| 0 1| 0 0| 0 0| 0 0 | 82 2
------------------------------------------------------------------------------------------------------------------------------------
Total reported
| 175 100| 2755 100| 1908 100| 371 100| 5209 100 | 8 100| 117 100| 75 100| 24 100| 224 100 | 5433 100
|
|
|
|
|
|
|
|
|
|
|
Percent reported |
92.6|
90.8|
92.5|
91.2|
91.5 |
88.9|
92.9|
90.4|
96.0|
92.2 |
91.5
|
|
|
|
|
|
|
|
|
|
|
|
|
|
|
|
|
|
|
|
|
|
UNKNOWN
| 14 | 278 | 155 | 36 | 483
| 1 | 9 | 8 | 1 | 19
| 502
------------------------------------------------------------------------------------------------------------------------------------
Total
| 189 | 3033 | 2063 | 407 | 5692
| 9 | 126 | 83 | 25 | 243
| 5935
Georgia Department of Corrections
Page 36 Run 10/24/00
Office of Planning and Analysis
Inmate statistical profile
Sample: ACTIVE PRISONERS SERVING LIFE EXCLUDING JAIL
Requestor: Statistics
Active inmates 10/24/2000
Prison Sentence In Years by current age & sex
|
MEN
|
WOMEN
|
| Age | Age | Age | Age | Men
| Age | Age | Age | Age |Women
|Grand
Sentence In Years |00-21 %|22-39 %|40-54 %|55-99 %|Total % |00-21 %|22-39 %|40-54 %|55-99 %|Total % |Total %
------------------------------------------------------------------------------------------------------------------------------------
0-1
| 0 0| 0 0| 0 0| 0 0| 0 0 | 0 0| 0 0| 0 0| 0 0| 0 0 | 0 0
1.1-2
| 0 0| 0 0| 0 0| 0 0| 0 0 | 0 0| 0 0| 0 0| 0 0| 0 0 | 0 0
2.1-3
| 0 0| 0 0| 0 0| 0 0| 0 0 | 0 0| 0 0| 0 0| 0 0| 0 0 | 0 0
3.1-4
| 0 0| 0 0| 0 0| 0 0| 0 0 | 0 0| 0 0| 0 0| 0 0| 0 0 | 0 0
4.1-5
| 0 0| 0 0| 0 0| 0 0| 0 0 | 0 0| 0 0| 0 0| 0 0| 0 0 | 0 0
5.1-6
| 0 0| 0 0| 0 0| 0 0| 0 0 | 0 0| 0 0| 0 0| 0 0| 0 0 | 0 0
6.1-7
| 0 0| 0 0| 0 0| 0 0| 0 0 | 0 0| 0 0| 0 0| 0 0| 0 0 | 0 0
7.1-8
| 0 0| 0 0| 0 0| 0 0| 0 0 | 0 0| 0 0| 0 0| 0 0| 0 0 | 0 0
8.1-9
| 0 0| 0 0| 0 0| 0 0| 0 0 | 0 0| 0 0| 0 0| 0 0| 0 0 | 0 0
9.1-10
| 0 0| 0 0| 0 0| 0 0| 0 0 | 0 0| 0 0| 0 0| 0 0| 0 0 | 0 0
10.1-12
| 0 0| 0 0| 0 0| 0 0| 0 0 | 0 0| 0 0| 0 0| 0 0| 0 0 | 0 0
12.1-15
| 0 0| 0 0| 0 0| 0 0| 0 0 | 0 0| 0 0| 0 0| 0 0| 0 0 | 0 0
15.1-20
| 0 0| 0 0| 0 0| 0 0| 0 0 | 0 0| 0 0| 0 0| 0 0| 0 0 | 0 0
20.1-OVER
| 0 0| 0 0| 0 0| 0 0| 0 0 | 0 0| 0 0| 0 0| 0 0| 0 0 | 0 0
LIFE
| 189 100| 3033 100| 2063 100| 407 100| 5692 100 | 9 100| 126 100| 83 100| 25 100| 243 100 | 5935 100
DEATH
| 0 0| 0 0| 0 0| 0 0| 0 0 | 0 0| 0 0| 0 0| 0 0| 0 0 | 0 0
LIFE W/O PAROLE
| 0 0| 0 0| 0 0| 0 0| 0 0 | 0 0| 0 0| 0 0| 0 0| 0 0 | 0 0
YOUTHFUL OFFENDERS | 0 0| 0 0| 0 0| 0 0| 0 0 | 0 0| 0 0| 0 0| 0 0| 0 0 | 0 0
------------------------------------------------------------------------------------------------------------------------------------
Total reported
| 189 100| 3033 100| 2063 100| 407 100| 5692 100 | 9 100| 126 100| 83 100| 25 100| 243 100 | 5935 100
|
|
|
|
|
|
|
|
|
|
|
Percent reported | 100.0| 100.0| 100.0| 100.0| 100.0 | 100.0| 100.0| 100.0| 100.0| 100.0 | 100.0
|
|
|
|
|
|
|
|
|
|
|
|
|
|
|
|
|
|
|
|
|
|
NOT REPORTED
|0|0|0|0|0
|0|0|0|0|0
|0
------------------------------------------------------------------------------------------------------------------------------------
Total
| 189 | 3033 | 2063 | 407 | 5692
| 9 | 126 | 83 | 25 | 243
| 5935
|
|
|
|
|
|
|
|
|
|
|
|
|
|
|
|
|
|
|
|
|
|
|
|
|
|
|
|
|
|
|
|
|
|
|
|
|
|
|
|
|
|
|
|
|
|
|
|
|
|
|
|
|
|
|
AVG EXCLUDING
|
|
|
|
|
|
|
|
|
|
|
LIFE, DEATH, YO
| .00 | .00 | .00 | .00 | .00 | .00 | .00 | .00 | .00 | .00 | .00
|
|
|
|
|
|
|
|
|
|
|
|
|
|
|
|
|
|
|
|
|
|
|
|
|
|
|
|
|
|
|
|
|
|
|
|
|
|
|
|
|
|
|
|
|
|
|
|
|
|
|
|
|
|
|
AVG INCLUDING
|
|
|
|
|
|
|
|
|
|
|
LIFE=21, YO=3 YRS | 21.00 | 21.00 | 21.00 | 21.00 | 21.00 | 21.00 | 21.00 | 21.00 | 21.00 | 21.00 | 21.00
Page 37 Run 10/24/00
Georgia Department of Corrections Office of Planning and Analysis
Inmate statistical profile
Sample: ACTIVE PRISONERS SERVING LIFE EXCLUDING JAIL
Requestor: Statistics
Active inmates 10/24/2000
Probation To Follow Prison by current age & sex
|
MEN
|
WOMEN
|
| Age | Age | Age | Age | Men
| Age | Age | Age | Age |Women
|Grand
Prob After Prison |00-21 %|22-39 %|40-54 %|55-99 %|Total % |00-21 %|22-39 %|40-54 %|55-99 %|Total % |Total %
------------------------------------------------------------------------------------------------------------------------------------
PROBATION TO FOLLOW | 9 5| 92 3| 62 3| 6 1| 169 3 | 0 0| 3 2| 3 4| 1 4| 7 3 | 176 3
NO PROBATION
| 180 95| 2941 97| 2001 97| 401 99| 5523 97 | 9 100| 123 98| 80 96| 24 96| 236 97 | 5759 97
------------------------------------------------------------------------------------------------------------------------------------
Total reported
| 189 100| 3033 100| 2063 100| 407 100| 5692 100 | 9 100| 126 100| 83 100| 25 100| 243 100 | 5935 100
|
|
|
|
|
|
|
|
|
|
|
Percent reported | 100.0| 100.0| 100.0| 100.0| 100.0 | 100.0| 100.0| 100.0| 100.0| 100.0 | 100.0
|
|
|
|
|
|
|
|
|
|
|
|
|
|
|
|
|
|
|
|
|
|
NOT REPORTED
|0|0|0|0|0
|0|0|0|0|0
|0
------------------------------------------------------------------------------------------------------------------------------------
Total
| 189 | 3033 | 2063 | 407 | 5692
| 9 | 126 | 83 | 25 | 243
| 5935
Page 38 Run 10/24/00
Georgia Department of Corrections Office of Planning and Analysis
Inmate statistical profile
Sample: ACTIVE PRISONERS SERVING LIFE EXCLUDING JAIL
Requestor: Statistics
Active inmates 10/24/2000
Admission Type by current age & sex
|
MEN
|
WOMEN
|
| Age | Age | Age | Age | Men
| Age | Age | Age | Age |Women
|Grand
Admission Type
|00-21 %|22-39 %|40-54 %|55-99 %|Total % |00-21 %|22-39 %|40-54 %|55-99 %|Total % |Total %
------------------------------------------------------------------------------------------------------------------------------------
COMMITTED FROM COURT| 187 99| 2458 81| 1510 73| 291 71| 4446 78 | 9 100| 115 91| 71 86| 25 100| 220 91 | 4666 79
RETURN APPEAL/BOND | 0 0| 0 0| 1 0| 0 0| 1 0 | 0 0| 0 0| 0 0| 0 0| 0 0 | 1 0
PAROLE REV/NEW SENT | 0 0| 365 12| 340 16| 73 18| 778 14 | 0 0| 7 6| 7 8| 0 0| 14 6 | 792 13
PAR REV/NO NEW SENT | 0 0| 21 1| 68 3| 8 2| 97 2 | 0 0| 1 1| 1 1| 0 0| 2 1 | 99 2
PROB VIOL/TOTAL REV | 0 0| 0 0| 0 0| 0 0| 0 0 | 0 0| 0 0| 0 0| 0 0| 0 0 | 0 0
PROB VIOL/PARTIAL | 0 0| 37 1| 40 2| 3 1| 80 1 | 0 0| 0 0| 2 2| 0 0| 2 1 | 82 1
ADMIT FM OTHER CUST | 0 0| 1 0| 2 0| 4 1| 7 0 | 0 0| 0 0| 0 0| 0 0| 0 0 | 7 0
SHOCK INCARCERATION | 0 0| 0 0| 0 0| 0 0| 0 0 | 0 0| 0 0| 0 0| 0 0| 0 0 | 0 0
PROB REV/REMAINDER | 1 1| 116 4| 45 2| 7 2| 169 3 | 0 0| 3 2| 2 2| 0 0| 5 2 | 174 3
NEW SENT/PAR REV PND| 0 0| 2 0| 4 0| 1 0| 7 0 | 0 0| 0 0| 0 0| 0 0| 0 0 | 7 0
LIFE W/O PAROLE
| 1 1| 9 0| 3 0| 0 0| 13 0 | 0 0| 0 0| 0 0| 0 0| 0 0 | 13 0
PAROLE REV BOOT CAMP| 0 0| 2 0| 1 0| 0 0| 3 0 | 0 0| 0 0| 0 0| 0 0| 0 0 | 3 0
PAR REV/RSN UNKNOWN | 0 0| 18 1| 39 2| 19 5| 76 1 | 0 0| 0 0| 0 0| 0 0| 0 0 | 76 1
PROBATION/PAROLE REV| 0 0| 0 0| 0 0| 0 0| 0 0 | 0 0| 0 0| 0 0| 0 0| 0 0 | 0 0
PB PAROLE RESCINDED | 0 0| 0 0| 0 0| 0 0| 0 0 | 0 0| 0 0| 0 0| 0 0| 0 0 | 0 0
PROB REVOCATION/SC | 0 0| 0 0| 0 0| 0 0| 0 0 | 0 0| 0 0| 0 0| 0 0| 0 0 | 0 0
PAR REV/REVOC CENTER| 0 0| 3 0| 9 0| 1 0| 13 0 | 0 0| 0 0| 0 0| 0 0| 0 0 | 13 0
INFORMATION ONLY | 0 0| 0 0| 0 0| 0 0| 0 0 | 0 0| 0 0| 0 0| 0 0| 0 0 | 0 0
INCOMPLETE SENT PKG | 0 0| 0 0| 0 0| 0 0| 0 0 | 0 0| 0 0| 0 0| 0 0| 0 0 | 0 0
HANCOCK REVOC CENTER| 0 0| 0 0| 0 0| 0 0| 0 0 | 0 0| 0 0| 0 0| 0 0| 0 0 | 0 0
WHITWORTH DETENTION | 0 0| 0 0| 1 0| 0 0| 1 0 | 0 0| 0 0| 0 0| 0 0| 0 0 | 1 0
DCYS AT RISK
| 0 0| 0 0| 0 0| 0 0| 0 0 | 0 0| 0 0| 0 0| 0 0| 0 0 | 0 0
OTHER
| 0 0| 0 0| 0 0| 0 0| 0 0 | 0 0| 0 0| 0 0| 0 0| 0 0 | 0 0
------------------------------------------------------------------------------------------------------------------------------------
Total reported
| 189 100| 3032 100| 2063 100| 407 100| 5691 100 | 9 100| 126 100| 83 100| 25 100| 243 100 | 5934 100
|
|
|
|
|
|
|
|
|
|
|
Percent reported | 100.0| 100.0| 100.0| 100.0| 100.0 | 100.0| 100.0| 100.0| 100.0| 100.0 | 100.0
|
|
|
|
|
|
|
|
|
|
|
|
|
|
|
|
|
|
|
|
|
|
UNKNOWN
|0|1|0|0|1
|0|0|0|0|0
|1
------------------------------------------------------------------------------------------------------------------------------------
Total
| 189 | 3033 | 2063 | 407 | 5692
| 9 | 126 | 83 | 25 | 243
| 5935
Page 39 Run 10/24/00
Georgia Department of Corrections Office of Planning and Analysis
Inmate statistical profile
Sample: ACTIVE PRISONERS SERVING LIFE EXCLUDING JAIL
Requestor: Statistics
Active inmates 10/24/2000
Release Type by current age & sex
|
MEN
|
WOMEN
|
| Age | Age | Age | Age | Men
| Age | Age | Age | Age |Women
|Grand
Release Type
|00-21 %|22-39 %|40-54 %|55-99 %|Total % |00-21 %|22-39 %|40-54 %|55-99 %|Total % |Total %
------------------------------------------------------------------------------------------------------------------------------------
PAROLE
| 0 0| 1 0| 0 0| 0 0| 1 0 | 0 0| 0 0| 0 0| 0 0| 0 0 | 1 0
Active
| 189 100| 3033 100| 2063 100| 407 100| 5692 100 | 9 100| 126 100| 83 100| 25 100| 243 100 | 5935 100
------------------------------------------------------------------------------------------------------------------------------------
Total
| 189 | 3033 | 2063 | 407 | 5692
| 9 | 126 | 83 | 25 | 243
| 5935
Page 40 Run 10/24/00
Georgia Department of Corrections Office of Planning and Analysis
Inmate statistical profile
Sample: ACTIVE PRISONERS SERVING LIFE EXCLUDING JAIL
Requestor: Statistics
Active inmates 10/24/2000
Inst By Group by current age & sex
|
MEN
|
WOMEN
|
| Age | Age | Age | Age | Men
| Age | Age | Age | Age |Women
|Grand
Inst By Group
|00-21 %|22-39 %|40-54 %|55-99 %|Total % |00-21 %|22-39 %|40-54 %|55-99 %|Total % |Total %
------------------------------------------------------------------------------------------------------------------------------------
County jails
| 0 0| 0 0| 0 0| 0 0| 0 0 | 0 0| 0 0| 0 0| 0 0| 0 0 | 0 0
Transitional centers| 0 0| 13 0| 23 1| 6 1| 42 1 | 0 0| 2 2| 0 0| 1 4| 3 1 | 45 1
County camps
| 0 0| 13 0| 9 0| 4 1| 26 0 | 0 0| 0 0| 0 0| 0 0| 0 0 | 26 0
Inmate boot camps | 0 0| 0 0| 0 0| 0 0| 0 0 | 0 0| 0 0| 0 0| 0 0| 0 0 | 0 0
State prisons
| 189 100| 2908 96| 1963 95| 387 95| 5447 96 | 9 100| 124 98| 83 100| 24 96| 240 99 | 5687 96
Private prisons
| 0 0| 99 3| 68 3| 10 2| 177 3 | 0 0| 0 0| 0 0| 0 0| 0 0 | 177 3
Other
| 0 0| 0 0| 0 0| 0 0| 0 0 | 0 0| 0 0| 0 0| 0 0| 0 0 | 0 0
------------------------------------------------------------------------------------------------------------------------------------
Total reported
| 189 100| 3033 100| 2063 100| 407 100| 5692 100 | 9 100| 126 100| 83 100| 25 100| 243 100 | 5935 100
|
|
|
|
|
|
|
|
|
|
|
Percent reported | 100.0| 100.0| 100.0| 100.0| 100.0 | 100.0| 100.0| 100.0| 100.0| 100.0 | 100.0
|
|
|
|
|
|
|
|
|
|
|
|
|
|
|
|
|
|
|
|
|
|
Not reported
|0|0|0|0|0
|0|0|0|0|0
|0
------------------------------------------------------------------------------------------------------------------------------------
Total
| 189 | 3033 | 2063 | 407 | 5692
| 9 | 126 | 83 | 25 | 243
| 5935
Page 41 Run 10/24/00
Georgia Department of Corrections Office of Planning and Analysis
Inmate statistical profile
Sample: ACTIVE PRISONERS SERVING LIFE EXCLUDING JAIL
Requestor: Statistics
Active inmates 10/24/2000
Institution by current age & sex
|
MEN
|
WOMEN
|
| Age | Age | Age | Age | Men
| Age | Age | Age | Age |Women
|Grand
Institution
|00-21 %|22-39 %|40-54 %|55-99 %|Total % |00-21 %|22-39 %|40-54 %|55-99 %|Total % |Total %
------------------------------------------------------------------------------------------------------------------------------------
Albany Trans Ctr | 0 0| 1 0| 2 0| 0 0| 3 0 | 0 0| 0 0| 0 0| 0 0| 0 0 | 3 0
Atlanta Trans Ctr(M)| 0 0| 8 0| 13 1| 5 1| 26 0 | 0 0| 0 0| 0 0| 0 0| 0 0 | 26 0
Macon Trans Ctr
| 0 0| 3 0| 3 0| 0 0| 6 0 | 0 0| 0 0| 0 0| 0 0| 0 0 | 6 0
Metro Trans Ctr (W) | 0 0| 0 0| 0 0| 0 0| 0 0 | 0 0| 1 1| 0 0| 1 4| 2 1 | 2 0
Savannah Trans Ctr | 0 0| 1 0| 5 0| 1 0| 7 0 | 0 0| 0 0| 0 0| 0 0| 0 0 | 7 0
Savannah Womens TC | 0 0| 0 0| 0 0| 0 0| 0 0 | 0 0| 1 1| 0 0| 0 0| 1 0 | 1 0
Carroll County
| 0 0| 0 0| 0 0| 1 0| 1 0 | 0 0| 0 0| 0 0| 0 0| 0 0 | 1 0
Clarke County
| 0 0| 1 0| 0 0| 0 0| 1 0 | 0 0| 0 0| 0 0| 0 0| 0 0 | 1 0
Colquitt County
| 0 0| 0 0| 1 0| 0 0| 1 0 | 0 0| 0 0| 0 0| 0 0| 0 0 | 1 0
Coweta County
| 0 0| 3 0| 1 0| 0 0| 4 0 | 0 0| 0 0| 0 0| 0 0| 0 0 | 4 0
Floyd County
| 0 0| 0 0| 1 0| 0 0| 1 0 | 0 0| 0 0| 0 0| 0 0| 0 0 | 1 0
Hall County
| 0 0| 2 0| 2 0| 0 0| 4 0 | 0 0| 0 0| 0 0| 0 0| 0 0 | 4 0
Jackson County
| 0 0| 1 0| 2 0| 1 0| 4 0 | 0 0| 0 0| 0 0| 0 0| 0 0 | 4 0
Jefferson County | 0 0| 2 0| 1 0| 0 0| 3 0 | 0 0| 0 0| 0 0| 0 0| 0 0 | 3 0
Mitchell County
| 0 0| 0 0| 1 0| 0 0| 1 0 | 0 0| 0 0| 0 0| 0 0| 0 0 | 1 0
Screven County
| 0 0| 1 0| 0 0| 0 0| 1 0 | 0 0| 0 0| 0 0| 0 0| 0 0 | 1 0
Stewart County
| 0 0| 0 0| 0 0| 1 0| 1 0 | 0 0| 0 0| 0 0| 0 0| 0 0 | 1 0
Terrell County
| 0 0| 0 0| 0 0| 1 0| 1 0 | 0 0| 0 0| 0 0| 0 0| 0 0 | 1 0
Clayton County
| 0 0| 3 0| 0 0| 0 0| 3 0 | 0 0| 0 0| 0 0| 0 0| 0 0 | 3 0
Ware Prison
| 13 7| 208 7| 99 5| 10 2| 330 6 | 0 0| 0 0| 0 0| 0 0| 0 0 | 330 6
Lowndes Prison
| 0 0| 5 0| 7 0| 1 0| 13 0 | 0 0| 0 0| 0 0| 0 0| 0 0 | 13 0
Dodge Prison
| 0 0| 57 2| 67 3| 6 1| 130 2 | 0 0| 0 0| 0 0| 0 0| 0 0 | 130 2
Phillips Prison
| 5 3| 126 4| 88 4| 23 6| 242 4 | 0 0| 0 0| 0 0| 0 0| 0 0 | 242 4
Walker Prison
| 0 0| 23 1| 27 1| 4 1| 54 1 | 0 0| 0 0| 0 0| 0 0| 0 0 | 54 1
Wayne Prison
| 0 0| 2 0| 4 0| 0 0| 6 0 | 0 0| 0 0| 0 0| 0 0| 0 0 | 6 0
Arrendale Prison | 49 26| 103 3| 23 1| 1 0| 176 3 | 0 0| 0 0| 0 0| 0 0| 0 0 | 176 3
Montgomery Prison | 0 0| 15 0| 13 1| 3 1| 31 1 | 0 0| 0 0| 0 0| 0 0| 0 0 | 31 1
Lee Prison
| 1 1| 26 1| 18 1| 1 0| 46 1 | 0 0| 0 0| 0 0| 0 0| 0 0 | 46 1
Putnam Prison
| 0 0| 5 0| 0 0| 0 0| 5 0 | 0 0| 0 0| 0 0| 0 0| 0 0 | 5 0
Georgia State Prison| 6 3| 275 9| 211 10| 18 4| 510 9 | 0 0| 0 0| 0 0| 0 0| 0 0 | 510 9
Mens Prison
| 0 0| 15 0| 33 2| 73 18| 121 2 | 0 0| 0 0| 0 0| 0 0| 0 0 | 121 2
Jackson Prison-Diag | 8 4| 23 1| 8 0| 3 1| 42 1 | 0 0| 0 0| 0 0| 0 0| 0 0 | 42 1
Jackson Prison-Perm | 0 0| 3 0| 1 0| 0 0| 4 0 | 0 0| 0 0| 0 0| 0 0| 0 0 | 4 0
Coastal Prison
| 4 2| 38 1| 17 1| 1 0| 60 1 | 0 0| 0 0| 0 0| 0 0| 0 0 | 60 1
Scott Prison
| 0 0| 73 2| 48 2| 11 3| 132 2 | 0 0| 0 0| 0 0| 0 0| 0 0 | 132 2
Rivers Prison
| 0 0| 74 2| 67 3| 9 2| 150 3 | 0 0| 0 0| 0 0| 0 0| 0 0 | 150 3
------------------------------------------------------------------------------------------------------------------------------------
(continued)
Page 42 Run 10/24/00
Georgia Department of Corrections Office of Planning and Analysis
Inmate statistical profile
Sample: ACTIVE PRISONERS SERVING LIFE EXCLUDING JAIL
Requestor:
Active inmates 10/24/2000
Institution by current age & sex
Statistics (CONTINUED)
|
MEN
|
WOMEN
|
| Age | Age | Age | Age | Men
| Age | Age | Age | Age |Women
|Grand
Institution
|00-21 %|22-39 %|40-54 %|55-99 %|Total % |00-21 %|22-39 %|40-54 %|55-99 %|Total % |Total %
------------------------------------------------------------------------------------------------------------------------------------
Rutledge Prison
| 0 0| 40 1| 58 3| 16 4| 114 2 | 0 0| 0 0| 0 0| 0 0| 0 0 | 114 2
Central Prison
| 0 0| 87 3| 114 6| 20 5| 221 4 | 0 0| 0 0| 0 0| 0 0| 0 0 | 221 4
Augusta Med Prison | 1 1| 81 3| 80 4| 25 6| 187 3 | 0 0| 0 0| 0 0| 0 0| 0 0 | 187 3
Rogers Prison
| 0 0| 25 1| 20 1| 0 0| 45 1 | 0 0| 0 0| 0 0| 0 0| 0 0 | 45 1
Burruss Prison
| 0 0| 5 0| 10 0| 2 0| 17 0 | 0 0| 0 0| 0 0| 0 0| 0 0 | 17 0
Bostick Prison
| 0 0| 10 0| 26 1| 27 7| 63 1 | 0 0| 0 0| 0 0| 0 0| 0 0 | 63 1
Valdosta Prison
| 8 4| 151 5| 97 5| 16 4| 272 5 | 0 0| 0 0| 0 0| 0 0| 0 0 | 272 5
Hays Prison
| 7 4| 165 5| 110 5| 15 4| 297 5 | 0 0| 0 0| 0 0| 0 0| 0 0 | 297 5
Hancock Prison
| 8 4| 226 7| 109 5| 19 5| 362 6 | 0 0| 0 0| 0 0| 0 0| 0 0 | 362 6
Telfair Prison
| 17 9| 209 7| 100 5| 11 3| 337 6 | 0 0| 0 0| 0 0| 0 0| 0 0 | 337 6
Autry Prison
| 9 5| 140 5| 97 5| 17 4| 263 5 | 0 0| 0 0| 0 0| 0 0| 0 0 | 263 4
Wilcox Prison
| 0 0| 70 2| 73 4| 6 1| 149 3 | 0 0| 0 0| 0 0| 0 0| 0 0 | 149 3
Calhoun Prison
| 10 5| 78 3| 57 3| 5 1| 150 3 | 0 0| 0 0| 0 0| 0 0| 0 0 | 150 3
Dooly Prison
| 0 0| 52 2| 72 3| 6 1| 130 2 | 0 0| 0 0| 0 0| 0 0| 0 0 | 130 2
Macon Prison
| 24 13| 274 9| 98 5| 25 6| 421 7 | 0 0| 0 0| 0 0| 0 0| 0 0 | 421 7
Smith Prison
| 17 9| 197 6| 77 4| 10 2| 301 5 | 0 0| 0 0| 0 0| 0 0| 0 0 | 301 5
Homerville Prison | 0 0| 1 0| 3 0| 0 0| 4 0 | 0 0| 0 0| 0 0| 0 0| 0 0 | 4 0
Washingtn Women Pris| 0 0| 0 0| 0 0| 0 0| 0 0 | 2 22| 36 29| 26 31| 8 32| 72 30 | 72 1
Baldwin Prison
| 2 1| 15 0| 24 1| 3 1| 44 1 | 0 0| 0 0| 0 0| 0 0| 0 0 | 44 1
Metro Womens Prison | 0 0| 0 0| 0 0| 0 0| 0 0 | 3 33| 23 18| 26 31| 8 32| 60 25 | 60 1
Pulaski Womens Pris | 0 0| 0 0| 0 0| 0 0| 0 0 | 4 44| 65 52| 31 37| 8 32| 108 44 | 108 2
Pelham PreTrans Unit| 0 0| 8 0| 5 0| 0 0| 13 0 | 0 0| 0 0| 0 0| 0 0| 0 0 | 13 0
Milan Prison
| 0 0| 0 0| 1 0| 0 0| 1 0 | 0 0| 0 0| 0 0| 0 0| 0 0 | 1 0
West Central Prison | 0 0| 3 0| 1 0| 0 0| 4 0 | 0 0| 0 0| 0 0| 0 0| 0 0 | 4 0
D Ray James Prison | 0 0| 36 1| 24 1| 3 1| 63 1 | 0 0| 0 0| 0 0| 0 0| 0 0 | 63 1
Coffee Corr Facility| 0 0| 30 1| 20 1| 4 1| 54 1 | 0 0| 0 0| 0 0| 0 0| 0 0 | 54 1
Wheeler Corr Facilty| 0 0| 33 1| 24 1| 3 1| 60 1 | 0 0| 0 0| 0 0| 0 0| 0 0 | 60 1
------------------------------------------------------------------------------------------------------------------------------------
Total reported
| 189 100| 3033 100| 2063 100| 407 100| 5692 100 | 9 100| 126 100| 83 100| 25 100| 243 100 | 5935 100
|
|
|
|
|
|
|
|
|
|
|
Percent reported | 100.0| 100.0| 100.0| 100.0| 100.0 | 100.0| 100.0| 100.0| 100.0| 100.0 | 100.0
|
|
|
|
|
|
|
|
|
|
|
|
|
|
|
|
|
|
|
|
|
|
Not Reported
|0|0|0|0|0
|0|0|0|0|0
|0
------------------------------------------------------------------------------------------------------------------------------------
Total
| 189 | 3033 | 2063 | 407 | 5692
| 9 | 126 | 83 | 25 | 243
| 5935
Page 43 Run 10/24/00
Georgia Department of Corrections Office of Planning and Analysis
Inmate statistical profile
Sample: ACTIVE PRISONERS SERVING LIFE EXCLUDING JAIL
Requestor: Statistics
Active inmates 10/24/2000
Misdemeanors And Felonies by current age & sex
|
MEN
|
WOMEN
|
| Age | Age | Age | Age | Men
| Age | Age | Age | Age |Women
|Grand
Crime Type
|00-21 %|22-39 %|40-54 %|55-99 %|Total % |00-21 %|22-39 %|40-54 %|55-99 %|Total % |Total %
------------------------------------------------------------------------------------------------------------------------------------
MISDEMEANOR
| 0 0| 0 0| 0 0| 0 0| 0 0 | 0 0| 0 0| 0 0| 0 0| 0 0 | 0 0
FELONY
| 189 100| 3033 100| 2063 100| 407 100| 5692 100 | 9 100| 126 100| 83 100| 25 100| 243 100 | 5935 100
------------------------------------------------------------------------------------------------------------------------------------
Total reported
| 189 100| 3033 100| 2063 100| 407 100| 5692 100 | 9 100| 126 100| 83 100| 25 100| 243 100 | 5935 100
|
|
|
|
|
|
|
|
|
|
|
Percent reported | 100.0| 100.0| 100.0| 100.0| 100.0 | 100.0| 100.0| 100.0| 100.0| 100.0 | 100.0
|
|
|
|
|
|
|
|
|
|
|
|
|
|
|
|
|
|
|
|
|
|
NOT REPORTED
|0|0|0|0|0
|0|0|0|0|0
|0
------------------------------------------------------------------------------------------------------------------------------------
Total
| 189 | 3033 | 2063 | 407 | 5692
| 9 | 126 | 83 | 25 | 243
| 5935
Page 44 Run 10/24/00
Georgia Department of Corrections Office of Planning and Analysis
Inmate statistical profile
Sample: ACTIVE PRISONERS SERVING LIFE EXCLUDING JAIL
Requestor: Statistics
Active inmates 10/24/2000
Crimes By Group by current age & sex
|
MEN
|
WOMEN
|
| Age | Age | Age | Age | Men
| Age | Age | Age | Age |Women
|Grand
Crimes By Group
|00-21 %|22-39 %|40-54 %|55-99 %|Total % |00-21 %|22-39 %|40-54 %|55-99 %|Total % |Total %
------------------------------------------------------------------------------------------------------------------------------------
HOMICIDE
| 141 75| 1880 62| 1219 59| 304 75| 3544 62 | 9 100| 110 87| 66 80| 25 100| 210 86 | 3754 63
ABORTION
| 0 0| 0 0| 0 0| 0 0| 0 0 | 0 0| 0 0| 0 0| 0 0| 0 0 | 0 0
BODILY INJRY&REL OFF| 15 8| 181 6| 99 5| 5 1| 300 5 | 0 0| 2 2| 5 6| 0 0| 7 3 | 307 5
ARSON & REL OFF
| 0 0| 1 0| 0 0| 0 0| 1 0 | 0 0| 0 0| 0 0| 0 0| 0 0 | 1 0
DAMAGE OF PROPERTY | 0 0| 1 0| 0 0| 0 0| 1 0 | 0 0| 0 0| 0 0| 0 0| 0 0 | 1 0
BURGLARY & REL OFF | 0 0| 19 1| 7 0| 0 0| 26 0 | 0 0| 0 0| 1 1| 0 0| 1 0 | 27 0
FORGERY & REL OFF | 0 0| 6 0| 4 0| 1 0| 11 0 | 0 0| 0 0| 0 0| 0 0| 0 0 | 11 0
THEFT
| 0 0| 7 0| 5 0| 0 0| 12 0 | 0 0| 0 0| 0 0| 0 0| 0 0 | 12 0
ROBBERY
| 22 12| 353 12| 238 12| 29 7| 642 11 | 0 0| 2 2| 1 1| 0 0| 3 1 | 645 11
SEXUAL OFFENSES
| 10 5| 340 11| 346 17| 55 14| 751 13 | 0 0| 0 0| 2 2| 0 0| 2 1 | 753 13
OBSCENITY CRIMES | 0 0| 0 0| 0 0| 0 0| 0 0 | 0 0| 0 0| 0 0| 0 0| 0 0 | 0 0
TREASON & REL OFF | 0 0| 0 0| 0 0| 0 0| 0 0 | 0 0| 0 0| 0 0| 0 0| 0 0 | 0 0
CRIMES INVOLVNG GOVT| 0 0| 7 0| 5 0| 1 0| 13 0 | 0 0| 0 0| 0 0| 0 0| 0 0 | 13 0
FALSIFICATIONS
| 0 0| 0 0| 0 0| 0 0| 0 0 | 0 0| 0 0| 0 0| 0 0| 0 0 | 0 0
OBSTRUCT LAW ENFORCE| 0 0| 1 0| 1 0| 0 0| 2 0 | 0 0| 0 0| 0 0| 0 0| 0 0 | 2 0
DISORDERLY CONDUCT | 0 0| 0 0| 0 0| 0 0| 0 0 | 0 0| 0 0| 0 0| 0 0| 0 0 | 0 0
GAMBLING & REL OFF | 0 0| 0 0| 0 0| 0 0| 0 0 | 0 0| 0 0| 0 0| 0 0| 0 0 | 0 0
CRUELTY TO CHILDREN | 0 0| 0 0| 0 0| 0 0| 0 0 | 0 0| 0 0| 0 0| 0 0| 0 0 | 0 0
CRIMES WITH GUNS | 0 0| 0 0| 1 0| 0 0| 1 0 | 0 0| 0 0| 0 0| 0 0| 0 0 | 1 0
INVASION PRIVACY | 0 0| 0 0| 0 0| 0 0| 0 0 | 0 0| 0 0| 0 0| 0 0| 0 0 | 0 0
RACKETEERING
| 0 0| 0 0| 0 0| 0 0| 0 0 | 0 0| 0 0| 0 0| 0 0| 0 0 | 0 0
DRUG ABUSE OFFENSES | 1 1| 217 7| 130 6| 10 2| 358 6 | 0 0| 12 10| 8 10| 0 0| 20 8 | 378 6
DRUG TRAFFICKING | 0 0| 18 1| 8 0| 1 0| 27 0 | 0 0| 0 0| 0 0| 0 0| 0 0 | 27 0
AUTO CRIMES
| 0 0| 0 0| 0 0| 0 0| 0 0 | 0 0| 0 0| 0 0| 0 0| 0 0 | 0 0
REVENUE & CONTRABAND| 0 0| 0 0| 0 0| 0 0| 0 0 | 0 0| 0 0| 0 0| 0 0| 0 0 | 0 0
CRIMES OF OTH STATES| 0 0| 0 0| 0 0| 0 0| 0 0 | 0 0| 0 0| 0 0| 0 0| 0 0 | 0 0
MISC. FELONIES
| 0 0| 1 0| 0 0| 1 0| 2 0 | 0 0| 0 0| 0 0| 0 0| 0 0 | 2 0
MISDEMEANORS
| 0 0| 0 0| 0 0| 0 0| 0 0 | 0 0| 0 0| 0 0| 0 0| 0 0 | 0 0
------------------------------------------------------------------------------------------------------------------------------------
Total reported
| 189 100| 3032 100| 2063 100| 407 100| 5691 100 | 9 100| 126 100| 83 100| 25 100| 243 100 | 5934 100
|
|
|
|
|
|
|
|
|
|
|
Percent reported | 100.0| 100.0| 100.0| 100.0| 100.0 | 100.0| 100.0| 100.0| 100.0| 100.0 | 100.0
|
|
|
|
|
|
|
|
|
|
|
|
|
|
|
|
|
|
|
|
|
|
NOT REPORTED
|0|1|0|0|1
|0|0|0|0|0
|1
------------------------------------------------------------------------------------------------------------------------------------
Total
| 189 | 3033 | 2063 | 407 | 5692
| 9 | 126 | 83 | 25 | 243
| 5935
Page 45 Run 10/24/00
Georgia Department of Corrections Office of Planning and Analysis
Inmate statistical profile
Sample: ACTIVE PRISONERS SERVING LIFE EXCLUDING JAIL
Requestor: Statistics
Active inmates 10/24/2000
Most Serious Offense by current age & sex
|
MEN
|
WOMEN
|
| Age | Age | Age | Age | Men
| Age | Age | Age | Age |Women
|Grand
Most Serious Offense|00-21 %|22-39 %|40-54 %|55-99 %|Total % |00-21 %|22-39 %|40-54 %|55-99 %|Total % |Total %
------------------------------------------------------------------------------------------------------------------------------------
Misdemeanors
|
|
|
------------------------------------------------------------------------------------------------------------------------------------
------------------------------------------------------------------------------------------------------------------------------------
------------------------------------------------------------------------------------------------------------------------------------
FELONIES
|
|
|
------------------------------------------------------------------------------------------------------------------------------------
------------------------------------------------------------------------------------------------------------------------------------
MISC. HOMICIDE OFFEN| 0 0| 1 0| 0 0| 0 0| 1 0 | 0 0| 0 0| 0 0| 0 0| 0 0 | 1 0
MURDER
| 141 75| 1879 62| 1219 59| 303 74| 3542 62 | 9 100| 110 87| 66 80| 25 100| 210 86 | 3752 63
VOLUNTARY MANSLAUGHT| 0 0| 1 0| 0 0| 1 0| 2 0 | 0 0| 0 0| 0 0| 0 0| 0 0 | 2 0
AGGRAVATED ASSAULT | 0 0| 7 0| 1 0| 0 0| 8 0 | 0 0| 0 0| 0 0| 0 0| 0 0 | 8 0
AGGRAVATED BATTERY | 0 0| 1 0| 0 0| 0 0| 1 0 | 0 0| 0 0| 0 0| 0 0| 0 0 | 1 0
KIDNAPPING
| 15 8| 173 6| 96 5| 5 1| 289 5 | 0 0| 2 2| 5 6| 0 0| 7 3 | 296 5
AGG ASSLT ON POLICE | 0 0| 0 0| 2 0| 0 0| 2 0 | 0 0| 0 0| 0 0| 0 0| 0 0 | 2 0
SECOND DEGREE ARSON | 0 0| 1 0| 0 0| 0 0| 1 0 | 0 0| 0 0| 0 0| 0 0| 0 0 | 1 0
CRIM. DAMAGE 2ND DEG| 0 0| 1 0| 0 0| 0 0| 1 0 | 0 0| 0 0| 0 0| 0 0| 0 0 | 1 0
BURGLARY
| 0 0| 19 1| 7 0| 0 0| 26 0 | 0 0| 0 0| 1 1| 0 0| 1 0 | 27 0
FORGERY 1ST DEGREE | 0 0| 6 0| 4 0| 1 0| 11 0 | 0 0| 0 0| 0 0| 0 0| 0 0 | 11 0
THEFT BY TAKING
| 0 0| 2 0| 3 0| 0 0| 5 0 | 0 0| 0 0| 0 0| 0 0| 0 0 | 5 0
THEFT BY REC STOLEN | 0 0| 3 0| 1 0| 0 0| 4 0 | 0 0| 0 0| 0 0| 0 0| 0 0 | 4 0
THEFT BY CONVERSION | 0 0| 1 0| 1 0| 0 0| 2 0 | 0 0| 0 0| 0 0| 0 0| 0 0 | 2 0
THEFT OF MOTOR VEH, | 0 0| 1 0| 0 0| 0 0| 1 0 | 0 0| 0 0| 0 0| 0 0| 0 0 | 1 0
ROBBERY
| 0 0| 5 0| 6 0| 4 1| 15 0 | 0 0| 0 0| 0 0| 0 0| 0 0 | 15 0
ARMED ROBBERY
| 22 12| 348 11| 232 11| 25 6| 627 11 | 0 0| 2 2| 1 1| 0 0| 3 1 | 630 11
MISC. SEXUAL
| 0 0| 1 0| 0 0| 0 0| 1 0 | 0 0| 0 0| 0 0| 0 0| 0 0 | 1 0
RAPE
| 10 5| 318 10| 312 15| 43 11| 683 12 | 0 0| 0 0| 2 2| 0 0| 2 1 | 685 12
AGGRAVATED SODOMY | 0 0| 16 1| 21 1| 9 2| 46 1 | 0 0| 0 0| 0 0| 0 0| 0 0 | 46 1
CHILD MOLESTATION | 0 0| 1 0| 3 0| 1 0| 5 0 | 0 0| 0 0| 0 0| 0 0| 0 0 | 5 0
AGGRAV. CHILD MOLEST| 0 0| 4 0| 10 0| 2 0| 16 0 | 0 0| 0 0| 0 0| 0 0| 0 0 | 16 0
OBSTR OF LAW ENF OFF| 0 0| 7 0| 5 0| 1 0| 13 0 | 0 0| 0 0| 0 0| 0 0| 0 0 | 13 0
ESCAPE
| 0 0| 1 0| 1 0| 0 0| 2 0 | 0 0| 0 0| 0 0| 0 0| 0 0 | 2 0
POSS OF CERTAIN WEAP| 0 0| 0 0| 1 0| 0 0| 1 0 | 0 0| 0 0| 0 0| 0 0| 0 0 | 1 0
S/D NARCOTICS, OPIAT| 0 0| 11 0| 13 1| 1 0| 25 0 | 0 0| 1 1| 1 1| 0 0| 2 1 | 27 0
S/D DEP,STIM,CNTRF D| 0 0| 4 0| 2 0| 0 0| 6 0 | 0 0| 0 0| 0 0| 0 0| 0 0 | 6 0
SALE/DIST OF MARIJUA| 0 0| 6 0| 5 0| 1 0| 12 0 | 0 0| 0 0| 0 0| 0 0| 0 0 | 12 0
POSS NARCOTICS, OPIA| 0 0| 4 0| 3 0| 0 0| 7 0 | 0 0| 0 0| 0 0| 0 0| 0 0 | 7 0
------------------------------------------------------------------------------------------------------------------------------------
(continued)
Page 46 Run 10/24/00
Georgia Department of Corrections Office of Planning and Analysis
Inmate statistical profile
Sample: ACTIVE PRISONERS SERVING LIFE EXCLUDING JAIL
Requestor:
Active inmates 10/24/2000
Most Serious Offense by current age & sex
Statistics (CONTINUED)
|
MEN
|
WOMEN
|
| Age | Age | Age | Age | Men
| Age | Age | Age | Age |Women
|Grand
Most Serious Offense|00-21 %|22-39 %|40-54 %|55-99 %|Total % |00-21 %|22-39 %|40-54 %|55-99 %|Total % |Total %
------------------------------------------------------------------------------------------------------------------------------------
POSS DEP,STIM,CNTRF | 0 0| 0 0| 1 0| 0 0| 1 0 | 0 0| 0 0| 0 0| 0 0| 0 0 | 1 0
VIOLATE GA CNTRL SBS| 0 0| 14 0| 6 0| 0 0| 20 0 | 0 0| 1 1| 1 1| 0 0| 2 1 | 22 0
UNLWFL MFG/DEL/DIST | 0 0| 6 0| 1 0| 0 0| 7 0 | 0 0| 0 0| 0 0| 0 0| 0 0 | 7 0
SALE/DIST CONT SUB P| 0 0| 3 0| 1 0| 0 0| 4 0 | 0 0| 0 0| 0 0| 0 0| 0 0 | 4 0
SALE/DIST CONT SUB S| 0 0| 1 0| 0 0| 0 0| 1 0 | 0 0| 0 0| 0 0| 0 0| 0 0 | 1 0
SALE/DISTRIBUTION CO| 1 1| 143 5| 82 4| 6 1| 232 4 | 0 0| 10 8| 6 7| 0 0| 16 7 | 248 4
POSSESSION OF COCAIN| 0 0| 25 1| 16 1| 2 0| 43 1 | 0 0| 0 0| 0 0| 0 0| 0 0 | 43 1
COCAINE LESS 200 GRA| 0 0| 12 0| 7 0| 1 0| 20 0 | 0 0| 0 0| 0 0| 0 0| 0 0 | 20 0
COCAINE 401 OR MORE | 0 0| 5 0| 0 0| 0 0| 5 0 | 0 0| 0 0| 0 0| 0 0| 0 0 | 5 0
NARCOTICS LESS 14 GR| 0 0| 0 0| 1 0| 0 0| 1 0 | 0 0| 0 0| 0 0| 0 0| 0 0 | 1 0
ATT/CONSPRCY COMMT C| 0 0| 1 0| 0 0| 0 0| 1 0 | 0 0| 0 0| 0 0| 0 0| 0 0 | 1 0
CONSPIRACY
| 0 0| 1 0| 0 0| 0 0| 1 0 | 0 0| 0 0| 0 0| 0 0| 0 0 | 1 0
CRIMINAL ATTEMPT | 0 0| 0 0| 0 0| 1 0| 1 0 | 0 0| 0 0| 0 0| 0 0| 0 0 | 1 0
------------------------------------------------------------------------------------------------------------------------------------
Total reported
| 189 100| 3033 100| 2063 100| 407 100| 5692 100 | 9 100| 126 100| 83 100| 25 100| 243 100 | 5935 100
|
|
|
|
|
|
|
|
|
|
|
Percent reported | 100.0| 100.0| 100.0| 100.0| 100.0 | 100.0| 100.0| 100.0| 100.0| 100.0 | 100.0
|
|
|
|
|
|
|
|
|
|
|
|
|
|
|
|
|
|
|
|
|
|
NOT REPORTED
|0|0|0|0|0
|0|0|0|0|0
|0
------------------------------------------------------------------------------------------------------------------------------------
Total
| 189 | 3033 | 2063 | 407 | 5692
| 9 | 126 | 83 | 25 | 243
| 5935
Page 47 Run 10/24/00
Georgia Department of Corrections Office of Planning and Analysis
Inmate statistical profile
Sample: ACTIVE PRISONERS SERVING LIFE EXCLUDING JAIL
Requestor: Statistics
Active inmates 10/24/2000
Most Serious Crime Type by current age & sex
|
MEN
|
WOMEN
|
| Age | Age | Age | Age | Men
| Age | Age | Age | Age |Women
|Grand
Crime Type
|00-21 %|22-39 %|40-54 %|55-99 %|Total % |00-21 %|22-39 %|40-54 %|55-99 %|Total % |Total %
------------------------------------------------------------------------------------------------------------------------------------
VIOL/PERSN
| 178 94| 2415 80| 1556 75| 338 83| 4487 79 | 9 100| 114 90| 72 87| 25 100| 220 91 | 4707 79
NVIOL/PERS
| 0 0| 0 0| 0 0| 0 0| 0 0 | 0 0| 0 0| 0 0| 0 0| 0 0 | 0 0
PROPERTY
| 0 0| 34 1| 16 1| 1 0| 51 1 | 0 0| 0 0| 1 1| 0 0| 1 0 | 52 1
DRUG SALES
| 1 1| 192 6| 112 5| 9 2| 314 6 | 0 0| 11 9| 7 8| 0 0| 18 7 | 332 6
DRUG POSSN
| 0 0| 43 1| 26 1| 2 0| 71 1 | 0 0| 1 1| 1 1| 0 0| 2 1 | 73 1
ALCOHOL
| 0 0| 0 0| 0 0| 0 0| 0 0 | 0 0| 0 0| 0 0| 0 0| 0 0 | 0 0
HABIT/DUI
| 0 0| 0 0| 0 0| 0 0| 0 0 | 0 0| 0 0| 0 0| 0 0| 0 0 | 0 0
SEX OFFEND
| 10 5| 340 11| 346 17| 55 14| 751 13 | 0 0| 0 0| 2 2| 0 0| 2 1 | 753 13
OTHER
| 0 0| 9 0| 7 0| 2 0| 18 0 | 0 0| 0 0| 0 0| 0 0| 0 0 | 18 0
------------------------------------------------------------------------------------------------------------------------------------
Total reported
| 189 100| 3033 100| 2063 100| 407 100| 5692 100 | 9 100| 126 100| 83 100| 25 100| 243 100 | 5935 100
|
|
|
|
|
|
|
|
|
|
|
Percent reported | 100.0| 100.0| 100.0| 100.0| 100.0 | 100.0| 100.0| 100.0| 100.0| 100.0 | 100.0
|
|
|
|
|
|
|
|
|
|
|
|
|
|
|
|
|
|
|
|
|
|
NOT REPORTED
|0|0|0|0|0
|0|0|0|0|0
|0
------------------------------------------------------------------------------------------------------------------------------------
Total
| 189 | 3033 | 2063 | 407 | 5692
| 9 | 126 | 83 | 25 | 243
| 5935