- Collection:
- Georgia Government Publications
- Title:
- Inmate statistical profile: juveniles in adult prison system, Dec. 2001
- Creator:
- Georgia. Department of Corrections. Planning and Analysis Section
- Publisher:
- Atlanta, GA. : Georgia Dept. of Corrections, Office of Planning and Analysis, 2001-12
- Date of Original:
- 2001-12
- Subject:
- Prisoners--Georgia
- Location:
- United States, Georgia, 32.75042, -83.50018
- Medium:
- state government records
- Type:
- Text
- Format:
- application/pdf
- External Identifiers:
- Call Number GA R300.P5 P1 J8 2001/12
- Metadata URL:
- https://dlg.galileo.usg.edu/id:dlg_ggpd_i-ga-br300-pp5-bp1-bj8-b2001-s12-belec-p-btext
- Digital Object URL:
- https://dlg.galileo.usg.edu/do:dlg_ggpd_i-ga-br300-pp5-bp1-bj8-b2001-s12-belec-p-btext
- Language:
- eng
- Holding Institution:
- University of Georgia. Map and Government Information Library
- Rights:
-

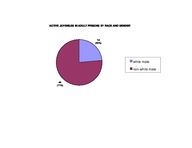
ACTIVE JUVENILES IN ADULT PRISONS BY RACE AND GENDER
14 (23%)
white male non-white male
44 (77%)
Active Juveniles in Adult Prisons by Security Status
4 (7%)
2 (3%)
12 (21%)
39 (67%)
medium
close
maximum
diagnostic
35
29
30
(50%)
25
20
15
10
5
0 10.1-12
ACTIVE JUVENILES IN ADULT PRISONS BY SENTENCE LENGTH
7 (12%)
12.1-15
5 (9%)
15.1-20
10 (17%)
20.1-Over
7 (12%)
Life
Active Juveniles in Adult Prison With Probation to Follow Prison
41 (71%)
17 (29%)
Probation to Follow No Probation
Active Juveniles in Adult Prisons by Crime Group
9 (16%)
6 (10%)
6 (10%)
37 (64%)
homicide
bodily injury &rel off
robbery
sexual offense
Active Juveniles in Adult Prison By Crime Type
9 (16%)
viol/persn
49 (84%)
sex offend
Georgia Department of Corrections
Page 1 Run 12/21/01
Office of Planning and Analysis
Inmate statistical profile TABLE OF CONTENTS FOR ACTIVE JUVENILE PRISONERS EXCLUDING JAILS
Title
PAGE
-----
----
RACE AND SEX............................ 2
Culture Fair IQ Scores.................. 3
Self-Rpt Socioeconomic Class............ 4
Self-Rpt Environment To Age 16.......... 5
Self-Rpt Education Level................ 6
Functional Reading Level (WRAT Scores).. 7
Functional Math Level (WRAT Scores)..... 8
Functional Spelling Level (WRAT Scores). 9
Self-Rpt Guardian Status To Age 16......10
Self-Rpt Employment Status Before Prison11
Self-Rpt Marital Status At Admission....12
Self-Rpt Number Of Children At Admission13
Self-Rpt Religious Affiliation..........14
Self-Rpt Family Behavior Patterns *.....15
Inmate Diagnostic Behavior Problem *....16
Physical Profile (General Condition)....17
Security Status.........................18
Number Of Sentences.....................19
Number Of Disciplinaries................20
Number Of Escapes.......................21
Number Of Prior Georgia Incarcerations *22
Number Of Transfers.....................23
County Of Conviction....................24
Circ Of Conviction......................25
Home County.............................26
Prison Sentence In Years................27
Probation To Follow Prison..............28
Admission Type..........................29
Release Type............................30
Inst By Group...........................31
Institution.............................32
Misdemeanors And Felonies...............33
Crimes By Group.........................34
Most Serious Offense....................35
Most Serious Crime Type.................36
Georgia Department of Corrections
Page 2 Run 12/21/01
Office of Planning and Analysis
Inmate statistical profile
Sample: ACTIVE JUVENILE PRISONERS EXCLUDING JAILS
Requestor: Statistics
Active inmates 12/21/2001
RACE AND SEX by current age & sex
|
MEN
|
WOMEN
|
| Age | Age | Age | Age | Men
| Age | Age | Age | Age |Women
|Grand
RACE AND SEX
|13-14 %|15-15 %|16-16 %|17-17 %|Total % |13-14 %|15-15 %|16-16 %|17-17 %|Total % |Total %
------------------------------------------------------------------------------------------------------------------------------------
WHITE MALE
| 0 0| 2 67| 2 12| 10 26| 14 24 | 0 0| 0 0| 0 0| 0 0| 0 0 | 14 24
NON WHITE MALE
| 0 0| 1 33| 15 88| 28 74| 44 76 | 0 0| 0 0| 0 0| 0 0| 0 0 | 44 76
WHITE FEMALE
| 0 0| 0 0| 0 0| 0 0| 0 0 | 0 0| 0 0| 0 0| 0 0| 0 0 | 0 0
NON WHITE FEMALE | 0 0| 0 0| 0 0| 0 0| 0 0 | 0 0| 0 0| 0 0| 0 0| 0 0 | 0 0
------------------------------------------------------------------------------------------------------------------------------------
Total reported
| 0 0| 3 100| 17 100| 38 100| 58 100 | 0 0| 0 0| 0 0| 0 0| 0 0 | 58 100
|
|
|
|
|
|
|
|
|
|
|
Percent reported |
.0| 100.0| 100.0| 100.0| 100.0 |
.0|
.0|
.0|
.0|
.0 | 100.0
|
|
|
|
|
|
|
|
|
|
|
|
|
|
|
|
|
|
|
|
|
|
NOT REPORTED
|0|0|0|0|0
|0|0|0|0|0
|0
------------------------------------------------------------------------------------------------------------------------------------
Total
| 0 | 3 | 17 | 38 | 58
|0|0|0|0|0
| 58
|
|
|
|
|
|
|
|
|
|
|
|
|
|
|
|
|
|
|
|
|
|
|
|
|
|
|
|
|
|
|
|
|
|
|
|
|
|
|
|
|
|
|
|
|
|
|
|
|
|
|
|
|
|
|
AVERAGE AGE
| .00 | 15.00 | 16.00 | 17.00 | 16.60 | .00 | .00 | .00 | .00 | .00 | 16.60
Page 3 Run 12/21/01
Georgia Department of Corrections Office of Planning and Analysis
Inmate statistical profile
Sample: ACTIVE JUVENILE PRISONERS EXCLUDING JAILS
Requestor: Statistics
Active inmates 12/21/2001
Culture Fair IQ Scores by current age & sex
|
MEN
|
WOMEN
|
| Age | Age | Age | Age | Men
| Age | Age | Age | Age |Women
|Grand
IQ Score
|13-14 %|15-15 %|16-16 %|17-17 %|Total % |13-14 %|15-15 %|16-16 %|17-17 %|Total % |Total %
------------------------------------------------------------------------------------------------------------------------------------
LESS THAN 70
| 0 0| 0 0| 0 0| 1 3| 1 2 | 0 0| 0 0| 0 0| 0 0| 0 0 | 1 2
70 AND UP
| 0 0| 2 100| 17 100| 37 97| 56 98 | 0 0| 0 0| 0 0| 0 0| 0 0 | 56 98
------------------------------------------------------------------------------------------------------------------------------------
Total reported
| 0 0| 2 100| 17 100| 38 100| 57 100 | 0 0| 0 0| 0 0| 0 0| 0 0 | 57 100
|
|
|
|
|
|
|
|
|
|
|
Percent reported |
.0|
66.7| 100.0| 100.0|
98.3 |
.0|
.0|
.0|
.0|
.0 |
98.3
|
|
|
|
|
|
|
|
|
|
|
|
|
|
|
|
|
|
|
|
|
|
NOT REPORTED
|0|1|0|0|1
|0|0|0|0|0
|1
------------------------------------------------------------------------------------------------------------------------------------
Total
| 0 | 3 | 17 | 38 | 58
|0|0|0|0|0
| 58
|
|
|
|
|
|
|
|
|
|
|
|
|
|
|
|
|
|
|
|
|
|
|
|
|
|
|
|
|
|
|
|
|
|
|
|
|
|
|
|
|
|
|
|
|
|
|
|
|
|
|
|
|
|
|
AVERAGE IQ
| .00 | 90.50 | 93.29 | 93.26 | 93.18 | .00 | .00 | .00 | .00 | .00 | 93.18
Page 4 Run 12/21/01
Georgia Department of Corrections Office of Planning and Analysis
Inmate statistical profile
Sample: ACTIVE JUVENILE PRISONERS EXCLUDING JAILS
Requestor: Statistics
Active inmates 12/21/2001
Self-Rpt Socioeconomic Class by current age & sex
|
MEN
|
WOMEN
|
| Age | Age | Age | Age | Men
| Age | Age | Age | Age |Women
|Grand
Socioeconomic Class |13-14 %|15-15 %|16-16 %|17-17 %|Total % |13-14 %|15-15 %|16-16 %|17-17 %|Total % |Total %
------------------------------------------------------------------------------------------------------------------------------------
WELFARE
| 0 0| 0 0| 3 18| 5 14| 8 14 | 0 0| 0 0| 0 0| 0 0| 0 0 | 8 14
OCC EMPLOY
| 0 0| 0 0| 0 0| 0 0| 0 0 | 0 0| 0 0| 0 0| 0 0| 0 0 | 0 0
MINIMUM STD
| 0 0| 1 50| 7 41| 9 24| 17 30 | 0 0| 0 0| 0 0| 0 0| 0 0 | 17 30
MIDDLE
| 0 0| 1 50| 7 41| 22 59| 30 54 | 0 0| 0 0| 0 0| 0 0| 0 0 | 30 54
OTHER
| 0 0| 0 0| 0 0| 1 3| 1 2 | 0 0| 0 0| 0 0| 0 0| 0 0 | 1 2
------------------------------------------------------------------------------------------------------------------------------------
Total reported
| 0 0| 2 100| 17 100| 37 100| 56 100 | 0 0| 0 0| 0 0| 0 0| 0 0 | 56 100
|
|
|
|
|
|
|
|
|
|
|
Percent reported |
.0|
66.7| 100.0|
97.4|
96.6 |
.0|
.0|
.0|
.0|
.0 |
96.6
|
|
|
|
|
|
|
|
|
|
|
|
|
|
|
|
|
|
|
|
|
|
NOT RPTD
|0|1|0|1|2
|0|0|0|0|0
|2
------------------------------------------------------------------------------------------------------------------------------------
Total
| 0 | 3 | 17 | 38 | 58
|0|0|0|0|0
| 58
Page 5 Run 12/21/01
Georgia Department of Corrections Office of Planning and Analysis
Inmate statistical profile
Sample: ACTIVE JUVENILE PRISONERS EXCLUDING JAILS
Requestor: Statistics
Active inmates 12/21/2001
Self-Rpt Environment To Age 16 by current age & sex
|
MEN
|
WOMEN
|
| Age | Age | Age | Age | Men
| Age | Age | Age | Age |Women
|Grand
Environment
|13-14 %|15-15 %|16-16 %|17-17 %|Total % |13-14 %|15-15 %|16-16 %|17-17 %|Total % |Total %
------------------------------------------------------------------------------------------------------------------------------------
RURAL/FARM
| 0 0| 0 0| 1 6| 0 0| 1 2 | 0 0| 0 0| 0 0| 0 0| 0 0 | 1 2
RURAL/NFARM
| 0 0| 0 0| 0 0| 2 5| 2 4 | 0 0| 0 0| 0 0| 0 0| 0 0 | 2 4
S.M.S.A
| 0 0| 1 50| 5 29| 16 42| 22 39 | 0 0| 0 0| 0 0| 0 0| 0 0 | 22 39
URBAN
| 0 0| 0 0| 5 29| 8 21| 13 23 | 0 0| 0 0| 0 0| 0 0| 0 0 | 13 23
SMALL TOWN
| 0 0| 1 50| 6 35| 12 32| 19 33 | 0 0| 0 0| 0 0| 0 0| 0 0 | 19 33
OTHER
| 0 0| 0 0| 0 0| 0 0| 0 0 | 0 0| 0 0| 0 0| 0 0| 0 0 | 0 0
------------------------------------------------------------------------------------------------------------------------------------
Total reported
| 0 0| 2 100| 17 100| 38 100| 57 100 | 0 0| 0 0| 0 0| 0 0| 0 0 | 57 100
|
|
|
|
|
|
|
|
|
|
|
Percent reported |
.0|
66.7| 100.0| 100.0|
98.3 |
.0|
.0|
.0|
.0|
.0 |
98.3
|
|
|
|
|
|
|
|
|
|
|
|
|
|
|
|
|
|
|
|
|
|
NOT RPTD
|0|1|0|0|1
|0|0|0|0|0
|1
------------------------------------------------------------------------------------------------------------------------------------
Total
| 0 | 3 | 17 | 38 | 58
|0|0|0|0|0
| 58
Page 6 Run 12/21/01
Georgia Department of Corrections Office of Planning and Analysis
Inmate statistical profile
Sample: ACTIVE JUVENILE PRISONERS EXCLUDING JAILS
Requestor: Statistics
Active inmates 12/21/2001
Self-Rpt Education Level by current age & sex
|
MEN
|
WOMEN
|
| Age | Age | Age | Age | Men
| Age | Age | Age | Age |Women
|Grand
Education Level
|13-14 %|15-15 %|16-16 %|17-17 %|Total % |13-14 %|15-15 %|16-16 %|17-17 %|Total % |Total %
------------------------------------------------------------------------------------------------------------------------------------
LESS THAN GRADE 7 | 0 0| 0 0| 0 0| 1 3| 1 2 | 0 0| 0 0| 0 0| 0 0| 0 0 | 1 2
GRADE 7
| 0 0| 1 50| 2 13| 0 0| 3 5 | 0 0| 0 0| 0 0| 0 0| 0 0 | 3 5
GRADE 8
| 0 0| 1 50| 4 27| 14 37| 19 35 | 0 0| 0 0| 0 0| 0 0| 0 0 | 19 35
GRADE 9
| 0 0| 0 0| 5 33| 16 42| 21 38 | 0 0| 0 0| 0 0| 0 0| 0 0 | 21 38
GRADE 10
| 0 0| 0 0| 3 20| 7 18| 10 18 | 0 0| 0 0| 0 0| 0 0| 0 0 | 10 18
GRADE 11
| 0 0| 0 0| 0 0| 0 0| 0 0 | 0 0| 0 0| 0 0| 0 0| 0 0 | 0 0
GRADE 12
| 0 0| 0 0| 1 7| 0 0| 1 2 | 0 0| 0 0| 0 0| 0 0| 0 0 | 1 2
MORE THAN GRADE 12 | 0 0| 0 0| 0 0| 0 0| 0 0 | 0 0| 0 0| 0 0| 0 0| 0 0 | 0 0
------------------------------------------------------------------------------------------------------------------------------------
Total reported
| 0 0| 2 100| 15 100| 38 100| 55 100 | 0 0| 0 0| 0 0| 0 0| 0 0 | 55 100
|
|
|
|
|
|
|
|
|
|
|
Percent reported |
.0|
66.7|
88.2| 100.0|
94.8 |
.0|
.0|
.0|
.0|
.0 |
94.8
|
|
|
|
|
|
|
|
|
|
|
|
|
|
|
|
|
|
|
|
|
|
NOT REPORTED
|0|1|2|0|3
|0|0|0|0|0
|3
------------------------------------------------------------------------------------------------------------------------------------
Total
| 0 | 3 | 17 | 38 | 58
|0|0|0|0|0
| 58
|
|
|
|
|
|
|
|
|
|
|
|
|
|
|
|
|
|
|
|
|
|
|
|
|
|
|
|
|
|
|
|
|
|
|
|
|
|
|
|
|
|
|
|
|
|
|
|
|
|
|
|
|
|
|
AVG EDUCATION LEVEL | .00 | 7.50 | 8.87 | 8.74 | 8.73 | .00 | .00 | .00 | .00 | .00 | 8.73
* NOTE: THE FIELD LABLED "LESS THAN GRADE 7" WAS CORRECTED IN MARCH 1989: MISSING DATA FOR INMATES STILL IN DIAGNOSTICS NOW HAS BEEN REMOVED FROM THIS FIELD AND IDENTIFIED AS "NOT REPORTED" INFORMATION.
Page 7 Run 12/21/01
Georgia Department of Corrections Office of Planning and Analysis
Inmate statistical profile
Sample: ACTIVE JUVENILE PRISONERS EXCLUDING JAILS
Requestor: Statistics
Active inmates 12/21/2001
Functional Reading Level (WRAT Scores) by current age & sex
|
MEN
|
WOMEN
|
| Age | Age | Age | Age | Men
| Age | Age | Age | Age |Women
|Grand
WRAT Reading Score |13-14 %|15-15 %|16-16 %|17-17 %|Total % |13-14 %|15-15 %|16-16 %|17-17 %|Total % |Total %
------------------------------------------------------------------------------------------------------------------------------------
LESS THAN GRADE 6 | 0 0| 1 50| 7 41| 18 47| 26 46 | 0 0| 0 0| 0 0| 0 0| 0 0 | 26 46
6TH THRU 8TH GRADE | 0 0| 0 0| 7 41| 3 8| 10 18 | 0 0| 0 0| 0 0| 0 0| 0 0 | 10 18
GRADE 9
| 0 0| 0 0| 1 6| 2 5| 3 5 | 0 0| 0 0| 0 0| 0 0| 0 0 | 3 5
GRADE 10
| 0 0| 0 0| 0 0| 1 3| 1 2 | 0 0| 0 0| 0 0| 0 0| 0 0 | 1 2
GRADE 11
| 0 0| 1 50| 1 6| 1 3| 3 5 | 0 0| 0 0| 0 0| 0 0| 0 0 | 3 5
GRADE 12
| 0 0| 0 0| 1 6| 13 34| 14 25 | 0 0| 0 0| 0 0| 0 0| 0 0 | 14 25
MORE THAN GRADE 12 | 0 0| 0 0| 0 0| 0 0| 0 0 | 0 0| 0 0| 0 0| 0 0| 0 0 | 0 0
------------------------------------------------------------------------------------------------------------------------------------
Total reported
| 0 0| 2 100| 17 100| 38 100| 57 100 | 0 0| 0 0| 0 0| 0 0| 0 0 | 57 100
|
|
|
|
|
|
|
|
|
|
|
Percent reported |
.0|
66.7| 100.0| 100.0|
98.3 |
.0|
.0|
.0|
.0|
.0 |
98.3
|
|
|
|
|
|
|
|
|
|
|
|
|
|
|
|
|
|
|
|
|
|
NOT REPORTED
|0|1|0|0|1
|0|0|0|0|0
|1
------------------------------------------------------------------------------------------------------------------------------------
Total
| 0 | 3 | 17 | 38 | 58
|0|0|0|0|0
| 58
|
|
|
|
|
|
|
|
|
|
|
|
|
|
|
|
|
|
|
|
|
|
|
|
|
|
|
|
|
|
|
|
|
|
|
|
|
|
|
|
|
|
|
|
|
|
|
|
|
|
|
|
|
|
|
AVG READING SCORE | .00 | 7.15 | 6.38 | 8.06 | 7.52 | .00 | .00 | .00 | .00 | .00 | 7.52
Page 8 Run 12/21/01
Georgia Department of Corrections Office of Planning and Analysis
Inmate statistical profile
Sample: ACTIVE JUVENILE PRISONERS EXCLUDING JAILS
Requestor: Statistics
Active inmates 12/21/2001
Functional Math Level (WRAT Scores) by current age & sex
|
MEN
|
WOMEN
|
| Age | Age | Age | Age | Men
| Age | Age | Age | Age |Women
|Grand
WRAT Math Score
|13-14 %|15-15 %|16-16 %|17-17 %|Total % |13-14 %|15-15 %|16-16 %|17-17 %|Total % |Total %
------------------------------------------------------------------------------------------------------------------------------------
LESS THAN GRADE 6 | 0 0| 2 100| 7 41| 13 34| 22 39 | 0 0| 0 0| 0 0| 0 0| 0 0 | 22 39
6TH THRU 8TH GRADE | 0 0| 0 0| 6 35| 19 50| 25 44 | 0 0| 0 0| 0 0| 0 0| 0 0 | 25 44
GRADE 9
| 0 0| 0 0| 4 24| 2 5| 6 11 | 0 0| 0 0| 0 0| 0 0| 0 0 | 6 11
GRADE 10
| 0 0| 0 0| 0 0| 1 3| 1 2 | 0 0| 0 0| 0 0| 0 0| 0 0 | 1 2
GRADE 11
| 0 0| 0 0| 0 0| 0 0| 0 0 | 0 0| 0 0| 0 0| 0 0| 0 0 | 0 0
GRADE 12
| 0 0| 0 0| 0 0| 3 8| 3 5 | 0 0| 0 0| 0 0| 0 0| 0 0 | 3 5
MORE THAN GRADE 12 | 0 0| 0 0| 0 0| 0 0| 0 0 | 0 0| 0 0| 0 0| 0 0| 0 0 | 0 0
------------------------------------------------------------------------------------------------------------------------------------
Total reported
| 0 0| 2 100| 17 100| 38 100| 57 100 | 0 0| 0 0| 0 0| 0 0| 0 0 | 57 100
|
|
|
|
|
|
|
|
|
|
|
Percent reported |
.0|
66.7| 100.0| 100.0|
98.3 |
.0|
.0|
.0|
.0|
.0 |
98.3
|
|
|
|
|
|
|
|
|
|
|
|
|
|
|
|
|
|
|
|
|
|
NOT REPORTED
|0|1|0|0|1
|0|0|0|0|0
|1
------------------------------------------------------------------------------------------------------------------------------------
Total
| 0 | 3 | 17 | 38 | 58
|0|0|0|0|0
| 58
|
|
|
|
|
|
|
|
|
|
|
|
|
|
|
|
|
|
|
|
|
|
|
|
|
|
|
|
|
|
|
|
|
|
|
|
|
|
|
|
|
|
|
|
|
|
|
|
|
|
|
|
|
|
|
AVG MATH SCORE
| .00 | 4.35 | 6.44 | 6.94 | 6.70 | .00 | .00 | .00 | .00 | .00 | 6.70
Page 9 Run 12/21/01
Georgia Department of Corrections Office of Planning and Analysis
Inmate statistical profile
Sample: ACTIVE JUVENILE PRISONERS EXCLUDING JAILS
Requestor: Statistics
Active inmates 12/21/2001
Functional Spelling Level (WRAT Scores) by current age & sex
|
MEN
|
WOMEN
|
| Age | Age | Age | Age | Men
| Age | Age | Age | Age |Women
|Grand
WRAT Spelling Score |13-14 %|15-15 %|16-16 %|17-17 %|Total % |13-14 %|15-15 %|16-16 %|17-17 %|Total % |Total %
------------------------------------------------------------------------------------------------------------------------------------
LESS THAN GRADE 6 | 0 0| 2 100| 7 41| 19 50| 28 49 | 0 0| 0 0| 0 0| 0 0| 0 0 | 28 49
6TH THRU 8TH GRADE | 0 0| 0 0| 7 41| 11 29| 18 32 | 0 0| 0 0| 0 0| 0 0| 0 0 | 18 32
GRADE 9
| 0 0| 0 0| 2 12| 2 5| 4 7 | 0 0| 0 0| 0 0| 0 0| 0 0 | 4 7
GRADE 10
| 0 0| 0 0| 1 6| 2 5| 3 5 | 0 0| 0 0| 0 0| 0 0| 0 0 | 3 5
GRADE 11
| 0 0| 0 0| 0 0| 1 3| 1 2 | 0 0| 0 0| 0 0| 0 0| 0 0 | 1 2
GRADE 12
| 0 0| 0 0| 0 0| 3 8| 3 5 | 0 0| 0 0| 0 0| 0 0| 0 0 | 3 5
MORE THAN GRADE 12 | 0 0| 0 0| 0 0| 0 0| 0 0 | 0 0| 0 0| 0 0| 0 0| 0 0 | 0 0
------------------------------------------------------------------------------------------------------------------------------------
Total reported
| 0 0| 2 100| 17 100| 38 100| 57 100 | 0 0| 0 0| 0 0| 0 0| 0 0 | 57 100
|
|
|
|
|
|
|
|
|
|
|
Percent reported |
.0|
66.7| 100.0| 100.0|
98.3 |
.0|
.0|
.0|
.0|
.0 |
98.3
|
|
|
|
|
|
|
|
|
|
|
|
|
|
|
|
|
|
|
|
|
|
NOT REPORTED
|0|1|0|0|1
|0|0|0|0|0
|1
------------------------------------------------------------------------------------------------------------------------------------
Total
| 0 | 3 | 17 | 38 | 58
|0|0|0|0|0
| 58
|
|
|
|
|
|
|
|
|
|
|
|
|
|
|
|
|
|
|
|
|
|
|
|
|
|
|
|
|
|
|
|
|
|
|
|
|
|
|
|
|
|
|
|
|
|
|
|
|
|
|
|
|
|
|
AVG SPELLING SCORE | .00 | 1.75 | 5.96 | 6.36 | 6.08 | .00 | .00 | .00 | .00 | .00 | 6.08
Page 10 Run 12/21/01
Georgia Department of Corrections Office of Planning and Analysis
Inmate statistical profile
Sample: ACTIVE JUVENILE PRISONERS EXCLUDING JAILS
Requestor: Statistics
Active inmates 12/21/2001
Self-Rpt Guardian Status To Age 16 by current age & sex
|
MEN
|
WOMEN
|
| Age | Age | Age | Age | Men
| Age | Age | Age | Age |Women
|Grand
Guardian Status
|13-14 %|15-15 %|16-16 %|17-17 %|Total % |13-14 %|15-15 %|16-16 %|17-17 %|Total % |Total %
------------------------------------------------------------------------------------------------------------------------------------
ORPHANAGE
| 0 0| 0 0| 0 0| 0 0| 0 0 | 0 0| 0 0| 0 0| 0 0| 0 0 | 0 0
FATHER ONLY
| 0 0| 0 0| 0 0| 0 0| 0 0 | 0 0| 0 0| 0 0| 0 0| 0 0 | 0 0
FTR MTR HD
| 0 0| 1 50| 3 18| 5 13| 9 16 | 0 0| 0 0| 0 0| 0 0| 0 0 | 9 16
MOTHER ONLY
| 0 0| 0 0| 5 29| 20 53| 25 44 | 0 0| 0 0| 0 0| 0 0| 0 0 | 25 44
MTR FTR HD
| 0 0| 1 50| 5 29| 8 21| 14 25 | 0 0| 0 0| 0 0| 0 0| 0 0 | 14 25
OTH FEMALE
| 0 0| 0 0| 0 0| 0 0| 0 0 | 0 0| 0 0| 0 0| 0 0| 0 0 | 0 0
OTH MALE
| 0 0| 0 0| 0 0| 0 0| 0 0 | 0 0| 0 0| 0 0| 0 0| 0 0 | 0 0
STEP-PARNTS
| 0 0| 0 0| 1 6| 0 0| 1 2 | 0 0| 0 0| 0 0| 0 0| 0 0 | 1 2
FOSTER HOME
| 0 0| 0 0| 0 0| 0 0| 0 0 | 0 0| 0 0| 0 0| 0 0| 0 0 | 0 0
GRAND PRNTS
| 0 0| 0 0| 2 12| 5 13| 7 12 | 0 0| 0 0| 0 0| 0 0| 0 0 | 7 12
OTHER
| 0 0| 0 0| 1 6| 0 0| 1 2 | 0 0| 0 0| 0 0| 0 0| 0 0 | 1 2
------------------------------------------------------------------------------------------------------------------------------------
Total reported
| 0 0| 2 100| 17 100| 38 100| 57 100 | 0 0| 0 0| 0 0| 0 0| 0 0 | 57 100
|
|
|
|
|
|
|
|
|
|
|
Percent reported |
.0|
66.7| 100.0| 100.0|
98.3 |
.0|
.0|
.0|
.0|
.0 |
98.3
|
|
|
|
|
|
|
|
|
|
|
|
|
|
|
|
|
|
|
|
|
|
NOT RPTD
|0|1|0|0|1
|0|0|0|0|0
|1
------------------------------------------------------------------------------------------------------------------------------------
Total
| 0 | 3 | 17 | 38 | 58
|0|0|0|0|0
| 58
Page 11 Run 12/21/01
Georgia Department of Corrections Office of Planning and Analysis
Inmate statistical profile
Sample: ACTIVE JUVENILE PRISONERS EXCLUDING JAILS
Requestor: Statistics
Active inmates 12/21/2001
Self-Rpt Employment Status Before Prison by current age & sex
|
MEN
|
WOMEN
|
| Age | Age | Age | Age | Men
| Age | Age | Age | Age |Women
|Grand
Employment
|13-14 %|15-15 %|16-16 %|17-17 %|Total % |13-14 %|15-15 %|16-16 %|17-17 %|Total % |Total %
------------------------------------------------------------------------------------------------------------------------------------
FULL TIME
| 0 0| 0 0| 1 6| 1 3| 2 4 | 0 0| 0 0| 0 0| 0 0| 0 0 | 2 4
PART TIME
| 0 0| 0 0| 2 12| 6 16| 8 14 | 0 0| 0 0| 0 0| 0 0| 0 0 | 8 14
UNEMPL < 6M
| 0 0| 0 0| 0 0| 0 0| 0 0 | 0 0| 0 0| 0 0| 0 0| 0 0 | 0 0
UNEMPL > 6M
| 0 0| 0 0| 0 0| 0 0| 0 0 | 0 0| 0 0| 0 0| 0 0| 0 0 | 0 0
NEVER WORKD
| 0 0| 0 0| 8 47| 26 68| 34 60 | 0 0| 0 0| 0 0| 0 0| 0 0 | 34 60
STUDENT
| 0 0| 2 100| 6 35| 5 13| 13 23 | 0 0| 0 0| 0 0| 0 0| 0 0 | 13 23
INCAPABLE
| 0 0| 0 0| 0 0| 0 0| 0 0 | 0 0| 0 0| 0 0| 0 0| 0 0 | 0 0
OTHER
| 0 0| 0 0| 0 0| 0 0| 0 0 | 0 0| 0 0| 0 0| 0 0| 0 0 | 0 0
------------------------------------------------------------------------------------------------------------------------------------
Total reported
| 0 0| 2 100| 17 100| 38 100| 57 100 | 0 0| 0 0| 0 0| 0 0| 0 0 | 57 100
|
|
|
|
|
|
|
|
|
|
|
Percent reported |
.0|
66.7| 100.0| 100.0|
98.3 |
.0|
.0|
.0|
.0|
.0 |
98.3
|
|
|
|
|
|
|
|
|
|
|
|
|
|
|
|
|
|
|
|
|
|
NOT RPTD
|0|1|0|0|1
|0|0|0|0|0
|1
------------------------------------------------------------------------------------------------------------------------------------
Total
| 0 | 3 | 17 | 38 | 58
|0|0|0|0|0
| 58
* NOTE: THE FIELD LABELD "OTHER" WAS CORRECTED IN APRIL 1989; INMATES CODED "PRE-OTIS NOT REPORTED" NOW HAVE BEEN REMOVED FROM THIS FIELD AND IDENTIFIED AS "NOT REPORTED".
Page 12 Run 12/21/01
Georgia Department of Corrections Office of Planning and Analysis
Inmate statistical profile
Sample: ACTIVE JUVENILE PRISONERS EXCLUDING JAILS
Requestor: Statistics
Active inmates 12/21/2001
Self-Rpt Marital Status At Admission by current age & sex
|
MEN
|
WOMEN
|
| Age | Age | Age | Age | Men
| Age | Age | Age | Age |Women
|Grand
Marital Status
|13-14 %|15-15 %|16-16 %|17-17 %|Total % |13-14 %|15-15 %|16-16 %|17-17 %|Total % |Total %
------------------------------------------------------------------------------------------------------------------------------------
SINGLE
| 0 0| 2 100| 15 100| 37 100| 54 100 | 0 0| 0 0| 0 0| 0 0| 0 0 | 54 100
MARRIED
| 0 0| 0 0| 0 0| 0 0| 0 0 | 0 0| 0 0| 0 0| 0 0| 0 0 | 0 0
SEPARATED
| 0 0| 0 0| 0 0| 0 0| 0 0 | 0 0| 0 0| 0 0| 0 0| 0 0 | 0 0
DIVORCED
| 0 0| 0 0| 0 0| 0 0| 0 0 | 0 0| 0 0| 0 0| 0 0| 0 0 | 0 0
WIDOWED
| 0 0| 0 0| 0 0| 0 0| 0 0 | 0 0| 0 0| 0 0| 0 0| 0 0 | 0 0
COMMON LAW
| 0 0| 0 0| 0 0| 0 0| 0 0 | 0 0| 0 0| 0 0| 0 0| 0 0 | 0 0
OTHER
| 0 0| 0 0| 0 0| 0 0| 0 0 | 0 0| 0 0| 0 0| 0 0| 0 0 | 0 0
------------------------------------------------------------------------------------------------------------------------------------
Total reported
| 0 0| 2 100| 15 100| 37 100| 54 100 | 0 0| 0 0| 0 0| 0 0| 0 0 | 54 100
|
|
|
|
|
|
|
|
|
|
|
Percent reported |
.0|
66.7|
88.2|
97.4|
93.1 |
.0|
.0|
.0|
.0|
.0 |
93.1
|
|
|
|
|
|
|
|
|
|
|
|
|
|
|
|
|
|
|
|
|
|
NOT RPTD
|0|1|2|1|4
|0|0|0|0|0
|4
------------------------------------------------------------------------------------------------------------------------------------
Total
| 0 | 3 | 17 | 38 | 58
|0|0|0|0|0
| 58
Page 13 Run 12/21/01
Georgia Department of Corrections Office of Planning and Analysis
Inmate statistical profile
Sample: ACTIVE JUVENILE PRISONERS EXCLUDING JAILS
Requestor: Statistics
Active inmates 12/21/2001
Self-Rpt Number Of Children At Admission by current age & sex
|
MEN
|
WOMEN
|
| Age | Age | Age | Age | Men
| Age | Age | Age | Age |Women
|Grand
Number Of Children |13-14 %|15-15 %|16-16 %|17-17 %|Total % |13-14 %|15-15 %|16-16 %|17-17 %|Total % |Total %
------------------------------------------------------------------------------------------------------------------------------------
NO CHILDREN
| 0 0| 0 0| 0 0| 0 0| 0 0 | 0 0| 0 0| 0 0| 0 0| 0 0 | 0 0
ONE CHILD
| 0 0| 0 0| 1 100| 1 100| 2 100 | 0 0| 0 0| 0 0| 0 0| 0 0 | 2 100
TWO CHILDREN
| 0 0| 0 0| 0 0| 0 0| 0 0 | 0 0| 0 0| 0 0| 0 0| 0 0 | 0 0
THREE CHILDREN
| 0 0| 0 0| 0 0| 0 0| 0 0 | 0 0| 0 0| 0 0| 0 0| 0 0 | 0 0
FOUR CHILDREN
| 0 0| 0 0| 0 0| 0 0| 0 0 | 0 0| 0 0| 0 0| 0 0| 0 0 | 0 0
FIVE CHILDREN
| 0 0| 0 0| 0 0| 0 0| 0 0 | 0 0| 0 0| 0 0| 0 0| 0 0 | 0 0
MORE THAN 5 CHILDREN| 0 0| 0 0| 0 0| 0 0| 0 0 | 0 0| 0 0| 0 0| 0 0| 0 0 | 0 0
------------------------------------------------------------------------------------------------------------------------------------
Total reported
| 0 0| 0 0| 1 100| 1 100| 2 100 | 0 0| 0 0| 0 0| 0 0| 0 0 | 2 100
|
|
|
|
|
|
|
|
|
|
|
Percent reported |
.0|
.0|
5.9|
2.6|
3.4 |
.0|
.0|
.0|
.0|
.0 |
3.4
|
|
|
|
|
|
|
|
|
|
|
|
|
|
|
|
|
|
|
|
|
|
NOT REPORTED
| 0 | 3 | 16 | 37 | 56
|0|0|0|0|0
| 56
------------------------------------------------------------------------------------------------------------------------------------
Total
| 0 | 3 | 17 | 38 | 58
|0|0|0|0|0
| 58
|
|
|
|
|
|
|
|
|
|
|
|
|
|
|
|
|
|
|
|
|
|
|
|
|
|
|
|
|
|
|
|
|
|
|
|
|
|
|
|
|
|
|
|
|
|
|
|
|
|
|
|
|
|
|
AVG NUM CHILDREN | .00 | .00 | 1.00 | 1.00 | 1.00 | .00 | .00 | .00 | .00 | .00 | 1.00
* NOTE: THE FIELD LABLED "NO CHILDREN" WAS CORRECTED IN MARCH 1989: MISSING DATA FOR INMATES STILL IN DIAGNOSTICS NOW HAS BEEN REMOVED FROM THIS FIELD AND IDENTIFIED AS "NOT REPORTED" INFORMATION.
Page 14 Run 12/21/01
Georgia Department of Corrections Office of Planning and Analysis
Inmate statistical profile
Sample: ACTIVE JUVENILE PRISONERS EXCLUDING JAILS
Requestor: Statistics
Active inmates 12/21/2001
Self-Rpt Religious Affiliation by current age & sex
|
MEN
|
WOMEN
|
| Age | Age | Age | Age | Men
| Age | Age | Age | Age |Women
|Grand
Religion
|13-14 %|15-15 %|16-16 %|17-17 %|Total % |13-14 %|15-15 %|16-16 %|17-17 %|Total % |Total %
------------------------------------------------------------------------------------------------------------------------------------
ISLAM
| 0 0| 0 0| 0 0| 0 0| 0 0 | 0 0| 0 0| 0 0| 0 0| 0 0 | 0 0
CATHOLIC
| 0 0| 1 50| 2 12| 1 3| 4 7 | 0 0| 0 0| 0 0| 0 0| 0 0 | 4 7
BAPTIST
| 0 0| 0 0| 9 53| 24 63| 33 58 | 0 0| 0 0| 0 0| 0 0| 0 0 | 33 58
METHODIST
| 0 0| 0 0| 0 0| 0 0| 0 0 | 0 0| 0 0| 0 0| 0 0| 0 0 | 0 0
EPISCOPLN
| 0 0| 0 0| 0 0| 0 0| 0 0 | 0 0| 0 0| 0 0| 0 0| 0 0 | 0 0
PRESBYTRN
| 0 0| 0 0| 0 0| 0 0| 0 0 | 0 0| 0 0| 0 0| 0 0| 0 0 | 0 0
CHC OF GOD
| 0 0| 0 0| 0 0| 1 3| 1 2 | 0 0| 0 0| 0 0| 0 0| 0 0 | 1 2
HOLINESS
| 0 0| 0 0| 1 6| 0 0| 1 2 | 0 0| 0 0| 0 0| 0 0| 0 0 | 1 2
JEWISH
| 0 0| 0 0| 0 0| 0 0| 0 0 | 0 0| 0 0| 0 0| 0 0| 0 0 | 0 0
ANGLICAN
| 0 0| 0 0| 0 0| 0 0| 0 0 | 0 0| 0 0| 0 0| 0 0| 0 0 | 0 0
GRK ORTHDX
| 0 0| 0 0| 0 0| 0 0| 0 0 | 0 0| 0 0| 0 0| 0 0| 0 0 | 0 0
HINDU
| 0 0| 0 0| 0 0| 0 0| 0 0 | 0 0| 0 0| 0 0| 0 0| 0 0 | 0 0
BUDDHIST
| 0 0| 0 0| 1 6| 2 5| 3 5 | 0 0| 0 0| 0 0| 0 0| 0 0 | 3 5
TAOIST
| 0 0| 0 0| 0 0| 0 0| 0 0 | 0 0| 0 0| 0 0| 0 0| 0 0 | 0 0
SHINTOIST
| 0 0| 0 0| 0 0| 0 0| 0 0 | 0 0| 0 0| 0 0| 0 0| 0 0 | 0 0
SEVEN D AD
| 0 0| 0 0| 0 0| 0 0| 0 0 | 0 0| 0 0| 0 0| 0 0| 0 0 | 0 0
JEHOVAH WT
| 0 0| 1 50| 0 0| 0 0| 1 2 | 0 0| 0 0| 0 0| 0 0| 0 0 | 1 2
LATR DAY S
| 0 0| 0 0| 0 0| 0 0| 0 0 | 0 0| 0 0| 0 0| 0 0| 0 0 | 0 0
QUAKER
| 0 0| 0 0| 0 0| 0 0| 0 0 | 0 0| 0 0| 0 0| 0 0| 0 0 | 0 0
OTHER PROD
| 0 0| 0 0| 0 0| 0 0| 0 0 | 0 0| 0 0| 0 0| 0 0| 0 0 | 0 0
NONE
| 0 0| 0 0| 3 18| 9 24| 12 21 | 0 0| 0 0| 0 0| 0 0| 0 0 | 12 21
OTHER
| 0 0| 0 0| 1 6| 1 3| 2 4 | 0 0| 0 0| 0 0| 0 0| 0 0 | 2 4
------------------------------------------------------------------------------------------------------------------------------------
Total reported
| 0 0| 2 100| 17 100| 38 100| 57 100 | 0 0| 0 0| 0 0| 0 0| 0 0 | 57 100
|
|
|
|
|
|
|
|
|
|
|
Percent reported |
.0|
66.7| 100.0| 100.0|
98.3 |
.0|
.0|
.0|
.0|
.0 |
98.3
|
|
|
|
|
|
|
|
|
|
|
|
|
|
|
|
|
|
|
|
|
|
NOT RPTD
|0|1|0|0|1
|0|0|0|0|0
|1
------------------------------------------------------------------------------------------------------------------------------------
Total
| 0 | 3 | 17 | 38 | 58
|0|0|0|0|0
| 58
Page 15 Run 12/21/01
Georgia Department of Corrections Office of Planning and Analysis
Inmate statistical profile
Sample: ACTIVE JUVENILE PRISONERS EXCLUDING JAILS
Requestor: Statistics
Active inmates 12/21/2001
Self-Rpt Family Behavior Patterns * by current age & sex
|
MEN
|
WOMEN
|
| Age | Age | Age | Age | Men
| Age | Age | Age | Age |Women
|Grand
Family Behavior
|13-14 %|15-15 %|16-16 %|17-17 %|Total % |13-14 %|15-15 %|16-16 %|17-17 %|Total % |Total %
------------------------------------------------------------------------------------------------------------------------------------
CRIMINLTY
| 0 0| 0 0| 5 29| 15 28| 20 28 | 0 0| 0 0| 0 0| 0 0| 0 0 | 20 28
ALCOHOLISM
| 0 0| 0 0| 1 6| 4 7| 5 7 | 0 0| 0 0| 0 0| 0 0| 0 0 | 5 7
DRUG ABUSE
| 0 0| 0 0| 1 6| 6 11| 7 10 | 0 0| 0 0| 0 0| 0 0| 0 0 | 7 10
DOMINERING
| 0 0| 0 0| 0 0| 0 0| 0 0 | 0 0| 0 0| 0 0| 0 0| 0 0 | 0 0
MIGRANT
| 0 0| 0 0| 0 0| 1 2| 1 1 | 0 0| 0 0| 0 0| 0 0| 0 0 | 1 1
INFL BTGS
| 0 0| 0 0| 0 0| 0 0| 0 0 | 0 0| 0 0| 0 0| 0 0| 0 0 | 0 0
PERMISSIVE
| 0 0| 0 0| 0 0| 0 0| 0 0 | 0 0| 0 0| 0 0| 0 0| 0 0 | 0 0
FATH ABSNT
| 0 0| 0 0| 7 41| 23 43| 30 42 | 0 0| 0 0| 0 0| 0 0| 0 0 | 30 42
MOTH ABSNT
| 0 0| 0 0| 2 12| 5 9| 7 10 | 0 0| 0 0| 0 0| 0 0| 0 0 | 7 10
NONE
| 0 0| 0 0| 1 6| 0 0| 1 1 | 0 0| 0 0| 0 0| 0 0| 0 0 | 1 1
------------------------------------------------------------------------------------------------------------------------------------
Total reported
| 0 0| 0 0| 17 100| 54 100| 71 100 | 0 0| 0 0| 0 0| 0 0| 0 0 | 71 100
|
|
|
|
|
|
|
|
|
|
|
Percent reported |
.0|
.0|
64.7|
76.3|
69.0 |
.0|
.0|
.0|
.0|
.0 |
69.0
|
|
|
|
|
|
|
|
|
|
|
|
|
|
|
|
|
|
|
|
|
|
OTHER
| 0 | 3 | 6 | 9 | 18
|0|0|0|0|0
| 18
------------------------------------------------------------------------------------------------------------------------------------
Total
| 0 | 3 | 17 | 38 | 58
|0|0|0|0|0
| 58
* NOTE: SINCE THERE CAN BE UP TO FIVE BEHAVIOR CODES PER INMATE, THE NUMBER OF CASES REPORTED IN THE DETAIL LINES AND THE TOTAL REPORTED LINE MAY EXCEED THE TOTAL NUMBER OF CASES. IN SHORT, THIS TABLE COUNTS THE NUMBER OF BEHAVIOR PROBLEMS, NOT INMATES.
Page 16 Run 12/21/01
Georgia Department of Corrections Office of Planning and Analysis
Inmate statistical profile
Sample: ACTIVE JUVENILE PRISONERS EXCLUDING JAILS
Requestor: Statistics
Active inmates 12/21/2001
Inmate Diagnostic Behavior Problem * by current age & sex
|
MEN
|
WOMEN
|
| Age | Age | Age | Age | Men
| Age | Age | Age | Age |Women
|Grand
Diagnostic Problem |13-14 %|15-15 %|16-16 %|17-17 %|Total % |13-14 %|15-15 %|16-16 %|17-17 %|Total % |Total %
------------------------------------------------------------------------------------------------------------------------------------
ALCOHOLIC
| 0 0| 0 0| 0 0| 0 0| 0 0 | 0 0| 0 0| 0 0| 0 0| 0 0 | 0 0
ALCOH ABSE
| 0 0| 0 0| 6 19| 18 23| 24 21 | 0 0| 0 0| 0 0| 0 0| 0 0 | 24 21
DRUG EXP
| 0 0| 0 0| 1 3| 0 0| 1 1 | 0 0| 0 0| 0 0| 0 0| 0 0 | 1 1
DRUG ABSE
| 0 0| 1 33| 10 31| 25 32| 36 32 | 0 0| 0 0| 0 0| 0 0| 0 0 | 36 32
NARC ADDCT
| 0 0| 0 0| 0 0| 0 0| 0 0 | 0 0| 0 0| 0 0| 0 0| 0 0 | 0 0
EPILEPTIC
| 0 0| 0 0| 0 0| 0 0| 0 0 | 0 0| 0 0| 0 0| 0 0| 0 0 | 0 0
MANIPULTVE
| 0 0| 0 0| 0 0| 0 0| 0 0 | 0 0| 0 0| 0 0| 0 0| 0 0 | 0 0
ASSAULTIVE
| 0 0| 2 67| 11 34| 24 31| 37 33 | 0 0| 0 0| 0 0| 0 0| 0 0 | 37 33
ESCPE TEND
| 0 0| 0 0| 1 3| 0 0| 1 1 | 0 0| 0 0| 0 0| 0 0| 0 0 | 1 1
SUICIDAL
| 0 0| 0 0| 1 3| 2 3| 3 3 | 0 0| 0 0| 0 0| 0 0| 0 0 | 3 3
WITHDRAWN
| 0 0| 0 0| 1 3| 0 0| 1 1 | 0 0| 0 0| 0 0| 0 0| 0 0 | 1 1
PR RLTY CT
| 0 0| 0 0| 0 0| 0 0| 0 0 | 0 0| 0 0| 0 0| 0 0| 0 0 | 0 0
HOMOSEXUAL
| 0 0| 0 0| 0 0| 0 0| 0 0 | 0 0| 0 0| 0 0| 0 0| 0 0 | 0 0
NONE
| 0 0| 0 0| 0 0| 0 0| 0 0 | 0 0| 0 0| 0 0| 0 0| 0 0 | 0 0
OTHER
| 0 0| 0 0| 0 0| 0 0| 0 0 | 0 0| 0 0| 0 0| 0 0| 0 0 | 0 0
NOT RPTD
| 0 0| 0 0| 1 3| 8 10| 9 8 | 0 0| 0 0| 0 0| 0 0| 0 0 | 9 8
------------------------------------------------------------------------------------------------------------------------------------
Total reported
| 0 0| 3 100| 32 100| 77 100| 112 100 | 0 0| 0 0| 0 0| 0 0| 0 0 | 112 100
|
|
|
|
|
|
|
|
|
|
|
Percent reported |
.0| 100.0| 100.0| 100.0| 100.0 |
.0|
.0|
.0|
.0|
.0 | 100.0
|
|
|
|
|
|
|
|
|
|
|
|
|
|
|
|
|
|
|
|
|
|
UNKNOWN
|0|0|0|0|0
|0|0|0|0|0
|0
------------------------------------------------------------------------------------------------------------------------------------
Total
| 0 | 3 | 17 | 38 | 58
|0|0|0|0|0
| 58
* NOTE: SINCE THERE CAN BE UP TO FIVE BEHAVIOR CODES PER INMATE, THE NUMBER OF CASES REPORTED IN THE DETAIL LINES AND THE TOTAL REPORTED LINE MAY EXCEED THE TOTAL NUMBER OF CASES. IN SHORT, THIS TABLE COUNTS THE NUMBER OF BEHAVIOR PROBLEMS, NOT INMATES.
Page 17 Run 12/21/01
Georgia Department of Corrections Office of Planning and Analysis
Inmate statistical profile
Sample: ACTIVE JUVENILE PRISONERS EXCLUDING JAILS
Requestor: Statistics
Active inmates 12/21/2001
Physical Profile (General Condition) by current age & sex
|
MEN
|
WOMEN
|
| Age | Age | Age | Age | Men
| Age | Age | Age | Age |Women
|Grand
Physical Profile |13-14 %|15-15 %|16-16 %|17-17 %|Total % |13-14 %|15-15 %|16-16 %|17-17 %|Total % |Total %
------------------------------------------------------------------------------------------------------------------------------------
NO LIMITATION
| 0 0| 3 100| 16 94| 35 92| 54 93 | 0 0| 0 0| 0 0| 0 0| 0 0 | 54 93
DEFECT NO MAJOR LIMT| 0 0| 0 0| 1 6| 2 5| 3 5 | 0 0| 0 0| 0 0| 0 0| 0 0 | 3 5
DEFECT MAJOR LIMIT | 0 0| 0 0| 0 0| 1 3| 1 2 | 0 0| 0 0| 0 0| 0 0| 0 0 | 1 2
VERY MAJOR DEFECT | 0 0| 0 0| 0 0| 0 0| 0 0 | 0 0| 0 0| 0 0| 0 0| 0 0 | 0 0
------------------------------------------------------------------------------------------------------------------------------------
Total reported
| 0 0| 3 100| 17 100| 38 100| 58 100 | 0 0| 0 0| 0 0| 0 0| 0 0 | 58 100
|
|
|
|
|
|
|
|
|
|
|
Percent reported |
.0| 100.0| 100.0| 100.0| 100.0 |
.0|
.0|
.0|
.0|
.0 | 100.0
|
|
|
|
|
|
|
|
|
|
|
|
|
|
|
|
|
|
|
|
|
|
NOT REPORTED
|0|0|0|0|0
|0|0|0|0|0
|0
------------------------------------------------------------------------------------------------------------------------------------
Total
| 0 | 3 | 17 | 38 | 58
|0|0|0|0|0
| 58
Page 18 Run 12/21/01
Georgia Department of Corrections Office of Planning and Analysis
Inmate statistical profile
Sample: ACTIVE JUVENILE PRISONERS EXCLUDING JAILS
Requestor: Statistics
Active inmates 12/21/2001
Security Status by current age & sex
|
MEN
|
WOMEN
|
| Age | Age | Age | Age | Men
| Age | Age | Age | Age |Women
|Grand
Security
|13-14 %|15-15 %|16-16 %|17-17 %|Total % |13-14 %|15-15 %|16-16 %|17-17 %|Total % |Total %
------------------------------------------------------------------------------------------------------------------------------------
DIAG INCOM
| 0 0| 0 0| 0 0| 0 0| 0 0 | 0 0| 0 0| 0 0| 0 0| 0 0 | 0 0
WRK RELEAS
| 0 0| 0 0| 0 0| 1 3| 1 2 | 0 0| 0 0| 0 0| 0 0| 0 0 | 1 2
TRUSTY
| 0 0| 0 0| 0 0| 0 0| 0 0 | 0 0| 0 0| 0 0| 0 0| 0 0 | 0 0
MINIMUM
| 0 0| 0 0| 0 0| 0 0| 0 0 | 0 0| 0 0| 0 0| 0 0| 0 0 | 0 0
MEDIUM
| 0 0| 0 0| 1 6| 11 29| 12 21 | 0 0| 0 0| 0 0| 0 0| 0 0 | 12 21
CLOSE
| 0 0| 2 67| 14 82| 23 61| 39 67 | 0 0| 0 0| 0 0| 0 0| 0 0 | 39 67
MAXIMUM
| 0 0| 0 0| 2 12| 2 5| 4 7 | 0 0| 0 0| 0 0| 0 0| 0 0 | 4 7
DIAGNOSTIC
| 0 0| 1 33| 0 0| 1 3| 2 3 | 0 0| 0 0| 0 0| 0 0| 0 0 | 2 3
------------------------------------------------------------------------------------------------------------------------------------
Total reported
| 0 0| 3 100| 17 100| 38 100| 58 100 | 0 0| 0 0| 0 0| 0 0| 0 0 | 58 100
|
|
|
|
|
|
|
|
|
|
|
Percent reported |
.0| 100.0| 100.0| 100.0| 100.0 |
.0|
.0|
.0|
.0|
.0 | 100.0
|
|
|
|
|
|
|
|
|
|
|
|
|
|
|
|
|
|
|
|
|
|
NOT RPTD
|0|0|0|0|0
|0|0|0|0|0
|0
------------------------------------------------------------------------------------------------------------------------------------
Total
| 0 | 3 | 17 | 38 | 58
|0|0|0|0|0
| 58
* NOTE: BEGINNING IN JULY 1987, THE FACILITIES DIVISION NO LONGER CODED INMATES AS BEING WORK RELEASE
Page 19 Run 12/21/01
Georgia Department of Corrections Office of Planning and Analysis
Inmate statistical profile
Sample: ACTIVE JUVENILE PRISONERS EXCLUDING JAILS
Requestor: Statistics
Active inmates 12/21/2001
Number Of Sentences by current age & sex
|
MEN
|
WOMEN
|
| Age | Age | Age | Age | Men
| Age | Age | Age | Age |Women
|Grand
Number Of Sentences |13-14 %|15-15 %|16-16 %|17-17 %|Total % |13-14 %|15-15 %|16-16 %|17-17 %|Total % |Total %
------------------------------------------------------------------------------------------------------------------------------------
ONE
| 0 0| 1 33| 9 53| 14 37| 24 41 | 0 0| 0 0| 0 0| 0 0| 0 0 | 24 41
TWO
| 0 0| 1 33| 4 24| 13 34| 18 31 | 0 0| 0 0| 0 0| 0 0| 0 0 | 18 31
THREE
| 0 0| 0 0| 2 12| 3 8| 5 9 | 0 0| 0 0| 0 0| 0 0| 0 0 | 5 9
FOUR
| 0 0| 0 0| 1 6| 6 16| 7 12 | 0 0| 0 0| 0 0| 0 0| 0 0 | 7 12
FIVE
| 0 0| 1 33| 0 0| 2 5| 3 5 | 0 0| 0 0| 0 0| 0 0| 0 0 | 3 5
MORE THAN FIVE
| 0 0| 0 0| 1 6| 0 0| 1 2 | 0 0| 0 0| 0 0| 0 0| 0 0 | 1 2
------------------------------------------------------------------------------------------------------------------------------------
Total reported
| 0 0| 3 100| 17 100| 38 100| 58 100 | 0 0| 0 0| 0 0| 0 0| 0 0 | 58 100
|
|
|
|
|
|
|
|
|
|
|
Percent reported |
.0| 100.0| 100.0| 100.0| 100.0 |
.0|
.0|
.0|
.0|
.0 | 100.0
|
|
|
|
|
|
|
|
|
|
|
|
|
|
|
|
|
|
|
|
|
|
NOT REPORTED
|0|0|0|0|0
|0|0|0|0|0
|0
------------------------------------------------------------------------------------------------------------------------------------
Total
| 0 | 3 | 17 | 38 | 58
|0|0|0|0|0
| 58
|
|
|
|
|
|
|
|
|
|
|
|
|
|
|
|
|
|
|
|
|
|
|
|
|
|
|
|
|
|
|
|
|
|
|
|
|
|
|
|
|
|
|
|
|
|
|
|
|
|
|
|
|
|
|
AVG NUM SENTENCES | .00 | 2.67 | 1.94 | 2.18 | 2.14 | .00 | .00 | .00 | .00 | .00 | 2.14
Page 20 Run 12/21/01
Georgia Department of Corrections Office of Planning and Analysis
Inmate statistical profile
Sample: ACTIVE JUVENILE PRISONERS EXCLUDING JAILS
Requestor: Statistics
Active inmates 12/21/2001
Number Of Disciplinaries by current age & sex
|
MEN
|
WOMEN
|
| Age | Age | Age | Age | Men
| Age | Age | Age | Age |Women
|Grand
Disciplinaries
|13-14 %|15-15 %|16-16 %|17-17 %|Total % |13-14 %|15-15 %|16-16 %|17-17 %|Total % |Total %
------------------------------------------------------------------------------------------------------------------------------------
ZERO
| 0 0| 2 67| 6 35| 7 18| 15 26 | 0 0| 0 0| 0 0| 0 0| 0 0 | 15 26
ONE
| 0 0| 1 33| 3 18| 2 5| 6 10 | 0 0| 0 0| 0 0| 0 0| 0 0 | 6 10
TWO
| 0 0| 0 0| 1 6| 4 11| 5 9 | 0 0| 0 0| 0 0| 0 0| 0 0 | 5 9
THREE
| 0 0| 0 0| 0 0| 4 11| 4 7 | 0 0| 0 0| 0 0| 0 0| 0 0 | 4 7
FOUR
| 0 0| 0 0| 0 0| 2 5| 2 3 | 0 0| 0 0| 0 0| 0 0| 0 0 | 2 3
FIVE
| 0 0| 0 0| 0 0| 1 3| 1 2 | 0 0| 0 0| 0 0| 0 0| 0 0 | 1 2
MORE THAN FIVE
| 0 0| 0 0| 7 41| 18 47| 25 43 | 0 0| 0 0| 0 0| 0 0| 0 0 | 25 43
------------------------------------------------------------------------------------------------------------------------------------
Total reported
| 0 0| 3 100| 17 100| 38 100| 58 100 | 0 0| 0 0| 0 0| 0 0| 0 0 | 58 100
|
|
|
|
|
|
|
|
|
|
|
Percent reported |
.0| 100.0| 100.0| 100.0| 100.0 |
.0|
.0|
.0|
.0|
.0 | 100.0
|
|
|
|
|
|
|
|
|
|
|
|
|
|
|
|
|
|
|
|
|
|
NOT REPORTED
|0|0|0|0|0
|0|0|0|0|0
|0
------------------------------------------------------------------------------------------------------------------------------------
Total
| 0 | 3 | 17 | 38 | 58
|0|0|0|0|0
| 58
|
|
|
|
|
|
|
|
|
|
|
|
|
|
|
|
|
|
|
|
|
|
|
|
|
|
|
|
|
|
|
|
|
|
|
|
|
|
|
|
|
|
|
|
|
|
|
|
|
|
|
|
|
|
|
AVG NUM DISCIP
| .00 | .33 | 8.18 | 6.03 | 6.36 | .00 | .00 | .00 | .00 | .00 | 6.36
Page 21 Run 12/21/01
Georgia Department of Corrections Office of Planning and Analysis
Inmate statistical profile
Sample: ACTIVE JUVENILE PRISONERS EXCLUDING JAILS
Requestor: Statistics
Active inmates 12/21/2001
Number Of Escapes by current age & sex
|
MEN
|
WOMEN
|
| Age | Age | Age | Age | Men
| Age | Age | Age | Age |Women
|Grand
Escapes
|13-14 %|15-15 %|16-16 %|17-17 %|Total % |13-14 %|15-15 %|16-16 %|17-17 %|Total % |Total %
------------------------------------------------------------------------------------------------------------------------------------
ZERO
| 0 0| 3 100| 17 100| 38 100| 58 100 | 0 0| 0 0| 0 0| 0 0| 0 0 | 58 100
ONE
| 0 0| 0 0| 0 0| 0 0| 0 0 | 0 0| 0 0| 0 0| 0 0| 0 0 | 0 0
TWO
| 0 0| 0 0| 0 0| 0 0| 0 0 | 0 0| 0 0| 0 0| 0 0| 0 0 | 0 0
THREE
| 0 0| 0 0| 0 0| 0 0| 0 0 | 0 0| 0 0| 0 0| 0 0| 0 0 | 0 0
FOUR
| 0 0| 0 0| 0 0| 0 0| 0 0 | 0 0| 0 0| 0 0| 0 0| 0 0 | 0 0
FIVE
| 0 0| 0 0| 0 0| 0 0| 0 0 | 0 0| 0 0| 0 0| 0 0| 0 0 | 0 0
MORE THAN FIVE
| 0 0| 0 0| 0 0| 0 0| 0 0 | 0 0| 0 0| 0 0| 0 0| 0 0 | 0 0
------------------------------------------------------------------------------------------------------------------------------------
Total reported
| 0 0| 3 100| 17 100| 38 100| 58 100 | 0 0| 0 0| 0 0| 0 0| 0 0 | 58 100
|
|
|
|
|
|
|
|
|
|
|
Percent reported |
.0| 100.0| 100.0| 100.0| 100.0 |
.0|
.0|
.0|
.0|
.0 | 100.0
|
|
|
|
|
|
|
|
|
|
|
|
|
|
|
|
|
|
|
|
|
|
NOT REPORTED
|0|0|0|0|0
|0|0|0|0|0
|0
------------------------------------------------------------------------------------------------------------------------------------
Total
| 0 | 3 | 17 | 38 | 58
|0|0|0|0|0
| 58
|
|
|
|
|
|
|
|
|
|
|
|
|
|
|
|
|
|
|
|
|
|
|
|
|
|
|
|
|
|
|
|
|
|
|
|
|
|
|
|
|
|
|
|
|
|
|
|
|
|
|
|
|
|
|
AVG NUM ESCAPES
| .00 | .00 | .00 | .00 | .00 | .00 | .00 | .00 | .00 | .00 | .00
Page 22 Run 12/21/01
Georgia Department of Corrections Office of Planning and Analysis
Inmate statistical profile
Sample: ACTIVE JUVENILE PRISONERS EXCLUDING JAILS
Requestor: Statistics
Active inmates 12/21/2001
Number Of Prior Georgia Incarcerations * by current age & sex
|
MEN
|
WOMEN
|
| Age | Age | Age | Age | Men
| Age | Age | Age | Age |Women
|Grand
Prior Incarcerations|13-14 %|15-15 %|16-16 %|17-17 %|Total % |13-14 %|15-15 %|16-16 %|17-17 %|Total % |Total %
------------------------------------------------------------------------------------------------------------------------------------
ZERO
| 0 0| 3 100| 17 100| 38 100| 58 100 | 0 0| 0 0| 0 0| 0 0| 0 0 | 58 100
ONE
| 0 0| 0 0| 0 0| 0 0| 0 0 | 0 0| 0 0| 0 0| 0 0| 0 0 | 0 0
TWO
| 0 0| 0 0| 0 0| 0 0| 0 0 | 0 0| 0 0| 0 0| 0 0| 0 0 | 0 0
THREE
| 0 0| 0 0| 0 0| 0 0| 0 0 | 0 0| 0 0| 0 0| 0 0| 0 0 | 0 0
FOUR
| 0 0| 0 0| 0 0| 0 0| 0 0 | 0 0| 0 0| 0 0| 0 0| 0 0 | 0 0
FIVE
| 0 0| 0 0| 0 0| 0 0| 0 0 | 0 0| 0 0| 0 0| 0 0| 0 0 | 0 0
MORE THAN FIVE
| 0 0| 0 0| 0 0| 0 0| 0 0 | 0 0| 0 0| 0 0| 0 0| 0 0 | 0 0
------------------------------------------------------------------------------------------------------------------------------------
Total reported
| 0 0| 3 100| 17 100| 38 100| 58 100 | 0 0| 0 0| 0 0| 0 0| 0 0 | 58 100
|
|
|
|
|
|
|
|
|
|
|
Percent reported |
.0| 100.0| 100.0| 100.0| 100.0 |
.0|
.0|
.0|
.0|
.0 | 100.0
|
|
|
|
|
|
|
|
|
|
|
|
|
|
|
|
|
|
|
|
|
|
NOT REPORTED
|0|0|0|0|0
|0|0|0|0|0
|0
------------------------------------------------------------------------------------------------------------------------------------
Total
| 0 | 3 | 17 | 38 | 58
|0|0|0|0|0
| 58
|
|
|
|
|
|
|
|
|
|
|
|
|
|
|
|
|
|
|
|
|
|
|
|
|
|
|
|
|
|
|
|
|
|
|
|
|
|
|
|
|
|
|
|
|
|
|
|
|
|
|
|
|
|
|
AVG # INCARCERATIONS| .00 | .00 | .00 | .00 | .00 | .00 | .00 | .00 | .00 | .00 | .00
* This data counts a parole revocation on an existing sentenCE AS A prior incarceration. Also, this data counts, for any cohort of inmates, the total number of Georgia incarcerations the inmate has had during his entire criminal career. For example, if an inmate was admitted to prison first in FY72, and then re-admitted in FY79 and FY85, he had two prior incarcerations before the FY85 admission. This inmate's records show two prior incarcerations in all three of his records since he has had two prior incarcerations in his criminal career. If the cohort of FY72 admissions is selected for analysis, two prior incarcerations will be listed for this inmate even though in FY72, he had no prior incarcerations.
Page 23 Run 12/21/01
Georgia Department of Corrections Office of Planning and Analysis
Inmate statistical profile
Sample: ACTIVE JUVENILE PRISONERS EXCLUDING JAILS
Requestor: Statistics
Active inmates 12/21/2001
Number Of Transfers by current age & sex
|
MEN
|
WOMEN
|
| Age | Age | Age | Age | Men
| Age | Age | Age | Age |Women
|Grand
Transfers
|13-14 %|15-15 %|16-16 %|17-17 %|Total % |13-14 %|15-15 %|16-16 %|17-17 %|Total % |Total %
------------------------------------------------------------------------------------------------------------------------------------
ZERO
| 0 0| 3 100| 17 100| 37 97| 57 98 | 0 0| 0 0| 0 0| 0 0| 0 0 | 57 98
ONE
| 0 0| 0 0| 0 0| 1 3| 1 2 | 0 0| 0 0| 0 0| 0 0| 0 0 | 1 2
TWO
| 0 0| 0 0| 0 0| 0 0| 0 0 | 0 0| 0 0| 0 0| 0 0| 0 0 | 0 0
THREE
| 0 0| 0 0| 0 0| 0 0| 0 0 | 0 0| 0 0| 0 0| 0 0| 0 0 | 0 0
FOUR
| 0 0| 0 0| 0 0| 0 0| 0 0 | 0 0| 0 0| 0 0| 0 0| 0 0 | 0 0
FIVE
| 0 0| 0 0| 0 0| 0 0| 0 0 | 0 0| 0 0| 0 0| 0 0| 0 0 | 0 0
MORE THAN FIVE
| 0 0| 0 0| 0 0| 0 0| 0 0 | 0 0| 0 0| 0 0| 0 0| 0 0 | 0 0
------------------------------------------------------------------------------------------------------------------------------------
Total reported
| 0 0| 3 100| 17 100| 38 100| 58 100 | 0 0| 0 0| 0 0| 0 0| 0 0 | 58 100
|
|
|
|
|
|
|
|
|
|
|
Percent reported |
.0| 100.0| 100.0| 100.0| 100.0 |
.0|
.0|
.0|
.0|
.0 | 100.0
|
|
|
|
|
|
|
|
|
|
|
|
|
|
|
|
|
|
|
|
|
|
NOT REPORTED
|0|0|0|0|0
|0|0|0|0|0
|0
------------------------------------------------------------------------------------------------------------------------------------
Total
| 0 | 3 | 17 | 38 | 58
|0|0|0|0|0
| 58
|
|
|
|
|
|
|
|
|
|
|
|
|
|
|
|
|
|
|
|
|
|
|
|
|
|
|
|
|
|
|
|
|
|
|
|
|
|
|
|
|
|
|
|
|
|
|
|
|
|
|
|
|
|
|
AVG NUM TRANSFERS | .00 | .00 | .00 | .03 | .02 | .00 | .00 | .00 | .00 | .00 | .02
Page 24 Run 12/21/01
Georgia Department of Corrections Office of Planning and Analysis
Inmate statistical profile
Sample: ACTIVE JUVENILE PRISONERS EXCLUDING JAILS
Requestor: Statistics
Active inmates 12/21/2001
County Of Conviction by current age & sex
|
MEN
|
WOMEN
|
| Age | Age | Age | Age | Men
| Age | Age | Age | Age |Women
|Grand
County Of Conviction|13-14 %|15-15 %|16-16 %|17-17 %|Total % |13-14 %|15-15 %|16-16 %|17-17 %|Total % |Total %
------------------------------------------------------------------------------------------------------------------------------------
Baldwin
| 0 0| 0 0| 0 0| 1 3| 1 2 | 0 0| 0 0| 0 0| 0 0| 0 0 | 1 2
Bibb
| 0 0| 0 0| 0 0| 4 11| 4 7 | 0 0| 0 0| 0 0| 0 0| 0 0 | 4 7
Chatham
| 0 0| 0 0| 2 12| 5 13| 7 12 | 0 0| 0 0| 0 0| 0 0| 0 0 | 7 12
Clarke
| 0 0| 0 0| 1 6| 0 0| 1 2 | 0 0| 0 0| 0 0| 0 0| 0 0 | 1 2
Clay
| 0 0| 0 0| 1 6| 0 0| 1 2 | 0 0| 0 0| 0 0| 0 0| 0 0 | 1 2
Clayton
| 0 0| 0 0| 2 12| 1 3| 3 5 | 0 0| 0 0| 0 0| 0 0| 0 0 | 3 5
Cobb
| 0 0| 0 0| 0 0| 2 5| 2 3 | 0 0| 0 0| 0 0| 0 0| 0 0 | 2 3
Colquit
| 0 0| 0 0| 0 0| 1 3| 1 2 | 0 0| 0 0| 0 0| 0 0| 0 0 | 1 2
Decatur
| 0 0| 0 0| 1 6| 0 0| 1 2 | 0 0| 0 0| 0 0| 0 0| 0 0 | 1 2
DeKalb
| 0 0| 0 0| 2 12| 3 8| 5 9 | 0 0| 0 0| 0 0| 0 0| 0 0 | 5 9
Douglas
| 0 0| 0 0| 0 0| 1 3| 1 2 | 0 0| 0 0| 0 0| 0 0| 0 0 | 1 2
Floyd
| 0 0| 1 33| 0 0| 0 0| 1 2 | 0 0| 0 0| 0 0| 0 0| 0 0 | 1 2
Fulton
| 0 0| 0 0| 0 0| 2 5| 2 3 | 0 0| 0 0| 0 0| 0 0| 0 0 | 2 3
Greene
| 0 0| 0 0| 1 6| 0 0| 1 2 | 0 0| 0 0| 0 0| 0 0| 0 0 | 1 2
Gwinnett
| 0 0| 2 67| 0 0| 2 5| 4 7 | 0 0| 0 0| 0 0| 0 0| 0 0 | 4 7
Jones
| 0 0| 0 0| 0 0| 1 3| 1 2 | 0 0| 0 0| 0 0| 0 0| 0 0 | 1 2
Lowndes
| 0 0| 0 0| 0 0| 2 5| 2 3 | 0 0| 0 0| 0 0| 0 0| 0 0 | 2 3
Monroe
| 0 0| 0 0| 1 6| 0 0| 1 2 | 0 0| 0 0| 0 0| 0 0| 0 0 | 1 2
Muscogee
| 0 0| 0 0| 0 0| 1 3| 1 2 | 0 0| 0 0| 0 0| 0 0| 0 0 | 1 2
Oconee
| 0 0| 0 0| 1 6| 0 0| 1 2 | 0 0| 0 0| 0 0| 0 0| 0 0 | 1 2
Paulding
| 0 0| 0 0| 0 0| 4 11| 4 7 | 0 0| 0 0| 0 0| 0 0| 0 0 | 4 7
Richmond
| 0 0| 0 0| 2 12| 4 11| 6 10 | 0 0| 0 0| 0 0| 0 0| 0 0 | 6 10
Taylor
| 0 0| 0 0| 1 6| 0 0| 1 2 | 0 0| 0 0| 0 0| 0 0| 0 0 | 1 2
Tift
| 0 0| 0 0| 1 6| 2 5| 3 5 | 0 0| 0 0| 0 0| 0 0| 0 0 | 3 5
Walker
| 0 0| 0 0| 0 0| 1 3| 1 2 | 0 0| 0 0| 0 0| 0 0| 0 0 | 1 2
Ware
| 0 0| 0 0| 0 0| 1 3| 1 2 | 0 0| 0 0| 0 0| 0 0| 0 0 | 1 2
Wilkinson
| 0 0| 0 0| 1 6| 0 0| 1 2 | 0 0| 0 0| 0 0| 0 0| 0 0 | 1 2
------------------------------------------------------------------------------------------------------------------------------------
Total reported
| 0 0| 3 100| 17 100| 38 100| 58 100 | 0 0| 0 0| 0 0| 0 0| 0 0 | 58 100
|
|
|
|
|
|
|
|
|
|
|
Percent reported |
.0| 100.0| 100.0| 100.0| 100.0 |
.0|
.0|
.0|
.0|
.0 | 100.0
|
|
|
|
|
|
|
|
|
|
|
|
|
|
|
|
|
|
|
|
|
|
Not reported
|0|0|0|0|0
|0|0|0|0|0
|0
------------------------------------------------------------------------------------------------------------------------------------
Total
| 0 | 3 | 17 | 38 | 58
|0|0|0|0|0
| 58
Page 25 Run 12/21/01
Georgia Department of Corrections Office of Planning and Analysis
Inmate statistical profile
Sample: ACTIVE JUVENILE PRISONERS EXCLUDING JAILS
Requestor: Statistics
Active inmates 12/21/2001
Circ Of Conviction by current age & sex
|
MEN
|
WOMEN
|
| Age | Age | Age | Age | Men
| Age | Age | Age | Age |Women
|Grand
Circ Of Conviction |13-14 %|15-15 %|16-16 %|17-17 %|Total % |13-14 %|15-15 %|16-16 %|17-17 %|Total % |Total %
------------------------------------------------------------------------------------------------------------------------------------
Atlanta
| 0 0| 0 0| 0 0| 2 5| 2 3 | 0 0| 0 0| 0 0| 0 0| 0 0 | 2 3
Augusta
| 0 0| 0 0| 2 12| 4 11| 6 10 | 0 0| 0 0| 0 0| 0 0| 0 0 | 6 10
Chattahoochee
| 0 0| 0 0| 1 6| 1 3| 2 3 | 0 0| 0 0| 0 0| 0 0| 0 0 | 2 3
Clayton
| 0 0| 0 0| 2 12| 1 3| 3 5 | 0 0| 0 0| 0 0| 0 0| 0 0 | 3 5
Cobb
| 0 0| 0 0| 0 0| 2 5| 2 3 | 0 0| 0 0| 0 0| 0 0| 0 0 | 2 3
Eastern
| 0 0| 0 0| 2 12| 5 13| 7 12 | 0 0| 0 0| 0 0| 0 0| 0 0 | 7 12
Gwinnett
| 0 0| 2 67| 0 0| 2 5| 4 7 | 0 0| 0 0| 0 0| 0 0| 0 0 | 4 7
Lookout Mountain | 0 0| 0 0| 0 0| 1 3| 1 2 | 0 0| 0 0| 0 0| 0 0| 0 0 | 1 2
Macon
| 0 0| 0 0| 0 0| 4 11| 4 7 | 0 0| 0 0| 0 0| 0 0| 0 0 | 4 7
Ocmulgee
| 0 0| 0 0| 2 12| 2 5| 4 7 | 0 0| 0 0| 0 0| 0 0| 0 0 | 4 7
Pataula
| 0 0| 0 0| 1 6| 0 0| 1 2 | 0 0| 0 0| 0 0| 0 0| 0 0 | 1 2
Rome
| 0 0| 1 33| 0 0| 0 0| 1 2 | 0 0| 0 0| 0 0| 0 0| 0 0 | 1 2
South Georgia
| 0 0| 0 0| 1 6| 0 0| 1 2 | 0 0| 0 0| 0 0| 0 0| 0 0 | 1 2
Southern
| 0 0| 0 0| 0 0| 3 8| 3 5 | 0 0| 0 0| 0 0| 0 0| 0 0 | 3 5
Stone Mountain
| 0 0| 0 0| 2 12| 3 8| 5 9 | 0 0| 0 0| 0 0| 0 0| 0 0 | 5 9
Tallapoosa
| 0 0| 0 0| 0 0| 4 11| 4 7 | 0 0| 0 0| 0 0| 0 0| 0 0 | 4 7
Tifton
| 0 0| 0 0| 1 6| 2 5| 3 5 | 0 0| 0 0| 0 0| 0 0| 0 0 | 3 5
Waycross
| 0 0| 0 0| 0 0| 1 3| 1 2 | 0 0| 0 0| 0 0| 0 0| 0 0 | 1 2
Western
| 0 0| 0 0| 2 12| 0 0| 2 3 | 0 0| 0 0| 0 0| 0 0| 0 0 | 2 3
Douglas
| 0 0| 0 0| 0 0| 1 3| 1 2 | 0 0| 0 0| 0 0| 0 0| 0 0 | 1 2
Towaliga
| 0 0| 0 0| 1 6| 0 0| 1 2 | 0 0| 0 0| 0 0| 0 0| 0 0 | 1 2
------------------------------------------------------------------------------------------------------------------------------------
Total reported
| 0 0| 3 100| 17 100| 38 100| 58 100 | 0 0| 0 0| 0 0| 0 0| 0 0 | 58 100
|
|
|
|
|
|
|
|
|
|
|
Percent reported |
.0| 100.0| 100.0| 100.0| 100.0 |
.0|
.0|
.0|
.0|
.0 | 100.0
|
|
|
|
|
|
|
|
|
|
|
|
|
|
|
|
|
|
|
|
|
|
Not reported
|0|0|0|0|0
|0|0|0|0|0
|0
------------------------------------------------------------------------------------------------------------------------------------
Total
| 0 | 3 | 17 | 38 | 58
|0|0|0|0|0
| 58
Page 26 Run 12/21/01
Georgia Department of Corrections Office of Planning and Analysis
Inmate statistical profile
Sample: ACTIVE JUVENILE PRISONERS EXCLUDING JAILS
Requestor: Statistics
Active inmates 12/21/2001
Home County by current age & sex
|
MEN
|
WOMEN
|
| Age | Age | Age | Age | Men
| Age | Age | Age | Age |Women
|Grand
Home County
|13-14 %|15-15 %|16-16 %|17-17 %|Total % |13-14 %|15-15 %|16-16 %|17-17 %|Total % |Total %
------------------------------------------------------------------------------------------------------------------------------------
Baldwin
| 0 0| 0 0| 0 0| 2 5| 2 4 | 0 0| 0 0| 0 0| 0 0| 0 0 | 2 4
Berrien
| 0 0| 0 0| 0 0| 1 3| 1 2 | 0 0| 0 0| 0 0| 0 0| 0 0 | 1 2
Bibb
| 0 0| 0 0| 1 7| 4 11| 5 9 | 0 0| 0 0| 0 0| 0 0| 0 0 | 5 9
Calhoun
| 0 0| 0 0| 1 7| 0 0| 1 2 | 0 0| 0 0| 0 0| 0 0| 0 0 | 1 2
Carroll
| 0 0| 0 0| 1 7| 0 0| 1 2 | 0 0| 0 0| 0 0| 0 0| 0 0 | 1 2
Chatham
| 0 0| 0 0| 2 14| 5 14| 7 13 | 0 0| 0 0| 0 0| 0 0| 0 0 | 7 13
Clarke
| 0 0| 0 0| 1 7| 0 0| 1 2 | 0 0| 0 0| 0 0| 0 0| 0 0 | 1 2
Clayton
| 0 0| 0 0| 2 14| 2 5| 4 8 | 0 0| 0 0| 0 0| 0 0| 0 0 | 4 8
Cobb
| 0 0| 0 0| 0 0| 2 5| 2 4 | 0 0| 0 0| 0 0| 0 0| 0 0 | 2 4
Colquit
| 0 0| 0 0| 0 0| 1 3| 1 2 | 0 0| 0 0| 0 0| 0 0| 0 0 | 1 2
Decatur
| 0 0| 0 0| 1 7| 0 0| 1 2 | 0 0| 0 0| 0 0| 0 0| 0 0 | 1 2
DeKalb
| 0 0| 0 0| 0 0| 2 5| 2 4 | 0 0| 0 0| 0 0| 0 0| 0 0 | 2 4
Floyd
| 0 0| 1 50| 0 0| 0 0| 1 2 | 0 0| 0 0| 0 0| 0 0| 0 0 | 1 2
Fulton
| 0 0| 0 0| 2 14| 2 5| 4 8 | 0 0| 0 0| 0 0| 0 0| 0 0 | 4 8
Greene
| 0 0| 0 0| 1 7| 0 0| 1 2 | 0 0| 0 0| 0 0| 0 0| 0 0 | 1 2
Gwinnett
| 0 0| 1 50| 0 0| 2 5| 3 6 | 0 0| 0 0| 0 0| 0 0| 0 0 | 3 6
Jones
| 0 0| 0 0| 0 0| 1 3| 1 2 | 0 0| 0 0| 0 0| 0 0| 0 0 | 1 2
Lowndes
| 0 0| 0 0| 0 0| 2 5| 2 4 | 0 0| 0 0| 0 0| 0 0| 0 0 | 2 4
Newton
| 0 0| 0 0| 0 0| 1 3| 1 2 | 0 0| 0 0| 0 0| 0 0| 0 0 | 1 2
Paulding
| 0 0| 0 0| 0 0| 4 11| 4 8 | 0 0| 0 0| 0 0| 0 0| 0 0 | 4 8
Richmond
| 0 0| 0 0| 1 7| 3 8| 4 8 | 0 0| 0 0| 0 0| 0 0| 0 0 | 4 8
Tift
| 0 0| 0 0| 1 7| 1 3| 2 4 | 0 0| 0 0| 0 0| 0 0| 0 0 | 2 4
Walker
| 0 0| 0 0| 0 0| 1 3| 1 2 | 0 0| 0 0| 0 0| 0 0| 0 0 | 1 2
Ware
| 0 0| 0 0| 0 0| 1 3| 1 2 | 0 0| 0 0| 0 0| 0 0| 0 0 | 1 2
------------------------------------------------------------------------------------------------------------------------------------
Total reported
| 0 0| 2 100| 14 100| 37 100| 53 100 | 0 0| 0 0| 0 0| 0 0| 0 0 | 53 100
|
|
|
|
|
|
|
|
|
|
|
Percent reported |
.0|
66.7|
82.4|
97.4|
91.4 |
.0|
.0|
.0|
.0|
.0 |
91.4
|
|
|
|
|
|
|
|
|
|
|
|
|
|
|
|
|
|
|
|
|
|
Not reported
|0|1|3|1|5
|0|0|0|0|0
|5
------------------------------------------------------------------------------------------------------------------------------------
Total
| 0 | 3 | 17 | 38 | 58
|0|0|0|0|0
| 58
Georgia Department of Corrections
Page 27 Run 12/21/01
Office of Planning and Analysis
Inmate statistical profile
Sample: ACTIVE JUVENILE PRISONERS EXCLUDING JAILS
Requestor: Statistics
Active inmates 12/21/2001
Prison Sentence In Years by current age & sex
|
MEN
|
WOMEN
|
| Age | Age | Age | Age | Men
| Age | Age | Age | Age |Women
|Grand
Sentence In Years |13-14 %|15-15 %|16-16 %|17-17 %|Total % |13-14 %|15-15 %|16-16 %|17-17 %|Total % |Total %
------------------------------------------------------------------------------------------------------------------------------------
0-1
| 0 0| 0 0| 0 0| 0 0| 0 0 | 0 0| 0 0| 0 0| 0 0| 0 0 | 0 0
1.1-2
| 0 0| 0 0| 0 0| 0 0| 0 0 | 0 0| 0 0| 0 0| 0 0| 0 0 | 0 0
2.1-3
| 0 0| 0 0| 0 0| 0 0| 0 0 | 0 0| 0 0| 0 0| 0 0| 0 0 | 0 0
3.1-4
| 0 0| 0 0| 0 0| 0 0| 0 0 | 0 0| 0 0| 0 0| 0 0| 0 0 | 0 0
4.1-5
| 0 0| 0 0| 0 0| 0 0| 0 0 | 0 0| 0 0| 0 0| 0 0| 0 0 | 0 0
5.1-6
| 0 0| 0 0| 0 0| 0 0| 0 0 | 0 0| 0 0| 0 0| 0 0| 0 0 | 0 0
6.1-7
| 0 0| 0 0| 0 0| 0 0| 0 0 | 0 0| 0 0| 0 0| 0 0| 0 0 | 0 0
7.1-8
| 0 0| 0 0| 0 0| 0 0| 0 0 | 0 0| 0 0| 0 0| 0 0| 0 0 | 0 0
8.1-9
| 0 0| 0 0| 0 0| 0 0| 0 0 | 0 0| 0 0| 0 0| 0 0| 0 0 | 0 0
9.1-10
| 0 0| 0 0| 0 0| 0 0| 0 0 | 0 0| 0 0| 0 0| 0 0| 0 0 | 0 0
10.1-12
| 0 0| 2 67| 10 59| 17 45| 29 50 | 0 0| 0 0| 0 0| 0 0| 0 0 | 29 50
12.1-15
| 0 0| 0 0| 2 12| 5 13| 7 12 | 0 0| 0 0| 0 0| 0 0| 0 0 | 7 12
15.1-20
| 0 0| 0 0| 2 12| 3 8| 5 9 | 0 0| 0 0| 0 0| 0 0| 0 0 | 5 9
20.1-OVER
| 0 0| 1 33| 2 12| 7 18| 10 17 | 0 0| 0 0| 0 0| 0 0| 0 0 | 10 17
LIFE
| 0 0| 0 0| 1 6| 6 16| 7 12 | 0 0| 0 0| 0 0| 0 0| 0 0 | 7 12
DEATH
| 0 0| 0 0| 0 0| 0 0| 0 0 | 0 0| 0 0| 0 0| 0 0| 0 0 | 0 0
LIFE W/O PAROLE
| 0 0| 0 0| 0 0| 0 0| 0 0 | 0 0| 0 0| 0 0| 0 0| 0 0 | 0 0
YOUTHFUL OFFENDERS | 0 0| 0 0| 0 0| 0 0| 0 0 | 0 0| 0 0| 0 0| 0 0| 0 0 | 0 0
------------------------------------------------------------------------------------------------------------------------------------
Total reported
| 0 0| 3 100| 17 100| 38 100| 58 100 | 0 0| 0 0| 0 0| 0 0| 0 0 | 58 100
|
|
|
|
|
|
|
|
|
|
|
Percent reported |
.0| 100.0| 100.0| 100.0| 100.0 |
.0|
.0|
.0|
.0|
.0 | 100.0
|
|
|
|
|
|
|
|
|
|
|
|
|
|
|
|
|
|
|
|
|
|
NOT REPORTED
|0|0|0|0|0
|0|0|0|0|0
|0
------------------------------------------------------------------------------------------------------------------------------------
Total
| 0 | 3 | 17 | 38 | 58
|0|0|0|0|0
| 58
|
|
|
|
|
|
|
|
|
|
|
|
|
|
|
|
|
|
|
|
|
|
|
|
|
|
|
|
|
|
|
|
|
|
|
|
|
|
|
|
|
|
|
|
|
|
|
|
|
|
|
|
|
|
|
AVG EXCLUDING
|
|
|
|
|
|
|
|
|
|
|
LIFE, DEATH, YO
| .00 | 13.34 | 13.38 | 14.54 | 14.11 | .00 | .00 | .00 | .00 | .00 | 14.11
|
|
|
|
|
|
|
|
|
|
|
|
|
|
|
|
|
|
|
|
|
|
|
|
|
|
|
|
|
|
|
|
|
|
|
|
|
|
|
|
|
|
|
|
|
|
|
|
|
|
|
|
|
|
|
AVG INCLUDING
|
|
|
|
|
|
|
|
|
|
|
LIFE=21, YO=3 YRS | .00 | 13.34 | 13.83 | 15.56 | 14.94 | .00 | .00 | .00 | .00 | .00 | 14.94
Page 28 Run 12/21/01
Georgia Department of Corrections Office of Planning and Analysis
Inmate statistical profile
Sample: ACTIVE JUVENILE PRISONERS EXCLUDING JAILS
Requestor: Statistics
Active inmates 12/21/2001
Probation To Follow Prison by current age & sex
|
MEN
|
WOMEN
|
| Age | Age | Age | Age | Men
| Age | Age | Age | Age |Women
|Grand
Prob After Prison |13-14 %|15-15 %|16-16 %|17-17 %|Total % |13-14 %|15-15 %|16-16 %|17-17 %|Total % |Total %
------------------------------------------------------------------------------------------------------------------------------------
PROBATION TO FOLLOW | 0 0| 1 33| 5 29| 11 29| 17 29 | 0 0| 0 0| 0 0| 0 0| 0 0 | 17 29
NO PROBATION
| 0 0| 2 67| 12 71| 27 71| 41 71 | 0 0| 0 0| 0 0| 0 0| 0 0 | 41 71
------------------------------------------------------------------------------------------------------------------------------------
Total reported
| 0 0| 3 100| 17 100| 38 100| 58 100 | 0 0| 0 0| 0 0| 0 0| 0 0 | 58 100
|
|
|
|
|
|
|
|
|
|
|
Percent reported |
.0| 100.0| 100.0| 100.0| 100.0 |
.0|
.0|
.0|
.0|
.0 | 100.0
|
|
|
|
|
|
|
|
|
|
|
|
|
|
|
|
|
|
|
|
|
|
NOT REPORTED
|0|0|0|0|0
|0|0|0|0|0
|0
------------------------------------------------------------------------------------------------------------------------------------
Total
| 0 | 3 | 17 | 38 | 58
|0|0|0|0|0
| 58
Page 29 Run 12/21/01
Georgia Department of Corrections Office of Planning and Analysis
Inmate statistical profile
Sample: ACTIVE JUVENILE PRISONERS EXCLUDING JAILS
Requestor: Statistics
Active inmates 12/21/2001
Admission Type by current age & sex
|
MEN
|
WOMEN
|
| Age | Age | Age | Age | Men
| Age | Age | Age | Age |Women
|Grand
Admission Type
|13-14 %|15-15 %|16-16 %|17-17 %|Total % |13-14 %|15-15 %|16-16 %|17-17 %|Total % |Total %
------------------------------------------------------------------------------------------------------------------------------------
COMMITTED FROM COURT| 0 0| 3 100| 17 100| 38 100| 58 100 | 0 0| 0 0| 0 0| 0 0| 0 0 | 58 100
RETURN APPEAL/BOND | 0 0| 0 0| 0 0| 0 0| 0 0 | 0 0| 0 0| 0 0| 0 0| 0 0 | 0 0
PAROLE REV/NEW SENT | 0 0| 0 0| 0 0| 0 0| 0 0 | 0 0| 0 0| 0 0| 0 0| 0 0 | 0 0
PAR REV/NO NEW SENT | 0 0| 0 0| 0 0| 0 0| 0 0 | 0 0| 0 0| 0 0| 0 0| 0 0 | 0 0
PROB VIOL/TOTAL REV | 0 0| 0 0| 0 0| 0 0| 0 0 | 0 0| 0 0| 0 0| 0 0| 0 0 | 0 0
PROB VIOL/PARTIAL | 0 0| 0 0| 0 0| 0 0| 0 0 | 0 0| 0 0| 0 0| 0 0| 0 0 | 0 0
ADMIT FM OTHER CUST | 0 0| 0 0| 0 0| 0 0| 0 0 | 0 0| 0 0| 0 0| 0 0| 0 0 | 0 0
SHOCK INCARCERATION | 0 0| 0 0| 0 0| 0 0| 0 0 | 0 0| 0 0| 0 0| 0 0| 0 0 | 0 0
PROB REV/REMAINDER | 0 0| 0 0| 0 0| 0 0| 0 0 | 0 0| 0 0| 0 0| 0 0| 0 0 | 0 0
NEW SENT/PAR REV PND| 0 0| 0 0| 0 0| 0 0| 0 0 | 0 0| 0 0| 0 0| 0 0| 0 0 | 0 0
LIFE W/O PAROLE
| 0 0| 0 0| 0 0| 0 0| 0 0 | 0 0| 0 0| 0 0| 0 0| 0 0 | 0 0
PAROLE REV BOOT CAMP| 0 0| 0 0| 0 0| 0 0| 0 0 | 0 0| 0 0| 0 0| 0 0| 0 0 | 0 0
PAR REV/RSN UNKNOWN | 0 0| 0 0| 0 0| 0 0| 0 0 | 0 0| 0 0| 0 0| 0 0| 0 0 | 0 0
PROBATION/PAROLE REV| 0 0| 0 0| 0 0| 0 0| 0 0 | 0 0| 0 0| 0 0| 0 0| 0 0 | 0 0
PB PAROLE RESCINDED | 0 0| 0 0| 0 0| 0 0| 0 0 | 0 0| 0 0| 0 0| 0 0| 0 0 | 0 0
PROB REVOC/SPEC COND| 0 0| 0 0| 0 0| 0 0| 0 0 | 0 0| 0 0| 0 0| 0 0| 0 0 | 0 0
PAR REV/REVOC CENTER| 0 0| 0 0| 0 0| 0 0| 0 0 | 0 0| 0 0| 0 0| 0 0| 0 0 | 0 0
INFORMATION ONLY | 0 0| 0 0| 0 0| 0 0| 0 0 | 0 0| 0 0| 0 0| 0 0| 0 0 | 0 0
INCOMPLETE SENT PKG | 0 0| 0 0| 0 0| 0 0| 0 0 | 0 0| 0 0| 0 0| 0 0| 0 0 | 0 0
HANCOCK REVOC CENTER| 0 0| 0 0| 0 0| 0 0| 0 0 | 0 0| 0 0| 0 0| 0 0| 0 0 | 0 0
WHITWORTH DETENTION | 0 0| 0 0| 0 0| 0 0| 0 0 | 0 0| 0 0| 0 0| 0 0| 0 0 | 0 0
DCYS AT RISK
| 0 0| 0 0| 0 0| 0 0| 0 0 | 0 0| 0 0| 0 0| 0 0| 0 0 | 0 0
OTHER
| 0 0| 0 0| 0 0| 0 0| 0 0 | 0 0| 0 0| 0 0| 0 0| 0 0 | 0 0
------------------------------------------------------------------------------------------------------------------------------------
Total reported
| 0 0| 3 100| 17 100| 38 100| 58 100 | 0 0| 0 0| 0 0| 0 0| 0 0 | 58 100
|
|
|
|
|
|
|
|
|
|
|
Percent reported |
.0| 100.0| 100.0| 100.0| 100.0 |
.0|
.0|
.0|
.0|
.0 | 100.0
|
|
|
|
|
|
|
|
|
|
|
|
|
|
|
|
|
|
|
|
|
|
UNKNOWN
|0|0|0|0|0
|0|0|0|0|0
|0
------------------------------------------------------------------------------------------------------------------------------------
Total
| 0 | 3 | 17 | 38 | 58
|0|0|0|0|0
| 58
Page 30 Run 12/21/01
Georgia Department of Corrections Office of Planning and Analysis
Inmate statistical profile
Sample: ACTIVE JUVENILE PRISONERS EXCLUDING JAILS
Requestor: Statistics
Active inmates 12/21/2001
Release Type by current age & sex
|
MEN
|
WOMEN
|
| Age | Age | Age | Age | Men
| Age | Age | Age | Age |Women
|Grand
Release Type
|13-14 %|15-15 %|16-16 %|17-17 %|Total % |13-14 %|15-15 %|16-16 %|17-17 %|Total % |Total %
------------------------------------------------------------------------------------------------------------------------------------
Active
| 0 0| 3 100| 17 100| 38 100| 58 100 | 0 0| 0 0| 0 0| 0 0| 0 0 | 58 100
------------------------------------------------------------------------------------------------------------------------------------
Total
| 0 | 3 | 17 | 38 | 58
|0|0|0|0|0
| 58
Page 31 Run 12/21/01
Georgia Department of Corrections Office of Planning and Analysis
Inmate statistical profile
Sample: ACTIVE JUVENILE PRISONERS EXCLUDING JAILS
Requestor: Statistics
Active inmates 12/21/2001
Inst By Group by current age & sex
|
MEN
|
WOMEN
|
| Age | Age | Age | Age | Men
| Age | Age | Age | Age |Women
|Grand
Inst By Group
|13-14 %|15-15 %|16-16 %|17-17 %|Total % |13-14 %|15-15 %|16-16 %|17-17 %|Total % |Total %
------------------------------------------------------------------------------------------------------------------------------------
County jails
| 0 0| 0 0| 0 0| 0 0| 0 0 | 0 0| 0 0| 0 0| 0 0| 0 0 | 0 0
Transitional centers| 0 0| 0 0| 0 0| 0 0| 0 0 | 0 0| 0 0| 0 0| 0 0| 0 0 | 0 0
County camps
| 0 0| 0 0| 0 0| 0 0| 0 0 | 0 0| 0 0| 0 0| 0 0| 0 0 | 0 0
Inmate boot camps | 0 0| 0 0| 0 0| 0 0| 0 0 | 0 0| 0 0| 0 0| 0 0| 0 0 | 0 0
State prisons
| 0 0| 3 100| 17 100| 38 100| 58 100 | 0 0| 0 0| 0 0| 0 0| 0 0 | 58 100
Private prisons
| 0 0| 0 0| 0 0| 0 0| 0 0 | 0 0| 0 0| 0 0| 0 0| 0 0 | 0 0
Other
| 0 0| 0 0| 0 0| 0 0| 0 0 | 0 0| 0 0| 0 0| 0 0| 0 0 | 0 0
------------------------------------------------------------------------------------------------------------------------------------
Total reported
| 0 0| 3 100| 17 100| 38 100| 58 100 | 0 0| 0 0| 0 0| 0 0| 0 0 | 58 100
|
|
|
|
|
|
|
|
|
|
|
Percent reported |
.0| 100.0| 100.0| 100.0| 100.0 |
.0|
.0|
.0|
.0|
.0 | 100.0
|
|
|
|
|
|
|
|
|
|
|
|
|
|
|
|
|
|
|
|
|
|
Not reported
|0|0|0|0|0
|0|0|0|0|0
|0
------------------------------------------------------------------------------------------------------------------------------------
Total
| 0 | 3 | 17 | 38 | 58
|0|0|0|0|0
| 58
Page 32 Run 12/21/01
Georgia Department of Corrections Office of Planning and Analysis
Inmate statistical profile
Sample: ACTIVE JUVENILE PRISONERS EXCLUDING JAILS
Requestor: Statistics
Active inmates 12/21/2001
Institution by current age & sex
|
MEN
|
WOMEN
|
| Age | Age | Age | Age | Men
| Age | Age | Age | Age |Women
|Grand
Institution
|13-14 %|15-15 %|16-16 %|17-17 %|Total % |13-14 %|15-15 %|16-16 %|17-17 %|Total % |Total %
------------------------------------------------------------------------------------------------------------------------------------
Phillips Prison
| 0 0| 0 0| 0 0| 1 3| 1 2 | 0 0| 0 0| 0 0| 0 0| 0 0 | 1 2
Arrendale Prison | 0 0| 3 100| 17 100| 37 97| 57 98 | 0 0| 0 0| 0 0| 0 0| 0 0 | 57 98
------------------------------------------------------------------------------------------------------------------------------------
Total reported
| 0 0| 3 100| 17 100| 38 100| 58 100 | 0 0| 0 0| 0 0| 0 0| 0 0 | 58 100
|
|
|
|
|
|
|
|
|
|
|
Percent reported |
.0| 100.0| 100.0| 100.0| 100.0 |
.0|
.0|
.0|
.0|
.0 | 100.0
|
|
|
|
|
|
|
|
|
|
|
|
|
|
|
|
|
|
|
|
|
|
Not Reported
|0|0|0|0|0
|0|0|0|0|0
|0
------------------------------------------------------------------------------------------------------------------------------------
Total
| 0 | 3 | 17 | 38 | 58
|0|0|0|0|0
| 58
Page 33 Run 12/21/01
Georgia Department of Corrections Office of Planning and Analysis
Inmate statistical profile
Sample: ACTIVE JUVENILE PRISONERS EXCLUDING JAILS
Requestor: Statistics
Active inmates 12/21/2001
Misdemeanors And Felonies by current age & sex
|
MEN
|
WOMEN
|
| Age | Age | Age | Age | Men
| Age | Age | Age | Age |Women
|Grand
Crime Type
|13-14 %|15-15 %|16-16 %|17-17 %|Total % |13-14 %|15-15 %|16-16 %|17-17 %|Total % |Total %
------------------------------------------------------------------------------------------------------------------------------------
MISDEMEANOR
| 0 0| 0 0| 0 0| 0 0| 0 0 | 0 0| 0 0| 0 0| 0 0| 0 0 | 0 0
FELONY
| 0 0| 3 100| 17 100| 38 100| 58 100 | 0 0| 0 0| 0 0| 0 0| 0 0 | 58 100
------------------------------------------------------------------------------------------------------------------------------------
Total reported
| 0 0| 3 100| 17 100| 38 100| 58 100 | 0 0| 0 0| 0 0| 0 0| 0 0 | 58 100
|
|
|
|
|
|
|
|
|
|
|
Percent reported |
.0| 100.0| 100.0| 100.0| 100.0 |
.0|
.0|
.0|
.0|
.0 | 100.0
|
|
|
|
|
|
|
|
|
|
|
|
|
|
|
|
|
|
|
|
|
|
NOT REPORTED
|0|0|0|0|0
|0|0|0|0|0
|0
------------------------------------------------------------------------------------------------------------------------------------
Total
| 0 | 3 | 17 | 38 | 58
|0|0|0|0|0
| 58
Page 34 Run 12/21/01
Georgia Department of Corrections Office of Planning and Analysis
Inmate statistical profile
Sample: ACTIVE JUVENILE PRISONERS EXCLUDING JAILS
Requestor: Statistics
Active inmates 12/21/2001
Crimes By Group by current age & sex
|
MEN
|
WOMEN
|
| Age | Age | Age | Age | Men
| Age | Age | Age | Age |Women
|Grand
Crimes By Group
|13-14 %|15-15 %|16-16 %|17-17 %|Total % |13-14 %|15-15 %|16-16 %|17-17 %|Total % |Total %
------------------------------------------------------------------------------------------------------------------------------------
HOMICIDE
| 0 0| 0 0| 0 0| 6 16| 6 10 | 0 0| 0 0| 0 0| 0 0| 0 0 | 6 10
ABORTION
| 0 0| 0 0| 0 0| 0 0| 0 0 | 0 0| 0 0| 0 0| 0 0| 0 0 | 0 0
BODILY INJRY&REL OFF| 0 0| 0 0| 1 6| 5 13| 6 10 | 0 0| 0 0| 0 0| 0 0| 0 0 | 6 10
ARSON & REL OFF
| 0 0| 0 0| 0 0| 0 0| 0 0 | 0 0| 0 0| 0 0| 0 0| 0 0 | 0 0
DAMAGE OF PROPERTY | 0 0| 0 0| 0 0| 0 0| 0 0 | 0 0| 0 0| 0 0| 0 0| 0 0 | 0 0
BURGLARY & REL OFF | 0 0| 0 0| 0 0| 0 0| 0 0 | 0 0| 0 0| 0 0| 0 0| 0 0 | 0 0
FORGERY & REL OFF | 0 0| 0 0| 0 0| 0 0| 0 0 | 0 0| 0 0| 0 0| 0 0| 0 0 | 0 0
THEFT
| 0 0| 0 0| 0 0| 0 0| 0 0 | 0 0| 0 0| 0 0| 0 0| 0 0 | 0 0
ROBBERY
| 0 0| 1 33| 14 82| 22 58| 37 64 | 0 0| 0 0| 0 0| 0 0| 0 0 | 37 64
SEXUAL OFFENSES
| 0 0| 2 67| 2 12| 5 13| 9 16 | 0 0| 0 0| 0 0| 0 0| 0 0 | 9 16
OBSCENITY CRIMES | 0 0| 0 0| 0 0| 0 0| 0 0 | 0 0| 0 0| 0 0| 0 0| 0 0 | 0 0
TREASON & REL OFF | 0 0| 0 0| 0 0| 0 0| 0 0 | 0 0| 0 0| 0 0| 0 0| 0 0 | 0 0
CRIMES INVOLVNG GOVT| 0 0| 0 0| 0 0| 0 0| 0 0 | 0 0| 0 0| 0 0| 0 0| 0 0 | 0 0
FALSIFICATIONS
| 0 0| 0 0| 0 0| 0 0| 0 0 | 0 0| 0 0| 0 0| 0 0| 0 0 | 0 0
OBSTRUCT LAW ENFORCE| 0 0| 0 0| 0 0| 0 0| 0 0 | 0 0| 0 0| 0 0| 0 0| 0 0 | 0 0
DISORDERLY CONDUCT | 0 0| 0 0| 0 0| 0 0| 0 0 | 0 0| 0 0| 0 0| 0 0| 0 0 | 0 0
GAMBLING & REL OFF | 0 0| 0 0| 0 0| 0 0| 0 0 | 0 0| 0 0| 0 0| 0 0| 0 0 | 0 0
CRUELTY TO CHILDREN | 0 0| 0 0| 0 0| 0 0| 0 0 | 0 0| 0 0| 0 0| 0 0| 0 0 | 0 0
CRIMES WITH GUNS | 0 0| 0 0| 0 0| 0 0| 0 0 | 0 0| 0 0| 0 0| 0 0| 0 0 | 0 0
INVASION PRIVACY | 0 0| 0 0| 0 0| 0 0| 0 0 | 0 0| 0 0| 0 0| 0 0| 0 0 | 0 0
RACKETEERING
| 0 0| 0 0| 0 0| 0 0| 0 0 | 0 0| 0 0| 0 0| 0 0| 0 0 | 0 0
DRUG ABUSE OFFENSES | 0 0| 0 0| 0 0| 0 0| 0 0 | 0 0| 0 0| 0 0| 0 0| 0 0 | 0 0
DRUG TRAFFICKING | 0 0| 0 0| 0 0| 0 0| 0 0 | 0 0| 0 0| 0 0| 0 0| 0 0 | 0 0
AUTO CRIMES
| 0 0| 0 0| 0 0| 0 0| 0 0 | 0 0| 0 0| 0 0| 0 0| 0 0 | 0 0
REVENUE & CONTRABAND| 0 0| 0 0| 0 0| 0 0| 0 0 | 0 0| 0 0| 0 0| 0 0| 0 0 | 0 0
CRIMES OF OTH STATES| 0 0| 0 0| 0 0| 0 0| 0 0 | 0 0| 0 0| 0 0| 0 0| 0 0 | 0 0
MISC. FELONIES
| 0 0| 0 0| 0 0| 0 0| 0 0 | 0 0| 0 0| 0 0| 0 0| 0 0 | 0 0
MISDEMEANORS
| 0 0| 0 0| 0 0| 0 0| 0 0 | 0 0| 0 0| 0 0| 0 0| 0 0 | 0 0
------------------------------------------------------------------------------------------------------------------------------------
Total reported
| 0 0| 3 100| 17 100| 38 100| 58 100 | 0 0| 0 0| 0 0| 0 0| 0 0 | 58 100
|
|
|
|
|
|
|
|
|
|
|
Percent reported |
.0| 100.0| 100.0| 100.0| 100.0 |
.0|
.0|
.0|
.0|
.0 | 100.0
|
|
|
|
|
|
|
|
|
|
|
|
|
|
|
|
|
|
|
|
|
|
NOT REPORTED
|0|0|0|0|0
|0|0|0|0|0
|0
------------------------------------------------------------------------------------------------------------------------------------
Total
| 0 | 3 | 17 | 38 | 58
|0|0|0|0|0
| 58
Page 35 Run 12/21/01
Georgia Department of Corrections Office of Planning and Analysis
Inmate statistical profile
Sample: ACTIVE JUVENILE PRISONERS EXCLUDING JAILS
Requestor: Statistics
Active inmates 12/21/2001
Most Serious Offense by current age & sex
|
MEN
|
WOMEN
|
| Age | Age | Age | Age | Men
| Age | Age | Age | Age |Women
|Grand
Most Serious Offense|13-14 %|15-15 %|16-16 %|17-17 %|Total % |13-14 %|15-15 %|16-16 %|17-17 %|Total % |Total %
------------------------------------------------------------------------------------------------------------------------------------
Misdemeanors
|
|
|
------------------------------------------------------------------------------------------------------------------------------------
------------------------------------------------------------------------------------------------------------------------------------
------------------------------------------------------------------------------------------------------------------------------------
FELONIES
|
|
|
------------------------------------------------------------------------------------------------------------------------------------
------------------------------------------------------------------------------------------------------------------------------------
MURDER
| 0 0| 0 0| 0 0| 4 11| 4 7 | 0 0| 0 0| 0 0| 0 0| 0 0 | 4 7
VOLUNTARY MANSLAUGHT| 0 0| 0 0| 0 0| 2 5| 2 3 | 0 0| 0 0| 0 0| 0 0| 0 0 | 2 3
KIDNAPPING
| 0 0| 0 0| 1 6| 5 13| 6 10 | 0 0| 0 0| 0 0| 0 0| 0 0 | 6 10
ARMED ROBBERY
| 0 0| 1 33| 14 82| 22 58| 37 64 | 0 0| 0 0| 0 0| 0 0| 0 0 | 37 64
RAPE
| 0 0| 2 67| 1 6| 5 13| 8 14 | 0 0| 0 0| 0 0| 0 0| 0 0 | 8 14
AGGRAV CHILD MOLESTA| 0 0| 0 0| 1 6| 0 0| 1 2 | 0 0| 0 0| 0 0| 0 0| 0 0 | 1 2
NONPYMT AGR NVL STOR| 0 0| 1 33| 5 29| 11 29| 17 29 | 0 0| 0 0| 0 0| 0 0| 0 0 | 17 29
CRMNL SOLICITATION | 0 0| 2 67| 12 71| 27 71| 41 71 | 0 0| 0 0| 0 0| 0 0| 0 0 | 41 71
------------------------------------------------------------------------------------------------------------------------------------
Total reported
| 0 0| 6 100| 34 100| 76 100| 116 100 | 0 0| 0 0| 0 0| 0 0| 0 0 | 116 100
|
|
|
|
|
|
|
|
|
|
|
Percent reported |
.0| 100.0| 100.0| 100.0| 100.0 |
.0|
.0|
.0|
.0|
.0 | 100.0
|
|
|
|
|
|
|
|
|
|
|
|
|
|
|
|
|
|
|
|
|
|
NOT REPORTED
|0|0|0|0|0
|0|0|0|0|0
|0
------------------------------------------------------------------------------------------------------------------------------------
Total
| 0 | 3 | 17 | 38 | 58
|0|0|0|0|0
| 58
Page 36 Run 12/21/01
Georgia Department of Corrections Office of Planning and Analysis
Inmate statistical profile
Sample: ACTIVE JUVENILE PRISONERS EXCLUDING JAILS
Requestor: Statistics
Active inmates 12/21/2001
Most Serious Crime Type by current age & sex
|
MEN
|
WOMEN
|
| Age | Age | Age | Age | Men
| Age | Age | Age | Age |Women
|Grand
Crime Type
|13-14 %|15-15 %|16-16 %|17-17 %|Total % |13-14 %|15-15 %|16-16 %|17-17 %|Total % |Total %
------------------------------------------------------------------------------------------------------------------------------------
VIOL/PERSN
| 0 0| 1 33| 15 88| 33 87| 49 84 | 0 0| 0 0| 0 0| 0 0| 0 0 | 49 84
NVIOL/PERS
| 0 0| 0 0| 0 0| 0 0| 0 0 | 0 0| 0 0| 0 0| 0 0| 0 0 | 0 0
PROPERTY
| 0 0| 0 0| 0 0| 0 0| 0 0 | 0 0| 0 0| 0 0| 0 0| 0 0 | 0 0
DRUG SALES
| 0 0| 0 0| 0 0| 0 0| 0 0 | 0 0| 0 0| 0 0| 0 0| 0 0 | 0 0
DRUG POSSN
| 0 0| 0 0| 0 0| 0 0| 0 0 | 0 0| 0 0| 0 0| 0 0| 0 0 | 0 0
ALCOHOL
| 0 0| 0 0| 0 0| 0 0| 0 0 | 0 0| 0 0| 0 0| 0 0| 0 0 | 0 0
HABIT/DUI
| 0 0| 0 0| 0 0| 0 0| 0 0 | 0 0| 0 0| 0 0| 0 0| 0 0 | 0 0
SEX OFFEND
| 0 0| 2 67| 2 12| 5 13| 9 16 | 0 0| 0 0| 0 0| 0 0| 0 0 | 9 16
OTHER
| 0 0| 0 0| 0 0| 0 0| 0 0 | 0 0| 0 0| 0 0| 0 0| 0 0 | 0 0
------------------------------------------------------------------------------------------------------------------------------------
Total reported
| 0 0| 3 100| 17 100| 38 100| 58 100 | 0 0| 0 0| 0 0| 0 0| 0 0 | 58 100
|
|
|
|
|
|
|
|
|
|
|
Percent reported |
.0| 100.0| 100.0| 100.0| 100.0 |
.0|
.0|
.0|
.0|
.0 | 100.0
|
|
|
|
|
|
|
|
|
|
|
|
|
|
|
|
|
|
|
|
|
|
NOT REPORTED
|0|0|0|0|0
|0|0|0|0|0
|0
------------------------------------------------------------------------------------------------------------------------------------
Total
| 0 | 3 | 17 | 38 | 58
|0|0|0|0|0
| 58