- Collection:
- Georgia Government Publications
- Title:
- Inmate statistical profile: all active inmates, 2001-06
- Creator:
- Georgia. Department of Corrections. Planning and Analysis Section
- Publisher:
- Atlanta, GA. : Georgia Dept. of Corrections, Office of Planning and Analysis, 2001-06
- Date of Original:
- 2001-06
- Subject:
- Prisoners--Georgia
- Location:
- United States, Georgia, 32.75042, -83.50018
- Medium:
- state government records
- Type:
- Text
- Format:
- application/pdf
- Description:
- Title from issue list screen (GALILEO, viewed Feb. 24, 2010)
- External Identifiers:
- Call Number GA R300.P5 P1 I5 2001/6
- Metadata URL:
- https://dlg.galileo.usg.edu/id:dlg_ggpd_i-ga-br300-pp5-bp1-bi5-b2001-s6-belec-p-btext
- Digital Object URL:
- https://dlg.galileo.usg.edu/do:dlg_ggpd_i-ga-br300-pp5-bp1-bi5-b2001-s6-belec-p-btext
- Language:
- eng
- Holding Institution:
- University of Georgia. Map and Government Information Library
- Rights:
-

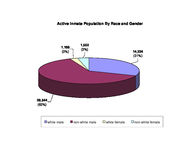
Active Inmate Population By Race and Gender
1,188 (3%)
1,552 (3%)
14,224 (31%)
28,544 (63%)
white male
non-white male
white female
non-white female
6,439 (14%)
Active Inmates By Security Status
803 (2%)
1,985 (4%)
2,498 (5%)
16,077 (35%)
17,705 (39%)
trusty
minimum
medium
close maximum diagnostic
Active Inmates Prison Sentence In Years
Years
LWOP Death
Life 20.1-Over
15.1-20 12.1-15 10.1-12
9.1-10 8.1-9 7.1-8 6.1-7 5.1-6 4.1-5 3.1-4 2.1-3 1.1-2 0-1
243, (1%) 128, (<1%)
2,735 (6%)
518 (1%)
1,663 (4%) 1,715 (4%) 1,634 (4%)
1,738 (4%) 1,571 (3%)
1,910 (4%) 1,679 (4%) 575 (1%)
4,495 (10%)
6,007 (13%) 6,234 (14%)
7,262 (16%)
5,319 (12%)
0
1000
2000
3000
4000
5000
6000
7000
8000
Number of Inmates
Active Inmates Who Have Probation To Follow Prison
14,090 (31%)
31,418 (69%)
Probation to follow No Probation
Number of Inmates
Active Inmates Grouped By Institution
40000 35000
35,281 (78%)
30000
25000
20000
15000
10000
5000
915
(2%)
0
transitional centers
3,920 (9%)
county camps
781 (2%)
inmate boot camps
state prisons
4,578 (10%)
private prisons
Active Inmates By Most Serious Crime Type
592 (1%)
3,469 (8%)
5,729 (13%)
1,560 (3%)
19,798 (44%)
4,188 (9%)
10,054 (22%)
viol/person drug poss
nonviol/person habit/dui
37 (<1%)
property sex offend
drug sales other
Georgia Department of Corrections
Page 1 Run 06/18/01
Office of Planning and Analysis
Inmate statistical profile TABLE OF CONTENTS FOR ACTIVE PRISONERS EXCLUDING JAIL
Title
PAGE
-----
----
RACE AND SEX............................ 2
Culture Fair IQ Scores.................. 3
Self-Rpt Socioeconomic Class............ 4
Self-Rpt Environment To Age 16.......... 5
Self-Rpt Education Level................ 6
Functional Reading Level (WRAT Scores).. 7
Functional Math Level (WRAT Scores)..... 8
Functional Spelling Level (WRAT Scores). 9
Self-Rpt Guardian Status To Age 16......10
Self-Rpt Employment Status Before Prison11
Self-Rpt Marital Status At Admission....12
Self-Rpt Number Of Children At Admission13
Self-Rpt Religious Affiliation..........14
Self-Rpt Family Behavior Patterns *.....15
Inmate Diagnostic Behavior Problem *....16
Physical Profile (General Condition)....17
Security Status.........................18
Number Of Sentences.....................19
Number Of Disciplinaries................20
Number Of Escapes.......................21
Number Of Prior Georgia Incarcerations *22
Number Of Transfers.....................23
County Of Conviction....................24
Circ Of Conviction......................29
Home County.............................31
Prison Sentence In Years................36
Probation To Follow Prison..............37
Admission Type..........................38
Release Type............................39
Inst By Group...........................40
Institution.............................41
Misdemeanors And Felonies...............44
Crimes By Group.........................45
Most Serious Offense....................46
Most Serious Crime Type.................53
Georgia Department of Corrections
Page 2 Run 06/18/01
Office of Planning and Analysis
Inmate statistical profile
Sample: ACTIVE PRISONERS EXCLUDING JAIL Active inmates 06/18/2001
Requestor: Statistics RACE AND SEX by current age & sex
|
MEN
|
WOMEN
|
| Age | Age | Age | Age | Men
| Age | Age | Age | Age |Women
|Grand
RACE AND SEX
|00-21 %|22-39 %|40-54 %|55-99 %|Total % |00-21 %|22-39 %|40-54 %|55-99 %|Total % |Total %
------------------------------------------------------------------------------------------------------------------------------------
WHITE MALE
| 1005 27| 7990 30| 4305 39| 924 56|14224 33 | 0 0| 0 0| 0 0| 0 0| 0 0 |14224 31
NON WHITE MALE
| 2732 73|18279 70| 6819 61| 714 44|28544 67 | 0 0| 0 0| 0 0| 0 0| 0 0 |28544 63
WHITE FEMALE
| 0 0| 0 0| 0 0| 0 0| 0 0 | 74 46| 760 43| 317 43| 37 56| 1188 43 | 1188 3
NON WHITE FEMALE | 0 0| 0 0| 0 0| 0 0| 0 0 | 86 54| 1022 57| 415 57| 29 44| 1552 57 | 1552 3
------------------------------------------------------------------------------------------------------------------------------------
Total reported
| 3737 100|26269 100|11124 100| 1638 100|42768 100 | 160 100| 1782 100| 732 100| 66 100| 2740 100 |45508 100
|
|
|
|
|
|
|
|
|
|
|
Percent reported | 100.0| 100.0| 100.0| 100.0| 100.0 | 100.0| 100.0| 100.0| 100.0| 100.0 | 100.0
|
|
|
|
|
|
|
|
|
|
|
|
|
|
|
|
|
|
|
|
|
|
NOT REPORTED
|0|0|0|0|0
|0|0|0|0|0
|0
------------------------------------------------------------------------------------------------------------------------------------
Total
| 3737 |26269 |11124 | 1638 |42768
| 160 | 1782 | 732 | 66 | 2740
|45508
|
|
|
|
|
|
|
|
|
|
|
|
|
|
|
|
|
|
|
|
|
|
|
|
|
|
|
|
|
|
|
|
|
|
|
|
|
|
|
|
|
|
|
|
|
|
|
|
|
|
|
|
|
|
|
AVERAGE AGE
| 19.93 | 30.22 | 45.08 | 60.65 | 34.35 | 19.99 | 31.38 | 44.70 | 59.77 | 34.96 | 34.38
Page 3 Run 06/18/01
Georgia Department of Corrections Office of Planning and Analysis
Inmate statistical profile
Sample: ACTIVE PRISONERS EXCLUDING JAIL Active inmates 06/18/2001
Requestor: Statistics Culture Fair IQ Scores by current age & sex
|
MEN
|
WOMEN
|
| Age | Age | Age | Age | Men
| Age | Age | Age | Age |Women
|Grand
IQ Score
|00-21 %|22-39 %|40-54 %|55-99 %|Total % |00-21 %|22-39 %|40-54 %|55-99 %|Total % |Total %
------------------------------------------------------------------------------------------------------------------------------------
LESS THAN 70
| 91 3| 979 4| 838 8| 112 8| 2020 5 | 4 3| 188 11| 172 25| 22 36| 386 15 | 2406 6
70 AND UP
| 3510 97|24260 96| 9694 92| 1373 92|38837 95 | 145 97| 1496 89| 521 75| 39 64| 2201 85 |41038 94
------------------------------------------------------------------------------------------------------------------------------------
Total reported
| 3601 100|25239 100|10532 100| 1485 100|40857 100 | 149 100| 1684 100| 693 100| 61 100| 2587 100 |43444 100
|
|
|
|
|
|
|
|
|
|
|
Percent reported |
96.4|
96.1|
94.7|
90.7|
95.5 |
93.1|
94.5|
94.7|
92.4|
94.4 |
95.5
|
|
|
|
|
|
|
|
|
|
|
|
|
|
|
|
|
|
|
|
|
|
NOT REPORTED
| 136 | 1030 | 592 | 153 | 1911
| 11 | 98 | 39 | 5 | 153
| 2064
------------------------------------------------------------------------------------------------------------------------------------
Total
| 3737 |26269 |11124 | 1638 |42768
| 160 | 1782 | 732 | 66 | 2740
|45508
|
|
|
|
|
|
|
|
|
|
|
|
|
|
|
|
|
|
|
|
|
|
|
|
|
|
|
|
|
|
|
|
|
|
|
|
|
|
|
|
|
|
|
|
|
|
|
|
|
|
|
|
|
|
|
AVERAGE IQ
| 100.54 | 100.06 | 96.16 | 93.68 | 98.87 | 97.76 | 93.74 | 84.72 | 78.62 | 91.20 | 98.41
Page 4 Run 06/18/01
Georgia Department of Corrections Office of Planning and Analysis
Inmate statistical profile
Sample: ACTIVE PRISONERS EXCLUDING JAIL
Requestor: Statistics
Active inmates 06/18/2001
Self-Rpt Socioeconomic Class by current age & sex
|
MEN
|
WOMEN
|
| Age | Age | Age | Age | Men
| Age | Age | Age | Age |Women
|Grand
Socioeconomic Class |00-21 %|22-39 %|40-54 %|55-99 %|Total % |00-21 %|22-39 %|40-54 %|55-99 %|Total % |Total %
------------------------------------------------------------------------------------------------------------------------------------
WELFARE
| 289 8| 1971 8| 716 7| 80 5| 3056 7 | 28 18| 289 17| 74 10| 1 2| 392 15 | 3448 8
OCC EMPLOY
| 316 9| 2128 8| 533 5| 44 3| 3021 7 | 1 1| 11 1| 4 1| 2 3| 18 1 | 3039 7
MINIMUM STD
| 1596 46|10293 41| 4578 43| 746 48|17213 42 | 43 28| 571 33| 289 40| 33 53| 936 35 |18149 42
MIDDLE
| 1249 36|10728 42| 4797 45| 659 43|17433 42 | 81 52| 830 48| 333 47| 24 39| 1268 47 |18701 43
OTHER
| 23 1| 201 1| 84 1| 18 1| 326 1 | 3 2| 37 2| 14 2| 2 3| 56 2 | 382 1
------------------------------------------------------------------------------------------------------------------------------------
Total reported
| 3473 100|25321 100|10708 100| 1547 100|41049 100 | 156 100| 1738 100| 714 100| 62 100| 2670 100 |43719 100
|
|
|
|
|
|
|
|
|
|
|
Percent reported |
92.9|
96.4|
96.3|
94.4|
96.0 |
97.5|
97.5|
97.5|
93.9|
97.4 |
96.1
|
|
|
|
|
|
|
|
|
|
|
|
|
|
|
|
|
|
|
|
|
|
NOT RPTD
| 264 | 948 | 416 | 91 | 1719
| 4 | 44 | 18 | 4 | 70
| 1789
------------------------------------------------------------------------------------------------------------------------------------
Total
| 3737 |26269 |11124 | 1638 |42768
| 160 | 1782 | 732 | 66 | 2740
|45508
Page 5 Run 06/18/01
Georgia Department of Corrections Office of Planning and Analysis
Inmate statistical profile
Sample: ACTIVE PRISONERS EXCLUDING JAIL
Requestor: Statistics
Active inmates 06/18/2001
Self-Rpt Environment To Age 16 by current age & sex
|
MEN
|
WOMEN
|
| Age | Age | Age | Age | Men
| Age | Age | Age | Age |Women
|Grand
Environment
|00-21 %|22-39 %|40-54 %|55-99 %|Total % |00-21 %|22-39 %|40-54 %|55-99 %|Total % |Total %
------------------------------------------------------------------------------------------------------------------------------------
RURAL/FARM
| 35 1| 588 2| 706 6| 289 18| 1618 4 | 0 0| 65 4| 51 7| 10 17| 126 5 | 1744 4
RURAL/NFARM
| 98 3| 1520 6| 733 7| 126 8| 2477 6 | 27 17| 199 11| 53 7| 5 8| 284 11 | 2761 6
S.M.S.A
| 1297 36| 9189 36| 3729 34| 426 27|14641 35 | 25 16| 285 16| 134 19| 13 22| 457 17 |15098 34
URBAN
| 824 23| 4736 18| 1823 17| 187 12| 7570 18 | 54 35| 558 32| 245 34| 14 23| 871 33 | 8441 19
SMALL TOWN
| 1355 37| 9523 37| 3812 35| 536 34|15226 36 | 48 31| 623 36| 228 32| 16 27| 915 34 |16141 36
OTHER
| 18 0| 143 1| 60 1| 6 0| 227 1 | 1 1| 13 1| 5 1| 2 3| 21 1 | 248 1
------------------------------------------------------------------------------------------------------------------------------------
Total reported
| 3627 100|25699 100|10863 100| 1570 100|41759 100 | 155 100| 1743 100| 716 100| 60 100| 2674 100 |44433 100
|
|
|
|
|
|
|
|
|
|
|
Percent reported |
97.1|
97.8|
97.7|
95.8|
97.6 |
96.9|
97.8|
97.8|
90.9|
97.6 |
97.6
|
|
|
|
|
|
|
|
|
|
|
|
|
|
|
|
|
|
|
|
|
|
NOT RPTD
| 110 | 570 | 261 | 68 | 1009
| 5 | 39 | 16 | 6 | 66
| 1075
------------------------------------------------------------------------------------------------------------------------------------
Total
| 3737 |26269 |11124 | 1638 |42768
| 160 | 1782 | 732 | 66 | 2740
|45508
Page 6 Run 06/18/01
Georgia Department of Corrections Office of Planning and Analysis
Inmate statistical profile
Sample: ACTIVE PRISONERS EXCLUDING JAIL Active inmates 06/18/2001
Requestor: Statistics Self-Rpt Education Level by current age & sex
|
MEN
|
WOMEN
|
| Age | Age | Age | Age | Men
| Age | Age | Age | Age |Women
|Grand
Education Level
|00-21 %|22-39 %|40-54 %|55-99 %|Total % |00-21 %|22-39 %|40-54 %|55-99 %|Total % |Total %
------------------------------------------------------------------------------------------------------------------------------------
LESS THAN GRADE 7 | 54 1| 462 2| 465 4| 308 19| 1289 3 | 0 0| 22 1| 20 3| 9 14| 51 2 | 1340 3
GRADE 7
| 103 3| 595 2| 370 3| 130 8| 1198 3 | 5 3| 49 3| 14 2| 2 3| 70 3 | 1268 3
GRADE 8
| 488 13| 2120 8| 967 9| 167 11| 3742 9 | 23 15| 140 8| 54 8| 6 10| 223 8 | 3965 9
GRADE 9
| 905 25| 4005 16| 1315 12| 152 10| 6377 15 | 33 21| 247 14| 67 10| 4 6| 351 13 | 6728 15
GRADE 10
| 1060 29| 5644 22| 1768 16| 164 10| 8636 21 | 35 23| 305 18| 89 13| 11 17| 440 17 | 9076 20
GRADE 11
| 765 21| 5228 20| 1443 13| 128 8| 7564 18 | 34 22| 277 16| 98 14| 6 10| 415 16 | 7979 18
GRADE 12
| 218 6| 5229 20| 2667 25| 303 19| 8417 20 | 15 10| 281 16| 156 22| 11 17| 463 18 | 8880 20
MORE THAN GRADE 12 | 36 1| 2477 10| 1887 17| 231 15| 4631 11 | 10 6| 399 23| 202 29| 14 22| 625 24 | 5256 12
------------------------------------------------------------------------------------------------------------------------------------
Total reported
| 3629 100|25760 100|10882 100| 1583 100|41854 100 | 155 100| 1720 100| 700 100| 63 100| 2638 100 |44492 100
|
|
|
|
|
|
|
|
|
|
|
Percent reported |
97.1|
98.1|
97.8|
96.6|
97.9 |
96.9|
96.5|
95.6|
95.5|
96.3 |
97.8
|
|
|
|
|
|
|
|
|
|
|
|
|
|
|
|
|
|
|
|
|
|
NOT REPORTED
| 108 | 509 | 242 | 55 | 914
| 5 | 62 | 32 | 3 | 102
| 1016
------------------------------------------------------------------------------------------------------------------------------------
Total
| 3737 |26269 |11124 | 1638 |42768
| 160 | 1782 | 732 | 66 | 2740
|45508
|
|
|
|
|
|
|
|
|
|
|
|
|
|
|
|
|
|
|
|
|
|
|
|
|
|
|
|
|
|
|
|
|
|
|
|
|
|
|
|
|
|
|
|
|
|
|
|
|
|
|
|
|
|
|
AVG EDUCATION LEVEL | 9.75 | 11.02 | 11.55 | 9.96 | 11.01 | 10.69 | 12.88 | 13.41 | 11.40 | 12.86 | 11.12
* NOTE: THE FIELD LABLED "LESS THAN GRADE 7" WAS CORRECTED IN MARCH 1989: MISSING DATA FOR INMATES STILL IN DIAGNOSTICS NOW HAS BEEN REMOVED FROM THIS FIELD AND IDENTIFIED AS "NOT REPORTED" INFORMATION.
Page 7 Run 06/18/01
Georgia Department of Corrections Office of Planning and Analysis
Inmate statistical profile
Sample: ACTIVE PRISONERS EXCLUDING JAIL
Requestor: Statistics
Active inmates 06/18/2001
Functional Reading Level (WRAT Scores) by current age & sex
|
MEN
|
WOMEN
|
| Age | Age | Age | Age | Men
| Age | Age | Age | Age |Women
|Grand
WRAT Reading Score |00-21 %|22-39 %|40-54 %|55-99 %|Total % |00-21 %|22-39 %|40-54 %|55-99 %|Total % |Total %
------------------------------------------------------------------------------------------------------------------------------------
LESS THAN GRADE 6 | 1422 39| 9750 39| 4756 45| 715 48|16643 41 | 31 21| 460 27| 211 30| 22 35| 724 28 |17367 40
6TH THRU 8TH GRADE | 803 22| 5637 22| 2242 21| 264 18| 8946 22 | 29 19| 303 18| 132 19| 13 21| 477 18 | 9423 22
GRADE 9
| 309 9| 2166 9| 710 7| 103 7| 3288 8 | 21 14| 135 8| 44 6| 6 10| 206 8 | 3494 8
GRADE 10
| 167 5| 1056 4| 368 4| 45 3| 1636 4 | 9 6| 61 4| 25 4| 3 5| 98 4 | 1734 4
GRADE 11
| 161 4| 992 4| 368 4| 46 3| 1567 4 | 4 3| 58 3| 38 5| 2 3| 102 4 | 1669 4
GRADE 12
| 476 13| 3670 15| 1574 15| 248 17| 5968 15 | 19 13| 141 8| 40 6| 5 8| 205 8 | 6173 14
MORE THAN GRADE 12 | 267 7| 2030 8| 482 5| 59 4| 2838 7 | 36 24| 525 31| 202 29| 11 18| 774 30 | 3612 8
------------------------------------------------------------------------------------------------------------------------------------
Total reported
| 3605 100|25301 100|10500 100| 1480 100|40886 100 | 149 100| 1683 100| 692 100| 62 100| 2586 100 |43472 100
|
|
|
|
|
|
|
|
|
|
|
Percent reported |
96.5|
96.3|
94.4|
90.4|
95.6 |
93.1|
94.4|
94.5|
93.9|
94.4 |
95.5
|
|
|
|
|
|
|
|
|
|
|
|
|
|
|
|
|
|
|
|
|
|
NOT REPORTED
| 132 | 968 | 624 | 158 | 1882
| 11 | 99 | 40 | 4 | 154
| 2036
------------------------------------------------------------------------------------------------------------------------------------
Total
| 3737 |26269 |11124 | 1638 |42768
| 160 | 1782 | 732 | 66 | 2740
|45508
|
|
|
|
|
|
|
|
|
|
|
|
|
|
|
|
|
|
|
|
|
|
|
|
|
|
|
|
|
|
|
|
|
|
|
|
|
|
|
|
|
|
|
|
|
|
|
|
|
|
|
|
|
|
|
AVG READING SCORE | 7.64 | 7.70 | 7.05 | 6.80 | 7.49 | 9.32 | 9.07 | 8.68 | 7.95 | 8.95 | 7.58
Page 8 Run 06/18/01
Georgia Department of Corrections Office of Planning and Analysis
Inmate statistical profile
Sample: ACTIVE PRISONERS EXCLUDING JAIL
Requestor: Statistics
Active inmates 06/18/2001
Functional Math Level (WRAT Scores) by current age & sex
|
MEN
|
WOMEN
|
| Age | Age | Age | Age | Men
| Age | Age | Age | Age |Women
|Grand
WRAT Math Score
|00-21 %|22-39 %|40-54 %|55-99 %|Total % |00-21 %|22-39 %|40-54 %|55-99 %|Total % |Total %
------------------------------------------------------------------------------------------------------------------------------------
LESS THAN GRADE 6 | 1187 33| 7785 31| 4355 41| 751 51|14078 34 | 32 21| 426 25| 259 37| 31 50| 748 29 |14826 34
6TH THRU 8TH GRADE | 1813 50|12443 49| 4118 39| 406 27|18780 46 | 77 52| 839 50| 279 40| 18 29| 1213 47 |19993 46
GRADE 9
| 306 8| 2255 9| 752 7| 103 7| 3416 8 | 20 13| 178 11| 47 7| 5 8| 250 10 | 3666 8
GRADE 10
| 161 4| 1349 5| 552 5| 77 5| 2139 5 | 12 8| 107 6| 46 7| 5 8| 170 7 | 2309 5
GRADE 11
| 71 2| 845 3| 355 3| 63 4| 1334 3 | 6 4| 70 4| 22 3| 3 5| 101 4 | 1435 3
GRADE 12
| 41 1| 444 2| 308 3| 62 4| 855 2 | 0 0| 23 1| 15 2| 0 0| 38 1 | 893 2
MORE THAN GRADE 12 | 26 1| 186 1| 69 1| 18 1| 299 1 | 2 1| 40 2| 25 4| 0 0| 67 3 | 366 1
------------------------------------------------------------------------------------------------------------------------------------
Total reported
| 3605 100|25307 100|10509 100| 1480 100|40901 100 | 149 100| 1683 100| 693 100| 62 100| 2587 100 |43488 100
|
|
|
|
|
|
|
|
|
|
|
Percent reported |
96.5|
96.3|
94.5|
90.4|
95.6 |
93.1|
94.4|
94.7|
93.9|
94.4 |
95.6
|
|
|
|
|
|
|
|
|
|
|
|
|
|
|
|
|
|
|
|
|
|
NOT REPORTED
| 132 | 962 | 615 | 158 | 1867
| 11 | 99 | 39 | 4 | 153
| 2020
------------------------------------------------------------------------------------------------------------------------------------
Total
| 3737 |26269 |11124 | 1638 |42768
| 160 | 1782 | 732 | 66 | 2740
|45508
|
|
|
|
|
|
|
|
|
|
|
|
|
|
|
|
|
|
|
|
|
|
|
|
|
|
|
|
|
|
|
|
|
|
|
|
|
|
|
|
|
|
|
|
|
|
|
|
|
|
|
|
|
|
|
AVG MATH SCORE
| 6.83 | 7.05 | 6.65 | 6.24 | 6.90 | 7.47 | 7.40 | 6.98 | 6.04 | 7.26 | 6.92
Page 9 Run 06/18/01
Georgia Department of Corrections Office of Planning and Analysis
Inmate statistical profile
Sample: ACTIVE PRISONERS EXCLUDING JAIL
Requestor: Statistics
Active inmates 06/18/2001
Functional Spelling Level (WRAT Scores) by current age & sex
|
MEN
|
WOMEN
|
| Age | Age | Age | Age | Men
| Age | Age | Age | Age |Women
|Grand
WRAT Spelling Score |00-21 %|22-39 %|40-54 %|55-99 %|Total % |00-21 %|22-39 %|40-54 %|55-99 %|Total % |Total %
------------------------------------------------------------------------------------------------------------------------------------
LESS THAN GRADE 6 | 1480 41|10991 43| 5847 56| 898 61|19216 47 | 30 20| 416 25| 220 32| 23 37| 689 27 |19905 46
6TH THRU 8TH GRADE | 1172 33| 7390 29| 2465 23| 294 20|11321 28 | 57 38| 532 32| 220 32| 23 37| 832 32 |12153 28
GRADE 9
| 296 8| 1866 7| 514 5| 64 4| 2740 7 | 20 13| 170 10| 47 7| 3 5| 240 9 | 2980 7
GRADE 10
| 287 8| 1735 7| 481 5| 58 4| 2561 6 | 21 14| 174 10| 50 7| 0 0| 245 9 | 2806 6
GRADE 11
| 133 4| 904 4| 259 2| 33 2| 1329 3 | 5 3| 92 5| 26 4| 3 5| 126 5 | 1455 3
GRADE 12
| 154 4| 1714 7| 722 7| 112 8| 2702 7 | 3 2| 79 5| 24 3| 1 2| 107 4 | 2809 6
MORE THAN GRADE 12 | 83 2| 701 3| 214 2| 20 1| 1018 2 | 13 9| 220 13| 106 15| 9 15| 348 13 | 1366 3
------------------------------------------------------------------------------------------------------------------------------------
Total reported
| 3605 100|25301 100|10502 100| 1479 100|40887 100 | 149 100| 1683 100| 693 100| 62 100| 2587 100 |43474 100
|
|
|
|
|
|
|
|
|
|
|
Percent reported |
96.5|
96.3|
94.4|
90.3|
95.6 |
93.1|
94.4|
94.7|
93.9|
94.4 |
95.5
|
|
|
|
|
|
|
|
|
|
|
|
|
|
|
|
|
|
|
|
|
|
NOT REPORTED
| 132 | 968 | 622 | 159 | 1881
| 11 | 99 | 39 | 4 | 153
| 2034
------------------------------------------------------------------------------------------------------------------------------------
Total
| 3737 |26269 |11124 | 1638 |42768
| 160 | 1782 | 732 | 66 | 2740
|45508
|
|
|
|
|
|
|
|
|
|
|
|
|
|
|
|
|
|
|
|
|
|
|
|
|
|
|
|
|
|
|
|
|
|
|
|
|
|
|
|
|
|
|
|
|
|
|
|
|
|
|
|
|
|
|
AVG SPELLING SCORE | 6.88 | 6.84 | 5.99 | 5.55 | 6.58 | 8.31 | 8.31 | 7.91 | 6.89 | 8.17 | 6.67
Page 10 Run 06/18/01
Georgia Department of Corrections Office of Planning and Analysis
Inmate statistical profile
Sample: ACTIVE PRISONERS EXCLUDING JAIL
Requestor: Statistics
Active inmates 06/18/2001
Self-Rpt Guardian Status To Age 16 by current age & sex
|
MEN
|
WOMEN
|
| Age | Age | Age | Age | Men
| Age | Age | Age | Age |Women
|Grand
Guardian Status
|00-21 %|22-39 %|40-54 %|55-99 %|Total % |00-21 %|22-39 %|40-54 %|55-99 %|Total % |Total %
------------------------------------------------------------------------------------------------------------------------------------
ORPHANAGE
| 3 0| 34 0| 21 0| 10 1| 68 0 | 0 0| 1 0| 2 0| 0 0| 3 0 | 71 0
FATHER ONLY
| 136 4| 663 3| 262 2| 27 2| 1088 3 | 4 3| 47 3| 18 3| 4 6| 73 3 | 1161 3
FTR MTR HD
| 233 6| 1486 6| 654 6| 75 5| 2448 6 | 6 4| 85 5| 37 5| 0 0| 128 5 | 2576 6
MOTHER ONLY
| 1889 52|11351 44| 3537 32| 345 22|17122 41 | 66 42| 690 39| 205 29| 18 29| 979 36 |18101 41
MTR FTR HD
| 786 22| 8185 32| 4861 45| 902 57|14734 35 | 47 30| 631 36| 352 49| 34 54| 1064 40 |15798 35
OTH FEMALE
| 76 2| 604 2| 287 3| 43 3| 1010 2 | 6 4| 49 3| 20 3| 3 5| 78 3 | 1088 2
OTH MALE
| 31 1| 86 0| 50 0| 7 0| 174 0 | 0 0| 4 0| 3 0| 0 0| 7 0 | 181 0
STEP-PARNTS
| 41 1| 457 2| 145 1| 23 1| 666 2 | 0 0| 5 0| 3 0| 0 0| 8 0 | 674 2
FOSTER HOME
| 42 1| 251 1| 125 1| 19 1| 437 1 | 5 3| 42 2| 9 1| 1 2| 57 2 | 494 1
GRAND PRNTS
| 336 9| 2145 8| 714 7| 106 7| 3301 8 | 19 12| 177 10| 58 8| 3 5| 257 10 | 3558 8
OTHER
| 72 2| 535 2| 241 2| 24 2| 872 2 | 3 2| 19 1| 8 1| 0 0| 30 1 | 902 2
------------------------------------------------------------------------------------------------------------------------------------
Total reported
| 3645 100|25797 100|10897 100| 1581 100|41920 100 | 156 100| 1750 100| 715 100| 63 100| 2684 100 |44604 100
|
|
|
|
|
|
|
|
|
|
|
Percent reported |
97.5|
98.2|
98.0|
96.5|
98.0 |
97.5|
98.2|
97.7|
95.5|
98.0 |
98.0
|
|
|
|
|
|
|
|
|
|
|
|
|
|
|
|
|
|
|
|
|
|
NOT RPTD
| 92 | 472 | 227 | 57 | 848
| 4 | 32 | 17 | 3 | 56
| 904
------------------------------------------------------------------------------------------------------------------------------------
Total
| 3737 |26269 |11124 | 1638 |42768
| 160 | 1782 | 732 | 66 | 2740
|45508
Page 11 Run 06/18/01
Georgia Department of Corrections Office of Planning and Analysis
Inmate statistical profile
Sample: ACTIVE PRISONERS EXCLUDING JAIL
Requestor: Statistics
Active inmates 06/18/2001
Self-Rpt Employment Status Before Prison by current age & sex
|
MEN
|
WOMEN
|
| Age | Age | Age | Age | Men
| Age | Age | Age | Age |Women
|Grand
Employment
|00-21 %|22-39 %|40-54 %|55-99 %|Total % |00-21 %|22-39 %|40-54 %|55-99 %|Total % |Total %
------------------------------------------------------------------------------------------------------------------------------------
FULL TIME
| 1032 30|13158 54| 5746 56| 637 44|20573 52 | 46 31| 647 41| 233 37| 17 30| 943 39 |21516 51
PART TIME
| 415 12| 2278 9| 665 6| 91 6| 3449 9 | 15 10| 106 7| 41 6| 1 2| 163 7 | 3612 9
UNEMPL < 6M
| 399 12| 3118 13| 1154 11| 146 10| 4817 12 | 17 12| 256 16| 104 16| 9 16| 386 16 | 5203 12
UNEMPL > 6M
| 381 11| 3773 15| 1909 19| 310 21| 6373 16 | 17 12| 265 17| 148 23| 16 28| 446 19 | 6819 16
NEVER WORKD
| 963 28| 1475 6| 106 1| 6 0| 2550 6 | 39 27| 187 12| 25 4| 4 7| 255 11 | 2805 7
STUDENT
| 180 5| 143 1| 15 0| 2 0| 340 1 | 11 7| 10 1| 4 1| 0 0| 25 1 | 365 1
INCAPABLE
| 21 1| 503 2| 723 7| 256 18| 1503 4 | 2 1| 94 6| 83 13| 10 18| 189 8 | 1692 4
OTHER
| 0 0| 0 0| 0 0| 0 0| 0 0 | 0 0| 0 0| 0 0| 0 0| 0 0 | 0 0
------------------------------------------------------------------------------------------------------------------------------------
Total reported
| 3391 100|24448 100|10318 100| 1448 100|39605 100 | 147 100| 1565 100| 638 100| 57 100| 2407 100 |42012 100
|
|
|
|
|
|
|
|
|
|
|
Percent reported |
90.7|
93.1|
92.8|
88.4|
92.6 |
91.9|
87.8|
87.2|
86.4|
87.8 |
92.3
|
|
|
|
|
|
|
|
|
|
|
|
|
|
|
|
|
|
|
|
|
|
NOT RPTD
| 346 | 1821 | 806 | 190 | 3163
| 13 | 217 | 94 | 9 | 333
| 3496
------------------------------------------------------------------------------------------------------------------------------------
Total
| 3737 |26269 |11124 | 1638 |42768
| 160 | 1782 | 732 | 66 | 2740
|45508
* NOTE: THE FIELD LABELD "OTHER" WAS CORRECTED IN APRIL 1989; INMATES CODED "PRE-OTIS NOT REPORTED" NOW HAVE BEEN REMOVED FROM THIS FIELD AND IDENTIFIED AS "NOT REPORTED".
Page 12 Run 06/18/01
Georgia Department of Corrections Office of Planning and Analysis
Inmate statistical profile
Sample: ACTIVE PRISONERS EXCLUDING JAIL
Requestor: Statistics
Active inmates 06/18/2001
Self-Rpt Marital Status At Admission by current age & sex
|
MEN
|
WOMEN
|
| Age | Age | Age | Age | Men
| Age | Age | Age | Age |Women
|Grand
Marital Status
|00-21 %|22-39 %|40-54 %|55-99 %|Total % |00-21 %|22-39 %|40-54 %|55-99 %|Total % |Total %
------------------------------------------------------------------------------------------------------------------------------------
SINGLE
| 3446 94|17091 66| 3995 37| 253 16|24785 59 | 147 94| 975 56| 220 31| 10 16| 1352 50 |26137 58
MARRIED
| 52 1| 2904 11| 2024 19| 467 29| 5447 13 | 2 1| 243 14| 120 17| 7 11| 372 14 | 5819 13
SEPARATED
| 10 0| 1037 4| 1022 9| 169 11| 2238 5 | 4 3| 202 12| 102 14| 7 11| 315 12 | 2553 6
DIVORCED
| 9 0| 1766 7| 2351 22| 437 27| 4563 11 | 1 1| 202 12| 152 21| 16 25| 371 14 | 4934 11
WIDOWED
| 4 0| 101 0| 240 2| 129 8| 474 1 | 0 0| 33 2| 65 9| 20 32| 118 4 | 592 1
COMMON LAW
| 127 3| 2934 11| 1281 12| 133 8| 4475 11 | 2 1| 97 6| 54 8| 3 5| 156 6 | 4631 10
OTHER
| 1 0| 8 0| 3 0| 3 0| 15 0 | 0 0| 1 0| 2 0| 0 0| 3 0 | 18 0
------------------------------------------------------------------------------------------------------------------------------------
Total reported
| 3649 100|25841 100|10916 100| 1591 100|41997 100 | 156 100| 1753 100| 715 100| 63 100| 2687 100 |44684 100
|
|
|
|
|
|
|
|
|
|
|
Percent reported |
97.6|
98.4|
98.1|
97.1|
98.2 |
97.5|
98.4|
97.7|
95.5|
98.1 |
98.2
|
|
|
|
|
|
|
|
|
|
|
|
|
|
|
|
|
|
|
|
|
|
NOT RPTD
| 88 | 428 | 208 | 47 | 771
| 4 | 29 | 17 | 3 | 53
| 824
------------------------------------------------------------------------------------------------------------------------------------
Total
| 3737 |26269 |11124 | 1638 |42768
| 160 | 1782 | 732 | 66 | 2740
|45508
Page 13 Run 06/18/01
Georgia Department of Corrections Office of Planning and Analysis
Inmate statistical profile
Sample: ACTIVE PRISONERS EXCLUDING JAIL
Requestor: Statistics
Active inmates 06/18/2001
Self-Rpt Number Of Children At Admission by current age & sex
|
MEN
|
WOMEN
|
| Age | Age | Age | Age | Men
| Age | Age | Age | Age |Women
|Grand
Number Of Children |00-21 %|22-39 %|40-54 %|55-99 %|Total % |00-21 %|22-39 %|40-54 %|55-99 %|Total % |Total %
------------------------------------------------------------------------------------------------------------------------------------
NO CHILDREN
| 0 0| 775 5| 445 6| 66 5| 1286 5 | 0 0| 7 0| 7 1| 2 3| 16 1 | 1302 5
ONE CHILD
| 635 74| 6438 41| 2391 30| 254 19| 9718 37 | 46 65| 335 23| 125 20| 6 10| 512 23 |10230 36
TWO CHILDREN
| 161 19| 4270 27| 2227 28| 314 23| 6972 27 | 18 25| 427 30| 183 29| 16 27| 644 29 | 7616 27
THREE CHILDREN
| 50 6| 2307 15| 1477 18| 277 21| 4111 16 | 4 6| 358 25| 162 26| 15 25| 539 25 | 4650 17
FOUR CHILDREN
| 8 1| 1079 7| 771 10| 152 11| 2010 8 | 3 4| 167 12| 91 15| 10 17| 271 12 | 2281 8
FIVE CHILDREN
| 3 0| 452 3| 400 5| 106 8| 961 4 | 0 0| 85 6| 33 5| 2 3| 120 5 | 1081 4
MORE THAN 5 CHILDREN| 1 0| 349 2| 377 5| 176 13| 903 3 | 0 0| 49 3| 26 4| 8 14| 83 4 | 986 4
------------------------------------------------------------------------------------------------------------------------------------
Total reported
| 858 100|15670 100| 8088 100| 1345 100|25961 100 | 71 100| 1428 100| 627 100| 59 100| 2185 100 |28146 100
|
|
|
|
|
|
|
|
|
|
|
Percent reported |
23.0|
59.7|
72.7|
82.1|
60.7 |
44.4|
80.1|
85.7|
89.4|
79.7 |
61.8
|
|
|
|
|
|
|
|
|
|
|
|
|
|
|
|
|
|
|
|
|
|
NOT REPORTED
| 2879 |10599 | 3036 | 293 |16807
| 89 | 354 | 105 | 7 | 555
|17362
------------------------------------------------------------------------------------------------------------------------------------
Total
| 3737 |26269 |11124 | 1638 |42768
| 160 | 1782 | 732 | 66 | 2740
|45508
|
|
|
|
|
|
|
|
|
|
|
|
|
|
|
|
|
|
|
|
|
|
|
|
|
|
|
|
|
|
|
|
|
|
|
|
|
|
|
|
|
|
|
|
|
|
|
|
|
|
|
|
|
|
|
AVG NUM CHILDREN | 1.35 | 1.99 | 2.37 | 3.11 | 2.15 | 1.49 | 2.58 | 2.68 | 3.27 | 2.59 | 2.18
* NOTE: THE FIELD LABLED "NO CHILDREN" WAS CORRECTED IN MARCH 1989: MISSING DATA FOR INMATES STILL IN DIAGNOSTICS NOW HAS BEEN REMOVED FROM THIS FIELD AND IDENTIFIED AS "NOT REPORTED" INFORMATION.
Page 14 Run 06/18/01
Georgia Department of Corrections Office of Planning and Analysis
Inmate statistical profile
Sample: ACTIVE PRISONERS EXCLUDING JAIL
Requestor: Statistics
Active inmates 06/18/2001
Self-Rpt Religious Affiliation by current age & sex
|
MEN
|
WOMEN
|
| Age | Age | Age | Age | Men
| Age | Age | Age | Age |Women
|Grand
Religion
|00-21 %|22-39 %|40-54 %|55-99 %|Total % |00-21 %|22-39 %|40-54 %|55-99 %|Total % |Total %
------------------------------------------------------------------------------------------------------------------------------------
ISLAM
| 74 2| 936 4| 340 3| 28 2| 1378 3 | 2 1| 18 1| 2 0| 0 0| 22 1 | 1400 3
CATHOLIC
| 119 3| 947 4| 366 3| 59 4| 1491 4 | 5 3| 81 5| 30 4| 2 3| 118 4 | 1609 4
BAPTIST
| 1521 42|12666 50| 6259 59| 901 58|21347 52 | 89 57| 1083 62| 457 64| 41 67| 1670 63 |23017 52
METHODIST
| 53 1| 491 2| 403 4| 98 6| 1045 3 | 6 4| 61 4| 42 6| 5 8| 114 4 | 1159 3
EPISCOPLN
| 5 0| 38 0| 19 0| 6 0| 68 0 | 0 0| 4 0| 4 1| 0 0| 8 0 | 76 0
PRESBYTRN
| 3 0| 49 0| 33 0| 14 1| 99 0 | 0 0| 0 0| 3 0| 2 3| 5 0 | 104 0
CHC OF GOD
| 39 1| 308 1| 146 1| 27 2| 520 1 | 1 1| 21 1| 15 2| 2 3| 39 1 | 559 1
HOLINESS
| 68 2| 962 4| 517 5| 88 6| 1635 4 | 8 5| 191 11| 80 11| 4 7| 283 11 | 1918 4
JEWISH
| 1 0| 21 0| 11 0| 3 0| 36 0 | 1 1| 0 0| 0 0| 0 0| 1 0 | 37 0
ANGLICAN
| 0 0| 4 0| 4 0| 0 0| 8 0 | 0 0| 1 0| 0 0| 0 0| 1 0 | 9 0
GRK ORTHDX
| 1 0| 1 0| 2 0| 1 0| 5 0 | 0 0| 0 0| 0 0| 0 0| 0 0 | 5 0
HINDU
| 0 0| 2 0| 0 0| 0 0| 2 0 | 0 0| 0 0| 0 0| 0 0| 0 0 | 2 0
BUDDHIST
| 7 0| 25 0| 3 0| 0 0| 35 0 | 0 0| 0 0| 0 0| 0 0| 0 0 | 35 0
TAOIST
| 0 0| 2 0| 2 0| 0 0| 4 0 | 0 0| 0 0| 0 0| 0 0| 0 0 | 4 0
SHINTOIST
| 2 0| 14 0| 1 0| 0 0| 17 0 | 0 0| 0 0| 0 0| 0 0| 0 0 | 17 0
SEVEN D AD
| 14 0| 56 0| 32 0| 9 1| 111 0 | 0 0| 5 0| 3 0| 0 0| 8 0 | 119 0
JEHOVAH WT
| 26 1| 210 1| 78 1| 6 0| 320 1 | 0 0| 16 1| 4 1| 1 2| 21 1 | 341 1
LATR DAY S
| 5 0| 20 0| 13 0| 4 0| 42 0 | 0 0| 2 0| 2 0| 0 0| 4 0 | 46 0
QUAKER
| 0 0| 0 0| 0 0| 0 0| 0 0 | 0 0| 0 0| 0 0| 0 0| 0 0 | 0 0
OTHER PROD
| 442 12| 2180 9| 577 5| 98 6| 3297 8 | 26 17| 131 8| 39 5| 2 3| 198 7 | 3495 8
NONE
| 882 25| 4592 18| 1227 12| 117 8| 6818 17 | 6 4| 53 3| 4 1| 0 0| 63 2 | 6881 16
OTHER
| 338 9| 1882 7| 632 6| 95 6| 2947 7 | 12 8| 73 4| 25 4| 2 3| 112 4 | 3059 7
------------------------------------------------------------------------------------------------------------------------------------
Total reported
| 3600 100|25406 100|10665 100| 1554 100|41225 100 | 156 100| 1740 100| 710 100| 61 100| 2667 100 |43892 100
|
|
|
|
|
|
|
|
|
|
|
Percent reported |
96.3|
96.7|
95.9|
94.9|
96.4 |
97.5|
97.6|
97.0|
92.4|
97.3 |
96.4
|
|
|
|
|
|
|
|
|
|
|
|
|
|
|
|
|
|
|
|
|
|
NOT RPTD
| 137 | 863 | 459 | 84 | 1543
| 4 | 42 | 22 | 5 | 73
| 1616
------------------------------------------------------------------------------------------------------------------------------------
Total
| 3737 |26269 |11124 | 1638 |42768
| 160 | 1782 | 732 | 66 | 2740
|45508
Page 15 Run 06/18/01
Georgia Department of Corrections Office of Planning and Analysis
Inmate statistical profile
Sample: ACTIVE PRISONERS EXCLUDING JAIL
Requestor: Statistics
Active inmates 06/18/2001
Self-Rpt Family Behavior Patterns * by current age & sex
|
MEN
|
WOMEN
|
| Age | Age | Age | Age | Men
| Age | Age | Age | Age |Women
|Grand
Family Behavior
|00-21 %|22-39 %|40-54 %|55-99 %|Total % |00-21 %|22-39 %|40-54 %|55-99 %|Total % |Total %
------------------------------------------------------------------------------------------------------------------------------------
CRIMINLTY
| 1157 23| 7685 24| 3160 26| 344 24|12346 24 | 62 18| 660 17| 264 20| 11 13| 997 18 |13343 24
ALCOHOLISM
| 446 9| 3774 12| 2027 16| 244 17| 6491 13 | 28 8| 468 12| 182 14| 14 17| 692 12 | 7183 13
DRUG ABUSE
| 403 8| 2256 7| 791 6| 57 4| 3507 7 | 33 10| 356 9| 112 8| 0 0| 501 9 | 4008 7
DOMINERING
| 12 0| 89 0| 50 0| 4 0| 155 0 | 31 9| 452 12| 191 14| 14 17| 688 12 | 843 1
MIGRANT
| 32 1| 247 1| 134 1| 12 1| 425 1 | 1 0| 12 0| 4 0| 0 0| 17 0 | 442 1
INFL BTGS
| 78 2| 910 3| 489 4| 96 7| 1573 3 | 15 4| 272 7| 108 8| 10 12| 405 7 | 1978 4
PERMISSIVE
| 11 0| 52 0| 40 0| 7 0| 110 0 | 28 8| 232 6| 61 5| 2 2| 323 6 | 433 1
FATH ABSNT
| 2246 45|13410 42| 4231 34| 452 32|20339 40 | 89 26| 816 22| 239 18| 19 23| 1163 21 |21502 38
MOTH ABSNT
| 591 12| 3313 10| 1195 10| 166 12| 5265 10 | 33 10| 219 6| 82 6| 9 11| 343 6 | 5608 10
NONE
| 47 1| 418 1| 206 2| 27 2| 698 1 | 21 6| 306 8| 86 6| 5 6| 418 8 | 1116 2
------------------------------------------------------------------------------------------------------------------------------------
Total reported
| 5023 100|32154 100|12323 100| 1409 100|50909 100 | 341 100| 3793 100| 1329 100| 84 100| 5547 100 |56456 100
|
|
|
|
|
|
|
|
|
|
|
Percent reported |
77.0|
71.5|
65.4|
54.1|
69.7 |
87.5|
83.3|
78.7|
62.1|
81.8 |
70.5
|
|
|
|
|
|
|
|
|
|
|
|
|
|
|
|
|
|
|
|
|
|
OTHER
| 858 | 7490 | 3845 | 752 |12945
| 20 | 298 | 156 | 25 | 499
|13444
------------------------------------------------------------------------------------------------------------------------------------
Total
| 3737 |26269 |11124 | 1638 |42768
| 160 | 1782 | 732 | 66 | 2740
|45508
* NOTE: SINCE THERE CAN BE UP TO FIVE BEHAVIOR CODES PER INMATE, THE NUMBER OF CASES REPORTED IN THE DETAIL LINES AND THE TOTAL REPORTED LINE MAY EXCEED THE TOTAL NUMBER OF CASES. IN SHORT, THIS TABLE COUNTS THE NUMBER OF BEHAVIOR PROBLEMS, NOT INMATES.
Page 16 Run 06/18/01
Georgia Department of Corrections Office of Planning and Analysis
Inmate statistical profile
Sample: ACTIVE PRISONERS EXCLUDING JAIL
Requestor: Statistics
Active inmates 06/18/2001
Inmate Diagnostic Behavior Problem * by current age & sex
|
MEN
|
WOMEN
|
| Age | Age | Age | Age | Men
| Age | Age | Age | Age |Women
|Grand
Diagnostic Problem |00-21 %|22-39 %|40-54 %|55-99 %|Total % |00-21 %|22-39 %|40-54 %|55-99 %|Total % |Total %
------------------------------------------------------------------------------------------------------------------------------------
ALCOHOLIC
| 46 1| 1072 2| 953 5| 164 7| 2235 3 | 3 1| 171 5| 93 7| 9 9| 276 6 | 2511 3
ALCOH ABSE
| 670 10| 6376 13| 3155 15| 422 17|10623 14 | 15 6| 278 9| 126 10| 14 14| 433 9 |11056 13
DRUG EXP
| 1349 20| 8912 18| 3268 16| 223 9|13752 18 | 25 10| 235 7| 95 7| 5 5| 360 8 |14112 17
DRUG ABSE
| 1188 18| 8996 19| 3930 19| 198 8|14312 18 | 44 18| 884 28| 336 27| 10 10| 1274 27 |15586 19
NARC ADDCT
| 33 0| 613 1| 427 2| 24 1| 1097 1 | 1 0| 53 2| 41 3| 1 1| 96 2 | 1193 1
EPILEPTIC
| 31 0| 263 1| 201 1| 32 1| 527 1 | 2 1| 74 2| 32 3| 4 4| 112 2 | 639 1
MANIPULTVE
| 932 14| 4968 10| 1553 7| 168 7| 7621 10 | 3 1| 51 2| 30 2| 2 2| 86 2 | 7707 9
ASSAULTIVE
| 1496 23|10207 21| 4182 20| 617 24|16502 21 | 61 25| 564 18| 212 17| 14 14| 851 18 |17353 21
ESCPE TEND
| 82 1| 1096 2| 705 3| 103 4| 1986 3 | 3 1| 91 3| 34 3| 0 0| 128 3 | 2114 3
SUICIDAL
| 129 2| 1042 2| 461 2| 58 2| 1690 2 | 13 5| 174 6| 57 4| 5 5| 249 5 | 1939 2
WITHDRAWN
| 14 0| 157 0| 90 0| 17 1| 278 0 | 13 5| 84 3| 23 2| 2 2| 122 3 | 400 0
PR RLTY CT
| 36 1| 377 1| 242 1| 30 1| 685 1 | 14 6| 95 3| 31 2| 5 5| 145 3 | 830 1
HOMOSEXUAL
| 15 0| 145 0| 77 0| 16 1| 253 0 | 14 6| 115 4| 20 2| 0 0| 149 3 | 402 0
NONE
| 68 1| 1100 2| 626 3| 178 7| 1972 3 | 1 0| 27 1| 27 2| 12 12| 67 1 | 2039 2
OTHER
| 52 1| 484 1| 329 2| 79 3| 944 1 | 2 1| 16 1| 11 1| 5 5| 34 1 | 978 1
NOT RPTD
| 414 6| 2211 5| 704 3| 185 7| 3514 4 | 34 14| 248 8| 98 8| 9 9| 389 8 | 3903 5
------------------------------------------------------------------------------------------------------------------------------------
Total reported
| 6609 100|48251 100|20935 100| 2523 100|78318 100 | 248 100| 3160 100| 1267 100| 97 100| 4772 100 |83090 100
|
|
|
|
|
|
|
|
|
|
|
Percent reported |
98.6|
99.1|
99.7|
99.5|
99.2 | 100.0| 100.0|
99.9| 100.0| 100.0 |
99.3
|
|
|
|
|
|
|
|
|
|
|
|
|
|
|
|
|
|
|
|
|
|
UNKNOWN
| 54 | 232 | 32 | 9 | 327
|0|0|1|0|1
| 328
------------------------------------------------------------------------------------------------------------------------------------
Total
| 3737 |26269 |11124 | 1638 |42768
| 160 | 1782 | 732 | 66 | 2740
|45508
* NOTE: SINCE THERE CAN BE UP TO FIVE BEHAVIOR CODES PER INMATE, THE NUMBER OF CASES REPORTED IN THE DETAIL LINES AND THE TOTAL REPORTED LINE MAY EXCEED THE TOTAL NUMBER OF CASES. IN SHORT, THIS TABLE COUNTS THE NUMBER OF BEHAVIOR PROBLEMS, NOT INMATES.
Page 17 Run 06/18/01
Georgia Department of Corrections Office of Planning and Analysis
Inmate statistical profile
Sample: ACTIVE PRISONERS EXCLUDING JAIL
Requestor: Statistics
Active inmates 06/18/2001
Physical Profile (General Condition) by current age & sex
|
MEN
|
WOMEN
|
| Age | Age | Age | Age | Men
| Age | Age | Age | Age |Women
|Grand
Physical Profile |00-21 %|22-39 %|40-54 %|55-99 %|Total % |00-21 %|22-39 %|40-54 %|55-99 %|Total % |Total %
------------------------------------------------------------------------------------------------------------------------------------
NO LIMITATION
| 3336 91|19517 76| 5402 50| 312 20|28567 68 | 140 92| 1341 78| 432 61| 11 18| 1924 73 |30491 68
DEFECT NO MAJOR LIMT| 128 4| 2641 10| 1966 18| 294 18| 5029 12 | 1 1| 61 4| 61 9| 11 18| 134 5 | 5163 12
DEFECT MAJOR LIMIT | 188 5| 3585 14| 3432 31| 901 56| 8106 19 | 11 7| 312 18| 206 29| 37 60| 566 21 | 8672 19
VERY MAJOR DEFECT | 1 0| 50 0| 110 1| 88 6| 249 1 | 0 0| 2 0| 7 1| 3 5| 12 0 | 261 1
------------------------------------------------------------------------------------------------------------------------------------
Total reported
| 3653 100|25793 100|10910 100| 1595 100|41951 100 | 152 100| 1716 100| 706 100| 62 100| 2636 100 |44587 100
|
|
|
|
|
|
|
|
|
|
|
Percent reported |
97.8|
98.2|
98.1|
97.4|
98.1 |
95.0|
96.3|
96.4|
93.9|
96.2 |
98.0
|
|
|
|
|
|
|
|
|
|
|
|
|
|
|
|
|
|
|
|
|
|
NOT REPORTED
| 84 | 476 | 214 | 43 | 817
| 8 | 66 | 26 | 4 | 104
| 921
------------------------------------------------------------------------------------------------------------------------------------
Total
| 3737 |26269 |11124 | 1638 |42768
| 160 | 1782 | 732 | 66 | 2740
|45508
Page 18 Run 06/18/01
Georgia Department of Corrections Office of Planning and Analysis
Inmate statistical profile
Sample: ACTIVE PRISONERS EXCLUDING JAIL Active inmates 06/18/2001
Requestor: Statistics Security Status by current age & sex
|
MEN
|
WOMEN
|
| Age | Age | Age | Age | Men
| Age | Age | Age | Age |Women
|Grand
Security
|00-21 %|22-39 %|40-54 %|55-99 %|Total % |00-21 %|22-39 %|40-54 %|55-99 %|Total % |Total %
------------------------------------------------------------------------------------------------------------------------------------
DIAG INCOM
| 0 0| 16 0| 2 0| 0 0| 18 0 | 0 0| 0 0| 0 0| 0 0| 0 0 | 18 0
WRK RELEAS
| 0 0| 0 0| 0 0| 0 0| 0 0 | 0 0| 0 0| 1 0| 0 0| 1 0 | 1 0
TRUSTY
| 42 1| 1451 6| 788 7| 65 4| 2346 5 | 5 3| 96 5| 47 6| 4 6| 152 6 | 2498 5
MINIMUM
| 1085 29| 8915 34| 3993 36| 536 33|14529 34 | 68 43| 1007 57| 431 59| 42 64| 1548 56 |16077 35
MEDIUM
| 1568 42|10121 39| 4442 40| 813 50|16944 40 | 58 36| 493 28| 193 26| 17 26| 761 28 |17705 39
CLOSE
| 745 20| 4092 16| 1265 11| 146 9| 6248 15 | 24 15| 128 7| 37 5| 2 3| 191 7 | 6439 14
MAXIMUM
| 16 0| 556 2| 203 2| 22 1| 797 2 | 0 0| 5 0| 1 0| 0 0| 6 0 | 803 2
DIAGNOSTIC
| 281 8| 1117 4| 431 4| 56 3| 1885 4 | 5 3| 53 3| 22 3| 1 2| 81 3 | 1966 4
------------------------------------------------------------------------------------------------------------------------------------
Total reported
| 3737 100|26268 100|11124 100| 1638 100|42767 100 | 160 100| 1782 100| 732 100| 66 100| 2740 100 |45507 100
|
|
|
|
|
|
|
|
|
|
|
Percent reported | 100.0| 100.0| 100.0| 100.0| 100.0 | 100.0| 100.0| 100.0| 100.0| 100.0 | 100.0
|
|
|
|
|
|
|
|
|
|
|
|
|
|
|
|
|
|
|
|
|
|
NOT RPTD
|0|1|0|0|1
|0|0|0|0|0
|1
------------------------------------------------------------------------------------------------------------------------------------
Total
| 3737 |26269 |11124 | 1638 |42768
| 160 | 1782 | 732 | 66 | 2740
|45508
* NOTE: BEGINNING IN JULY 1987, THE FACILITIES DIVISION NO LONGER CODED INMATES AS BEING WORK RELEASE
Page 19 Run 06/18/01
Georgia Department of Corrections Office of Planning and Analysis
Inmate statistical profile
Sample: ACTIVE PRISONERS EXCLUDING JAIL Active inmates 06/18/2001
Requestor: Statistics Number Of Sentences by current age & sex
|
MEN
|
WOMEN
|
| Age | Age | Age | Age | Men
| Age | Age | Age | Age |Women
|Grand
Number Of Sentences |00-21 %|22-39 %|40-54 %|55-99 %|Total % |00-21 %|22-39 %|40-54 %|55-99 %|Total % |Total %
------------------------------------------------------------------------------------------------------------------------------------
ONE
| 1528 41| 7957 30| 3590 32| 651 40|13726 32 | 83 52| 639 36| 276 38| 36 55| 1034 38 |14760 32
TWO
| 983 26| 6163 23| 2621 24| 401 25|10168 24 | 39 25| 446 25| 198 27| 13 20| 696 25 |10864 24
THREE
| 541 15| 4231 16| 1727 16| 214 13| 6713 16 | 13 8| 277 16| 100 14| 10 15| 400 15 | 7113 16
FOUR
| 292 8| 2686 10| 1050 9| 133 8| 4161 10 | 11 7| 176 10| 52 7| 4 6| 243 9 | 4404 10
FIVE
| 173 5| 1805 7| 714 6| 76 5| 2768 6 | 7 4| 102 6| 26 4| 1 2| 136 5 | 2904 6
MORE THAN FIVE
| 208 6| 3390 13| 1405 13| 157 10| 5160 12 | 6 4| 136 8| 78 11| 2 3| 222 8 | 5382 12
------------------------------------------------------------------------------------------------------------------------------------
Total reported
| 3725 100|26232 100|11107 100| 1632 100|42696 100 | 159 100| 1776 100| 730 100| 66 100| 2731 100 |45427 100
|
|
|
|
|
|
|
|
|
|
|
Percent reported |
99.7|
99.9|
99.8|
99.6|
99.8 |
99.4|
99.7|
99.7| 100.0|
99.7 |
99.8
|
|
|
|
|
|
|
|
|
|
|
|
|
|
|
|
|
|
|
|
|
|
NOT REPORTED
| 12 | 37 | 17 | 6 | 72
|1|6|2|0|9
| 81
------------------------------------------------------------------------------------------------------------------------------------
Total
| 3737 |26269 |11124 | 1638 |42768
| 160 | 1782 | 732 | 66 | 2740
|45508
|
|
|
|
|
|
|
|
|
|
|
|
|
|
|
|
|
|
|
|
|
|
|
|
|
|
|
|
|
|
|
|
|
|
|
|
|
|
|
|
|
|
|
|
|
|
|
|
|
|
|
|
|
|
|
AVG NUM SENTENCES | 2.34 | 3.06 | 3.01 | 2.65 | 2.97 | 2.04 | 2.62 | 2.68 | 2.11 | 2.59 | 2.95
Page 20 Run 06/18/01
Georgia Department of Corrections Office of Planning and Analysis
Inmate statistical profile
Sample: ACTIVE PRISONERS EXCLUDING JAIL Active inmates 06/18/2001
Requestor: Statistics Number Of Disciplinaries by current age & sex
|
MEN
|
WOMEN
|
| Age | Age | Age | Age | Men
| Age | Age | Age | Age |Women
|Grand
Disciplinaries
|00-21 %|22-39 %|40-54 %|55-99 %|Total % |00-21 %|22-39 %|40-54 %|55-99 %|Total % |Total %
------------------------------------------------------------------------------------------------------------------------------------
ZERO
| 1297 35| 8567 33| 4773 43| 820 50|15457 36 | 65 41| 835 47| 409 56| 42 64| 1351 49 |16808 37
ONE
| 524 14| 3790 14| 1696 15| 297 18| 6307 15 | 30 19| 265 15| 112 15| 11 17| 418 15 | 6725 15
TWO
| 312 8| 2404 9| 986 9| 137 8| 3839 9 | 11 7| 161 9| 57 8| 4 6| 233 9 | 4072 9
THREE
| 235 6| 1673 6| 653 6| 82 5| 2643 6 | 14 9| 124 7| 33 5| 3 5| 174 6 | 2817 6
FOUR
| 189 5| 1251 5| 416 4| 53 3| 1909 4 | 4 3| 68 4| 25 3| 1 2| 98 4 | 2007 4
FIVE
| 155 4| 995 4| 335 3| 41 3| 1526 4 | 4 3| 37 2| 10 1| 0 0| 51 2 | 1577 3
MORE THAN FIVE
| 1025 27| 7586 29| 2265 20| 208 13|11084 26 | 32 20| 292 16| 86 12| 5 8| 415 15 |11499 25
------------------------------------------------------------------------------------------------------------------------------------
Total reported
| 3737 100|26266 100|11124 100| 1638 100|42765 100 | 160 100| 1782 100| 732 100| 66 100| 2740 100 |45505 100
|
|
|
|
|
|
|
|
|
|
|
Percent reported | 100.0| 100.0| 100.0| 100.0| 100.0 | 100.0| 100.0| 100.0| 100.0| 100.0 | 100.0
|
|
|
|
|
|
|
|
|
|
|
|
|
|
|
|
|
|
|
|
|
|
NOT REPORTED
|0|3|0|0|3
|0|0|0|0|0
|3
------------------------------------------------------------------------------------------------------------------------------------
Total
| 3737 |26269 |11124 | 1638 |42768
| 160 | 1782 | 732 | 66 | 2740
|45508
|
|
|
|
|
|
|
|
|
|
|
|
|
|
|
|
|
|
|
|
|
|
|
|
|
|
|
|
|
|
|
|
|
|
|
|
|
|
|
|
|
|
|
|
|
|
|
|
|
|
|
|
|
|
|
AVG NUM DISCIP
| 5.41 | 6.22 | 4.47 | 2.81 | 5.56 | 3.35 | 3.27 | 2.33 | 1.55 | 2.98 | 5.40
Page 21 Run 06/18/01
Georgia Department of Corrections Office of Planning and Analysis
Inmate statistical profile
Sample: ACTIVE PRISONERS EXCLUDING JAIL Active inmates 06/18/2001
Requestor: Statistics Number Of Escapes by current age & sex
|
MEN
|
WOMEN
|
| Age | Age | Age | Age | Men
| Age | Age | Age | Age |Women
|Grand
Escapes
|00-21 %|22-39 %|40-54 %|55-99 %|Total % |00-21 %|22-39 %|40-54 %|55-99 %|Total % |Total %
------------------------------------------------------------------------------------------------------------------------------------
ZERO
| 3724 100|26077 99|10983 99| 1612 98|42396 99 | 160 100| 1771 99| 729 100| 66 100| 2726 99 |45122 99
ONE
| 13 0| 189 1| 120 1| 20 1| 342 1 | 0 0| 11 1| 3 0| 0 0| 14 1 | 356 1
TWO
| 0 0| 3 0| 16 0| 4 0| 23 0 | 0 0| 0 0| 0 0| 0 0| 0 0 | 23 0
THREE
| 0 0| 0 0| 4 0| 2 0| 6 0 | 0 0| 0 0| 0 0| 0 0| 0 0 | 6 0
FOUR
| 0 0| 0 0| 1 0| 0 0| 1 0 | 0 0| 0 0| 0 0| 0 0| 0 0 | 1 0
FIVE
| 0 0| 0 0| 0 0| 0 0| 0 0 | 0 0| 0 0| 0 0| 0 0| 0 0 | 0 0
MORE THAN FIVE
| 0 0| 0 0| 0 0| 0 0| 0 0 | 0 0| 0 0| 0 0| 0 0| 0 0 | 0 0
------------------------------------------------------------------------------------------------------------------------------------
Total reported
| 3737 100|26269 100|11124 100| 1638 100|42768 100 | 160 100| 1782 100| 732 100| 66 100| 2740 100 |45508 100
|
|
|
|
|
|
|
|
|
|
|
Percent reported | 100.0| 100.0| 100.0| 100.0| 100.0 | 100.0| 100.0| 100.0| 100.0| 100.0 | 100.0
|
|
|
|
|
|
|
|
|
|
|
|
|
|
|
|
|
|
|
|
|
|
NOT REPORTED
|0|0|0|0|0
|0|0|0|0|0
|0
------------------------------------------------------------------------------------------------------------------------------------
Total
| 3737 |26269 |11124 | 1638 |42768
| 160 | 1782 | 732 | 66 | 2740
|45508
|
|
|
|
|
|
|
|
|
|
|
|
|
|
|
|
|
|
|
|
|
|
|
|
|
|
|
|
|
|
|
|
|
|
|
|
|
|
|
|
|
|
|
|
|
|
|
|
|
|
|
|
|
|
|
AVG NUM ESCAPES
| .00 | .01 | .02 | .02 | .01 | .00 | .01 | .00 | .00 | .01 | .01
Page 22 Run 06/18/01
Georgia Department of Corrections Office of Planning and Analysis
Inmate statistical profile
Sample: ACTIVE PRISONERS EXCLUDING JAIL
Requestor: Statistics
Active inmates 06/18/2001
Number Of Prior Georgia Incarcerations * by current age & sex
|
MEN
|
WOMEN
|
| Age | Age | Age | Age | Men
| Age | Age | Age | Age |Women
|Grand
Prior Incarcerations|00-21 %|22-39 %|40-54 %|55-99 %|Total % |00-21 %|22-39 %|40-54 %|55-99 %|Total % |Total %
------------------------------------------------------------------------------------------------------------------------------------
ZERO
| 3361 90|13828 53| 4178 38| 925 56|22292 52 | 148 93| 1086 61| 408 56| 50 76| 1692 62 |23984 53
ONE
| 343 9| 5417 21| 2110 19| 308 19| 8178 19 | 12 8| 353 20| 112 15| 10 15| 487 18 | 8665 19
TWO
| 31 1| 3252 12| 1567 14| 152 9| 5002 12 | 0 0| 165 9| 74 10| 2 3| 241 9 | 5243 12
THREE
| 2 0| 1891 7| 1098 10| 112 7| 3103 7 | 0 0| 98 5| 53 7| 2 3| 153 6 | 3256 7
FOUR
| 0 0| 1001 4| 826 7| 62 4| 1889 4 | 0 0| 41 2| 29 4| 2 3| 72 3 | 1961 4
FIVE
| 0 0| 515 2| 570 5| 32 2| 1117 3 | 0 0| 22 1| 19 3| 0 0| 41 1 | 1158 3
MORE THAN FIVE
| 0 0| 365 1| 775 7| 47 3| 1187 3 | 0 0| 17 1| 37 5| 0 0| 54 2 | 1241 3
------------------------------------------------------------------------------------------------------------------------------------
Total reported
| 3737 100|26269 100|11124 100| 1638 100|42768 100 | 160 100| 1782 100| 732 100| 66 100| 2740 100 |45508 100
|
|
|
|
|
|
|
|
|
|
|
Percent reported | 100.0| 100.0| 100.0| 100.0| 100.0 | 100.0| 100.0| 100.0| 100.0| 100.0 | 100.0
|
|
|
|
|
|
|
|
|
|
|
|
|
|
|
|
|
|
|
|
|
|
NOT REPORTED
|0|0|0|0|0
|0|0|0|0|0
|0
------------------------------------------------------------------------------------------------------------------------------------
Total
| 3737 |26269 |11124 | 1638 |42768
| 160 | 1782 | 732 | 66 | 2740
|45508
|
|
|
|
|
|
|
|
|
|
|
|
|
|
|
|
|
|
|
|
|
|
|
|
|
|
|
|
|
|
|
|
|
|
|
|
|
|
|
|
|
|
|
|
|
|
|
|
|
|
|
|
|
|
|
AVG # INCARCERATIONS| .11 | 1.01 | 1.81 | 1.03 | 1.14 | .08 | .76 | 1.24 | .42 | .84 | 1.12
* This data counts a parole revocation on an existing sentenCE AS A prior incarceration. Also, this data counts, for any cohort of inmates, the total number of Georgia incarcerations the inmate has had during his entire criminal career. For example, if an inmate was admitted to prison first in FY72, and then re-admitted in FY79 and FY85, he had two prior incarcerations before the FY85 admission. This inmate's records show two prior incarcerations in all three of his records since he has had two prior incarcerations in his criminal career. If the cohort of FY72 admissions is selected for analysis, two prior incarcerations will be listed for this inmate even though in FY72, he had no prior incarcerations.
Page 23 Run 06/18/01
Georgia Department of Corrections Office of Planning and Analysis
Inmate statistical profile
Sample: ACTIVE PRISONERS EXCLUDING JAIL Active inmates 06/18/2001
Requestor: Statistics Number Of Transfers by current age & sex
|
MEN
|
WOMEN
|
| Age | Age | Age | Age | Men
| Age | Age | Age | Age |Women
|Grand
Transfers
|00-21 %|22-39 %|40-54 %|55-99 %|Total % |00-21 %|22-39 %|40-54 %|55-99 %|Total % |Total %
------------------------------------------------------------------------------------------------------------------------------------
ZERO
| 928 25| 2416 9| 1003 9| 112 7| 4459 10 | 31 19| 325 18| 123 17| 7 11| 486 18 | 4945 11
ONE
| 1828 49|10638 40| 4296 39| 667 41|17429 41 | 108 68| 965 54| 388 53| 26 39| 1487 54 |18916 42
TWO
| 633 17| 5795 22| 2052 18| 299 18| 8779 21 | 8 5| 252 14| 110 15| 13 20| 383 14 | 9162 20
THREE
| 222 6| 3092 12| 1266 11| 187 11| 4767 11 | 8 5| 143 8| 49 7| 9 14| 209 8 | 4976 11
FOUR
| 71 2| 1685 6| 775 7| 120 7| 2651 6 | 5 3| 60 3| 30 4| 3 5| 98 4 | 2749 6
FIVE
| 30 1| 1036 4| 509 5| 63 4| 1638 4 | 0 0| 22 1| 12 2| 4 6| 38 1 | 1676 4
MORE THAN FIVE
| 25 1| 1607 6| 1223 11| 190 12| 3045 7 | 0 0| 15 1| 20 3| 4 6| 39 1 | 3084 7
------------------------------------------------------------------------------------------------------------------------------------
Total reported
| 3737 100|26269 100|11124 100| 1638 100|42768 100 | 160 100| 1782 100| 732 100| 66 100| 2740 100 |45508 100
|
|
|
|
|
|
|
|
|
|
|
Percent reported | 100.0| 100.0| 100.0| 100.0| 100.0 | 100.0| 100.0| 100.0| 100.0| 100.0 | 100.0
|
|
|
|
|
|
|
|
|
|
|
|
|
|
|
|
|
|
|
|
|
|
NOT REPORTED
|0|0|0|0|0
|0|0|0|0|0
|0
------------------------------------------------------------------------------------------------------------------------------------
Total
| 3737 |26269 |11124 | 1638 |42768
| 160 | 1782 | 732 | 66 | 2740
|45508
|
|
|
|
|
|
|
|
|
|
|
|
|
|
|
|
|
|
|
|
|
|
|
|
|
|
|
|
|
|
|
|
|
|
|
|
|
|
|
|
|
|
|
|
|
|
|
|
|
|
|
|
|
|
|
AVG NUM TRANSFERS | 1.17 | 2.14 | 2.55 | 2.61 | 2.18 | 1.05 | 1.32 | 1.48 | 2.15 | 1.37 | 2.13
Page 24 Run 06/18/01
Georgia Department of Corrections Office of Planning and Analysis
Inmate statistical profile
Sample: ACTIVE PRISONERS EXCLUDING JAIL Active inmates 06/18/2001
Requestor: Statistics County Of Conviction by current age & sex
|
MEN
|
WOMEN
|
| Age | Age | Age | Age | Men
| Age | Age | Age | Age |Women
|Grand
County Of Conviction|00-21 %|22-39 %|40-54 %|55-99 %|Total % |00-21 %|22-39 %|40-54 %|55-99 %|Total % |Total %
------------------------------------------------------------------------------------------------------------------------------------
Appling
| 3 0| 51 0| 29 0| 5 0| 88 0 | 1 1| 2 0| 1 0| 0 0| 4 0 | 92 0
Atkinson
| 3 0| 32 0| 11 0| 3 0| 49 0 | 0 0| 2 0| 2 0| 0 0| 4 0 | 53 0
Bacon
| 2 0| 37 0| 15 0| 0 0| 54 0 | 0 0| 3 0| 0 0| 0 0| 3 0 | 57 0
Baker
| 0 0| 15 0| 5 0| 1 0| 21 0 | 0 0| 3 0| 0 0| 0 0| 3 0 | 24 0
Baldwin
| 43 1| 240 1| 88 1| 7 0| 378 1 | 0 0| 19 1| 8 1| 0 0| 27 1 | 405 1
Banks
| 11 0| 25 0| 21 0| 5 0| 62 0 | 1 1| 3 0| 1 0| 0 0| 5 0 | 67 0
Barrow
| 11 0| 94 0| 55 0| 12 1| 172 0 | 0 0| 12 1| 5 1| 0 0| 17 1 | 189 0
Bartow
| 34 1| 236 1| 102 1| 24 1| 396 1 | 5 3| 26 1| 8 1| 0 0| 39 1 | 435 1
Ben Hill
| 22 1| 120 0| 50 0| 10 1| 202 0 | 1 1| 12 1| 3 0| 0 0| 16 1 | 218 0
Berrien
| 5 0| 51 0| 14 0| 4 0| 74 0 | 0 0| 2 0| 0 0| 0 0| 2 0 | 76 0
Bibb
| 84 2| 651 2| 319 3| 39 2| 1093 3 | 3 2| 35 2| 26 4| 2 3| 66 2 | 1159 3
Bleckley
| 12 0| 71 0| 27 0| 3 0| 113 0 | 0 0| 7 0| 3 0| 0 0| 10 0 | 123 0
Brantley
| 1 0| 26 0| 15 0| 3 0| 45 0 | 0 0| 1 0| 2 0| 0 0| 3 0 | 48 0
Brooks
| 5 0| 67 0| 18 0| 5 0| 95 0 | 0 0| 2 0| 2 0| 0 0| 4 0 | 99 0
Bryan
| 5 0| 52 0| 24 0| 3 0| 84 0 | 0 0| 1 0| 0 0| 1 2| 2 0 | 86 0
Bulloch
| 52 1| 223 1| 81 1| 9 1| 365 1 | 2 1| 16 1| 7 1| 2 3| 27 1 | 392 1
Burke
| 14 0| 134 1| 51 0| 7 0| 206 0 | 1 1| 3 0| 3 0| 0 0| 7 0 | 213 0
Butts
| 17 0| 82 0| 32 0| 7 0| 138 0 | 1 1| 6 0| 3 0| 0 0| 10 0 | 148 0
Calhoun
| 5 0| 22 0| 16 0| 3 0| 46 0 | 0 0| 2 0| 0 0| 0 0| 2 0 | 48 0
Camden
| 4 0| 65 0| 26 0| 4 0| 99 0 | 1 1| 2 0| 2 0| 1 2| 6 0 | 105 0
Candler
| 6 0| 70 0| 16 0| 0 0| 92 0 | 0 0| 3 0| 1 0| 0 0| 4 0 | 96 0
Carroll
| 36 1| 257 1| 110 1| 31 2| 434 1 | 5 3| 28 2| 8 1| 0 0| 41 2 | 475 1
Catoosa
| 14 0| 102 0| 56 1| 11 1| 183 0 | 0 0| 11 1| 3 0| 1 2| 15 1 | 198 0
Charlton
| 3 0| 30 0| 16 0| 2 0| 51 0 | 0 0| 3 0| 0 0| 0 0| 3 0 | 54 0
Chatham
| 226 6| 1431 5| 472 4| 55 3| 2184 5 | 9 6| 98 6| 30 4| 3 5| 140 5 | 2324 5
Chattahoochee
| 4 0| 15 0| 8 0| 0 0| 27 0 | 1 1| 0 0| 0 0| 0 0| 1 0 | 28 0
Chatooga
| 3 0| 103 0| 53 0| 8 0| 167 0 | 2 1| 7 0| 2 0| 1 2| 12 0 | 179 0
Cherokee
| 28 1| 190 1| 134 1| 22 1| 374 1 | 3 2| 34 2| 8 1| 0 0| 45 2 | 419 1
Clarke
| 42 1| 322 1| 111 1| 19 1| 494 1 | 0 0| 25 1| 9 1| 2 3| 36 1 | 530 1
Clay
| 3 0| 15 0| 7 0| 1 0| 26 0 | 0 0| 0 0| 0 0| 0 0| 0 0 | 26 0
Clayton
| 202 5| 990 4| 371 3| 52 3| 1615 4 | 11 7| 109 6| 31 4| 5 8| 156 6 | 1771 4
Clinch
| 6 0| 25 0| 12 0| 0 0| 43 0 | 0 0| 3 0| 0 0| 0 0| 3 0 | 46 0
Cobb
| 175 5| 1168 4| 504 5| 78 5| 1925 5 | 5 3| 84 5| 31 4| 2 3| 122 4 | 2047 5
Coffee
| 19 1| 133 1| 51 0| 5 0| 208 0 | 1 1| 5 0| 3 0| 0 0| 9 0 | 217 0
Colquit
| 31 1| 185 1| 85 1| 20 1| 321 1 | 0 0| 10 1| 2 0| 1 2| 13 0 | 334 1
Columbia
| 28 1| 135 1| 57 1| 5 0| 225 1 | 2 1| 11 1| 5 1| 0 0| 18 1 | 243 1
------------------------------------------------------------------------------------------------------------------------------------
(continued)
Page 25 Run 06/18/01
Georgia Department of Corrections Office of Planning and Analysis
Inmate statistical profile
Sample: ACTIVE PRISONERS EXCLUDING JAIL
Requestor: Statistics
Active inmates 06/18/2001
County Of Conviction by current age & sex
(continued)
|
MEN
|
WOMEN
|
| Age | Age | Age | Age | Men
| Age | Age | Age | Age |Women
|Grand
County Of Conviction|00-21 %|22-39 %|40-54 %|55-99 %|Total % |00-21 %|22-39 %|40-54 %|55-99 %|Total % |Total %
------------------------------------------------------------------------------------------------------------------------------------
Cook
| 6 0| 99 0| 44 0| 2 0| 151 0 | 0 0| 6 0| 4 1| 0 0| 10 0 | 161 0
Coweta
| 46 1| 318 1| 96 1| 10 1| 470 1 | 1 1| 21 1| 4 1| 0 0| 26 1 | 496 1
Crawford
| 1 0| 18 0| 2 0| 0 0| 21 0 | 0 0| 0 0| 0 0| 0 0| 0 0 | 21 0
Crisp
| 26 1| 177 1| 71 1| 10 1| 284 1 | 1 1| 9 1| 3 0| 1 2| 14 1 | 298 1
Dade
| 6 0| 38 0| 29 0| 9 1| 82 0 | 0 0| 1 0| 0 0| 0 0| 1 0 | 83 0
Dawson
| 4 0| 30 0| 23 0| 4 0| 61 0 | 0 0| 2 0| 0 0| 0 0| 2 0 | 63 0
Decatur
| 21 1| 190 1| 72 1| 9 1| 292 1 | 2 1| 14 1| 4 1| 0 0| 20 1 | 312 1
DeKalb
| 274 7| 1742 7| 660 6| 89 5| 2765 6 | 11 7| 63 4| 27 4| 5 8| 106 4 | 2871 6
Dodge
| 19 1| 130 0| 61 1| 6 0| 216 1 | 1 1| 14 1| 4 1| 0 0| 19 1 | 235 1
Dooly
| 7 0| 76 0| 23 0| 2 0| 108 0 | 0 0| 3 0| 1 0| 0 0| 4 0 | 112 0
Dougherty
| 77 2| 633 2| 242 2| 27 2| 979 2 | 0 0| 35 2| 19 3| 2 3| 56 2 | 1035 2
Douglas
| 72 2| 424 2| 182 2| 27 2| 705 2 | 2 1| 33 2| 19 3| 0 0| 54 2 | 759 2
Early
| 6 0| 60 0| 15 0| 4 0| 85 0 | 0 0| 3 0| 2 0| 0 0| 5 0 | 90 0
Echols
| 1 0| 5 0| 2 0| 0 0| 8 0 | 0 0| 0 0| 0 0| 0 0| 0 0 | 8 0
Effingham
| 25 1| 80 0| 40 0| 3 0| 148 0 | 0 0| 8 0| 5 1| 1 2| 14 1 | 162 0
Elbert
| 14 0| 96 0| 51 0| 5 0| 166 0 | 1 1| 10 1| 4 1| 0 0| 15 1 | 181 0
Emanuel
| 15 0| 124 0| 40 0| 7 0| 186 0 | 0 0| 3 0| 1 0| 0 0| 4 0 | 190 0
Evans
| 7 0| 55 0| 16 0| 4 0| 82 0 | 0 0| 0 0| 1 0| 0 0| 1 0 | 83 0
Fannin
| 3 0| 60 0| 40 0| 7 0| 110 0 | 0 0| 4 0| 2 0| 1 2| 7 0 | 117 0
Fayette
| 18 0| 134 1| 56 1| 10 1| 218 1 | 0 0| 13 1| 3 0| 0 0| 16 1 | 234 1
Floyd
| 62 2| 474 2| 201 2| 30 2| 767 2 | 3 2| 50 3| 24 3| 2 3| 79 3 | 846 2
Forsyth
| 5 0| 92 0| 56 1| 12 1| 165 0 | 0 0| 13 1| 7 1| 0 0| 20 1 | 185 0
Franklin
| 16 0| 63 0| 32 0| 7 0| 118 0 | 0 0| 4 0| 3 0| 1 2| 8 0 | 126 0
Fulton
| 218 6| 2073 8| 1025 9| 155 9| 3471 8 | 7 4| 67 4| 39 5| 8 12| 121 4 | 3592 8
Gilmer
| 13 0| 68 0| 38 0| 18 1| 137 0 | 0 0| 2 0| 4 1| 1 2| 7 0 | 144 0
Glascock
| 1 0| 1 0| 2 0| 0 0| 4 0 | 0 0| 0 0| 0 0| 0 0| 0 0 | 4 0
Glynn
| 34 1| 309 1| 140 1| 22 1| 505 1 | 2 1| 18 1| 5 1| 1 2| 26 1 | 531 1
Gordon
| 18 0| 157 1| 71 1| 13 1| 259 1 | 4 3| 18 1| 7 1| 0 0| 29 1 | 288 1
Grady
| 38 1| 138 1| 53 0| 9 1| 238 1 | 0 0| 19 1| 3 0| 0 0| 22 1 | 260 1
Greene
| 18 0| 58 0| 16 0| 2 0| 94 0 | 0 0| 1 0| 1 0| 0 0| 2 0 | 96 0
Gwinnett
| 96 3| 698 3| 312 3| 45 3| 1151 3 | 6 4| 62 3| 35 5| 1 2| 104 4 | 1255 3
Habersham
| 5 0| 50 0| 22 0| 2 0| 79 0 | 1 1| 5 0| 0 0| 0 0| 6 0 | 85 0
Hall
| 47 1| 342 1| 200 2| 35 2| 624 1 | 2 1| 30 2| 8 1| 1 2| 41 2 | 665 1
Hancock
| 3 0| 21 0| 7 0| 1 0| 32 0 | 0 0| 0 0| 1 0| 0 0| 1 0 | 33 0
Haralson
| 11 0| 64 0| 33 0| 5 0| 113 0 | 0 0| 4 0| 3 0| 0 0| 7 0 | 120 0
------------------------------------------------------------------------------------------------------------------------------------
(continued)
Page 26 Run 06/18/01
Georgia Department of Corrections Office of Planning and Analysis
Inmate statistical profile
Sample: ACTIVE PRISONERS EXCLUDING JAIL
Requestor: Statistics
Active inmates 06/18/2001
County Of Conviction by current age & sex
(continued)
|
MEN
|
WOMEN
|
| Age | Age | Age | Age | Men
| Age | Age | Age | Age |Women
|Grand
County Of Conviction|00-21 %|22-39 %|40-54 %|55-99 %|Total % |00-21 %|22-39 %|40-54 %|55-99 %|Total % |Total %
------------------------------------------------------------------------------------------------------------------------------------
Harris
| 11 0| 64 0| 31 0| 2 0| 108 0 | 1 1| 3 0| 0 0| 0 0| 4 0 | 112 0
Hart
| 8 0| 74 0| 17 0| 2 0| 101 0 | 0 0| 5 0| 3 0| 0 0| 8 0 | 109 0
Heard
| 4 0| 30 0| 13 0| 12 1| 59 0 | 1 1| 1 0| 1 0| 0 0| 3 0 | 62 0
Henry
| 29 1| 187 1| 86 1| 12 1| 314 1 | 3 2| 11 1| 8 1| 1 2| 23 1 | 337 1
Houston
| 46 1| 290 1| 120 1| 12 1| 468 1 | 1 1| 20 1| 9 1| 2 3| 32 1 | 500 1
Irwin
| 6 0| 49 0| 21 0| 5 0| 81 0 | 1 1| 1 0| 0 0| 0 0| 2 0 | 83 0
Jackson
| 11 0| 103 0| 63 1| 10 1| 187 0 | 0 0| 12 1| 4 1| 0 0| 16 1 | 203 0
Jasper
| 3 0| 44 0| 14 0| 1 0| 62 0 | 0 0| 1 0| 1 0| 0 0| 2 0 | 64 0
Jeff Davis
| 6 0| 28 0| 25 0| 3 0| 62 0 | 0 0| 2 0| 1 0| 0 0| 3 0 | 65 0
Jefferson
| 12 0| 79 0| 27 0| 6 0| 124 0 | 0 0| 5 0| 2 0| 0 0| 7 0 | 131 0
Jenkins
| 12 0| 59 0| 12 0| 1 0| 84 0 | 0 0| 4 0| 1 0| 0 0| 5 0 | 89 0
Johnson
| 5 0| 37 0| 11 0| 2 0| 55 0 | 0 0| 3 0| 0 0| 0 0| 3 0 | 58 0
Jones
| 11 0| 46 0| 24 0| 3 0| 84 0 | 1 1| 1 0| 1 0| 0 0| 3 0 | 87 0
Lamar
| 6 0| 68 0| 30 0| 6 0| 110 0 | 0 0| 0 0| 3 0| 0 0| 3 0 | 113 0
Lanier
| 1 0| 30 0| 6 0| 5 0| 42 0 | 0 0| 4 0| 2 0| 0 0| 6 0 | 48 0
Laurens
| 23 1| 162 1| 63 1| 4 0| 252 1 | 1 1| 5 0| 6 1| 1 2| 13 0 | 265 1
Lee
| 7 0| 37 0| 11 0| 2 0| 57 0 | 1 1| 2 0| 2 0| 0 0| 5 0 | 62 0
Liberty
| 26 1| 160 1| 44 0| 7 0| 237 1 | 1 1| 7 0| 2 0| 0 0| 10 0 | 247 1
Lincoln
| 2 0| 22 0| 13 0| 1 0| 38 0 | 0 0| 0 0| 0 0| 0 0| 0 0 | 38 0
Long
| 6 0| 34 0| 17 0| 3 0| 60 0 | 0 0| 2 0| 1 0| 0 0| 3 0 | 63 0
Lowndes
| 41 1| 366 1| 138 1| 12 1| 557 1 | 1 1| 22 1| 14 2| 2 3| 39 1 | 596 1
Lumpkins
| 3 0| 41 0| 23 0| 8 0| 75 0 | 0 0| 4 0| 2 0| 0 0| 6 0 | 81 0
Macon
| 12 0| 46 0| 19 0| 2 0| 79 0 | 0 0| 0 0| 1 0| 0 0| 1 0 | 80 0
Madison
| 5 0| 66 0| 29 0| 8 0| 108 0 | 0 0| 7 0| 1 0| 0 0| 8 0 | 116 0
Marion
| 3 0| 19 0| 15 0| 2 0| 39 0 | 0 0| 0 0| 2 0| 0 0| 2 0 | 41 0
McDuffie
| 7 0| 128 0| 42 0| 14 1| 191 0 | 2 1| 2 0| 1 0| 0 0| 5 0 | 196 0
McIntosh
| 6 0| 49 0| 25 0| 2 0| 82 0 | 0 0| 1 0| 0 0| 0 0| 1 0 | 83 0
Meriwether
| 16 0| 110 0| 50 0| 9 1| 185 0 | 1 1| 8 0| 3 0| 2 3| 14 1 | 199 0
Miller
| 3 0| 18 0| 11 0| 1 0| 33 0 | 0 0| 2 0| 1 0| 0 0| 3 0 | 36 0
Mitchell
| 14 0| 138 1| 64 1| 3 0| 219 1 | 3 2| 13 1| 2 0| 0 0| 18 1 | 237 1
Monroe
| 15 0| 69 0| 45 0| 6 0| 135 0 | 0 0| 2 0| 0 0| 0 0| 2 0 | 137 0
Montgomery
| 0 0| 21 0| 11 0| 0 0| 32 0 | 0 0| 1 0| 2 0| 0 0| 3 0 | 35 0
Morgan
| 8 0| 78 0| 26 0| 5 0| 117 0 | 0 0| 7 0| 0 0| 0 0| 7 0 | 124 0
Murray
| 13 0| 86 0| 44 0| 9 1| 152 0 | 0 0| 5 0| 1 0| 0 0| 6 0 | 158 0
Muscogee
| 167 4| 909 3| 393 4| 49 3| 1518 4 | 7 4| 72 4| 30 4| 2 3| 111 4 | 1629 4
------------------------------------------------------------------------------------------------------------------------------------
(continued)
Page 27 Run 06/18/01
Georgia Department of Corrections Office of Planning and Analysis
Inmate statistical profile
Sample: ACTIVE PRISONERS EXCLUDING JAIL
Requestor: Statistics
Active inmates 06/18/2001
County Of Conviction by current age & sex
(continued)
|
MEN
|
WOMEN
|
| Age | Age | Age | Age | Men
| Age | Age | Age | Age |Women
|Grand
County Of Conviction|00-21 %|22-39 %|40-54 %|55-99 %|Total % |00-21 %|22-39 %|40-54 %|55-99 %|Total % |Total %
------------------------------------------------------------------------------------------------------------------------------------
Newton
| 24 1| 233 1| 90 1| 13 1| 360 1 | 2 1| 13 1| 5 1| 2 3| 22 1 | 382 1
Oconee
| 4 0| 32 0| 12 0| 1 0| 49 0 | 1 1| 1 0| 0 0| 0 0| 2 0 | 51 0
Oglethrope
| 3 0| 34 0| 14 0| 1 0| 52 0 | 0 0| 1 0| 0 0| 0 0| 1 0 | 53 0
Paulding
| 14 0| 60 0| 61 1| 7 0| 142 0 | 0 0| 9 1| 1 0| 0 0| 10 0 | 152 0
Peach
| 4 0| 52 0| 37 0| 0 0| 93 0 | 1 1| 1 0| 2 0| 0 0| 4 0 | 97 0
Pickens
| 3 0| 41 0| 29 0| 7 0| 80 0 | 0 0| 2 0| 4 1| 0 0| 6 0 | 86 0
Pierce
| 7 0| 28 0| 21 0| 2 0| 58 0 | 1 1| 0 0| 0 0| 0 0| 1 0 | 59 0
Pike
| 2 0| 16 0| 12 0| 3 0| 33 0 | 0 0| 0 0| 1 0| 0 0| 1 0 | 34 0
Polk
| 8 0| 113 0| 44 0| 7 0| 172 0 | 0 0| 9 1| 1 0| 0 0| 10 0 | 182 0
Pulaski
| 14 0| 59 0| 24 0| 4 0| 101 0 | 0 0| 9 1| 0 0| 0 0| 9 0 | 110 0
Putnam
| 10 0| 94 0| 49 0| 5 0| 158 0 | 0 0| 4 0| 2 0| 1 2| 7 0 | 165 0
Quitman
| 2 0| 13 0| 0 0| 0 0| 15 0 | 0 0| 0 0| 0 0| 1 2| 1 0 | 16 0
Rabun
| 4 0| 28 0| 13 0| 3 0| 48 0 | 0 0| 1 0| 1 0| 0 0| 2 0 | 50 0
Randolph
| 8 0| 57 0| 14 0| 3 0| 82 0 | 0 0| 0 0| 1 0| 0 0| 1 0 | 83 0
Richmond
| 156 4| 1099 4| 457 4| 53 3| 1765 4 | 2 1| 87 5| 45 6| 1 2| 135 5 | 1900 4
Rockdale
| 29 1| 174 1| 93 1| 14 1| 310 1 | 1 1| 8 0| 10 1| 0 0| 19 1 | 329 1
Schely
| 2 0| 17 0| 4 0| 0 0| 23 0 | 0 0| 0 0| 0 0| 0 0| 0 0 | 23 0
Screven
| 9 0| 76 0| 25 0| 5 0| 115 0 | 3 2| 4 0| 0 0| 0 0| 7 0 | 122 0
Seminole
| 6 0| 49 0| 24 0| 4 0| 83 0 | 0 0| 2 0| 2 0| 0 0| 4 0 | 87 0
Spalding
| 50 1| 381 1| 154 1| 18 1| 603 1 | 4 3| 25 1| 13 2| 1 2| 43 2 | 646 1
Stephens
| 7 0| 81 0| 32 0| 5 0| 125 0 | 0 0| 5 0| 1 0| 0 0| 6 0 | 131 0
Stewart
| 5 0| 20 0| 5 0| 1 0| 31 0 | 0 0| 0 0| 2 0| 0 0| 2 0 | 33 0
Sumter
| 24 1| 137 1| 53 0| 5 0| 219 1 | 0 0| 12 1| 4 1| 0 0| 16 1 | 235 1
Talbot
| 7 0| 22 0| 7 0| 0 0| 36 0 | 0 0| 0 0| 3 0| 0 0| 3 0 | 39 0
Taliaferro
| 1 0| 4 0| 5 0| 0 0| 10 0 | 0 0| 0 0| 1 0| 0 0| 1 0 | 11 0
Tattnall
| 7 0| 87 0| 35 0| 7 0| 136 0 | 0 0| 3 0| 5 1| 0 0| 8 0 | 144 0
Taylor
| 12 0| 41 0| 18 0| 2 0| 73 0 | 1 1| 2 0| 0 0| 0 0| 3 0 | 76 0
Telfair
| 7 0| 86 0| 35 0| 2 0| 130 0 | 2 1| 6 0| 4 1| 0 0| 12 0 | 142 0
Terrell
| 4 0| 65 0| 22 0| 3 0| 94 0 | 0 0| 3 0| 0 0| 0 0| 3 0 | 97 0
Thomas
| 29 1| 191 1| 77 1| 12 1| 309 1 | 1 1| 15 1| 4 1| 0 0| 20 1 | 329 1
Tift
| 32 1| 201 1| 93 1| 11 1| 337 1 | 2 1| 11 1| 4 1| 1 2| 18 1 | 355 1
Toombs
| 32 1| 177 1| 64 1| 8 0| 281 1 | 2 1| 17 1| 0 0| 0 0| 19 1 | 300 1
Towns
| 1 0| 16 0| 8 0| 1 0| 26 0 | 1 1| 2 0| 0 0| 0 0| 3 0 | 29 0
Treutlen
| 3 0| 24 0| 13 0| 1 0| 41 0 | 0 0| 2 0| 1 0| 0 0| 3 0 | 44 0
Troup
| 64 2| 465 2| 149 1| 24 1| 702 2 | 5 3| 29 2| 9 1| 0 0| 43 2 | 745 2
------------------------------------------------------------------------------------------------------------------------------------
(continued)
Page 28 Run 06/18/01
Georgia Department of Corrections Office of Planning and Analysis
Inmate statistical profile
Sample: ACTIVE PRISONERS EXCLUDING JAIL
Requestor: Statistics
Active inmates 06/18/2001
County Of Conviction by current age & sex
(continued)
|
MEN
|
WOMEN
|
| Age | Age | Age | Age | Men
| Age | Age | Age | Age |Women
|Grand
County Of Conviction|00-21 %|22-39 %|40-54 %|55-99 %|Total % |00-21 %|22-39 %|40-54 %|55-99 %|Total % |Total %
------------------------------------------------------------------------------------------------------------------------------------
Turner
| 4 0| 53 0| 26 0| 3 0| 86 0 | 0 0| 2 0| 0 0| 0 0| 2 0 | 88 0
Twiggs
| 3 0| 20 0| 11 0| 2 0| 36 0 | 0 0| 0 0| 0 0| 0 0| 0 0 | 36 0
Union
| 4 0| 28 0| 7 0| 4 0| 43 0 | 0 0| 2 0| 0 0| 0 0| 2 0 | 45 0
Upson
| 19 1| 115 0| 43 0| 11 1| 188 0 | 1 1| 4 0| 2 0| 0 0| 7 0 | 195 0
Walker
| 14 0| 188 1| 77 1| 15 1| 294 1 | 1 1| 11 1| 6 1| 0 0| 18 1 | 312 1
Walton
| 22 1| 196 1| 83 1| 15 1| 316 1 | 1 1| 11 1| 4 1| 0 0| 16 1 | 332 1
Ware
| 30 1| 252 1| 112 1| 14 1| 408 1 | 0 0| 24 1| 9 1| 0 0| 33 1 | 441 1
Warren
| 3 0| 26 0| 17 0| 2 0| 48 0 | 0 0| 0 0| 1 0| 0 0| 1 0 | 49 0
Washington
| 9 0| 79 0| 27 0| 3 0| 118 0 | 0 0| 7 0| 3 0| 0 0| 10 0 | 128 0
Wayne
| 7 0| 77 0| 23 0| 3 0| 110 0 | 0 0| 3 0| 1 0| 1 2| 5 0 | 115 0
Webster
| 0 0| 11 0| 3 0| 0 0| 14 0 | 0 0| 0 0| 0 0| 0 0| 0 0 | 14 0
Wheeler
| 2 0| 30 0| 13 0| 3 0| 48 0 | 1 1| 0 0| 0 0| 1 2| 2 0 | 50 0
White
| 6 0| 42 0| 14 0| 2 0| 64 0 | 0 0| 4 0| 2 0| 0 0| 6 0 | 70 0
Whitfield
| 46 1| 339 1| 158 1| 27 2| 570 1 | 2 1| 47 3| 16 2| 1 2| 66 2 | 636 1
Wilcox
| 1 0| 31 0| 17 0| 4 0| 53 0 | 0 0| 4 0| 0 0| 0 0| 4 0 | 57 0
Wilkes
| 10 0| 45 0| 20 0| 2 0| 77 0 | 0 0| 7 0| 0 0| 0 0| 7 0 | 84 0
Wilkinson
| 4 0| 32 0| 10 0| 1 0| 47 0 | 0 0| 2 0| 0 0| 0 0| 2 0 | 49 0
Worth
| 7 0| 86 0| 36 0| 6 0| 135 0 | 0 0| 5 0| 1 0| 0 0| 6 0 | 141 0
------------------------------------------------------------------------------------------------------------------------------------
Total reported
| 3725 100|26232 100|11108 100| 1632 100|42697 100 | 159 100| 1776 100| 730 100| 66 100| 2731 100 |45428 100
|
|
|
|
|
|
|
|
|
|
|
Percent reported |
99.7|
99.9|
99.9|
99.6|
99.8 |
99.4|
99.7|
99.7| 100.0|
99.7 |
99.8
|
|
|
|
|
|
|
|
|
|
|
|
|
|
|
|
|
|
|
|
|
|
Not reported
| 12 | 37 | 16 | 6 | 71
|1|6|2|0|9
| 80
------------------------------------------------------------------------------------------------------------------------------------
Total
| 3737 |26269 |11124 | 1638 |42768
| 160 | 1782 | 732 | 66 | 2740
|45508
Page 29 Run 06/18/01
Georgia Department of Corrections Office of Planning and Analysis
Inmate statistical profile
Sample: ACTIVE PRISONERS EXCLUDING JAIL Active inmates 06/18/2001
Requestor: Statistics Circ Of Conviction by current age & sex
|
MEN
|
WOMEN
|
| Age | Age | Age | Age | Men
| Age | Age | Age | Age |Women
|Grand
Circ Of Conviction |00-21 %|22-39 %|40-54 %|55-99 %|Total % |00-21 %|22-39 %|40-54 %|55-99 %|Total % |Total %
------------------------------------------------------------------------------------------------------------------------------------
Alapaha
| 21 1| 237 1| 87 1| 14 1| 359 1 | 0 0| 17 1| 8 1| 0 0| 25 1 | 384 1
Alcovy
| 46 1| 429 2| 173 2| 28 2| 676 2 | 3 2| 24 1| 9 1| 2 3| 38 1 | 714 2
Atlanta
| 218 6| 2073 8| 1025 9| 155 9| 3471 8 | 7 4| 67 4| 39 5| 8 12| 121 4 | 3592 8
Atlantic
| 57 2| 437 2| 161 1| 26 2| 681 2 | 1 1| 14 1| 9 1| 1 2| 25 1 | 706 2
Augusta
| 198 5| 1368 5| 565 5| 65 4| 2196 5 | 5 3| 101 6| 53 7| 1 2| 160 6 | 2356 5
Blue Ridge
| 28 1| 190 1| 134 1| 22 1| 374 1 | 3 2| 34 2| 8 1| 0 0| 45 2 | 419 1
Brunswick
| 54 1| 530 2| 243 2| 37 2| 864 2 | 4 3| 27 2| 10 1| 3 5| 44 2 | 908 2
Chattahoochee
| 204 5| 1070 4| 472 4| 55 3| 1801 4 | 10 6| 77 4| 35 5| 2 3| 124 5 | 1925 4
Cherokee
| 52 1| 393 1| 173 2| 37 2| 655 2 | 9 6| 44 2| 15 2| 0 0| 68 2 | 723 2
Clayton
| 202 5| 990 4| 371 3| 52 3| 1615 4 | 11 7| 109 6| 31 4| 5 8| 156 6 | 1771 4
Cobb
| 175 5| 1168 4| 504 5| 78 5| 1925 5 | 5 3| 84 5| 31 4| 2 3| 122 4 | 2047 5
Conasauga
| 59 2| 425 2| 202 2| 36 2| 722 2 | 2 1| 52 3| 17 2| 1 2| 72 3 | 794 2
Cordele
| 56 2| 404 2| 161 1| 26 2| 647 2 | 2 1| 28 2| 7 1| 1 2| 38 1 | 685 2
Coweta
| 166 4| 1180 4| 418 4| 86 5| 1850 4 | 13 8| 87 5| 25 3| 2 3| 127 5 | 1977 4
Dougherty
| 77 2| 633 2| 242 2| 27 2| 979 2 | 0 0| 35 2| 19 3| 2 3| 56 2 | 1035 2
Dublin
| 34 1| 243 1| 98 1| 9 1| 384 1 | 1 1| 10 1| 7 1| 1 2| 19 1 | 403 1
Eastern
| 226 6| 1431 5| 472 4| 55 3| 2184 5 | 9 6| 98 6| 30 4| 3 5| 140 5 | 2324 5
Flint
| 29 1| 187 1| 86 1| 12 1| 314 1 | 3 2| 11 1| 8 1| 1 2| 23 1 | 337 1
Griffin
| 89 2| 646 2| 265 2| 42 3| 1042 2 | 5 3| 42 2| 19 3| 1 2| 67 2 | 1109 2
Gwinnett
| 96 3| 698 3| 312 3| 45 3| 1151 3 | 6 4| 62 3| 35 5| 1 2| 104 4 | 1255 3
Houston
| 46 1| 290 1| 120 1| 12 1| 468 1 | 1 1| 20 1| 9 1| 2 3| 32 1 | 500 1
Lookout Mountain | 37 1| 431 2| 215 2| 43 3| 726 2 | 3 2| 30 2| 11 2| 2 3| 46 2 | 772 2
Macon
| 89 2| 721 3| 358 3| 39 2| 1207 3 | 4 3| 36 2| 28 4| 2 3| 70 3 | 1277 3
Middle
| 74 2| 529 2| 174 2| 24 1| 801 2 | 2 1| 35 2| 7 1| 0 0| 44 2 | 845 2
Mountain
| 16 0| 159 1| 67 1| 10 1| 252 1 | 1 1| 11 1| 2 0| 0 0| 14 1 | 266 1
Northeastern
| 51 1| 372 1| 223 2| 39 2| 685 2 | 2 1| 32 2| 8 1| 1 2| 43 2 | 728 2
Northern
| 46 1| 333 1| 143 1| 23 1| 545 1 | 1 1| 27 2| 11 2| 1 2| 40 1 | 585 1
Ocmulgee
| 100 3| 613 2| 234 2| 25 2| 972 2 | 1 1| 35 2| 14 2| 1 2| 51 2 | 1023 2
Oconee
| 54 1| 397 2| 171 2| 18 1| 640 1 | 4 3| 37 2| 13 2| 1 2| 55 2 | 695 2
Ogeechee
| 98 3| 438 2| 158 1| 18 1| 712 2 | 5 3| 32 2| 13 2| 3 5| 53 2 | 765 2
Pataula
| 32 1| 277 1| 93 1| 16 1| 418 1 | 0 0| 10 1| 6 1| 1 2| 17 1 | 435 1
Piedmont
| 33 1| 222 1| 139 1| 27 2| 421 1 | 1 1| 27 2| 10 1| 0 0| 38 1 | 459 1
Rome
| 62 2| 474 2| 201 2| 30 2| 767 2 | 3 2| 50 3| 24 3| 2 3| 79 3 | 846 2
South Georgia
| 78 2| 503 2| 210 2| 25 2| 816 2 | 5 3| 51 3| 9 1| 0 0| 65 2 | 881 2
Southern
| 107 3| 814 3| 320 3| 49 3| 1290 3 | 2 1| 49 3| 22 3| 3 5| 76 3 | 1366 3
Southwestern
| 50 1| 268 1| 95 1| 10 1| 423 1 | 1 1| 14 1| 9 1| 0 0| 24 1 | 447 1
------------------------------------------------------------------------------------------------------------------------------------
(continued)
Page 30 Run 06/18/01
Georgia Department of Corrections Office of Planning and Analysis
Inmate statistical profile
Sample: ACTIVE PRISONERS EXCLUDING JAIL
Requestor: Statistics
Active inmates 06/18/2001
Circ Of Conviction by current age & sex
(continued)
|
MEN
|
WOMEN
|
| Age | Age | Age | Age | Men
| Age | Age | Age | Age |Women
|Grand
Circ Of Conviction |00-21 %|22-39 %|40-54 %|55-99 %|Total % |00-21 %|22-39 %|40-54 %|55-99 %|Total % |Total %
------------------------------------------------------------------------------------------------------------------------------------
Stone Mountain
| 274 7| 1742 7| 660 6| 89 5| 2765 6 | 11 7| 63 4| 27 4| 5 8| 106 4 | 2871 6
Tallapoosa
| 33 1| 237 1| 138 1| 19 1| 427 1 | 0 0| 22 1| 5 1| 0 0| 27 1 | 454 1
Tifton
| 49 1| 389 1| 176 2| 25 2| 639 1 | 3 2| 19 1| 5 1| 1 2| 28 1 | 667 1
Toombs
| 24 1| 226 1| 99 1| 19 1| 368 1 | 2 1| 9 1| 3 0| 0 0| 14 1 | 382 1
Waycross
| 62 2| 506 2| 230 2| 26 2| 824 2 | 2 1| 36 2| 14 2| 0 0| 52 2 | 876 2
Western
| 46 1| 354 1| 123 1| 20 1| 543 1 | 1 1| 26 1| 9 1| 2 3| 38 1 | 581 1
Rockdale
| 29 1| 174 1| 93 1| 14 1| 310 1 | 1 1| 8 0| 10 1| 0 0| 19 1 | 329 1
Douglas
| 72 2| 424 2| 182 2| 27 2| 705 2 | 2 1| 33 2| 19 3| 0 0| 54 2 | 759 2
Appalachian
| 19 1| 169 1| 107 1| 32 2| 327 1 | 0 0| 8 0| 10 1| 2 3| 20 1 | 347 1
Enotah
| 14 0| 127 0| 52 0| 15 1| 208 0 | 1 1| 12 1| 4 1| 0 0| 17 1 | 225 0
Forsyth-Bell
| 5 0| 92 0| 56 1| 12 1| 165 0 | 0 0| 13 1| 7 1| 0 0| 20 1 | 185 0
Towaliga
| 38 1| 219 1| 107 1| 19 1| 383 1 | 1 1| 8 0| 6 1| 0 0| 15 1 | 398 1
------------------------------------------------------------------------------------------------------------------------------------
Total reported
| 3725 100|26232 100|11108 100| 1632 100|42697 100 | 159 100| 1776 100| 730 100| 66 100| 2731 100 |45428 100
|
|
|
|
|
|
|
|
|
|
|
Percent reported |
99.7|
99.9|
99.9|
99.6|
99.8 |
99.4|
99.7|
99.7| 100.0|
99.7 |
99.8
|
|
|
|
|
|
|
|
|
|
|
|
|
|
|
|
|
|
|
|
|
|
Not reported
| 12 | 37 | 16 | 6 | 71
|1|6|2|0|9
| 80
------------------------------------------------------------------------------------------------------------------------------------
Total
| 3737 |26269 |11124 | 1638 |42768
| 160 | 1782 | 732 | 66 | 2740
|45508
Page 31 Run 06/18/01
Georgia Department of Corrections Office of Planning and Analysis
Inmate statistical profile
Sample: ACTIVE PRISONERS EXCLUDING JAIL Active inmates 06/18/2001
Requestor: Statistics Home County by current age & sex
|
MEN
|
WOMEN
|
| Age | Age | Age | Age | Men
| Age | Age | Age | Age |Women
|Grand
Home County
|00-21 %|22-39 %|40-54 %|55-99 %|Total % |00-21 %|22-39 %|40-54 %|55-99 %|Total % |Total %
------------------------------------------------------------------------------------------------------------------------------------
Appling
| 4 0| 57 0| 32 0| 5 0| 98 0 | 1 1| 0 0| 1 0| 0 0| 2 0 | 100 0
Atkinson
| 2 0| 31 0| 12 0| 5 0| 50 0 | 0 0| 1 0| 1 0| 0 0| 2 0 | 52 0
Bacon
| 0 0| 32 0| 16 0| 1 0| 49 0 | 0 0| 2 0| 0 0| 0 0| 2 0 | 51 0
Baker
| 1 0| 17 0| 6 0| 1 0| 25 0 | 0 0| 2 0| 0 0| 0 0| 2 0 | 27 0
Baldwin
| 40 1| 207 1| 75 1| 7 0| 329 1 | 0 0| 18 1| 7 1| 1 2| 26 1 | 355 1
Banks
| 2 0| 23 0| 13 0| 6 0| 44 0 | 0 0| 3 0| 2 0| 0 0| 5 0 | 49 0
Barrow
| 11 0| 104 0| 56 1| 10 1| 181 0 | 0 0| 10 1| 5 1| 0 0| 15 1 | 196 0
Bartow
| 31 1| 220 1| 98 1| 23 2| 372 1 | 5 3| 27 2| 6 1| 0 0| 38 1 | 410 1
Ben Hill
| 21 1| 98 0| 37 0| 9 1| 165 0 | 2 1| 9 1| 4 1| 0 0| 15 1 | 180 0
Berrien
| 4 0| 42 0| 12 0| 6 0| 64 0 | 0 0| 3 0| 1 0| 0 0| 4 0 | 68 0
Bibb
| 91 3| 658 3| 335 3| 39 3| 1123 3 | 3 2| 38 2| 27 4| 1 2| 69 3 | 1192 3
Bleckley
| 8 0| 70 0| 25 0| 1 0| 104 0 | 0 0| 5 0| 3 0| 0 0| 8 0 | 112 0
Brantley
| 2 0| 26 0| 11 0| 2 0| 41 0 | 0 0| 2 0| 2 0| 0 0| 4 0 | 45 0
Brooks
| 4 0| 58 0| 12 0| 4 0| 78 0 | 0 0| 2 0| 1 0| 0 0| 3 0 | 81 0
Bryan
| 7 0| 49 0| 24 0| 3 0| 83 0 | 0 0| 2 0| 2 0| 0 0| 4 0 | 87 0
Bulloch
| 35 1| 186 1| 81 1| 8 1| 310 1 | 1 1| 16 1| 7 1| 1 2| 25 1 | 335 1
Burke
| 14 0| 119 0| 45 0| 8 1| 186 0 | 0 0| 2 0| 2 0| 0 0| 4 0 | 190 0
Butts
| 15 0| 79 0| 25 0| 5 0| 124 0 | 1 1| 6 0| 2 0| 0 0| 9 0 | 133 0
Calhoun
| 5 0| 27 0| 13 0| 1 0| 46 0 | 0 0| 1 0| 0 0| 0 0| 1 0 | 47 0
Camden
| 4 0| 59 0| 20 0| 4 0| 87 0 | 1 1| 2 0| 1 0| 0 0| 4 0 | 91 0
Candler
| 9 0| 56 0| 17 0| 0 0| 82 0 | 0 0| 2 0| 1 0| 0 0| 3 0 | 85 0
Carroll
| 24 1| 228 1| 113 1| 34 2| 399 1 | 5 3| 25 2| 9 1| 0 0| 39 2 | 438 1
Catoosa
| 8 0| 64 0| 34 0| 7 0| 113 0 | 0 0| 3 0| 2 0| 0 0| 5 0 | 118 0
Charlton
| 1 0| 28 0| 11 0| 1 0| 41 0 | 0 0| 1 0| 1 0| 0 0| 2 0 | 43 0
Chatham
| 218 6| 1364 6| 449 4| 54 4| 2085 5 | 8 5| 89 5| 21 3| 5 8| 123 5 | 2208 5
Chattahoochee
| 1 0| 8 0| 5 0| 0 0| 14 0 | 0 0| 1 0| 0 0| 0 0| 1 0 | 15 0
Chatooga
| 6 0| 99 0| 46 0| 9 1| 160 0 | 2 1| 9 1| 1 0| 1 2| 13 1 | 173 0
Cherokee
| 20 1| 151 1| 95 1| 14 1| 280 1 | 2 1| 22 1| 9 1| 0 0| 33 1 | 313 1
Clarke
| 54 2| 326 1| 121 1| 17 1| 518 1 | 1 1| 25 2| 11 2| 3 5| 40 2 | 558 1
Clay
| 2 0| 13 0| 8 0| 1 0| 24 0 | 0 0| 2 0| 0 0| 0 0| 2 0 | 26 0
Clayton
| 146 4| 697 3| 252 2| 35 2| 1130 3 | 5 3| 58 4| 22 3| 4 7| 89 4 | 1219 3
Clinch
| 5 0| 26 0| 12 0| 0 0| 43 0 | 0 0| 3 0| 0 0| 0 0| 3 0 | 46 0
Cobb
| 135 4| 861 4| 404 4| 58 4| 1458 4 | 6 4| 78 5| 20 3| 1 2| 105 4 | 1563 4
Coffee
| 15 0| 132 1| 47 0| 6 0| 200 1 | 1 1| 9 1| 5 1| 1 2| 16 1 | 216 1
Colquit
| 33 1| 168 1| 74 1| 15 1| 290 1 | 0 0| 13 1| 1 0| 0 0| 14 1 | 304 1
Columbia
| 18 1| 104 0| 41 0| 4 0| 167 0 | 2 1| 8 0| 7 1| 0 0| 17 1 | 184 0
------------------------------------------------------------------------------------------------------------------------------------
(continued)
Page 32 Run 06/18/01
Georgia Department of Corrections Office of Planning and Analysis
Inmate statistical profile
Sample: ACTIVE PRISONERS EXCLUDING JAIL
Requestor: Statistics
Active inmates 06/18/2001
Home County by current age & sex
(continued)
|
MEN
|
WOMEN
|
| Age | Age | Age | Age | Men
| Age | Age | Age | Age |Women
|Grand
Home County
|00-21 %|22-39 %|40-54 %|55-99 %|Total % |00-21 %|22-39 %|40-54 %|55-99 %|Total % |Total %
------------------------------------------------------------------------------------------------------------------------------------
Cook
| 6 0| 92 0| 39 0| 2 0| 139 0 | 0 0| 6 0| 4 1| 0 0| 10 0 | 149 0
Coweta
| 41 1| 267 1| 79 1| 6 0| 393 1 | 1 1| 20 1| 4 1| 0 0| 25 1 | 418 1
Crawford
| 1 0| 16 0| 3 0| 0 0| 20 0 | 0 0| 0 0| 0 0| 0 0| 0 0 | 20 0
Crisp
| 20 1| 152 1| 57 1| 8 1| 237 1 | 1 1| 9 1| 2 0| 0 0| 12 0 | 249 1
Dade
| 2 0| 23 0| 16 0| 8 1| 49 0 | 1 1| 0 0| 0 0| 0 0| 1 0 | 50 0
Dawson
| 3 0| 41 0| 24 0| 1 0| 69 0 | 0 0| 6 0| 0 0| 0 0| 6 0 | 75 0
Decatur
| 24 1| 164 1| 52 1| 6 0| 246 1 | 1 1| 13 1| 3 0| 0 0| 17 1 | 263 1
DeKalb
| 226 6| 1519 6| 528 5| 81 6| 2354 6 | 10 7| 68 4| 23 3| 5 8| 106 4 | 2460 6
Dodge
| 11 0| 116 0| 55 1| 6 0| 188 0 | 1 1| 12 1| 4 1| 0 0| 17 1 | 205 0
Dooly
| 11 0| 67 0| 12 0| 1 0| 91 0 | 0 0| 3 0| 1 0| 0 0| 4 0 | 95 0
Dougherty
| 77 2| 642 3| 246 2| 24 2| 989 3 | 0 0| 35 2| 19 3| 3 5| 57 2 | 1046 2
Douglas
| 55 2| 231 1| 109 1| 18 1| 413 1 | 0 0| 22 1| 10 1| 0 0| 32 1 | 445 1
Early
| 7 0| 54 0| 17 0| 4 0| 82 0 | 0 0| 2 0| 2 0| 0 0| 4 0 | 86 0
Echols
| 1 0| 2 0| 2 0| 0 0| 5 0 | 0 0| 0 0| 0 0| 0 0| 0 0 | 5 0
Effingham
| 23 1| 71 0| 31 0| 2 0| 127 0 | 0 0| 5 0| 3 0| 1 2| 9 0 | 136 0
Elbert
| 16 0| 90 0| 48 0| 4 0| 158 0 | 0 0| 10 1| 4 1| 0 0| 14 1 | 172 0
Emanuel
| 14 0| 118 0| 32 0| 6 0| 170 0 | 2 1| 4 0| 2 0| 0 0| 8 0 | 178 0
Evans
| 5 0| 52 0| 11 0| 2 0| 70 0 | 0 0| 0 0| 1 0| 0 0| 1 0 | 71 0
Fannin
| 3 0| 55 0| 26 0| 11 1| 95 0 | 0 0| 3 0| 2 0| 1 2| 6 0 | 101 0
Fayette
| 6 0| 57 0| 18 0| 6 0| 87 0 | 0 0| 5 0| 3 0| 0 0| 8 0 | 95 0
Floyd
| 60 2| 433 2| 173 2| 23 2| 689 2 | 4 3| 45 3| 25 4| 1 2| 75 3 | 764 2
Forsyth
| 3 0| 80 0| 36 0| 7 0| 126 0 | 0 0| 6 0| 8 1| 1 2| 15 1 | 141 0
Franklin
| 11 0| 52 0| 26 0| 7 0| 96 0 | 0 0| 4 0| 1 0| 1 2| 6 0 | 102 0
Fulton
| 354 10| 2977 12| 1419 14| 174 12| 4924 12 | 15 10| 132 8| 74 11| 9 15| 230 9 | 5154 12
Gilmer
| 11 0| 53 0| 34 0| 16 1| 114 0 | 1 1| 3 0| 3 0| 0 0| 7 0 | 121 0
Glascock
| 0 0| 2 0| 2 0| 0 0| 4 0 | 0 0| 0 0| 0 0| 0 0| 0 0 | 4 0
Glynn
| 22 1| 275 1| 111 1| 19 1| 427 1 | 2 1| 15 1| 5 1| 1 2| 23 1 | 450 1
Gordon
| 17 0| 140 1| 61 1| 12 1| 230 1 | 2 1| 16 1| 4 1| 0 0| 22 1 | 252 1
Grady
| 31 1| 121 0| 45 0| 6 0| 203 1 | 1 1| 14 1| 4 1| 0 0| 19 1 | 222 1
Greene
| 18 1| 53 0| 12 0| 2 0| 85 0 | 0 0| 1 0| 2 0| 0 0| 3 0 | 88 0
Gwinnett
| 88 3| 560 2| 243 2| 45 3| 936 2 | 3 2| 48 3| 20 3| 0 0| 71 3 | 1007 2
Habersham
| 5 0| 47 0| 28 0| 2 0| 82 0 | 1 1| 2 0| 0 0| 0 0| 3 0 | 85 0
Hall
| 42 1| 314 1| 191 2| 35 2| 582 1 | 1 1| 32 2| 8 1| 1 2| 42 2 | 624 1
Hancock
| 5 0| 29 0| 12 0| 1 0| 47 0 | 0 0| 0 0| 1 0| 0 0| 1 0 | 48 0
Haralson
| 5 0| 64 0| 33 0| 5 0| 107 0 | 0 0| 11 1| 1 0| 0 0| 12 0 | 119 0
------------------------------------------------------------------------------------------------------------------------------------
(continued)
Page 33 Run 06/18/01
Georgia Department of Corrections Office of Planning and Analysis
Inmate statistical profile
Sample: ACTIVE PRISONERS EXCLUDING JAIL
Requestor: Statistics
Active inmates 06/18/2001
Home County by current age & sex
(continued)
|
MEN
|
WOMEN
|
| Age | Age | Age | Age | Men
| Age | Age | Age | Age |Women
|Grand
Home County
|00-21 %|22-39 %|40-54 %|55-99 %|Total % |00-21 %|22-39 %|40-54 %|55-99 %|Total % |Total %
------------------------------------------------------------------------------------------------------------------------------------
Harris
| 11 0| 47 0| 26 0| 2 0| 86 0 | 1 1| 2 0| 0 0| 0 0| 3 0 | 89 0
Hart
| 9 0| 55 0| 18 0| 2 0| 84 0 | 0 0| 3 0| 3 0| 0 0| 6 0 | 90 0
Heard
| 1 0| 24 0| 10 0| 10 1| 45 0 | 0 0| 2 0| 0 0| 0 0| 2 0 | 47 0
Henry
| 38 1| 163 1| 74 1| 11 1| 286 1 | 3 2| 4 0| 7 1| 0 0| 14 1 | 300 1
Houston
| 47 1| 269 1| 117 1| 14 1| 447 1 | 1 1| 22 1| 8 1| 1 2| 32 1 | 479 1
Irwin
| 9 0| 45 0| 21 0| 2 0| 77 0 | 0 0| 3 0| 0 0| 0 0| 3 0 | 80 0
Jackson
| 14 0| 88 0| 64 1| 14 1| 180 0 | 2 1| 13 1| 2 0| 0 0| 17 1 | 197 0
Jasper
| 2 0| 45 0| 14 0| 2 0| 63 0 | 0 0| 1 0| 1 0| 0 0| 2 0 | 65 0
Jeff Davis
| 5 0| 30 0| 25 0| 2 0| 62 0 | 0 0| 2 0| 2 0| 0 0| 4 0 | 66 0
Jefferson
| 12 0| 71 0| 27 0| 3 0| 113 0 | 0 0| 4 0| 3 0| 0 0| 7 0 | 120 0
Jenkins
| 13 0| 60 0| 14 0| 1 0| 88 0 | 0 0| 4 0| 2 0| 0 0| 6 0 | 94 0
Johnson
| 1 0| 25 0| 10 0| 3 0| 39 0 | 0 0| 3 0| 0 0| 0 0| 3 0 | 42 0
Jones
| 9 0| 20 0| 15 0| 3 0| 47 0 | 1 1| 1 0| 1 0| 0 0| 3 0 | 50 0
Lamar
| 0 0| 60 0| 27 0| 7 0| 94 0 | 0 0| 0 0| 3 0| 0 0| 3 0 | 97 0
Lanier
| 1 0| 30 0| 5 0| 4 0| 40 0 | 0 0| 4 0| 2 0| 0 0| 6 0 | 46 0
Laurens
| 21 1| 166 1| 55 1| 6 0| 248 1 | 1 1| 7 0| 5 1| 1 2| 14 1 | 262 1
Lee
| 11 0| 25 0| 12 0| 2 0| 50 0 | 0 0| 3 0| 1 0| 0 0| 4 0 | 54 0
Liberty
| 28 1| 149 1| 32 0| 5 0| 214 1 | 1 1| 5 0| 1 0| 0 0| 7 0 | 221 1
Lincoln
| 2 0| 22 0| 11 0| 1 0| 36 0 | 0 0| 0 0| 0 0| 0 0| 0 0 | 36 0
Long
| 3 0| 18 0| 12 0| 1 0| 34 0 | 0 0| 2 0| 1 0| 0 0| 3 0 | 37 0
Lowndes
| 34 1| 314 1| 115 1| 14 1| 477 1 | 1 1| 18 1| 11 2| 1 2| 31 1 | 508 1
Lumpkins
| 3 0| 37 0| 25 0| 6 0| 71 0 | 0 0| 3 0| 1 0| 0 0| 4 0 | 75 0
Macon
| 9 0| 44 0| 17 0| 3 0| 73 0 | 0 0| 0 0| 2 0| 0 0| 2 0 | 75 0
Madison
| 4 0| 68 0| 27 0| 6 0| 105 0 | 0 0| 6 0| 2 0| 0 0| 8 0 | 113 0
Marion
| 5 0| 18 0| 13 0| 1 0| 37 0 | 0 0| 1 0| 0 0| 0 0| 1 0 | 38 0
McDuffie
| 5 0| 101 0| 35 0| 8 1| 149 0 | 1 1| 4 0| 0 0| 0 0| 5 0 | 154 0
McIntosh
| 6 0| 46 0| 20 0| 2 0| 74 0 | 0 0| 0 0| 0 0| 0 0| 0 0 | 74 0
Meriwether
| 20 1| 107 0| 52 1| 9 1| 188 0 | 0 0| 9 1| 1 0| 2 3| 12 0 | 200 0
Miller
| 1 0| 17 0| 12 0| 1 0| 31 0 | 0 0| 2 0| 1 0| 0 0| 3 0 | 34 0
Mitchell
| 13 0| 127 1| 55 1| 5 0| 200 1 | 3 2| 8 0| 1 0| 0 0| 12 0 | 212 1
Monroe
| 9 0| 60 0| 30 0| 4 0| 103 0 | 0 0| 2 0| 1 0| 0 0| 3 0 | 106 0
Montgomery
| 3 0| 27 0| 7 0| 1 0| 38 0 | 0 0| 4 0| 0 0| 0 0| 4 0 | 42 0
Morgan
| 6 0| 51 0| 21 0| 5 0| 83 0 | 0 0| 7 0| 0 0| 0 0| 7 0 | 90 0
Murray
| 14 0| 81 0| 45 0| 11 1| 151 0 | 1 1| 8 0| 4 1| 0 0| 13 1 | 164 0
Muscogee
| 153 4| 816 3| 341 3| 40 3| 1350 3 | 5 3| 58 4| 25 4| 2 3| 90 4 | 1440 3
------------------------------------------------------------------------------------------------------------------------------------
(continued)
Page 34 Run 06/18/01
Georgia Department of Corrections Office of Planning and Analysis
Inmate statistical profile
Sample: ACTIVE PRISONERS EXCLUDING JAIL
Requestor: Statistics
Active inmates 06/18/2001
Home County by current age & sex
(continued)
|
MEN
|
WOMEN
|
| Age | Age | Age | Age | Men
| Age | Age | Age | Age |Women
|Grand
Home County
|00-21 %|22-39 %|40-54 %|55-99 %|Total % |00-21 %|22-39 %|40-54 %|55-99 %|Total % |Total %
------------------------------------------------------------------------------------------------------------------------------------
Newton
| 21 1| 215 1| 77 1| 13 1| 326 1 | 1 1| 11 1| 4 1| 3 5| 19 1 | 345 1
Oconee
| 1 0| 20 0| 17 0| 2 0| 40 0 | 1 1| 0 0| 1 0| 0 0| 2 0 | 42 0
Oglethrope
| 4 0| 36 0| 7 0| 1 0| 48 0 | 1 1| 2 0| 0 0| 0 0| 3 0 | 51 0
Paulding
| 14 0| 76 0| 56 1| 8 1| 154 0 | 0 0| 14 1| 4 1| 1 2| 19 1 | 173 0
Peach
| 5 0| 53 0| 31 0| 0 0| 89 0 | 1 1| 3 0| 1 0| 0 0| 5 0 | 94 0
Pickens
| 5 0| 51 0| 33 0| 4 0| 93 0 | 0 0| 4 0| 3 0| 0 0| 7 0 | 100 0
Pierce
| 8 0| 21 0| 16 0| 1 0| 46 0 | 0 0| 2 0| 0 0| 0 0| 2 0 | 48 0
Pike
| 4 0| 20 0| 17 0| 3 0| 44 0 | 0 0| 0 0| 0 0| 0 0| 0 0 | 44 0
Polk
| 11 0| 117 0| 49 0| 9 1| 186 0 | 0 0| 8 0| 2 0| 0 0| 10 0 | 196 0
Pulaski
| 15 0| 46 0| 18 0| 2 0| 81 0 | 0 0| 7 0| 0 0| 0 0| 7 0 | 88 0
Putnam
| 14 0| 74 0| 44 0| 4 0| 136 0 | 0 0| 3 0| 3 0| 1 2| 7 0 | 143 0
Quitman
| 0 0| 6 0| 0 0| 0 0| 6 0 | 0 0| 0 0| 0 0| 1 2| 1 0 | 7 0
Rabun
| 3 0| 29 0| 10 0| 1 0| 43 0 | 0 0| 1 0| 0 0| 0 0| 1 0 | 44 0
Randolph
| 8 0| 53 0| 10 0| 2 0| 73 0 | 0 0| 0 0| 2 0| 0 0| 2 0 | 75 0
Richmond
| 156 4| 1069 4| 438 4| 42 3| 1705 4 | 3 2| 83 5| 41 6| 1 2| 128 5 | 1833 4
Rockdale
| 24 1| 122 1| 68 1| 12 1| 226 1 | 3 2| 5 0| 3 0| 0 0| 11 0 | 237 1
Schely
| 3 0| 12 0| 6 0| 0 0| 21 0 | 0 0| 0 0| 0 0| 0 0| 0 0 | 21 0
Screven
| 3 0| 65 0| 20 0| 4 0| 92 0 | 3 2| 5 0| 1 0| 0 0| 9 0 | 101 0
Seminole
| 5 0| 45 0| 23 0| 3 0| 76 0 | 0 0| 3 0| 2 0| 0 0| 5 0 | 81 0
Spalding
| 54 2| 355 1| 140 1| 17 1| 566 1 | 4 3| 25 2| 11 2| 1 2| 41 2 | 607 1
Stephens
| 6 0| 84 0| 33 0| 6 0| 129 0 | 0 0| 7 0| 2 0| 0 0| 9 0 | 138 0
Stewart
| 3 0| 21 0| 8 0| 1 0| 33 0 | 1 1| 0 0| 0 0| 0 0| 1 0 | 34 0
Sumter
| 20 1| 134 1| 51 1| 5 0| 210 1 | 0 0| 13 1| 5 1| 0 0| 18 1 | 228 1
Talbot
| 5 0| 31 0| 9 0| 0 0| 45 0 | 1 1| 0 0| 3 0| 0 0| 4 0 | 49 0
Taliaferro
| 0 0| 11 0| 2 0| 0 0| 13 0 | 0 0| 0 0| 1 0| 0 0| 1 0 | 14 0
Tattnall
| 7 0| 87 0| 25 0| 4 0| 123 0 | 0 0| 3 0| 6 1| 0 0| 9 0 | 132 0
Taylor
| 10 0| 41 0| 18 0| 3 0| 72 0 | 0 0| 3 0| 0 0| 0 0| 3 0 | 75 0
Telfair
| 8 0| 79 0| 31 0| 2 0| 120 0 | 1 1| 5 0| 3 0| 0 0| 9 0 | 129 0
Terrell
| 5 0| 58 0| 15 0| 1 0| 79 0 | 0 0| 3 0| 0 0| 0 0| 3 0 | 82 0
Thomas
| 31 1| 179 1| 72 1| 9 1| 291 1 | 0 0| 15 1| 3 0| 0 0| 18 1 | 309 1
Tift
| 24 1| 180 1| 83 1| 10 1| 297 1 | 1 1| 7 0| 2 0| 1 2| 11 0 | 308 1
Toombs
| 28 1| 143 1| 60 1| 6 0| 237 1 | 1 1| 14 1| 1 0| 0 0| 16 1 | 253 1
Towns
| 0 0| 9 0| 4 0| 1 0| 14 0 | 0 0| 1 0| 0 0| 0 0| 1 0 | 15 0
Treutlen
| 4 0| 31 0| 12 0| 1 0| 48 0 | 1 1| 1 0| 1 0| 0 0| 3 0 | 51 0
Troup
| 57 2| 393 2| 124 1| 20 1| 594 2 | 5 3| 25 2| 10 1| 0 0| 40 2 | 634 2
------------------------------------------------------------------------------------------------------------------------------------
(continued)
Page 35 Run 06/18/01
Georgia Department of Corrections Office of Planning and Analysis
Inmate statistical profile
Sample: ACTIVE PRISONERS EXCLUDING JAIL
Requestor: Statistics
Active inmates 06/18/2001
Home County by current age & sex
(continued)
|
MEN
|
WOMEN
|
| Age | Age | Age | Age | Men
| Age | Age | Age | Age |Women
|Grand
Home County
|00-21 %|22-39 %|40-54 %|55-99 %|Total % |00-21 %|22-39 %|40-54 %|55-99 %|Total % |Total %
------------------------------------------------------------------------------------------------------------------------------------
Turner
| 7 0| 48 0| 21 0| 1 0| 77 0 | 0 0| 3 0| 1 0| 0 0| 4 0 | 81 0
Twiggs
| 4 0| 27 0| 10 0| 0 0| 41 0 | 0 0| 0 0| 0 0| 0 0| 0 0 | 41 0
Union
| 3 0| 23 0| 9 0| 1 0| 36 0 | 0 0| 4 0| 1 0| 0 0| 5 0 | 41 0
Upson
| 20 1| 107 0| 48 0| 9 1| 184 0 | 1 1| 7 0| 3 0| 0 0| 11 0 | 195 0
Walker
| 15 0| 150 1| 56 1| 9 1| 230 1 | 1 1| 15 1| 5 1| 1 2| 22 1 | 252 1
Walton
| 19 1| 190 1| 72 1| 14 1| 295 1 | 0 0| 10 1| 7 1| 0 0| 17 1 | 312 1
Ware
| 26 1| 230 1| 106 1| 11 1| 373 1 | 1 1| 14 1| 7 1| 0 0| 22 1 | 395 1
Warren
| 4 0| 18 0| 18 0| 4 0| 44 0 | 0 0| 0 0| 1 0| 0 0| 1 0 | 45 0
Washington
| 12 0| 79 0| 30 0| 2 0| 123 0 | 1 1| 4 0| 2 0| 0 0| 7 0 | 130 0
Wayne
| 8 0| 79 0| 28 0| 4 0| 119 0 | 0 0| 5 0| 0 0| 1 2| 6 0 | 125 0
Webster
| 1 0| 5 0| 2 0| 0 0| 8 0 | 0 0| 0 0| 0 0| 0 0| 0 0 | 8 0
Wheeler
| 1 0| 20 0| 10 0| 4 0| 35 0 | 0 0| 1 0| 0 0| 0 0| 1 0 | 36 0
White
| 4 0| 35 0| 16 0| 3 0| 58 0 | 1 1| 4 0| 1 0| 0 0| 6 0 | 64 0
Whitfield
| 38 1| 296 1| 139 1| 22 2| 495 1 | 1 1| 32 2| 12 2| 0 0| 45 2 | 540 1
Wilcox
| 2 0| 31 0| 18 0| 5 0| 56 0 | 0 0| 6 0| 0 0| 0 0| 6 0 | 62 0
Wilkes
| 7 0| 39 0| 17 0| 4 0| 67 0 | 0 0| 5 0| 0 0| 0 0| 5 0 | 72 0
Wilkinson
| 3 0| 37 0| 12 0| 1 0| 53 0 | 0 0| 2 0| 0 0| 0 0| 2 0 | 55 0
Worth
| 3 0| 83 0| 32 0| 6 0| 124 0 | 0 0| 4 0| 1 0| 0 0| 5 0 | 129 0
------------------------------------------------------------------------------------------------------------------------------------
Total reported
| 3485 100|24305 100|10183 100| 1461 100|39434 100 | 148 100| 1655 100| 674 100| 60 100| 2537 100 |41971 100
|
|
|
|
|
|
|
|
|
|
|
Percent reported |
93.3|
92.5|
91.5|
89.2|
92.2 |
92.5|
92.9|
92.1|
90.9|
92.6 |
92.2
|
|
|
|
|
|
|
|
|
|
|
|
|
|
|
|
|
|
|
|
|
|
Not reported
| 252 | 1964 | 941 | 177 | 3334
| 12 | 127 | 58 | 6 | 203
| 3537
------------------------------------------------------------------------------------------------------------------------------------
Total
| 3737 |26269 |11124 | 1638 |42768
| 160 | 1782 | 732 | 66 | 2740
|45508
Georgia Department of Corrections
Page 36 Run 06/18/01
Office of Planning and Analysis
Inmate statistical profile
Sample: ACTIVE PRISONERS EXCLUDING JAIL
Requestor: Statistics
Active inmates 06/18/2001
Prison Sentence In Years by current age & sex
|
MEN
|
WOMEN
|
| Age | Age | Age | Age | Men
| Age | Age | Age | Age |Women
|Grand
Sentence In Years |00-21 %|22-39 %|40-54 %|55-99 %|Total % |00-21 %|22-39 %|40-54 %|55-99 %|Total % |Total %
------------------------------------------------------------------------------------------------------------------------------------
0-1
| 104 3| 311 1| 109 1| 5 0| 529 1 | 2 1| 33 2| 9 1| 2 3| 46 2 | 575 1
1.1-2
| 261 7| 910 3| 316 3| 32 2| 1519 4 | 15 9| 104 6| 40 5| 1 2| 160 6 | 1679 4
2.1-3
| 237 6| 1001 4| 409 4| 45 3| 1692 4 | 20 13| 153 9| 43 6| 2 3| 218 8 | 1910 4
3.1-4
| 245 7| 824 3| 320 3| 31 2| 1420 3 | 9 6| 106 6| 35 5| 1 2| 151 6 | 1571 3
4.1-5
| 228 6| 988 4| 329 3| 33 2| 1578 4 | 9 6| 114 6| 36 5| 1 2| 160 6 | 1738 4
5.1-6
| 623 17| 2958 11| 1134 10| 125 8| 4840 11 | 36 23| 313 18| 120 16| 10 15| 479 18 | 5319 12
6.1-7
| 192 5| 937 4| 324 3| 39 2| 1492 3 | 10 6| 86 5| 45 6| 1 2| 142 5 | 1634 4
7.1-8
| 135 4| 1073 4| 342 3| 48 3| 1598 4 | 5 3| 78 4| 32 4| 2 3| 117 4 | 1715 4
8.1-9
| 127 3| 1067 4| 328 3| 39 2| 1561 4 | 9 6| 70 4| 22 3| 1 2| 102 4 | 1663 4
9.1-10
| 29 1| 329 1| 107 1| 10 1| 475 1 | 0 0| 31 2| 11 2| 1 2| 43 2 | 518 1
10.1-12
| 799 21| 4514 17| 1361 12| 203 12| 6877 16 | 19 12| 265 15| 98 13| 3 5| 385 14 | 7262 16
12.1-15
| 181 5| 1759 7| 591 5| 72 4| 2603 6 | 4 3| 87 5| 38 5| 3 5| 132 5 | 2735 6
15.1-20
| 211 6| 2778 11| 1164 10| 174 11| 4327 10 | 5 3| 100 6| 56 8| 7 11| 168 6 | 4495 10
20.1-OVER
| 169 5| 3572 14| 2002 18| 311 19| 6054 14 | 7 4| 110 6| 57 8| 6 9| 180 7 | 6234 14
LIFE
| 180 5| 3012 11| 2130 19| 440 27| 5762 13 | 9 6| 123 7| 88 12| 25 38| 245 9 | 6007 13
DEATH
| 1 0| 58 0| 58 1| 10 1| 127 0 | 0 0| 1 0| 0 0| 0 0| 1 0 | 128 0
LIFE W/O PAROLE
| 3 0| 139 1| 84 1| 15 1| 241 1 | 0 0| 2 0| 0 0| 0 0| 2 0 | 243 1
YOUTHFUL OFFENDERS | 0 0| 2 0| 0 0| 0 0| 2 0 | 0 0| 0 0| 0 0| 0 0| 0 0 | 2 0
------------------------------------------------------------------------------------------------------------------------------------
Total reported
| 3725 100|26232 100|11108 100| 1632 100|42697 100 | 159 100| 1776 100| 730 100| 66 100| 2731 100 |45428 100
|
|
|
|
|
|
|
|
|
|
|
Percent reported |
99.7|
99.9|
99.9|
99.6|
99.8 |
99.4|
99.7|
99.7| 100.0|
99.7 |
99.8
|
|
|
|
|
|
|
|
|
|
|
|
|
|
|
|
|
|
|
|
|
|
NOT REPORTED
| 12 | 37 | 16 | 6 | 71
|1|6|2|0|9
| 80
------------------------------------------------------------------------------------------------------------------------------------
Total
| 3737 |26269 |11124 | 1638 |42768
| 160 | 1782 | 732 | 66 | 2740
|45508
|
|
|
|
|
|
|
|
|
|
|
|
|
|
|
|
|
|
|
|
|
|
|
|
|
|
|
|
|
|
|
|
|
|
|
|
|
|
|
|
|
|
|
|
|
|
|
|
|
|
|
|
|
|
|
AVG EXCLUDING
|
|
|
|
|
|
|
|
|
|
|
LIFE, DEATH, YO
| 7.69 | 11.23 | 12.78 | 14.39 | 11.36 | 6.49 | 7.86 | 8.77 | 9.91 | 8.05 | 11.15
|
|
|
|
|
|
|
|
|
|
|
|
|
|
|
|
|
|
|
|
|
|
|
|
|
|
|
|
|
|
|
|
|
|
|
|
|
|
|
|
|
|
|
|
|
|
|
|
|
|
|
|
|
|
|
AVG INCLUDING
|
|
|
|
|
|
|
|
|
|
|
LIFE=21, YO=3 YRS | 8.33 | 12.31 | 14.29 | 16.08 | 12.62 | 7.31 | 8.76 | 10.25 | 14.11 | 9.20 | 12.41
Page 37 Run 06/18/01
Georgia Department of Corrections Office of Planning and Analysis
Inmate statistical profile
Sample: ACTIVE PRISONERS EXCLUDING JAIL Active inmates 06/18/2001
Requestor: Statistics Probation To Follow Prison by current age & sex
|
MEN
|
WOMEN
|
| Age | Age | Age | Age | Men
| Age | Age | Age | Age |Women
|Grand
Prob After Prison |00-21 %|22-39 %|40-54 %|55-99 %|Total % |00-21 %|22-39 %|40-54 %|55-99 %|Total % |Total %
------------------------------------------------------------------------------------------------------------------------------------
PROBATION TO FOLLOW | 1652 44| 8023 31| 2994 27| 474 29|13143 31 | 74 46| 615 35| 238 33| 20 30| 947 35 |14090 31
NO PROBATION
| 2085 56|18246 69| 8130 73| 1164 71|29625 69 | 86 54| 1167 65| 494 67| 46 70| 1793 65 |31418 69
------------------------------------------------------------------------------------------------------------------------------------
Total reported
| 3737 100|26269 100|11124 100| 1638 100|42768 100 | 160 100| 1782 100| 732 100| 66 100| 2740 100 |45508 100
|
|
|
|
|
|
|
|
|
|
|
Percent reported | 100.0| 100.0| 100.0| 100.0| 100.0 | 100.0| 100.0| 100.0| 100.0| 100.0 | 100.0
|
|
|
|
|
|
|
|
|
|
|
|
|
|
|
|
|
|
|
|
|
|
NOT REPORTED
|0|0|0|0|0
|0|0|0|0|0
|0
------------------------------------------------------------------------------------------------------------------------------------
Total
| 3737 |26269 |11124 | 1638 |42768
| 160 | 1782 | 732 | 66 | 2740
|45508
Page 38 Run 06/18/01
Georgia Department of Corrections Office of Planning and Analysis
Inmate statistical profile
Sample: ACTIVE PRISONERS EXCLUDING JAIL Active inmates 06/18/2001
Requestor: Statistics Admission Type by current age & sex
|
MEN
|
WOMEN
|
| Age | Age | Age | Age | Men
| Age | Age | Age | Age |Women
|Grand
Admission Type
|00-21 %|22-39 %|40-54 %|55-99 %|Total % |00-21 %|22-39 %|40-54 %|55-99 %|Total % |Total %
------------------------------------------------------------------------------------------------------------------------------------
COMMITTED FROM COURT| 3053 82|16878 64| 7219 65| 1227 75|28377 66 | 128 81| 1105 62| 463 63| 60 91| 1756 64 |30133 66
RETURN APPEAL/BOND | 0 0| 6 0| 4 0| 0 0| 10 0 | 0 0| 0 0| 1 0| 0 0| 1 0 | 11 0
PAROLE REV/NEW SENT | 130 3| 4318 16| 1890 17| 192 12| 6530 15 | 5 3| 215 12| 101 14| 4 6| 325 12 | 6855 15
PAR REV/NO NEW SENT | 27 1| 845 3| 409 4| 39 2| 1320 3 | 3 2| 95 5| 26 4| 0 0| 124 5 | 1444 3
PROB VIOL/TOTAL REV | 0 0| 0 0| 1 0| 0 0| 1 0 | 0 0| 0 0| 0 0| 0 0| 0 0 | 1 0
PROB VIOL/PARTIAL | 236 6| 1211 5| 439 4| 38 2| 1924 5 | 9 6| 140 8| 48 7| 1 2| 198 7 | 2122 5
ADMIT FM OTHER CUST | 1 0| 16 0| 6 0| 5 0| 28 0 | 0 0| 0 0| 0 0| 0 0| 0 0 | 28 0
SHOCK INCARCERATION | 0 0| 0 0| 0 0| 0 0| 0 0 | 0 0| 0 0| 0 0| 0 0| 0 0 | 0 0
PROB REV/REMAINDER | 257 7| 2509 10| 867 8| 91 6| 3724 9 | 12 8| 217 12| 84 12| 1 2| 314 11 | 4038 9
NEW SENT/PAR REV PND| 0 0| 34 0| 25 0| 3 0| 62 0 | 0 0| 1 0| 1 0| 0 0| 2 0 | 64 0
LIFE W/O PAROLE
| 2 0| 84 0| 40 0| 11 1| 137 0 | 0 0| 0 0| 0 0| 0 0| 0 0 | 137 0
PAROLE REV BOOT CAMP| 0 0| 7 0| 2 0| 0 0| 9 0 | 0 0| 0 0| 0 0| 0 0| 0 0 | 9 0
PAR REV/RSN UNKNOWN | 0 0| 21 0| 57 1| 21 1| 99 0 | 0 0| 0 0| 0 0| 0 0| 0 0 | 99 0
PROBATION/PAROLE REV| 1 0| 0 0| 0 0| 0 0| 1 0 | 0 0| 0 0| 0 0| 0 0| 0 0 | 1 0
PB PAROLE RESCINDED | 0 0| 8 0| 1 0| 0 0| 9 0 | 0 0| 0 0| 0 0| 0 0| 0 0 | 9 0
PROB REVOC/SPEC COND| 5 0| 39 0| 19 0| 1 0| 64 0 | 2 1| 3 0| 6 1| 0 0| 11 0 | 75 0
PAR REV/REVOC CENTER| 6 0| 222 1| 119 1| 4 0| 351 1 | 0 0| 0 0| 0 0| 0 0| 0 0 | 351 1
INFORMATION ONLY | 0 0| 0 0| 0 0| 0 0| 0 0 | 0 0| 0 0| 0 0| 0 0| 0 0 | 0 0
INCOMPLETE SENT PKG | 0 0| 0 0| 0 0| 0 0| 0 0 | 0 0| 0 0| 0 0| 0 0| 0 0 | 0 0
HANCOCK REVOC CENTER| 0 0| 3 0| 0 0| 0 0| 3 0 | 0 0| 0 0| 0 0| 0 0| 0 0 | 3 0
WHITWORTH DETENTION | 2 0| 28 0| 11 0| 1 0| 42 0 | 0 0| 0 0| 0 0| 0 0| 0 0 | 42 0
DCYS AT RISK
| 7 0| 3 0| 0 0| 0 0| 10 0 | 0 0| 0 0| 0 0| 0 0| 0 0 | 10 0
OTHER
| 0 0| 0 0| 0 0| 0 0| 0 0 | 0 0| 0 0| 0 0| 0 0| 0 0 | 0 0
------------------------------------------------------------------------------------------------------------------------------------
Total reported
| 3727 100|26232 100|11109 100| 1633 100|42701 100 | 159 100| 1776 100| 730 100| 66 100| 2731 100 |45432 100
|
|
|
|
|
|
|
|
|
|
|
Percent reported |
99.7|
99.9|
99.9|
99.7|
99.8 |
99.4|
99.7|
99.7| 100.0|
99.7 |
99.8
|
|
|
|
|
|
|
|
|
|
|
|
|
|
|
|
|
|
|
|
|
|
UNKNOWN
| 10 | 37 | 15 | 5 | 67
|1|6|2|0|9
| 76
------------------------------------------------------------------------------------------------------------------------------------
Total
| 3737 |26269 |11124 | 1638 |42768
| 160 | 1782 | 732 | 66 | 2740
|45508
Page 39 Run 06/18/01
Georgia Department of Corrections Office of Planning and Analysis
Inmate statistical profile
Sample: ACTIVE PRISONERS EXCLUDING JAIL Active inmates 06/18/2001
Requestor: Statistics Release Type by current age & sex
|
MEN
|
WOMEN
|
| Age | Age | Age | Age | Men
| Age | Age | Age | Age |Women
|Grand
Release Type
|00-21 %|22-39 %|40-54 %|55-99 %|Total % |00-21 %|22-39 %|40-54 %|55-99 %|Total % |Total %
------------------------------------------------------------------------------------------------------------------------------------
PAROLE
| 10 0| 37 0| 15 0| 5 0| 67 0 | 1 1| 6 0| 2 0| 0 0| 9 0 | 76 0
SENTENCE EXPIRED | 0 0| 0 0| 1 0| 0 0| 1 0 | 0 0| 0 0| 0 0| 0 0| 0 0 | 1 0
Active
| 3737 100|26269 100|11123 100| 1638 100|42767 100 | 160 100| 1782 100| 732 100| 66 100| 2740 100 |45507 100
------------------------------------------------------------------------------------------------------------------------------------
Total
| 3737 |26269 |11124 | 1638 |42768
| 160 | 1782 | 732 | 66 | 2740
|45508
Page 40 Run 06/18/01
Georgia Department of Corrections Office of Planning and Analysis
Inmate statistical profile
Sample: ACTIVE PRISONERS EXCLUDING JAIL Active inmates 06/18/2001
Requestor: Statistics Inst By Group by current age & sex
|
MEN
|
WOMEN
|
| Age | Age | Age | Age | Men
| Age | Age | Age | Age |Women
|Grand
Inst By Group
|00-21 %|22-39 %|40-54 %|55-99 %|Total % |00-21 %|22-39 %|40-54 %|55-99 %|Total % |Total %
------------------------------------------------------------------------------------------------------------------------------------
County jails
| 0 0| 0 0| 0 0| 0 0| 0 0 | 0 0| 0 0| 0 0| 0 0| 0 0 | 0 0
Transitional centers| 16 0| 477 2| 209 2| 15 1| 717 2 | 8 5| 134 8| 55 8| 1 2| 198 7 | 915 2
County camps
| 332 9| 2868 11| 697 6| 23 1| 3920 9 | 0 0| 0 0| 0 0| 0 0| 0 0 | 3920 9
Inmate boot camps | 270 7| 511 2| 0 0| 0 0| 781 2 | 0 0| 0 0| 0 0| 0 0| 0 0 | 781 2
State prisons
| 2737 73|19533 74| 8998 81| 1471 90|32739 77 | 152 95| 1648 92| 677 92| 65 98| 2542 93 |35281 78
Private prisons
| 378 10| 2858 11| 1213 11| 129 8| 4578 11 | 0 0| 0 0| 0 0| 0 0| 0 0 | 4578 10
Other
| 1 0| 13 0| 2 0| 0 0| 16 0 | 0 0| 0 0| 0 0| 0 0| 0 0 | 16 0
------------------------------------------------------------------------------------------------------------------------------------
Total reported
| 3734 100|26260 100|11119 100| 1638 100|42751 100 | 160 100| 1782 100| 732 100| 66 100| 2740 100 |45491 100
|
|
|
|
|
|
|
|
|
|
|
Percent reported |
99.9| 100.0| 100.0| 100.0| 100.0 | 100.0| 100.0| 100.0| 100.0| 100.0 | 100.0
|
|
|
|
|
|
|
|
|
|
|
|
|
|
|
|
|
|
|
|
|
|
Not reported
| 3 | 9 | 5 | 0 | 17
|0|0|0|0|0
| 17
------------------------------------------------------------------------------------------------------------------------------------
Total
| 3737 |26269 |11124 | 1638 |42768
| 160 | 1782 | 732 | 66 | 2740
|45508
Page 41 Run 06/18/01
Georgia Department of Corrections Office of Planning and Analysis
Inmate statistical profile
Sample: ACTIVE PRISONERS EXCLUDING JAIL Active inmates 06/18/2001
Requestor: Statistics Institution by current age & sex
|
MEN
|
WOMEN
|
| Age | Age | Age | Age | Men
| Age | Age | Age | Age |Women
|Grand
Institution
|00-21 %|22-39 %|40-54 %|55-99 %|Total % |00-21 %|22-39 %|40-54 %|55-99 %|Total % |Total %
------------------------------------------------------------------------------------------------------------------------------------
Albany Trans Ctr | 3 0| 100 0| 42 0| 3 0| 148 0 | 0 0| 0 0| 0 0| 0 0| 0 0 | 148 0
Atlanta Trans Ctr(M)| 4 0| 160 1| 75 1| 8 0| 247 1 | 0 0| 0 0| 0 0| 0 0| 0 0 | 247 1
Macon Trans Ctr
| 5 0| 82 0| 36 0| 2 0| 125 0 | 0 0| 0 0| 0 0| 0 0| 0 0 | 125 0
Metro Trans Ctr (W) | 0 0| 0 0| 0 0| 0 0| 0 0 | 6 4| 85 5| 32 4| 1 2| 124 5 | 124 0
New Horizons
| 0 0| 0 0| 0 0| 0 0| 0 0 | 0 0| 0 0| 1 0| 0 0| 1 0 | 1 0
Savannah Trans Ctr | 4 0| 135 1| 56 1| 2 0| 197 0 | 0 0| 0 0| 0 0| 0 0| 0 0 | 197 0
Savannah Womens TC | 0 0| 0 0| 0 0| 0 0| 0 0 | 2 1| 49 3| 22 3| 0 0| 73 3 | 73 0
Central State Hosp | 1 0| 13 0| 2 0| 0 0| 16 0 | 0 0| 0 0| 0 0| 0 0| 0 0 | 16 0
Bulloch County
| 15 0| 92 0| 24 0| 1 0| 132 0 | 0 0| 0 0| 0 0| 0 0| 0 0 | 132 0
Carroll County
| 19 1| 149 1| 36 0| 3 0| 207 0 | 0 0| 0 0| 0 0| 0 0| 0 0 | 207 0
Clarke County
| 2 0| 75 0| 18 0| 0 0| 95 0 | 0 0| 0 0| 0 0| 0 0| 0 0 | 95 0
Colquitt County
| 22 1| 128 0| 26 0| 0 0| 176 0 | 0 0| 0 0| 0 0| 0 0| 0 0 | 176 0
Coweta County
| 12 0| 130 0| 52 0| 3 0| 197 0 | 0 0| 0 0| 0 0| 0 0| 0 0 | 197 0
Decatur County
| 5 0| 64 0| 27 0| 0 0| 96 0 | 0 0| 0 0| 0 0| 0 0| 0 0 | 96 0
Effingham County | 4 0| 44 0| 8 0| 0 0| 56 0 | 0 0| 0 0| 0 0| 0 0| 0 0 | 56 0
Floyd County
| 13 0| 152 1| 47 0| 1 0| 213 0 | 0 0| 0 0| 0 0| 0 0| 0 0 | 213 0
Gwinnett County
| 18 0| 78 0| 23 0| 1 0| 120 0 | 0 0| 0 0| 0 0| 0 0| 0 0 | 120 0
Hall County
| 16 0| 187 1| 27 0| 1 0| 231 1 | 0 0| 0 0| 0 0| 0 0| 0 0 | 231 1
Harris County
| 5 0| 36 0| 6 0| 1 0| 48 0 | 0 0| 0 0| 0 0| 0 0| 0 0 | 48 0
Jackson County
| 8 0| 100 0| 30 0| 1 0| 139 0 | 0 0| 0 0| 0 0| 0 0| 0 0 | 139 0
Jefferson County | 20 1| 140 1| 23 0| 1 0| 184 0 | 0 0| 0 0| 0 0| 0 0| 0 0 | 184 0
Mitchell County
| 3 0| 47 0| 18 0| 0 0| 68 0 | 0 0| 0 0| 0 0| 0 0| 0 0 | 68 0
Muscogee County
| 48 1| 359 1| 85 1| 2 0| 494 1 | 0 0| 0 0| 0 0| 0 0| 0 0 | 494 1
Richmond County
| 6 0| 142 1| 39 0| 3 0| 190 0 | 0 0| 0 0| 0 0| 0 0| 0 0 | 190 0
Screven County
| 16 0| 110 0| 12 0| 0 0| 138 0 | 0 0| 0 0| 0 0| 0 0| 0 0 | 138 0
Spalding County
| 5 0| 114 0| 30 0| 1 0| 150 0 | 0 0| 0 0| 0 0| 0 0| 0 0 | 150 0
Stewart County
| 6 0| 32 0| 6 0| 0 0| 44 0 | 0 0| 0 0| 0 0| 0 0| 0 0 | 44 0
Sumter County
| 42 1| 246 1| 40 0| 1 0| 329 1 | 0 0| 0 0| 0 0| 0 0| 0 0 | 329 1
Terrell County
| 8 0| 91 0| 32 0| 1 0| 132 0 | 0 0| 0 0| 0 0| 0 0| 0 0 | 132 0
Thomas County
| 7 0| 105 0| 20 0| 1 0| 133 0 | 0 0| 0 0| 0 0| 0 0| 0 0 | 133 0
Troup County
| 9 0| 86 0| 28 0| 1 0| 124 0 | 0 0| 0 0| 0 0| 0 0| 0 0 | 124 0
Clayton County
| 23 1| 161 1| 40 0| 0 0| 224 1 | 0 0| 0 0| 0 0| 0 0| 0 0 | 224 0
Ware Prison
| 116 3| 852 3| 286 3| 33 2| 1287 3 | 0 0| 0 0| 0 0| 0 0| 0 0 | 1287 3
Lowndes Prison
| 27 1| 210 1| 66 1| 4 0| 307 1 | 0 0| 0 0| 0 0| 0 0| 0 0 | 307 1
Dodge Prison
| 58 2| 673 3| 384 3| 36 2| 1151 3 | 0 0| 0 0| 0 0| 0 0| 0 0 | 1151 3
Phillips Prison
| 82 2| 563 2| 297 3| 53 3| 995 2 | 0 0| 0 0| 0 0| 0 0| 0 0 | 995 2
------------------------------------------------------------------------------------------------------------------------------------
(continued)
Page 42 Run 06/18/01
Georgia Department of Corrections Office of Planning and Analysis
Inmate statistical profile
Sample: ACTIVE PRISONERS EXCLUDING JAIL
Requestor: Statistics
Active inmates 06/18/2001
Institution by current age & sex
(CONTINUED)
|
MEN
|
WOMEN
|
| Age | Age | Age | Age | Men
| Age | Age | Age | Age |Women
|Grand
Institution
|00-21 %|22-39 %|40-54 %|55-99 %|Total % |00-21 %|22-39 %|40-54 %|55-99 %|Total % |Total %
------------------------------------------------------------------------------------------------------------------------------------
Walker Prison
| 75 2| 361 1| 161 1| 25 2| 622 1 | 0 0| 0 0| 0 0| 0 0| 0 0 | 622 1
Wayne Prison
| 4 0| 113 0| 75 1| 8 0| 200 0 | 0 0| 0 0| 0 0| 0 0| 0 0 | 200 0
Arrendale Prison | 505 14| 558 2| 156 1| 8 0| 1227 3 | 0 0| 0 0| 0 0| 0 0| 0 0 | 1227 3
Montgomery Prison | 27 1| 283 1| 73 1| 5 0| 388 1 | 0 0| 0 0| 0 0| 0 0| 0 0 | 388 1
Lee Prison
| 59 2| 474 2| 182 2| 13 1| 728 2 | 0 0| 0 0| 0 0| 0 0| 0 0 | 728 2
Putnam Prison
| 14 0| 89 0| 35 0| 0 0| 138 0 | 0 0| 0 0| 0 0| 0 0| 0 0 | 138 0
Georgia State Prison| 34 1| 806 3| 328 3| 32 2| 1200 3 | 0 0| 0 0| 0 0| 0 0| 0 0 | 1200 3
Mens Prison
| 3 0| 142 1| 245 2| 264 16| 654 2 | 0 0| 0 0| 0 0| 0 0| 0 0 | 654 1
Jackson Prison-Diag | 174 5| 936 4| 439 4| 60 4| 1609 4 | 0 0| 0 0| 0 0| 0 0| 0 0 | 1609 4
Jackson Prison-Perm | 2 0| 130 0| 104 1| 11 1| 247 1 | 0 0| 0 0| 0 0| 0 0| 0 0 | 247 1
Coastal Prison
| 187 5| 880 3| 379 3| 29 2| 1475 3 | 0 0| 1 0| 0 0| 0 0| 1 0 | 1476 3
Scott Prison
| 64 2| 722 3| 324 3| 29 2| 1139 3 | 0 0| 0 0| 0 0| 0 0| 0 0 | 1139 3
Rivers Prison
| 55 1| 689 3| 316 3| 36 2| 1096 3 | 0 0| 0 0| 0 0| 0 0| 0 0 | 1096 2
Rutledge Prison
| 18 0| 276 1| 213 2| 47 3| 554 1 | 0 0| 0 0| 0 0| 0 0| 0 0 | 554 1
Central Prison
| 22 1| 414 2| 306 3| 45 3| 787 2 | 0 0| 0 0| 0 0| 0 0| 0 0 | 787 2
Augusta Med Prison | 58 2| 554 2| 360 3| 97 6| 1069 3 | 0 0| 0 0| 1 0| 0 0| 1 0 | 1070 2
Rogers Prison
| 181 5| 827 3| 244 2| 12 1| 1264 3 | 0 0| 0 0| 0 0| 0 0| 0 0 | 1264 3
Burruss Prison
| 31 1| 187 1| 65 1| 15 1| 298 1 | 0 0| 0 0| 0 0| 0 0| 0 0 | 298 1
Bostick Prison
| 6 0| 194 1| 264 2| 142 9| 606 1 | 0 0| 0 0| 0 0| 0 0| 0 0 | 606 1
Valdosta Prison
| 38 1| 559 2| 225 2| 35 2| 857 2 | 0 0| 0 0| 0 0| 0 0| 0 0 | 857 2
Hays Prison
| 108 3| 698 3| 333 3| 49 3| 1188 3 | 0 0| 0 0| 0 0| 0 0| 0 0 | 1188 3
Hancock Prison
| 100 3| 856 3| 373 3| 45 3| 1374 3 | 0 0| 0 0| 0 0| 0 0| 0 0 | 1374 3
Telfair Prison
| 70 2| 730 3| 244 2| 22 1| 1066 2 | 0 0| 0 0| 0 0| 0 0| 0 0 | 1066 2
Autry Prison
| 72 2| 805 3| 393 4| 63 4| 1333 3 | 0 0| 0 0| 0 0| 0 0| 0 0 | 1333 3
Washington Mens Pris| 39 1| 82 0| 26 0| 1 0| 148 0 | 0 0| 0 0| 0 0| 0 0| 0 0 | 148 0
Wilcox Prison
| 70 2| 777 3| 416 4| 55 3| 1318 3 | 0 0| 0 0| 0 0| 0 0| 0 0 | 1318 3
Calhoun Prison
| 73 2| 772 3| 344 3| 48 3| 1237 3 | 0 0| 0 0| 0 0| 0 0| 0 0 | 1237 3
Dooly Prison
| 64 2| 664 3| 354 3| 32 2| 1114 3 | 0 0| 0 0| 0 0| 0 0| 0 0 | 1114 2
Macon Prison
| 68 2| 897 3| 334 3| 59 4| 1358 3 | 0 0| 0 0| 0 0| 0 0| 0 0 | 1358 3
Smith Prison
| 70 2| 777 3| 247 2| 25 2| 1119 3 | 0 0| 0 0| 0 0| 0 0| 0 0 | 1119 2
Homerville Prison | 6 0| 127 0| 65 1| 2 0| 200 0 | 0 0| 0 0| 0 0| 0 0| 0 0 | 200 0
Washingtn Women Pris| 0 0| 0 0| 0 0| 0 0| 0 0 | 49 31| 529 30| 235 32| 25 38| 838 31 | 838 2
Baldwin Prison
| 78 2| 446 2| 205 2| 22 1| 751 2 | 0 0| 0 0| 0 0| 0 0| 0 0 | 751 2
Metro Womens Prison | 0 0| 1 0| 0 0| 0 0| 1 0 | 35 22| 421 24| 187 26| 21 32| 664 24 | 665 1
Pulaski Womens Pris | 0 0| 1 0| 0 0| 0 0| 1 0 | 68 43| 697 39| 254 35| 19 29| 1038 38 | 1039 2
------------------------------------------------------------------------------------------------------------------------------------
(continued)
Page 43 Run 06/18/01
Georgia Department of Corrections Office of Planning and Analysis
Inmate statistical profile
Sample: ACTIVE PRISONERS EXCLUDING JAIL
Requestor: Statistics
Active inmates 06/18/2001
Institution by current age & sex
(CONTINUED)
|
MEN
|
WOMEN
|
| Age | Age | Age | Age | Men
| Age | Age | Age | Age |Women
|Grand
Institution
|00-21 %|22-39 %|40-54 %|55-99 %|Total % |00-21 %|22-39 %|40-54 %|55-99 %|Total % |Total %
------------------------------------------------------------------------------------------------------------------------------------
Pelham PreTrans Unit| 2 0| 123 0| 63 1| 4 0| 192 0 | 0 0| 0 0| 0 0| 0 0| 0 0 | 192 0
Milan Prison
| 58 2| 154 1| 47 0| 0 0| 259 1 | 0 0| 0 0| 0 0| 0 0| 0 0 | 259 1
West Central Prison | 19 1| 131 0| 27 0| 5 0| 182 0 | 0 0| 0 0| 0 0| 0 0| 0 0 | 182 0
D Ray James Prison | 126 3| 1007 4| 394 4| 33 2| 1560 4 | 0 0| 0 0| 0 0| 0 0| 0 0 | 1560 3
Coffee Corr Facility| 141 4| 923 4| 400 4| 45 3| 1509 4 | 0 0| 0 0| 0 0| 0 0| 0 0 | 1509 3
Wheeler Corr Facilty| 111 3| 928 4| 419 4| 51 3| 1509 4 | 0 0| 0 0| 0 0| 0 0| 0 0 | 1509 3
Transfer Inst Unkn | 0 0| 0 0| 1 0| 0 0| 1 0 | 0 0| 0 0| 0 0| 0 0| 0 0 | 1 0
Montgomery BC
| 33 1| 54 0| 0 0| 0 0| 87 0 | 0 0| 0 0| 0 0| 0 0| 0 0 | 87 0
Scott BC
| 23 1| 54 0| 0 0| 0 0| 77 0 | 0 0| 0 0| 0 0| 0 0| 0 0 | 77 0
Burruss BC
| 58 2| 92 0| 0 0| 0 0| 150 0 | 0 0| 0 0| 0 0| 0 0| 0 0 | 150 0
Hays BC
| 71 2| 128 0| 0 0| 0 0| 199 0 | 0 0| 0 0| 0 0| 0 0| 0 0 | 199 0
Baldwin BC
| 85 2| 183 1| 0 0| 0 0| 268 1 | 0 0| 0 0| 0 0| 0 0| 0 0 | 268 1
------------------------------------------------------------------------------------------------------------------------------------
Total reported
| 3734 100|26260 100|11120 100| 1638 100|42752 100 | 160 100| 1782 100| 732 100| 66 100| 2740 100 |45492 100
|
|
|
|
|
|
|
|
|
|
|
Percent reported |
99.9| 100.0| 100.0| 100.0| 100.0 | 100.0| 100.0| 100.0| 100.0| 100.0 | 100.0
|
|
|
|
|
|
|
|
|
|
|
|
|
|
|
|
|
|
|
|
|
|
Not Reported
| 3 | 9 | 4 | 0 | 16
|0|0|0|0|0
| 16
------------------------------------------------------------------------------------------------------------------------------------
Total
| 3737 |26269 |11124 | 1638 |42768
| 160 | 1782 | 732 | 66 | 2740
|45508
Page 44 Run 06/18/01
Georgia Department of Corrections Office of Planning and Analysis
Inmate statistical profile
Sample: ACTIVE PRISONERS EXCLUDING JAIL Active inmates 06/18/2001
Requestor: Statistics Misdemeanors And Felonies by current age & sex
|
MEN
|
WOMEN
|
| Age | Age | Age | Age | Men
| Age | Age | Age | Age |Women
|Grand
Crime Type
|00-21 %|22-39 %|40-54 %|55-99 %|Total % |00-21 %|22-39 %|40-54 %|55-99 %|Total % |Total %
------------------------------------------------------------------------------------------------------------------------------------
MISDEMEANOR
| 7 0| 39 0| 24 0| 2 0| 72 0 | 0 0| 3 0| 2 0| 0 0| 5 0 | 77 0
FELONY
| 3718 100|26193 100|11083 100| 1630 100|42624 100 | 159 100| 1773 100| 728 100| 66 100| 2726 100 |45350 100
------------------------------------------------------------------------------------------------------------------------------------
Total reported
| 3725 100|26232 100|11107 100| 1632 100|42696 100 | 159 100| 1776 100| 730 100| 66 100| 2731 100 |45427 100
|
|
|
|
|
|
|
|
|
|
|
Percent reported |
99.7|
99.9|
99.8|
99.6|
99.8 |
99.4|
99.7|
99.7| 100.0|
99.7 |
99.8
|
|
|
|
|
|
|
|
|
|
|
|
|
|
|
|
|
|
|
|
|
|
NOT REPORTED
| 12 | 37 | 17 | 6 | 72
|1|6|2|0|9
| 81
------------------------------------------------------------------------------------------------------------------------------------
Total
| 3737 |26269 |11124 | 1638 |42768
| 160 | 1782 | 732 | 66 | 2740
|45508
Page 45 Run 06/18/01
Georgia Department of Corrections Office of Planning and Analysis
Inmate statistical profile
Sample: ACTIVE PRISONERS EXCLUDING JAIL Active inmates 06/18/2001
Requestor: Statistics Crimes By Group by current age & sex
|
MEN
|
WOMEN
|
| Age | Age | Age | Age | Men
| Age | Age | Age | Age |Women
|Grand
Crimes By Group
|00-21 %|22-39 %|40-54 %|55-99 %|Total % |00-21 %|22-39 %|40-54 %|55-99 %|Total % |Total %
------------------------------------------------------------------------------------------------------------------------------------
HOMICIDE
| 229 6| 3022 12| 1719 15| 459 28| 5429 13 | 20 13| 223 13| 134 18| 35 53| 412 15 | 5841 13
ABORTION
| 0 0| 0 0| 0 0| 0 0| 0 0 | 0 0| 0 0| 0 0| 0 0| 0 0 | 0 0
BODILY INJRY&REL OFF| 504 14| 3902 15| 1504 14| 199 12| 6109 14 | 20 13| 173 10| 83 11| 5 8| 281 10 | 6390 14
ARSON & REL OFF
| 20 1| 188 1| 58 1| 9 1| 275 1 | 2 1| 8 0| 11 2| 2 3| 23 1 | 298 1
DAMAGE OF PROPERTY | 18 0| 61 0| 27 0| 3 0| 109 0 | 0 0| 4 0| 0 0| 0 0| 4 0 | 113 0
BURGLARY & REL OFF | 552 15| 3087 12| 1150 10| 46 3| 4835 11 | 14 9| 135 8| 35 5| 0 0| 184 7 | 5019 11
FORGERY & REL OFF | 54 1| 730 3| 335 3| 17 1| 1136 3 | 20 13| 294 17| 91 12| 6 9| 411 15 | 1547 3
THEFT
| 290 8| 1658 6| 700 6| 55 3| 2703 6 | 13 8| 201 11| 104 14| 2 3| 320 12 | 3023 7
ROBBERY
| 1128 30| 4580 17| 1175 11| 78 5| 6961 16 | 48 30| 166 9| 39 5| 0 0| 253 9 | 7214 16
SEXUAL OFFENSES
| 265 7| 2823 11| 2025 18| 529 32| 5642 13 | 3 2| 44 2| 27 4| 0 0| 74 3 | 5716 13
OBSCENITY CRIMES | 0 0| 0 0| 2 0| 1 0| 3 0 | 0 0| 0 0| 0 0| 0 0| 0 0 | 3 0
TREASON & REL OFF | 0 0| 1 0| 1 0| 0 0| 2 0 | 0 0| 1 0| 0 0| 0 0| 1 0 | 3 0
CRIMES INVOLVNG GOVT| 75 2| 617 2| 186 2| 7 0| 885 2 | 1 1| 36 2| 19 3| 0 0| 56 2 | 941 2
FALSIFICATIONS
| 0 0| 20 0| 7 0| 2 0| 29 0 | 1 1| 2 0| 1 0| 0 0| 4 0 | 33 0
OBSTRUCT LAW ENFORCE| 12 0| 86 0| 28 0| 2 0| 128 0 | 0 0| 6 0| 2 0| 1 2| 9 0 | 137 0
DISORDERLY CONDUCT | 9 0| 32 0| 9 0| 0 0| 50 0 | 0 0| 0 0| 0 0| 0 0| 0 0 | 50 0
GAMBLING & REL OFF | 1 0| 3 0| 1 0| 1 0| 6 0 | 0 0| 1 0| 0 0| 0 0| 1 0 | 7 0
CRUELTY TO CHILDREN | 10 0| 188 1| 52 0| 10 1| 260 1 | 5 3| 67 4| 11 2| 0 0| 83 3 | 343 1
CRIMES WITH GUNS | 8 0| 109 0| 56 1| 6 0| 179 0 | 0 0| 2 0| 0 0| 0 0| 2 0 | 181 0
INVASION PRIVACY | 3 0| 7 0| 9 0| 1 0| 20 0 | 0 0| 0 0| 0 0| 0 0| 0 0 | 20 0
RACKETEERING
| 0 0| 10 0| 17 0| 0 0| 27 0 | 0 0| 3 0| 2 0| 0 0| 5 0 | 32 0
DRUG ABUSE OFFENSES | 474 13| 3943 15| 1523 14| 131 8| 6071 14 | 9 6| 317 18| 135 18| 12 18| 473 17 | 6544 14
DRUG TRAFFICKING | 33 1| 749 3| 224 2| 29 2| 1035 2 | 1 1| 50 3| 19 3| 3 5| 73 3 | 1108 2
AUTO CRIMES
| 6 0| 265 1| 246 2| 39 2| 556 1 | 0 0| 14 1| 10 1| 0 0| 24 1 | 580 1
REVENUE & CONTRABAND| 0 0| 0 0| 0 0| 0 0| 0 0 | 0 0| 0 0| 0 0| 0 0| 0 0 | 0 0
CRIMES OF OTH STATES| 0 0| 0 0| 1 0| 0 0| 1 0 | 0 0| 1 0| 0 0| 0 0| 1 0 | 2 0
MISC. FELONIES
| 24 1| 101 0| 25 0| 5 0| 155 0 | 2 1| 24 1| 5 1| 0 0| 31 1 | 186 0
MISDEMEANORS
| 7 0| 39 0| 24 0| 2 0| 72 0 | 0 0| 3 0| 2 0| 0 0| 5 0 | 77 0
------------------------------------------------------------------------------------------------------------------------------------
Total reported
| 3722 100|26221 100|11104 100| 1631 100|42678 100 | 159 100| 1775 100| 730 100| 66 100| 2730 100 |45408 100
|
|
|
|
|
|
|
|
|
|
|
Percent reported |
99.6|
99.8|
99.8|
99.6|
99.8 |
99.4|
99.6|
99.7| 100.0|
99.6 |
99.8
|
|
|
|
|
|
|
|
|
|
|
|
|
|
|
|
|
|
|
|
|
|
NOT REPORTED
| 15 | 48 | 20 | 7 | 90
| 1 | 7 | 2 | 0 | 10
| 100
------------------------------------------------------------------------------------------------------------------------------------
Total
| 3737 |26269 |11124 | 1638 |42768
| 160 | 1782 | 732 | 66 | 2740
|45508
Page 46 Run 06/18/01
Georgia Department of Corrections Office of Planning and Analysis
Inmate statistical profile
Sample: ACTIVE PRISONERS EXCLUDING JAIL Active inmates 06/18/2001
Requestor: Statistics Most Serious Offense by current age & sex
|
MEN
|
WOMEN
|
| Age | Age | Age | Age | Men
| Age | Age | Age | Age |Women
|Grand
Most Serious Offense|00-21 %|22-39 %|40-54 %|55-99 %|Total % |00-21 %|22-39 %|40-54 %|55-99 %|Total % |Total %
------------------------------------------------------------------------------------------------------------------------------------
Misdemeanors
|
|
|
------------------------------------------------------------------------------------------------------------------------------------
------------------------------------------------------------------------------------------------------------------------------------
abandonment
| 0 0| 1 0| 0 0| 0 0| 1 0 | 0 0| 0 0| 0 0| 0 0| 0 0 | 1 0
stalking
| 0 0| 2 0| 0 0| 0 0| 2 0 | 0 0| 0 0| 0 0| 0 0| 0 0 | 2 0
aggravated assault | 0 0| 1 0| 0 0| 0 0| 1 0 | 0 0| 0 0| 0 0| 0 0| 0 0 | 1 0
simple assault
| 0 0| 1 0| 0 0| 0 0| 1 0 | 0 0| 0 0| 0 0| 0 0| 0 0 | 1 0
simple battery
| 0 0| 1 0| 5 0| 1 0| 7 0 | 0 0| 1 0| 0 0| 0 0| 1 0 | 8 0
reckless conduct | 0 0| 1 0| 0 0| 0 0| 1 0 | 0 0| 0 0| 0 0| 0 0| 0 0 | 1 0
disorderly conduct | 0 0| 1 0| 0 0| 0 0| 1 0 | 0 0| 0 0| 0 0| 0 0| 0 0 | 1 0
theft by taking
| 0 0| 2 0| 2 0| 0 0| 4 0 | 0 0| 0 0| 0 0| 0 0| 0 0 | 4 0
robbery
| 0 0| 1 0| 0 0| 0 0| 1 0 | 0 0| 0 0| 0 0| 0 0| 0 0 | 1 0
bad checks
| 0 0| 1 0| 1 0| 0 0| 2 0 | 0 0| 2 0| 0 0| 0 0| 2 0 | 4 0
poss of narcotics | 0 0| 1 0| 0 0| 0 0| 1 0 | 0 0| 0 0| 0 0| 0 0| 0 0 | 1 0
poss of marijuana | 1 0| 2 0| 1 0| 0 0| 4 0 | 0 0| 0 0| 0 0| 0 0| 0 0 | 4 0
viol motor veh law | 0 0| 2 0| 3 0| 0 0| 5 0 | 0 0| 0 0| 0 0| 0 0| 0 0 | 5 0
d.u.i.
| 0 0| 6 0| 5 0| 1 0| 12 0 | 0 0| 0 0| 0 0| 0 0| 0 0 | 12 0
obstr of law enf off| 1 0| 8 0| 2 0| 0 0| 11 0 | 0 0| 0 0| 0 0| 0 0| 0 0 | 11 0
impersonating anothe| 1 0| 1 0| 0 0| 0 0| 2 0 | 0 0| 0 0| 0 0| 0 0| 0 0 | 2 0
criminal trespassing| 0 0| 2 0| 2 0| 0 0| 4 0 | 0 0| 0 0| 0 0| 0 0| 0 0 | 4 0
sexual battery
| 0 0| 1 0| 0 0| 0 0| 1 0 | 0 0| 0 0| 0 0| 0 0| 0 0 | 1 0
escape
| 1 0| 0 0| 0 0| 0 0| 1 0 | 0 0| 0 0| 0 0| 0 0| 0 0 | 1 0
cpwl & concealed wea| 1 0| 1 0| 0 0| 0 0| 2 0 | 0 0| 0 0| 0 0| 0 0| 0 0 | 2 0
shoplifting
| 0 0| 1 0| 0 0| 0 0| 1 0 | 0 0| 0 0| 0 0| 0 0| 0 0 | 1 0
pointing gun at anot| 0 0| 1 0| 0 0| 0 0| 1 0 | 0 0| 0 0| 0 0| 0 0| 0 0 | 1 0
carry dly weapons pu| 0 0| 0 0| 1 0| 0 0| 1 0 | 0 0| 0 0| 0 0| 0 0| 0 0 | 1 0
inciting to riot | 0 0| 0 0| 0 0| 0 0| 0 0 | 0 0| 0 0| 1 0| 0 0| 1 0 | 1 0
theft by deception <| 0 0| 1 0| 0 0| 0 0| 1 0 | 0 0| 0 0| 0 0| 0 0| 0 0 | 1 0
------------------------------------------------------------------------------------------------------------------------------------
FELONIES
|
|
|
------------------------------------------------------------------------------------------------------------------------------------
------------------------------------------------------------------------------------------------------------------------------------
------------------------------------------------------------------------------------------------------------------------------------
(continued)
Page 47 Run 06/18/01
Georgia Department of Corrections Office of Planning and Analysis
Inmate statistical profile
Sample: ACTIVE PRISONERS EXCLUDING JAIL
Requestor: Statistics
Active inmates 06/18/2001
Most Serious Offense by current age & sex
(CONTINUED)
|
MEN
|
WOMEN
|
| Age | Age | Age | Age | Men
| Age | Age | Age | Age |Women
|Grand
Most Serious Offense|00-21 %|22-39 %|40-54 %|55-99 %|Total % |00-21 %|22-39 %|40-54 %|55-99 %|Total % |Total %
------------------------------------------------------------------------------------------------------------------------------------
FELONIES
|
|
|
------------------------------------------------------------------------------------------------------------------------------------
------------------------------------------------------------------------------------------------------------------------------------
misc misdemeanor | 2 0| 0 0| 2 0| 0 0| 4 0 | 0 0| 0 0| 1 0| 0 0| 1 0 | 5 0
MISC. HOMICIDE OFFEN| 3 0| 5 0| 3 0| 0 0| 11 0 | 0 0| 0 0| 0 0| 0 0| 0 0 | 11 0
MURDER
| 136 4| 2058 8| 1342 12| 350 21| 3886 9 | 9 6| 113 6| 73 10| 25 38| 220 8 | 4106 9
VOLUNTARY MANSLAUGHT| 56 2| 709 3| 283 3| 78 5| 1126 3 | 9 6| 80 5| 49 7| 8 12| 146 5 | 1272 3
INVOLUNTARY MANSLAUG| 18 0| 78 0| 19 0| 10 1| 125 0 | 1 1| 13 1| 2 0| 0 0| 16 1 | 141 0
RECKLESS ABANDONMENT| 0 0| 0 0| 0 0| 0 0| 0 0 | 0 0| 1 0| 0 0| 0 0| 1 0 | 1 0
FETICIDE
| 0 0| 2 0| 2 0| 0 0| 4 0 | 0 0| 0 0| 0 0| 0 0| 0 0 | 4 0
VEHICULAR HOMICIDE | 19 1| 163 1| 71 1| 17 1| 270 1 | 1 1| 15 1| 6 1| 2 3| 24 1 | 294 1
HOMICIDE BY PILOT,DU| 0 0| 7 0| 1 0| 1 0| 9 0 | 0 0| 0 0| 3 0| 0 0| 3 0 | 12 0
CONCEAL DEATH OF ANO| 0 0| 2 0| 0 0| 1 0| 3 0 | 0 0| 0 0| 0 0| 0 0| 0 0 | 3 0
CRIMINAL ATTEMPT MUR| 0 0| 3 0| 1 0| 2 0| 6 0 | 0 0| 1 0| 1 0| 0 0| 2 0 | 8 0
MISC. ASSAULT/BATTER| 2 0| 28 0| 13 0| 1 0| 44 0 | 0 0| 0 0| 0 0| 0 0| 0 0 | 44 0
AGGRAVATED ASSAULT | 313 8| 2402 9| 886 8| 133 8| 3734 9 | 17 11| 124 7| 55 8| 3 5| 199 7 | 3933 9
CRMNL ATTEMPT AGG AS| 0 0| 2 0| 1 0| 0 0| 3 0 | 0 0| 0 0| 0 0| 0 0| 0 0 | 3 0
AGGRAVATED BATTERY | 52 1| 301 1| 124 1| 17 1| 494 1 | 1 1| 19 1| 12 2| 1 2| 33 1 | 527 1
TERRORIST THREATS & | 22 1| 150 1| 67 1| 6 0| 245 1 | 0 0| 2 0| 5 1| 0 0| 7 0 | 252 1
FALSE IMPRISONMENT | 7 0| 76 0| 26 0| 2 0| 111 0 | 0 0| 1 0| 2 0| 0 0| 3 0 | 114 0
KIDNAPPING
| 92 2| 655 2| 281 3| 26 2| 1054 2 | 2 1| 12 1| 8 1| 0 0| 22 1 | 1076 2
INTERFERENCE WITH CU| 1 0| 2 0| 0 0| 0 0| 3 0 | 0 0| 0 0| 0 0| 0 0| 0 0 | 3 0
AGG ASSLT ON POLICE | 10 0| 193 1| 59 1| 9 1| 271 1 | 0 0| 8 0| 1 0| 0 0| 9 0 | 280 1
AGG BATRY PEACE OFFI| 0 0| 6 0| 2 0| 0 0| 8 0 | 0 0| 0 0| 0 0| 0 0| 0 0 | 8 0
SIMPLE BATTERY MISD | 0 0| 1 0| 2 0| 0 0| 3 0 | 0 0| 0 0| 0 0| 0 0| 0 0 | 3 0
RECK COND-HIV INFCTD| 0 0| 6 0| 2 0| 0 0| 8 0 | 0 0| 5 0| 0 0| 1 2| 6 0 | 14 0
STALKING
| 0 0| 0 0| 1 0| 0 0| 1 0 | 0 0| 0 0| 0 0| 0 0| 0 0 | 1 0
AGGRAVATED STALKING | 4 0| 73 0| 38 0| 5 0| 120 0 | 0 0| 2 0| 0 0| 0 0| 2 0 | 122 0
CRIMINAL ATTEMPT KID| 1 0| 7 0| 2 0| 0 0| 10 0 | 0 0| 0 0| 0 0| 0 0| 0 0 | 10 0
MISC. ARSON
| 0 0| 1 0| 1 0| 1 0| 3 0 | 0 0| 0 0| 0 0| 0 0| 0 0 | 3 0
FIRST DEGREE ARSON | 13 0| 159 1| 48 0| 8 0| 228 1 | 2 1| 8 0| 9 1| 1 2| 20 1 | 248 1
SECOND DEGREE ARSON | 7 0| 28 0| 8 0| 0 0| 43 0 | 0 0| 0 0| 2 0| 1 2| 3 0 | 46 0
CRIMINAL POSS EXPLOS| 0 0| 0 0| 1 0| 0 0| 1 0 | 0 0| 0 0| 0 0| 0 0| 0 0 | 1 0
CRIM. DAMAGE 1ST DEG| 2 0| 18 0| 5 0| 0 0| 25 0 | 0 0| 1 0| 0 0| 0 0| 1 0 | 26 0
------------------------------------------------------------------------------------------------------------------------------------
(continued)
Page 48 Run 06/18/01
Georgia Department of Corrections Office of Planning and Analysis
Inmate statistical profile
Sample: ACTIVE PRISONERS EXCLUDING JAIL
Requestor: Statistics
Active inmates 06/18/2001
Most Serious Offense by current age & sex
(CONTINUED)
|
MEN
|
WOMEN
|
| Age | Age | Age | Age | Men
| Age | Age | Age | Age |Women
|Grand
Most Serious Offense|00-21 %|22-39 %|40-54 %|55-99 %|Total % |00-21 %|22-39 %|40-54 %|55-99 %|Total % |Total %
------------------------------------------------------------------------------------------------------------------------------------
CRIM. DAMAGE 2ND DEG| 13 0| 40 0| 19 0| 3 0| 75 0 | 0 0| 2 0| 0 0| 0 0| 2 0 | 77 0
VANDALISM TO CHURCH | 1 0| 0 0| 0 0| 0 0| 1 0 | 0 0| 1 0| 0 0| 0 0| 1 0 | 2 0
ALTER I.D.
| 2 0| 3 0| 3 0| 0 0| 8 0 | 0 0| 0 0| 0 0| 0 0| 0 0 | 8 0
BURGLARY
| 542 15| 3064 12| 1130 10| 46 3| 4782 11 | 13 8| 133 7| 35 5| 0 0| 181 7 | 4963 11
POSS BURGLAR TOOLS | 6 0| 13 0| 10 0| 0 0| 29 0 | 1 1| 2 0| 0 0| 0 0| 3 0 | 32 0
CRMNL ATMPT COMMIT B| 4 0| 10 0| 10 0| 0 0| 24 0 | 0 0| 0 0| 0 0| 0 0| 0 0 | 24 0
MISC. FORGERY
| 1 0| 7 0| 2 0| 0 0| 10 0 | 0 0| 2 0| 0 0| 0 0| 2 0 | 12 0
FORGERY 1ST DEGREE | 43 1| 654 2| 306 3| 10 1| 1013 2 | 19 12| 267 15| 82 11| 5 8| 373 14 | 1386 3
FORGERY 2ND DEGREE | 1 0| 10 0| 7 0| 1 0| 19 0 | 1 1| 8 0| 2 0| 0 0| 11 0 | 30 0
BAD CHECKS
| 0 0| 1 0| 2 0| 1 0| 4 0 | 0 0| 0 0| 0 0| 0 0| 0 0 | 4 0
THEFT CREDIT CARD | 2 0| 18 0| 6 0| 0 0| 26 0 | 0 0| 3 0| 2 0| 0 0| 5 0 | 31 0
FRAUDULENT CREDIT CA| 6 0| 26 0| 5 0| 0 0| 37 0 | 0 0| 10 1| 3 0| 0 0| 13 0 | 50 0
TELECOMMUNICATIONS F| 0 0| 2 0| 0 0| 0 0| 2 0 | 0 0| 0 0| 0 0| 0 0| 0 0 | 2 0
CRMNL ATMPT COMMIT F| 0 0| 1 0| 0 0| 0 0| 1 0 | 0 0| 0 0| 0 0| 0 0| 0 0 | 1 0
MISC. FRAUD
| 1 0| 11 0| 7 0| 5 0| 24 0 | 0 0| 4 0| 2 0| 1 2| 7 0 | 31 0
THEFT BY TAKING
| 92 2| 530 2| 202 2| 24 1| 848 2 | 3 2| 58 3| 28 4| 0 0| 89 3 | 937 2
THEFT BY DECEPTION | 1 0| 20 0| 17 0| 3 0| 41 0 | 2 1| 4 0| 0 0| 0 0| 6 0 | 47 0
THEFT BY EXTORTION | 0 0| 1 0| 1 0| 0 0| 2 0 | 0 0| 0 0| 0 0| 0 0| 0 0 | 2 0
THEFT OF LOST PROPER| 0 0| 1 0| 2 0| 0 0| 3 0 | 0 0| 0 0| 0 0| 0 0| 0 0 | 3 0
THEFT BY REC STOLEN | 130 3| 609 2| 172 2| 5 0| 916 2 | 1 1| 21 1| 7 1| 0 0| 29 1 | 945 2
THEFT OF SERVICES | 0 0| 3 0| 2 0| 0 0| 5 0 | 0 0| 0 0| 0 0| 0 0| 0 0 | 5 0
THEFT BY CONVERSION | 0 0| 23 0| 14 0| 2 0| 39 0 | 1 1| 5 0| 1 0| 0 0| 7 0 | 46 0
CONVSN PAYMNTS REAL | 0 0| 0 0| 1 0| 0 0| 1 0 | 0 0| 0 0| 0 0| 0 0| 0 0 | 1 0
THEFT OF MOTOR VEH, | 25 1| 121 0| 32 0| 0 0| 178 0 | 1 1| 5 0| 0 0| 0 0| 6 0 | 184 0
THEFT BRING PROP IN | 0 0| 12 0| 3 0| 2 0| 17 0 | 0 0| 1 0| 0 0| 0 0| 1 0 | 18 0
THEFT RECV PROP OUT | 0 0| 2 0| 0 0| 1 0| 3 0 | 0 0| 0 0| 0 0| 0 0| 0 0 | 3 0
LIVESTOCK THEFT
| 0 0| 0 0| 1 0| 0 0| 1 0 | 0 0| 0 0| 0 0| 0 0| 0 0 | 1 0
THEFT BY SHOPLIFTING| 9 0| 252 1| 227 2| 15 1| 503 1 | 5 3| 106 6| 67 9| 2 3| 180 7 | 683 2
ENTERING VEHICLE | 33 1| 84 0| 26 0| 3 0| 146 0 | 0 0| 1 0| 1 0| 0 0| 2 0 | 148 0
ROBBERY
| 458 12| 1831 7| 451 4| 22 1| 2762 6 | 35 22| 110 6| 27 4| 0 0| 172 6 | 2934 6
ARMED ROBBERY
| 598 16| 2552 10| 708 6| 56 3| 3914 9 | 12 8| 47 3| 10 1| 0 0| 69 3 | 3983 9
HIJACKING MOTOR VEHI| 12 0| 30 0| 0 0| 0 0| 42 0 | 1 1| 1 0| 0 0| 0 0| 2 0 | 44 0
CRIMINAL ATTEMPT ROB| 10 0| 31 0| 8 0| 0 0| 49 0 | 0 0| 2 0| 0 0| 0 0| 2 0 | 51 0
CRMNL ATMPT ARMED RO| 50 1| 136 1| 8 0| 0 0| 194 0 | 0 0| 6 0| 2 0| 0 0| 8 0 | 202 0
MISC. SEXUAL
| 1 0| 14 0| 9 0| 1 0| 25 0 | 0 0| 0 0| 1 0| 0 0| 1 0 | 26 0
------------------------------------------------------------------------------------------------------------------------------------
(continued)
Page 49 Run 06/18/01
Georgia Department of Corrections Office of Planning and Analysis
Inmate statistical profile
Sample: ACTIVE PRISONERS EXCLUDING JAIL
Requestor: Statistics
Active inmates 06/18/2001
Most Serious Offense by current age & sex
(CONTINUED)
|
MEN
|
WOMEN
|
| Age | Age | Age | Age | Men
| Age | Age | Age | Age |Women
|Grand
Most Serious Offense|00-21 %|22-39 %|40-54 %|55-99 %|Total % |00-21 %|22-39 %|40-54 %|55-99 %|Total % |Total %
------------------------------------------------------------------------------------------------------------------------------------
RAPE
| 58 2| 835 3| 674 6| 83 5| 1650 4 | 0 0| 1 0| 3 0| 0 0| 4 0 | 1654 4
SODOMY
| 2 0| 17 0| 16 0| 5 0| 40 0 | 0 0| 0 0| 0 0| 0 0| 0 0 | 40 0
AGGRAVATED SODOMY | 7 0| 104 0| 92 1| 30 2| 233 1 | 0 0| 1 0| 3 0| 0 0| 4 0 | 237 1
INCEST
| 1 0| 24 0| 36 0| 7 0| 68 0 | 0 0| 1 0| 0 0| 0 0| 1 0 | 69 0
BIGAMY
| 0 0| 1 0| 0 0| 0 0| 1 0 | 0 0| 0 0| 0 0| 0 0| 0 0 | 1 0
AGGRAVATED SEXUAL BA| 2 0| 38 0| 30 0| 9 1| 79 0 | 0 0| 1 0| 0 0| 0 0| 1 0 | 80 0
STATUATORY RAPE
| 53 1| 341 1| 36 0| 11 1| 441 1 | 0 0| 6 0| 0 0| 0 0| 6 0 | 447 1
CHILD MOLESTATION | 110 3| 916 3| 726 7| 248 15| 2000 5 | 2 1| 18 1| 14 2| 0 0| 34 1 | 2034 4
ENTICING CHILD-INDEC| 1 0| 22 0| 12 0| 4 0| 39 0 | 1 1| 1 0| 0 0| 0 0| 2 0 | 41 0
AGGRAV. CHILD MOLEST| 26 1| 465 2| 382 3| 128 8| 1001 2 | 0 0| 15 1| 6 1| 0 0| 21 1 | 1022 2
SEXL/ASSLT/AGN/PERS/| 0 0| 6 0| 0 0| 0 0| 6 0 | 0 0| 0 0| 0 0| 0 0| 0 0 | 6 0
CRIMINAL ATTPT RAPE | 3 0| 37 0| 10 0| 3 0| 53 0 | 0 0| 0 0| 0 0| 0 0| 0 0 | 53 0
CRIMINAL ATTPT SODOM| 0 0| 1 0| 0 0| 0 0| 1 0 | 0 0| 0 0| 0 0| 0 0| 0 0 | 1 0
CRIMINAL ATTPT AGG S| 1 0| 1 0| 2 0| 0 0| 4 0 | 0 0| 0 0| 0 0| 0 0| 0 0 | 4 0
MISC. OBSCENITY
| 0 0| 0 0| 2 0| 1 0| 3 0 | 0 0| 0 0| 0 0| 0 0| 0 0 | 3 0
MISC. PUBLIC ORDER | 0 0| 1 0| 0 0| 0 0| 1 0 | 0 0| 0 0| 0 0| 0 0| 0 0 | 1 0
FALSE SWEARNG WRITTN| 0 0| 0 0| 1 0| 0 0| 1 0 | 0 0| 1 0| 0 0| 0 0| 1 0 | 2 0
BRIBERY GOVT OFFICER| 2 0| 2 0| 1 0| 0 0| 5 0 | 0 0| 0 0| 0 0| 0 0| 0 0 | 5 0
DEFRAUDING STATE | 0 0| 0 0| 2 0| 0 0| 2 0 | 0 0| 0 0| 1 0| 0 0| 1 0 | 3 0
FALSE CERTIFICATES | 0 0| 1 0| 0 0| 0 0| 1 0 | 0 0| 0 0| 0 0| 0 0| 0 0 | 1 0
INFLUENCING WITNESS | 1 0| 2 0| 1 0| 0 0| 4 0 | 0 0| 0 0| 0 0| 0 0| 0 0 | 4 0
OBSTR OF LAW ENF OFF| 72 2| 612 2| 182 2| 7 0| 873 2 | 1 1| 36 2| 18 2| 0 0| 55 2 | 928 2
PERJURY
| 0 0| 1 0| 0 0| 1 0| 2 0 | 0 0| 0 0| 0 0| 0 0| 0 0 | 2 0
IMPERSONATION
| 0 0| 1 0| 0 0| 0 0| 1 0 | 0 0| 0 0| 0 0| 0 0| 0 0 | 1 0
IMPERSONATING OFFIC| 0 0| 1 0| 0 0| 0 0| 1 0 | 0 0| 0 0| 0 0| 0 0| 0 0 | 1 0
FALSE STATEMENTS GOV| 0 0| 16 0| 7 0| 1 0| 24 0 | 1 1| 2 0| 1 0| 0 0| 4 0 | 28 0
IMPRSNTNG ANTHR RBAL| 0 0| 1 0| 0 0| 0 0| 1 0 | 0 0| 0 0| 0 0| 0 0| 0 0 | 1 0
ESCAPE
| 10 0| 75 0| 25 0| 2 0| 112 0 | 0 0| 3 0| 1 0| 0 0| 4 0 | 116 0
AIDING ESCAPE
| 0 0| 1 0| 0 0| 0 0| 1 0 | 0 0| 0 0| 0 0| 0 0| 0 0 | 1 0
HINDERING APPREH OR | 2 0| 5 0| 1 0| 0 0| 8 0 | 0 0| 1 0| 1 0| 1 2| 3 0 | 11 0
MUTINY IN PENAL INST| 0 0| 2 0| 0 0| 0 0| 2 0 | 0 0| 0 0| 0 0| 0 0| 0 0 | 2 0
BAIL JUMPING
| 0 0| 3 0| 2 0| 0 0| 5 0 | 0 0| 2 0| 0 0| 0 0| 2 0 | 7 0
FALSE PUBLIC ALARM | 1 0| 2 0| 1 0| 0 0| 4 0 | 0 0| 0 0| 0 0| 0 0| 0 0 | 4 0
CRIM INTER WITH GOVT| 8 0| 30 0| 8 0| 0 0| 46 0 | 0 0| 0 0| 0 0| 0 0| 0 0 | 46 0
COMMERICAL GAMBLING | 0 0| 1 0| 0 0| 1 0| 2 0 | 0 0| 0 0| 0 0| 0 0| 0 0 | 2 0
------------------------------------------------------------------------------------------------------------------------------------
(continued)
Page 50 Run 06/18/01
Georgia Department of Corrections Office of Planning and Analysis
Inmate statistical profile
Sample: ACTIVE PRISONERS EXCLUDING JAIL
Requestor: Statistics
Active inmates 06/18/2001
Most Serious Offense by current age & sex
(CONTINUED)
|
MEN
|
WOMEN
|
| Age | Age | Age | Age | Men
| Age | Age | Age | Age |Women
|Grand
Most Serious Offense|00-21 %|22-39 %|40-54 %|55-99 %|Total % |00-21 %|22-39 %|40-54 %|55-99 %|Total % |Total %
------------------------------------------------------------------------------------------------------------------------------------
SOLICIT/ACCEPTING BR| 0 0| 1 0| 0 0| 0 0| 1 0 | 0 0| 1 0| 0 0| 0 0| 1 0 | 2 0
DOGFIGHTING
| 1 0| 0 0| 0 0| 0 0| 1 0 | 0 0| 0 0| 0 0| 0 0| 0 0 | 1 0
BUS HIJACKING
| 0 0| 1 0| 1 0| 0 0| 2 0 | 0 0| 0 0| 0 0| 0 0| 0 0 | 2 0
CRUELTY TO CHILDREN | 10 0| 183 1| 43 0| 7 0| 243 1 | 5 3| 66 4| 11 2| 0 0| 82 3 | 325 1
SEX EXPLOITATION CHI| 0 0| 3 0| 7 0| 3 0| 13 0 | 0 0| 0 0| 0 0| 0 0| 0 0 | 13 0
ABANDONMENT OF CHILD| 0 0| 2 0| 2 0| 0 0| 4 0 | 0 0| 0 0| 0 0| 0 0| 0 0 | 4 0
CNTRBTNG DELINQENCY | 0 0| 0 0| 0 0| 0 0| 0 0 | 0 0| 1 0| 0 0| 0 0| 1 0 | 1 0
MISC WEAPON/EXPLOSIV| 0 0| 3 0| 1 0| 0 0| 4 0 | 0 0| 0 0| 0 0| 0 0| 0 0 | 4 0
CARRY CONCEALED WEAP| 1 0| 3 0| 2 0| 0 0| 6 0 | 0 0| 0 0| 0 0| 0 0| 0 0 | 6 0
ALTER PISTL LICENSE | 1 0| 0 0| 0 0| 0 0| 1 0 | 0 0| 0 0| 0 0| 0 0| 0 0 | 1 0
POSS OF FIREARM DUR | 3 0| 9 0| 4 0| 1 0| 17 0 | 0 0| 0 0| 0 0| 0 0| 0 0 | 17 0
POSS OF CERTAIN WEAP| 1 0| 15 0| 8 0| 2 0| 26 0 | 0 0| 0 0| 0 0| 0 0| 0 0 | 26 0
POSS FIREARM CONVCT | 0 0| 75 0| 41 0| 3 0| 119 0 | 0 0| 1 0| 0 0| 0 0| 1 0 | 120 0
CARRYING WEAPON AT S| 2 0| 3 0| 0 0| 0 0| 5 0 | 0 0| 1 0| 0 0| 0 0| 1 0 | 6 0
DESTROY/INJUR POLICE| 0 0| 1 0| 0 0| 0 0| 1 0 | 0 0| 0 0| 0 0| 0 0| 0 0 | 1 0
MISC INVASION OF PRI| 0 0| 0 0| 2 0| 0 0| 2 0 | 0 0| 0 0| 0 0| 0 0| 0 0 | 2 0
PEEPING TOM
| 3 0| 7 0| 7 0| 1 0| 18 0 | 0 0| 0 0| 0 0| 0 0| 0 0 | 18 0
RACKETEERING
| 0 0| 10 0| 17 0| 0 0| 27 0 | 0 0| 3 0| 2 0| 0 0| 5 0 | 32 0
S/D NARCOTICS, OPIAT| 4 0| 82 0| 51 0| 6 0| 143 0 | 0 0| 5 0| 5 1| 1 2| 11 0 | 154 0
S/D DEP,STIM,CNTRF D| 3 0| 54 0| 21 0| 2 0| 80 0 | 0 0| 6 0| 2 0| 0 0| 8 0 | 88 0
SALE-DIST OF LSD | 1 0| 2 0| 0 0| 0 0| 3 0 | 0 0| 0 0| 0 0| 0 0| 0 0 | 3 0
SALE/DIST OF MARIJUA| 29 1| 198 1| 78 1| 9 1| 314 1 | 1 1| 11 1| 4 1| 2 3| 18 1 | 332 1
POSS NARCOTICS, OPIA| 7 0| 138 1| 81 1| 4 0| 230 1 | 0 0| 19 1| 9 1| 0 0| 28 1 | 258 1
POSS DEP,STIM,CNTRF | 4 0| 76 0| 42 0| 4 0| 126 0 | 0 0| 9 1| 1 0| 1 2| 11 0 | 137 0
POSS OF L.S.D.
| 0 0| 5 0| 0 0| 0 0| 5 0 | 0 0| 1 0| 1 0| 0 0| 2 0 | 7 0
POSS OF MARIJUANA | 38 1| 195 1| 54 0| 5 0| 292 1 | 0 0| 15 1| 1 0| 1 2| 17 1 | 309 1
ILLEGAL ATTM TO OBT | 2 0| 4 0| 4 0| 2 0| 12 0 | 0 0| 8 0| 2 0| 0 0| 10 0 | 22 0
VIOLATE GA CNTRL SBS| 4 0| 64 0| 18 0| 0 0| 86 0 | 0 0| 2 0| 2 0| 0 0| 4 0 | 90 0
VIOLATE DNGROUS DRGS| 0 0| 2 0| 1 0| 0 0| 3 0 | 0 0| 1 0| 0 0| 0 0| 1 0 | 4 0
UNLWFL MFG/DEL/DIST | 3 0| 24 0| 8 0| 0 0| 35 0 | 0 0| 2 0| 0 0| 0 0| 2 0 | 37 0
POSS DRUG RELATED MA| 0 0| 3 0| 2 0| 0 0| 5 0 | 0 0| 0 0| 0 0| 0 0| 0 0 | 5 0
SALE/DIST CONT SUB P| 13 0| 41 0| 11 0| 1 0| 66 0 | 0 0| 2 0| 1 0| 0 0| 3 0 | 69 0
SALE/DIST CONT SUB S| 7 0| 21 0| 6 0| 1 0| 35 0 | 0 0| 2 0| 0 0| 0 0| 2 0 | 37 0
SALE/DISTRIBUTION CO| 147 4| 1472 6| 544 5| 37 2| 2200 5 | 5 3| 108 6| 44 6| 3 5| 160 6 | 2360 5
POSSESSION OF COCAIN| 210 6| 1539 6| 595 5| 57 3| 2401 6 | 3 2| 123 7| 62 8| 4 6| 192 7 | 2593 6
------------------------------------------------------------------------------------------------------------------------------------
(continued)
Page 51 Run 06/18/01
Georgia Department of Corrections Office of Planning and Analysis
Inmate statistical profile
Sample: ACTIVE PRISONERS EXCLUDING JAIL
Requestor: Statistics
Active inmates 06/18/2001
Most Serious Offense by current age & sex
(CONTINUED)
|
MEN
|
WOMEN
|
| Age | Age | Age | Age | Men
| Age | Age | Age | Age |Women
|Grand
Most Serious Offense|00-21 %|22-39 %|40-54 %|55-99 %|Total % |00-21 %|22-39 %|40-54 %|55-99 %|Total % |Total %
------------------------------------------------------------------------------------------------------------------------------------
CRMNL ATPT VIOL SUBS| 2 0| 23 0| 7 0| 3 0| 35 0 | 0 0| 3 0| 1 0| 0 0| 4 0 | 39 0
MISC. DRUGS TRAFFICK| 14 0| 222 1| 56 1| 6 0| 298 1 | 0 0| 17 1| 8 1| 1 2| 26 1 | 324 1
COCAINE LESS 200 GRA| 10 0| 329 1| 104 1| 16 1| 459 1 | 0 0| 14 1| 6 1| 0 0| 20 1 | 479 1
COCAINE 201-400 GRAM| 1 0| 55 0| 12 0| 2 0| 70 0 | 0 0| 5 0| 3 0| 0 0| 8 0 | 78 0
COCAINE 401 OR MORE | 2 0| 83 0| 25 0| 3 0| 113 0 | 1 1| 8 0| 0 0| 2 3| 11 0 | 124 0
NARCOTICS LESS 14 GR| 0 0| 2 0| 0 0| 0 0| 2 0 | 0 0| 0 0| 0 0| 0 0| 0 0 | 2 0
NARCOTICS 15-28 GRAM| 0 0| 1 0| 0 0| 0 0| 1 0 | 0 0| 0 0| 0 0| 0 0| 0 0 | 1 0
NARCOTICS 29 MORE GR| 0 0| 3 0| 2 0| 0 0| 5 0 | 0 0| 0 0| 0 0| 0 0| 0 0 | 5 0
MARIJUANA 101-2000 P| 4 0| 16 0| 4 0| 0 0| 24 0 | 0 0| 3 0| 0 0| 0 0| 3 0 | 27 0
MARIJUANA 2001-10000| 0 0| 1 0| 0 0| 0 0| 1 0 | 0 0| 0 0| 0 0| 0 0| 0 0 | 1 0
TRFFKNG MTHAQUALONE>| 0 0| 1 0| 0 0| 0 0| 1 0 | 0 0| 0 0| 0 0| 0 0| 0 0 | 1 0
AMPHETAMINE 28-199 G| 0 0| 7 0| 12 0| 0 0| 19 0 | 0 0| 0 0| 1 0| 0 0| 1 0 | 20 0
AMPHETAMINE 200-399 | 0 0| 3 0| 0 0| 0 0| 3 0 | 0 0| 1 0| 0 0| 0 0| 1 0 | 4 0
AMPHETAMINE 400+ GRA| 0 0| 7 0| 1 0| 0 0| 8 0 | 0 0| 1 0| 0 0| 0 0| 1 0 | 9 0
USE COMM FACLTY VIO | 0 0| 1 0| 2 0| 0 0| 3 0 | 0 0| 0 0| 0 0| 0 0| 0 0 | 3 0
ATT/CONSPRCY COMMT C| 2 0| 18 0| 5 0| 2 0| 27 0 | 0 0| 1 0| 1 0| 0 0| 2 0 | 29 0
ILLGL DIST CONTRLLD | 0 0| 0 0| 1 0| 0 0| 1 0 | 0 0| 0 0| 0 0| 0 0| 0 0 | 1 0
VIOL MOTOR VEHICLE L| 5 0| 56 0| 39 0| 6 0| 106 0 | 0 0| 4 0| 3 0| 0 0| 7 0 | 113 0
DRVNG HABTL VIOLATOR| 1 0| 205 1| 198 2| 31 2| 435 1 | 0 0| 10 1| 7 1| 0 0| 17 1 | 452 1
HABIT TRAF VOIL/IMPA| 0 0| 2 0| 9 0| 2 0| 13 0 | 0 0| 0 0| 0 0| 0 0| 0 0 | 13 0
HABIT TRAF VIOL/OTHE| 0 0| 2 0| 0 0| 0 0| 2 0 | 0 0| 0 0| 0 0| 0 0| 0 0 | 2 0
MISC. MRALS/PBLIC H/| 0 0| 2 0| 0 0| 0 0| 2 0 | 0 0| 0 0| 0 0| 0 0| 0 0 | 2 0
VIOLATN GAME AND FIS| 0 0| 0 0| 0 0| 1 0| 1 0 | 0 0| 0 0| 0 0| 0 0| 0 0 | 1 0
MISC CORRECTIONL INS| 0 0| 4 0| 0 0| 0 0| 4 0 | 0 0| 1 0| 0 0| 0 0| 1 0 | 5 0
VIOLATION OTHR STATE| 0 0| 0 0| 1 0| 0 0| 1 0 | 0 0| 1 0| 0 0| 0 0| 1 0 | 2 0
CONSPIRACY
| 15 0| 63 0| 9 0| 2 0| 89 0 | 0 0| 14 1| 3 0| 0 0| 17 1 | 106 0
CRIMINAL ATTEMPT | 6 0| 22 0| 12 0| 3 0| 43 0 | 0 0| 9 1| 2 0| 0 0| 11 0 | 54 0
AIRCRAFT HIJACKING | 0 0| 1 0| 0 0| 0 0| 1 0 | 0 0| 0 0| 0 0| 0 0| 0 0 | 1 0
UNAUTH DIST RECRD DE| 0 0| 1 0| 0 0| 0 0| 1 0 | 0 0| 0 0| 0 0| 0 0| 0 0 | 1 0
CRIMINAL SOLICITATIO| 0 0| 11 0| 1 0| 0 0| 12 0 | 0 0| 0 0| 0 0| 0 0| 0 0 | 12 0
PARTY TO A CRIME | 2 0| 3 0| 2 0| 0 0| 7 0 | 2 1| 1 0| 0 0| 0 0| 3 0 | 10 0
CRIMINAL TRESPASSING| 0 0| 0 0| 1 0| 0 0| 1 0 | 0 0| 0 0| 0 0| 0 0| 0 0 | 1 0
GANG PARTICIPATION | 1 0| 0 0| 0 0| 0 0| 1 0 | 0 0| 0 0| 0 0| 0 0| 0 0 | 1 0
------------------------------------------------------------------------------------------------------------------------------------
(continued)
Page 52 Run 06/18/01
Georgia Department of Corrections Office of Planning and Analysis
Inmate statistical profile
Sample: ACTIVE PRISONERS EXCLUDING JAIL
Requestor: Statistics
Active inmates 06/18/2001
Most Serious Offense by current age & sex
(CONTINUED)
|
MEN
|
WOMEN
|
| Age | Age | Age | Age | Men
| Age | Age | Age | Age |Women
|Grand
Most Serious Offense|00-21 %|22-39 %|40-54 %|55-99 %|Total % |00-21 %|22-39 %|40-54 %|55-99 %|Total % |Total %
------------------------------------------------------------------------------------------------------------------------------------
------------------------------------------------------------------------------------------------------------------------------------
Total reported
| 3725 100|26231 100|11107 100| 1632 100|42695 100 | 159 100| 1776 100| 730 100| 66 100| 2731 100 |45426 100
|
|
|
|
|
|
|
|
|
|
|
Percent reported |
99.7|
99.9|
99.8|
99.6|
99.8 |
99.4|
99.7|
99.7| 100.0|
99.7 |
99.8
|
|
|
|
|
|
|
|
|
|
|
|
|
|
|
|
|
|
|
|
|
|
NOT REPORTED
| 12 | 38 | 17 | 6 | 73
|1|6|2|0|9
| 82
------------------------------------------------------------------------------------------------------------------------------------
Total
| 3737 |26269 |11124 | 1638 |42768
| 160 | 1782 | 732 | 66 | 2740
|45508
Page 53 Run 06/18/01
Georgia Department of Corrections Office of Planning and Analysis
Inmate statistical profile
Sample: ACTIVE PRISONERS EXCLUDING JAIL Active inmates 06/18/2001
Requestor: Statistics Most Serious Crime Type by current age & sex
|
MEN
|
WOMEN
|
| Age | Age | Age | Age | Men
| Age | Age | Age | Age |Women
|Grand
Crime Type
|00-21 %|22-39 %|40-54 %|55-99 %|Total % |00-21 %|22-39 %|40-54 %|55-99 %|Total % |Total %
------------------------------------------------------------------------------------------------------------------------------------
VIOL/PERSN
| 1873 50|11701 45| 4450 40| 744 46|18768 44 | 93 58| 629 35| 268 37| 40 61| 1030 38 |19798 44
NVIOL/PERS
| 7 0| 19 0| 9 0| 1 0| 36 0 | 0 0| 1 0| 0 0| 0 0| 1 0 | 37 0
PROPERTY
| 935 25| 5744 22| 2294 21| 131 8| 9104 21 | 49 31| 647 36| 244 33| 10 15| 950 35 |10054 22
DRUG SALES
| 240 6| 2643 10| 943 8| 85 5| 3911 9 | 7 4| 186 10| 75 10| 9 14| 277 10 | 4188 9
DRUG POSSN
| 268 7| 2052 8| 805 7| 75 5| 3200 7 | 3 2| 181 10| 79 11| 6 9| 269 10 | 3469 8
ALCOHOL
| 0 0| 0 0| 0 0| 0 0| 0 0 | 0 0| 0 0| 0 0| 0 0| 0 0 | 0 0
HABIT/DUI
| 6 0| 271 1| 251 2| 40 2| 568 1 | 0 0| 14 1| 10 1| 0 0| 24 1 | 592 1
SEX OFFEND
| 265 7| 2826 11| 2032 18| 532 33| 5655 13 | 3 2| 44 2| 27 4| 0 0| 74 3 | 5729 13
OTHER
| 131 4| 976 4| 323 3| 24 1| 1454 3 | 4 3| 74 4| 27 4| 1 2| 106 4 | 1560 3
------------------------------------------------------------------------------------------------------------------------------------
Total reported
| 3725 100|26232 100|11107 100| 1632 100|42696 100 | 159 100| 1776 100| 730 100| 66 100| 2731 100 |45427 100
|
|
|
|
|
|
|
|
|
|
|
Percent reported |
99.7|
99.9|
99.8|
99.6|
99.8 |
99.4|
99.7|
99.7| 100.0|
99.7 |
99.8
|
|
|
|
|
|
|
|
|
|
|
|
|
|
|
|
|
|
|
|
|
|
NOT REPORTED
| 12 | 37 | 17 | 6 | 72
|1|6|2|0|9
| 81
------------------------------------------------------------------------------------------------------------------------------------
Total
| 3737 |26269 |11124 | 1638 |42768
| 160 | 1782 | 732 | 66 | 2740
|45508