- Collection:
- Georgia Government Publications
- Title:
- Inmate statistical profile: all active inmates, 2000-05
- Creator:
- Georgia. Department of Corrections. Planning and Analysis Section
- Publisher:
- Atlanta, GA. : Georgia Dept. of Corrections, Office of Planning and Analysis, 2000-05
- Date of Original:
- 2000-05
- Subject:
- Prisoners--Georgia
- Location:
- United States, Georgia, 32.75042, -83.50018
- Medium:
- state government records
- Type:
- Text
- Format:
- application/pdf
- Description:
- Title from issue list screen (GALILEO, viewed Feb. 24, 2010)
- External Identifiers:
- Call Number GA R300.P5 P1 I5 2000/5
- Metadata URL:
- https://dlg.galileo.usg.edu/id:dlg_ggpd_i-ga-br300-pp5-bp1-bi5-b2000-s5-belec-p-btext
- Digital Object URL:
- https://dlg.galileo.usg.edu/do:dlg_ggpd_i-ga-br300-pp5-bp1-bi5-b2000-s5-belec-p-btext
- Language:
- eng
- Holding Institution:
- University of Georgia. Map and Government Information Library
- Rights:
-

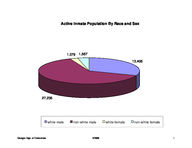
Active Inmate Population By Race and Sex
1,079 1,567
13,406
27,235
white male
non-white male
white female
non-white female
Georgia Dept. of Corrections
5/2000
1
Active Inmates By Security Status
6,294
926 2,079
1,978
17,247
Georgia Dept. of Corrections
5/2000
14,763
trusty
minimum
medium
close maximum diagnostic
2
Years
Active Inmates Prison Sentence In Years
LWOP Death
Life 20.1-Over
15.1-20 12.1-15 10.1-12
9.1-10 8.1-9 7.1-8 6.1-7 5.1-6 4.1-5 3.1-4 2.1-3 1.1-2 0-1
187 128
486
896 241
0
1000
2557
1542 1484 1408
1625 2457
2093
4222
2000
3000
4000
Number of Inmates
4952
5000
5856 5865
6629
6000
7000
Georgia Dept. of Corrections
5/2000
3
Active Inmates Who Have Probation To Follow Prison
12,371
30,916
Probation to follow No Probation
Georgia Dept. of Corrections
5/2000
4
Number of Inmates
Active Inmates Grouped By Institution
40000 35000
34,422
30000
25000
20000
15000
10000
5000
892
0
transitional centers
3,867
county camps
850
inmate boot camps
state prisons
3,245
private prisons
Georgia Dept. of Corrections
5/2000
5
Active Inmates By Most Serious Crime Type
644 3,250
5,386
1,427
18,474
3,803
9,622
28
viol/person nonviol/person property drug sales drug poss habit/dui sex offend other
Georgia Dept. of Corrections
5/2000
6
Georgia Department of Corrections
Page 1 Run 05/15/00
Office of Planning and Analysis
Inmate statistical profile TABLE OF CONTENTS FOR ACTIVE PRISONERS EXCLUDING JAIL
TITLE ----RACE AND SEX............................ 2 Culture Fair IQ Scores.................. 3 Self-Rpt Socioeconomic Class............ 4 Self-Rpt Environment To Age 16.......... 5 Self-Rpt Education Level................ 6 Functional Reading Level (WRAT Scores).. 7 Functional Math Level (WRAT Scores)..... 8 Functional Spelling Level (WRAT Scores). 9 Self-Rpt Guardian Status To Age 16......10 Self-Rpt Employment Status Before Prison11 Self-Rpt Marital Status At Admission....12 Self-Rpt Number Of Children At Admission13 Self-Rpt Religious Affiliation..........14 Self-Rpt Family Behavior Patterns *.....15 Inmate Diagnostic Behavior Problem *....16 Physical Profile (General Condition)....17 Security Status.........................18 Number Of Sentences.....................19 Number Of Disciplinaries................20 Number Of Escapes.......................21 Number Of Prior Georgia Incarcerations *22 Number Of Transfers.....................23 County Of Conviction....................24 Circuit Of Conviction...................29 Home County.............................31 Prison Sentence In Years................36 Probation To Follow Prison..............37 Admission Type..........................38 Release Type............................39 Inst By Group...........................40 Institution.............................41 Misdemeanors And Felonies...............44 Crimes By Group.........................45 Most Serious Offense....................46 Most Serious Crime Type.................53
PAGE ----
Georgia Dept. of Corrections
5/2000
7
Georgia Department of Corrections
Page 2 Run 05/15/00
Office of Planning and Analysis
Inmate statistical profile
Sample: ACTIVE PRISONERS EXCLUDING JAIL Active inmates 05/15/2000
Requestor: Statistics RACE AND SEX by current age & sex
|
MEN
|
WOMEN
|
| Age | Age | Age | Age | Men
| Age | Age | Age | Age |Women
|Grand
RACE AND SEX
|00-21 %|22-39 %|40-54 %|55-99 %|Total % |00-21 %|22-39 %|40-54 %|55-99 %|Total % |Total %
------------------------------------------------------------------------------------------------------------------------------------
WHITE MALE
| 1027 26| 7648 30| 3907 39| 824 57|13406 33 | 0 0| 0 0| 0 0| 0 0| 0 0 |13406 31
NON WHITE MALE
| 2870 74|17617 70| 6132 61| 616 43|27235 67 | 0 0| 0 0| 0 0| 0 0| 0 0 |27235 63
WHITE FEMALE
| 0 0| 0 0| 0 0| 0 0| 0 0 | 83 47| 692 40| 267 40| 37 56| 1079 41 | 1079 2
NON WHITE FEMALE | 0 0| 0 0| 0 0| 0 0| 0 0 | 95 53| 1039 60| 404 60| 29 44| 1567 59 | 1567 4
------------------------------------------------------------------------------------------------------------------------------------
Total reported
| 3897 100|25265 100|10039 100| 1440 100|40641 100 | 178 100| 1731 100| 671 100| 66 100| 2646 100 |43287 100
|
|
|
|
|
|
|
|
|
|
|
Percent reported | 100.0| 100.0| 100.0| 100.0| 100.0 | 100.0| 100.0| 100.0| 100.0| 100.0 | 100.0
|
|
|
|
|
|
|
|
|
|
|
|
|
|
|
|
|
|
|
|
|
|
NOT REPORTED
|0|0|0|0|0
|0|0|0|0|0
|0
------------------------------------------------------------------------------------------------------------------------------------
Total
| 3897 |25265 |10039 | 1440 |40641
| 178 | 1731 | 671 | 66 | 2646
|43287
|
|
|
|
|
|
|
|
|
|
|
|
|
|
|
|
|
|
|
|
|
|
|
|
|
|
|
|
|
|
|
|
|
|
|
|
|
|
|
|
|
|
|
|
|
|
|
|
|
|
|
|
|
|
|
AVERAGE AGE
| 19.88 | 30.35 | 45.01 | 60.92 | 34.05 | 19.83 | 31.41 | 44.36 | 59.61 | 34.61 | 34.08
Georgia Dept. of Corrections
5/2000
8
Page 3 Run 05/15/00
Georgia Department of Corrections Office of Planning and Analysis
Inmate statistical profile
Sample: ACTIVE PRISONERS EXCLUDING JAIL Active inmates 05/15/2000
Requestor: Statistics Culture Fair IQ Scores by current age & sex
|
MEN
|
WOMEN
|
| Age | Age | Age | Age | Men
| Age | Age | Age | Age |Women
|Grand
IQ Score
|00-21 %|22-39 %|40-54 %|55-99 %|Total % |00-21 %|22-39 %|40-54 %|55-99 %|Total % |Total %
------------------------------------------------------------------------------------------------------------------------------------
LESS THAN 70
| 112 3| 1038 4| 801 8| 93 7| 2044 5 | 6 3| 216 13| 185 29| 20 33| 427 17 | 2471 6
70 AND UP
| 3626 97|23269 96| 8685 92| 1209 93|36789 95 | 168 97| 1457 87| 463 71| 40 67| 2128 83 |38917 94
------------------------------------------------------------------------------------------------------------------------------------
Total reported
| 3738 100|24307 100| 9486 100| 1302 100|38833 100 | 174 100| 1673 100| 648 100| 60 100| 2555 100 |41388 100
|
|
|
|
|
|
|
|
|
|
|
Percent reported |
95.9|
96.2|
94.5|
90.4|
95.6 |
97.8|
96.6|
96.6|
90.9|
96.6 |
95.6
|
|
|
|
|
|
|
|
|
|
|
|
|
|
|
|
|
|
|
|
|
|
NOT REPORTED
| 159 | 958 | 553 | 138 | 1808
| 4 | 58 | 23 | 6 | 91
| 1899
------------------------------------------------------------------------------------------------------------------------------------
Total
| 3897 |25265 |10039 | 1440 |40641
| 178 | 1731 | 671 | 66 | 2646
|43287
|
|
|
|
|
|
|
|
|
|
|
|
|
|
|
|
|
|
|
|
|
|
|
|
|
|
|
|
|
|
|
|
|
|
|
|
|
|
|
|
|
|
|
|
|
|
|
|
|
|
|
|
|
|
|
AVERAGE IQ
| 100.05 | 99.67 | 95.75 | 93.13 | 98.53 | 99.83 | 92.19 | 84.64 | 80.15 | 90.51 | 98.04
Georgia Dept. of Corrections
5/2000
9
Page 4 Run 05/15/00
Georgia Department of Corrections Office of Planning and Analysis
Inmate statistical profile
Sample: ACTIVE PRISONERS EXCLUDING JAIL
Requestor: Statistics
Active inmates 05/15/2000
Self-Rpt Socioeconomic Class by current age & sex
|
MEN
|
WOMEN
|
| Age | Age | Age | Age | Men
| Age | Age | Age | Age |Women
|Grand
Socioeconomic Class |00-21 %|22-39 %|40-54 %|55-99 %|Total % |00-21 %|22-39 %|40-54 %|55-99 %|Total % |Total %
------------------------------------------------------------------------------------------------------------------------------------
WELFARE
| 346 10| 1922 8| 629 7| 80 6| 2977 8 | 31 17| 262 15| 61 9| 2 3| 356 14 | 3333 8
OCC EMPLOY
| 428 12| 2296 9| 517 5| 42 3| 3283 8 | 1 1| 14 1| 6 1| 3 5| 24 1 | 3307 8
MINIMUM STD
| 1491 41| 9223 38| 3972 41| 653 48|15339 40 | 48 27| 619 36| 275 41| 33 52| 975 37 |16314 39
MIDDLE
| 1322 37|10652 44| 4424 46| 577 42|16975 44 | 91 51| 757 44| 305 46| 22 35| 1175 45 |18150 44
OTHER
| 16 0| 146 1| 69 1| 15 1| 246 1 | 7 4| 50 3| 21 3| 3 5| 81 3 | 327 1
------------------------------------------------------------------------------------------------------------------------------------
Total reported
| 3603 100|24239 100| 9611 100| 1367 100|38820 100 | 178 100| 1702 100| 668 100| 63 100| 2611 100 |41431 100
|
|
|
|
|
|
|
|
|
|
|
Percent reported |
92.5|
95.9|
95.7|
94.9|
95.5 | 100.0|
98.3|
99.6|
95.5|
98.7 |
95.7
|
|
|
|
|
|
|
|
|
|
|
|
|
|
|
|
|
|
|
|
|
|
NOT RPTD
| 294 | 1026 | 428 | 73 | 1821
| 0 | 29 | 3 | 3 | 35
| 1856
------------------------------------------------------------------------------------------------------------------------------------
Total
| 3897 |25265 |10039 | 1440 |40641
| 178 | 1731 | 671 | 66 | 2646
|43287
Georgia Dept. of Corrections
5/2000
10
Page 5 Run 05/15/00
Georgia Department of Corrections Office of Planning and Analysis
Inmate statistical profile
Sample: ACTIVE PRISONERS EXCLUDING JAIL
Requestor: Statistics
Active inmates 05/15/2000
Self-Rpt Environment To Age 16 by current age & sex
|
MEN
|
WOMEN
|
| Age | Age | Age | Age | Men
| Age | Age | Age | Age |Women
|Grand
Environment
|00-21 %|22-39 %|40-54 %|55-99 %|Total % |00-21 %|22-39 %|40-54 %|55-99 %|Total % |Total %
------------------------------------------------------------------------------------------------------------------------------------
RURAL/FARM
| 17 0| 630 3| 702 7| 286 21| 1635 4 | 2 1| 62 4| 49 7| 14 23| 127 5 | 1762 4
RURAL/NFARM
| 125 3| 1660 7| 710 7| 115 8| 2610 7 | 17 10| 159 9| 45 7| 3 5| 224 9 | 2834 7
S.M.S.A
| 1367 36| 8879 36| 3335 34| 348 25|13929 35 | 38 21| 338 20| 144 22| 11 18| 531 20 |14460 34
URBAN
| 846 22| 4595 19| 1586 16| 160 12| 7187 18 | 59 33| 440 26| 205 31| 10 16| 714 27 | 7901 19
SMALL TOWN
| 1396 37| 8769 36| 3362 34| 477 34|14004 35 | 58 33| 688 40| 216 32| 21 34| 983 38 |14987 36
OTHER
| 14 0| 127 1| 60 1| 5 0| 206 1 | 4 2| 20 1| 9 1| 2 3| 35 1 | 241 1
------------------------------------------------------------------------------------------------------------------------------------
Total reported
| 3765 100|24660 100| 9755 100| 1391 100|39571 100 | 178 100| 1707 100| 668 100| 61 100| 2614 100 |42185 100
|
|
|
|
|
|
|
|
|
|
|
Percent reported |
96.6|
97.6|
97.2|
96.6|
97.4 | 100.0|
98.6|
99.6|
92.4|
98.8 |
97.5
|
|
|
|
|
|
|
|
|
|
|
|
|
|
|
|
|
|
|
|
|
|
NOT RPTD
| 132 | 605 | 284 | 49 | 1070
| 0 | 24 | 3 | 5 | 32
| 1102
------------------------------------------------------------------------------------------------------------------------------------
Total
| 3897 |25265 |10039 | 1440 |40641
| 178 | 1731 | 671 | 66 | 2646
|43287
Georgia Dept. of Corrections
5/2000
11
Page 6 Run 05/15/00
Georgia Department of Corrections Office of Planning and Analysis
Inmate statistical profile
Sample: ACTIVE PRISONERS EXCLUDING JAIL Active inmates 05/15/2000
Requestor: Statistics Self-Rpt Education Level by current age & sex
|
MEN
|
WOMEN
|
| Age | Age | Age | Age | Men
| Age | Age | Age | Age |Women
|Grand
Education Level
|00-21 %|22-39 %|40-54 %|55-99 %|Total % |00-21 %|22-39 %|40-54 %|55-99 %|Total % |Total %
------------------------------------------------------------------------------------------------------------------------------------
LESS THAN GRADE 7 | 41 1| 425 2| 468 5| 306 22| 1240 3 | 1 1| 20 1| 22 3| 13 20| 56 2 | 1296 3
GRADE 7
| 112 3| 573 2| 356 4| 123 9| 1164 3 | 5 3| 51 3| 19 3| 1 2| 76 3 | 1240 3
GRADE 8
| 514 14| 1964 8| 847 9| 138 10| 3463 9 | 24 14| 140 8| 53 8| 3 5| 220 9 | 3683 9
GRADE 9
| 950 25| 3705 15| 1204 12| 141 10| 6000 15 | 39 22| 234 14| 57 9| 3 5| 333 13 | 6333 15
GRADE 10
| 1094 29| 5314 21| 1522 16| 128 9| 8058 20 | 45 26| 276 16| 81 12| 9 14| 411 16 | 8469 20
GRADE 11
| 799 21| 4930 20| 1299 13| 94 7| 7122 18 | 36 20| 284 17| 80 12| 5 8| 405 16 | 7527 18
GRADE 12
| 224 6| 5344 22| 2375 24| 263 19| 8206 21 | 12 7| 292 17| 140 21| 14 22| 458 18 | 8664 20
MORE THAN GRADE 12 | 41 1| 2496 10| 1710 17| 206 15| 4453 11 | 14 8| 383 23| 201 31| 16 25| 614 24 | 5067 12
------------------------------------------------------------------------------------------------------------------------------------
Total reported
| 3775 100|24751 100| 9781 100| 1399 100|39706 100 | 176 100| 1680 100| 653 100| 64 100| 2573 100 |42279 100
|
|
|
|
|
|
|
|
|
|
|
Percent reported |
96.9|
98.0|
97.4|
97.2|
97.7 |
98.9|
97.1|
97.3|
97.0|
97.2 |
97.7
|
|
|
|
|
|
|
|
|
|
|
|
|
|
|
|
|
|
|
|
|
|
NOT REPORTED
| 122 | 514 | 258 | 41 | 935
| 2 | 51 | 18 | 2 | 73
| 1008
------------------------------------------------------------------------------------------------------------------------------------
Total
| 3897 |25265 |10039 | 1440 |40641
| 178 | 1731 | 671 | 66 | 2646
|43287
|
|
|
|
|
|
|
|
|
|
|
|
|
|
|
|
|
|
|
|
|
|
|
|
|
|
|
|
|
|
|
|
|
|
|
|
|
|
|
|
|
|
|
|
|
|
|
|
|
|
|
|
|
|
|
AVG EDUCATION LEVEL | 9.75 | 11.08 | 11.57 | 9.75 | 11.03 | 10.75 | 12.81 | 13.50 | 10.84 | 12.79 | 11.14
* NOTE: THE FIELD LABLED "LESS THAN GRADE 7" WAS CORRECTED IN MARCH 1989: MISSING DATA FOR INMATES STILL IN DIAGNOSTICS NOW HAS BEEN REMOVED FROM THIS FIELD AND IDENTIFIED AS "NOT REPORTED" INFORMATION.
Georgia Dept. of Corrections
5/2000
12
Page 7 Run 05/15/00
Georgia Department of Corrections Office of Planning and Analysis
Inmate statistical profile
Sample: ACTIVE PRISONERS EXCLUDING JAIL
Requestor: Statistics
Active inmates 05/15/2000
Functional Reading Level (WRAT Scores) by current age & sex
|
MEN
|
WOMEN
|
| Age | Age | Age | Age | Men
| Age | Age | Age | Age |Women
|Grand
WRAT Reading Score |00-21 %|22-39 %|40-54 %|55-99 %|Total % |00-21 %|22-39 %|40-54 %|55-99 %|Total % |Total %
------------------------------------------------------------------------------------------------------------------------------------
LESS THAN GRADE 6 | 1510 40| 9560 39| 4289 46| 630 49|15989 41 | 41 24| 451 27| 212 33| 20 33| 724 28 |16713 40
6TH THRU 8TH GRADE | 816 22| 5392 22| 2004 21| 219 17| 8431 22 | 36 21| 326 19| 111 17| 11 18| 484 19 | 8915 22
GRADE 9
| 314 8| 1974 8| 618 7| 83 6| 2989 8 | 18 10| 132 8| 40 6| 8 13| 198 8 | 3187 8
GRADE 10
| 175 5| 1005 4| 331 4| 41 3| 1552 4 | 11 6| 61 4| 25 4| 2 3| 99 4 | 1651 4
GRADE 11
| 155 4| 972 4| 324 3| 44 3| 1495 4 | 2 1| 65 4| 28 4| 2 3| 97 4 | 1592 4
GRADE 12
| 480 13| 3579 15| 1470 16| 235 18| 5764 15 | 12 7| 128 8| 36 6| 4 7| 180 7 | 5944 14
MORE THAN GRADE 12 | 290 8| 1854 8| 358 4| 42 3| 2544 7 | 54 31| 511 31| 198 30| 14 23| 777 30 | 3321 8
------------------------------------------------------------------------------------------------------------------------------------
Total reported
| 3740 100|24336 100| 9394 100| 1294 100|38764 100 | 174 100| 1674 100| 650 100| 61 100| 2559 100 |41323 100
|
|
|
|
|
|
|
|
|
|
|
Percent reported |
96.0|
96.3|
93.6|
89.9|
95.4 |
97.8|
96.7|
96.9|
92.4|
96.7 |
95.5
|
|
|
|
|
|
|
|
|
|
|
|
|
|
|
|
|
|
|
|
|
|
NOT REPORTED
| 157 | 929 | 645 | 146 | 1877
| 4 | 57 | 21 | 5 | 87
| 1964
------------------------------------------------------------------------------------------------------------------------------------
Total
| 3897 |25265 |10039 | 1440 |40641
| 178 | 1731 | 671 | 66 | 2646
|43287
|
|
|
|
|
|
|
|
|
|
|
|
|
|
|
|
|
|
|
|
|
|
|
|
|
|
|
|
|
|
|
|
|
|
|
|
|
|
|
|
|
|
|
|
|
|
|
|
|
|
|
|
|
|
|
AVG READING SCORE | 7.60 | 7.64 | 7.01 | 6.78 | 7.45 | 9.38 | 9.02 | 8.59 | 8.28 | 8.92 | 7.54
Georgia Dept. of Corrections
5/2000
13
Page 8 Run 05/15/00
Georgia Department of Corrections Office of Planning and Analysis
Inmate statistical profile
Sample: ACTIVE PRISONERS EXCLUDING JAIL
Requestor: Statistics
Active inmates 05/15/2000
Functional Math Level (WRAT Scores) by current age & sex
|
MEN
|
WOMEN
|
| Age | Age | Age | Age | Men
| Age | Age | Age | Age |Women
|Grand
WRAT Math Score
|00-21 %|22-39 %|40-54 %|55-99 %|Total % |00-21 %|22-39 %|40-54 %|55-99 %|Total % |Total %
------------------------------------------------------------------------------------------------------------------------------------
LESS THAN GRADE 6 | 1268 34| 7673 32| 3984 42| 668 52|13593 35 | 35 20| 458 27| 262 40| 26 43| 781 31 |14374 35
6TH THRU 8TH GRADE | 1853 50|11865 49| 3558 38| 360 28|17636 45 | 86 49| 816 49| 235 36| 22 36| 1159 45 |18795 45
GRADE 9
| 310 8| 2094 9| 667 7| 86 7| 3157 8 | 21 12| 168 10| 46 7| 6 10| 241 9 | 3398 8
GRADE 10
| 159 4| 1298 5| 490 5| 68 5| 2015 5 | 18 10| 113 7| 40 6| 3 5| 174 7 | 2189 5
GRADE 11
| 78 2| 805 3| 344 4| 50 4| 1277 3 | 10 6| 67 4| 29 4| 2 3| 108 4 | 1385 3
GRADE 12
| 47 1| 456 2| 305 3| 52 4| 860 2 | 1 1| 23 1| 15 2| 1 2| 40 2 | 900 2
MORE THAN GRADE 12 | 25 1| 151 1| 56 1| 10 1| 242 1 | 3 2| 29 2| 24 4| 1 2| 57 2 | 299 1
------------------------------------------------------------------------------------------------------------------------------------
Total reported
| 3740 100|24342 100| 9404 100| 1294 100|38780 100 | 174 100| 1674 100| 651 100| 61 100| 2560 100 |41340 100
|
|
|
|
|
|
|
|
|
|
|
Percent reported |
96.0|
96.3|
93.7|
89.9|
95.4 |
97.8|
96.7|
97.0|
92.4|
96.7 |
95.5
|
|
|
|
|
|
|
|
|
|
|
|
|
|
|
|
|
|
|
|
|
|
NOT REPORTED
| 157 | 923 | 635 | 146 | 1861
| 4 | 57 | 20 | 5 | 86
| 1947
------------------------------------------------------------------------------------------------------------------------------------
Total
| 3897 |25265 |10039 | 1440 |40641
| 178 | 1731 | 671 | 66 | 2646
|43287
|
|
|
|
|
|
|
|
|
|
|
|
|
|
|
|
|
|
|
|
|
|
|
|
|
|
|
|
|
|
|
|
|
|
|
|
|
|
|
|
|
|
|
|
|
|
|
|
|
|
|
|
|
|
|
AVG MATH SCORE
| 6.82 | 7.01 | 6.63 | 6.12 | 6.87 | 7.70 | 7.31 | 6.85 | 6.25 | 7.19 | 6.89
Georgia Dept. of Corrections
5/2000
14
Page 9 Run 05/15/00
Georgia Department of Corrections Office of Planning and Analysis
Inmate statistical profile
Sample: ACTIVE PRISONERS EXCLUDING JAIL
Requestor: Statistics
Active inmates 05/15/2000
Functional Spelling Level (WRAT Scores) by current age & sex
|
MEN
|
WOMEN
|
| Age | Age | Age | Age | Men
| Age | Age | Age | Age |Women
|Grand
WRAT Spelling Score |00-21 %|22-39 %|40-54 %|55-99 %|Total % |00-21 %|22-39 %|40-54 %|55-99 %|Total % |Total %
------------------------------------------------------------------------------------------------------------------------------------
LESS THAN GRADE 6 | 1579 42|10886 45| 5288 56| 795 61|18548 48 | 39 22| 441 26| 218 33| 22 36| 720 28 |19268 47
6TH THRU 8TH GRADE | 1219 33| 6975 29| 2196 23| 261 20|10651 27 | 63 36| 537 32| 192 29| 22 36| 814 32 |11465 28
GRADE 9
| 287 8| 1710 7| 443 5| 53 4| 2493 6 | 15 9| 161 10| 41 6| 4 7| 221 9 | 2714 7
GRADE 10
| 268 7| 1680 7| 425 5| 46 4| 2419 6 | 23 13| 170 10| 58 9| 0 0| 251 10 | 2670 6
GRADE 11
| 127 3| 846 3| 230 2| 28 2| 1231 3 | 10 6| 92 5| 22 3| 2 3| 126 5 | 1357 3
GRADE 12
| 180 5| 1658 7| 658 7| 96 7| 2592 7 | 9 5| 72 4| 21 3| 1 2| 103 4 | 2695 7
MORE THAN GRADE 12 | 80 2| 581 2| 156 2| 14 1| 831 2 | 15 9| 201 12| 99 15| 10 16| 325 13 | 1156 3
------------------------------------------------------------------------------------------------------------------------------------
Total reported
| 3740 100|24336 100| 9396 100| 1293 100|38765 100 | 174 100| 1674 100| 651 100| 61 100| 2560 100 |41325 100
|
|
|
|
|
|
|
|
|
|
|
Percent reported |
96.0|
96.3|
93.6|
89.8|
95.4 |
97.8|
96.7|
97.0|
92.4|
96.7 |
95.5
|
|
|
|
|
|
|
|
|
|
|
|
|
|
|
|
|
|
|
|
|
|
NOT REPORTED
| 157 | 929 | 643 | 147 | 1876
| 4 | 57 | 20 | 5 | 86
| 1962
------------------------------------------------------------------------------------------------------------------------------------
Total
| 3897 |25265 |10039 | 1440 |40641
| 178 | 1731 | 671 | 66 | 2646
|43287
|
|
|
|
|
|
|
|
|
|
|
|
|
|
|
|
|
|
|
|
|
|
|
|
|
|
|
|
|
|
|
|
|
|
|
|
|
|
|
|
|
|
|
|
|
|
|
|
|
|
|
|
|
|
|
AVG SPELLING SCORE | 6.79 | 6.75 | 5.94 | 5.47 | 6.52 | 8.44 | 8.23 | 7.71 | 7.04 | 8.09 | 6.61
Georgia Dept. of Corrections
5/2000
15
Page 10 Run 05/15/00
Georgia Department of Corrections Office of Planning and Analysis
Inmate statistical profile
Sample: ACTIVE PRISONERS EXCLUDING JAIL
Requestor: Statistics
Active inmates 05/15/2000
Self-Rpt Guardian Status To Age 16 by current age & sex
|
MEN
|
WOMEN
|
| Age | Age | Age | Age | Men
| Age | Age | Age | Age |Women
|Grand
Guardian Status
|00-21 %|22-39 %|40-54 %|55-99 %|Total % |00-21 %|22-39 %|40-54 %|55-99 %|Total % |Total %
------------------------------------------------------------------------------------------------------------------------------------
ORPHANAGE
| 7 0| 27 0| 21 0| 8 1| 63 0 | 0 0| 0 0| 2 0| 0 0| 2 0 | 65 0
FATHER ONLY
| 127 3| 654 3| 228 2| 21 2| 1030 3 | 3 2| 58 3| 23 3| 3 5| 87 3 | 1117 3
FTR MTR HD
| 236 6| 1349 5| 525 5| 61 4| 2171 5 | 3 2| 54 3| 26 4| 0 0| 83 3 | 2254 5
MOTHER ONLY
| 1967 52|10635 43| 3007 31| 302 22|15911 40 | 81 46| 714 42| 208 31| 20 31| 1023 39 |16934 40
MTR FTR HD
| 846 22| 8207 33| 4589 47| 826 59|14468 36 | 52 29| 589 34| 317 48| 33 52| 991 38 |15459 36
OTH FEMALE
| 70 2| 532 2| 262 3| 42 3| 906 2 | 9 5| 52 3| 16 2| 2 3| 79 3 | 985 2
OTH MALE
| 20 1| 76 0| 37 0| 6 0| 139 0 | 0 0| 6 0| 4 1| 0 0| 10 0 | 149 0
STEP-PARNTS
| 61 2| 451 2| 142 1| 16 1| 670 2 | 1 1| 5 0| 4 1| 0 0| 10 0 | 680 2
FOSTER HOME
| 46 1| 233 1| 129 1| 15 1| 423 1 | 2 1| 41 2| 9 1| 2 3| 54 2 | 477 1
GRAND PRNTS
| 328 9| 2063 8| 649 7| 89 6| 3129 8 | 25 14| 178 10| 49 7| 4 6| 256 10 | 3385 8
OTHER
| 72 2| 543 2| 205 2| 12 1| 832 2 | 2 1| 18 1| 9 1| 0 0| 29 1 | 861 2
------------------------------------------------------------------------------------------------------------------------------------
Total reported
| 3780 100|24770 100| 9794 100| 1398 100|39742 100 | 178 100| 1715 100| 667 100| 64 100| 2624 100 |42366 100
|
|
|
|
|
|
|
|
|
|
|
Percent reported |
97.0|
98.0|
97.6|
97.1|
97.8 | 100.0|
99.1|
99.4|
97.0|
99.2 |
97.9
|
|
|
|
|
|
|
|
|
|
|
|
|
|
|
|
|
|
|
|
|
|
NOT RPTD
| 117 | 495 | 245 | 42 | 899
| 0 | 16 | 4 | 2 | 22
| 921
------------------------------------------------------------------------------------------------------------------------------------
Total
| 3897 |25265 |10039 | 1440 |40641
| 178 | 1731 | 671 | 66 | 2646
|43287
Georgia Dept. of Corrections
5/2000
16
Page 11 Run 05/15/00
Georgia Department of Corrections Office of Planning and Analysis
Inmate statistical profile
Sample: ACTIVE PRISONERS EXCLUDING JAIL
Requestor: Statistics
Active inmates 05/15/2000
Self-Rpt Employment Status Before Prison by current age & sex
|
MEN
|
WOMEN
|
| Age | Age | Age | Age | Men
| Age | Age | Age | Age |Women
|Grand
Employment
|00-21 %|22-39 %|40-54 %|55-99 %|Total % |00-21 %|22-39 %|40-54 %|55-99 %|Total % |Total %
------------------------------------------------------------------------------------------------------------------------------------
FULL TIME
| 1188 33|12806 54| 5149 55| 532 42|19675 52 | 53 31| 553 35| 199 33| 17 30| 822 34 |20497 51
PART TIME
| 352 10| 1971 8| 628 7| 78 6| 3029 8 | 18 11| 102 6| 42 7| 3 5| 165 7 | 3194 8
UNEMPL < 6M
| 426 12| 3101 13| 1072 11| 133 10| 4732 12 | 36 21| 322 21| 122 20| 10 18| 490 20 | 5222 13
UNEMPL > 6M
| 425 12| 4034 17| 1757 19| 289 23| 6505 17 | 25 15| 346 22| 149 25| 17 30| 537 22 | 7042 17
NEVER WORKD
| 948 27| 1202 5| 81 1| 6 0| 2237 6 | 26 15| 133 8| 15 2| 4 7| 178 7 | 2415 6
STUDENT
| 213 6| 112 0| 12 0| 2 0| 339 1 | 11 7| 11 1| 4 1| 0 0| 26 1 | 365 1
INCAPABLE
| 22 1| 548 2| 638 7| 240 19| 1448 4 | 0 0| 103 7| 75 12| 6 11| 184 8 | 1632 4
OTHER
| 0 0| 0 0| 0 0| 0 0| 0 0 | 0 0| 0 0| 0 0| 0 0| 0 0 | 0 0
------------------------------------------------------------------------------------------------------------------------------------
Total reported
| 3574 100|23774 100| 9337 100| 1280 100|37965 100 | 169 100| 1570 100| 606 100| 57 100| 2402 100 |40367 100
|
|
|
|
|
|
|
|
|
|
|
Percent reported |
91.7|
94.1|
93.0|
88.9|
93.4 |
94.9|
90.7|
90.3|
86.4|
90.8 |
93.3
|
|
|
|
|
|
|
|
|
|
|
|
|
|
|
|
|
|
|
|
|
|
NOT RPTD
| 323 | 1491 | 702 | 160 | 2676
| 9 | 161 | 65 | 9 | 244
| 2920
------------------------------------------------------------------------------------------------------------------------------------
Total
| 3897 |25265 |10039 | 1440 |40641
| 178 | 1731 | 671 | 66 | 2646
|43287
* NOTE: THE FIELD LABELD "OTHER" WAS CORRECTED IN APRIL 1989; INMATES CODED "PRE-OTIS NOT REPORTED" NOW HAVE BEEN REMOVED FROM THIS FIELD AND IDENTIFIED AS "NOT REPORTED".
Georgia Dept. of Corrections
5/2000
17
Page 12 Run 05/15/00
Georgia Department of Corrections Office of Planning and Analysis
Inmate statistical profile
Sample: ACTIVE PRISONERS EXCLUDING JAIL
Requestor: Statistics
Active inmates 05/15/2000
Self-Rpt Marital Status At Admission by current age & sex
|
MEN
|
WOMEN
|
| Age | Age | Age | Age | Men
| Age | Age | Age | Age |Women
|Grand
Marital Status
|00-21 %|22-39 %|40-54 %|55-99 %|Total % |00-21 %|22-39 %|40-54 %|55-99 %|Total % |Total %
------------------------------------------------------------------------------------------------------------------------------------
SINGLE
| 3555 94|16092 65| 3416 35| 197 14|23260 58 | 161 90| 945 55| 209 31| 8 13| 1323 50 |24583 58
MARRIED
| 66 2| 2883 12| 1914 20| 420 30| 5283 13 | 5 3| 246 14| 104 16| 9 14| 364 14 | 5647 13
SEPARATED
| 15 0| 1057 4| 922 9| 152 11| 2146 5 | 1 1| 174 10| 94 14| 6 9| 275 10 | 2421 6
DIVORCED
| 8 0| 1857 7| 2171 22| 387 28| 4423 11 | 2 1| 204 12| 154 23| 14 22| 374 14 | 4797 11
WIDOWED
| 5 0| 106 0| 221 2| 127 9| 459 1 | 1 1| 38 2| 61 9| 24 38| 124 5 | 583 1
COMMON LAW
| 137 4| 2827 11| 1156 12| 121 9| 4241 11 | 8 4| 111 6| 46 7| 3 5| 168 6 | 4409 10
OTHER
| 1 0| 6 0| 2 0| 2 0| 11 0 | 0 0| 2 0| 1 0| 0 0| 3 0 | 14 0
------------------------------------------------------------------------------------------------------------------------------------
Total reported
| 3787 100|24828 100| 9802 100| 1406 100|39823 100 | 178 100| 1720 100| 669 100| 64 100| 2631 100 |42454 100
|
|
|
|
|
|
|
|
|
|
|
Percent reported |
97.2|
98.3|
97.6|
97.6|
98.0 | 100.0|
99.4|
99.7|
97.0|
99.4 |
98.1
|
|
|
|
|
|
|
|
|
|
|
|
|
|
|
|
|
|
|
|
|
|
NOT RPTD
| 110 | 437 | 237 | 34 | 818
| 0 | 11 | 2 | 2 | 15
| 833
------------------------------------------------------------------------------------------------------------------------------------
Total
| 3897 |25265 |10039 | 1440 |40641
| 178 | 1731 | 671 | 66 | 2646
|43287
Georgia Dept. of Corrections
5/2000
18
Page 13 Run 05/15/00
Georgia Department of Corrections Office of Planning and Analysis
Inmate statistical profile
Sample: ACTIVE PRISONERS EXCLUDING JAIL
Requestor: Statistics
Active inmates 05/15/2000
Self-Rpt Number Of Children At Admission by current age & sex
|
MEN
|
WOMEN
|
| Age | Age | Age | Age | Men
| Age | Age | Age | Age |Women
|Grand
Number Of Children |00-21 %|22-39 %|40-54 %|55-99 %|Total % |00-21 %|22-39 %|40-54 %|55-99 %|Total % |Total %
------------------------------------------------------------------------------------------------------------------------------------
NO CHILDREN
| 0 0| 934 6| 420 6| 63 5| 1417 6 | 0 0| 8 1| 7 1| 2 3| 17 1 | 1434 5
ONE CHILD
| 717 76| 6241 41| 2113 29| 218 18| 9289 37 | 44 57| 341 24| 104 18| 5 8| 494 23 | 9783 36
TWO CHILDREN
| 175 18| 4182 27| 2005 27| 278 23| 6640 27 | 25 32| 422 30| 172 30| 17 29| 636 30 | 7276 27
THREE CHILDREN
| 44 5| 2221 14| 1368 19| 233 19| 3866 16 | 6 8| 332 23| 160 27| 18 31| 516 24 | 4382 16
FOUR CHILDREN
| 8 1| 1011 7| 731 10| 144 12| 1894 8 | 2 3| 165 12| 82 14| 8 14| 257 12 | 2151 8
FIVE CHILDREN
| 4 0| 406 3| 380 5| 98 8| 888 4 | 0 0| 100 7| 27 5| 3 5| 130 6 | 1018 4
MORE THAN 5 CHILDREN| 0 0| 325 2| 367 5| 171 14| 863 3 | 0 0| 51 4| 30 5| 6 10| 87 4 | 950 4
------------------------------------------------------------------------------------------------------------------------------------
Total reported
| 948 100|15320 100| 7384 100| 1205 100|24857 100 | 77 100| 1419 100| 582 100| 59 100| 2137 100 |26994 100
|
|
|
|
|
|
|
|
|
|
|
Percent reported |
24.3|
60.6|
73.6|
83.7|
61.2 |
43.3|
82.0|
86.7|
89.4|
80.8 |
62.4
|
|
|
|
|
|
|
|
|
|
|
|
|
|
|
|
|
|
|
|
|
|
NOT REPORTED
| 2949 | 9945 | 2655 | 235 |15784
| 101 | 312 | 89 | 7 | 509
|16293
------------------------------------------------------------------------------------------------------------------------------------
Total
| 3897 |25265 |10039 | 1440 |40641
| 178 | 1731 | 671 | 66 | 2646
|43287
|
|
|
|
|
|
|
|
|
|
|
|
|
|
|
|
|
|
|
|
|
|
|
|
|
|
|
|
|
|
|
|
|
|
|
|
|
|
|
|
|
|
|
|
|
|
|
|
|
|
|
|
|
|
|
AVG NUM CHILDREN | 1.32 | 1.95 | 2.41 | 3.19 | 2.13 | 1.56 | 2.59 | 2.75 | 3.08 | 2.61 | 2.16
* NOTE: THE FIELD LABLED "NO CHILDREN" WAS CORRECTED IN MARCH 1989: MISSING DATA FOR INMATES STILL IN DIAGNOSTICS NOW HAS BEEN REMOVED FROM THIS FIELD AND IDENTIFIED AS "NOT REPORTED" INFORMATION.
Georgia Dept. of Corrections
5/2000
19
Page 14 Run 05/15/00
Georgia Department of Corrections Office of Planning and Analysis
Inmate statistical profile
Sample: ACTIVE PRISONERS EXCLUDING JAIL
Requestor: Statistics
Active inmates 05/15/2000
Self-Rpt Religious Affiliation by current age & sex
|
MEN
|
WOMEN
|
| Age | Age | Age | Age | Men
| Age | Age | Age | Age |Women
|Grand
Religion
|00-21 %|22-39 %|40-54 %|55-99 %|Total % |00-21 %|22-39 %|40-54 %|55-99 %|Total % |Total %
------------------------------------------------------------------------------------------------------------------------------------
ISLAM
| 76 2| 925 4| 298 3| 25 2| 1324 3 | 4 2| 12 1| 3 0| 0 0| 19 1 | 1343 3
CATHOLIC
| 115 3| 865 4| 333 3| 61 4| 1374 4 | 4 2| 74 4| 28 4| 4 6| 110 4 | 1484 4
BAPTIST
| 1699 45|12631 52| 5777 60| 808 59|20915 54 | 104 59| 1076 63| 428 65| 39 63| 1647 63 |22562 54
METHODIST
| 57 2| 535 2| 381 4| 83 6| 1056 3 | 7 4| 65 4| 34 5| 5 8| 111 4 | 1167 3
EPISCOPLN
| 6 0| 42 0| 17 0| 6 0| 71 0 | 0 0| 6 0| 5 1| 0 0| 11 0 | 82 0
PRESBYTRN
| 6 0| 46 0| 31 0| 11 1| 94 0 | 0 0| 2 0| 2 0| 2 3| 6 0 | 100 0
CHC OF GOD
| 28 1| 296 1| 135 1| 24 2| 483 1 | 2 1| 26 2| 15 2| 1 2| 44 2 | 527 1
HOLINESS
| 64 2| 982 4| 480 5| 75 5| 1601 4 | 12 7| 186 11| 69 10| 2 3| 269 10 | 1870 4
JEWISH
| 1 0| 18 0| 11 0| 3 0| 33 0 | 1 1| 1 0| 0 0| 0 0| 2 0 | 35 0
ANGLICAN
| 0 0| 7 0| 2 0| 0 0| 9 0 | 0 0| 1 0| 0 0| 0 0| 1 0 | 10 0
GRK ORTHDX
| 0 0| 1 0| 2 0| 0 0| 3 0 | 0 0| 0 0| 0 0| 0 0| 0 0 | 3 0
HINDU
| 0 0| 3 0| 0 0| 0 0| 3 0 | 0 0| 0 0| 0 0| 0 0| 0 0 | 3 0
BUDDHIST
| 5 0| 21 0| 3 0| 0 0| 29 0 | 1 1| 0 0| 0 0| 0 0| 1 0 | 30 0
TAOIST
| 0 0| 2 0| 1 0| 0 0| 3 0 | 0 0| 0 0| 0 0| 0 0| 0 0 | 3 0
SHINTOIST
| 3 0| 9 0| 0 0| 0 0| 12 0 | 0 0| 1 0| 0 0| 0 0| 1 0 | 13 0
SEVEN D AD
| 10 0| 56 0| 35 0| 9 1| 110 0 | 0 0| 10 1| 2 0| 0 0| 12 0 | 122 0
JEHOVAH WT
| 29 1| 220 1| 58 1| 6 0| 313 1 | 0 0| 15 1| 5 1| 1 2| 21 1 | 334 1
LATR DAY S
| 3 0| 26 0| 9 0| 3 0| 41 0 | 0 0| 2 0| 1 0| 0 0| 3 0 | 44 0
QUAKER
| 0 0| 0 0| 0 0| 0 0| 0 0 | 0 0| 0 0| 0 0| 0 0| 0 0 | 0 0
OTHER PROD
| 396 11| 1905 8| 464 5| 90 7| 2855 7 | 25 14| 108 6| 42 6| 5 8| 180 7 | 3035 7
NONE
| 965 26| 4241 17| 1021 11| 90 7| 6317 16 | 3 2| 26 2| 4 1| 0 0| 33 1 | 6350 15
OTHER
| 284 8| 1543 6| 530 6| 81 6| 2438 6 | 14 8| 94 6| 25 4| 3 5| 136 5 | 2574 6
------------------------------------------------------------------------------------------------------------------------------------
Total reported
| 3747 100|24374 100| 9588 100| 1375 100|39084 100 | 177 100| 1705 100| 663 100| 62 100| 2607 100 |41691 100
|
|
|
|
|
|
|
|
|
|
|
Percent reported |
96.2|
96.5|
95.5|
95.5|
96.2 |
99.4|
98.5|
98.8|
93.9|
98.5 |
96.3
|
|
|
|
|
|
|
|
|
|
|
|
|
|
|
|
|
|
|
|
|
|
NOT RPTD
| 150 | 891 | 451 | 65 | 1557
| 1 | 26 | 8 | 4 | 39
| 1596
------------------------------------------------------------------------------------------------------------------------------------
Total
| 3897 |25265 |10039 | 1440 |40641
| 178 | 1731 | 671 | 66 | 2646
|43287
Georgia Dept. of Corrections
5/2000
20
Page 15 Run 05/15/00
Georgia Department of Corrections Office of Planning and Analysis
Inmate statistical profile
Sample: ACTIVE PRISONERS EXCLUDING JAIL
Requestor: Statistics
Active inmates 05/15/2000
Self-Rpt Family Behavior Patterns * by current age & sex
|
MEN
|
WOMEN
|
| Age | Age | Age | Age | Men
| Age | Age | Age | Age |Women
|Grand
Family Behavior
|00-21 %|22-39 %|40-54 %|55-99 %|Total % |00-21 %|22-39 %|40-54 %|55-99 %|Total % |Total %
------------------------------------------------------------------------------------------------------------------------------------
CRIMINLTY
| 1131 24| 7171 25| 2803 26| 280 24|11385 25 | 63 16| 626 16| 242 18| 15 18| 946 17 |12331 24
ALCOHOLISM
| 404 9| 3423 12| 1732 16| 204 18| 5763 13 | 37 9| 504 13| 189 14| 12 14| 742 13 | 6505 13
DRUG ABUSE
| 349 7| 1901 7| 607 6| 34 3| 2891 6 | 35 9| 326 8| 116 9| 2 2| 479 8 | 3370 7
DOMINERING
| 9 0| 76 0| 43 0| 7 1| 135 0 | 38 10| 475 12| 179 14| 14 16| 706 13 | 841 2
MIGRANT
| 40 1| 303 1| 138 1| 7 1| 488 1 | 1 0| 14 0| 4 0| 0 0| 19 0 | 507 1
INFL BTGS
| 61 1| 869 3| 427 4| 81 7| 1438 3 | 23 6| 261 7| 107 8| 8 9| 399 7 | 1837 4
PERMISSIVE
| 15 0| 51 0| 35 0| 5 0| 106 0 | 37 9| 227 6| 61 5| 2 2| 327 6 | 433 1
FATH ABSNT
| 2074 45|11945 41| 3583 34| 380 33|17982 39 | 100 25| 864 22| 243 18| 21 25| 1228 22 |19210 37
MOTH ABSNT
| 486 10| 2936 10| 1038 10| 131 11| 4591 10 | 32 8| 245 6| 82 6| 7 8| 366 6 | 4957 10
NONE
| 91 2| 486 2| 228 2| 22 2| 827 2 | 31 8| 306 8| 91 7| 4 5| 432 8 | 1259 2
------------------------------------------------------------------------------------------------------------------------------------
Total reported
| 4660 100|29161 100|10634 100| 1151 100|45606 100 | 397 100| 3848 100| 1314 100| 85 100| 5644 100 |51250 100
|
|
|
|
|
|
|
|
|
|
|
Percent reported |
72.7|
69.0|
63.8|
51.2|
67.5 |
87.6|
85.8|
82.0|
63.6|
84.4 |
68.5
|
|
|
|
|
|
|
|
|
|
|
|
|
|
|
|
|
|
|
|
|
|
OTHER
| 1065 | 7820 | 3639 | 703 |13227
| 22 | 246 | 121 | 24 | 413
|13640
------------------------------------------------------------------------------------------------------------------------------------
Total
| 3897 |25265 |10039 | 1440 |40641
| 178 | 1731 | 671 | 66 | 2646
|43287
* NOTE: SINCE THERE CAN BE UP TO FIVE BEHAVIOR CODES PER INMATE, THE NUMBER OF CASES REPORTED IN THE DETAIL LINES AND THE TOTAL REPORTED LINE MAY EXCEED THE TOTAL NUMBER OF CASES. IN SHORT, THIS TABLE COUNTS THE NUMBER OF BEHAVIOR PROBLEMS, NOT INMATES.
Georgia Dept. of Corrections
5/2000
21
Page 16 Run 05/15/00
Georgia Department of Corrections Office of Planning and Analysis
Inmate statistical profile
Sample: ACTIVE PRISONERS EXCLUDING JAIL
Requestor: Statistics
Active inmates 05/15/2000
Inmate Diagnostic Behavior Problem * by current age & sex
|
MEN
|
WOMEN
|
| Age | Age | Age | Age | Men
| Age | Age | Age | Age |Women
|Grand
Diagnostic Problem |00-21 %|22-39 %|40-54 %|55-99 %|Total % |00-21 %|22-39 %|40-54 %|55-99 %|Total % |Total %
------------------------------------------------------------------------------------------------------------------------------------
ALCOHOLIC
| 29 0| 1062 2| 898 5| 156 7| 2145 3 | 5 2| 198 6| 91 7| 6 6| 300 6 | 2445 3
ALCOH ABSE
| 638 10| 6042 14| 2871 16| 356 17| 9907 14 | 19 7| 370 11| 142 11| 15 15| 546 11 |10453 14
DRUG EXP
| 1379 22| 8256 19| 2927 16| 172 8|12734 18 | 30 11| 245 7| 94 7| 5 5| 374 8 |13108 17
DRUG ABSE
| 1172 18| 8380 19| 3376 19| 149 7|13077 18 | 55 20| 909 28| 326 26| 12 12| 1302 26 |14379 19
NARC ADDCT
| 28 0| 619 1| 395 2| 22 1| 1064 2 | 1 0| 43 1| 34 3| 2 2| 80 2 | 1144 2
EPILEPTIC
| 29 0| 280 1| 178 1| 28 1| 515 1 | 5 2| 69 2| 31 2| 4 4| 109 2 | 624 1
MANIPULTVE
| 668 11| 3444 8| 954 5| 110 5| 5176 7 | 4 1| 74 2| 40 3| 4 4| 122 2 | 5298 7
ASSAULTIVE
| 1495 24| 9013 20| 3449 19| 506 24|14463 20 | 61 22| 571 17| 196 16| 16 16| 844 17 |15307 20
ESCPE TEND
| 85 1| 1040 2| 632 4| 83 4| 1840 3 | 6 2| 106 3| 34 3| 0 0| 146 3 | 1986 3
SUICIDAL
| 130 2| 1071 2| 402 2| 38 2| 1641 2 | 14 5| 163 5| 58 5| 4 4| 239 5 | 1880 2
WITHDRAWN
| 10 0| 160 0| 68 0| 15 1| 253 0 | 13 5| 70 2| 26 2| 1 1| 110 2 | 363 0
PR RLTY CT
| 23 0| 362 1| 219 1| 21 1| 625 1 | 8 3| 81 2| 34 3| 2 2| 125 3 | 750 1
HOMOSEXUAL
| 12 0| 138 0| 64 0| 15 1| 229 0 | 8 3| 122 4| 18 1| 0 0| 148 3 | 377 0
NONE
| 62 1| 1148 3| 584 3| 168 8| 1962 3 | 3 1| 34 1| 28 2| 12 12| 77 2 | 2039 3
OTHER
| 53 1| 527 1| 296 2| 72 3| 948 1 | 2 1| 28 1| 15 1| 5 5| 50 1 | 998 1
NOT RPTD
| 470 7| 2480 6| 679 4| 179 9| 3808 5 | 44 16| 210 6| 87 7| 11 11| 352 7 | 4160 5
------------------------------------------------------------------------------------------------------------------------------------
Total reported
| 6356 100|44254 100|18009 100| 2097 100|70716 100 | 278 100| 3293 100| 1255 100| 99 100| 4925 100 |75641 100
|
|
|
|
|
|
|
|
|
|
|
Percent reported |
98.1|
99.1|
99.8|
99.5|
99.2 | 100.0| 100.0|
99.9| 100.0| 100.0 |
99.2
|
|
|
|
|
|
|
|
|
|
|
|
|
|
|
|
|
|
|
|
|
|
UNKNOWN
| 73 | 232 | 17 | 7 | 329
|0|0|1|0|1
| 330
------------------------------------------------------------------------------------------------------------------------------------
Total
| 3897 |25265 |10039 | 1440 |40641
| 178 | 1731 | 671 | 66 | 2646
|43287
* NOTE: SINCE THERE CAN BE UP TO FIVE BEHAVIOR CODES PER INMATE, THE NUMBER OF CASES REPORTED IN THE DETAIL LINES AND THE TOTAL REPORTED LINE MAY EXCEED THE TOTAL NUMBER OF CASES. IN SHORT, THIS TABLE COUNTS THE NUMBER OF BEHAVIOR PROBLEMS, NOT INMATES.
Georgia Dept. of Corrections
5/2000
22
Page 17 Run 05/15/00
Georgia Department of Corrections Office of Planning and Analysis
Inmate statistical profile
Sample: ACTIVE PRISONERS EXCLUDING JAIL
Requestor: Statistics
Active inmates 05/15/2000
Physical Profile (General Condition) by current age & sex
|
MEN
|
WOMEN
|
| Age | Age | Age | Age | Men
| Age | Age | Age | Age |Women
|Grand
Physical Profile |00-21 %|22-39 %|40-54 %|55-99 %|Total % |00-21 %|22-39 %|40-54 %|55-99 %|Total % |Total %
------------------------------------------------------------------------------------------------------------------------------------
NO LIMITATION
| 3426 90|18499 75| 4892 50| 238 17|27055 68 | 149 86| 1168 69| 304 46| 11 17| 1632 63 |28687 68
DEFECT NO MAJOR LIMT| 164 4| 3007 12| 2011 20| 334 24| 5516 14 | 4 2| 112 7| 78 12| 11 17| 205 8 | 5721 13
DEFECT MAJOR LIMIT | 225 6| 3218 13| 2826 29| 737 52| 7006 18 | 20 12| 397 24| 271 41| 39 62| 727 28 | 7733 18
VERY MAJOR DEFECT | 1 0| 64 0| 99 1| 97 7| 261 1 | 0 0| 4 0| 7 1| 2 3| 13 1 | 274 1
------------------------------------------------------------------------------------------------------------------------------------
Total reported
| 3816 100|24788 100| 9828 100| 1406 100|39838 100 | 173 100| 1681 100| 660 100| 63 100| 2577 100 |42415 100
|
|
|
|
|
|
|
|
|
|
|
Percent reported |
97.9|
98.1|
97.9|
97.6|
98.0 |
97.2|
97.1|
98.4|
95.5|
97.4 |
98.0
|
|
|
|
|
|
|
|
|
|
|
|
|
|
|
|
|
|
|
|
|
|
NOT REPORTED
| 81 | 477 | 211 | 34 | 803
| 5 | 50 | 11 | 3 | 69
| 872
------------------------------------------------------------------------------------------------------------------------------------
Total
| 3897 |25265 |10039 | 1440 |40641
| 178 | 1731 | 671 | 66 | 2646
|43287
Georgia Dept. of Corrections
5/2000
23
Page 18 Run 05/15/00
Georgia Department of Corrections Office of Planning and Analysis
Inmate statistical profile
Sample: ACTIVE PRISONERS EXCLUDING JAIL Active inmates 05/15/2000
Requestor: Statistics Security Status by current age & sex
|
MEN
|
WOMEN
|
| Age | Age | Age | Age | Men
| Age | Age | Age | Age |Women
|Grand
Security
|00-21 %|22-39 %|40-54 %|55-99 %|Total % |00-21 %|22-39 %|40-54 %|55-99 %|Total % |Total %
------------------------------------------------------------------------------------------------------------------------------------
DIAG INCOM
| 1 0| 9 0| 6 0| 2 0| 18 0 | 0 0| 0 0| 0 0| 0 0| 0 0 | 18 0
WRK RELEAS
| 0 0| 1 0| 0 0| 1 0| 2 0 | 0 0| 0 0| 0 0| 0 0| 0 0 | 2 0
TRUSTY
| 24 1| 1176 5| 614 6| 64 4| 1878 5 | 2 1| 55 3| 37 6| 4 6| 98 4 | 1976 5
MINIMUM
| 1026 26| 8368 33| 3481 35| 420 29|13295 33 | 82 46| 957 55| 390 58| 39 59| 1468 55 |14763 34
MEDIUM
| 1642 42| 9910 39| 4145 41| 746 52|16443 40 | 64 36| 530 31| 193 29| 17 26| 804 30 |17247 40
CLOSE
| 870 22| 3977 16| 1121 11| 143 10| 6111 15 | 24 13| 123 7| 32 5| 4 6| 183 7 | 6294 15
MAXIMUM
| 35 1| 650 3| 213 2| 20 1| 918 2 | 2 1| 4 0| 2 0| 0 0| 8 0 | 926 2
DIAGNOSTIC
| 299 8| 1174 5| 459 5| 44 3| 1976 5 | 4 2| 62 4| 17 3| 2 3| 85 3 | 2061 5
------------------------------------------------------------------------------------------------------------------------------------
Total reported
| 3897 100|25265 100|10039 100| 1440 100|40641 100 | 178 100| 1731 100| 671 100| 66 100| 2646 100 |43287 100
|
|
|
|
|
|
|
|
|
|
|
Percent reported | 100.0| 100.0| 100.0| 100.0| 100.0 | 100.0| 100.0| 100.0| 100.0| 100.0 | 100.0
|
|
|
|
|
|
|
|
|
|
|
|
|
|
|
|
|
|
|
|
|
|
NOT RPTD
|0|0|0|0|0
|0|0|0|0|0
|0
------------------------------------------------------------------------------------------------------------------------------------
Total
| 3897 |25265 |10039 | 1440 |40641
| 178 | 1731 | 671 | 66 | 2646
|43287
* NOTE: BEGINNING IN JULY 1987, THE FACILITIES DIVISION NO LONGER CODED INMATES AS BEING WORK RELEASE
Georgia Dept. of Corrections
5/2000
24
Page 19 Run 05/15/00
Georgia Department of Corrections Office of Planning and Analysis
Inmate statistical profile
Sample: ACTIVE PRISONERS EXCLUDING JAIL Active inmates 05/15/2000
Requestor: Statistics Number Of Sentences by current age & sex
|
MEN
|
WOMEN
|
| Age | Age | Age | Age | Men
| Age | Age | Age | Age |Women
|Grand
Number Of Sentences |00-21 %|22-39 %|40-54 %|55-99 %|Total % |00-21 %|22-39 %|40-54 %|55-99 %|Total % |Total %
------------------------------------------------------------------------------------------------------------------------------------
ONE
| 1579 42| 7552 30| 3215 33| 587 41|12933 32 | 89 52| 686 41| 265 40| 33 51| 1073 42 |14006 33
TWO
| 975 26| 5961 24| 2430 25| 374 26| 9740 24 | 50 29| 410 25| 169 26| 15 23| 644 25 |10384 24
THREE
| 526 14| 3948 16| 1543 16| 167 12| 6184 15 | 9 5| 229 14| 99 15| 10 15| 347 14 | 6531 15
FOUR
| 326 9| 2550 10| 904 9| 113 8| 3893 10 | 11 6| 148 9| 44 7| 3 5| 206 8 | 4099 10
FIVE
| 176 5| 1649 7| 595 6| 58 4| 2478 6 | 10 6| 76 5| 19 3| 1 2| 106 4 | 2584 6
MORE THAN FIVE
| 208 5| 3304 13| 1200 12| 130 9| 4842 12 | 2 1| 123 7| 60 9| 3 5| 188 7 | 5030 12
------------------------------------------------------------------------------------------------------------------------------------
Total reported
| 3790 100|24964 100| 9887 100| 1429 100|40070 100 | 171 100| 1672 100| 656 100| 65 100| 2564 100 |42634 100
|
|
|
|
|
|
|
|
|
|
|
Percent reported |
97.3|
98.8|
98.5|
99.2|
98.6 |
96.1|
96.6|
97.8|
98.5|
96.9 |
98.5
|
|
|
|
|
|
|
|
|
|
|
|
|
|
|
|
|
|
|
|
|
|
NOT REPORTED
| 107 | 301 | 152 | 11 | 571
| 7 | 59 | 15 | 1 | 82
| 653
------------------------------------------------------------------------------------------------------------------------------------
Total
| 3897 |25265 |10039 | 1440 |40641
| 178 | 1731 | 671 | 66 | 2646
|43287
|
|
|
|
|
|
|
|
|
|
|
|
|
|
|
|
|
|
|
|
|
|
|
|
|
|
|
|
|
|
|
|
|
|
|
|
|
|
|
|
|
|
|
|
|
|
|
|
|
|
|
|
|
|
|
AVG NUM SENTENCES | 2.33 | 3.08 | 2.96 | 2.55 | 2.96 | 1.91 | 2.51 | 2.59 | 2.20 | 2.48 | 2.93
Georgia Dept. of Corrections
5/2000
25
Page 20 Run 05/15/00
Georgia Department of Corrections Office of Planning and Analysis
Inmate statistical profile
Sample: ACTIVE PRISONERS EXCLUDING JAIL Active inmates 05/15/2000
Requestor: Statistics Number Of Disciplinaries by current age & sex
|
MEN
|
WOMEN
|
| Age | Age | Age | Age | Men
| Age | Age | Age | Age |Women
|Grand
Disciplinaries
|00-21 %|22-39 %|40-54 %|55-99 %|Total % |00-21 %|22-39 %|40-54 %|55-99 %|Total % |Total %
------------------------------------------------------------------------------------------------------------------------------------
ZERO
| 1390 36| 8708 34| 4459 44| 754 52|15311 38 | 78 44| 852 49| 385 57| 41 62| 1356 51 |16667 39
ONE
| 525 13| 3726 15| 1604 16| 259 18| 6114 15 | 28 16| 284 16| 108 16| 10 15| 430 16 | 6544 15
TWO
| 315 8| 2339 9| 825 8| 110 8| 3589 9 | 20 11| 149 9| 44 7| 3 5| 216 8 | 3805 9
THREE
| 243 6| 1535 6| 545 5| 75 5| 2398 6 | 7 4| 90 5| 30 4| 3 5| 130 5 | 2528 6
FOUR
| 196 5| 1180 5| 402 4| 40 3| 1818 4 | 10 6| 66 4| 19 3| 4 6| 99 4 | 1917 4
FIVE
| 144 4| 920 4| 288 3| 29 2| 1381 3 | 5 3| 39 2| 16 2| 1 2| 61 2 | 1442 3
MORE THAN FIVE
| 1084 28| 6853 27| 1915 19| 173 12|10025 25 | 30 17| 251 15| 69 10| 4 6| 354 13 |10379 24
------------------------------------------------------------------------------------------------------------------------------------
Total reported
| 3897 100|25261 100|10038 100| 1440 100|40636 100 | 178 100| 1731 100| 671 100| 66 100| 2646 100 |43282 100
|
|
|
|
|
|
|
|
|
|
|
Percent reported | 100.0| 100.0| 100.0| 100.0| 100.0 | 100.0| 100.0| 100.0| 100.0| 100.0 | 100.0
|
|
|
|
|
|
|
|
|
|
|
|
|
|
|
|
|
|
|
|
|
|
NOT REPORTED
|0|4|1|0|5
|0|0|0|0|0
|5
------------------------------------------------------------------------------------------------------------------------------------
Total
| 3897 |25265 |10039 | 1440 |40641
| 178 | 1731 | 671 | 66 | 2646
|43287
|
|
|
|
|
|
|
|
|
|
|
|
|
|
|
|
|
|
|
|
|
|
|
|
|
|
|
|
|
|
|
|
|
|
|
|
|
|
|
|
|
|
|
|
|
|
|
|
|
|
|
|
|
|
|
AVG NUM DISCIP
| 5.79 | 5.84 | 4.21 | 2.59 | 5.32 | 3.38 | 3.14 | 1.97 | 1.41 | 2.82 | 5.17
Georgia Dept. of Corrections
5/2000
26
Page 21 Run 05/15/00
Georgia Department of Corrections Office of Planning and Analysis
Inmate statistical profile
Sample: ACTIVE PRISONERS EXCLUDING JAIL Active inmates 05/15/2000
Requestor: Statistics Number Of Escapes by current age & sex
|
MEN
|
WOMEN
|
| Age | Age | Age | Age | Men
| Age | Age | Age | Age |Women
|Grand
Escapes
|00-21 %|22-39 %|40-54 %|55-99 %|Total % |00-21 %|22-39 %|40-54 %|55-99 %|Total % |Total %
------------------------------------------------------------------------------------------------------------------------------------
ZERO
| 3884 100|25053 99| 9899 99| 1415 98|40251 99 | 178 100| 1722 99| 668 100| 66 100| 2634 100 |42885 99
ONE
| 13 0| 207 1| 119 1| 20 1| 359 1 | 0 0| 9 1| 3 0| 0 0| 12 0 | 371 1
TWO
| 0 0| 5 0| 16 0| 3 0| 24 0 | 0 0| 0 0| 0 0| 0 0| 0 0 | 24 0
THREE
| 0 0| 0 0| 4 0| 2 0| 6 0 | 0 0| 0 0| 0 0| 0 0| 0 0 | 6 0
FOUR
| 0 0| 0 0| 1 0| 0 0| 1 0 | 0 0| 0 0| 0 0| 0 0| 0 0 | 1 0
FIVE
| 0 0| 0 0| 0 0| 0 0| 0 0 | 0 0| 0 0| 0 0| 0 0| 0 0 | 0 0
MORE THAN FIVE
| 0 0| 0 0| 0 0| 0 0| 0 0 | 0 0| 0 0| 0 0| 0 0| 0 0 | 0 0
------------------------------------------------------------------------------------------------------------------------------------
Total reported
| 3897 100|25265 100|10039 100| 1440 100|40641 100 | 178 100| 1731 100| 671 100| 66 100| 2646 100 |43287 100
|
|
|
|
|
|
|
|
|
|
|
Percent reported | 100.0| 100.0| 100.0| 100.0| 100.0 | 100.0| 100.0| 100.0| 100.0| 100.0 | 100.0
|
|
|
|
|
|
|
|
|
|
|
|
|
|
|
|
|
|
|
|
|
|
NOT REPORTED
|0|0|0|0|0
|0|0|0|0|0
|0
------------------------------------------------------------------------------------------------------------------------------------
Total
| 3897 |25265 |10039 | 1440 |40641
| 178 | 1731 | 671 | 66 | 2646
|43287
|
|
|
|
|
|
|
|
|
|
|
|
|
|
|
|
|
|
|
|
|
|
|
|
|
|
|
|
|
|
|
|
|
|
|
|
|
|
|
|
|
|
|
|
|
|
|
|
|
|
|
|
|
|
|
AVG NUM ESCAPES
| .00 | .01 | .02 | .02 | .01 | .00 | .01 | .00 | .00 | .00 | .01
Georgia Dept. of Corrections
5/2000
27
Page 22 Run 05/15/00
Georgia Department of Corrections Office of Planning and Analysis
Inmate statistical profile
Sample: ACTIVE PRISONERS EXCLUDING JAIL
Requestor: Statistics
Active inmates 05/15/2000
Number Of Prior Georgia Incarcerations * by current age & sex
|
MEN
|
WOMEN
|
| Age | Age | Age | Age | Men
| Age | Age | Age | Age |Women
|Grand
Prior Incarcerations|00-21 %|22-39 %|40-54 %|55-99 %|Total % |00-21 %|22-39 %|40-54 %|55-99 %|Total % |Total %
------------------------------------------------------------------------------------------------------------------------------------
ZERO
| 3551 91|13249 52| 3938 39| 847 59|21585 53 | 171 96| 1106 64| 369 55| 44 67| 1690 64 |23275 54
ONE
| 312 8| 5298 21| 1939 19| 261 18| 7810 19 | 7 4| 311 18| 116 17| 12 18| 446 17 | 8256 19
TWO
| 32 1| 3098 12| 1429 14| 134 9| 4693 12 | 0 0| 147 8| 74 11| 5 8| 226 9 | 4919 11
THREE
| 2 0| 1777 7| 978 10| 79 5| 2836 7 | 0 0| 92 5| 45 7| 2 3| 139 5 | 2975 7
FOUR
| 0 0| 994 4| 710 7| 58 4| 1762 4 | 0 0| 35 2| 24 4| 3 5| 62 2 | 1824 4
FIVE
| 0 0| 518 2| 456 5| 30 2| 1004 2 | 0 0| 25 1| 12 2| 0 0| 37 1 | 1041 2
MORE THAN FIVE
| 0 0| 331 1| 589 6| 31 2| 951 2 | 0 0| 15 1| 31 5| 0 0| 46 2 | 997 2
------------------------------------------------------------------------------------------------------------------------------------
Total reported
| 3897 100|25265 100|10039 100| 1440 100|40641 100 | 178 100| 1731 100| 671 100| 66 100| 2646 100 |43287 100
|
|
|
|
|
|
|
|
|
|
|
Percent reported | 100.0| 100.0| 100.0| 100.0| 100.0 | 100.0| 100.0| 100.0| 100.0| 100.0 | 100.0
|
|
|
|
|
|
|
|
|
|
|
|
|
|
|
|
|
|
|
|
|
|
NOT REPORTED
|0|0|0|0|0
|0|0|0|0|0
|0
------------------------------------------------------------------------------------------------------------------------------------
Total
| 3897 |25265 |10039 | 1440 |40641
| 178 | 1731 | 671 | 66 | 2646
|43287
|
|
|
|
|
|
|
|
|
|
|
|
|
|
|
|
|
|
|
|
|
|
|
|
|
|
|
|
|
|
|
|
|
|
|
|
|
|
|
|
|
|
|
|
|
|
|
|
|
|
|
|
|
|
|
AVG # INCARCERATIONS| .10 | 1.01 | 1.69 | .95 | 1.09 | .04 | .72 | 1.15 | .61 | .78 | 1.07
* This data counts a parole revocation on an existing sentenCE AS A prior incarceration. Also, this data counts, for any cohort of inmates, the total number of Georgia incarcerations the inmate has had during his entire criminal career. For example, if an inmate was admitted to prison first in FY72, and then re-admitted in FY79 and FY85, he had two prior incarcerations before the FY85 admission. This inmate's records show two prior incarcerations in all three of his records since he has had two prior incarcerations in his criminal career. If the cohort of FY72 admissions is selected for analysis, two prior incarcerations will be listed for this inmate even though in FY72, he had no prior incarcerations.
Georgia Dept. of Corrections
5/2000
28
Page 23 Run 05/15/00
Georgia Department of Corrections Office of Planning and Analysis
Inmate statistical profile
Sample: ACTIVE PRISONERS EXCLUDING JAIL Active inmates 05/15/2000
Requestor: Statistics Number Of Transfers by current age & sex
|
MEN
|
WOMEN
|
| Age | Age | Age | Age | Men
| Age | Age | Age | Age |Women
|Grand
Transfers
|00-21 %|22-39 %|40-54 %|55-99 %|Total % |00-21 %|22-39 %|40-54 %|55-99 %|Total % |Total %
------------------------------------------------------------------------------------------------------------------------------------
ZERO
| 871 22| 2290 9| 900 9| 110 8| 4171 10 | 40 22| 358 21| 112 17| 11 17| 521 20 | 4692 11
ONE
| 1947 50|10571 42| 3982 40| 577 40|17077 42 | 122 69| 924 53| 353 53| 22 33| 1421 54 |18498 43
TWO
| 716 18| 5489 22| 1903 19| 271 19| 8379 21 | 11 6| 250 14| 118 18| 11 17| 390 15 | 8769 20
THREE
| 215 6| 2860 11| 1086 11| 157 11| 4318 11 | 4 2| 127 7| 46 7| 8 12| 185 7 | 4503 10
FOUR
| 97 2| 1582 6| 658 7| 99 7| 2436 6 | 1 1| 38 2| 20 3| 6 9| 65 2 | 2501 6
FIVE
| 28 1| 964 4| 462 5| 63 4| 1517 4 | 0 0| 18 1| 9 1| 3 5| 30 1 | 1547 4
MORE THAN FIVE
| 23 1| 1509 6| 1048 10| 163 11| 2743 7 | 0 0| 16 1| 13 2| 5 8| 34 1 | 2777 6
------------------------------------------------------------------------------------------------------------------------------------
Total reported
| 3897 100|25265 100|10039 100| 1440 100|40641 100 | 178 100| 1731 100| 671 100| 66 100| 2646 100 |43287 100
|
|
|
|
|
|
|
|
|
|
|
Percent reported | 100.0| 100.0| 100.0| 100.0| 100.0 | 100.0| 100.0| 100.0| 100.0| 100.0 | 100.0
|
|
|
|
|
|
|
|
|
|
|
|
|
|
|
|
|
|
|
|
|
|
NOT REPORTED
|0|0|0|0|0
|0|0|0|0|0
|0
------------------------------------------------------------------------------------------------------------------------------------
Total
| 3897 |25265 |10039 | 1440 |40641
| 178 | 1731 | 671 | 66 | 2646
|43287
|
|
|
|
|
|
|
|
|
|
|
|
|
|
|
|
|
|
|
|
|
|
|
|
|
|
|
|
|
|
|
|
|
|
|
|
|
|
|
|
|
|
|
|
|
|
|
|
|
|
|
|
|
|
|
AVG NUM TRANSFERS | 1.21 | 2.10 | 2.49 | 2.60 | 2.13 | .90 | 1.25 | 1.41 | 2.24 | 1.29 | 2.08
Georgia Dept. of Corrections
5/2000
29
Page 24 Run 05/15/00
Georgia Department of Corrections Office of Planning and Analysis
Inmate statistical profile
Sample: ACTIVE PRISONERS EXCLUDING JAIL Active inmates 05/15/2000
Requestor: Statistics County Of Conviction by current age & sex
|
MEN
|
WOMEN
|
| Age | Age | Age | Age | Men
| Age | Age | Age | Age |Women
|Grand
County Of Conviction|00-21 %|22-39 %|40-54 %|55-99 %|Total % |00-21 %|22-39 %|40-54 %|55-99 %|Total % |Total %
------------------------------------------------------------------------------------------------------------------------------------
APPLING COUNTY
| 2 0| 49 0| 30 0| 2 0| 83 0 | 1 1| 2 0| 0 0| 0 0| 3 0 | 86 0
ATKINSON COUNTY
| 0 0| 22 0| 11 0| 3 0| 36 0 | 0 0| 1 0| 2 0| 0 0| 3 0 | 39 0
BACON COUNTY
| 2 0| 36 0| 11 0| 0 0| 49 0 | 0 0| 4 0| 0 0| 0 0| 4 0 | 53 0
BAKER COUNTY
| 1 0| 19 0| 3 0| 0 0| 23 0 | 0 0| 3 0| 0 0| 0 0| 3 0 | 26 0
BALDWIN COUNTY
| 40 1| 222 1| 62 1| 10 1| 334 1 | 2 1| 18 1| 1 0| 0 0| 21 1 | 355 1
BANKS COUNTY
| 4 0| 29 0| 22 0| 4 0| 59 0 | 1 1| 1 0| 2 0| 0 0| 4 0 | 63 0
BARROW COUNTY
| 16 0| 84 0| 56 1| 10 1| 166 0 | 0 0| 5 0| 4 1| 0 0| 9 0 | 175 0
BARTOW COUNTY
| 39 1| 227 1| 107 1| 26 2| 399 1 | 1 1| 20 1| 4 1| 0 0| 25 1 | 424 1
BEN HILL COUNTY
| 19 1| 119 0| 41 0| 11 1| 190 0 | 0 0| 9 1| 4 1| 0 0| 13 1 | 203 0
BERRIEN COUNTY
| 4 0| 38 0| 12 0| 3 0| 57 0 | 0 0| 3 0| 0 0| 0 0| 3 0 | 60 0
BIBB COUNTY
| 108 3| 622 2| 272 3| 30 2| 1032 3 | 6 4| 27 2| 22 3| 2 3| 57 2 | 1089 3
BLECKLEY COUNTY
| 14 0| 64 0| 20 0| 3 0| 101 0 | 1 1| 5 0| 2 0| 0 0| 8 0 | 109 0
BRANTLEY COUNTY
| 3 0| 21 0| 12 0| 3 0| 39 0 | 0 0| 3 0| 2 0| 0 0| 5 0 | 44 0
BROOKS COUNTY
| 3 0| 73 0| 20 0| 2 0| 98 0 | 0 0| 1 0| 2 0| 0 0| 3 0 | 101 0
BRYAN COUNTY
| 5 0| 61 0| 25 0| 3 0| 94 0 | 0 0| 2 0| 0 0| 1 2| 3 0 | 97 0
BULLOCH COUNTY
| 53 1| 216 1| 70 1| 8 1| 347 1 | 0 0| 17 1| 5 1| 2 3| 24 1 | 371 1
BURKE COUNTY
| 12 0| 112 0| 39 0| 6 0| 169 0 | 0 0| 3 0| 3 0| 0 0| 6 0 | 175 0
BUTTS COUNTY
| 12 0| 92 0| 28 0| 5 0| 137 0 | 0 0| 6 0| 2 0| 0 0| 8 0 | 145 0
CALHOUN COUNTY
| 3 0| 20 0| 17 0| 3 0| 43 0 | 0 0| 2 0| 1 0| 0 0| 3 0 | 46 0
CAMDEN COUNTY
| 3 0| 72 0| 25 0| 2 0| 102 0 | 1 1| 2 0| 3 0| 1 2| 7 0 | 109 0
CANDLER COUNTY
| 2 0| 71 0| 17 0| 0 0| 90 0 | 0 0| 3 0| 1 0| 0 0| 4 0 | 94 0
CARROLL COUNTY
| 46 1| 247 1| 96 1| 26 2| 415 1 | 5 3| 29 2| 10 2| 0 0| 44 2 | 459 1
CATOOSA COUNTY
| 18 0| 82 0| 54 1| 14 1| 168 0 | 0 0| 13 1| 1 0| 1 2| 15 1 | 183 0
CHARLTON COUNTY
| 2 0| 36 0| 14 0| 2 0| 54 0 | 0 0| 3 0| 1 0| 0 0| 4 0 | 58 0
CHATHAM COUNTY
| 235 6| 1321 5| 445 5| 44 3| 2045 5 | 11 6| 89 5| 38 6| 2 3| 140 5 | 2185 5
CHATTAHOOCHEE COUNTY| 4 0| 10 0| 5 0| 0 0| 19 0 | 0 0| 0 0| 0 0| 0 0| 0 0 | 19 0
CHATTOOGA COUNTY | 14 0| 99 0| 42 0| 7 0| 162 0 | 1 1| 6 0| 1 0| 1 2| 9 0 | 171 0
CHEROKEE COUNTY
| 28 1| 186 1| 113 1| 22 2| 349 1 | 3 2| 24 1| 7 1| 0 0| 34 1 | 383 1
CLARKE COUNTY
| 33 1| 328 1| 115 1| 17 1| 493 1 | 0 0| 24 1| 12 2| 2 3| 38 1 | 531 1
CLAY COUNTY
| 1 0| 18 0| 6 0| 0 0| 25 0 | 0 0| 0 0| 0 0| 0 0| 0 0 | 25 0
CLAYTON COUNTY
| 185 5| 998 4| 308 3| 43 3| 1534 4 | 10 6| 94 6| 34 5| 4 6| 142 6 | 1676 4
CLINCH COUNTY
| 4 0| 27 0| 11 0| 0 0| 42 0 | 0 0| 2 0| 1 0| 0 0| 3 0 | 45 0
COBB COUNTY
| 184 5| 1098 4| 457 5| 63 4| 1802 4 | 11 6| 96 6| 45 7| 4 6| 156 6 | 1958 5
COFFEE COUNTY
| 20 1| 130 1| 42 0| 7 0| 199 0 | 1 1| 9 1| 3 0| 0 0| 13 1 | 212 0
COLQUITT COUNTY
| 24 1| 201 1| 84 1| 17 1| 326 1 | 0 0| 17 1| 5 1| 1 2| 23 1 | 349 1
COLUMBIA COUNTY
| 33 1| 124 0| 38 0| 5 0| 200 0 | 2 1| 10 1| 4 1| 0 0| 16 1 | 216 1
------------------------------------------------------------------------------------------------------------------------------------
(continued)
Georgia Dept. of Corrections
5/2000
30
Page 25 Run 05/15/00
Georgia Department of Corrections Office of Planning and Analysis
Inmate statistical profile
Sample: ACTIVE PRISONERS EXCLUDING JAIL
Requestor: Statistics
Active inmates 05/15/2000
County Of Conviction by current age & sex
(CONTINUED)
|
MEN
|
WOMEN
|
| Age | Age | Age | Age | Men
| Age | Age | Age | Age |Women
|Grand
County Of Conviction|00-21 %|22-39 %|40-54 %|55-99 %|Total % |00-21 %|22-39 %|40-54 %|55-99 %|Total % |Total %
------------------------------------------------------------------------------------------------------------------------------------
COOK COUNTY
| 11 0| 84 0| 38 0| 3 0| 136 0 | 0 0| 9 1| 2 0| 0 0| 11 0 | 147 0
COWETA COUNTY
| 47 1| 277 1| 97 1| 10 1| 431 1 | 3 2| 25 1| 1 0| 0 0| 29 1 | 460 1
CRAWFORD COUNTY
| 1 0| 12 0| 1 0| 0 0| 14 0 | 1 1| 0 0| 1 0| 0 0| 2 0 | 16 0
CRISP COUNTY
| 25 1| 150 1| 67 1| 8 1| 250 1 | 2 1| 10 1| 1 0| 2 3| 15 1 | 265 1
DADE COUNTY
| 5 0| 42 0| 23 0| 7 0| 77 0 | 0 0| 1 0| 0 0| 0 0| 1 0 | 78 0
DAWSON COUNTY
| 4 0| 25 0| 18 0| 4 0| 51 0 | 0 0| 1 0| 0 0| 0 0| 1 0 | 52 0
DECATUR COUNTY
| 32 1| 190 1| 73 1| 10 1| 305 1 | 0 0| 13 1| 4 1| 0 0| 17 1 | 322 1
DEKALB COUNTY
| 318 8| 1727 7| 606 6| 77 5| 2728 7 | 14 8| 59 4| 26 4| 5 8| 104 4 | 2832 7
DODGE COUNTY
| 18 0| 108 0| 47 0| 4 0| 177 0 | 3 2| 17 1| 2 0| 0 0| 22 1 | 199 0
DOOLY COUNTY
| 10 0| 72 0| 26 0| 0 0| 108 0 | 0 0| 4 0| 0 0| 0 0| 4 0 | 112 0
DOUGHERTY COUNTY | 71 2| 562 2| 200 2| 23 2| 856 2 | 3 2| 29 2| 13 2| 0 0| 45 2 | 901 2
DOUGLAS COUNTY
| 63 2| 345 1| 136 1| 23 2| 567 1 | 3 2| 24 1| 12 2| 0 0| 39 2 | 606 1
EARLY COUNTY
| 8 0| 54 0| 16 0| 5 0| 83 0 | 0 0| 3 0| 1 0| 0 0| 4 0 | 87 0
ECHOLS COUNTY.
| 1 0| 5 0| 2 0| 1 0| 9 0 | 0 0| 0 0| 0 0| 0 0| 0 0 | 9 0
EFFINGHAM COUNTY | 20 1| 83 0| 29 0| 3 0| 135 0 | 1 1| 7 0| 2 0| 1 2| 11 0 | 146 0
ELBERT COUNTY
| 14 0| 103 0| 45 0| 7 0| 169 0 | 1 1| 8 0| 3 0| 0 0| 12 0 | 181 0
EMANUEL COUNTY
| 10 0| 110 0| 36 0| 6 0| 162 0 | 0 0| 6 0| 0 0| 0 0| 6 0 | 168 0
EVANS COUNTY
| 6 0| 49 0| 14 0| 4 0| 73 0 | 0 0| 0 0| 4 1| 0 0| 4 0 | 77 0
FANNIN COUNTY
| 2 0| 55 0| 35 0| 9 1| 101 0 | 0 0| 6 0| 0 0| 1 2| 7 0 | 108 0
FAYETTE COUNTY
| 17 0| 118 0| 40 0| 8 1| 183 0 | 2 1| 5 0| 2 0| 0 0| 9 0 | 192 0
FLOYD COUNTY
| 37 1| 398 2| 162 2| 19 1| 616 2 | 4 2| 48 3| 16 2| 1 2| 69 3 | 685 2
FORSYTH COUNTY
| 6 0| 86 0| 46 0| 10 1| 148 0 | 0 0| 8 0| 4 1| 0 0| 12 0 | 160 0
FRANKLIN COUNTY
| 18 0| 72 0| 23 0| 4 0| 117 0 | 0 0| 4 0| 3 0| 1 2| 8 0 | 125 0
FULTON COUNTY
| 248 7| 2133 9| 980 10| 132 9| 3493 9 | 8 5| 63 4| 38 6| 8 12| 117 5 | 3610 8
GILMER COUNTY
| 10 0| 62 0| 36 0| 10 1| 118 0 | 0 0| 0 0| 3 0| 0 0| 3 0 | 121 0
GLASCOCK COUNTY
| 2 0| 3 0| 2 0| 0 0| 7 0 | 0 0| 0 0| 0 0| 0 0| 0 0 | 7 0
GLYNN COUNTY
| 39 1| 311 1| 114 1| 18 1| 482 1 | 1 1| 18 1| 10 2| 1 2| 30 1 | 512 1
GORDON COUNTY
| 15 0| 164 1| 59 1| 16 1| 254 1 | 0 0| 17 1| 3 0| 0 0| 20 1 | 274 1
GRADY COUNTY
| 31 1| 118 0| 53 1| 6 0| 208 1 | 2 1| 17 1| 5 1| 0 0| 24 1 | 232 1
GREENE COUNTY
| 20 1| 39 0| 11 0| 2 0| 72 0 | 0 0| 1 0| 0 0| 0 0| 1 0 | 73 0
GWINNETT COUNTY
| 86 2| 641 3| 249 3| 45 3| 1021 3 | 5 3| 42 3| 27 4| 4 6| 78 3 | 1099 3
HABERSHAM COUNTY | 7 0| 55 0| 18 0| 2 0| 82 0 | 2 1| 1 0| 1 0| 0 0| 4 0 | 86 0
HALL COUNTY
| 42 1| 311 1| 177 2| 26 2| 556 1 | 4 2| 29 2| 7 1| 2 3| 42 2 | 598 1
HANCOCK COUNTY
| 5 0| 24 0| 5 0| 1 0| 35 0 | 0 0| 0 0| 1 0| 1 2| 2 0 | 37 0
HARALSON COUNTY
| 15 0| 56 0| 25 0| 4 0| 100 0 | 0 0| 8 0| 0 0| 0 0| 8 0 | 108 0
------------------------------------------------------------------------------------------------------------------------------------
(continued)
Georgia Dept. of Corrections
5/2000
31
Page 26 Run 05/15/00
Georgia Department of Corrections Office of Planning and Analysis
Inmate statistical profile
Sample: ACTIVE PRISONERS EXCLUDING JAIL
Requestor: Statistics
Active inmates 05/15/2000
County Of Conviction by current age & sex
(CONTINUED)
|
MEN
|
WOMEN
|
| Age | Age | Age | Age | Men
| Age | Age | Age | Age |Women
|Grand
County Of Conviction|00-21 %|22-39 %|40-54 %|55-99 %|Total % |00-21 %|22-39 %|40-54 %|55-99 %|Total % |Total %
------------------------------------------------------------------------------------------------------------------------------------
HARRIS COUNTY
| 16 0| 55 0| 30 0| 3 0| 104 0 | 1 1| 2 0| 0 0| 0 0| 3 0 | 107 0
HART COUNTY
| 4 0| 67 0| 13 0| 3 0| 87 0 | 1 1| 4 0| 2 0| 0 0| 7 0 | 94 0
HEARD COUNTY
| 4 0| 30 0| 17 0| 12 1| 63 0 | 1 1| 2 0| 0 0| 0 0| 3 0 | 66 0
HENRY COUNTY
| 22 1| 166 1| 68 1| 12 1| 268 1 | 1 1| 14 1| 4 1| 0 0| 19 1 | 287 1
HOUSTON COUNTY
| 41 1| 263 1| 107 1| 12 1| 423 1 | 0 0| 14 1| 5 1| 1 2| 20 1 | 443 1
IRWIN COUNTY
| 5 0| 51 0| 14 0| 6 0| 76 0 | 0 0| 1 0| 0 0| 0 0| 1 0 | 77 0
JACKSON COUNTY
| 17 0| 102 0| 62 1| 7 0| 188 0 | 2 1| 11 1| 3 0| 0 0| 16 1 | 204 0
JASPER COUNTY
| 3 0| 47 0| 12 0| 1 0| 63 0 | 0 0| 0 0| 2 0| 0 0| 2 0 | 65 0
JEFF DAVIS COUNTY | 2 0| 34 0| 23 0| 2 0| 61 0 | 0 0| 2 0| 1 0| 0 0| 3 0 | 64 0
JEFFERSON COUNTY | 16 0| 91 0| 31 0| 6 0| 144 0 | 0 0| 11 1| 1 0| 0 0| 12 0 | 156 0
JENKINS COUNTY
| 9 0| 55 0| 12 0| 1 0| 77 0 | 0 0| 4 0| 0 0| 0 0| 4 0 | 81 0
JOHNSON COUNTY
| 5 0| 37 0| 9 0| 1 0| 52 0 | 0 0| 3 0| 1 0| 0 0| 4 0 | 56 0
JONES COUNTY
| 11 0| 29 0| 18 0| 3 0| 61 0 | 0 0| 4 0| 0 0| 0 0| 4 0 | 65 0
LAMAR COUNTY
| 7 0| 69 0| 33 0| 6 0| 115 0 | 0 0| 2 0| 2 0| 0 0| 4 0 | 119 0
LANIER COUNTY
| 1 0| 30 0| 8 0| 4 0| 43 0 | 0 0| 4 0| 1 0| 0 0| 5 0 | 48 0
LAURENS COUNTY
| 27 1| 155 1| 59 1| 3 0| 244 1 | 1 1| 9 1| 3 0| 1 2| 14 1 | 258 1
LEE COUNTY
| 6 0| 35 0| 10 0| 0 0| 51 0 | 1 1| 1 0| 1 0| 0 0| 3 0 | 54 0
LIBERTY COUNTY
| 29 1| 135 1| 42 0| 10 1| 216 1 | 0 0| 13 1| 4 1| 0 0| 17 1 | 233 1
LINCOLN COUNTY
| 1 0| 19 0| 13 0| 1 0| 34 0 | 0 0| 1 0| 0 0| 0 0| 1 0 | 35 0
LONG COUNTY
| 5 0| 39 0| 20 0| 4 0| 68 0 | 0 0| 4 0| 0 0| 0 0| 4 0 | 72 0
LOWNDES COUNTY
| 39 1| 353 1| 129 1| 13 1| 534 1 | 2 1| 25 1| 13 2| 1 2| 41 2 | 575 1
LUMPKIN COUNTY
| 5 0| 41 0| 20 0| 8 1| 74 0 | 0 0| 1 0| 2 0| 0 0| 3 0 | 77 0
MACON COUNTY
| 14 0| 50 0| 18 0| 0 0| 82 0 | 0 0| 1 0| 1 0| 0 0| 2 0 | 84 0
MADISON COUNTY
| 7 0| 46 0| 31 0| 10 1| 94 0 | 0 0| 6 0| 1 0| 1 2| 8 0 | 102 0
MARION COUNTY
| 3 0| 27 0| 11 0| 1 0| 42 0 | 0 0| 0 0| 3 0| 0 0| 3 0 | 45 0
MCDUFFIE COUNTY
| 12 0| 131 1| 38 0| 10 1| 191 0 | 1 1| 4 0| 2 0| 0 0| 7 0 | 198 0
MCINTOSH COUNTY
| 6 0| 57 0| 23 0| 3 0| 89 0 | 1 1| 2 0| 0 0| 0 0| 3 0 | 92 0
MERIWETHER COUNTY | 30 1| 103 0| 51 1| 7 0| 191 0 | 0 0| 8 0| 4 1| 2 3| 14 1 | 205 0
MILLER COUNTY
| 5 0| 18 0| 7 0| 1 0| 31 0 | 2 1| 2 0| 0 0| 0 0| 4 0 | 35 0
MITCHELL COUNTY
| 19 1| 144 1| 59 1| 5 0| 227 1 | 3 2| 12 1| 3 0| 0 0| 18 1 | 245 1
MONROE COUNTY
| 20 1| 59 0| 36 0| 2 0| 117 0 | 0 0| 2 0| 1 0| 0 0| 3 0 | 120 0
MONTGOMERY COUNTY | 2 0| 22 0| 9 0| 0 0| 33 0 | 0 0| 0 0| 2 0| 0 0| 2 0 | 35 0
MORGAN COUNTY
| 11 0| 60 0| 23 0| 3 0| 97 0 | 0 0| 5 0| 0 0| 0 0| 5 0 | 102 0
MURRAY COUNTY
| 13 0| 77 0| 29 0| 7 0| 126 0 | 0 0| 6 0| 2 0| 0 0| 8 0 | 134 0
MUSCOGEE COUNTY
| 151 4| 842 3| 348 4| 40 3| 1381 3 | 7 4| 69 4| 30 5| 2 3| 108 4 | 1489 3
------------------------------------------------------------------------------------------------------------------------------------
(continued)
Georgia Dept. of Corrections
5/2000
32
Page 27 Run 05/15/00
Georgia Department of Corrections Office of Planning and Analysis
Inmate statistical profile
Sample: ACTIVE PRISONERS EXCLUDING JAIL
Requestor: Statistics
Active inmates 05/15/2000
County Of Conviction by current age & sex
(CONTINUED)
|
MEN
|
WOMEN
|
| Age | Age | Age | Age | Men
| Age | Age | Age | Age |Women
|Grand
County Of Conviction|00-21 %|22-39 %|40-54 %|55-99 %|Total % |00-21 %|22-39 %|40-54 %|55-99 %|Total % |Total %
------------------------------------------------------------------------------------------------------------------------------------
NEWTON COUNTY
| 24 1| 223 1| 71 1| 15 1| 333 1 | 1 1| 12 1| 6 1| 2 3| 21 1 | 354 1
OCONEE COUNTY
| 9 0| 30 0| 10 0| 1 0| 50 0 | 0 0| 1 0| 0 0| 0 0| 1 0 | 51 0
OGLETHORPE COUNTY | 5 0| 29 0| 8 0| 1 0| 43 0 | 0 0| 0 0| 0 0| 0 0| 0 0 | 43 0
PAULDING COUNTY
| 4 0| 68 0| 50 1| 10 1| 132 0 | 0 0| 5 0| 3 0| 0 0| 8 0 | 140 0
PEACH COUNTY
| 4 0| 56 0| 36 0| 0 0| 96 0 | 0 0| 1 0| 2 0| 0 0| 3 0 | 99 0
PICKENS COUNTY
| 5 0| 50 0| 26 0| 9 1| 90 0 | 0 0| 5 0| 5 1| 0 0| 10 0 | 100 0
PIERCE COUNTY
| 6 0| 31 0| 18 0| 1 0| 56 0 | 0 0| 0 0| 0 0| 0 0| 0 0 | 56 0
PIKE COUNTY
| 3 0| 19 0| 11 0| 3 0| 36 0 | 0 0| 0 0| 1 0| 0 0| 1 0 | 37 0
POLK COUNTY
| 15 0| 106 0| 38 0| 8 1| 167 0 | 0 0| 1 0| 0 0| 0 0| 1 0 | 168 0
PULASKI COUNTY
| 13 0| 53 0| 17 0| 4 0| 87 0 | 0 0| 9 1| 1 0| 0 0| 10 0 | 97 0
PUTNAM COUNTY
| 10 0| 76 0| 37 0| 5 0| 128 0 | 0 0| 4 0| 1 0| 1 2| 6 0 | 134 0
QUITMAN COUNTY
| 2 0| 11 0| 1 0| 0 0| 14 0 | 0 0| 0 0| 1 0| 1 2| 2 0 | 16 0
RABUN COUNTY
| 4 0| 22 0| 11 0| 2 0| 39 0 | 0 0| 0 0| 3 0| 0 0| 3 0 | 42 0
RANDOLPH COUNTY
| 5 0| 45 0| 16 0| 3 0| 69 0 | 0 0| 3 0| 2 0| 0 0| 5 0 | 74 0
RICHMOND COUNTY
| 142 4| 1038 4| 402 4| 38 3| 1620 4 | 6 4| 91 5| 42 6| 1 2| 140 5 | 1760 4
ROCKDALE COUNTY
| 23 1| 167 1| 91 1| 16 1| 297 1 | 0 0| 5 0| 7 1| 0 0| 12 0 | 309 1
SCHLEY COUNTY
| 1 0| 18 0| 5 0| 0 0| 24 0 | 0 0| 1 0| 0 0| 0 0| 1 0 | 25 0
SCREVEN COUNTY
| 18 0| 79 0| 31 0| 3 0| 131 0 | 3 2| 8 0| 0 0| 0 0| 11 0 | 142 0
SEMINOLE COUNTY
| 7 0| 55 0| 23 0| 2 0| 87 0 | 0 0| 2 0| 2 0| 0 0| 4 0 | 91 0
SPALDING COUNTY
| 51 1| 369 1| 125 1| 23 2| 568 1 | 6 4| 25 1| 10 2| 2 3| 43 2 | 611 1
STEPHENS COUNTY
| 6 0| 61 0| 24 0| 4 0| 95 0 | 0 0| 4 0| 0 0| 0 0| 4 0 | 99 0
STEWART COUNTY
| 5 0| 16 0| 4 0| 1 0| 26 0 | 0 0| 0 0| 2 0| 0 0| 2 0 | 28 0
SUMTER COUNTY
| 20 1| 130 1| 49 0| 5 0| 204 1 | 1 1| 7 0| 5 1| 0 0| 13 1 | 217 1
TALBOT COUNTY
| 10 0| 21 0| 5 0| 0 0| 36 0 | 0 0| 1 0| 1 0| 0 0| 2 0 | 38 0
TALIAFERRO COUNTY | 1 0| 4 0| 7 0| 0 0| 12 0 | 0 0| 0 0| 1 0| 0 0| 1 0 | 13 0
TATTNALL COUNTY
| 11 0| 81 0| 38 0| 6 0| 136 0 | 0 0| 2 0| 3 0| 0 0| 5 0 | 141 0
TAYLOR COUNTY
| 11 0| 44 0| 16 0| 2 0| 73 0 | 2 1| 1 0| 0 0| 0 0| 3 0 | 76 0
TELFAIR COUNTY
| 9 0| 89 0| 32 0| 2 0| 132 0 | 1 1| 8 0| 3 0| 0 0| 12 0 | 144 0
TERRELL COUNTY
| 6 0| 62 0| 18 0| 2 0| 88 0 | 0 0| 2 0| 0 0| 0 0| 2 0 | 90 0
THOMAS COUNTY
| 22 1| 202 1| 63 1| 9 1| 296 1 | 1 1| 10 1| 5 1| 0 0| 16 1 | 312 1
TIFT COUNTY
| 25 1| 183 1| 85 1| 13 1| 306 1 | 2 1| 9 1| 3 0| 1 2| 15 1 | 321 1
TOOMBS COUNTY
| 32 1| 169 1| 54 1| 7 0| 262 1 | 2 1| 15 1| 2 0| 0 0| 19 1 | 281 1
TOWNS COUNTY
| 2 0| 14 0| 8 0| 1 0| 25 0 | 0 0| 0 0| 0 0| 0 0| 0 0 | 25 0
TREUTLEN COUNTY
| 5 0| 27 0| 14 0| 0 0| 46 0 | 0 0| 1 0| 1 0| 0 0| 2 0 | 48 0
TROUP COUNTY
| 78 2| 397 2| 126 1| 19 1| 620 2 | 3 2| 30 2| 12 2| 0 0| 45 2 | 665 2
------------------------------------------------------------------------------------------------------------------------------------
(continued)
Georgia Dept. of Corrections
5/2000
33
Page 28 Run 05/15/00
Georgia Department of Corrections Office of Planning and Analysis
Inmate statistical profile
Sample: ACTIVE PRISONERS EXCLUDING JAIL
Requestor: Statistics
Active inmates 05/15/2000
County Of Conviction by current age & sex
(CONTINUED)
|
MEN
|
WOMEN
|
| Age | Age | Age | Age | Men
| Age | Age | Age | Age |Women
|Grand
County Of Conviction|00-21 %|22-39 %|40-54 %|55-99 %|Total % |00-21 %|22-39 %|40-54 %|55-99 %|Total % |Total %
------------------------------------------------------------------------------------------------------------------------------------
TURNER COUNTY
| 5 0| 50 0| 23 0| 2 0| 80 0 | 0 0| 3 0| 0 0| 0 0| 3 0 | 83 0
TWIGGS COUNTY
| 3 0| 18 0| 12 0| 2 0| 35 0 | 0 0| 0 0| 0 0| 0 0| 0 0 | 35 0
UNION COUNTY
| 4 0| 24 0| 9 0| 2 0| 39 0 | 0 0| 1 0| 0 0| 0 0| 1 0 | 40 0
UPSON COUNTY
| 17 0| 116 0| 45 0| 10 1| 188 0 | 0 0| 7 0| 1 0| 0 0| 8 0 | 196 0
WALKER COUNTY
| 20 1| 167 1| 66 1| 11 1| 264 1 | 0 0| 13 1| 5 1| 0 0| 18 1 | 282 1
WALTON COUNTY
| 13 0| 174 1| 63 1| 10 1| 260 1 | 0 0| 13 1| 3 0| 0 0| 16 1 | 276 1
WARE COUNTY
| 33 1| 258 1| 110 1| 12 1| 413 1 | 1 1| 21 1| 3 0| 0 0| 25 1 | 438 1
WARREN COUNTY
| 3 0| 26 0| 18 0| 2 0| 49 0 | 0 0| 0 0| 1 0| 0 0| 1 0 | 50 0
WASHINGTON COUNTY | 17 0| 78 0| 27 0| 2 0| 124 0 | 0 0| 5 0| 3 0| 0 0| 8 0 | 132 0
WAYNE COUNTY
| 10 0| 81 0| 24 0| 3 0| 118 0 | 0 0| 3 0| 0 0| 0 0| 3 0 | 121 0
WEBSTER COUNTY
| 0 0| 8 0| 1 0| 0 0| 9 0 | 0 0| 1 0| 0 0| 0 0| 1 0 | 10 0
WHEELER COUNTY
| 2 0| 22 0| 12 0| 3 0| 39 0 | 0 0| 0 0| 0 0| 1 2| 1 0 | 40 0
WHITE COUNTY
| 6 0| 37 0| 15 0| 1 0| 59 0 | 0 0| 3 0| 1 0| 0 0| 4 0 | 63 0
WHITFIELD COUNTY | 35 1| 326 1| 153 2| 26 2| 540 1 | 2 1| 35 2| 7 1| 0 0| 44 2 | 584 1
WILCOX COUNTY
| 2 0| 24 0| 11 0| 5 0| 42 0 | 0 0| 4 0| 0 0| 0 0| 4 0 | 46 0
WILKES COUNTY
| 9 0| 39 0| 18 0| 2 0| 68 0 | 0 0| 6 0| 0 0| 0 0| 6 0 | 74 0
WILKINSON COUNTY | 2 0| 30 0| 9 0| 1 0| 42 0 | 0 0| 2 0| 0 0| 0 0| 2 0 | 44 0
WORTH COUNTY
| 7 0| 82 0| 29 0| 5 0| 123 0 | 0 0| 4 0| 0 0| 0 0| 4 0 | 127 0
CONVERSION
| 0 0| 0 0| 0 0| 0 0| 0 0 | 0 0| 0 0| 0 0| 0 0| 0 0 | 0 0
------------------------------------------------------------------------------------------------------------------------------------
Total reported
| 3790 100|24962 100| 9887 100| 1429 100|40068 100 | 171 100| 1669 100| 656 100| 65 100| 2561 100 |42629 100
|
|
|
|
|
|
|
|
|
|
|
Percent reported |
97.3|
98.8|
98.5|
99.2|
98.6 |
96.1|
96.4|
97.8|
98.5|
96.8 |
98.5
|
|
|
|
|
|
|
|
|
|
|
|
|
|
|
|
|
|
|
|
|
|
UNKNOWN
| 107 | 303 | 152 | 11 | 573
| 7 | 62 | 15 | 1 | 85
| 658
------------------------------------------------------------------------------------------------------------------------------------
Total
| 3897 |25265 |10039 | 1440 |40641
| 178 | 1731 | 671 | 66 | 2646
|43287
Georgia Dept. of Corrections
5/2000
34
Page 29 Run 05/15/00
Georgia Department of Corrections Office of Planning and Analysis
Inmate statistical profile
Sample: ACTIVE PRISONERS EXCLUDING JAIL Active inmates 05/15/2000
Requestor: Statistics Circuit Of Conviction by current age & sex
|
MEN
|
WOMEN
|
| Age | Age | Age | Age | Men
| Age | Age | Age | Age |Women
|Grand
Circ Of Conviction |00-21 %|22-39 %|40-54 %|55-99 %|Total % |00-21 %|22-39 %|40-54 %|55-99 %|Total % |Total %
------------------------------------------------------------------------------------------------------------------------------------
ALAPAHA CIRCUIT
| 20 1| 201 1| 80 1| 13 1| 314 1 | 0 0| 19 1| 6 1| 0 0| 25 1 | 339 1
ALCOVY CIRCUIT
| 37 1| 397 2| 134 1| 25 2| 593 1 | 1 1| 25 2| 9 1| 2 3| 37 1 | 630 1
ATLANTA CIRCUIT
| 248 7| 2133 9| 980 10| 132 9| 3493 9 | 8 5| 63 4| 38 6| 8 12| 117 5 | 3610 9
ATLANTIC CIRCUIT | 62 2| 422 2| 162 2| 30 2| 676 2 | 1 1| 23 1| 11 2| 1 2| 36 1 | 712 2
AUGUSTA CIRCUIT
| 187 5| 1274 5| 479 5| 49 3| 1989 5 | 8 5| 104 6| 49 8| 1 2| 162 6 | 2151 5
BLUE RIDGE CIRCUIT | 30 1| 213 1| 134 1| 30 2| 407 1 | 3 2| 27 2| 11 2| 0 0| 41 2 | 448 1
BRUNSWICK CIRCUIT | 56 1| 547 2| 216 2| 27 2| 846 2 | 3 2| 27 2| 14 2| 2 3| 46 2 | 892 2
CHATTAHOOCHEE CIRCUI| 195 5| 999 4| 415 4| 46 3| 1655 4 | 10 6| 73 4| 34 5| 2 3| 119 5 | 1774 4
CHEROKEE CIRCUIT | 54 1| 391 2| 166 2| 42 3| 653 2 | 1 1| 37 2| 7 1| 0 0| 45 2 | 698 2
CLAYTON CIRCUIT
| 185 5| 998 4| 308 3| 43 3| 1534 4 | 10 6| 94 6| 34 5| 4 6| 142 6 | 1676 4
COBB CIRCUIT
| 184 5| 1098 4| 457 5| 63 4| 1802 5 | 11 6| 96 6| 45 7| 4 6| 156 6 | 1958 5
CONASAUGA CIRCUIT | 48 1| 403 2| 182 2| 33 2| 666 2 | 2 1| 41 2| 9 1| 0 0| 52 2 | 718 2
CORDELE CIRCUIT
| 56 1| 365 1| 145 1| 24 2| 590 1 | 2 1| 27 2| 5 1| 2 3| 36 1 | 626 1
COWETA CIRCUIT
| 205 5| 1054 4| 387 4| 74 5| 1720 4 | 12 7| 94 6| 27 4| 2 3| 135 5 | 1855 4
DOUGHERTY CIRCUIT | 71 2| 562 2| 200 2| 23 2| 856 2 | 3 2| 29 2| 13 2| 0 0| 45 2 | 901 2
DUBLIN CIRCUIT
| 40 1| 237 1| 94 1| 6 0| 377 1 | 1 1| 13 1| 5 1| 1 2| 20 1 | 397 1
EASTERN CIRCUIT
| 235 6| 1321 5| 445 5| 44 3| 2045 5 | 11 6| 89 5| 38 6| 2 3| 140 5 | 2185 5
FLINT CIRCUIT
| 38 1| 293 1| 129 1| 23 2| 483 1 | 1 1| 18 1| 5 1| 0 0| 24 1 | 507 1
GRIFFIN CIRCUIT
| 88 2| 622 3| 221 2| 44 3| 975 2 | 8 5| 37 2| 14 2| 2 3| 61 2 | 1036 2
GWINNETT CIRCUIT | 86 2| 641 3| 249 3| 45 3| 1021 3 | 5 3| 42 3| 27 4| 4 6| 78 3 | 1099 3
HOUSTON CIRCUIT
| 41 1| 263 1| 107 1| 12 1| 423 1 | 0 0| 14 1| 5 1| 1 2| 20 1 | 443 1
LOOKOUT MOUNTAIN CIR| 57 2| 390 2| 185 2| 39 3| 671 2 | 1 1| 33 2| 7 1| 2 3| 43 2 | 714 2
MACON CIRCUIT
| 113 3| 690 3| 309 3| 30 2| 1142 3 | 7 4| 28 2| 25 4| 2 3| 62 2 | 1204 3
MIDDLE CIRCUIT
| 77 2| 519 2| 165 2| 21 1| 782 2 | 2 1| 40 2| 7 1| 0 0| 49 2 | 831 2
MOUNTAIN CIRCUIT | 17 0| 138 1| 53 1| 8 1| 216 1 | 2 1| 5 0| 4 1| 0 0| 11 0 | 227 1
NORTHEASTERN CIRCUIT| 46 1| 336 1| 195 2| 30 2| 607 2 | 4 2| 30 2| 7 1| 2 3| 43 2 | 650 2
NORTHERN CIRCUIT | 48 1| 317 1| 120 1| 25 2| 510 1 | 2 1| 22 1| 9 1| 2 3| 35 1 | 545 1
OCMULGEE CIRCUIT | 102 3| 527 2| 177 2| 26 2| 832 2 | 2 1| 34 2| 5 1| 2 3| 43 2 | 875 2
OCONEE CIRCUIT
| 58 2| 358 1| 137 1| 16 1| 569 1 | 5 3| 39 2| 10 2| 1 2| 55 2 | 624 1
OGEECHEE CIRCUIT | 100 3| 433 2| 142 1| 15 1| 690 2 | 4 2| 36 2| 7 1| 3 5| 50 2 | 740 2
PATAULA CIRCUIT
| 34 1| 263 1| 87 1| 13 1| 397 1 | 2 1| 12 1| 6 1| 1 2| 21 1 | 418 1
PIEDMONT CIRCUIT | 37 1| 215 1| 140 1| 21 1| 413 1 | 3 2| 17 1| 9 1| 0 0| 29 1 | 442 1
ROME CIRCUIT
| 37 1| 398 2| 162 2| 19 1| 616 2 | 4 2| 48 3| 16 2| 1 2| 69 3 | 685 2
SOUTH GEORGIA CIRCUI| 86 2| 491 2| 205 2| 24 2| 806 2 | 5 3| 47 3| 13 2| 0 0| 65 3 | 871 2
SOUTHERN CIRCUIT | 89 2| 834 3| 298 3| 42 3| 1263 3 | 3 2| 53 3| 25 4| 2 3| 83 3 | 1346 3
------------------------------------------------------------------------------------------------------------------------------------
(continued)
Georgia Dept. of Corrections
5/2000
35
Page 30 Run 05/15/00
Georgia Department of Corrections Office of Planning and Analysis
Inmate statistical profile
Sample: ACTIVE PRISONERS EXCLUDING JAIL
Requestor: Statistics
Active inmates 05/15/2000
Circuit Of Conviction by current age & sex
(Continued)
|
MEN
|
WOMEN
|
| Age | Age | Age | Age | Men
| Age | Age | Age | Age |Women
|Grand
Circ Of Conviction |00-21 %|22-39 %|40-54 %|55-99 %|Total % |00-21 %|22-39 %|40-54 %|55-99 %|Total % |Total %
------------------------------------------------------------------------------------------------------------------------------------
SOUTHWESTERN CIRCUIT| 46 1| 257 1| 87 1| 6 0| 396 1 | 2 1| 11 1| 9 1| 0 0| 22 1 | 418 1
STONE MOUNTAIN CIRCU| 318 8| 1727 7| 606 6| 77 5| 2728 7 | 14 8| 59 4| 26 4| 5 8| 104 4 | 2832 7
TALLAPOOSA CIRCUIT | 34 1| 230 1| 113 1| 22 2| 399 1 | 0 0| 14 1| 3 0| 0 0| 17 1 | 416 1
TIFTON CIRCUIT
| 42 1| 366 1| 151 2| 26 2| 585 1 | 2 1| 17 1| 3 0| 1 2| 23 1 | 608 1
TOOMBS CIRCUIT
| 28 1| 222 1| 96 1| 15 1| 361 1 | 1 1| 11 1| 4 1| 0 0| 16 1 | 377 1
WAYCROSS CIRCUIT | 66 2| 512 2| 207 2| 25 2| 810 2 | 2 1| 40 2| 9 1| 0 0| 51 2 | 861 2
WESTERN CIRCUIT
| 42 1| 358 1| 125 1| 18 1| 543 1 | 0 0| 25 2| 12 2| 2 3| 39 2 | 582 1
ROCKDALE CIRCUIT | 23 1| 167 1| 91 1| 16 1| 297 1 | 0 0| 5 0| 7 1| 0 0| 12 0 | 309 1
DOUGLAS CIRCUIT
| 63 2| 345 1| 136 1| 23 2| 567 1 | 3 2| 24 1| 12 2| 0 0| 39 2 | 606 1
APPALACHIAN CIRCUIT | 17 0| 167 1| 97 1| 28 2| 309 1 | 0 0| 11 1| 8 1| 1 2| 20 1 | 329 1
ENOTAH CIRCUIT
| 17 0| 116 0| 52 1| 12 1| 197 0 | 0 0| 5 0| 3 0| 0 0| 8 0 | 205 0
BELL-FORSYTH CIRCUIT| 4 0| 59 0| 25 0| 2 0| 90 0 | 0 0| 5 0| 0 0| 0 0| 5 0 | 95 0
------------------------------------------------------------------------------------------------------------------------------------
Total reported
| 3767 100|24869 100| 9851 100| 1427 100|39914 100 | 171 100| 1663 100| 652 100| 65 100| 2551 100 |42465 100
|
|
|
|
|
|
|
|
|
|
|
Percent reported |
96.7|
98.4|
98.1|
99.1|
98.2 |
96.1|
96.1|
97.2|
98.5|
96.4 |
98.1
|
|
|
|
|
|
|
|
|
|
|
|
|
|
|
|
|
|
|
|
|
|
NOT REPORTED
| 130 | 396 | 188 | 13 | 727
| 7 | 68 | 19 | 1 | 95
| 822
------------------------------------------------------------------------------------------------------------------------------------
Total
| 3897 |25265 |10039 | 1440 |40641
| 178 | 1731 | 671 | 66 | 2646
|43287
Georgia Dept. of Corrections
5/2000
36
Page 31 Run 05/15/00
Georgia Department of Corrections Office of Planning and Analysis
Inmate statistical profile
Sample: ACTIVE PRISONERS EXCLUDING JAIL Active inmates 05/15/2000
Requestor: Statistics Home County by current age & sex
|
MEN
|
WOMEN
|
| Age | Age | Age | Age | Men
| Age | Age | Age | Age |Women
|Grand
Home County
|00-21 %|22-39 %|40-54 %|55-99 %|Total % |00-21 %|22-39 %|40-54 %|55-99 %|Total % |Total %
------------------------------------------------------------------------------------------------------------------------------------
APPLING COUNTY
| 3 0| 59 0| 28 0| 3 0| 93 0 | 0 0| 4 0| 0 0| 0 0| 4 0 | 97 0
ATKINSON COUNTY
| 1 0| 25 0| 11 0| 5 0| 42 0 | 0 0| 0 0| 0 0| 0 0| 0 0 | 42 0
BACON COUNTY
| 2 0| 31 0| 14 0| 1 0| 48 0 | 0 0| 2 0| 1 0| 0 0| 3 0 | 51 0
BAKER COUNTY
| 2 0| 14 0| 5 0| 1 0| 22 0 | 0 0| 1 0| 0 0| 0 0| 1 0 | 23 0
BALDWIN COUNTY
| 33 1| 190 1| 52 1| 10 1| 285 1 | 2 1| 14 1| 2 0| 1 2| 19 1 | 304 1
BANKS COUNTY
| 0 0| 28 0| 16 0| 3 0| 47 0 | 1 1| 1 0| 2 0| 0 0| 4 0 | 51 0
BARROW COUNTY
| 16 0| 104 0| 48 1| 8 1| 176 0 | 0 0| 8 0| 3 0| 0 0| 11 0 | 187 0
BARTOW COUNTY
| 37 1| 225 1| 99 1| 25 2| 386 1 | 2 1| 21 1| 8 1| 0 0| 31 1 | 417 1
BEN HILL COUNTY
| 18 0| 99 0| 30 0| 10 1| 157 0 | 0 0| 7 0| 5 1| 0 0| 12 0 | 169 0
BERRIEN COUNTY
| 2 0| 37 0| 10 0| 4 0| 53 0 | 0 0| 5 0| 1 0| 0 0| 6 0 | 59 0
BIBB COUNTY
| 113 3| 636 3| 288 3| 29 2| 1066 3 | 7 4| 35 2| 23 4| 1 2| 66 3 | 1132 3
BLECKLEY COUNTY
| 13 0| 64 0| 19 0| 3 0| 99 0 | 1 1| 6 0| 2 0| 0 0| 9 0 | 108 0
BRANTLEY COUNTY
| 5 0| 20 0| 8 0| 2 0| 35 0 | 0 0| 3 0| 1 0| 0 0| 4 0 | 39 0
BROOKS COUNTY
| 2 0| 65 0| 20 0| 2 0| 89 0 | 0 0| 1 0| 2 0| 0 0| 3 0 | 92 0
BRYAN COUNTY
| 9 0| 52 0| 28 0| 3 0| 92 0 | 0 0| 2 0| 2 0| 0 0| 4 0 | 96 0
BULLOCH COUNTY
| 44 1| 187 1| 64 1| 7 1| 302 1 | 0 0| 16 1| 5 1| 1 2| 22 1 | 324 1
BURKE COUNTY
| 13 0| 108 0| 33 0| 7 1| 161 0 | 0 0| 5 0| 2 0| 0 0| 7 0 | 168 0
BUTTS COUNTY
| 11 0| 75 0| 25 0| 4 0| 115 0 | 0 0| 7 0| 1 0| 0 0| 8 0 | 123 0
CALHOUN COUNTY
| 3 0| 23 0| 11 0| 1 0| 38 0 | 0 0| 2 0| 1 0| 0 0| 3 0 | 41 0
CAMDEN COUNTY
| 4 0| 59 0| 22 0| 3 0| 88 0 | 1 1| 3 0| 2 0| 0 0| 6 0 | 94 0
CANDLER COUNTY
| 4 0| 61 0| 16 0| 0 0| 81 0 | 0 0| 2 0| 1 0| 0 0| 3 0 | 84 0
CARROLL COUNTY
| 35 1| 232 1| 101 1| 30 2| 398 1 | 6 4| 29 2| 9 1| 0 0| 44 2 | 442 1
CATOOSA COUNTY
| 11 0| 55 0| 33 0| 12 1| 111 0 | 0 0| 7 0| 0 0| 0 0| 7 0 | 118 0
CHARLTON COUNTY
| 1 0| 30 0| 13 0| 1 0| 45 0 | 0 0| 2 0| 2 0| 0 0| 4 0 | 49 0
CHATHAM COUNTY
| 230 6| 1263 5| 426 5| 48 4| 1967 5 | 10 6| 88 5| 31 5| 4 6| 133 5 | 2100 5
CHATTAHOOCHEE COUNTY| 1 0| 6 0| 5 0| 0 0| 12 0 | 0 0| 0 0| 0 0| 0 0| 0 0 | 12 0
CHATTOOGA COUNTY | 17 0| 102 0| 43 0| 6 0| 168 0 | 1 1| 9 1| 2 0| 1 2| 13 1 | 181 0
CHEROKEE COUNTY
| 22 1| 166 1| 82 1| 16 1| 286 1 | 2 1| 19 1| 5 1| 0 0| 26 1 | 312 1
CLARKE COUNTY
| 45 1| 338 1| 115 1| 14 1| 512 1 | 1 1| 26 2| 11 2| 3 5| 41 2 | 553 1
CLAY COUNTY
| 2 0| 14 0| 6 0| 0 0| 22 0 | 0 0| 1 0| 0 0| 0 0| 1 0 | 23 0
CLAYTON COUNTY
| 145 4| 685 3| 230 2| 36 3| 1096 3 | 9 5| 56 3| 17 3| 3 5| 85 3 | 1181 3
CLINCH COUNTY
| 5 0| 26 0| 11 0| 1 0| 43 0 | 0 0| 2 0| 1 0| 0 0| 3 0 | 46 0
COBB COUNTY
| 153 4| 804 3| 367 4| 44 3| 1368 4 | 12 7| 90 6| 32 5| 2 3| 136 5 | 1504 4
COFFEE COUNTY
| 14 0| 130 1| 37 0| 5 0| 186 0 | 2 1| 16 1| 5 1| 1 2| 24 1 | 210 1
COLQUITT COUNTY
| 29 1| 184 1| 70 1| 13 1| 296 1 | 0 0| 19 1| 5 1| 0 0| 24 1 | 320 1
COLUMBIA COUNTY
| 23 1| 90 0| 28 0| 3 0| 144 0 | 2 1| 9 1| 5 1| 0 0| 16 1 | 160 0
------------------------------------------------------------------------------------------------------------------------------------
(continued)
Georgia Dept. of Corrections
5/2000
37
Page 32 Run 05/15/00
Georgia Department of Corrections Office of Planning and Analysis
Inmate statistical profile
Sample: ACTIVE PRISONERS EXCLUDING JAIL
Requestor: Statistics
Active inmates 05/15/2000
Home County by current age & sex
(CONTINUED)
|
MEN
|
WOMEN
|
| Age | Age | Age | Age | Men
| Age | Age | Age | Age |Women
|Grand
Home County
|00-21 %|22-39 %|40-54 %|55-99 %|Total % |00-21 %|22-39 %|40-54 %|55-99 %|Total % |Total %
------------------------------------------------------------------------------------------------------------------------------------
COOK COUNTY
| 12 0| 80 0| 36 0| 3 0| 131 0 | 0 0| 9 1| 2 0| 0 0| 11 0 | 142 0
COWETA COUNTY
| 47 1| 238 1| 81 1| 7 1| 373 1 | 3 2| 26 2| 2 0| 0 0| 31 1 | 404 1
CRAWFORD COUNTY
| 0 0| 13 0| 2 0| 0 0| 15 0 | 0 0| 0 0| 0 0| 0 0| 0 0 | 15 0
CRISP COUNTY
| 24 1| 124 1| 46 0| 7 1| 201 1 | 3 2| 9 1| 1 0| 1 2| 14 1 | 215 1
DADE COUNTY
| 1 0| 28 0| 13 0| 7 1| 49 0 | 0 0| 1 0| 0 0| 0 0| 1 0 | 50 0
DAWSON COUNTY
| 3 0| 35 0| 19 0| 0 0| 57 0 | 0 0| 4 0| 0 0| 0 0| 4 0 | 61 0
DECATUR COUNTY
| 33 1| 167 1| 54 1| 8 1| 262 1 | 0 0| 11 1| 4 1| 0 0| 15 1 | 277 1
DEKALB COUNTY
| 275 8| 1504 6| 497 5| 70 5| 2346 6 | 11 7| 61 4| 30 5| 5 8| 107 4 | 2453 6
DODGE COUNTY
| 10 0| 99 0| 41 0| 4 0| 154 0 | 2 1| 16 1| 2 0| 0 0| 20 1 | 174 0
DOOLY COUNTY
| 15 0| 61 0| 18 0| 0 0| 94 0 | 0 0| 4 0| 0 0| 0 0| 4 0 | 98 0
DOUGHERTY COUNTY | 76 2| 574 2| 205 2| 17 1| 872 2 | 3 2| 34 2| 16 3| 1 2| 54 2 | 926 2
DOUGLAS COUNTY
| 52 1| 204 1| 92 1| 16 1| 364 1 | 3 2| 16 1| 7 1| 0 0| 26 1 | 390 1
EARLY COUNTY
| 10 0| 51 0| 17 0| 5 0| 83 0 | 0 0| 3 0| 1 0| 0 0| 4 0 | 87 0
ECHOLS COUNTY.
| 1 0| 1 0| 2 0| 1 0| 5 0 | 0 0| 0 0| 0 0| 0 0| 0 0 | 5 0
EFFINGHAM COUNTY | 21 1| 79 0| 28 0| 2 0| 130 0 | 1 1| 4 0| 2 0| 1 2| 8 0 | 138 0
ELBERT COUNTY
| 13 0| 94 0| 39 0| 5 0| 151 0 | 0 0| 6 0| 4 1| 0 0| 10 0 | 161 0
EMANUEL COUNTY
| 8 0| 102 0| 28 0| 5 0| 143 0 | 0 0| 5 0| 1 0| 0 0| 6 0 | 149 0
EVANS COUNTY
| 5 0| 45 0| 10 0| 2 0| 62 0 | 0 0| 0 0| 4 1| 0 0| 4 0 | 66 0
FANNIN COUNTY
| 0 0| 45 0| 28 0| 9 1| 82 0 | 0 0| 5 0| 0 0| 1 2| 6 0 | 88 0
FAYETTE COUNTY
| 4 0| 61 0| 18 0| 6 0| 89 0 | 0 0| 6 0| 1 0| 0 0| 7 0 | 96 0
FLOYD COUNTY
| 37 1| 382 2| 145 2| 16 1| 580 2 | 3 2| 47 3| 14 2| 1 2| 65 3 | 645 2
FORSYTH COUNTY
| 9 0| 70 0| 26 0| 6 0| 111 0 | 0 0| 6 0| 5 1| 0 0| 11 0 | 122 0
FRANKLIN COUNTY
| 13 0| 55 0| 23 0| 4 0| 95 0 | 0 0| 3 0| 1 0| 1 2| 5 0 | 100 0
FULTON COUNTY
| 381 10| 2998 13| 1287 14| 155 12| 4821 13 | 15 9| 104 6| 65 10| 8 13| 192 8 | 5013 13
GILMER COUNTY
| 10 0| 49 0| 35 0| 9 1| 103 0 | 0 0| 2 0| 1 0| 0 0| 3 0 | 106 0
GLASCOCK COUNTY
| 0 0| 6 0| 0 0| 0 0| 6 0 | 0 0| 0 0| 0 0| 0 0| 0 0 | 6 0
GLYNN COUNTY
| 33 1| 284 1| 90 1| 17 1| 424 1 | 2 1| 19 1| 7 1| 1 2| 29 1 | 453 1
GORDON COUNTY
| 15 0| 146 1| 57 1| 16 1| 234 1 | 0 0| 16 1| 3 0| 0 0| 19 1 | 253 1
GRADY COUNTY
| 23 1| 111 0| 41 0| 6 0| 181 0 | 1 1| 9 1| 5 1| 0 0| 15 1 | 196 0
GREENE COUNTY
| 18 0| 42 0| 9 0| 2 0| 71 0 | 0 0| 2 0| 2 0| 0 0| 4 0 | 75 0
GWINNETT COUNTY
| 73 2| 503 2| 201 2| 34 3| 811 2 | 2 1| 41 3| 18 3| 3 5| 64 3 | 875 2
HABERSHAM COUNTY | 7 0| 55 0| 23 0| 1 0| 86 0 | 1 1| 1 0| 1 0| 0 0| 3 0 | 89 0
HALL COUNTY
| 41 1| 273 1| 168 2| 31 2| 513 1 | 3 2| 28 2| 7 1| 2 3| 40 2 | 553 1
HANCOCK COUNTY
| 7 0| 27 0| 10 0| 1 0| 45 0 | 0 0| 0 0| 1 0| 1 2| 2 0 | 47 0
HARALSON COUNTY
| 9 0| 56 0| 22 0| 5 0| 92 0 | 1 1| 8 0| 0 0| 0 0| 9 0 | 101 0
------------------------------------------------------------------------------------------------------------------------------------
(continued)
Georgia Dept. of Corrections
5/2000
38
Page 33 Run 05/15/00
Georgia Department of Corrections Office of Planning and Analysis
Inmate statistical profile
Sample: ACTIVE PRISONERS EXCLUDING JAIL
Requestor: Statistics
Active inmates 05/15/2000
Home County by current age & sex
(CONTINUED)
|
MEN
|
WOMEN
|
| Age | Age | Age | Age | Men
| Age | Age | Age | Age |Women
|Grand
Home County
|00-21 %|22-39 %|40-54 %|55-99 %|Total % |00-21 %|22-39 %|40-54 %|55-99 %|Total % |Total %
------------------------------------------------------------------------------------------------------------------------------------
HARRIS COUNTY
| 10 0| 45 0| 20 0| 4 0| 79 0 | 0 0| 4 0| 0 0| 0 0| 4 0 | 83 0
HART COUNTY
| 3 0| 52 0| 14 0| 2 0| 71 0 | 1 1| 3 0| 2 0| 0 0| 6 0 | 77 0
HEARD COUNTY
| 2 0| 32 0| 11 0| 10 1| 55 0 | 0 0| 2 0| 0 0| 0 0| 2 0 | 57 0
HENRY COUNTY
| 25 1| 153 1| 61 1| 10 1| 249 1 | 4 2| 6 0| 7 1| 0 0| 17 1 | 266 1
HOUSTON COUNTY
| 46 1| 250 1| 107 1| 14 1| 417 1 | 0 0| 20 1| 7 1| 1 2| 28 1 | 445 1
IRWIN COUNTY
| 10 0| 46 0| 18 0| 3 0| 77 0 | 0 0| 2 0| 0 0| 0 0| 2 0 | 79 0
JACKSON COUNTY
| 20 1| 91 0| 67 1| 11 1| 189 1 | 1 1| 10 1| 2 0| 0 0| 13 1 | 202 1
JASPER COUNTY
| 7 0| 42 0| 13 0| 2 0| 64 0 | 0 0| 0 0| 1 0| 0 0| 1 0 | 65 0
JEFF DAVIS COUNTY | 3 0| 37 0| 25 0| 2 0| 67 0 | 1 1| 2 0| 2 0| 0 0| 5 0 | 72 0
JEFFERSON COUNTY | 19 1| 87 0| 32 0| 3 0| 141 0 | 0 0| 11 1| 3 0| 0 0| 14 1 | 155 0
JENKINS COUNTY
| 13 0| 56 0| 15 0| 1 0| 85 0 | 0 0| 7 0| 0 0| 0 0| 7 0 | 92 0
JOHNSON COUNTY
| 2 0| 27 0| 8 0| 1 0| 38 0 | 0 0| 2 0| 1 0| 0 0| 3 0 | 41 0
JONES COUNTY
| 7 0| 18 0| 8 0| 2 0| 35 0 | 0 0| 3 0| 0 0| 0 0| 3 0 | 38 0
LAMAR COUNTY
| 4 0| 66 0| 32 0| 7 1| 109 0 | 0 0| 1 0| 3 0| 0 0| 4 0 | 113 0
LANIER COUNTY
| 2 0| 35 0| 7 0| 3 0| 47 0 | 0 0| 4 0| 1 0| 0 0| 5 0 | 52 0
LAURENS COUNTY
| 26 1| 159 1| 54 1| 5 0| 244 1 | 1 1| 9 1| 3 0| 2 3| 15 1 | 259 1
LEE COUNTY
| 7 0| 26 0| 14 0| 2 0| 49 0 | 0 0| 0 0| 0 0| 0 0| 0 0 | 49 0
LIBERTY COUNTY
| 28 1| 131 1| 34 0| 7 1| 200 1 | 0 0| 11 1| 5 1| 0 0| 16 1 | 216 1
LINCOLN COUNTY
| 2 0| 18 0| 10 0| 1 0| 31 0 | 0 0| 1 0| 0 0| 0 0| 1 0 | 32 0
LONG COUNTY
| 2 0| 21 0| 12 0| 1 0| 36 0 | 0 0| 3 0| 0 0| 0 0| 3 0 | 39 0
LOWNDES COUNTY
| 35 1| 310 1| 111 1| 14 1| 470 1 | 2 1| 22 1| 11 2| 1 2| 36 1 | 506 1
LUMPKIN COUNTY
| 2 0| 40 0| 22 0| 6 0| 70 0 | 0 0| 3 0| 1 0| 0 0| 4 0 | 74 0
MACON COUNTY
| 8 0| 53 0| 18 0| 0 0| 79 0 | 0 0| 2 0| 2 0| 0 0| 4 0 | 83 0
MADISON COUNTY
| 6 0| 59 0| 27 0| 9 1| 101 0 | 0 0| 6 0| 1 0| 1 2| 8 0 | 109 0
MARION COUNTY
| 9 0| 23 0| 10 0| 1 0| 43 0 | 0 0| 0 0| 1 0| 0 0| 1 0 | 44 0
MCDUFFIE COUNTY
| 11 0| 98 0| 29 0| 5 0| 143 0 | 1 1| 6 0| 0 0| 0 0| 7 0 | 150 0
MCINTOSH COUNTY
| 7 0| 49 0| 15 0| 3 0| 74 0 | 0 0| 2 0| 0 0| 0 0| 2 0 | 76 0
MERIWETHER COUNTY | 29 1| 99 0| 47 1| 8 1| 183 0 | 0 0| 6 0| 3 0| 2 3| 11 0 | 194 0
MILLER COUNTY
| 2 0| 21 0| 9 0| 0 0| 32 0 | 1 1| 2 0| 0 0| 0 0| 3 0 | 35 0
MITCHELL COUNTY
| 19 1| 122 1| 51 1| 6 0| 198 1 | 3 2| 10 1| 3 0| 0 0| 16 1 | 214 1
MONROE COUNTY
| 9 0| 58 0| 30 0| 1 0| 98 0 | 0 0| 1 0| 1 0| 0 0| 2 0 | 100 0
MONTGOMERY COUNTY | 3 0| 24 0| 5 0| 0 0| 32 0 | 0 0| 3 0| 0 0| 0 0| 3 0 | 35 0
MORGAN COUNTY
| 10 0| 39 0| 19 0| 4 0| 72 0 | 0 0| 4 0| 0 0| 0 0| 4 0 | 76 0
MURRAY COUNTY
| 8 0| 85 0| 35 0| 10 1| 138 0 | 1 1| 9 1| 3 0| 0 0| 13 1 | 151 0
MUSCOGEE COUNTY
| 150 4| 749 3| 308 3| 30 2| 1237 3 | 5 3| 62 4| 30 5| 1 2| 98 4 | 1335 3
------------------------------------------------------------------------------------------------------------------------------------
(continued)
Georgia Dept. of Corrections
5/2000
39
Page 34 Run 05/15/00
Georgia Department of Corrections Office of Planning and Analysis
Inmate statistical profile
Sample: ACTIVE PRISONERS EXCLUDING JAIL
Requestor: Statistics
Active inmates 05/15/2000
Home County by current age & sex
(CONTINUED)
|
MEN
|
WOMEN
|
| Age | Age | Age | Age | Men
| Age | Age | Age | Age |Women
|Grand
Home County
|00-21 %|22-39 %|40-54 %|55-99 %|Total % |00-21 %|22-39 %|40-54 %|55-99 %|Total % |Total %
------------------------------------------------------------------------------------------------------------------------------------
NEWTON COUNTY
| 20 1| 215 1| 71 1| 13 1| 319 1 | 0 0| 12 1| 3 0| 3 5| 18 1 | 337 1
OCONEE COUNTY
| 4 0| 19 0| 12 0| 1 0| 36 0 | 1 1| 0 0| 1 0| 0 0| 2 0 | 38 0
OGLETHORPE COUNTY | 2 0| 29 0| 5 0| 0 0| 36 0 | 0 0| 0 0| 0 0| 0 0| 0 0 | 36 0
PAULDING COUNTY
| 5 0| 86 0| 48 1| 10 1| 149 0 | 0 0| 8 0| 5 1| 1 2| 14 1 | 163 0
PEACH COUNTY
| 7 0| 58 0| 29 0| 0 0| 94 0 | 0 0| 1 0| 1 0| 0 0| 2 0 | 96 0
PICKENS COUNTY
| 6 0| 46 0| 29 0| 5 0| 86 0 | 1 1| 5 0| 5 1| 0 0| 11 0 | 97 0
PIERCE COUNTY
| 5 0| 28 0| 12 0| 1 0| 46 0 | 0 0| 0 0| 0 0| 0 0| 0 0 | 46 0
PIKE COUNTY
| 3 0| 11 0| 13 0| 3 0| 30 0 | 0 0| 0 0| 0 0| 0 0| 0 0 | 30 0
POLK COUNTY
| 17 0| 110 0| 49 1| 8 1| 184 0 | 0 0| 4 0| 0 0| 0 0| 4 0 | 188 0
PULASKI COUNTY
| 9 0| 45 0| 17 0| 1 0| 72 0 | 1 1| 5 0| 1 0| 0 0| 7 0 | 79 0
PUTNAM COUNTY
| 12 0| 60 0| 34 0| 4 0| 110 0 | 0 0| 3 0| 2 0| 1 2| 6 0 | 116 0
QUITMAN COUNTY
| 0 0| 6 0| 1 0| 0 0| 7 0 | 0 0| 0 0| 1 0| 1 2| 2 0 | 9 0
RABUN COUNTY
| 3 0| 21 0| 10 0| 1 0| 35 0 | 0 0| 0 0| 2 0| 0 0| 2 0 | 37 0
RANDOLPH COUNTY
| 6 0| 40 0| 11 0| 3 0| 60 0 | 0 0| 0 0| 2 0| 0 0| 2 0 | 62 0
RICHMOND COUNTY
| 136 4| 1011 4| 386 4| 32 2| 1565 4 | 6 4| 82 5| 44 7| 1 2| 133 5 | 1698 4
ROCKDALE COUNTY
| 18 0| 131 1| 65 1| 12 1| 226 1 | 1 1| 9 1| 7 1| 0 0| 17 1 | 243 1
SCHLEY COUNTY
| 1 0| 13 0| 6 0| 0 0| 20 0 | 0 0| 1 0| 0 0| 0 0| 1 0 | 21 0
SCREVEN COUNTY
| 15 0| 64 0| 24 0| 3 0| 106 0 | 3 2| 8 0| 1 0| 0 0| 12 0 | 118 0
SEMINOLE COUNTY
| 9 0| 50 0| 18 0| 1 0| 78 0 | 1 1| 2 0| 2 0| 0 0| 5 0 | 83 0
SPALDING COUNTY
| 57 2| 343 1| 114 1| 19 1| 533 1 | 6 4| 24 1| 8 1| 2 3| 40 2 | 573 1
STEPHENS COUNTY
| 7 0| 68 0| 26 0| 5 0| 106 0 | 0 0| 7 0| 1 0| 0 0| 8 0 | 114 0
STEWART COUNTY
| 2 0| 14 0| 8 0| 1 0| 25 0 | 0 0| 1 0| 0 0| 0 0| 1 0 | 26 0
SUMTER COUNTY
| 18 0| 131 1| 49 1| 6 0| 204 1 | 0 0| 7 0| 4 1| 0 0| 11 0 | 215 1
TALBOT COUNTY
| 10 0| 27 0| 5 0| 0 0| 42 0 | 1 1| 2 0| 1 0| 0 0| 4 0 | 46 0
TALIAFERRO COUNTY | 1 0| 8 0| 2 0| 0 0| 11 0 | 0 0| 0 0| 1 0| 0 0| 1 0 | 12 0
TATTNALL COUNTY
| 14 0| 85 0| 26 0| 3 0| 128 0 | 0 0| 1 0| 5 1| 0 0| 6 0 | 134 0
TAYLOR COUNTY
| 11 0| 46 0| 16 0| 3 0| 76 0 | 2 1| 2 0| 0 0| 0 0| 4 0 | 80 0
TELFAIR COUNTY
| 8 0| 86 0| 28 0| 2 0| 124 0 | 1 1| 8 0| 2 0| 0 0| 11 0 | 135 0
TERRELL COUNTY
| 10 0| 56 0| 16 0| 1 0| 83 0 | 0 0| 2 0| 0 0| 0 0| 2 0 | 85 0
THOMAS COUNTY
| 23 1| 180 1| 61 1| 6 0| 270 1 | 0 0| 13 1| 3 0| 0 0| 16 1 | 286 1
TIFT COUNTY
| 18 0| 169 1| 75 1| 12 1| 274 1 | 1 1| 8 0| 1 0| 1 2| 11 0 | 285 1
TOOMBS COUNTY
| 29 1| 139 1| 53 1| 7 1| 228 1 | 2 1| 12 1| 3 0| 0 0| 17 1 | 245 1
TOWNS COUNTY
| 3 0| 6 0| 4 0| 2 0| 15 0 | 0 0| 0 0| 0 0| 0 0| 0 0 | 15 0
TREUTLEN COUNTY
| 4 0| 29 0| 10 0| 0 0| 43 0 | 0 0| 0 0| 1 0| 0 0| 1 0 | 44 0
TROUP COUNTY
| 66 2| 344 1| 103 1| 15 1| 528 1 | 3 2| 28 2| 11 2| 0 0| 42 2 | 570 1
------------------------------------------------------------------------------------------------------------------------------------
(continued)
Georgia Dept. of Corrections
5/2000
40
Page 35 Run 05/15/00
Georgia Department of Corrections Office of Planning and Analysis
Inmate statistical profile
Sample: ACTIVE PRISONERS EXCLUDING JAIL
Requestor: Statistics
Active inmates 05/15/2000
Home County by current age & sex
(CONTINUED)
|
MEN
|
WOMEN
|
| Age | Age | Age | Age | Men
| Age | Age | Age | Age |Women
|Grand
Home County
|00-21 %|22-39 %|40-54 %|55-99 %|Total % |00-21 %|22-39 %|40-54 %|55-99 %|Total % |Total %
------------------------------------------------------------------------------------------------------------------------------------
TURNER COUNTY
| 5 0| 44 0| 19 0| 2 0| 70 0 | 0 0| 4 0| 0 0| 0 0| 4 0 | 74 0
TWIGGS COUNTY
| 4 0| 20 0| 9 0| 0 0| 33 0 | 0 0| 0 0| 0 0| 0 0| 0 0 | 33 0
UNION COUNTY
| 3 0| 26 0| 7 0| 2 0| 38 0 | 0 0| 0 0| 1 0| 0 0| 1 0 | 39 0
UPSON COUNTY
| 16 0| 111 0| 47 1| 6 0| 180 0 | 0 0| 7 0| 1 0| 1 2| 9 0 | 189 0
WALKER COUNTY
| 18 0| 131 1| 50 1| 6 0| 205 1 | 0 0| 14 1| 5 1| 1 2| 20 1 | 225 1
WALTON COUNTY
| 17 0| 165 1| 56 1| 12 1| 250 1 | 0 0| 12 1| 2 0| 0 0| 14 1 | 264 1
WARE COUNTY
| 28 1| 236 1| 106 1| 10 1| 380 1 | 1 1| 11 1| 4 1| 0 0| 16 1 | 396 1
WARREN COUNTY
| 6 0| 19 0| 18 0| 5 0| 48 0 | 0 0| 1 0| 1 0| 0 0| 2 0 | 50 0
WASHINGTON COUNTY | 19 1| 80 0| 29 0| 1 0| 129 0 | 1 1| 3 0| 3 0| 0 0| 7 0 | 136 0
WAYNE COUNTY
| 10 0| 80 0| 31 0| 3 0| 124 0 | 0 0| 2 0| 1 0| 0 0| 3 0 | 127 0
WEBSTER COUNTY
| 0 0| 5 0| 2 0| 0 0| 7 0 | 0 0| 0 0| 0 0| 0 0| 0 0 | 7 0
WHEELER COUNTY
| 2 0| 13 0| 9 0| 4 0| 28 0 | 0 0| 0 0| 0 0| 0 0| 0 0 | 28 0
WHITE COUNTY
| 7 0| 30 0| 18 0| 3 0| 58 0 | 0 0| 3 0| 0 0| 0 0| 3 0 | 61 0
WHITFIELD COUNTY | 34 1| 282 1| 135 1| 21 2| 472 1 | 2 1| 27 2| 5 1| 0 0| 34 1 | 506 1
WILCOX COUNTY
| 1 0| 25 0| 13 0| 6 0| 45 0 | 0 0| 6 0| 0 0| 0 0| 6 0 | 51 0
WILKES COUNTY
| 8 0| 34 0| 17 0| 4 0| 63 0 | 0 0| 3 0| 0 0| 0 0| 3 0 | 66 0
WILKINSON COUNTY | 4 0| 36 0| 12 0| 1 0| 53 0 | 0 0| 3 0| 0 0| 0 0| 3 0 | 56 0
WORTH COUNTY
| 5 0| 78 0| 26 0| 5 0| 114 0 | 0 0| 5 0| 0 0| 0 0| 5 0 | 119 0
OUT OF STATE
| 0 0| 17 0| 65 1| 21 2| 103 0 | 0 0| 0 0| 0 0| 0 0| 0 0 | 103 0
------------------------------------------------------------------------------------------------------------------------------------
Total reported
| 3646 100|23376 100| 9228 100| 1317 100|37567 100 | 168 100| 1619 100| 630 100| 63 100| 2480 100 |40047 100
|
|
|
|
|
|
|
|
|
|
|
Percent reported |
93.6|
92.5|
91.9|
91.5|
92.4 |
94.4|
93.5|
93.9|
95.5|
93.7 |
92.5
|
|
|
|
|
|
|
|
|
|
|
|
|
|
|
|
|
|
|
|
|
|
UNKNOWN
| 251 | 1889 | 811 | 123 | 3074
| 10 | 112 | 41 | 3 | 166
| 3240
------------------------------------------------------------------------------------------------------------------------------------
Total
| 3897 |25265 |10039 | 1440 |40641
| 178 | 1731 | 671 | 66 | 2646
|43287
Georgia Dept. of Corrections
5/2000
41
Georgia Department of Corrections
Page 36 Run 05/15/00
Office of Planning and Analysis
Inmate statistical profile
Sample: ACTIVE PRISONERS EXCLUDING JAIL
Requestor: Statistics
Active inmates 05/15/2000
Prison Sentence In Years by current age & sex
|
MEN
|
WOMEN
|
| Age | Age | Age | Age | Men
| Age | Age | Age | Age |Women
|Grand
Sentence In Years |00-21 %|22-39 %|40-54 %|55-99 %|Total % |00-21 %|22-39 %|40-54 %|55-99 %|Total % |Total %
------------------------------------------------------------------------------------------------------------------------------------
0-1
| 30 1| 141 1| 42 0| 2 0| 215 1 | 1 1| 15 1| 9 1| 1 2| 26 1 | 241 1
1.1-2
| 135 4| 521 2| 135 1| 13 1| 804 2 | 5 3| 58 3| 29 4| 0 0| 92 4 | 896 2
2.1-3
| 322 8| 1149 5| 397 4| 32 2| 1900 5 | 25 15| 124 7| 43 7| 1 2| 193 8 | 2093 5
3.1-4
| 359 9| 1295 5| 498 5| 50 3| 2202 5 | 18 11| 177 11| 57 9| 3 5| 255 10 | 2457 6
4.1-5
| 213 6| 910 4| 302 3| 32 2| 1457 4 | 16 9| 109 7| 40 6| 3 5| 168 7 | 1625 4
5.1-6
| 598 16| 2810 11| 976 10| 116 8| 4500 11 | 31 18| 311 19| 104 16| 6 9| 452 18 | 4952 12
6.1-7
| 186 5| 814 3| 273 3| 19 1| 1292 3 | 10 6| 78 5| 28 4| 0 0| 116 5 | 1408 3
7.1-8
| 132 3| 912 4| 298 3| 44 3| 1386 3 | 6 4| 65 4| 27 4| 0 0| 98 4 | 1484 3
8.1-9
| 128 3| 980 4| 298 3| 39 3| 1445 4 | 10 6| 60 4| 25 4| 2 3| 97 4 | 1542 4
9.1-10
| 19 1| 326 1| 99 1| 9 1| 453 1 | 0 0| 23 1| 9 1| 1 2| 33 1 | 486 1
10.1-12
| 875 23| 4024 16| 1199 12| 193 14| 6291 16 | 26 15| 234 14| 73 11| 5 8| 338 13 | 6629 16
12.1-15
| 156 4| 1686 7| 518 5| 73 5| 2433 6 | 4 2| 80 5| 36 5| 4 6| 124 5 | 2557 6
15.1-20
| 217 6| 2704 11| 1007 10| 136 10| 4064 10 | 2 1| 98 6| 52 8| 6 9| 158 6 | 4222 10
20.1-OVER
| 211 6| 3476 14| 1742 18| 264 18| 5693 14 | 7 4| 106 6| 52 8| 7 11| 172 7 | 5865 14
LIFE
| 203 5| 3034 12| 1995 20| 388 27| 5620 14 | 10 6| 128 8| 72 11| 26 40| 236 9 | 5856 14
DEATH
| 3 0| 67 0| 47 0| 10 1| 127 0 | 0 0| 1 0| 0 0| 0 0| 1 0 | 128 0
LIFE W/O PAROLE
| 3 0| 112 0| 61 1| 9 1| 185 0 | 0 0| 2 0| 0 0| 0 0| 2 0 | 187 0
YOUTHFUL OFFENDERS | 0 0| 2 0| 0 0| 0 0| 2 0 | 0 0| 0 0| 0 0| 0 0| 0 0 | 2 0
------------------------------------------------------------------------------------------------------------------------------------
Total reported
| 3790 100|24963 100| 9887 100| 1429 100|40069 100 | 171 100| 1669 100| 656 100| 65 100| 2561 100 |42630 100
|
|
|
|
|
|
|
|
|
|
|
Percent reported |
97.3|
98.8|
98.5|
99.2|
98.6 |
96.1|
96.4|
97.8|
98.5|
96.8 |
98.5
|
|
|
|
|
|
|
|
|
|
|
|
|
|
|
|
|
|
|
|
|
|
NOT REPORTED
| 107 | 302 | 152 | 11 | 572
| 7 | 62 | 15 | 1 | 85
| 657
------------------------------------------------------------------------------------------------------------------------------------
Total
| 3897 |25265 |10039 | 1440 |40641
| 178 | 1731 | 671 | 66 | 2646
|43287
|
|
|
|
|
|
|
|
|
|
|
|
|
|
|
|
|
|
|
|
|
|
|
|
|
|
|
|
|
|
|
|
|
|
|
|
|
|
|
|
|
|
|
|
|
|
|
|
|
|
|
|
|
|
|
AVG EXCLUDING
|
|
|
|
|
|
|
|
|
|
|
LIFE, DEATH, YO
| 7.94 | 11.30 | 12.66 | 14.27 | 11.35 | 6.34 | 7.83 | 8.48 | 10.93 | 7.94 | 11.13
|
|
|
|
|
|
|
|
|
|
|
|
|
|
|
|
|
|
|
|
|
|
|
|
|
|
|
|
|
|
|
|
|
|
|
|
|
|
|
|
|
|
|
|
|
|
|
|
|
|
|
|
|
|
|
AVG INCLUDING
|
|
|
|
|
|
|
|
|
|
|
LIFE=21, YO=3 YRS | 8.64 | 12.44 | 14.29 | 16.04 | 12.67 | 7.20 | 8.83 | 9.85 | 14.96 | 9.14 | 12.45
Georgia Dept. of Corrections
5/2000
42
Page 37 Run 05/15/00
Georgia Department of Corrections Office of Planning and Analysis
Inmate statistical profile
Sample: ACTIVE PRISONERS EXCLUDING JAIL Active inmates 05/15/2000
Requestor: Statistics Probation To Follow Prison by current age & sex
|
MEN
|
WOMEN
|
| Age | Age | Age | Age | Men
| Age | Age | Age | Age |Women
|Grand
Prob After Prison |00-21 %|22-39 %|40-54 %|55-99 %|Total % |00-21 %|22-39 %|40-54 %|55-99 %|Total % |Total %
------------------------------------------------------------------------------------------------------------------------------------
PROBATION TO FOLLOW | 1601 41| 6982 28| 2565 26| 397 28|11545 28 | 79 44| 517 30| 210 31| 20 30| 826 31 |12371 29
NO PROBATION
| 2296 59|18283 72| 7474 74| 1043 72|29096 72 | 99 56| 1214 70| 461 69| 46 70| 1820 69 |30916 71
------------------------------------------------------------------------------------------------------------------------------------
Total reported
| 3897 100|25265 100|10039 100| 1440 100|40641 100 | 178 100| 1731 100| 671 100| 66 100| 2646 100 |43287 100
|
|
|
|
|
|
|
|
|
|
|
Percent reported | 100.0| 100.0| 100.0| 100.0| 100.0 | 100.0| 100.0| 100.0| 100.0| 100.0 | 100.0
|
|
|
|
|
|
|
|
|
|
|
|
|
|
|
|
|
|
|
|
|
|
NOT REPORTED
|0|0|0|0|0
|0|0|0|0|0
|0
------------------------------------------------------------------------------------------------------------------------------------
Total
| 3897 |25265 |10039 | 1440 |40641
| 178 | 1731 | 671 | 66 | 2646
|43287
Georgia Dept. of Corrections
5/2000
43
Page 38 Run 05/15/00
Georgia Department of Corrections Office of Planning and Analysis
Inmate statistical profile
Sample: ACTIVE PRISONERS EXCLUDING JAIL Active inmates 05/15/2000
Requestor: Statistics Admission Type by current age & sex
|
MEN
|
WOMEN
|
| Age | Age | Age | Age | Men
| Age | Age | Age | Age |Women
|Grand
Admission Type
|00-21 %|22-39 %|40-54 %|55-99 %|Total % |00-21 %|22-39 %|40-54 %|55-99 %|Total % |Total %
------------------------------------------------------------------------------------------------------------------------------------
COMMITTED FROM COURT| 3127 82|15875 64| 6483 66| 1073 75|26558 66 | 141 82| 1044 62| 425 65| 55 85| 1665 65 |28223 66
RETURN APPEAL/BOND | 0 0| 4 0| 3 0| 0 0| 7 0 | 1 1| 0 0| 0 0| 0 0| 1 0 | 8 0
PAROLE REV/NEW SENT | 150 4| 4384 18| 1730 17| 157 11| 6421 16 | 1 1| 201 12| 100 15| 4 6| 306 12 | 6727 16
PAR REV/NO NEW SENT | 37 1| 773 3| 341 3| 34 2| 1185 3 | 2 1| 73 4| 22 3| 2 3| 99 4 | 1284 3
PROB VIOL/TOTAL REV | 0 0| 0 0| 1 0| 0 0| 1 0 | 0 0| 0 0| 0 0| 0 0| 0 0 | 1 0
PROB VIOL/PARTIAL | 193 5| 1033 4| 327 3| 41 3| 1594 4 | 9 5| 121 7| 43 7| 2 3| 175 7 | 1769 4
ADMIT FM OTHER CUST | 0 0| 14 0| 7 0| 4 0| 25 0 | 0 0| 1 0| 0 0| 0 0| 1 0 | 26 0
SHOCK INCARCERATION | 0 0| 0 0| 0 0| 0 0| 0 0 | 0 0| 0 0| 0 0| 0 0| 0 0 | 0 0
PROB REV/REMAINDER | 263 7| 2428 10| 769 8| 86 6| 3546 9 | 17 10| 229 14| 63 10| 2 3| 311 12 | 3857 9
NEW SENT/PAR REV PND| 0 0| 55 0| 20 0| 2 0| 77 0 | 0 0| 1 0| 3 0| 0 0| 4 0 | 81 0
LIFE W/O PAROLE
| 3 0| 76 0| 35 0| 7 0| 121 0 | 0 0| 0 0| 0 0| 0 0| 0 0 | 121 0
PAROLE REV BOOT CAMP| 0 0| 14 0| 2 0| 0 0| 16 0 | 0 0| 0 0| 0 0| 0 0| 0 0 | 16 0
PAR REV/RSN UNKNOWN | 0 0| 27 0| 56 1| 20 1| 103 0 | 0 0| 0 0| 0 0| 0 0| 0 0 | 103 0
PROBATION/PAROLE REV| 0 0| 0 0| 0 0| 0 0| 0 0 | 0 0| 0 0| 0 0| 0 0| 0 0 | 0 0
PB PAROLE RESCINDED | 1 0| 4 0| 1 0| 0 0| 6 0 | 0 0| 0 0| 0 0| 0 0| 0 0 | 6 0
PROB REVOCATION/SC | 1 0| 1 0| 2 0| 0 0| 4 0 | 0 0| 2 0| 0 0| 0 0| 2 0 | 6 0
PAR REV/REVOC CENTER| 4 0| 239 1| 104 1| 4 0| 351 1 | 0 0| 0 0| 0 0| 0 0| 0 0 | 351 1
INFORMATION ONLY | 0 0| 0 0| 0 0| 0 0| 0 0 | 0 0| 0 0| 0 0| 0 0| 0 0 | 0 0
INCOMPLETE SENT PKG | 0 0| 0 0| 0 0| 0 0| 0 0 | 0 0| 0 0| 0 0| 0 0| 0 0 | 0 0
HANCOCK REVOC CENTER| 0 0| 6 0| 0 0| 0 0| 6 0 | 0 0| 0 0| 0 0| 0 0| 0 0 | 6 0
WHITWORTH DETENTION | 2 0| 37 0| 12 0| 1 0| 52 0 | 0 0| 0 0| 0 0| 0 0| 0 0 | 52 0
DCYS AT RISK
| 11 0| 1 0| 0 0| 0 0| 12 0 | 0 0| 0 0| 0 0| 0 0| 0 0 | 12 0
OTHER
| 0 0| 0 0| 0 0| 0 0| 0 0 | 0 0| 0 0| 0 0| 0 0| 0 0 | 0 0
------------------------------------------------------------------------------------------------------------------------------------
Total reported
| 3792 100|24971 100| 9893 100| 1429 100|40085 100 | 171 100| 1672 100| 656 100| 65 100| 2564 100 |42649 100
|
|
|
|
|
|
|
|
|
|
|
Percent reported |
97.3|
98.8|
98.5|
99.2|
98.6 |
96.1|
96.6|
97.8|
98.5|
96.9 |
98.5
|
|
|
|
|
|
|
|
|
|
|
|
|
|
|
|
|
|
|
|
|
|
UNKNOWN
| 105 | 294 | 146 | 11 | 556
| 7 | 59 | 15 | 1 | 82
| 638
------------------------------------------------------------------------------------------------------------------------------------
Total
| 3897 |25265 |10039 | 1440 |40641
| 178 | 1731 | 671 | 66 | 2646
|43287
Georgia Dept. of Corrections
5/2000
44
Page 39 Run 05/15/00
Georgia Department of Corrections Office of Planning and Analysis
Inmate statistical profile
Sample: ACTIVE PRISONERS EXCLUDING JAIL Active inmates 05/15/2000
Requestor: Statistics Release Type by current age & sex
|
MEN
|
WOMEN
|
| Age | Age | Age | Age | Men
| Age | Age | Age | Age |Women
|Grand
Release Type
|00-21 %|22-39 %|40-54 %|55-99 %|Total % |00-21 %|22-39 %|40-54 %|55-99 %|Total % |Total %
------------------------------------------------------------------------------------------------------------------------------------
PAROLE
| 105 3| 294 1| 146 1| 11 1| 556 1 | 7 4| 59 3| 15 2| 1 2| 82 3 | 638 1
SENTENCE EXPIRED | 0 0| 0 0| 1 0| 0 0| 1 0 | 0 0| 0 0| 0 0| 0 0| 0 0 | 1 0
Active
| 3897 100|25265 100|10038 100| 1440 100|40640 100 | 178 100| 1731 100| 671 100| 66 100| 2646 100 |43286 100
------------------------------------------------------------------------------------------------------------------------------------
Total
| 3897 |25265 |10039 | 1440 |40641
| 178 | 1731 | 671 | 66 | 2646
|43287
Georgia Dept. of Corrections
5/2000
45
Page 40 Run 05/15/00
Georgia Department of Corrections Office of Planning and Analysis
Inmate statistical profile
Sample: ACTIVE PRISONERS EXCLUDING JAIL Active inmates 05/15/2000
Requestor: Statistics Inst By Group by current age & sex
|
MEN
|
WOMEN
|
| Age | Age | Age | Age | Men
| Age | Age | Age | Age |Women
|Grand
Inst By Group
|00-21 %|22-39 %|40-54 %|55-99 %|Total % |00-21 %|22-39 %|40-54 %|55-99 %|Total % |Total %
------------------------------------------------------------------------------------------------------------------------------------
County jails
| 0 0| 0 0| 0 0| 0 0| 0 0 | 0 0| 0 0| 0 0| 0 0| 0 0 | 0 0
Transitional centers| 13 0| 461 2| 229 2| 14 1| 717 2 | 4 2| 119 7| 47 7| 5 8| 175 7 | 892 2
County camps
| 465 12| 2768 11| 611 6| 23 2| 3867 10 | 0 0| 0 0| 0 0| 0 0| 0 0 | 3867 9
Inmate boot camps | 235 6| 615 2| 0 0| 0 0| 850 2 | 0 0| 0 0| 0 0| 0 0| 0 0 | 850 2
State prisons
| 2893 74|19379 77| 8355 83| 1324 92|31951 79 | 174 98| 1612 93| 624 93| 61 92| 2471 93 |34422 80
Private prisons
| 289 7| 2035 8| 842 8| 79 5| 3245 8 | 0 0| 0 0| 0 0| 0 0| 0 0 | 3245 7
Other
| 2 0| 7 0| 1 0| 0 0| 10 0 | 0 0| 0 0| 0 0| 0 0| 0 0 | 10 0
------------------------------------------------------------------------------------------------------------------------------------
Total reported
| 3897 100|25265 100|10038 100| 1440 100|40640 100 | 178 100| 1731 100| 671 100| 66 100| 2646 100 |43286 100
|
|
|
|
|
|
|
|
|
|
|
Percent reported | 100.0| 100.0| 100.0| 100.0| 100.0 | 100.0| 100.0| 100.0| 100.0| 100.0 | 100.0
|
|
|
|
|
|
|
|
|
|
|
|
|
|
|
|
|
|
|
|
|
|
Not reported
|0|0|1|0|1
|0|0|0|0|0
|1
------------------------------------------------------------------------------------------------------------------------------------
Total
| 3897 |25265 |10039 | 1440 |40641
| 178 | 1731 | 671 | 66 | 2646
|43287
Georgia Dept. of Corrections
5/2000
46
Page 41 Run 05/15/00
Georgia Department of Corrections Office of Planning and Analysis
Inmate statistical profile
Sample: ACTIVE PRISONERS EXCLUDING JAIL Active inmates 05/15/2000
Requestor: Statistics Institution by current age & sex
|
MEN
|
WOMEN
|
| Age | Age | Age | Age | Men
| Age | Age | Age | Age |Women
|Grand
Institution
|00-21 %|22-39 %|40-54 %|55-99 %|Total % |00-21 %|22-39 %|40-54 %|55-99 %|Total % |Total %
------------------------------------------------------------------------------------------------------------------------------------
Albany Trans Ctr | 4 0| 96 0| 41 0| 2 0| 143 0 | 0 0| 0 0| 0 0| 0 0| 0 0 | 143 0
Atlanta Trans Ctr(M)| 4 0| 156 1| 81 1| 6 0| 247 1 | 0 0| 0 0| 0 0| 0 0| 0 0 | 247 1
Macon Trans Ctr
| 0 0| 91 0| 33 0| 3 0| 127 0 | 0 0| 0 0| 0 0| 0 0| 0 0 | 127 0
Metro Trans Ctr (W) | 0 0| 1 0| 0 0| 0 0| 1 0 | 2 1| 79 5| 30 4| 4 6| 115 4 | 116 0
Savannah Trans Ctr | 5 0| 117 0| 74 1| 3 0| 199 0 | 0 0| 0 0| 0 0| 0 0| 0 0 | 199 0
Savannah Womens TC | 0 0| 0 0| 0 0| 0 0| 0 0 | 2 1| 40 2| 17 3| 1 2| 60 2 | 60 0
Central State Hosp | 2 0| 7 0| 1 0| 0 0| 10 0 | 0 0| 0 0| 0 0| 0 0| 0 0 | 10 0
Bulloch County
| 17 0| 92 0| 22 0| 0 0| 131 0 | 0 0| 0 0| 0 0| 0 0| 0 0 | 131 0
Carroll County
| 30 1| 143 1| 32 0| 3 0| 208 1 | 0 0| 0 0| 0 0| 0 0| 0 0 | 208 0
Clarke County
| 6 0| 76 0| 10 0| 0 0| 92 0 | 0 0| 0 0| 0 0| 0 0| 0 0 | 92 0
Colquitt County
| 27 1| 129 1| 30 0| 0 0| 186 0 | 0 0| 0 0| 0 0| 0 0| 0 0 | 186 0
Coweta County
| 13 0| 132 1| 39 0| 3 0| 187 0 | 0 0| 0 0| 0 0| 0 0| 0 0 | 187 0
Decatur County
| 13 0| 72 0| 18 0| 1 0| 104 0 | 0 0| 0 0| 0 0| 0 0| 0 0 | 104 0
Effingham County | 8 0| 40 0| 8 0| 2 0| 58 0 | 0 0| 0 0| 0 0| 0 0| 0 0 | 58 0
Floyd County
| 19 0| 159 1| 41 0| 0 0| 219 1 | 0 0| 0 0| 0 0| 0 0| 0 0 | 219 1
Gwinnett County
| 15 0| 83 0| 16 0| 1 0| 115 0 | 0 0| 0 0| 0 0| 0 0| 0 0 | 115 0
Hall County
| 20 1| 177 1| 28 0| 1 0| 226 1 | 0 0| 0 0| 0 0| 0 0| 0 0 | 226 1
Harris County
| 7 0| 33 0| 9 0| 0 0| 49 0 | 0 0| 0 0| 0 0| 0 0| 0 0 | 49 0
Jackson County
| 14 0| 126 0| 30 0| 1 0| 171 0 | 0 0| 0 0| 0 0| 0 0| 0 0 | 171 0
Jefferson County | 20 1| 141 1| 23 0| 1 0| 185 0 | 0 0| 0 0| 0 0| 0 0| 0 0 | 185 0
Mitchell County
| 12 0| 43 0| 13 0| 0 0| 68 0 | 0 0| 0 0| 0 0| 0 0| 0 0 | 68 0
Muscogee County
| 54 1| 340 1| 64 1| 3 0| 461 1 | 0 0| 0 0| 0 0| 0 0| 0 0 | 461 1
Richmond County
| 20 1| 131 1| 33 0| 1 0| 185 0 | 0 0| 0 0| 0 0| 0 0| 0 0 | 185 0
Screven County
| 16 0| 88 0| 20 0| 0 0| 124 0 | 0 0| 0 0| 0 0| 0 0| 0 0 | 124 0
Spalding County
| 19 0| 109 0| 22 0| 0 0| 150 0 | 0 0| 0 0| 0 0| 0 0| 0 0 | 150 0
Stewart County
| 9 0| 29 0| 2 0| 1 0| 41 0 | 0 0| 0 0| 0 0| 0 0| 0 0 | 41 0
Sumter County
| 56 1| 236 1| 52 1| 1 0| 345 1 | 0 0| 0 0| 0 0| 0 0| 0 0 | 345 1
Terrell County
| 5 0| 55 0| 11 0| 1 0| 72 0 | 0 0| 0 0| 0 0| 0 0| 0 0 | 72 0
Thomas County
| 15 0| 100 0| 24 0| 2 0| 141 0 | 0 0| 0 0| 0 0| 0 0| 0 0 | 141 0
Troup County
| 19 0| 81 0| 24 0| 1 0| 125 0 | 0 0| 0 0| 0 0| 0 0| 0 0 | 125 0
Clayton County
| 31 1| 153 1| 40 0| 0 0| 224 1 | 0 0| 0 0| 0 0| 0 0| 0 0 | 224 1
Ware Prison
| 123 3| 856 3| 275 3| 20 1| 1274 3 | 0 0| 0 0| 0 0| 0 0| 0 0 | 1274 3
Lowndes Prison
| 37 1| 220 1| 62 1| 6 0| 325 1 | 0 0| 0 0| 0 0| 0 0| 0 0 | 325 1
Dodge Prison
| 34 1| 588 2| 306 3| 24 2| 952 2 | 0 0| 0 0| 0 0| 0 0| 0 0 | 952 2
Phillips Prison
| 87 2| 611 2| 260 3| 39 3| 997 2 | 0 0| 0 0| 0 0| 0 0| 0 0 | 997 2
Walker Prison
| 28 1| 257 1| 117 1| 15 1| 417 1 | 0 0| 0 0| 0 0| 0 0| 0 0 | 417 1
------------------------------------------------------------------------------------------------------------------------------------
(continued)
Georgia Dept. of Corrections
5/2000
47
Page 42 Run 05/15/00
Georgia Department of Corrections Office of Planning and Analysis
Inmate statistical profile
Sample: ACTIVE PRISONERS EXCLUDING JAIL
Requestor: Statistics
Active inmates 05/15/2000
Institution by current age & sex
(CONTINUED)
|
MEN
|
WOMEN
|
| Age | Age | Age | Age | Men
| Age | Age | Age | Age |Women
|Grand
Institution
|00-21 %|22-39 %|40-54 %|55-99 %|Total % |00-21 %|22-39 %|40-54 %|55-99 %|Total % |Total %
------------------------------------------------------------------------------------------------------------------------------------
Wayne Prison
| 11 0| 113 0| 68 1| 6 0| 198 0 | 0 0| 0 0| 0 0| 0 0| 0 0 | 198 0
Arrendale Prison | 542 14| 526 2| 124 1| 14 1| 1206 3 | 0 0| 0 0| 0 0| 0 0| 0 0 | 1206 3
Montgomery Prison | 51 1| 232 1| 92 1| 7 0| 382 1 | 0 0| 0 0| 0 0| 0 0| 0 0 | 382 1
Lee Prison
| 49 1| 443 2| 161 2| 15 1| 668 2 | 0 0| 0 0| 0 0| 0 0| 0 0 | 668 2
Putnam Prison
| 21 1| 86 0| 31 0| 0 0| 138 0 | 0 0| 0 0| 0 0| 0 0| 0 0 | 138 0
Georgia State Prison| 39 1| 811 3| 338 3| 25 2| 1213 3 | 0 0| 0 0| 0 0| 0 0| 0 0 | 1213 3
Mens Prison
| 4 0| 159 1| 213 2| 265 18| 641 2 | 0 0| 0 0| 0 0| 0 0| 0 0 | 641 1
Jackson Prison-Diag | 168 4| 935 4| 414 4| 66 5| 1583 4 | 0 0| 0 0| 0 0| 0 0| 0 0 | 1583 4
Jackson Prison-Perm | 4 0| 147 1| 85 1| 11 1| 247 1 | 0 0| 0 0| 0 0| 0 0| 0 0 | 247 1
Coastal Prison
| 159 4| 732 3| 331 3| 26 2| 1248 3 | 0 0| 0 0| 0 0| 0 0| 0 0 | 1248 3
Scott Prison
| 71 2| 736 3| 310 3| 42 3| 1159 3 | 0 0| 0 0| 0 0| 0 0| 0 0 | 1159 3
Rivers Prison
| 59 2| 680 3| 331 3| 31 2| 1101 3 | 0 0| 0 0| 0 0| 0 0| 0 0 | 1101 3
Rutledge Prison
| 20 1| 300 1| 221 2| 50 3| 591 1 | 0 0| 0 0| 0 0| 0 0| 0 0 | 591 1
Central Prison
| 23 1| 429 2| 280 3| 45 3| 777 2 | 0 0| 0 0| 0 0| 0 0| 0 0 | 777 2
Augusta Med Prison | 91 2| 577 2| 338 3| 79 5| 1085 3 | 0 0| 1 0| 0 0| 0 0| 1 0 | 1086 3
Rogers Prison
| 175 4| 842 3| 215 2| 8 1| 1240 3 | 0 0| 0 0| 0 0| 0 0| 0 0 | 1240 3
Burruss Prison
| 33 1| 195 1| 59 1| 10 1| 297 1 | 0 0| 0 0| 0 0| 0 0| 0 0 | 297 1
Bostick Prison
| 12 0| 226 1| 235 2| 131 9| 604 1 | 0 0| 0 0| 0 0| 0 0| 0 0 | 604 1
Valdosta Prison
| 42 1| 577 2| 200 2| 24 2| 843 2 | 0 0| 0 0| 0 0| 0 0| 0 0 | 843 2
Hays Prison
| 139 4| 738 3| 326 3| 42 3| 1245 3 | 0 0| 0 0| 0 0| 0 0| 0 0 | 1245 3
Hancock Prison
| 99 3| 910 4| 338 3| 37 3| 1384 3 | 0 0| 0 0| 0 0| 0 0| 0 0 | 1384 3
Telfair Prison
| 77 2| 732 3| 239 2| 16 1| 1064 3 | 0 0| 0 0| 0 0| 0 0| 0 0 | 1064 2
Autry Prison
| 75 2| 813 3| 380 4| 58 4| 1326 3 | 0 0| 0 0| 0 0| 0 0| 0 0 | 1326 3
Washington Mens Pris| 25 1| 89 0| 34 0| 1 0| 149 0 | 0 0| 0 0| 0 0| 0 0| 0 0 | 149 0
Wilcox Prison
| 76 2| 736 3| 377 4| 49 3| 1238 3 | 0 0| 0 0| 0 0| 0 0| 0 0 | 1238 3
Calhoun Prison
| 91 2| 769 3| 324 3| 44 3| 1228 3 | 0 0| 0 0| 0 0| 0 0| 0 0 | 1228 3
Dooly Prison
| 76 2| 670 3| 343 3| 32 2| 1121 3 | 0 0| 0 0| 0 0| 0 0| 0 0 | 1121 3
Macon Prison
| 109 3| 887 4| 324 3| 46 3| 1366 3 | 0 0| 0 0| 0 0| 0 0| 0 0 | 1366 3
Smith Prison
| 82 2| 785 3| 232 2| 18 1| 1117 3 | 0 0| 0 0| 0 0| 0 0| 0 0 | 1117 3
Homerville Prison | 1 0| 142 1| 53 1| 1 0| 197 0 | 0 0| 0 0| 0 0| 0 0| 0 0 | 197 0
Washingtn Women Pris| 0 0| 0 0| 0 0| 0 0| 0 0 | 46 26| 509 29| 228 34| 19 29| 802 30 | 802 2
Baldwin Prison
| 77 2| 439 2| 176 2| 10 1| 702 2 | 0 0| 0 0| 0 0| 0 0| 0 0 | 702 2
Metro Womens Prison | 0 0| 0 0| 0 0| 0 0| 0 0 | 45 25| 432 25| 159 24| 23 35| 659 25 | 659 2
Pulaski Womens Pris | 0 0| 0 0| 0 0| 0 0| 0 0 | 83 47| 670 39| 237 35| 19 29| 1009 38 | 1009 2
Pelham PreTrans Unit| 5 0| 121 0| 54 1| 7 0| 187 0 | 0 0| 0 0| 0 0| 0 0| 0 0 | 187 0
------------------------------------------------------------------------------------------------------------------------------------
(continued)
Georgia Dept. of Corrections
5/2000
48
Page 43 Run 05/15/00
Georgia Department of Corrections Office of Planning and Analysis
Inmate statistical profile
Sample: ACTIVE PRISONERS EXCLUDING JAIL
Requestor: Statistics
Active inmates 05/15/2000
Institution by current age & sex
(CONTINUED)
|
MEN
|
WOMEN
|
| Age | Age | Age | Age | Men
| Age | Age | Age | Age |Women
|Grand
Institution
|00-21 %|22-39 %|40-54 %|55-99 %|Total % |00-21 %|22-39 %|40-54 %|55-99 %|Total % |Total %
------------------------------------------------------------------------------------------------------------------------------------
Milan Prison
| 56 1| 145 1| 57 1| 2 0| 260 1 | 0 0| 0 0| 0 0| 0 0| 0 0 | 260 1
West Central Prison | 22 1| 125 0| 32 0| 2 0| 181 0 | 0 0| 0 0| 0 0| 0 0| 0 0 | 181 0
D Ray James Prison | 102 3| 793 3| 317 3| 27 2| 1239 3 | 0 0| 0 0| 0 0| 0 0| 0 0 | 1239 3
Coffee Corr Facility| 97 2| 612 2| 271 3| 23 2| 1003 2 | 0 0| 0 0| 0 0| 0 0| 0 0 | 1003 2
Wheeler Corr Facilty| 90 2| 630 2| 254 3| 29 2| 1003 2 | 0 0| 0 0| 0 0| 0 0| 0 0 | 1003 2
Transfer Inst Unkn | 0 0| 0 0| 1 0| 0 0| 1 0 | 0 0| 0 0| 0 0| 0 0| 0 0 | 1 0
Montgomery BC
| 23 1| 60 0| 0 0| 0 0| 83 0 | 0 0| 0 0| 0 0| 0 0| 0 0 | 83 0
Scott BC
| 23 1| 49 0| 0 0| 0 0| 72 0 | 0 0| 0 0| 0 0| 0 0| 0 0 | 72 0
Burruss BC
| 37 1| 104 0| 0 0| 0 0| 141 0 | 0 0| 0 0| 0 0| 0 0| 0 0 | 141 0
Hays BC
| 50 1| 157 1| 0 0| 0 0| 207 1 | 0 0| 0 0| 0 0| 0 0| 0 0 | 207 0
Baldwin BC
| 71 2| 184 1| 0 0| 0 0| 255 1 | 0 0| 0 0| 0 0| 0 0| 0 0 | 255 1
Treutlen BC
| 31 1| 61 0| 0 0| 0 0| 92 0 | 0 0| 0 0| 0 0| 0 0| 0 0 | 92 0
------------------------------------------------------------------------------------------------------------------------------------
Total reported
| 3897 100|25265 100|10039 100| 1440 100|40641 100 | 178 100| 1731 100| 671 100| 66 100| 2646 100 |43287 100
|
|
|
|
|
|
|
|
|
|
|
Percent reported | 100.0| 100.0| 100.0| 100.0| 100.0 | 100.0| 100.0| 100.0| 100.0| 100.0 | 100.0
|
|
|
|
|
|
|
|
|
|
|
|
|
|
|
|
|
|
|
|
|
|
Not Reported
|0|0|0|0|0
|0|0|0|0|0
|0
------------------------------------------------------------------------------------------------------------------------------------
Total
| 3897 |25265 |10039 | 1440 |40641
| 178 | 1731 | 671 | 66 | 2646
|43287
Georgia Dept. of Corrections
5/2000
49
Page 44 Run 05/15/00
Georgia Department of Corrections Office of Planning and Analysis
Inmate statistical profile
Sample: ACTIVE PRISONERS EXCLUDING JAIL Active inmates 05/15/2000
Requestor: Statistics Misdemeanors And Felonies by current age & sex
|
MEN
|
WOMEN
|
| Age | Age | Age | Age | Men
| Age | Age | Age | Age |Women
|Grand
Crime Type
|00-21 %|22-39 %|40-54 %|55-99 %|Total % |00-21 %|22-39 %|40-54 %|55-99 %|Total % |Total %
------------------------------------------------------------------------------------------------------------------------------------
MISDEMEANOR
| 15 0| 63 0| 20 0| 4 0| 102 0 | 0 0| 8 0| 4 1| 0 0| 12 0 | 114 0
FELONY
| 3775 100|24901 100| 9867 100| 1425 100|39968 100 | 171 100| 1664 100| 652 99| 65 100| 2552 100 |42520 100
------------------------------------------------------------------------------------------------------------------------------------
Total reported
| 3790 100|24964 100| 9887 100| 1429 100|40070 100 | 171 100| 1672 100| 656 100| 65 100| 2564 100 |42634 100
|
|
|
|
|
|
|
|
|
|
|
Percent reported |
97.3|
98.8|
98.5|
99.2|
98.6 |
96.1|
96.6|
97.8|
98.5|
96.9 |
98.5
|
|
|
|
|
|
|
|
|
|
|
|
|
|
|
|
|
|
|
|
|
|
NOT REPORTED
| 107 | 301 | 152 | 11 | 571
| 7 | 59 | 15 | 1 | 82
| 653
------------------------------------------------------------------------------------------------------------------------------------
Total
| 3897 |25265 |10039 | 1440 |40641
| 178 | 1731 | 671 | 66 | 2646
|43287
Georgia Dept. of Corrections
5/2000
50
Page 45 Run 05/15/00
Georgia Department of Corrections Office of Planning and Analysis
Inmate statistical profile
Sample: ACTIVE PRISONERS EXCLUDING JAIL Active inmates 05/15/2000
Requestor: Statistics Crimes By Group by current age & sex
|
MEN
|
WOMEN
|
| Age | Age | Age | Age | Men
| Age | Age | Age | Age |Women
|Grand
Crimes By Group
|00-21 %|22-39 %|40-54 %|55-99 %|Total % |00-21 %|22-39 %|40-54 %|55-99 %|Total % |Total %
------------------------------------------------------------------------------------------------------------------------------------
HOMICIDE
| 259 7| 2898 12| 1606 16| 402 28| 5165 13 | 20 12| 212 13| 113 17| 34 52| 379 15 | 5544 13
ABORTION
| 0 0| 0 0| 0 0| 0 0| 0 0 | 0 0| 0 0| 0 0| 0 0| 0 0 | 0 0
BODILY INJRY&REL OFF| 540 14| 3571 14| 1276 13| 166 12| 5553 14 | 16 9| 177 11| 74 11| 4 6| 271 11 | 5824 14
ARSON & REL OFF
| 26 1| 186 1| 65 1| 10 1| 287 1 | 0 0| 16 1| 8 1| 1 2| 25 1 | 312 1
DAMAGE OF PROPERTY | 18 0| 55 0| 22 0| 3 0| 98 0 | 1 1| 4 0| 1 0| 0 0| 6 0 | 104 0
BURGLARY & REL OFF | 548 14| 3067 12| 993 10| 40 3| 4648 12 | 19 11| 115 7| 36 5| 0 0| 170 7 | 4818 11
FORGERY & REL OFF | 50 1| 689 3| 306 3| 12 1| 1057 3 | 13 8| 261 16| 82 13| 3 5| 359 14 | 1416 3
THEFT
| 311 8| 1633 7| 615 6| 51 4| 2610 7 | 18 11| 186 11| 103 16| 4 6| 311 12 | 2921 7
ROBBERY
| 1181 31| 4261 17| 1048 11| 56 4| 6546 16 | 47 27| 136 8| 36 5| 1 2| 220 9 | 6766 16
SEXUAL OFFENSES
| 274 7| 2787 11| 1773 18| 475 33| 5309 13 | 6 4| 40 2| 19 3| 0 0| 65 3 | 5374 13
OBSCENITY CRIMES | 0 0| 0 0| 2 0| 0 0| 2 0 | 0 0| 0 0| 0 0| 0 0| 0 0 | 2 0
TREASON & REL OFF | 0 0| 2 0| 1 0| 0 0| 3 0 | 0 0| 0 0| 0 0| 0 0| 0 0 | 3 0
CRIMES INVOLVNG GOVT| 73 2| 574 2| 135 1| 7 0| 789 2 | 2 1| 28 2| 16 2| 0 0| 46 2 | 835 2
FALSIFICATIONS
| 1 0| 24 0| 8 0| 1 0| 34 0 | 0 0| 2 0| 1 0| 0 0| 3 0 | 37 0
OBSTRUCT LAW ENFORCE| 12 0| 73 0| 25 0| 2 0| 112 0 | 1 1| 3 0| 2 0| 0 0| 6 0 | 118 0
DISORDERLY CONDUCT | 0 0| 32 0| 3 0| 0 0| 35 0 | 1 1| 0 0| 1 0| 0 0| 2 0 | 37 0
GAMBLING & REL OFF | 0 0| 3 0| 0 0| 1 0| 4 0 | 0 0| 1 0| 0 0| 0 0| 1 0 | 5 0
CRUELTY TO CHILDREN | 12 0| 168 1| 50 1| 11 1| 241 1 | 4 2| 62 4| 7 1| 0 0| 73 3 | 314 1
CRIMES WITH GUNS | 9 0| 127 1| 44 0| 7 0| 187 0 | 0 0| 2 0| 0 0| 0 0| 2 0 | 189 0
INVASION PRIVACY | 3 0| 9 0| 8 0| 1 0| 21 0 | 0 0| 0 0| 0 0| 0 0| 0 0 | 21 0
RACKETEERING
| 1 0| 5 0| 8 0| 1 0| 15 0 | 0 0| 2 0| 1 0| 0 0| 3 0 | 18 0
DRUG ABUSE OFFENSES | 403 11| 3697 15| 1388 14| 108 8| 5596 14 | 18 11| 344 21| 120 18| 16 25| 498 19 | 6094 14
DRUG TRAFFICKING | 22 1| 636 3| 197 2| 29 2| 884 2 | 2 1| 44 3| 23 4| 1 2| 70 3 | 954 2
AUTO CRIMES
| 2 0| 303 1| 263 3| 36 3| 604 2 | 0 0| 16 1| 6 1| 1 2| 23 1 | 627 1
REVENUE & CONTRABAND| 0 0| 0 0| 0 0| 0 0| 0 0 | 0 0| 0 0| 0 0| 0 0| 0 0 | 0 0
CRIMES OF OTH STATES| 0 0| 1 0| 1 0| 0 0| 2 0 | 0 0| 0 0| 0 0| 0 0| 0 0 | 2 0
MISC. FELONIES
| 27 1| 93 0| 26 0| 6 0| 152 0 | 3 2| 13 1| 3 0| 0 0| 19 1 | 171 0
MISDEMEANORS
| 15 0| 63 0| 20 0| 4 0| 102 0 | 0 0| 8 0| 4 1| 0 0| 12 0 | 114 0
------------------------------------------------------------------------------------------------------------------------------------
Total reported
| 3787 100|24957 100| 9883 100| 1429 100|40056 100 | 171 100| 1672 100| 656 100| 65 100| 2564 100 |42620 100
|
|
|
|
|
|
|
|
|
|
|
Percent reported |
97.2|
98.8|
98.4|
99.2|
98.6 |
96.1|
96.6|
97.8|
98.5|
96.9 |
98.5
|
|
|
|
|
|
|
|
|
|
|
|
|
|
|
|
|
|
|
|
|
|
NOT REPORTED
| 110 | 308 | 156 | 11 | 585
| 7 | 59 | 15 | 1 | 82
| 667
------------------------------------------------------------------------------------------------------------------------------------
Total
| 3897 |25265 |10039 | 1440 |40641
| 178 | 1731 | 671 | 66 | 2646
|43287
Georgia Dept. of Corrections
5/2000
51
Page 46 Run 05/15/00
Georgia Department of Corrections Office of Planning and Analysis
Inmate statistical profile
Sample: ACTIVE PRISONERS EXCLUDING JAIL Active inmates 05/15/2000
Requestor: Statistics Most Serious Offense by current age & sex
|
MEN
|
WOMEN
|
| Age | Age | Age | Age | Men
| Age | Age | Age | Age |Women
|Grand
Most Serious Offense|00-21 %|22-39 %|40-54 %|55-99 %|Total % |00-21 %|22-39 %|40-54 %|55-99 %|Total % |Total %
------------------------------------------------------------------------------------------------------------------------------------
Misdemeanors
|
|
|
------------------------------------------------------------------------------------------------------------------------------------
------------------------------------------------------------------------------------------------------------------------------------
abandonment
| 0 0| 0 0| 0 0| 1 0| 1 0 | 0 0| 0 0| 0 0| 0 0| 0 0 | 1 0
stalking
| 0 0| 3 0| 1 0| 0 0| 4 0 | 0 0| 0 0| 0 0| 0 0| 0 0 | 4 0
assault & battery | 0 0| 0 0| 1 0| 0 0| 1 0 | 0 0| 0 0| 0 0| 0 0| 0 0 | 1 0
aggravated assault | 0 0| 1 0| 0 0| 0 0| 1 0 | 0 0| 0 0| 0 0| 0 0| 0 0 | 1 0
simple assault
| 1 0| 3 0| 0 0| 0 0| 4 0 | 0 0| 1 0| 0 0| 0 0| 1 0 | 5 0
simple battery
| 2 0| 12 0| 1 0| 0 0| 15 0 | 0 0| 0 0| 1 0| 0 0| 1 0 | 16 0
reckless conduct | 0 0| 2 0| 0 0| 1 0| 3 0 | 0 0| 0 0| 0 0| 0 0| 0 0 | 3 0
receiving stolen goo| 0 0| 2 0| 0 0| 0 0| 2 0 | 0 0| 0 0| 0 0| 0 0| 0 0 | 2 0
theft by taking
| 1 0| 3 0| 0 0| 0 0| 4 0 | 0 0| 0 0| 0 0| 0 0| 0 0 | 4 0
robbery
| 0 0| 1 0| 0 0| 0 0| 1 0 | 0 0| 0 0| 0 0| 0 0| 0 0 | 1 0
bad checks
| 0 0| 1 0| 0 0| 0 0| 1 0 | 0 0| 2 0| 1 0| 0 0| 3 0 | 4 0
fraudulent checks | 0 0| 0 0| 0 0| 0 0| 0 0 | 0 0| 1 0| 0 0| 0 0| 1 0 | 1 0
poss of narcotics | 0 0| 1 0| 0 0| 0 0| 1 0 | 0 0| 0 0| 0 0| 0 0| 0 0 | 1 0
poss of marijuana | 0 0| 2 0| 1 0| 0 0| 3 0 | 0 0| 0 0| 0 0| 0 0| 0 0 | 3 0
viol motor veh law | 1 0| 4 0| 3 0| 0 0| 8 0 | 0 0| 0 0| 0 0| 0 0| 0 0 | 8 0
d.u.i.
| 0 0| 7 0| 6 0| 1 0| 14 0 | 0 0| 2 0| 1 0| 0 0| 3 0 | 17 0
obstr of law enf off| 2 0| 4 0| 0 0| 1 0| 7 0 | 0 0| 0 0| 0 0| 0 0| 0 0 | 7 0
impersonating anothe| 0 0| 1 0| 0 0| 0 0| 1 0 | 0 0| 0 0| 0 0| 0 0| 0 0 | 1 0
criminal trespassing| 0 0| 4 0| 2 0| 0 0| 6 0 | 0 0| 1 0| 1 0| 0 0| 2 0 | 8 0
criminal damage
| 0 0| 0 0| 1 0| 0 0| 1 0 | 0 0| 0 0| 0 0| 0 0| 0 0 | 1 0
viol ga cntrl subst | 0 0| 1 0| 0 0| 0 0| 1 0 | 0 0| 0 0| 0 0| 0 0| 0 0 | 1 0
public indecency | 0 0| 1 0| 0 0| 0 0| 1 0 | 0 0| 0 0| 0 0| 0 0| 0 0 | 1 0
sexual battery
| 0 0| 2 0| 1 0| 0 0| 3 0 | 0 0| 0 0| 0 0| 0 0| 0 0 | 3 0
escape
| 0 0| 1 0| 0 0| 0 0| 1 0 | 0 0| 0 0| 0 0| 0 0| 0 0 | 1 0
cpwl & concealed wea| 2 0| 0 0| 1 0| 0 0| 3 0 | 0 0| 0 0| 0 0| 0 0| 0 0 | 3 0
shoplifting
| 3 0| 0 0| 1 0| 0 0| 4 0 | 0 0| 0 0| 0 0| 0 0| 0 0 | 4 0
pointing gun at anot| 0 0| 1 0| 0 0| 0 0| 1 0 | 0 0| 0 0| 0 0| 0 0| 0 0 | 1 0
inciting to riot | 1 0| 0 0| 0 0| 0 0| 1 0 | 0 0| 0 0| 0 0| 0 0| 0 0 | 1 0
theft by deception <| 0 0| 1 0| 0 0| 0 0| 1 0 | 0 0| 0 0| 0 0| 0 0| 0 0 | 1 0
entrng mot veh crim | 1 0| 0 0| 0 0| 0 0| 1 0 | 0 0| 0 0| 0 0| 0 0| 0 0 | 1 0
------------------------------------------------------------------------------------------------------------------------------------
(continued)
Georgia Dept. of Corrections
5/2000
52
Page 47 Run 05/15/00
Georgia Department of Corrections Office of Planning and Analysis
Inmate statistical profile
Sample: ACTIVE PRISONERS EXCLUDING JAIL
Requestor: Statistics
Active inmates 05/15/2000
Most Serious Offense by current age & sex
(CONTINUED)
|
MEN
|
WOMEN
|
| Age | Age | Age | Age | Men
| Age | Age | Age | Age |Women
|Grand
Most Serious Offense|00-21 %|22-39 %|40-54 %|55-99 %|Total % |00-21 %|22-39 %|40-54 %|55-99 %|Total % |Total %
------------------------------------------------------------------------------------------------------------------------------------
FELONIES
|
|
|
------------------------------------------------------------------------------------------------------------------------------------
------------------------------------------------------------------------------------------------------------------------------------
misc misdemeanor | 1 0| 5 0| 1 0| 0 0| 7 0 | 0 0| 1 0| 0 0| 0 0| 1 0 | 8 0
MISC. HOMICIDE OFFEN| 2 0| 3 0| 1 0| 0 0| 6 0 | 0 0| 0 0| 0 0| 0 0| 0 0 | 6 0
MURDER
| 164 4| 1995 8| 1255 13| 306 21| 3720 9 | 10 6| 111 7| 59 9| 25 38| 205 8 | 3925 9
VOLUNTARY MANSLAUGHT| 60 2| 671 3| 271 3| 72 5| 1074 3 | 9 5| 73 4| 45 7| 7 11| 134 5 | 1208 3
INVOLUNTARY MANSLAUG| 17 0| 83 0| 18 0| 8 1| 126 0 | 0 0| 13 1| 2 0| 0 0| 15 1 | 141 0
RECKLESS ABANDONMENT| 0 0| 0 0| 0 0| 0 0| 0 0 | 1 1| 0 0| 0 0| 0 0| 1 0 | 1 0
FETICIDE
| 0 0| 3 0| 1 0| 0 0| 4 0 | 0 0| 0 0| 0 0| 0 0| 0 0 | 4 0
VEHICULAR HOMICIDE | 18 0| 143 1| 60 1| 14 1| 235 1 | 0 0| 15 1| 6 1| 2 3| 23 1 | 258 1
HOMICIDE BY PILOT,DU| 0 0| 1 0| 0 0| 0 0| 1 0 | 0 0| 0 0| 1 0| 0 0| 1 0 | 2 0
CONCEAL DEATH OF ANO| 0 0| 0 0| 0 0| 1 0| 1 0 | 0 0| 0 0| 0 0| 0 0| 0 0 | 1 0
CRIMINAL ATTEMPT MUR| 0 0| 2 0| 1 0| 1 0| 4 0 | 0 0| 0 0| 0 0| 0 0| 0 0 | 4 0
MISC. ASSAULT/BATTER| 1 0| 16 0| 11 0| 1 0| 29 0 | 0 0| 0 0| 0 0| 0 0| 0 0 | 29 0
AGGRAVATED ASSAULT | 340 9| 2230 9| 766 8| 110 8| 3446 9 | 11 6| 121 7| 53 8| 4 6| 189 7 | 3635 9
CRMNL ATTEMPT AGG AS| 0 0| 3 0| 2 0| 0 0| 5 0 | 0 0| 0 0| 0 0| 0 0| 0 0 | 5 0
AGGRAVATED BATTERY | 46 1| 265 1| 99 1| 15 1| 425 1 | 2 1| 19 1| 8 1| 0 0| 29 1 | 454 1
TERRORIST THREATS & | 28 1| 144 1| 70 1| 8 1| 250 1 | 0 0| 6 0| 5 1| 0 0| 11 0 | 261 1
FALSE IMPRISONMENT | 8 0| 59 0| 19 0| 1 0| 87 0 | 0 0| 2 0| 1 0| 0 0| 3 0 | 90 0
KIDNAPPING
| 96 3| 604 2| 221 2| 21 1| 942 2 | 2 1| 14 1| 5 1| 0 0| 21 1 | 963 2
INTERFERENCE WITH CU| 0 0| 2 0| 0 0| 0 0| 2 0 | 0 0| 0 0| 0 0| 0 0| 0 0 | 2 0
AGG ASSLT ON POLICE | 14 0| 161 1| 55 1| 7 0| 237 1 | 0 0| 6 0| 2 0| 0 0| 8 0 | 245 1
AGG BATRY PEACE OFFI| 0 0| 8 0| 1 0| 0 0| 9 0 | 0 0| 0 0| 0 0| 0 0| 0 0 | 9 0
SIMPLE BATTERY MISD | 0 0| 1 0| 2 0| 0 0| 3 0 | 0 0| 0 0| 0 0| 0 0| 0 0 | 3 0
RECK COND-HIV INFCTD| 1 0| 4 0| 4 0| 0 0| 9 0 | 0 0| 7 0| 0 0| 0 0| 7 0 | 16 0
AGGRAVATED STALKING | 5 0| 69 0| 24 0| 3 0| 101 0 | 1 1| 2 0| 0 0| 0 0| 3 0 | 104 0
CRIMINAL ATTEMPT KID| 1 0| 5 0| 2 0| 0 0| 8 0 | 0 0| 0 0| 0 0| 0 0| 0 0 | 8 0
MISC. ARSON
| 0 0| 1 0| 2 0| 1 0| 4 0 | 0 0| 0 0| 1 0| 0 0| 1 0 | 5 0
FIRST DEGREE ARSON | 15 0| 160 1| 53 1| 9 1| 237 1 | 0 0| 14 1| 7 1| 1 2| 22 1 | 259 1
SECOND DEGREE ARSON | 10 0| 24 0| 9 0| 0 0| 43 0 | 0 0| 1 0| 0 0| 0 0| 1 0 | 44 0
THIRD DEGREE ARSON | 1 0| 0 0| 0 0| 0 0| 1 0 | 0 0| 1 0| 0 0| 0 0| 1 0 | 2 0
CRIMINAL POSS EXPLOS| 0 0| 1 0| 1 0| 0 0| 2 0 | 0 0| 0 0| 0 0| 0 0| 0 0 | 2 0
MISC. CRIMINAL DAMAG| 0 0| 2 0| 0 0| 0 0| 2 0 | 0 0| 0 0| 0 0| 0 0| 0 0 | 2 0
------------------------------------------------------------------------------------------------------------------------------------
(continued)
Georgia Dept. of Corrections
5/2000
53
Page 48 Run 05/15/00
Georgia Department of Corrections Office of Planning and Analysis
Inmate statistical profile
Sample: ACTIVE PRISONERS EXCLUDING JAIL
Requestor: Statistics
Active inmates 05/15/2000
Most Serious Offense by current age & sex
(CONTINUED)
|
MEN
|
WOMEN
|
| Age | Age | Age | Age | Men
| Age | Age | Age | Age |Women
|Grand
Most Serious Offense|00-21 %|22-39 %|40-54 %|55-99 %|Total % |00-21 %|22-39 %|40-54 %|55-99 %|Total % |Total %
------------------------------------------------------------------------------------------------------------------------------------
CRIM. DAMAGE 1ST DEG| 3 0| 16 0| 5 0| 0 0| 24 0 | 0 0| 1 0| 0 0| 0 0| 1 0 | 25 0
CRIM. DAMAGE 2ND DEG| 11 0| 36 0| 15 0| 3 0| 65 0 | 1 1| 2 0| 1 0| 0 0| 4 0 | 69 0
VANDALISM TO CHURCH | 1 0| 0 0| 0 0| 0 0| 1 0 | 0 0| 1 0| 0 0| 0 0| 1 0 | 2 0
ALTER I.D.
| 3 0| 1 0| 2 0| 0 0| 6 0 | 0 0| 0 0| 0 0| 0 0| 0 0 | 6 0
BURGLARY
| 537 14| 3041 12| 970 10| 39 3| 4587 11 | 19 11| 114 7| 36 5| 0 0| 169 7 | 4756 11
POSS BURGLAR TOOLS | 2 0| 12 0| 8 0| 1 0| 23 0 | 0 0| 1 0| 0 0| 0 0| 1 0 | 24 0
CRMNL ATMPT COMMIT B| 9 0| 14 0| 15 0| 0 0| 38 0 | 0 0| 0 0| 0 0| 0 0| 0 0 | 38 0
MISC. FORGERY
| 0 0| 3 0| 2 0| 0 0| 5 0 | 0 0| 1 0| 0 0| 0 0| 1 0 | 6 0
FORGERY 1ST DEGREE | 46 1| 617 2| 279 3| 9 1| 951 2 | 10 6| 232 14| 67 10| 2 3| 311 12 | 1262 3
FORGERY 2ND DEGREE | 0 0| 13 0| 4 0| 0 0| 17 0 | 0 0| 6 0| 2 0| 0 0| 8 0 | 25 0
BAD CHECKS
| 0 0| 3 0| 2 0| 0 0| 5 0 | 0 0| 2 0| 0 0| 0 0| 2 0 | 7 0
THEFT CREDIT CARD | 1 0| 9 0| 4 0| 0 0| 14 0 | 1 1| 1 0| 2 0| 0 0| 4 0 | 18 0
FRAUDULENT CREDIT CA| 3 0| 34 0| 6 0| 0 0| 43 0 | 2 1| 11 1| 5 1| 0 0| 18 1 | 61 0
RECV GDS,SRVS FRAUD | 0 0| 0 0| 0 0| 0 0| 0 0 | 0 0| 1 0| 0 0| 0 0| 1 0 | 1 0
TELECOMMUNICATIONS F| 0 0| 2 0| 1 0| 0 0| 3 0 | 0 0| 0 0| 0 0| 0 0| 0 0 | 3 0
MISC. FRAUD
| 0 0| 8 0| 8 0| 3 0| 19 0 | 0 0| 7 0| 6 1| 1 2| 14 1 | 33 0
THEFT BY TAKING
| 87 2| 490 2| 178 2| 23 2| 778 2 | 7 4| 47 3| 29 4| 1 2| 84 3 | 862 2
THEFT BY DECEPTION | 2 0| 19 0| 14 0| 5 0| 40 0 | 1 1| 5 0| 1 0| 0 0| 7 0 | 47 0
THEFT BY EXTORTION | 0 0| 1 0| 1 0| 0 0| 2 0 | 0 0| 0 0| 0 0| 0 0| 0 0 | 2 0
THEFT OF LOST PROPER| 0 0| 1 0| 2 0| 0 0| 3 0 | 0 0| 0 0| 0 0| 0 0| 0 0 | 3 0
THEFT BY REC STOLEN | 144 4| 585 2| 166 2| 9 1| 904 2 | 1 1| 21 1| 3 0| 0 0| 25 1 | 929 2
THEFT OF SERVICES | 0 0| 4 0| 2 0| 0 0| 6 0 | 0 0| 0 0| 0 0| 0 0| 0 0 | 6 0
THEFT BY CONVERSION | 2 0| 20 0| 10 0| 1 0| 33 0 | 0 0| 3 0| 1 0| 1 2| 5 0 | 38 0
THEFT OF MOTOR VEH, | 30 1| 114 0| 23 0| 0 0| 167 0 | 0 0| 5 0| 0 0| 0 0| 5 0 | 172 0
THEFT BRING PROP IN | 0 0| 13 0| 2 0| 2 0| 17 0 | 0 0| 0 0| 1 0| 0 0| 1 0 | 18 0
THEFT RECV PROP OUT | 0 0| 3 0| 0 0| 1 0| 4 0 | 0 0| 0 0| 0 0| 0 0| 0 0 | 4 0
THEFT BY SHOPLIFTING| 11 0| 280 1| 192 2| 10 1| 493 1 | 9 5| 100 6| 68 10| 2 3| 179 7 | 672 2
ENTERING VEHICLE | 35 1| 103 0| 25 0| 0 0| 163 0 | 0 0| 5 0| 0 0| 0 0| 5 0 | 168 0
ROBBERY
| 474 13| 1686 7| 384 4| 19 1| 2563 6 | 34 20| 88 5| 24 4| 1 2| 147 6 | 2710 6
ARMED ROBBERY
| 638 17| 2391 10| 648 7| 37 3| 3714 9 | 11 6| 39 2| 12 2| 0 0| 62 2 | 3776 9
HIJACKING MOTOR VEHI| 11 0| 23 0| 0 0| 0 0| 34 0 | 1 1| 0 0| 0 0| 0 0| 1 0 | 35 0
CRIMINAL ATTEMPT ROB| 11 0| 34 0| 8 0| 0 0| 53 0 | 0 0| 3 0| 0 0| 0 0| 3 0 | 56 0
CRMNL ATMPT ARMED RO| 47 1| 127 1| 8 0| 0 0| 182 0 | 1 1| 6 0| 0 0| 0 0| 7 0 | 189 0
MISC. SEXUAL
| 0 0| 11 0| 7 0| 0 0| 18 0 | 0 0| 1 0| 1 0| 0 0| 2 0 | 20 0
RAPE
| 61 2| 892 4| 596 6| 75 5| 1624 4 | 0 0| 2 0| 2 0| 0 0| 4 0 | 1628 4
------------------------------------------------------------------------------------------------------------------------------------
(continued)
Georgia Dept. of Corrections
5/2000
54
Page 49 Run 05/15/00
Georgia Department of Corrections Office of Planning and Analysis
Inmate statistical profile
Sample: ACTIVE PRISONERS EXCLUDING JAIL
Requestor: Statistics
Active inmates 05/15/2000
Most Serious Offense by current age & sex
(CONTINUED)
|
MEN
|
WOMEN
|
| Age | Age | Age | Age | Men
| Age | Age | Age | Age |Women
|Grand
Most Serious Offense|00-21 %|22-39 %|40-54 %|55-99 %|Total % |00-21 %|22-39 %|40-54 %|55-99 %|Total % |Total %
------------------------------------------------------------------------------------------------------------------------------------
SODOMY
| 3 0| 17 0| 13 0| 6 0| 39 0 | 0 0| 0 0| 0 0| 0 0| 0 0 | 39 0
AGGRAVATED SODOMY | 7 0| 116 0| 87 1| 32 2| 242 1 | 0 0| 1 0| 3 0| 0 0| 4 0 | 246 1
INCEST
| 1 0| 23 0| 38 0| 7 0| 69 0 | 0 0| 0 0| 0 0| 0 0| 0 0 | 69 0
BIGAMY
| 0 0| 1 0| 0 0| 0 0| 1 0 | 0 0| 0 0| 0 0| 0 0| 0 0 | 1 0
AGGRAVATED SEXUAL BA| 3 0| 32 0| 25 0| 4 0| 64 0 | 0 0| 1 0| 0 0| 0 0| 1 0 | 65 0
STATUATORY RAPE
| 75 2| 282 1| 32 0| 9 1| 398 1 | 2 1| 2 0| 0 0| 0 0| 4 0 | 402 1
CHILD MOLESTATION | 94 2| 889 4| 614 6| 229 16| 1826 5 | 3 2| 16 1| 8 1| 0 0| 27 1 | 1853 4
ENTICING CHILD-INDEC| 1 0| 22 0| 7 0| 5 0| 35 0 | 0 0| 2 0| 0 0| 0 0| 2 0 | 37 0
AGGRAV. CHILD MOLEST| 26 1| 455 2| 344 3| 106 7| 931 2 | 1 1| 15 1| 5 1| 0 0| 21 1 | 952 2
SEXL/ASSLT/AGN/PERS/| 0 0| 5 0| 0 0| 0 0| 5 0 | 0 0| 0 0| 0 0| 0 0| 0 0 | 5 0
SOLICIT SODOMY FROM | 0 0| 1 0| 0 0| 0 0| 1 0 | 0 0| 0 0| 0 0| 0 0| 0 0 | 1 0
CRIMINAL ATTPT RAPE | 3 0| 39 0| 8 0| 2 0| 52 0 | 0 0| 0 0| 0 0| 0 0| 0 0 | 52 0
CRIMINAL ATTPT SODOM| 0 0| 1 0| 0 0| 0 0| 1 0 | 0 0| 0 0| 0 0| 0 0| 0 0 | 1 0
CRIMINAL ATTPT AGG S| 0 0| 1 0| 2 0| 0 0| 3 0 | 0 0| 0 0| 0 0| 0 0| 0 0 | 3 0
MISC. OBSCENITY
| 0 0| 0 0| 2 0| 0 0| 2 0 | 0 0| 0 0| 0 0| 0 0| 0 0 | 2 0
MISC. PUBLIC ORDER | 0 0| 1 0| 1 0| 0 0| 2 0 | 0 0| 0 0| 0 0| 0 0| 0 0 | 2 0
FALSE SWEARNG WRITTN| 0 0| 1 0| 0 0| 0 0| 1 0 | 0 0| 0 0| 0 0| 0 0| 0 0 | 1 0
BRIBERY GOVT OFFICER| 0 0| 3 0| 0 0| 0 0| 3 0 | 0 0| 0 0| 0 0| 0 0| 0 0 | 3 0
VIOLATE OATH PUBLIC | 0 0| 1 0| 0 0| 0 0| 1 0 | 0 0| 0 0| 0 0| 0 0| 0 0 | 1 0
DEFRAUDING STATE | 0 0| 0 0| 1 0| 1 0| 2 0 | 0 0| 2 0| 1 0| 0 0| 3 0 | 5 0
FALSE CERTIFICATES | 0 0| 1 0| 0 0| 0 0| 1 0 | 0 0| 0 0| 0 0| 0 0| 0 0 | 1 0
INFLUENCING WITNESS | 0 0| 3 0| 1 0| 0 0| 4 0 | 0 0| 0 0| 0 0| 0 0| 0 0 | 4 0
OBSTR OF LAW ENF OFF| 73 2| 566 2| 133 1| 6 0| 778 2 | 2 1| 26 2| 15 2| 0 0| 43 2 | 821 2
PERJURY
| 0 0| 2 0| 0 0| 1 0| 3 0 | 0 0| 1 0| 0 0| 0 0| 1 0 | 4 0
FALSE SWEARING
| 0 0| 1 0| 0 0| 0 0| 1 0 | 0 0| 0 0| 0 0| 0 0| 0 0 | 1 0
IMPERSONATING OFFIC| 0 0| 2 0| 1 0| 0 0| 3 0 | 0 0| 0 0| 0 0| 0 0| 0 0 | 3 0
FALSE STATEMENTS GOV| 1 0| 18 0| 7 0| 0 0| 26 0 | 0 0| 1 0| 1 0| 0 0| 2 0 | 28 0
IMPRSNTNG ANTHR RBAL| 0 0| 1 0| 0 0| 0 0| 1 0 | 0 0| 0 0| 0 0| 0 0| 0 0 | 1 0
ESCAPE
| 8 0| 65 0| 23 0| 2 0| 98 0 | 0 0| 3 0| 0 0| 0 0| 3 0 | 101 0
AIDING ESCAPE
| 0 0| 0 0| 1 0| 0 0| 1 0 | 1 1| 0 0| 0 0| 0 0| 1 0 | 2 0
HINDERING APPREH OR | 3 0| 5 0| 1 0| 0 0| 9 0 | 0 0| 0 0| 2 0| 0 0| 2 0 | 11 0
MUTINY IN PENAL INST| 0 0| 1 0| 0 0| 0 0| 1 0 | 0 0| 0 0| 0 0| 0 0| 0 0 | 1 0
BAIL JUMPING
| 0 0| 2 0| 0 0| 0 0| 2 0 | 0 0| 0 0| 0 0| 0 0| 0 0 | 2 0
CRIMINAL ATTEMPT ESC| 1 0| 0 0| 0 0| 0 0| 1 0 | 0 0| 0 0| 0 0| 0 0| 0 0 | 1 0
FALSE PUBLIC ALARM | 0 0| 1 0| 0 0| 0 0| 1 0 | 0 0| 0 0| 0 0| 0 0| 0 0 | 1 0
------------------------------------------------------------------------------------------------------------------------------------
(continued)
Georgia Dept. of Corrections
5/2000
55
Page 50 Run 05/15/00
Georgia Department of Corrections Office of Planning and Analysis
Inmate statistical profile
Sample: ACTIVE PRISONERS EXCLUDING JAIL
Requestor: Statistics
Active inmates 05/15/2000
Most Serious Offense by current age & sex
(CONTINUED)
|
MEN
|
WOMEN
|
| Age | Age | Age | Age | Men
| Age | Age | Age | Age |Women
|Grand
Most Serious Offense|00-21 %|22-39 %|40-54 %|55-99 %|Total % |00-21 %|22-39 %|40-54 %|55-99 %|Total % |Total %
------------------------------------------------------------------------------------------------------------------------------------
CRIM INTER WITH GOVT| 0 0| 31 0| 3 0| 0 0| 34 0 | 1 1| 0 0| 1 0| 0 0| 2 0 | 36 0
COMMERICAL GAMBLING | 0 0| 0 0| 0 0| 1 0| 1 0 | 0 0| 0 0| 0 0| 0 0| 0 0 | 1 0
SOLICIT/ACCEPTING BR| 0 0| 1 0| 0 0| 0 0| 1 0 | 0 0| 1 0| 0 0| 0 0| 1 0 | 2 0
BUS HIJACKING
| 0 0| 2 0| 0 0| 0 0| 2 0 | 0 0| 0 0| 0 0| 0 0| 0 0 | 2 0
CRUELTY TO CHILDREN | 12 0| 166 1| 43 0| 9 1| 230 1 | 4 2| 62 4| 6 1| 0 0| 72 3 | 302 1
SEX EXPLOITATION CHI| 0 0| 2 0| 6 0| 2 0| 10 0 | 0 0| 0 0| 0 0| 0 0| 0 0 | 10 0
ABANDONMENT OF CHILD| 0 0| 0 0| 1 0| 0 0| 1 0 | 0 0| 0 0| 0 0| 0 0| 0 0 | 1 0
CNTRBTNG DELINQENCY | 0 0| 0 0| 0 0| 0 0| 0 0 | 0 0| 0 0| 1 0| 0 0| 1 0 | 1 0
MISC WEAPON/EXPLOSIV| 2 0| 1 0| 1 0| 0 0| 4 0 | 0 0| 0 0| 0 0| 0 0| 0 0 | 4 0
CARRY CONCEALED WEAP| 1 0| 7 0| 1 0| 0 0| 9 0 | 0 0| 0 0| 0 0| 0 0| 0 0 | 9 0
POSS OF FIREARM DUR | 1 0| 7 0| 3 0| 1 0| 12 0 | 0 0| 0 0| 0 0| 0 0| 0 0 | 12 0
POSS OF CERTAIN WEAP| 0 0| 14 0| 4 0| 2 0| 20 0 | 0 0| 0 0| 0 0| 0 0| 0 0 | 20 0
POSS FIREARM CONVCT | 3 0| 92 0| 35 0| 4 0| 134 0 | 0 0| 1 0| 0 0| 0 0| 1 0 | 135 0
CARRYING WEAPON AT S| 2 0| 6 0| 0 0| 0 0| 8 0 | 0 0| 1 0| 0 0| 0 0| 1 0 | 9 0
PEEPING TOM
| 3 0| 9 0| 8 0| 1 0| 21 0 | 0 0| 0 0| 0 0| 0 0| 0 0 | 21 0
RACKETEERING
| 1 0| 5 0| 8 0| 1 0| 15 0 | 0 0| 2 0| 1 0| 0 0| 3 0 | 18 0
S/D NARCOTICS, OPIAT| 1 0| 82 0| 43 0| 6 0| 132 0 | 0 0| 5 0| 2 0| 1 2| 8 0 | 140 0
S/D DEP,STIM,CNTRF D| 3 0| 44 0| 13 0| 1 0| 61 0 | 0 0| 2 0| 1 0| 1 2| 4 0 | 65 0
SALE-DIST OF LSD | 2 0| 1 0| 0 0| 0 0| 3 0 | 0 0| 0 0| 0 0| 0 0| 0 0 | 3 0
SALE/DIST OF MARIJUA| 18 0| 178 1| 82 1| 10 1| 288 1 | 1 1| 12 1| 4 1| 2 3| 19 1 | 307 1
POSS NARCOTICS, OPIA| 6 0| 118 0| 53 1| 4 0| 181 0 | 0 0| 14 1| 8 1| 1 2| 23 1 | 204 0
POSS DEP,STIM,CNTRF | 5 0| 75 0| 42 0| 3 0| 125 0 | 1 1| 11 1| 2 0| 2 3| 16 1 | 141 0
POSS OF L.S.D.
| 0 0| 4 0| 0 0| 0 0| 4 0 | 0 0| 0 0| 1 0| 0 0| 1 0 | 5 0
POSS OF MARIJUANA | 26 1| 172 1| 50 1| 9 1| 257 1 | 1 1| 14 1| 0 0| 2 3| 17 1 | 274 1
ILLEGAL ATTM TO OBT | 0 0| 1 0| 2 0| 0 0| 3 0 | 0 0| 3 0| 3 0| 0 0| 6 0 | 9 0
VIOLATE GA CNTRL SBS| 1 0| 59 0| 18 0| 0 0| 78 0 | 0 0| 4 0| 3 0| 0 0| 7 0 | 85 0
VIOLATE DNGROUS DRGS| 0 0| 2 0| 0 0| 0 0| 2 0 | 0 0| 0 0| 0 0| 0 0| 0 0 | 2 0
UNLWFL MFG/DEL/DIST | 3 0| 20 0| 12 0| 0 0| 35 0 | 0 0| 2 0| 0 0| 0 0| 2 0 | 37 0
POSS DRUG RELATED MA| 0 0| 2 0| 2 0| 0 0| 4 0 | 0 0| 0 0| 0 0| 0 0| 0 0 | 4 0
SALE/DIST CONT SUB P| 13 0| 29 0| 8 0| 0 0| 50 0 | 1 1| 2 0| 0 0| 0 0| 3 0 | 53 0
SALE/DIST CONT SUB S| 2 0| 19 0| 3 0| 0 0| 24 0 | 0 0| 0 0| 0 0| 0 0| 0 0 | 24 0
SALE/DISTRIBUTION CO| 127 3| 1382 6| 518 5| 32 2| 2059 5 | 4 2| 120 7| 33 5| 4 6| 161 6 | 2220 5
POSSESSION OF COCAIN| 195 5| 1491 6| 535 5| 42 3| 2263 6 | 10 6| 154 9| 62 9| 3 5| 229 9 | 2492 6
CRMNL ATPT VIOL SUBS| 1 0| 18 0| 7 0| 1 0| 27 0 | 0 0| 1 0| 1 0| 0 0| 2 0 | 29 0
MISC. DRUGS TRAFFICK| 8 0| 116 0| 34 0| 2 0| 160 0 | 1 1| 12 1| 8 1| 0 0| 21 1 | 181 0
------------------------------------------------------------------------------------------------------------------------------------
(continued)
Georgia Dept. of Corrections
5/2000
56
Page 51 Run 05/15/00
Georgia Department of Corrections Office of Planning and Analysis
Inmate statistical profile
Sample: ACTIVE PRISONERS EXCLUDING JAIL
Requestor: Statistics
Active inmates 05/15/2000
Most Serious Offense by current age & sex
(CONTINUED)
|
MEN
|
WOMEN
|
| Age | Age | Age | Age | Men
| Age | Age | Age | Age |Women
|Grand
Most Serious Offense|00-21 %|22-39 %|40-54 %|55-99 %|Total % |00-21 %|22-39 %|40-54 %|55-99 %|Total % |Total %
------------------------------------------------------------------------------------------------------------------------------------
COCAINE LESS 200 GRA| 11 0| 327 1| 98 1| 20 1| 456 1 | 0 0| 14 1| 9 1| 0 0| 23 1 | 479 1
COCAINE 201-400 GRAM| 0 0| 45 0| 11 0| 1 0| 57 0 | 0 0| 4 0| 3 0| 1 2| 8 0 | 65 0
COCAINE 401 OR MORE | 2 0| 86 0| 26 0| 3 0| 117 0 | 1 1| 8 0| 1 0| 0 0| 10 0 | 127 0
NARCOTICS LESS 14 GR| 0 0| 1 0| 2 0| 0 0| 3 0 | 0 0| 0 0| 0 0| 0 0| 0 0 | 3 0
NARCOTICS 15-28 GRAM| 0 0| 2 0| 0 0| 0 0| 2 0 | 0 0| 0 0| 0 0| 0 0| 0 0 | 2 0
NARCOTICS 29 MORE GR| 0 0| 5 0| 2 0| 0 0| 7 0 | 0 0| 0 0| 0 0| 0 0| 0 0 | 7 0
MARIJUANA 101-2000 P| 1 0| 8 0| 6 0| 1 0| 16 0 | 0 0| 1 0| 0 0| 0 0| 1 0 | 17 0
MARIJUANA 2001-10000| 0 0| 1 0| 0 0| 0 0| 1 0 | 0 0| 0 0| 0 0| 0 0| 0 0 | 1 0
TRFFKNG MTHAQUALONE>| 0 0| 1 0| 0 0| 0 0| 1 0 | 0 0| 0 0| 0 0| 0 0| 0 0 | 1 0
AMPHETAMINE 28-199 G| 0 0| 13 0| 12 0| 1 0| 26 0 | 0 0| 1 0| 1 0| 0 0| 2 0 | 28 0
AMPHETAMINE 200-399 | 0 0| 4 0| 0 0| 0 0| 4 0 | 0 0| 1 0| 0 0| 0 0| 1 0 | 5 0
AMPHETAMINE 400+ GRA| 0 0| 8 0| 0 0| 0 0| 8 0 | 0 0| 1 0| 0 0| 0 0| 1 0 | 9 0
USE COMM FACLTY VIO | 0 0| 3 0| 2 0| 0 0| 5 0 | 0 0| 0 0| 0 0| 0 0| 0 0 | 5 0
ATT/CONSPRCY COMMT C| 0 0| 16 0| 3 0| 1 0| 20 0 | 0 0| 2 0| 1 0| 0 0| 3 0 | 23 0
ILLGL DIST CONTRLLD | 0 0| 0 0| 1 0| 0 0| 1 0 | 0 0| 0 0| 0 0| 0 0| 0 0 | 1 0
VIOL MOTOR VEHICLE L| 2 0| 68 0| 42 0| 3 0| 115 0 | 0 0| 9 1| 2 0| 0 0| 11 0 | 126 0
DRVNG HABTL VIOLATOR| 0 0| 229 1| 212 2| 31 2| 472 1 | 0 0| 7 0| 4 1| 1 2| 12 0 | 484 1
HABIT TRAF VOIL/IMPA| 0 0| 4 0| 9 0| 2 0| 15 0 | 0 0| 0 0| 0 0| 0 0| 0 0 | 15 0
HABIT TRAF VIOL/OTHE| 0 0| 2 0| 0 0| 0 0| 2 0 | 0 0| 0 0| 0 0| 0 0| 0 0 | 2 0
MISC. MRALS/PBLIC H/| 1 0| 1 0| 1 0| 0 0| 3 0 | 0 0| 0 0| 0 0| 0 0| 0 0 | 3 0
MISC CORRECTIONL INS| 0 0| 3 0| 2 0| 0 0| 5 0 | 0 0| 0 0| 0 0| 0 0| 0 0 | 5 0
VIOLATION OTHR STATE| 0 0| 1 0| 1 0| 0 0| 2 0 | 0 0| 0 0| 0 0| 0 0| 0 0 | 2 0
CONSPIRACY
| 21 1| 50 0| 12 0| 4 0| 87 0 | 2 1| 12 1| 2 0| 0 0| 16 1 | 103 0
CRIMINAL ATTEMPT | 4 0| 29 0| 5 0| 2 0| 40 0 | 0 0| 1 0| 1 0| 0 0| 2 0 | 42 0
AIRCRAFT HIJACKING | 0 0| 1 0| 0 0| 0 0| 1 0 | 0 0| 0 0| 0 0| 0 0| 0 0 | 1 0
CRIMINAL SOLICITATIO| 0 0| 5 0| 4 0| 0 0| 9 0 | 0 0| 0 0| 0 0| 0 0| 0 0 | 9 0
PARTY TO A CRIME | 1 0| 7 0| 4 0| 0 0| 12 0 | 1 1| 0 0| 0 0| 0 0| 1 0 | 13 0
CRIMINAL TRESPASSING| 0 0| 1 0| 1 0| 0 0| 2 0 | 0 0| 0 0| 0 0| 0 0| 0 0 | 2 0
GANG PARTICIPATION | 1 0| 0 0| 0 0| 0 0| 1 0 | 0 0| 0 0| 0 0| 0 0| 0 0 | 1 0
------------------------------------------------------------------------------------------------------------------------------------
(continued)
Georgia Dept. of Corrections
5/2000
57
Page 52 Run 05/15/00
Georgia Department of Corrections Office of Planning and Analysis
Inmate statistical profile
Sample: ACTIVE PRISONERS EXCLUDING JAIL
Requestor: Statistics
Active inmates 05/15/2000
Most Serious Offense by current age & sex
(CONTINUED)
|
MEN
|
WOMEN
|
| Age | Age | Age | Age | Men
| Age | Age | Age | Age |Women
|Grand
Most Serious Offense|00-21 %|22-39 %|40-54 %|55-99 %|Total % |00-21 %|22-39 %|40-54 %|55-99 %|Total % |Total %
------------------------------------------------------------------------------------------------------------------------------------
------------------------------------------------------------------------------------------------------------------------------------
Total reported
| 3790 100|24964 100| 9887 100| 1429 100|40070 100 | 171 100| 1672 100| 656 100| 65 100| 2564 100 |42634 100
|
|
|
|
|
|
|
|
|
|
|
Percent reported |
97.3|
98.8|
98.5|
99.2|
98.6 |
96.1|
96.6|
97.8|
98.5|
96.9 |
98.5
|
|
|
|
|
|
|
|
|
|
|
|
|
|
|
|
|
|
|
|
|
|
NOT REPORTED
| 107 | 301 | 152 | 11 | 571
| 7 | 59 | 15 | 1 | 82
| 653
------------------------------------------------------------------------------------------------------------------------------------
Total
| 3897 |25265 |10039 | 1440 |40641
| 178 | 1731 | 671 | 66 | 2646
|43287
Georgia Dept. of Corrections
5/2000
58
Page 53 Run 05/15/00
Georgia Department of Corrections Office of Planning and Analysis
Inmate statistical profile
Sample: ACTIVE PRISONERS EXCLUDING JAIL Active inmates 05/15/2000
Requestor: Statistics Most Serious Crime Type by current age & sex
|
MEN
|
WOMEN
|
| Age | Age | Age | Age | Men
| Age | Age | Age | Age |Women
|Grand
Crime Type
|00-21 %|22-39 %|40-54 %|55-99 %|Total % |00-21 %|22-39 %|40-54 %|55-99 %|Total % |Total %
------------------------------------------------------------------------------------------------------------------------------------
VIOL/PERSN
| 1998 53|10922 44| 3977 40| 633 44|17530 44 | 87 51| 588 35| 230 35| 39 60| 944 37 |18474 43
NVIOL/PERS
| 3 0| 17 0| 5 0| 2 0| 27 0 | 0 0| 1 0| 0 0| 0 0| 1 0 | 28 0
PROPERTY
| 959 25| 5647 23| 2014 20| 119 8| 8739 22 | 51 30| 590 35| 234 36| 8 12| 883 34 | 9622 23
DRUG SALES
| 191 5| 2391 10| 876 9| 78 5| 3536 9 | 8 5| 187 11| 63 10| 9 14| 267 10 | 3803 9
DRUG POSSN
| 234 6| 1946 8| 710 7| 59 4| 2949 7 | 12 7| 201 12| 80 12| 8 12| 301 12 | 3250 8
ALCOHOL
| 0 0| 0 0| 0 0| 0 0| 0 0 | 0 0| 0 0| 0 0| 0 0| 0 0 | 0 0
HABIT/DUI
| 2 0| 310 1| 269 3| 37 3| 618 2 | 0 0| 18 1| 7 1| 1 2| 26 1 | 644 2
SEX OFFEND
| 274 7| 2790 11| 1780 18| 477 33| 5321 13 | 6 4| 40 2| 19 3| 0 0| 65 3 | 5386 13
OTHER
| 129 3| 941 4| 256 3| 24 2| 1350 3 | 7 4| 47 3| 23 4| 0 0| 77 3 | 1427 3
------------------------------------------------------------------------------------------------------------------------------------
Total reported
| 3790 100|24964 100| 9887 100| 1429 100|40070 100 | 171 100| 1672 100| 656 100| 65 100| 2564 100 |42634 100
|
|
|
|
|
|
|
|
|
|
|
Percent reported |
97.3|
98.8|
98.5|
99.2|
98.6 |
96.1|
96.6|
97.8|
98.5|
96.9 |
98.5
|
|
|
|
|
|
|
|
|
|
|
|
|
|
|
|
|
|
|
|
|
|
NOT REPORTED
| 107 | 301 | 152 | 11 | 571
| 7 | 59 | 15 | 1 | 82
| 653
------------------------------------------------------------------------------------------------------------------------------------
Total
| 3897 |25265 |10039 | 1440 |40641
| 178 | 1731 | 671 | 66 | 2646
|43287
Georgia Dept. of Corrections
5/2000
59
Georgia Dept. of Corrections
5/2000
60