- Collection:
- Georgia Government Publications
- Title:
- Female inmate population, 2000-05-01
- Creator:
- Georgia. Department of Corrections. Planning and Analysis Section
- Publisher:
- Atlanta, GA. : Georgia Dept. of Corrections, Office of Planning and Analysis, 2000-05-01
- Date of Original:
- 2000-05-01
- Subject:
- Prisoners--Georgia
- Location:
- United States, Georgia, 32.75042, -83.50018
- Medium:
- state government records
- Type:
- Text
- Format:
- application/pdf
- External Identifiers:
- Call Number GA R300.P5 P1 F4 2000/5
- Metadata URL:
- https://dlg.galileo.usg.edu/id:dlg_ggpd_i-ga-br300-pp5-bp1-bf4-b2000-s5-belec-p-btext
- Digital Object URL:
- https://dlg.galileo.usg.edu/do:dlg_ggpd_i-ga-br300-pp5-bp1-bf4-b2000-s5-belec-p-btext
- Language:
- eng
- Holding Institution:
- University of Georgia. Map and Government Information Library
- Rights:
-

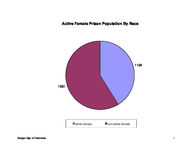
Active Female Prison Population By Race
1581
1104
white female
non-white female
Georgia Dept. of Corrections
1
Active Female Prison Population By Security Status
182
8 120
107
809 1459
trusty
minimum
medium
close
maximum
diagnostic
Georgia Dept. of Corrections
2
Years
Active Female Prison Population By Sentence In Years
LWOP 2 Death 1
Life 20.1-Over
15.1-20 12.1-15 10.1-12
9.1-10 8.1-9 7.1-8 6.1-7 5.1-6 4.1-5 3.1-4 2.1-3 1.1-2 0-1
32 23
0
50
236 172 156 122
96 100
119
168 272
201 92
100
150
200
250
300
Number of Females
342
350
400
451
450
500
Georgia Dept. of Corrections
3
Active Female Prison Population With Probation Following Prison
842
1843
Georgia Dept. of Corrections
Probation to Follow
No Probation
4
Active Female Prison Population By Institution Group
188
2497
Transitional Centers
State Prisons
Georgia Dept. of Corrections
5
Number of Inmates
Active Female Prison Population By Crime Group
1000
942
897
900
800
700
600
500
400
300
200
100
0
viol/persn
Georgia Dept. of Corrections
property
313 267
27
drug sales
drug possn
Crime Group
habit/dui
64 sex offend
76 others
6
Page 1 Run 05/01/00
Georgia Department of Corrections Office of Planning and Analysis
Inmate statistical profile TABLE OF CONTENTS FOR ACTIVE PRISONERS EXCLUDING JAIL FEMALES ONLY
TITLE ----RACE AND SEX............................ 2 Culture Fair IQ Scores.................. 3 Self-Rpt Socioeconomic Class............ 4 Self-Rpt Environment To Age 16.......... 5 Self-Rpt Education Level................ 6 Functional Reading Level (WRAT Scores).. 7 Functional Math Level (WRAT Scores)..... 8 Functional Spelling Level (WRAT Scores). 9 Self-Rpt Guardian Status To Age 16......10 Self-Rpt Employment Status Before Prison11 Self-Rpt Marital Status At Admission....12 Self-Rpt Number Of Children At Admission13 Self-Rpt Religious Affiliation..........14 Self-Rpt Family Behavior Patterns *.....15 Inmate Diagnostic Behavior Problem *....16 Physical Profile (General Condition)....17 Security Status.........................18 Number Of Sentences.....................19 Number Of Disciplinaries................20 Number Of Escapes.......................21 Number Of Prior Georgia Incarcerations *22 Number Of Transfers.....................23 County Of Conviction....................24 Circuit Of Conviction...................29 Home County.............................31 Prison Sentence In Years................36 Probation To Follow Prison..............37 Admission Type..........................38 Release Type............................39 Inst By Group...........................40 Institution.............................41 Misdemeanors And Felonies...............42 Crimes By Group.........................43 Most Serious Offense....................44 Most Serious Crime Type.................48
PAGE ----
Georgia Dept. of Corrections
7
Page
2 Run 05/01/00
Georgia Department of Corrections Office of Planning and Analysis
FEMALES ONLY Inmate statistical profile
Sample: ACTIVE PRISONERS EXCLUDING JAIL Active inmates 05/01/2000
Requestor: Statistics RACE AND SEX by current age & sex
|
MEN
|
WOMEN
|
| Age | Age | Age | Age | Men
| Age | Age | Age | Age |Women
|Grand
RACE AND SEX
|00-21 %|22-39 %|40-54 %|55-99 %|Total % |00-21 %|22-39 %|40-54 %|55-99 %|Total % |Total %
------------------------------------------------------------------------------------------------------------------------------------
WHITE MALE
| 0 0| 0 0| 0 0| 0 0| 0 0 | 0 0| 0 0| 0 0| 0 0| 0 0 | 0 0
NON WHITE MALE
| 0 0| 0 0| 0 0| 0 0| 0 0 | 0 0| 0 0| 0 0| 0 0| 0 0 | 0 0
WHITE FEMALE
| 0 0| 0 0| 0 0| 0 0| 0 0 | 85 46| 705 40| 277 41| 37 56| 1104 41 | 1104 41
NON WHITE FEMALE | 0 0| 0 0| 0 0| 0 0| 0 0 | 99 54| 1048 60| 405 59| 29 44| 1581 59 | 1581 59
------------------------------------------------------------------------------------------------------------------------------------
Total reported
| 0 0| 0 0| 0 0| 0 0| 0 0 | 184 100| 1753 100| 682 100| 66 100| 2685 100 | 2685 100
|
|
|
|
|
|
|
|
|
|
|
Percent reported |
.0|
.0|
.0|
.0|
.0 | 100.0| 100.0| 100.0| 100.0| 100.0 | 100.0
|
|
|
|
|
|
|
|
|
|
|
|
|
|
|
|
|
|
|
|
|
|
NOT REPORTED
|0|0|0|0|0
|0|0|0|0|0
|0
------------------------------------------------------------------------------------------------------------------------------------
Total
|0|0|0|0|0
| 184 | 1753 | 682 | 66 | 2685
| 2685
|
|
|
|
|
|
|
|
|
|
|
|
|
|
|
|
|
|
|
|
|
|
|
|
|
|
|
|
|
|
|
|
|
|
|
|
|
|
|
|
|
|
|
|
|
|
|
|
|
|
|
|
|
|
|
AVERAGE AGE
| .00 | .00 | .00 | .00 | .00 | 19.83 | 31.43 | 44.36 | 59.55 | 34.61 | 34.61
Georgia Dept. of Corrections
8
Page
3 Run 05/01/00
Georgia Department of Corrections Office of Planning and Analysis
FEMALES ONLY Inmate statistical profile
Sample: ACTIVE PRISONERS EXCLUDING JAIL Active inmates 05/01/2000
Requestor: Statistics Culture Fair IQ Scores by current age & sex
|
MEN
|
WOMEN
|
| Age | Age | Age | Age | Men
| Age | Age | Age | Age |Women
|Grand
IQ Score
|00-21 %|22-39 %|40-54 %|55-99 %|Total % |00-21 %|22-39 %|40-54 %|55-99 %|Total % |Total %
------------------------------------------------------------------------------------------------------------------------------------
LESS THAN 70
| 0 0| 0 0| 0 0| 0 0| 0 0 | 7 4| 209 13| 187 29| 20 34| 423 17 | 423 17
70 AND UP
| 0 0| 0 0| 0 0| 0 0| 0 0 | 166 96| 1460 87| 463 71| 39 66| 2128 83 | 2128 83
------------------------------------------------------------------------------------------------------------------------------------
Total reported
| 0 0| 0 0| 0 0| 0 0| 0 0 | 173 100| 1669 100| 650 100| 59 100| 2551 100 | 2551 100
|
|
|
|
|
|
|
|
|
|
|
Percent reported |
.0|
.0|
.0|
.0|
.0 |
94.0|
95.2|
95.3|
89.4|
95.0 |
95.0
|
|
|
|
|
|
|
|
|
|
|
|
|
|
|
|
|
|
|
|
|
|
NOT REPORTED
|0|0|0|0|0
| 11 | 84 | 32 | 7 | 134
| 134
------------------------------------------------------------------------------------------------------------------------------------
Total
|0|0|0|0|0
| 184 | 1753 | 682 | 66 | 2685
| 2685
|
|
|
|
|
|
|
|
|
|
|
|
|
|
|
|
|
|
|
|
|
|
|
|
|
|
|
|
|
|
|
|
|
|
|
|
|
|
|
|
|
|
|
|
|
|
|
|
|
|
|
|
|
|
|
AVERAGE IQ
| .00 | .00 | .00 | .00 | .00 | 100.01 | 92.45 | 84.59 | 80.14 | 90.68 | 90.68
Georgia Dept. of Corrections
9
Page
4 Run 05/01/00
Georgia Department of Corrections Office of Planning and Analysis
FEMALES ONLY Inmate statistical profile
Sample: ACTIVE PRISONERS EXCLUDING JAIL
Requestor: Statistics
Active inmates 05/01/2000
Self-Rpt Socioeconomic Class by current age & sex
|
MEN
|
WOMEN
|
| Age | Age | Age | Age | Men
| Age | Age | Age | Age |Women
|Grand
Socioeconomic Class |00-21 %|22-39 %|40-54 %|55-99 %|Total % |00-21 %|22-39 %|40-54 %|55-99 %|Total % |Total %
------------------------------------------------------------------------------------------------------------------------------------
WELFARE
| 0 0| 0 0| 0 0| 0 0| 0 0 | 34 19| 259 15| 60 9| 2 3| 355 14 | 355 14
OCC EMPLOY
| 0 0| 0 0| 0 0| 0 0| 0 0 | 1 1| 14 1| 6 1| 3 5| 24 1 | 24 1
MINIMUM STD
| 0 0| 0 0| 0 0| 0 0| 0 0 | 48 27| 630 37| 278 41| 32 52| 988 38 | 988 38
MIDDLE
| 0 0| 0 0| 0 0| 0 0| 0 0 | 87 49| 753 44| 305 45| 22 35| 1167 45 | 1167 45
OTHER
| 0 0| 0 0| 0 0| 0 0| 0 0 | 8 4| 51 3| 22 3| 3 5| 84 3 | 84 3
------------------------------------------------------------------------------------------------------------------------------------
Total reported
| 0 0| 0 0| 0 0| 0 0| 0 0 | 178 100| 1707 100| 671 100| 62 100| 2618 100 | 2618 100
|
|
|
|
|
|
|
|
|
|
|
Percent reported |
.0|
.0|
.0|
.0|
.0 |
96.7|
97.4|
98.4|
93.9|
97.5 |
97.5
|
|
|
|
|
|
|
|
|
|
|
|
|
|
|
|
|
|
|
|
|
|
NOT RPTD
|0|0|0|0|0
| 6 | 46 | 11 | 4 | 67
| 67
------------------------------------------------------------------------------------------------------------------------------------
Total
|0|0|0|0|0
| 184 | 1753 | 682 | 66 | 2685
| 2685
Georgia Dept. of Corrections
10
Page
5 Run 05/01/00
Georgia Department of Corrections Office of Planning and Analysis
FEMALES ONLY Inmate statistical profile
Sample: ACTIVE PRISONERS EXCLUDING JAIL
Requestor: Statistics
Active inmates 05/01/2000
Self-Rpt Environment To Age 16 by current age & sex
|
MEN
|
WOMEN
|
| Age | Age | Age | Age | Men
| Age | Age | Age | Age |Women
|Grand
Environment
|00-21 %|22-39 %|40-54 %|55-99 %|Total % |00-21 %|22-39 %|40-54 %|55-99 %|Total % |Total %
------------------------------------------------------------------------------------------------------------------------------------
RURAL/FARM
| 0 0| 0 0| 0 0| 0 0| 0 0 | 2 1| 59 3| 51 8| 14 23| 126 5 | 126 5
RURAL/NFARM
| 0 0| 0 0| 0 0| 0 0| 0 0 | 17 10| 161 9| 46 7| 3 5| 227 9 | 227 9
S.M.S.A
| 0 0| 0 0| 0 0| 0 0| 0 0 | 38 21| 343 20| 147 22| 11 18| 539 21 | 539 21
URBAN
| 0 0| 0 0| 0 0| 0 0| 0 0 | 57 32| 437 25| 199 30| 9 15| 702 27 | 702 27
SMALL TOWN
| 0 0| 0 0| 0 0| 0 0| 0 0 | 60 34| 694 40| 218 32| 21 35| 993 38 | 993 38
OTHER
| 0 0| 0 0| 0 0| 0 0| 0 0 | 4 2| 21 1| 10 1| 2 3| 37 1 | 37 1
------------------------------------------------------------------------------------------------------------------------------------
Total reported
| 0 0| 0 0| 0 0| 0 0| 0 0 | 178 100| 1715 100| 671 100| 60 100| 2624 100 | 2624 100
|
|
|
|
|
|
|
|
|
|
|
Percent reported |
.0|
.0|
.0|
.0|
.0 |
96.7|
97.8|
98.4|
90.9|
97.7 |
97.7
|
|
|
|
|
|
|
|
|
|
|
|
|
|
|
|
|
|
|
|
|
|
NOT RPTD
|0|0|0|0|0
| 6 | 38 | 11 | 6 | 61
| 61
------------------------------------------------------------------------------------------------------------------------------------
Total
|0|0|0|0|0
| 184 | 1753 | 682 | 66 | 2685
| 2685
Georgia Dept. of Corrections
11
Page
6 Run 05/01/00
Georgia Department of Corrections Office of Planning and Analysis
FEMALES ONLY Inmate statistical profile
Sample: ACTIVE PRISONERS EXCLUDING JAIL Active inmates 05/01/2000
Requestor: Statistics Self-Rpt Education Level by current age & sex
|
MEN
|
WOMEN
|
| Age | Age | Age | Age | Men
| Age | Age | Age | Age |Women
|Grand
Education Level
|00-21 %|22-39 %|40-54 %|55-99 %|Total % |00-21 %|22-39 %|40-54 %|55-99 %|Total % |Total %
------------------------------------------------------------------------------------------------------------------------------------
LESS THAN GRADE 7 | 0 0| 0 0| 0 0| 0 0| 0 0 | 2 1| 20 1| 20 3| 13 21| 55 2 | 55 2
GRADE 7
| 0 0| 0 0| 0 0| 0 0| 0 0 | 5 3| 49 3| 18 3| 1 2| 73 3 | 73 3
GRADE 8
| 0 0| 0 0| 0 0| 0 0| 0 0 | 25 14| 141 8| 55 8| 3 5| 224 9 | 224 9
GRADE 9
| 0 0| 0 0| 0 0| 0 0| 0 0 | 39 22| 237 14| 62 9| 3 5| 341 13 | 341 13
GRADE 10
| 0 0| 0 0| 0 0| 0 0| 0 0 | 45 26| 276 16| 81 12| 9 14| 411 16 | 411 16
GRADE 11
| 0 0| 0 0| 0 0| 0 0| 0 0 | 36 20| 286 17| 79 12| 5 8| 406 16 | 406 16
GRADE 12
| 0 0| 0 0| 0 0| 0 0| 0 0 | 11 6| 292 17| 144 22| 13 21| 460 18 | 460 18
MORE THAN GRADE 12 | 0 0| 0 0| 0 0| 0 0| 0 0 | 13 7| 388 23| 197 30| 16 25| 614 24 | 614 24
------------------------------------------------------------------------------------------------------------------------------------
Total reported
| 0 0| 0 0| 0 0| 0 0| 0 0 | 176 100| 1689 100| 656 100| 63 100| 2584 100 | 2584 100
|
|
|
|
|
|
|
|
|
|
|
Percent reported |
.0|
.0|
.0|
.0|
.0 |
95.7|
96.3|
96.2|
95.5|
96.2 |
96.2
|
|
|
|
|
|
|
|
|
|
|
|
|
|
|
|
|
|
|
|
|
|
NOT REPORTED
|0|0|0|0|0
| 8 | 64 | 26 | 3 | 101
| 101
------------------------------------------------------------------------------------------------------------------------------------
Total
|0|0|0|0|0
| 184 | 1753 | 682 | 66 | 2685
| 2685
|
|
|
|
|
|
|
|
|
|
|
|
|
|
|
|
|
|
|
|
|
|
|
|
|
|
|
|
|
|
|
|
|
|
|
|
|
|
|
|
|
|
|
|
|
|
|
|
|
|
|
|
|
|
|
AVG EDUCATION LEVEL | .00 | .00 | .00 | .00 | .00 | 10.59 | 12.82 | 13.44 | 10.83 | 12.77 | 12.77
* NOTE: THE FIELD LABLED "LESS THAN GRADE 7" WAS CORRECTED IN MARCH 1989: MISSING DATA FOR INMATES STILL IN DIAGNOSTICS NOW HAS BEEN REMOVED FROM THIS FIELD AND IDENTIFIED AS "NOT REPORTED" INFORMATION.
Georgia Dept. of Corrections
12
Page
7 Run 05/01/00
Georgia Department of Corrections Office of Planning and Analysis
FEMALES ONLY Inmate statistical profile
Sample: ACTIVE PRISONERS EXCLUDING JAIL
Requestor: Statistics
Active inmates 05/01/2000
Functional Reading Level (WRAT Scores) by current age & sex
|
MEN
|
WOMEN
|
| Age | Age | Age | Age | Men
| Age | Age | Age | Age |Women
|Grand
WRAT Reading Score |00-21 %|22-39 %|40-54 %|55-99 %|Total % |00-21 %|22-39 %|40-54 %|55-99 %|Total % |Total %
------------------------------------------------------------------------------------------------------------------------------------
LESS THAN GRADE 6 | 0 0| 0 0| 0 0| 0 0| 0 0 | 42 24| 450 27| 219 34| 20 33| 731 29 | 731 29
6TH THRU 8TH GRADE | 0 0| 0 0| 0 0| 0 0| 0 0 | 37 21| 321 19| 108 17| 11 18| 477 19 | 477 19
GRADE 9
| 0 0| 0 0| 0 0| 0 0| 0 0 | 18 10| 126 8| 39 6| 8 13| 191 7 | 191 7
GRADE 10
| 0 0| 0 0| 0 0| 0 0| 0 0 | 10 6| 60 4| 24 4| 2 3| 96 4 | 96 4
GRADE 11
| 0 0| 0 0| 0 0| 0 0| 0 0 | 2 1| 67 4| 26 4| 2 3| 97 4 | 97 4
GRADE 12
| 0 0| 0 0| 0 0| 0 0| 0 0 | 12 7| 130 8| 36 6| 3 5| 181 7 | 181 7
MORE THAN GRADE 12 | 0 0| 0 0| 0 0| 0 0| 0 0 | 52 30| 516 31| 200 31| 14 23| 782 31 | 782 31
------------------------------------------------------------------------------------------------------------------------------------
Total reported
| 0 0| 0 0| 0 0| 0 0| 0 0 | 173 100| 1670 100| 652 100| 60 100| 2555 100 | 2555 100
|
|
|
|
|
|
|
|
|
|
|
Percent reported |
.0|
.0|
.0|
.0|
.0 |
94.0|
95.3|
95.6|
90.9|
95.2 |
95.2
|
|
|
|
|
|
|
|
|
|
|
|
|
|
|
|
|
|
|
|
|
|
NOT REPORTED
|0|0|0|0|0
| 11 | 83 | 30 | 6 | 130
| 130
------------------------------------------------------------------------------------------------------------------------------------
Total
|0|0|0|0|0
| 184 | 1753 | 682 | 66 | 2685
| 2685
|
|
|
|
|
|
|
|
|
|
|
|
|
|
|
|
|
|
|
|
|
|
|
|
|
|
|
|
|
|
|
|
|
|
|
|
|
|
|
|
|
|
|
|
|
|
|
|
|
|
|
|
|
|
|
AVG READING SCORE | .00 | .00 | .00 | .00 | .00 | 9.30 | 9.04 | 8.54 | 8.20 | 8.91 | 8.91
Georgia Dept. of Corrections
13
Page
8 Run 05/01/00
Georgia Department of Corrections Office of Planning and Analysis
FEMALES ONLY Inmate statistical profile
Sample: ACTIVE PRISONERS EXCLUDING JAIL
Requestor: Statistics
Active inmates 05/01/2000
Functional Math Level (WRAT Scores) by current age & sex
|
MEN
|
WOMEN
|
| Age | Age | Age | Age | Men
| Age | Age | Age | Age |Women
|Grand
WRAT Math Score
|00-21 %|22-39 %|40-54 %|55-99 %|Total % |00-21 %|22-39 %|40-54 %|55-99 %|Total % |Total %
------------------------------------------------------------------------------------------------------------------------------------
LESS THAN GRADE 6 | 0 0| 0 0| 0 0| 0 0| 0 0 | 36 21| 451 27| 266 41| 26 43| 779 30 | 779 30
6TH THRU 8TH GRADE | 0 0| 0 0| 0 0| 0 0| 0 0 | 83 48| 815 49| 234 36| 21 35| 1153 45 | 1153 45
GRADE 9
| 0 0| 0 0| 0 0| 0 0| 0 0 | 22 13| 171 10| 45 7| 6 10| 244 10 | 244 10
GRADE 10
| 0 0| 0 0| 0 0| 0 0| 0 0 | 17 10| 114 7| 39 6| 3 5| 173 7 | 173 7
GRADE 11
| 0 0| 0 0| 0 0| 0 0| 0 0 | 10 6| 69 4| 30 5| 2 3| 111 4 | 111 4
GRADE 12
| 0 0| 0 0| 0 0| 0 0| 0 0 | 1 1| 22 1| 15 2| 1 2| 39 2 | 39 2
MORE THAN GRADE 12 | 0 0| 0 0| 0 0| 0 0| 0 0 | 4 2| 28 2| 24 4| 1 2| 57 2 | 57 2
------------------------------------------------------------------------------------------------------------------------------------
Total reported
| 0 0| 0 0| 0 0| 0 0| 0 0 | 173 100| 1670 100| 653 100| 60 100| 2556 100 | 2556 100
|
|
|
|
|
|
|
|
|
|
|
Percent reported |
.0|
.0|
.0|
.0|
.0 |
94.0|
95.3|
95.7|
90.9|
95.2 |
95.2
|
|
|
|
|
|
|
|
|
|
|
|
|
|
|
|
|
|
|
|
|
|
NOT REPORTED
|0|0|0|0|0
| 11 | 83 | 29 | 6 | 129
| 129
------------------------------------------------------------------------------------------------------------------------------------
Total
|0|0|0|0|0
| 184 | 1753 | 682 | 66 | 2685
| 2685
|
|
|
|
|
|
|
|
|
|
|
|
|
|
|
|
|
|
|
|
|
|
|
|
|
|
|
|
|
|
|
|
|
|
|
|
|
|
|
|
|
|
|
|
|
|
|
|
|
|
|
|
|
|
|
AVG MATH SCORE
| .00 | .00 | .00 | .00 | .00 | 7.71 | 7.33 | 6.82 | 6.23 | 7.20 | 7.20
Georgia Dept. of Corrections
14
Page
9 Run 05/01/00
Georgia Department of Corrections Office of Planning and Analysis
FEMALES ONLY Inmate statistical profile
Sample: ACTIVE PRISONERS EXCLUDING JAIL
Requestor: Statistics
Active inmates 05/01/2000
Functional Spelling Level (WRAT Scores) by current age & sex
|
MEN
|
WOMEN
|
| Age | Age | Age | Age | Men
| Age | Age | Age | Age |Women
|Grand
WRAT Spelling Score |00-21 %|22-39 %|40-54 %|55-99 %|Total % |00-21 %|22-39 %|40-54 %|55-99 %|Total % |Total %
------------------------------------------------------------------------------------------------------------------------------------
LESS THAN GRADE 6 | 0 0| 0 0| 0 0| 0 0| 0 0 | 40 23| 432 26| 224 34| 22 37| 718 28 | 718 28
6TH THRU 8TH GRADE | 0 0| 0 0| 0 0| 0 0| 0 0 | 61 35| 541 32| 186 28| 21 35| 809 32 | 809 32
GRADE 9
| 0 0| 0 0| 0 0| 0 0| 0 0 | 16 9| 157 9| 40 6| 4 7| 217 8 | 217 8
GRADE 10
| 0 0| 0 0| 0 0| 0 0| 0 0 | 22 13| 175 10| 56 9| 0 0| 253 10 | 253 10
GRADE 11
| 0 0| 0 0| 0 0| 0 0| 0 0 | 10 6| 93 6| 23 4| 2 3| 128 5 | 128 5
GRADE 12
| 0 0| 0 0| 0 0| 0 0| 0 0 | 9 5| 76 5| 23 4| 1 2| 109 4 | 109 4
MORE THAN GRADE 12 | 0 0| 0 0| 0 0| 0 0| 0 0 | 15 9| 196 12| 101 15| 10 17| 322 13 | 322 13
------------------------------------------------------------------------------------------------------------------------------------
Total reported
| 0 0| 0 0| 0 0| 0 0| 0 0 | 173 100| 1670 100| 653 100| 60 100| 2556 100 | 2556 100
|
|
|
|
|
|
|
|
|
|
|
Percent reported |
.0|
.0|
.0|
.0|
.0 |
94.0|
95.3|
95.7|
90.9|
95.2 |
95.2
|
|
|
|
|
|
|
|
|
|
|
|
|
|
|
|
|
|
|
|
|
|
NOT REPORTED
|0|0|0|0|0
| 11 | 83 | 29 | 6 | 129
| 129
------------------------------------------------------------------------------------------------------------------------------------
Total
|0|0|0|0|0
| 184 | 1753 | 682 | 66 | 2685
| 2685
|
|
|
|
|
|
|
|
|
|
|
|
|
|
|
|
|
|
|
|
|
|
|
|
|
|
|
|
|
|
|
|
|
|
|
|
|
|
|
|
|
|
|
|
|
|
|
|
|
|
|
|
|
|
|
AVG SPELLING SCORE | .00 | .00 | .00 | .00 | .00 | 8.44 | 8.26 | 7.70 | 7.02 | 8.10 | 8.10
Georgia Dept. of Corrections
15
Page 10 Run 05/01/00
Georgia Department of Corrections Office of Planning and Analysis
FEMALES ONLY Inmate statistical profile
Sample: ACTIVE PRISONERS EXCLUDING JAIL
Requestor: Statistics
Active inmates 05/01/2000
Self-Rpt Guardian Status To Age 16 by current age & sex
|
MEN
|
WOMEN
|
| Age | Age | Age | Age | Men
| Age | Age | Age | Age |Women
|Grand
Guardian Status
|00-21 %|22-39 %|40-54 %|55-99 %|Total % |00-21 %|22-39 %|40-54 %|55-99 %|Total % |Total %
------------------------------------------------------------------------------------------------------------------------------------
ORPHANAGE
| 0 0| 0 0| 0 0| 0 0| 0 0 | 0 0| 0 0| 2 0| 0 0| 2 0 | 2 0
FATHER ONLY
| 0 0| 0 0| 0 0| 0 0| 0 0 | 3 2| 60 3| 23 3| 3 5| 89 3 | 89 3
FTR MTR HD
| 0 0| 0 0| 0 0| 0 0| 0 0 | 3 2| 52 3| 27 4| 0 0| 82 3 | 82 3
MOTHER ONLY
| 0 0| 0 0| 0 0| 0 0| 0 0 | 83 47| 720 42| 203 30| 20 32| 1026 39 | 1026 39
MTR FTR HD
| 0 0| 0 0| 0 0| 0 0| 0 0 | 50 28| 590 34| 321 48| 32 51| 993 38 | 993 38
OTH FEMALE
| 0 0| 0 0| 0 0| 0 0| 0 0 | 7 4| 52 3| 17 3| 2 3| 78 3 | 78 3
OTH MALE
| 0 0| 0 0| 0 0| 0 0| 0 0 | 0 0| 7 0| 4 1| 0 0| 11 0 | 11 0
STEP-PARNTS
| 0 0| 0 0| 0 0| 0 0| 0 0 | 1 1| 5 0| 4 1| 0 0| 10 0 | 10 0
FOSTER HOME
| 0 0| 0 0| 0 0| 0 0| 0 0 | 3 2| 42 2| 9 1| 2 3| 56 2 | 56 2
GRAND PRNTS
| 0 0| 0 0| 0 0| 0 0| 0 0 | 26 15| 178 10| 50 7| 4 6| 258 10 | 258 10
OTHER
| 0 0| 0 0| 0 0| 0 0| 0 0 | 2 1| 17 1| 10 1| 0 0| 29 1 | 29 1
------------------------------------------------------------------------------------------------------------------------------------
Total reported
| 0 0| 0 0| 0 0| 0 0| 0 0 | 178 100| 1723 100| 670 100| 63 100| 2634 100 | 2634 100
|
|
|
|
|
|
|
|
|
|
|
Percent reported |
.0|
.0|
.0|
.0|
.0 |
96.7|
98.3|
98.2|
95.5|
98.1 |
98.1
|
|
|
|
|
|
|
|
|
|
|
|
|
|
|
|
|
|
|
|
|
|
NOT RPTD
|0|0|0|0|0
| 6 | 30 | 12 | 3 | 51
| 51
------------------------------------------------------------------------------------------------------------------------------------
Total
|0|0|0|0|0
| 184 | 1753 | 682 | 66 | 2685
| 2685
Georgia Dept. of Corrections
16
Page 11 Run 05/01/00
Georgia Department of Corrections Office of Planning and Analysis
FEMALES ONLY Inmate statistical profile
Sample: ACTIVE PRISONERS EXCLUDING JAIL
Requestor: Statistics
Active inmates 05/01/2000
Self-Rpt Employment Status Before Prison by current age & sex
|
MEN
|
WOMEN
|
| Age | Age | Age | Age | Men
| Age | Age | Age | Age |Women
|Grand
Employment
|00-21 %|22-39 %|40-54 %|55-99 %|Total % |00-21 %|22-39 %|40-54 %|55-99 %|Total % |Total %
------------------------------------------------------------------------------------------------------------------------------------
FULL TIME
| 0 0| 0 0| 0 0| 0 0| 0 0 | 51 30| 551 35| 198 32| 17 30| 817 34 | 817 34
PART TIME
| 0 0| 0 0| 0 0| 0 0| 0 0 | 18 11| 103 7| 41 7| 3 5| 165 7 | 165 7
UNEMPL < 6M
| 0 0| 0 0| 0 0| 0 0| 0 0 | 33 20| 327 21| 122 20| 9 16| 491 20 | 491 20
UNEMPL > 6M
| 0 0| 0 0| 0 0| 0 0| 0 0 | 27 16| 352 22| 153 25| 17 30| 549 23 | 549 23
NEVER WORKD
| 0 0| 0 0| 0 0| 0 0| 0 0 | 28 17| 129 8| 16 3| 4 7| 177 7 | 177 7
STUDENT
| 0 0| 0 0| 0 0| 0 0| 0 0 | 11 7| 11 1| 4 1| 0 0| 26 1 | 26 1
INCAPABLE
| 0 0| 0 0| 0 0| 0 0| 0 0 | 0 0| 103 7| 76 12| 6 11| 185 8 | 185 8
OTHER
| 0 0| 0 0| 0 0| 0 0| 0 0 | 0 0| 0 0| 0 0| 0 0| 0 0 | 0 0
------------------------------------------------------------------------------------------------------------------------------------
Total reported
| 0 0| 0 0| 0 0| 0 0| 0 0 | 168 100| 1576 100| 610 100| 56 100| 2410 100 | 2410 100
|
|
|
|
|
|
|
|
|
|
|
Percent reported |
.0|
.0|
.0|
.0|
.0 |
91.3|
89.9|
89.4|
84.8|
89.8 |
89.8
|
|
|
|
|
|
|
|
|
|
|
|
|
|
|
|
|
|
|
|
|
|
NOT RPTD
|0|0|0|0|0
| 16 | 177 | 72 | 10 | 275
| 275
------------------------------------------------------------------------------------------------------------------------------------
Total
|0|0|0|0|0
| 184 | 1753 | 682 | 66 | 2685
| 2685
* NOTE: THE FIELD LABELD "OTHER" WAS CORRECTED IN APRIL 1989; INMATES CODED "PRE-OTIS NOT REPORTED" NOW HAVE BEEN REMOVED FROM THIS FIELD AND IDENTIFIED AS "NOT REPORTED".
Georgia Dept. of Corrections
17
Page 12 Run 05/01/00
Georgia Department of Corrections Office of Planning and Analysis
FEMALES ONLY Inmate statistical profile
Sample: ACTIVE PRISONERS EXCLUDING JAIL
Requestor: Statistics
Active inmates 05/01/2000
Self-Rpt Marital Status At Admission by current age & sex
|
MEN
|
WOMEN
|
| Age | Age | Age | Age | Men
| Age | Age | Age | Age |Women
|Grand
Marital Status
|00-21 %|22-39 %|40-54 %|55-99 %|Total % |00-21 %|22-39 %|40-54 %|55-99 %|Total % |Total %
------------------------------------------------------------------------------------------------------------------------------------
SINGLE
| 0 0| 0 0| 0 0| 0 0| 0 0 | 161 90| 946 55| 208 31| 8 13| 1323 50 | 1323 50
MARRIED
| 0 0| 0 0| 0 0| 0 0| 0 0 | 5 3| 244 14| 104 15| 9 14| 362 14 | 362 14
SEPARATED
| 0 0| 0 0| 0 0| 0 0| 0 0 | 1 1| 176 10| 95 14| 5 8| 277 10 | 277 10
DIVORCED
| 0 0| 0 0| 0 0| 0 0| 0 0 | 2 1| 206 12| 156 23| 14 22| 378 14 | 378 14
WIDOWED
| 0 0| 0 0| 0 0| 0 0| 0 0 | 1 1| 40 2| 61 9| 24 38| 126 5 | 126 5
COMMON LAW
| 0 0| 0 0| 0 0| 0 0| 0 0 | 8 4| 114 7| 47 7| 3 5| 172 7 | 172 7
OTHER
| 0 0| 0 0| 0 0| 0 0| 0 0 | 0 0| 2 0| 1 0| 0 0| 3 0 | 3 0
------------------------------------------------------------------------------------------------------------------------------------
Total reported
| 0 0| 0 0| 0 0| 0 0| 0 0 | 178 100| 1728 100| 672 100| 63 100| 2641 100 | 2641 100
|
|
|
|
|
|
|
|
|
|
|
Percent reported |
.0|
.0|
.0|
.0|
.0 |
96.7|
98.6|
98.5|
95.5|
98.4 |
98.4
|
|
|
|
|
|
|
|
|
|
|
|
|
|
|
|
|
|
|
|
|
|
NOT RPTD
|0|0|0|0|0
| 6 | 25 | 10 | 3 | 44
| 44
------------------------------------------------------------------------------------------------------------------------------------
Total
|0|0|0|0|0
| 184 | 1753 | 682 | 66 | 2685
| 2685
Georgia Dept. of Corrections
18
Page 13 Run 05/01/00
Georgia Department of Corrections Office of Planning and Analysis
FEMALES ONLY Inmate statistical profile
Sample: ACTIVE PRISONERS EXCLUDING JAIL
Requestor: Statistics
Active inmates 05/01/2000
Self-Rpt Number Of Children At Admission by current age & sex
|
MEN
|
WOMEN
|
| Age | Age | Age | Age | Men
| Age | Age | Age | Age |Women
|Grand
Number Of Children |00-21 %|22-39 %|40-54 %|55-99 %|Total % |00-21 %|22-39 %|40-54 %|55-99 %|Total % |Total %
------------------------------------------------------------------------------------------------------------------------------------
NO CHILDREN
| 0 0| 0 0| 0 0| 0 0| 0 0 | 0 0| 8 1| 7 1| 2 3| 17 1 | 17 1
ONE CHILD
| 0 0| 0 0| 0 0| 0 0| 0 0 | 44 55| 346 24| 104 18| 5 9| 499 23 | 499 23
TWO CHILDREN
| 0 0| 0 0| 0 0| 0 0| 0 0 | 28 35| 427 30| 172 29| 16 28| 643 30 | 643 30
THREE CHILDREN
| 0 0| 0 0| 0 0| 0 0| 0 0 | 6 8| 327 23| 159 27| 18 31| 510 24 | 510 24
FOUR CHILDREN
| 0 0| 0 0| 0 0| 0 0| 0 0 | 2 3| 164 12| 83 14| 8 14| 257 12 | 257 12
FIVE CHILDREN
| 0 0| 0 0| 0 0| 0 0| 0 0 | 0 0| 101 7| 29 5| 3 5| 133 6 | 133 6
MORE THAN 5 CHILDREN| 0 0| 0 0| 0 0| 0 0| 0 0 | 0 0| 52 4| 30 5| 6 10| 88 4 | 88 4
------------------------------------------------------------------------------------------------------------------------------------
Total reported
| 0 0| 0 0| 0 0| 0 0| 0 0 | 80 100| 1425 100| 584 100| 58 100| 2147 100 | 2147 100
|
|
|
|
|
|
|
|
|
|
|
Percent reported |
.0|
.0|
.0|
.0|
.0 |
43.5|
81.3|
85.6|
87.9|
80.0 |
80.0
|
|
|
|
|
|
|
|
|
|
|
|
|
|
|
|
|
|
|
|
|
|
NOT REPORTED
|0|0|0|0|0
| 104 | 328 | 98 | 8 | 538
| 538
------------------------------------------------------------------------------------------------------------------------------------
Total
|0|0|0|0|0
| 184 | 1753 | 682 | 66 | 2685
| 2685
|
|
|
|
|
|
|
|
|
|
|
|
|
|
|
|
|
|
|
|
|
|
|
|
|
|
|
|
|
|
|
|
|
|
|
|
|
|
|
|
|
|
|
|
|
|
|
|
|
|
|
|
|
|
|
AVG NUM CHILDREN | .00 | .00 | .00 | .00 | .00 | 1.58 | 2.59 | 2.76 | 3.10 | 2.61 | 2.61
* NOTE: THE FIELD LABLED "NO CHILDREN" WAS CORRECTED IN MARCH 1989: MISSING DATA FOR INMATES STILL IN DIAGNOSTICS NOW HAS BEEN REMOVED FROM THIS FIELD AND IDENTIFIED AS "NOT REPORTED" INFORMATION.
Georgia Dept. of Corrections
19
Page
14 Run 05/01/00
Georgia Department of Corrections Office of Planning and Analysis
FEMALES ONLY Inmate statistical profile
Sample: ACTIVE PRISONERS EXCLUDING JAIL
Requestor: Statistics
Active inmates 05/01/2000
Self-Rpt Religious Affiliation by current age & sex
|
MEN
|
WOMEN
|
| Age | Age | Age | Age | Men
| Age | Age | Age | Age |Women
|Grand
Religion
|00-21 %|22-39 %|40-54 %|55-99 %|Total % |00-21 %|22-39 %|40-54 %|55-99 %|Total % |Total %
------------------------------------------------------------------------------------------------------------------------------------
ISLAM
| 0 0| 0 0| 0 0| 0 0| 0 0 | 4 2| 12 1| 3 0| 0 0| 19 1 | 19 1
CATHOLIC
| 0 0| 0 0| 0 0| 0 0| 0 0 | 4 2| 72 4| 28 4| 4 7| 108 4 | 108 4
BAPTIST
| 0 0| 0 0| 0 0| 0 0| 0 0 | 106 60| 1084 63| 429 64| 38 62| 1657 63 | 1657 63
METHODIST
| 0 0| 0 0| 0 0| 0 0| 0 0 | 6 3| 65 4| 35 5| 5 8| 111 4 | 111 4
EPISCOPLN
| 0 0| 0 0| 0 0| 0 0| 0 0 | 0 0| 5 0| 5 1| 0 0| 10 0 | 10 0
PRESBYTRN
| 0 0| 0 0| 0 0| 0 0| 0 0 | 0 0| 2 0| 2 0| 2 3| 6 0 | 6 0
CHC OF GOD
| 0 0| 0 0| 0 0| 0 0| 0 0 | 2 1| 29 2| 16 2| 1 2| 48 2 | 48 2
HOLINESS
| 0 0| 0 0| 0 0| 0 0| 0 0 | 10 6| 182 11| 70 11| 2 3| 264 10 | 264 10
JEWISH
| 0 0| 0 0| 0 0| 0 0| 0 0 | 1 1| 1 0| 0 0| 0 0| 2 0 | 2 0
ANGLICAN
| 0 0| 0 0| 0 0| 0 0| 0 0 | 0 0| 1 0| 0 0| 0 0| 1 0 | 1 0
GRK ORTHDX
| 0 0| 0 0| 0 0| 0 0| 0 0 | 0 0| 0 0| 0 0| 0 0| 0 0 | 0 0
HINDU
| 0 0| 0 0| 0 0| 0 0| 0 0 | 0 0| 0 0| 0 0| 0 0| 0 0 | 0 0
BUDDHIST
| 0 0| 0 0| 0 0| 0 0| 0 0 | 1 1| 0 0| 0 0| 0 0| 1 0 | 1 0
TAOIST
| 0 0| 0 0| 0 0| 0 0| 0 0 | 0 0| 0 0| 0 0| 0 0| 0 0 | 0 0
SHINTOIST
| 0 0| 0 0| 0 0| 0 0| 0 0 | 0 0| 1 0| 0 0| 0 0| 1 0 | 1 0
SEVEN D AD
| 0 0| 0 0| 0 0| 0 0| 0 0 | 0 0| 10 1| 2 0| 0 0| 12 0 | 12 0
JEHOVAH WT
| 0 0| 0 0| 0 0| 0 0| 0 0 | 0 0| 12 1| 5 1| 1 2| 18 1 | 18 1
LATR DAY S
| 0 0| 0 0| 0 0| 0 0| 0 0 | 0 0| 2 0| 1 0| 0 0| 3 0 | 3 0
QUAKER
| 0 0| 0 0| 0 0| 0 0| 0 0 | 0 0| 0 0| 0 0| 0 0| 0 0 | 0 0
OTHER PROD
| 0 0| 0 0| 0 0| 0 0| 0 0 | 25 14| 110 6| 40 6| 5 8| 180 7 | 180 7
NONE
| 0 0| 0 0| 0 0| 0 0| 0 0 | 3 2| 26 2| 4 1| 0 0| 33 1 | 33 1
OTHER
| 0 0| 0 0| 0 0| 0 0| 0 0 | 15 8| 99 6| 26 4| 3 5| 143 5 | 143 5
------------------------------------------------------------------------------------------------------------------------------------
Total reported
| 0 0| 0 0| 0 0| 0 0| 0 0 | 177 100| 1713 100| 666 100| 61 100| 2617 100 | 2617 100
|
|
|
|
|
|
|
|
|
|
|
Percent reported |
.0|
.0|
.0|
.0|
.0 |
96.2|
97.7|
97.7|
92.4|
97.5 |
97.5
|
|
|
|
|
|
|
|
|
|
|
|
|
|
|
|
|
|
|
|
|
|
NOT RPTD
|0|0|0|0|0
| 7 | 40 | 16 | 5 | 68
| 68
------------------------------------------------------------------------------------------------------------------------------------
Georgia Dept. of Corrections
20
Total
|0|0|0|0|0
| 184 | 1753 | 682 | 66 | 2685
| 2685
Georgia Dept. of Corrections
21
Page 15 Run 05/01/00
Georgia Department of Corrections Office of Planning and Analysis
FEMALES ONLY Inmate statistical profile
Sample: ACTIVE PRISONERS EXCLUDING JAIL
Requestor: Statistics
Active inmates 05/01/2000
Self-Rpt Family Behavior Patterns * by current age & sex
|
MEN
|
WOMEN
|
| Age | Age | Age | Age | Men
| Age | Age | Age | Age |Women
|Grand
Family Behavior
|00-21 %|22-39 %|40-54 %|55-99 %|Total % |00-21 %|22-39 %|40-54 %|55-99 %|Total % |Total %
------------------------------------------------------------------------------------------------------------------------------------
CRIMINLTY
| 0 0| 0 0| 0 0| 0 0| 0 0 | 61 16| 624 16| 238 18| 15 18| 938 17 | 938 17
ALCOHOLISM
| 0 0| 0 0| 0 0| 0 0| 0 0 | 38 10| 500 13| 188 14| 12 14| 738 13 | 738 13
DRUG ABUSE
| 0 0| 0 0| 0 0| 0 0| 0 0 | 37 9| 325 8| 117 9| 2 2| 481 9 | 481 9
DOMINERING
| 0 0| 0 0| 0 0| 0 0| 0 0 | 36 9| 465 12| 179 14| 14 16| 694 12 | 694 12
MIGRANT
| 0 0| 0 0| 0 0| 0 0| 0 0 | 1 0| 14 0| 4 0| 0 0| 19 0 | 19 0
INFL BTGS
| 0 0| 0 0| 0 0| 0 0| 0 0 | 22 6| 261 7| 108 8| 8 9| 399 7 | 399 7
PERMISSIVE
| 0 0| 0 0| 0 0| 0 0| 0 0 | 38 10| 230 6| 61 5| 2 2| 331 6 | 331 6
FATH ABSNT
| 0 0| 0 0| 0 0| 0 0| 0 0 | 100 25| 866 23| 242 18| 21 25| 1229 22 | 1229 22
MOTH ABSNT
| 0 0| 0 0| 0 0| 0 0| 0 0 | 31 8| 249 6| 85 6| 7 8| 372 7 | 372 7
NONE
| 0 0| 0 0| 0 0| 0 0| 0 0 | 29 7| 312 8| 90 7| 4 5| 435 8 | 435 8
------------------------------------------------------------------------------------------------------------------------------------
Total reported
| 0 0| 0 0| 0 0| 0 0| 0 0 | 393 100| 3846 100| 1312 100| 85 100| 5636 100 | 5636 100
|
|
|
|
|
|
|
|
|
|
|
Percent reported |
.0|
.0|
.0|
.0|
.0 |
84.8|
84.8|
80.4|
63.6|
83.2 |
83.2
|
|
|
|
|
|
|
|
|
|
|
|
|
|
|
|
|
|
|
|
|
|
OTHER
|0|0|0|0|0
| 28 | 266 | 134 | 24 | 452
| 452
------------------------------------------------------------------------------------------------------------------------------------
Total
|0|0|0|0|0
| 184 | 1753 | 682 | 66 | 2685
| 2685
* NOTE: SINCE THERE CAN BE UP TO FIVE BEHAVIOR CODES PER INMATE, THE NUMBER OF CASES REPORTED IN THE DETAIL LINES AND THE TOTAL REPORTED LINE MAY EXCEED THE TOTAL NUMBER OF CASES. IN SHORT, THIS TABLE COUNTS THE NUMBER OF BEHAVIOR PROBLEMS, NOT INMATES.
Georgia Dept. of Corrections
22
Page 16 Run 05/01/00
Georgia Department of Corrections Office of Planning and Analysis
FEMALES ONLY Inmate statistical profile
Sample: ACTIVE PRISONERS EXCLUDING JAIL
Requestor: Statistics
Active inmates 05/01/2000
Inmate Diagnostic Behavior Problem * by current age & sex
|
MEN
|
WOMEN
|
| Age | Age | Age | Age | Men
| Age | Age | Age | Age |Women
|Grand
Diagnostic Problem |00-21 %|22-39 %|40-54 %|55-99 %|Total % |00-21 %|22-39 %|40-54 %|55-99 %|Total % |Total %
------------------------------------------------------------------------------------------------------------------------------------
ALCOHOLIC
| 0 0| 0 0| 0 0| 0 0| 0 0 | 5 2| 197 6| 92 7| 6 6| 300 6 | 300 6
ALCOH ABSE
| 0 0| 0 0| 0 0| 0 0| 0 0 | 19 7| 375 11| 143 11| 15 15| 552 11 | 552 11
DRUG EXP
| 0 0| 0 0| 0 0| 0 0| 0 0 | 29 10| 250 8| 92 7| 5 5| 376 8 | 376 8
DRUG ABSE
| 0 0| 0 0| 0 0| 0 0| 0 0 | 58 21| 906 27| 326 26| 11 11| 1301 26 | 1301 26
NARC ADDCT
| 0 0| 0 0| 0 0| 0 0| 0 0 | 1 0| 42 1| 31 2| 2 2| 76 2 | 76 2
EPILEPTIC
| 0 0| 0 0| 0 0| 0 0| 0 0 | 5 2| 68 2| 32 3| 4 4| 109 2 | 109 2
MANIPULTVE
| 0 0| 0 0| 0 0| 0 0| 0 0 | 4 1| 75 2| 41 3| 4 4| 124 3 | 124 3
ASSAULTIVE
| 0 0| 0 0| 0 0| 0 0| 0 0 | 61 22| 574 17| 199 16| 16 16| 850 17 | 850 17
ESCPE TEND
| 0 0| 0 0| 0 0| 0 0| 0 0 | 7 3| 107 3| 38 3| 0 0| 152 3 | 152 3
SUICIDAL
| 0 0| 0 0| 0 0| 0 0| 0 0 | 14 5| 161 5| 58 5| 4 4| 237 5 | 237 5
WITHDRAWN
| 0 0| 0 0| 0 0| 0 0| 0 0 | 13 5| 71 2| 26 2| 1 1| 111 2 | 111 2
PR RLTY CT
| 0 0| 0 0| 0 0| 0 0| 0 0 | 8 3| 78 2| 34 3| 2 2| 122 2 | 122 2
HOMOSEXUAL
| 0 0| 0 0| 0 0| 0 0| 0 0 | 7 3| 121 4| 18 1| 0 0| 146 3 | 146 3
NONE
| 0 0| 0 0| 0 0| 0 0| 0 0 | 3 1| 34 1| 30 2| 12 12| 79 2 | 79 2
OTHER
| 0 0| 0 0| 0 0| 0 0| 0 0 | 2 1| 28 1| 16 1| 5 5| 51 1 | 51 1
NOT RPTD
| 0 0| 0 0| 0 0| 0 0| 0 0 | 43 15| 213 6| 87 7| 11 11| 354 7 | 354 7
------------------------------------------------------------------------------------------------------------------------------------
Total reported
| 0 0| 0 0| 0 0| 0 0| 0 0 | 279 100| 3301 100| 1264 100| 98 100| 4942 100 | 4942 100
|
|
|
|
|
|
|
|
|
|
|
Percent reported |
.0|
.0|
.0|
.0|
.0 | 100.0|
99.9|
99.9| 100.0|
99.9 |
99.9
|
|
|
|
|
|
|
|
|
|
|
|
|
|
|
|
|
|
|
|
|
|
UNKNOWN
|0|0|0|0|0
|0|1|1|0|2
|2
------------------------------------------------------------------------------------------------------------------------------------
Total
|0|0|0|0|0
| 184 | 1753 | 682 | 66 | 2685
| 2685
* NOTE: SINCE THERE CAN BE UP TO FIVE BEHAVIOR CODES PER INMATE, THE NUMBER OF CASES REPORTED IN THE DETAIL LINES AND THE TOTAL REPORTED LINE MAY EXCEED THE TOTAL NUMBER OF CASES. IN SHORT, THIS TABLE COUNTS THE NUMBER OF BEHAVIOR PROBLEMS, NOT INMATES.
Georgia Dept. of Corrections
23
Page
17 Run 05/01/00
Georgia Department of Corrections Office of Planning and Analysis
FEMALES ONLY Inmate statistical profile
Sample: ACTIVE PRISONERS EXCLUDING JAIL
Requestor: Statistics
Active inmates 05/01/2000
Physical Profile (General Condition) by current age & sex
|
MEN
|
WOMEN
|
| Age | Age | Age | Age | Men
| Age | Age | Age | Age |Women
|Grand
Physical Profile |00-21 %|22-39 %|40-54 %|55-99 %|Total % |00-21 %|22-39 %|40-54 %|55-99 %|Total % |Total %
------------------------------------------------------------------------------------------------------------------------------------
NO LIMITATION
| 0 0| 0 0| 0 0| 0 0| 0 0 | 147 85| 1181 70| 302 45| 11 18| 1641 63 | 1641 63
DEFECT NO MAJOR LIMT| 0 0| 0 0| 0 0| 0 0| 0 0 | 4 2| 112 7| 83 12| 11 18| 210 8 | 210 8
DEFECT MAJOR LIMIT | 0 0| 0 0| 0 0| 0 0| 0 0 | 21 12| 397 23| 273 41| 38 61| 729 28 | 729 28
VERY MAJOR DEFECT | 0 0| 0 0| 0 0| 0 0| 0 0 | 0 0| 4 0| 7 1| 2 3| 13 1 | 13 1
------------------------------------------------------------------------------------------------------------------------------------
Total reported
| 0 0| 0 0| 0 0| 0 0| 0 0 | 172 100| 1694 100| 665 100| 62 100| 2593 100 | 2593 100
|
|
|
|
|
|
|
|
|
|
|
Percent reported |
.0|
.0|
.0|
.0|
.0 |
93.5|
96.6|
97.5|
93.9|
96.6 |
96.6
|
|
|
|
|
|
|
|
|
|
|
|
|
|
|
|
|
|
|
|
|
|
NOT REPORTED
|0|0|0|0|0
| 12 | 59 | 17 | 4 | 92
| 92
------------------------------------------------------------------------------------------------------------------------------------
Total
|0|0|0|0|0
| 184 | 1753 | 682 | 66 | 2685
| 2685
Georgia Dept. of Corrections
24
Page 18 Run 05/01/00
Georgia Department of Corrections Office of Planning and Analysis
FEMALES ONLY Inmate statistical profile
Sample: ACTIVE PRISONERS EXCLUDING JAIL Active inmates 05/01/2000
Requestor: Statistics Security Status by current age & sex
|
MEN
|
WOMEN
|
| Age | Age | Age | Age | Men
| Age | Age | Age | Age |Women
|Grand
Security
|00-21 %|22-39 %|40-54 %|55-99 %|Total % |00-21 %|22-39 %|40-54 %|55-99 %|Total % |Total %
------------------------------------------------------------------------------------------------------------------------------------
DIAG INCOM
| 0 0| 0 0| 0 0| 0 0| 0 0 | 0 0| 0 0| 0 0| 0 0| 0 0 | 0 0
WRK RELEAS
| 0 0| 0 0| 0 0| 0 0| 0 0 | 0 0| 0 0| 0 0| 0 0| 0 0 | 0 0
TRUSTY
| 0 0| 0 0| 0 0| 0 0| 0 0 | 4 2| 56 3| 43 6| 4 6| 107 4 | 107 4
MINIMUM
| 0 0| 0 0| 0 0| 0 0| 0 0 | 81 44| 950 54| 389 57| 39 59| 1459 54 | 1459 54
MEDIUM
| 0 0| 0 0| 0 0| 0 0| 0 0 | 61 33| 541 31| 190 28| 17 26| 809 30 | 809 30
CLOSE
| 0 0| 0 0| 0 0| 0 0| 0 0 | 24 13| 122 7| 32 5| 4 6| 182 7 | 182 7
MAXIMUM
| 0 0| 0 0| 0 0| 0 0| 0 0 | 2 1| 4 0| 2 0| 0 0| 8 0 | 8 0
DIAGNOSTIC
| 0 0| 0 0| 0 0| 0 0| 0 0 | 12 7| 80 5| 26 4| 2 3| 120 4 | 120 4
------------------------------------------------------------------------------------------------------------------------------------
Total reported
| 0 0| 0 0| 0 0| 0 0| 0 0 | 184 100| 1753 100| 682 100| 66 100| 2685 100 | 2685 100
|
|
|
|
|
|
|
|
|
|
|
Percent reported |
.0|
.0|
.0|
.0|
.0 | 100.0| 100.0| 100.0| 100.0| 100.0 | 100.0
|
|
|
|
|
|
|
|
|
|
|
|
|
|
|
|
|
|
|
|
|
|
NOT RPTD
|0|0|0|0|0
|0|0|0|0|0
|0
------------------------------------------------------------------------------------------------------------------------------------
Total
|0|0|0|0|0
| 184 | 1753 | 682 | 66 | 2685
| 2685
* NOTE: BEGINNING IN JULY 1987, THE FACILITIES DIVISION NO LONGER CODED INMATES AS BEING WORK RELEASE
Georgia Dept. of Corrections
25
Page
19 Run 05/01/00
Georgia Department of Corrections Office of Planning and Analysis
FEMALES ONLY Inmate statistical profile
Sample: ACTIVE PRISONERS EXCLUDING JAIL Active inmates 05/01/2000
Requestor: Statistics Number Of Sentences by current age & sex
|
MEN
|
WOMEN
|
| Age | Age | Age | Age | Men
| Age | Age | Age | Age |Women
|Grand
Number Of Sentences |00-21 %|22-39 %|40-54 %|55-99 %|Total % |00-21 %|22-39 %|40-54 %|55-99 %|Total % |Total %
------------------------------------------------------------------------------------------------------------------------------------
ONE
| 0 0| 0 0| 0 0| 0 0| 0 0 | 92 53| 694 41| 270 41| 33 51| 1089 42 | 1089 42
TWO
| 0 0| 0 0| 0 0| 0 0| 0 0 | 50 29| 410 24| 173 26| 15 23| 648 25 | 648 25
THREE
| 0 0| 0 0| 0 0| 0 0| 0 0 | 9 5| 229 14| 97 15| 10 15| 345 13 | 345 13
FOUR
| 0 0| 0 0| 0 0| 0 0| 0 0 | 11 6| 151 9| 46 7| 3 5| 211 8 | 211 8
FIVE
| 0 0| 0 0| 0 0| 0 0| 0 0 | 10 6| 74 4| 20 3| 1 2| 105 4 | 105 4
MORE THAN FIVE
| 0 0| 0 0| 0 0| 0 0| 0 0 | 2 1| 126 7| 57 9| 3 5| 188 7 | 188 7
------------------------------------------------------------------------------------------------------------------------------------
Total reported
| 0 0| 0 0| 0 0| 0 0| 0 0 | 174 100| 1684 100| 663 100| 65 100| 2586 100 | 2586 100
|
|
|
|
|
|
|
|
|
|
|
Percent reported |
.0|
.0|
.0|
.0|
.0 |
94.6|
96.1|
97.2|
98.5|
96.3 |
96.3
|
|
|
|
|
|
|
|
|
|
|
|
|
|
|
|
|
|
|
|
|
|
NOT REPORTED
|0|0|0|0|0
| 10 | 69 | 19 | 1 | 99
| 99
------------------------------------------------------------------------------------------------------------------------------------
Total
|0|0|0|0|0
| 184 | 1753 | 682 | 66 | 2685
| 2685
|
|
|
|
|
|
|
|
|
|
|
|
|
|
|
|
|
|
|
|
|
|
|
|
|
|
|
|
|
|
|
|
|
|
|
|
|
|
|
|
|
|
|
|
|
|
|
|
|
|
|
|
|
|
|
AVG NUM SENTENCES | .00 | .00 | .00 | .00 | .00 | 1.89 | 2.53 | 2.54 | 2.20 | 2.48 | 2.48
Georgia Dept. of Corrections
26
Page 20 Run 05/01/00
Georgia Department of Corrections Office of Planning and Analysis
FEMALES ONLY Inmate statistical profile
Sample: ACTIVE PRISONERS EXCLUDING JAIL Active inmates 05/01/2000
Requestor: Statistics Number Of Disciplinaries by current age & sex
|
MEN
|
WOMEN
|
| Age | Age | Age | Age | Men
| Age | Age | Age | Age |Women
|Grand
Disciplinaries
|00-21 %|22-39 %|40-54 %|55-99 %|Total % |00-21 %|22-39 %|40-54 %|55-99 %|Total % |Total %
------------------------------------------------------------------------------------------------------------------------------------
ZERO
| 0 0| 0 0| 0 0| 0 0| 0 0 | 84 46| 877 50| 399 59| 41 62| 1401 52 | 1401 52
ONE
| 0 0| 0 0| 0 0| 0 0| 0 0 | 28 15| 272 16| 109 16| 11 17| 420 16 | 420 16
TWO
| 0 0| 0 0| 0 0| 0 0| 0 0 | 22 12| 154 9| 41 6| 2 3| 219 8 | 219 8
THREE
| 0 0| 0 0| 0 0| 0 0| 0 0 | 6 3| 90 5| 29 4| 3 5| 128 5 | 128 5
FOUR
| 0 0| 0 0| 0 0| 0 0| 0 0 | 10 5| 66 4| 20 3| 4 6| 100 4 | 100 4
FIVE
| 0 0| 0 0| 0 0| 0 0| 0 0 | 6 3| 39 2| 18 3| 1 2| 64 2 | 64 2
MORE THAN FIVE
| 0 0| 0 0| 0 0| 0 0| 0 0 | 28 15| 254 14| 66 10| 4 6| 352 13 | 352 13
------------------------------------------------------------------------------------------------------------------------------------
Total reported
| 0 0| 0 0| 0 0| 0 0| 0 0 | 184 100| 1752 100| 682 100| 66 100| 2684 100 | 2684 100
|
|
|
|
|
|
|
|
|
|
|
Percent reported |
.0|
.0|
.0|
.0|
.0 | 100.0|
99.9| 100.0| 100.0| 100.0 | 100.0
|
|
|
|
|
|
|
|
|
|
|
|
|
|
|
|
|
|
|
|
|
|
NOT REPORTED
|0|0|0|0|0
|0|1|0|0|1
|1
------------------------------------------------------------------------------------------------------------------------------------
Total
|0|0|0|0|0
| 184 | 1753 | 682 | 66 | 2685
| 2685
|
|
|
|
|
|
|
|
|
|
|
|
|
|
|
|
|
|
|
|
|
|
|
|
|
|
|
|
|
|
|
|
|
|
|
|
|
|
|
|
|
|
|
|
|
|
|
|
|
|
|
|
|
|
|
AVG NUM DISCIP
| .00 | .00 | .00 | .00 | .00 | 3.17 | 3.11 | 1.91 | 1.39 | 2.77 | 2.77
Georgia Dept. of Corrections
27
Page 21 Run 05/01/00
Georgia Department of Corrections Office of Planning and Analysis
FEMALES ONLY Inmate statistical profile
Sample: ACTIVE PRISONERS EXCLUDING JAIL Active inmates 05/01/2000
Requestor: Statistics Number Of Escapes by current age & sex
|
MEN
|
WOMEN
|
| Age | Age | Age | Age | Men
| Age | Age | Age | Age |Women
|Grand
Escapes
|00-21 %|22-39 %|40-54 %|55-99 %|Total % |00-21 %|22-39 %|40-54 %|55-99 %|Total % |Total %
------------------------------------------------------------------------------------------------------------------------------------
ZERO
| 0 0| 0 0| 0 0| 0 0| 0 0 | 184 100| 1745 100| 679 100| 66 100| 2674 100 | 2674 100
ONE
| 0 0| 0 0| 0 0| 0 0| 0 0 | 0 0| 8 0| 3 0| 0 0| 11 0 | 11 0
TWO
| 0 0| 0 0| 0 0| 0 0| 0 0 | 0 0| 0 0| 0 0| 0 0| 0 0 | 0 0
THREE
| 0 0| 0 0| 0 0| 0 0| 0 0 | 0 0| 0 0| 0 0| 0 0| 0 0 | 0 0
FOUR
| 0 0| 0 0| 0 0| 0 0| 0 0 | 0 0| 0 0| 0 0| 0 0| 0 0 | 0 0
FIVE
| 0 0| 0 0| 0 0| 0 0| 0 0 | 0 0| 0 0| 0 0| 0 0| 0 0 | 0 0
MORE THAN FIVE
| 0 0| 0 0| 0 0| 0 0| 0 0 | 0 0| 0 0| 0 0| 0 0| 0 0 | 0 0
------------------------------------------------------------------------------------------------------------------------------------
Total reported
| 0 0| 0 0| 0 0| 0 0| 0 0 | 184 100| 1753 100| 682 100| 66 100| 2685 100 | 2685 100
|
|
|
|
|
|
|
|
|
|
|
Percent reported |
.0|
.0|
.0|
.0|
.0 | 100.0| 100.0| 100.0| 100.0| 100.0 | 100.0
|
|
|
|
|
|
|
|
|
|
|
|
|
|
|
|
|
|
|
|
|
|
NOT REPORTED
|0|0|0|0|0
|0|0|0|0|0
|0
------------------------------------------------------------------------------------------------------------------------------------
Total
|0|0|0|0|0
| 184 | 1753 | 682 | 66 | 2685
| 2685
|
|
|
|
|
|
|
|
|
|
|
|
|
|
|
|
|
|
|
|
|
|
|
|
|
|
|
|
|
|
|
|
|
|
|
|
|
|
|
|
|
|
|
|
|
|
|
|
|
|
|
|
|
|
|
AVG NUM ESCAPES
| .00 | .00 | .00 | .00 | .00 | .00 | .00 | .00 | .00 | .00 | .00
Georgia Dept. of Corrections
28
Page
22 Run 05/01/00
Georgia Department of Corrections Office of Planning and Analysis
FEMALES ONLY Inmate statistical profile
Sample: ACTIVE PRISONERS EXCLUDING JAIL
Requestor: Statistics
Active inmates 05/01/2000
Number Of Prior Georgia Incarcerations * by current age & sex
|
MEN
|
WOMEN
|
| Age | Age | Age | Age | Men
| Age | Age | Age | Age |Women
|Grand
Prior Incarcerations|00-21 %|22-39 %|40-54 %|55-99 %|Total % |00-21 %|22-39 %|40-54 %|55-99 %|Total % |Total %
------------------------------------------------------------------------------------------------------------------------------------
ZERO
| 0 0| 0 0| 0 0| 0 0| 0 0 | 176 96| 1118 64| 377 55| 44 67| 1715 64 | 1715 64
ONE
| 0 0| 0 0| 0 0| 0 0| 0 0 | 8 4| 318 18| 116 17| 12 18| 454 17 | 454 17
TWO
| 0 0| 0 0| 0 0| 0 0| 0 0 | 0 0| 148 8| 77 11| 5 8| 230 9 | 230 9
THREE
| 0 0| 0 0| 0 0| 0 0| 0 0 | 0 0| 92 5| 47 7| 2 3| 141 5 | 141 5
FOUR
| 0 0| 0 0| 0 0| 0 0| 0 0 | 0 0| 36 2| 23 3| 3 5| 62 2 | 62 2
FIVE
| 0 0| 0 0| 0 0| 0 0| 0 0 | 0 0| 26 1| 11 2| 0 0| 37 1 | 37 1
MORE THAN FIVE
| 0 0| 0 0| 0 0| 0 0| 0 0 | 0 0| 15 1| 31 5| 0 0| 46 2 | 46 2
------------------------------------------------------------------------------------------------------------------------------------
Total reported
| 0 0| 0 0| 0 0| 0 0| 0 0 | 184 100| 1753 100| 682 100| 66 100| 2685 100 | 2685 100
|
|
|
|
|
|
|
|
|
|
|
Percent reported |
.0|
.0|
.0|
.0|
.0 | 100.0| 100.0| 100.0| 100.0| 100.0 | 100.0
|
|
|
|
|
|
|
|
|
|
|
|
|
|
|
|
|
|
|
|
|
|
NOT REPORTED
|0|0|0|0|0
|0|0|0|0|0
|0
------------------------------------------------------------------------------------------------------------------------------------
Total
|0|0|0|0|0
| 184 | 1753 | 682 | 66 | 2685
| 2685
|
|
|
|
|
|
|
|
|
|
|
|
|
|
|
|
|
|
|
|
|
|
|
|
|
|
|
|
|
|
|
|
|
|
|
|
|
|
|
|
|
|
|
|
|
|
|
|
|
|
|
|
|
|
|
AVG # INCARCERATIONS| .00 | .00 | .00 | .00 | .00 | .04 | .72 | 1.14 | .61 | .78 | .78
* This data counts a parole revocation on an existing sentenCE AS A prior incarceration. Also, this data counts, for any cohort of inmates, the total number of Georgia incarcerations the inmate has had during his entire criminal career. For example, if an inmate was admitted to prison first in FY72, and then re-admitted in FY79 and FY85, he had two prior incarcerations before the FY85 admission. This inmate's records show two prior incarcerations in all three of
Georgia Dept. of Corrections
29
his records since he has had two prior incarcerations in his criminal career. If the cohort of FY72 admissions is selected for analysis, two prior incarcerations will be listed for this inmate even though in FY72, he had no prior incarcerations.
Georgia Dept. of Corrections
30
Page
23 Run 05/01/00
Georgia Department of Corrections Office of Planning and Analysis
FEMALES ONLY Inmate statistical profile
Sample: ACTIVE PRISONERS EXCLUDING JAIL Active inmates 05/01/2000
Requestor: Statistics Number Of Transfers by current age & sex
|
MEN
|
WOMEN
|
| Age | Age | Age | Age | Men
| Age | Age | Age | Age |Women
|Grand
Transfers
|00-21 %|22-39 %|40-54 %|55-99 %|Total % |00-21 %|22-39 %|40-54 %|55-99 %|Total % |Total %
------------------------------------------------------------------------------------------------------------------------------------
ZERO
| 0 0| 0 0| 0 0| 0 0| 0 0 | 45 24| 352 20| 114 17| 11 17| 522 19 | 522 19
ONE
| 0 0| 0 0| 0 0| 0 0| 0 0 | 122 66| 932 53| 358 52| 22 33| 1434 53 | 1434 53
TWO
| 0 0| 0 0| 0 0| 0 0| 0 0 | 12 7| 269 15| 120 18| 11 17| 412 15 | 412 15
THREE
| 0 0| 0 0| 0 0| 0 0| 0 0 | 4 2| 125 7| 46 7| 8 12| 183 7 | 183 7
FOUR
| 0 0| 0 0| 0 0| 0 0| 0 0 | 1 1| 38 2| 22 3| 6 9| 67 2 | 67 2
FIVE
| 0 0| 0 0| 0 0| 0 0| 0 0 | 0 0| 21 1| 9 1| 3 5| 33 1 | 33 1
MORE THAN FIVE
| 0 0| 0 0| 0 0| 0 0| 0 0 | 0 0| 16 1| 13 2| 5 8| 34 1 | 34 1
------------------------------------------------------------------------------------------------------------------------------------
Total reported
| 0 0| 0 0| 0 0| 0 0| 0 0 | 184 100| 1753 100| 682 100| 66 100| 2685 100 | 2685 100
|
|
|
|
|
|
|
|
|
|
|
Percent reported |
.0|
.0|
.0|
.0|
.0 | 100.0| 100.0| 100.0| 100.0| 100.0 | 100.0
|
|
|
|
|
|
|
|
|
|
|
|
|
|
|
|
|
|
|
|
|
|
NOT REPORTED
|0|0|0|0|0
|0|0|0|0|0
|0
------------------------------------------------------------------------------------------------------------------------------------
Total
|0|0|0|0|0
| 184 | 1753 | 682 | 66 | 2685
| 2685
|
|
|
|
|
|
|
|
|
|
|
|
|
|
|
|
|
|
|
|
|
|
|
|
|
|
|
|
|
|
|
|
|
|
|
|
|
|
|
|
|
|
|
|
|
|
|
|
|
|
|
|
|
|
|
AVG NUM TRANSFERS | .00 | .00 | .00 | .00 | .00 | .88 | 1.27 | 1.41 | 2.24 | 1.30 | 1.30
Georgia Dept. of Corrections
31
Page
24 Run 05/01/00
Georgia Department of Corrections Office of Planning and Analysis
FEMALES ONLY Inmate statistical profile
Sample: ACTIVE PRISONERS EXCLUDING JAIL Active inmates 05/01/2000
Requestor: Statistics County Of Conviction by current age & sex
|
MEN
|
WOMEN
|
| Age | Age | Age | Age | Men
| Age | Age | Age | Age |Women
|Grand
County Of Conviction|00-21 %|22-39 %|40-54 %|55-99 %|Total % |00-21 %|22-39 %|40-54 %|55-99 %|Total % |Total %
------------------------------------------------------------------------------------------------------------------------------------
APPLING COUNTY
| 0 0| 0 0| 0 0| 0 0| 0 0 | 1 1| 2 0| 0 0| 0 0| 3 0 | 3 0
ATKINSON COUNTY
| 0 0| 0 0| 0 0| 0 0| 0 0 | 0 0| 1 0| 2 0| 0 0| 3 0 | 3 0
BACON COUNTY
| 0 0| 0 0| 0 0| 0 0| 0 0 | 0 0| 4 0| 0 0| 0 0| 4 0 | 4 0
BAKER COUNTY
| 0 0| 0 0| 0 0| 0 0| 0 0 | 0 0| 3 0| 0 0| 0 0| 3 0 | 3 0
BALDWIN COUNTY
| 0 0| 0 0| 0 0| 0 0| 0 0 | 2 1| 19 1| 1 0| 0 0| 22 1 | 22 1
BANKS COUNTY
| 0 0| 0 0| 0 0| 0 0| 0 0 | 1 1| 1 0| 2 0| 0 0| 4 0 | 4 0
BARROW COUNTY
| 0 0| 0 0| 0 0| 0 0| 0 0 | 0 0| 4 0| 4 1| 0 0| 8 0 | 8 0
BARTOW COUNTY
| 0 0| 0 0| 0 0| 0 0| 0 0 | 1 1| 20 1| 4 1| 0 0| 25 1 | 25 1
BEN HILL COUNTY
| 0 0| 0 0| 0 0| 0 0| 0 0 | 0 0| 8 0| 4 1| 0 0| 12 0 | 12 0
BERRIEN COUNTY
| 0 0| 0 0| 0 0| 0 0| 0 0 | 0 0| 3 0| 0 0| 0 0| 3 0 | 3 0
BIBB COUNTY
| 0 0| 0 0| 0 0| 0 0| 0 0 | 5 3| 26 2| 23 3| 2 3| 56 2 | 56 2
BLECKLEY COUNTY
| 0 0| 0 0| 0 0| 0 0| 0 0 | 1 1| 5 0| 2 0| 0 0| 8 0 | 8 0
BRANTLEY COUNTY
| 0 0| 0 0| 0 0| 0 0| 0 0 | 0 0| 3 0| 2 0| 0 0| 5 0 | 5 0
BROOKS COUNTY
| 0 0| 0 0| 0 0| 0 0| 0 0 | 0 0| 1 0| 2 0| 0 0| 3 0 | 3 0
BRYAN COUNTY
| 0 0| 0 0| 0 0| 0 0| 0 0 | 0 0| 2 0| 0 0| 1 2| 3 0 | 3 0
BULLOCH COUNTY
| 0 0| 0 0| 0 0| 0 0| 0 0 | 0 0| 17 1| 5 1| 2 3| 24 1 | 24 1
BURKE COUNTY
| 0 0| 0 0| 0 0| 0 0| 0 0 | 0 0| 3 0| 3 0| 0 0| 6 0 | 6 0
BUTTS COUNTY
| 0 0| 0 0| 0 0| 0 0| 0 0 | 0 0| 6 0| 2 0| 0 0| 8 0 | 8 0
CALHOUN COUNTY
| 0 0| 0 0| 0 0| 0 0| 0 0 | 0 0| 2 0| 1 0| 0 0| 3 0 | 3 0
CAMDEN COUNTY
| 0 0| 0 0| 0 0| 0 0| 0 0 | 1 1| 2 0| 3 0| 1 2| 7 0 | 7 0
CANDLER COUNTY
| 0 0| 0 0| 0 0| 0 0| 0 0 | 0 0| 3 0| 1 0| 0 0| 4 0 | 4 0
CARROLL COUNTY
| 0 0| 0 0| 0 0| 0 0| 0 0 | 5 3| 27 2| 10 2| 0 0| 42 2 | 42 2
CATOOSA COUNTY
| 0 0| 0 0| 0 0| 0 0| 0 0 | 0 0| 12 1| 1 0| 1 2| 14 1 | 14 1
CHARLTON COUNTY
| 0 0| 0 0| 0 0| 0 0| 0 0 | 0 0| 3 0| 1 0| 0 0| 4 0 | 4 0
CHATHAM COUNTY
| 0 0| 0 0| 0 0| 0 0| 0 0 | 12 7| 91 5| 38 6| 2 3| 143 6 | 143 6
CHATTAHOOCHEE COUNTY| 0 0| 0 0| 0 0| 0 0| 0 0 | 0 0| 0 0| 0 0| 0 0| 0 0 | 0 0
CHATTOOGA COUNTY | 0 0| 0 0| 0 0| 0 0| 0 0 | 1 1| 5 0| 1 0| 1 2| 8 0 | 8 0
CHEROKEE COUNTY
| 0 0| 0 0| 0 0| 0 0| 0 0 | 3 2| 24 1| 7 1| 0 0| 34 1 | 34 1
CLARKE COUNTY
| 0 0| 0 0| 0 0| 0 0| 0 0 | 0 0| 24 1| 12 2| 2 3| 38 1 | 38 1
CLAY COUNTY
| 0 0| 0 0| 0 0| 0 0| 0 0 | 0 0| 0 0| 0 0| 0 0| 0 0 | 0 0
CLAYTON COUNTY
| 0 0| 0 0| 0 0| 0 0| 0 0 | 10 6| 100 6| 34 5| 4 6| 148 6 | 148 6
CLINCH COUNTY
| 0 0| 0 0| 0 0| 0 0| 0 0 | 0 0| 2 0| 1 0| 0 0| 3 0 | 3 0
Georgia Dept. of Corrections
32
COBB COUNTY
| 0 0| 0 0| 0 0| 0 0| 0 0 | 12 7| 95 6| 42 6| 4 6| 153 6 | 153 6
COFFEE COUNTY
| 0 0| 0 0| 0 0| 0 0| 0 0 | 1 1| 8 0| 3 0| 0 0| 12 0 | 12 0
COLQUITT COUNTY
| 0 0| 0 0| 0 0| 0 0| 0 0 | 0 0| 16 1| 4 1| 1 2| 21 1 | 21 1
COLUMBIA COUNTY
| 0 0| 0 0| 0 0| 0 0| 0 0 | 2 1| 11 1| 4 1| 0 0| 17 1 | 17 1
------------------------------------------------------------------------------------------------------------------------------------
(continued)
Georgia Department of Corrections
Page 25 Run 05/01/00
Office of Planning and Analysis
FEMALES ONLY Inmate statistical profile
Sample: ACTIVE PRISONERS EXCLUDING JAIL
Requestor: Statistics
Active inmates 05/01/2000
County Of Conviction by current age & sex
(CONTINUED)
|
MEN
|
WOMEN
|
| Age | Age | Age | Age | Men
| Age | Age | Age | Age |Women
|Grand
County Of Conviction|00-21 %|22-39 %|40-54 %|55-99 %|Total % |00-21 %|22-39 %|40-54 %|55-99 %|Total % |Total %
------------------------------------------------------------------------------------------------------------------------------------
COOK COUNTY
| 0 0| 0 0| 0 0| 0 0| 0 0 | 0 0| 10 1| 3 0| 0 0| 13 1 | 13 1
COWETA COUNTY
| 0 0| 0 0| 0 0| 0 0| 0 0 | 3 2| 26 2| 1 0| 0 0| 30 1 | 30 1
CRAWFORD COUNTY
| 0 0| 0 0| 0 0| 0 0| 0 0 | 1 1| 0 0| 1 0| 0 0| 2 0 | 2 0
CRISP COUNTY
| 0 0| 0 0| 0 0| 0 0| 0 0 | 2 1| 11 1| 1 0| 2 3| 16 1 | 16 1
DADE COUNTY
| 0 0| 0 0| 0 0| 0 0| 0 0 | 0 0| 1 0| 0 0| 0 0| 1 0 | 1 0
DAWSON COUNTY
| 0 0| 0 0| 0 0| 0 0| 0 0 | 0 0| 1 0| 0 0| 0 0| 1 0 | 1 0
DECATUR COUNTY
| 0 0| 0 0| 0 0| 0 0| 0 0 | 0 0| 14 1| 4 1| 0 0| 18 1 | 18 1
DEKALB COUNTY
| 0 0| 0 0| 0 0| 0 0| 0 0 | 14 8| 59 4| 26 4| 5 8| 104 4 | 104 4
DODGE COUNTY
| 0 0| 0 0| 0 0| 0 0| 0 0 | 3 2| 17 1| 2 0| 0 0| 22 1 | 22 1
DOOLY COUNTY
| 0 0| 0 0| 0 0| 0 0| 0 0 | 0 0| 4 0| 0 0| 0 0| 4 0 | 4 0
DOUGHERTY COUNTY | 0 0| 0 0| 0 0| 0 0| 0 0 | 3 2| 29 2| 14 2| 0 0| 46 2 | 46 2
DOUGLAS COUNTY
| 0 0| 0 0| 0 0| 0 0| 0 0 | 3 2| 25 1| 13 2| 0 0| 41 2 | 41 2
EARLY COUNTY
| 0 0| 0 0| 0 0| 0 0| 0 0 | 0 0| 3 0| 1 0| 0 0| 4 0 | 4 0
ECHOLS COUNTY.
| 0 0| 0 0| 0 0| 0 0| 0 0 | 0 0| 0 0| 0 0| 0 0| 0 0 | 0 0
EFFINGHAM COUNTY | 0 0| 0 0| 0 0| 0 0| 0 0 | 1 1| 7 0| 2 0| 1 2| 11 0 | 11 0
ELBERT COUNTY
| 0 0| 0 0| 0 0| 0 0| 0 0 | 1 1| 8 0| 3 0| 0 0| 12 0 | 12 0
EMANUEL COUNTY
| 0 0| 0 0| 0 0| 0 0| 0 0 | 0 0| 6 0| 1 0| 0 0| 7 0 | 7 0
EVANS COUNTY
| 0 0| 0 0| 0 0| 0 0| 0 0 | 0 0| 1 0| 3 0| 0 0| 4 0 | 4 0
FANNIN COUNTY
| 0 0| 0 0| 0 0| 0 0| 0 0 | 0 0| 6 0| 0 0| 1 2| 7 0 | 7 0
FAYETTE COUNTY
| 0 0| 0 0| 0 0| 0 0| 0 0 | 2 1| 5 0| 2 0| 0 0| 9 0 | 9 0
FLOYD COUNTY
| 0 0| 0 0| 0 0| 0 0| 0 0 | 3 2| 46 3| 16 2| 1 2| 66 3 | 66 3
FORSYTH COUNTY
| 0 0| 0 0| 0 0| 0 0| 0 0 | 0 0| 8 0| 6 1| 0 0| 14 1 | 14 1
FRANKLIN COUNTY
| 0 0| 0 0| 0 0| 0 0| 0 0 | 0 0| 4 0| 3 0| 1 2| 8 0 | 8 0
FULTON COUNTY
| 0 0| 0 0| 0 0| 0 0| 0 0 | 8 5| 64 4| 40 6| 8 12| 120 5 | 120 5
GILMER COUNTY
| 0 0| 0 0| 0 0| 0 0| 0 0 | 0 0| 0 0| 3 0| 0 0| 3 0 | 3 0
GLASCOCK COUNTY
| 0 0| 0 0| 0 0| 0 0| 0 0 | 0 0| 0 0| 0 0| 0 0| 0 0 | 0 0
GLYNN COUNTY
| 0 0| 0 0| 0 0| 0 0| 0 0 | 1 1| 18 1| 10 2| 1 2| 30 1 | 30 1
GORDON COUNTY
| 0 0| 0 0| 0 0| 0 0| 0 0 | 0 0| 16 1| 4 1| 0 0| 20 1 | 20 1
GRADY COUNTY
| 0 0| 0 0| 0 0| 0 0| 0 0 | 2 1| 19 1| 5 1| 0 0| 26 1 | 26 1
GREENE COUNTY
| 0 0| 0 0| 0 0| 0 0| 0 0 | 0 0| 1 0| 0 0| 0 0| 1 0 | 1 0
GWINNETT COUNTY
| 0 0| 0 0| 0 0| 0 0| 0 0 | 4 2| 41 2| 26 4| 4 6| 75 3 | 75 3
HABERSHAM COUNTY | 0 0| 0 0| 0 0| 0 0| 0 0 | 2 1| 1 0| 1 0| 0 0| 4 0 | 4 0
Georgia Dept. of Corrections
33
HALL COUNTY
| 0 0| 0 0| 0 0| 0 0| 0 0 | 4 2| 30 2| 8 1| 2 3| 44 2 | 44 2
HANCOCK COUNTY
| 0 0| 0 0| 0 0| 0 0| 0 0 | 0 0| 0 0| 1 0| 1 2| 2 0 | 2 0
HARALSON COUNTY
| 0 0| 0 0| 0 0| 0 0| 0 0 | 0 0| 8 0| 0 0| 0 0| 8 0 | 8 0
------------------------------------------------------------------------------------------------------------------------------------
(continued)
Georgia Dept. of Corrections
34
Page
26 Run 05/01/00
Georgia Department of Corrections Office of Planning and Analysis
FEMALES ONLY Inmate statistical profile
Sample: ACTIVE PRISONERS EXCLUDING JAIL
Requestor: Statistics
Active inmates 05/01/2000
County Of Conviction by current age & sex
(CONTINUED)
|
MEN
|
WOMEN
|
| Age | Age | Age | Age | Men
| Age | Age | Age | Age |Women
|Grand
County Of Conviction|00-21 %|22-39 %|40-54 %|55-99 %|Total % |00-21 %|22-39 %|40-54 %|55-99 %|Total % |Total %
------------------------------------------------------------------------------------------------------------------------------------
HARRIS COUNTY
| 0 0| 0 0| 0 0| 0 0| 0 0 | 1 1| 2 0| 0 0| 0 0| 3 0 | 3 0
HART COUNTY
| 0 0| 0 0| 0 0| 0 0| 0 0 | 1 1| 4 0| 1 0| 0 0| 6 0 | 6 0
HEARD COUNTY
| 0 0| 0 0| 0 0| 0 0| 0 0 | 1 1| 2 0| 0 0| 0 0| 3 0 | 3 0
HENRY COUNTY
| 0 0| 0 0| 0 0| 0 0| 0 0 | 1 1| 14 1| 4 1| 0 0| 19 1 | 19 1
HOUSTON COUNTY
| 0 0| 0 0| 0 0| 0 0| 0 0 | 0 0| 16 1| 6 1| 1 2| 23 1 | 23 1
IRWIN COUNTY
| 0 0| 0 0| 0 0| 0 0| 0 0 | 0 0| 1 0| 0 0| 0 0| 1 0 | 1 0
JACKSON COUNTY
| 0 0| 0 0| 0 0| 0 0| 0 0 | 2 1| 11 1| 3 0| 0 0| 16 1 | 16 1
JASPER COUNTY
| 0 0| 0 0| 0 0| 0 0| 0 0 | 0 0| 0 0| 2 0| 0 0| 2 0 | 2 0
JEFF DAVIS COUNTY | 0 0| 0 0| 0 0| 0 0| 0 0 | 0 0| 2 0| 1 0| 0 0| 3 0 | 3 0
JEFFERSON COUNTY | 0 0| 0 0| 0 0| 0 0| 0 0 | 0 0| 11 1| 1 0| 0 0| 12 0 | 12 0
JENKINS COUNTY
| 0 0| 0 0| 0 0| 0 0| 0 0 | 0 0| 5 0| 0 0| 0 0| 5 0 | 5 0
JOHNSON COUNTY
| 0 0| 0 0| 0 0| 0 0| 0 0 | 0 0| 4 0| 0 0| 0 0| 4 0 | 4 0
JONES COUNTY
| 0 0| 0 0| 0 0| 0 0| 0 0 | 0 0| 4 0| 0 0| 0 0| 4 0 | 4 0
LAMAR COUNTY
| 0 0| 0 0| 0 0| 0 0| 0 0 | 0 0| 1 0| 2 0| 0 0| 3 0 | 3 0
LANIER COUNTY
| 0 0| 0 0| 0 0| 0 0| 0 0 | 0 0| 4 0| 1 0| 0 0| 5 0 | 5 0
LAURENS COUNTY
| 0 0| 0 0| 0 0| 0 0| 0 0 | 1 1| 8 0| 3 0| 1 2| 13 1 | 13 1
LEE COUNTY
| 0 0| 0 0| 0 0| 0 0| 0 0 | 1 1| 1 0| 1 0| 0 0| 3 0 | 3 0
LIBERTY COUNTY
| 0 0| 0 0| 0 0| 0 0| 0 0 | 0 0| 13 1| 4 1| 0 0| 17 1 | 17 1
LINCOLN COUNTY
| 0 0| 0 0| 0 0| 0 0| 0 0 | 0 0| 1 0| 0 0| 0 0| 1 0 | 1 0
LONG COUNTY
| 0 0| 0 0| 0 0| 0 0| 0 0 | 0 0| 3 0| 0 0| 0 0| 3 0 | 3 0
LOWNDES COUNTY
| 0 0| 0 0| 0 0| 0 0| 0 0 | 2 1| 26 2| 14 2| 1 2| 43 2 | 43 2
LUMPKIN COUNTY
| 0 0| 0 0| 0 0| 0 0| 0 0 | 0 0| 1 0| 2 0| 0 0| 3 0 | 3 0
MACON COUNTY
| 0 0| 0 0| 0 0| 0 0| 0 0 | 0 0| 1 0| 2 0| 0 0| 3 0 | 3 0
MADISON COUNTY
| 0 0| 0 0| 0 0| 0 0| 0 0 | 0 0| 7 0| 1 0| 1 2| 9 0 | 9 0
MARION COUNTY
| 0 0| 0 0| 0 0| 0 0| 0 0 | 0 0| 0 0| 3 0| 0 0| 3 0 | 3 0
MCDUFFIE COUNTY
| 0 0| 0 0| 0 0| 0 0| 0 0 | 1 1| 4 0| 2 0| 0 0| 7 0 | 7 0
MCINTOSH COUNTY
| 0 0| 0 0| 0 0| 0 0| 0 0 | 1 1| 1 0| 0 0| 0 0| 2 0 | 2 0
MERIWETHER COUNTY | 0 0| 0 0| 0 0| 0 0| 0 0 | 0 0| 8 0| 4 1| 2 3| 14 1 | 14 1
MILLER COUNTY
| 0 0| 0 0| 0 0| 0 0| 0 0 | 2 1| 2 0| 0 0| 0 0| 4 0 | 4 0
MITCHELL COUNTY
| 0 0| 0 0| 0 0| 0 0| 0 0 | 3 2| 12 1| 3 0| 0 0| 18 1 | 18 1
MONROE COUNTY
| 0 0| 0 0| 0 0| 0 0| 0 0 | 0 0| 2 0| 1 0| 0 0| 3 0 | 3 0
MONTGOMERY COUNTY | 0 0| 0 0| 0 0| 0 0| 0 0 | 0 0| 0 0| 2 0| 0 0| 2 0 | 2 0
MORGAN COUNTY
| 0 0| 0 0| 0 0| 0 0| 0 0 | 0 0| 5 0| 0 0| 0 0| 5 0 | 5 0
Georgia Dept. of Corrections
35
MURRAY COUNTY
| 0 0| 0 0| 0 0| 0 0| 0 0 | 0 0| 6 0| 2 0| 0 0| 8 0 | 8 0
MUSCOGEE COUNTY
| 0 0| 0 0| 0 0| 0 0| 0 0 | 8 5| 69 4| 30 5| 2 3| 109 4 | 109 4
------------------------------------------------------------------------------------------------------------------------------------
(continued)
Georgia Department of Corrections
Page 27 Run 05/01/00
Office of Planning and Analysis
FEMALES ONLY Inmate statistical profile
Sample: ACTIVE PRISONERS EXCLUDING JAIL
Requestor: Statistics
Active inmates 05/01/2000
County Of Conviction by current age & sex
(CONTINUED)
|
MEN
|
WOMEN
|
| Age | Age | Age | Age | Men
| Age | Age | Age | Age |Women
|Grand
County Of Conviction|00-21 %|22-39 %|40-54 %|55-99 %|Total % |00-21 %|22-39 %|40-54 %|55-99 %|Total % |Total %
------------------------------------------------------------------------------------------------------------------------------------
NEWTON COUNTY
| 0 0| 0 0| 0 0| 0 0| 0 0 | 2 1| 12 1| 7 1| 2 3| 23 1 | 23 1
OCONEE COUNTY
| 0 0| 0 0| 0 0| 0 0| 0 0 | 0 0| 1 0| 0 0| 0 0| 1 0 | 1 0
OGLETHORPE COUNTY | 0 0| 0 0| 0 0| 0 0| 0 0 | 0 0| 0 0| 0 0| 0 0| 0 0 | 0 0
PAULDING COUNTY
| 0 0| 0 0| 0 0| 0 0| 0 0 | 0 0| 4 0| 3 0| 0 0| 7 0 | 7 0
PEACH COUNTY
| 0 0| 0 0| 0 0| 0 0| 0 0 | 0 0| 1 0| 2 0| 0 0| 3 0 | 3 0
PICKENS COUNTY
| 0 0| 0 0| 0 0| 0 0| 0 0 | 0 0| 5 0| 6 1| 0 0| 11 0 | 11 0
PIERCE COUNTY
| 0 0| 0 0| 0 0| 0 0| 0 0 | 0 0| 0 0| 0 0| 0 0| 0 0 | 0 0
PIKE COUNTY
| 0 0| 0 0| 0 0| 0 0| 0 0 | 0 0| 0 0| 1 0| 0 0| 1 0 | 1 0
POLK COUNTY
| 0 0| 0 0| 0 0| 0 0| 0 0 | 0 0| 1 0| 0 0| 0 0| 1 0 | 1 0
PULASKI COUNTY
| 0 0| 0 0| 0 0| 0 0| 0 0 | 0 0| 8 0| 1 0| 0 0| 9 0 | 9 0
PUTNAM COUNTY
| 0 0| 0 0| 0 0| 0 0| 0 0 | 0 0| 4 0| 1 0| 1 2| 6 0 | 6 0
QUITMAN COUNTY
| 0 0| 0 0| 0 0| 0 0| 0 0 | 0 0| 0 0| 1 0| 1 2| 2 0 | 2 0
RABUN COUNTY
| 0 0| 0 0| 0 0| 0 0| 0 0 | 0 0| 0 0| 3 0| 0 0| 3 0 | 3 0
RANDOLPH COUNTY
| 0 0| 0 0| 0 0| 0 0| 0 0 | 0 0| 3 0| 2 0| 0 0| 5 0 | 5 0
RICHMOND COUNTY
| 0 0| 0 0| 0 0| 0 0| 0 0 | 6 3| 95 6| 42 6| 1 2| 144 6 | 144 6
ROCKDALE COUNTY
| 0 0| 0 0| 0 0| 0 0| 0 0 | 0 0| 5 0| 7 1| 0 0| 12 0 | 12 0
SCHLEY COUNTY
| 0 0| 0 0| 0 0| 0 0| 0 0 | 0 0| 1 0| 0 0| 0 0| 1 0 | 1 0
SCREVEN COUNTY
| 0 0| 0 0| 0 0| 0 0| 0 0 | 3 2| 8 0| 0 0| 0 0| 11 0 | 11 0
SEMINOLE COUNTY
| 0 0| 0 0| 0 0| 0 0| 0 0 | 0 0| 2 0| 2 0| 0 0| 4 0 | 4 0
SPALDING COUNTY
| 0 0| 0 0| 0 0| 0 0| 0 0 | 6 3| 25 1| 10 2| 2 3| 43 2 | 43 2
STEPHENS COUNTY
| 0 0| 0 0| 0 0| 0 0| 0 0 | 0 0| 4 0| 0 0| 0 0| 4 0 | 4 0
STEWART COUNTY
| 0 0| 0 0| 0 0| 0 0| 0 0 | 0 0| 0 0| 2 0| 0 0| 2 0 | 2 0
SUMTER COUNTY
| 0 0| 0 0| 0 0| 0 0| 0 0 | 1 1| 7 0| 5 1| 0 0| 13 1 | 13 1
TALBOT COUNTY
| 0 0| 0 0| 0 0| 0 0| 0 0 | 0 0| 1 0| 1 0| 0 0| 2 0 | 2 0
TALIAFERRO COUNTY | 0 0| 0 0| 0 0| 0 0| 0 0 | 0 0| 0 0| 1 0| 0 0| 1 0 | 1 0
TATTNALL COUNTY
| 0 0| 0 0| 0 0| 0 0| 0 0 | 0 0| 2 0| 3 0| 0 0| 5 0 | 5 0
TAYLOR COUNTY
| 0 0| 0 0| 0 0| 0 0| 0 0 | 2 1| 1 0| 0 0| 0 0| 3 0 | 3 0
TELFAIR COUNTY
| 0 0| 0 0| 0 0| 0 0| 0 0 | 1 1| 7 0| 3 0| 0 0| 11 0 | 11 0
TERRELL COUNTY
| 0 0| 0 0| 0 0| 0 0| 0 0 | 0 0| 2 0| 0 0| 0 0| 2 0 | 2 0
THOMAS COUNTY
| 0 0| 0 0| 0 0| 0 0| 0 0 | 1 1| 10 1| 5 1| 0 0| 16 1 | 16 1
TIFT COUNTY
| 0 0| 0 0| 0 0| 0 0| 0 0 | 3 2| 8 0| 3 0| 1 2| 15 1 | 15 1
TOOMBS COUNTY
| 0 0| 0 0| 0 0| 0 0| 0 0 | 2 1| 16 1| 2 0| 0 0| 20 1 | 20 1
TOWNS COUNTY
| 0 0| 0 0| 0 0| 0 0| 0 0 | 0 0| 0 0| 0 0| 0 0| 0 0 | 0 0
TREUTLEN COUNTY
| 0 0| 0 0| 0 0| 0 0| 0 0 | 0 0| 1 0| 1 0| 0 0| 2 0 | 2 0
Georgia Dept. of Corrections
36
TROUP COUNTY
| 0 0| 0 0| 0 0| 0 0| 0 0 | 3 2| 30 2| 13 2| 0 0| 46 2 | 46 2
------------------------------------------------------------------------------------------------------------------------------------
(continued)
Georgia Dept. of Corrections
37
Page
28 Run 05/01/00
Georgia Department of Corrections Office of Planning and Analysis
FEMALES ONLY Inmate statistical profile
Sample: ACTIVE PRISONERS EXCLUDING JAIL
Requestor:
Active inmates 05/01/2000
County Of Conviction by current age & sex
Statistics (CONTINUED)
|
MEN
|
WOMEN
|
| Age | Age | Age | Age | Men
| Age | Age | Age | Age |Women
|Grand
County Of Conviction|00-21 %|22-39 %|40-54 %|55-99 %|Total % |00-21 %|22-39 %|40-54 %|55-99 %|Total % |Total %
------------------------------------------------------------------------------------------------------------------------------------
TURNER COUNTY
| 0 0| 0 0| 0 0| 0 0| 0 0 | 0 0| 3 0| 0 0| 0 0| 3 0 | 3 0
TWIGGS COUNTY
| 0 0| 0 0| 0 0| 0 0| 0 0 | 0 0| 0 0| 0 0| 0 0| 0 0 | 0 0
UNION COUNTY
| 0 0| 0 0| 0 0| 0 0| 0 0 | 0 0| 1 0| 0 0| 0 0| 1 0 | 1 0
UPSON COUNTY
| 0 0| 0 0| 0 0| 0 0| 0 0 | 1 1| 7 0| 1 0| 0 0| 9 0 | 9 0
WALKER COUNTY
| 0 0| 0 0| 0 0| 0 0| 0 0 | 0 0| 13 1| 5 1| 0 0| 18 1 | 18 1
WALTON COUNTY
| 0 0| 0 0| 0 0| 0 0| 0 0 | 0 0| 13 1| 3 0| 0 0| 16 1 | 16 1
WARE COUNTY
| 0 0| 0 0| 0 0| 0 0| 0 0 | 1 1| 23 1| 1 0| 0 0| 25 1 | 25 1
WARREN COUNTY
| 0 0| 0 0| 0 0| 0 0| 0 0 | 0 0| 0 0| 1 0| 0 0| 1 0 | 1 0
WASHINGTON COUNTY | 0 0| 0 0| 0 0| 0 0| 0 0 | 0 0| 5 0| 3 0| 0 0| 8 0 | 8 0
WAYNE COUNTY
| 0 0| 0 0| 0 0| 0 0| 0 0 | 0 0| 3 0| 0 0| 0 0| 3 0 | 3 0
WEBSTER COUNTY
| 0 0| 0 0| 0 0| 0 0| 0 0 | 0 0| 1 0| 0 0| 0 0| 1 0 | 1 0
WHEELER COUNTY
| 0 0| 0 0| 0 0| 0 0| 0 0 | 0 0| 0 0| 0 0| 1 2| 1 0 | 1 0
WHITE COUNTY
| 0 0| 0 0| 0 0| 0 0| 0 0 | 0 0| 4 0| 1 0| 0 0| 5 0 | 5 0
WHITFIELD COUNTY | 0 0| 0 0| 0 0| 0 0| 0 0 | 2 1| 36 2| 7 1| 0 0| 45 2 | 45 2
WILCOX COUNTY
| 0 0| 0 0| 0 0| 0 0| 0 0 | 0 0| 4 0| 0 0| 0 0| 4 0 | 4 0
WILKES COUNTY
| 0 0| 0 0| 0 0| 0 0| 0 0 | 0 0| 7 0| 0 0| 0 0| 7 0 | 7 0
WILKINSON COUNTY | 0 0| 0 0| 0 0| 0 0| 0 0 | 0 0| 2 0| 0 0| 0 0| 2 0 | 2 0
WORTH COUNTY
| 0 0| 0 0| 0 0| 0 0| 0 0 | 0 0| 4 0| 0 0| 0 0| 4 0 | 4 0
CONVERSION
| 0 0| 0 0| 0 0| 0 0| 0 0 | 0 0| 0 0| 0 0| 0 0| 0 0 | 0 0
------------------------------------------------------------------------------------------------------------------------------------
Total reported
| 0 0| 0 0| 0 0| 0 0| 0 0 | 174 100| 1683 100| 663 100| 65 100| 2585 100 | 2585 100
|
|
|
|
|
|
|
|
|
|
|
Percent reported |
.0|
.0|
.0|
.0|
.0 |
94.6|
96.0|
97.2|
98.5|
96.3 |
96.3
|
|
|
|
|
|
|
|
|
|
|
|
|
|
|
|
|
|
|
|
|
|
UNKNOWN
|0|0|0|0|0
| 10 | 70 | 19 | 1 | 100
| 100
------------------------------------------------------------------------------------------------------------------------------------
Total
|0|0|0|0|0
| 184 | 1753 | 682 | 66 | 2685
| 2685
Georgia Dept. of Corrections
38
Page
29 Run 05/01/00
Georgia Department of Corrections Office of Planning and Analysis
FEMALES ONLY Inmate statistical profile
Sample: ACTIVE PRISONERS EXCLUDING JAIL Active inmates 05/01/2000
Requestor: Statistics Circuit Of Conviction by current age & sex
|
MEN
|
WOMEN
|
| Age | Age | Age | Age | Men
| Age | Age | Age | Age |Women
|Grand
Circ Of Conviction |00-21 %|22-39 %|40-54 %|55-99 %|Total % |00-21 %|22-39 %|40-54 %|55-99 %|Total % |Total %
------------------------------------------------------------------------------------------------------------------------------------
ALAPAHA CIRCUIT
| 0 0| 0 0| 0 0| 0 0| 0 0 | 0 0| 20 1| 7 1| 0 0| 27 1 | 27 1
ALCOVY CIRCUIT
| 0 0| 0 0| 0 0| 0 0| 0 0 | 2 1| 25 1| 10 2| 2 3| 39 2 | 39 2
ATLANTA CIRCUIT
| 0 0| 0 0| 0 0| 0 0| 0 0 | 8 5| 64 4| 40 6| 8 12| 120 5 | 120 5
ATLANTIC CIRCUIT | 0 0| 0 0| 0 0| 0 0| 0 0 | 1 1| 22 1| 10 2| 1 2| 34 1 | 34 1
AUGUSTA CIRCUIT
| 0 0| 0 0| 0 0| 0 0| 0 0 | 8 5| 109 6| 49 7| 1 2| 167 6 | 167 6
BLUE RIDGE CIRCUIT | 0 0| 0 0| 0 0| 0 0| 0 0 | 3 2| 27 2| 12 2| 0 0| 42 2 | 42 2
BRUNSWICK CIRCUIT | 0 0| 0 0| 0 0| 0 0| 0 0 | 3 2| 27 2| 14 2| 2 3| 46 2 | 46 2
CHATTAHOOCHEE CIRCUI| 0 0| 0 0| 0 0| 0 0| 0 0 | 11 6| 73 4| 34 5| 2 3| 120 5 | 120 5
CHEROKEE CIRCUIT | 0 0| 0 0| 0 0| 0 0| 0 0 | 1 1| 36 2| 8 1| 0 0| 45 2 | 45 2
CLAYTON CIRCUIT
| 0 0| 0 0| 0 0| 0 0| 0 0 | 10 6| 100 6| 34 5| 4 6| 148 6 | 148 6
COBB CIRCUIT
| 0 0| 0 0| 0 0| 0 0| 0 0 | 12 7| 95 6| 42 6| 4 6| 153 6 | 153 6
CONASAUGA CIRCUIT | 0 0| 0 0| 0 0| 0 0| 0 0 | 2 1| 42 3| 9 1| 0 0| 53 2 | 53 2
CORDELE CIRCUIT
| 0 0| 0 0| 0 0| 0 0| 0 0 | 2 1| 27 2| 5 1| 2 3| 36 1 | 36 1
COWETA CIRCUIT
| 0 0| 0 0| 0 0| 0 0| 0 0 | 12 7| 93 6| 28 4| 2 3| 135 5 | 135 5
DOUGHERTY CIRCUIT | 0 0| 0 0| 0 0| 0 0| 0 0 | 3 2| 29 2| 14 2| 0 0| 46 2 | 46 2
DUBLIN CIRCUIT
| 0 0| 0 0| 0 0| 0 0| 0 0 | 1 1| 13 1| 4 1| 1 2| 19 1 | 19 1
EASTERN CIRCUIT
| 0 0| 0 0| 0 0| 0 0| 0 0 | 12 7| 91 5| 38 6| 2 3| 143 6 | 143 6
FLINT CIRCUIT
| 0 0| 0 0| 0 0| 0 0| 0 0 | 1 1| 18 1| 5 1| 0 0| 24 1 | 24 1
GRIFFIN CIRCUIT
| 0 0| 0 0| 0 0| 0 0| 0 0 | 9 5| 37 2| 14 2| 2 3| 62 2 | 62 2
GWINNETT CIRCUIT | 0 0| 0 0| 0 0| 0 0| 0 0 | 4 2| 41 2| 26 4| 4 6| 75 3 | 75 3
HOUSTON CIRCUIT
| 0 0| 0 0| 0 0| 0 0| 0 0 | 0 0| 16 1| 6 1| 1 2| 23 1 | 23 1
LOOKOUT MOUNTAIN CIR| 0 0| 0 0| 0 0| 0 0| 0 0 | 1 1| 31 2| 7 1| 2 3| 41 2 | 41 2
MACON CIRCUIT
| 0 0| 0 0| 0 0| 0 0| 0 0 | 6 3| 27 2| 26 4| 2 3| 61 2 | 61 2
MIDDLE CIRCUIT
| 0 0| 0 0| 0 0| 0 0| 0 0 | 2 1| 41 2| 8 1| 0 0| 51 2 | 51 2
MOUNTAIN CIRCUIT | 0 0| 0 0| 0 0| 0 0| 0 0 | 2 1| 5 0| 4 1| 0 0| 11 0 | 11 0
NORTHEASTERN CIRCUIT| 0 0| 0 0| 0 0| 0 0| 0 0 | 4 2| 31 2| 8 1| 2 3| 45 2 | 45 2
NORTHERN CIRCUIT | 0 0| 0 0| 0 0| 0 0| 0 0 | 2 1| 23 1| 8 1| 2 3| 35 1 | 35 1
OCMULGEE CIRCUIT | 0 0| 0 0| 0 0| 0 0| 0 0 | 2 1| 35 2| 5 1| 2 3| 44 2 | 44 2
OCONEE CIRCUIT
| 0 0| 0 0| 0 0| 0 0| 0 0 | 5 3| 37 2| 10 2| 1 2| 53 2 | 53 2
OGEECHEE CIRCUIT | 0 0| 0 0| 0 0| 0 0| 0 0 | 4 2| 37 2| 7 1| 3 5| 51 2 | 51 2
PATAULA CIRCUIT
| 0 0| 0 0| 0 0| 0 0| 0 0 | 2 1| 12 1| 6 1| 1 2| 21 1 | 21 1
PIEDMONT CIRCUIT | 0 0| 0 0| 0 0| 0 0| 0 0 | 3 2| 16 1| 9 1| 0 0| 28 1 | 28 1
ROME CIRCUIT
| 0 0| 0 0| 0 0| 0 0| 0 0 | 3 2| 46 3| 16 2| 1 2| 66 3 | 66 3
Georgia Dept. of Corrections
39
SOUTH GEORGIA CIRCUI| 0 0| 0 0| 0 0| 0 0| 0 0 | 5 3| 50 3| 13 2| 0 0| 68 3 | 68 3
SOUTHERN CIRCUIT | 0 0| 0 0| 0 0| 0 0| 0 0 | 3 2| 53 3| 25 4| 2 3| 83 3 | 83 3
------------------------------------------------------------------------------------------------------------------------------------
(continued)
Georgia Department of Corrections
Page 30 Run 05/01/00
Office of Planning and Analysis
FEMALES ONLY Inmate statistical profile
Sample: ACTIVE PRISONERS EXCLUDING JAIL
Requestor: Statistics
Active inmates 05/01/2000
Circuit Of Conviction by current age & sex
(Continued)
|
MEN
|
WOMEN
|
| Age | Age | Age | Age | Men
| Age | Age | Age | Age |Women
|Grand
Circ Of Conviction |00-21 %|22-39 %|40-54 %|55-99 %|Total % |00-21 %|22-39 %|40-54 %|55-99 %|Total % |Total %
------------------------------------------------------------------------------------------------------------------------------------
SOUTHWESTERN CIRCUIT| 0 0| 0 0| 0 0| 0 0| 0 0 | 2 1| 11 1| 10 2| 0 0| 23 1 | 23 1
STONE MOUNTAIN CIRCU| 0 0| 0 0| 0 0| 0 0| 0 0 | 14 8| 59 4| 26 4| 5 8| 104 4 | 104 4
TALLAPOOSA CIRCUIT | 0 0| 0 0| 0 0| 0 0| 0 0 | 0 0| 13 1| 3 0| 0 0| 16 1 | 16 1
TIFTON CIRCUIT
| 0 0| 0 0| 0 0| 0 0| 0 0 | 3 2| 16 1| 3 0| 1 2| 23 1 | 23 1
TOOMBS CIRCUIT
| 0 0| 0 0| 0 0| 0 0| 0 0 | 1 1| 12 1| 4 1| 0 0| 17 1 | 17 1
WAYCROSS CIRCUIT | 0 0| 0 0| 0 0| 0 0| 0 0 | 2 1| 41 2| 7 1| 0 0| 50 2 | 50 2
WESTERN CIRCUIT
| 0 0| 0 0| 0 0| 0 0| 0 0 | 0 0| 25 1| 12 2| 2 3| 39 2 | 39 2
ROCKDALE CIRCUIT | 0 0| 0 0| 0 0| 0 0| 0 0 | 0 0| 5 0| 7 1| 0 0| 12 0 | 12 0
DOUGLAS CIRCUIT
| 0 0| 0 0| 0 0| 0 0| 0 0 | 3 2| 25 1| 13 2| 0 0| 41 2 | 41 2
APPALACHIAN CIRCUIT | 0 0| 0 0| 0 0| 0 0| 0 0 | 0 0| 11 1| 9 1| 1 2| 21 1 | 21 1
ENOTAH CIRCUIT
| 0 0| 0 0| 0 0| 0 0| 0 0 | 0 0| 6 0| 3 0| 0 0| 9 0 | 9 0
BELL-FORSYTH CIRCUIT| 0 0| 0 0| 0 0| 0 0| 0 0 | 0 0| 5 0| 1 0| 0 0| 6 0 | 6 0
------------------------------------------------------------------------------------------------------------------------------------
Total reported
| 0 0| 0 0| 0 0| 0 0| 0 0 | 174 100| 1678 100| 659 100| 65 100| 2576 100 | 2576 100
|
|
|
|
|
|
|
|
|
|
|
Percent reported |
.0|
.0|
.0|
.0|
.0 |
94.6|
95.7|
96.6|
98.5|
95.9 |
95.9
|
|
|
|
|
|
|
|
|
|
|
|
|
|
|
|
|
|
|
|
|
|
NOT REPORTED
|0|0|0|0|0
| 10 | 75 | 23 | 1 | 109
| 109
------------------------------------------------------------------------------------------------------------------------------------
Total
|0|0|0|0|0
| 184 | 1753 | 682 | 66 | 2685
| 2685
Georgia Dept. of Corrections
40
Page
31 Run 05/01/00
Georgia Department of Corrections Office of Planning and Analysis
FEMALES ONLY Inmate statistical profile
Sample: ACTIVE PRISONERS EXCLUDING JAIL Active inmates 05/01/2000
Requestor: Statistics Home County by current age & sex
|
MEN
|
WOMEN
|
| Age | Age | Age | Age | Men
| Age | Age | Age | Age |Women
|Grand
Home County
|00-21 %|22-39 %|40-54 %|55-99 %|Total % |00-21 %|22-39 %|40-54 %|55-99 %|Total % |Total %
------------------------------------------------------------------------------------------------------------------------------------
APPLING COUNTY
| 0 0| 0 0| 0 0| 0 0| 0 0 | 0 0| 4 0| 0 0| 0 0| 4 0 | 4 0
ATKINSON COUNTY
| 0 0| 0 0| 0 0| 0 0| 0 0 | 0 0| 0 0| 0 0| 0 0| 0 0 | 0 0
BACON COUNTY
| 0 0| 0 0| 0 0| 0 0| 0 0 | 0 0| 2 0| 1 0| 0 0| 3 0 | 3 0
BAKER COUNTY
| 0 0| 0 0| 0 0| 0 0| 0 0 | 0 0| 1 0| 0 0| 0 0| 1 0 | 1 0
BALDWIN COUNTY
| 0 0| 0 0| 0 0| 0 0| 0 0 | 2 1| 15 1| 2 0| 1 2| 20 1 | 20 1
BANKS COUNTY
| 0 0| 0 0| 0 0| 0 0| 0 0 | 1 1| 1 0| 2 0| 0 0| 4 0 | 4 0
BARROW COUNTY
| 0 0| 0 0| 0 0| 0 0| 0 0 | 0 0| 8 0| 3 0| 0 0| 11 0 | 11 0
BARTOW COUNTY
| 0 0| 0 0| 0 0| 0 0| 0 0 | 2 1| 22 1| 8 1| 0 0| 32 1 | 32 1
BEN HILL COUNTY
| 0 0| 0 0| 0 0| 0 0| 0 0 | 0 0| 7 0| 5 1| 0 0| 12 0 | 12 0
BERRIEN COUNTY
| 0 0| 0 0| 0 0| 0 0| 0 0 | 0 0| 5 0| 1 0| 0 0| 6 0 | 6 0
BIBB COUNTY
| 0 0| 0 0| 0 0| 0 0| 0 0 | 7 4| 36 2| 24 4| 1 2| 68 3 | 68 3
BLECKLEY COUNTY
| 0 0| 0 0| 0 0| 0 0| 0 0 | 1 1| 6 0| 2 0| 0 0| 9 0 | 9 0
BRANTLEY COUNTY
| 0 0| 0 0| 0 0| 0 0| 0 0 | 0 0| 3 0| 1 0| 0 0| 4 0 | 4 0
BROOKS COUNTY
| 0 0| 0 0| 0 0| 0 0| 0 0 | 0 0| 1 0| 2 0| 0 0| 3 0 | 3 0
BRYAN COUNTY
| 0 0| 0 0| 0 0| 0 0| 0 0 | 0 0| 2 0| 2 0| 0 0| 4 0 | 4 0
BULLOCH COUNTY
| 0 0| 0 0| 0 0| 0 0| 0 0 | 0 0| 17 1| 5 1| 1 2| 23 1 | 23 1
BURKE COUNTY
| 0 0| 0 0| 0 0| 0 0| 0 0 | 0 0| 5 0| 2 0| 0 0| 7 0 | 7 0
BUTTS COUNTY
| 0 0| 0 0| 0 0| 0 0| 0 0 | 0 0| 7 0| 1 0| 0 0| 8 0 | 8 0
CALHOUN COUNTY
| 0 0| 0 0| 0 0| 0 0| 0 0 | 0 0| 2 0| 1 0| 0 0| 3 0 | 3 0
CAMDEN COUNTY
| 0 0| 0 0| 0 0| 0 0| 0 0 | 1 1| 3 0| 2 0| 0 0| 6 0 | 6 0
CANDLER COUNTY
| 0 0| 0 0| 0 0| 0 0| 0 0 | 0 0| 2 0| 1 0| 0 0| 3 0 | 3 0
CARROLL COUNTY
| 0 0| 0 0| 0 0| 0 0| 0 0 | 6 4| 28 2| 9 1| 0 0| 43 2 | 43 2
CATOOSA COUNTY
| 0 0| 0 0| 0 0| 0 0| 0 0 | 0 0| 7 0| 0 0| 0 0| 7 0 | 7 0
CHARLTON COUNTY
| 0 0| 0 0| 0 0| 0 0| 0 0 | 0 0| 2 0| 2 0| 0 0| 4 0 | 4 0
CHATHAM COUNTY
| 0 0| 0 0| 0 0| 0 0| 0 0 | 10 6| 85 5| 29 5| 4 6| 128 5 | 128 5
CHATTAHOOCHEE COUNTY| 0 0| 0 0| 0 0| 0 0| 0 0 | 0 0| 0 0| 0 0| 0 0| 0 0 | 0 0
CHATTOOGA COUNTY | 0 0| 0 0| 0 0| 0 0| 0 0 | 1 1| 8 0| 2 0| 1 2| 12 0 | 12 0
CHEROKEE COUNTY
| 0 0| 0 0| 0 0| 0 0| 0 0 | 2 1| 19 1| 5 1| 0 0| 26 1 | 26 1
CLARKE COUNTY
| 0 0| 0 0| 0 0| 0 0| 0 0 | 1 1| 25 2| 11 2| 3 5| 40 2 | 40 2
CLAY COUNTY
| 0 0| 0 0| 0 0| 0 0| 0 0 | 0 0| 1 0| 0 0| 0 0| 1 0 | 1 0
CLAYTON COUNTY
| 0 0| 0 0| 0 0| 0 0| 0 0 | 9 5| 58 4| 17 3| 3 5| 87 3 | 87 3
CLINCH COUNTY
| 0 0| 0 0| 0 0| 0 0| 0 0 | 0 0| 2 0| 1 0| 0 0| 3 0 | 3 0
COBB COUNTY
| 0 0| 0 0| 0 0| 0 0| 0 0 | 13 8| 88 5| 31 5| 1 2| 133 5 | 133 5
Georgia Dept. of Corrections
41
COFFEE COUNTY
| 0 0| 0 0| 0 0| 0 0| 0 0 | 2 1| 14 1| 5 1| 1 2| 22 1 | 22 1
COLQUITT COUNTY
| 0 0| 0 0| 0 0| 0 0| 0 0 | 0 0| 18 1| 4 1| 0 0| 22 1 | 22 1
COLUMBIA COUNTY
| 0 0| 0 0| 0 0| 0 0| 0 0 | 2 1| 10 1| 5 1| 0 0| 17 1 | 17 1
------------------------------------------------------------------------------------------------------------------------------------
(continued)
Georgia Dept. of Corrections
42
Page 32 Run 05/01/00
Georgia Department of Corrections Office of Planning and Analysis
FEMALES ONLY Inmate statistical profile
Sample: ACTIVE PRISONERS EXCLUDING JAIL
Requestor: Statistics
Active inmates 05/01/2000
Home County by current age & sex
(CONTINUED)
|
MEN
|
WOMEN
|
| Age | Age | Age | Age | Men
| Age | Age | Age | Age |Women
|Grand
Home County
|00-21 %|22-39 %|40-54 %|55-99 %|Total % |00-21 %|22-39 %|40-54 %|55-99 %|Total % |Total %
------------------------------------------------------------------------------------------------------------------------------------
COOK COUNTY
| 0 0| 0 0| 0 0| 0 0| 0 0 | 0 0| 9 1| 3 0| 0 0| 12 0 | 12 0
COWETA COUNTY
| 0 0| 0 0| 0 0| 0 0| 0 0 | 2 1| 26 2| 2 0| 0 0| 30 1 | 30 1
CRAWFORD COUNTY
| 0 0| 0 0| 0 0| 0 0| 0 0 | 0 0| 0 0| 0 0| 0 0| 0 0 | 0 0
CRISP COUNTY
| 0 0| 0 0| 0 0| 0 0| 0 0 | 3 2| 10 1| 1 0| 1 2| 15 1 | 15 1
DADE COUNTY
| 0 0| 0 0| 0 0| 0 0| 0 0 | 0 0| 1 0| 0 0| 0 0| 1 0 | 1 0
DAWSON COUNTY
| 0 0| 0 0| 0 0| 0 0| 0 0 | 0 0| 2 0| 0 0| 0 0| 2 0 | 2 0
DECATUR COUNTY
| 0 0| 0 0| 0 0| 0 0| 0 0 | 0 0| 12 1| 4 1| 0 0| 16 1 | 16 1
DEKALB COUNTY
| 0 0| 0 0| 0 0| 0 0| 0 0 | 11 7| 62 4| 27 4| 5 8| 105 4 | 105 4
DODGE COUNTY
| 0 0| 0 0| 0 0| 0 0| 0 0 | 2 1| 17 1| 2 0| 0 0| 21 1 | 21 1
DOOLY COUNTY
| 0 0| 0 0| 0 0| 0 0| 0 0 | 0 0| 4 0| 0 0| 0 0| 4 0 | 4 0
DOUGHERTY COUNTY | 0 0| 0 0| 0 0| 0 0| 0 0 | 3 2| 34 2| 17 3| 1 2| 55 2 | 55 2
DOUGLAS COUNTY
| 0 0| 0 0| 0 0| 0 0| 0 0 | 3 2| 16 1| 8 1| 0 0| 27 1 | 27 1
EARLY COUNTY
| 0 0| 0 0| 0 0| 0 0| 0 0 | 0 0| 3 0| 1 0| 0 0| 4 0 | 4 0
ECHOLS COUNTY.
| 0 0| 0 0| 0 0| 0 0| 0 0 | 0 0| 0 0| 0 0| 0 0| 0 0 | 0 0
EFFINGHAM COUNTY | 0 0| 0 0| 0 0| 0 0| 0 0 | 1 1| 5 0| 3 0| 1 2| 10 0 | 10 0
ELBERT COUNTY
| 0 0| 0 0| 0 0| 0 0| 0 0 | 0 0| 7 0| 4 1| 0 0| 11 0 | 11 0
EMANUEL COUNTY
| 0 0| 0 0| 0 0| 0 0| 0 0 | 0 0| 5 0| 2 0| 0 0| 7 0 | 7 0
EVANS COUNTY
| 0 0| 0 0| 0 0| 0 0| 0 0 | 0 0| 1 0| 3 0| 0 0| 4 0 | 4 0
FANNIN COUNTY
| 0 0| 0 0| 0 0| 0 0| 0 0 | 0 0| 5 0| 0 0| 1 2| 6 0 | 6 0
FAYETTE COUNTY
| 0 0| 0 0| 0 0| 0 0| 0 0 | 0 0| 6 0| 1 0| 0 0| 7 0 | 7 0
FLOYD COUNTY
| 0 0| 0 0| 0 0| 0 0| 0 0 | 3 2| 43 3| 12 2| 1 2| 59 2 | 59 2
FORSYTH COUNTY
| 0 0| 0 0| 0 0| 0 0| 0 0 | 0 0| 7 0| 6 1| 0 0| 13 1 | 13 1
FRANKLIN COUNTY
| 0 0| 0 0| 0 0| 0 0| 0 0 | 0 0| 3 0| 1 0| 1 2| 5 0 | 5 0
FULTON COUNTY
| 0 0| 0 0| 0 0| 0 0| 0 0 | 13 8| 112 7| 68 11| 8 13| 201 8 | 201 8
GILMER COUNTY
| 0 0| 0 0| 0 0| 0 0| 0 0 | 0 0| 2 0| 1 0| 0 0| 3 0 | 3 0
GLASCOCK COUNTY
| 0 0| 0 0| 0 0| 0 0| 0 0 | 0 0| 0 0| 0 0| 0 0| 0 0 | 0 0
GLYNN COUNTY
| 0 0| 0 0| 0 0| 0 0| 0 0 | 2 1| 18 1| 7 1| 1 2| 28 1 | 28 1
GORDON COUNTY
| 0 0| 0 0| 0 0| 0 0| 0 0 | 0 0| 16 1| 4 1| 0 0| 20 1 | 20 1
GRADY COUNTY
| 0 0| 0 0| 0 0| 0 0| 0 0 | 1 1| 8 0| 5 1| 0 0| 14 1 | 14 1
GREENE COUNTY
| 0 0| 0 0| 0 0| 0 0| 0 0 | 0 0| 2 0| 2 0| 0 0| 4 0 | 4 0
GWINNETT COUNTY
| 0 0| 0 0| 0 0| 0 0| 0 0 | 1 1| 37 2| 18 3| 3 5| 59 2 | 59 2
HABERSHAM COUNTY | 0 0| 0 0| 0 0| 0 0| 0 0 | 1 1| 1 0| 1 0| 0 0| 3 0 | 3 0
HALL COUNTY
| 0 0| 0 0| 0 0| 0 0| 0 0 | 3 2| 31 2| 8 1| 2 3| 44 2 | 44 2
HANCOCK COUNTY
| 0 0| 0 0| 0 0| 0 0| 0 0 | 0 0| 0 0| 1 0| 1 2| 2 0 | 2 0
HARALSON COUNTY
| 0 0| 0 0| 0 0| 0 0| 0 0 | 1 1| 7 0| 0 0| 0 0| 8 0 | 8 0
Georgia Dept. of Corrections
43
------------------------------------------------------------------------------------------------------------------------------------
(continued)
Georgia Department of Corrections
Page 33 Run 05/01/00
Office of Planning and Analysis
FEMALES ONLY Inmate statistical profile
Sample: ACTIVE PRISONERS EXCLUDING JAIL
Requestor: Statistics
Active inmates 05/01/2000
Home County by current age & sex
(CONTINUED)
|
MEN
|
WOMEN
|
| Age | Age | Age | Age | Men
| Age | Age | Age | Age |Women
|Grand
Home County
|00-21 %|22-39 %|40-54 %|55-99 %|Total % |00-21 %|22-39 %|40-54 %|55-99 %|Total % |Total %
------------------------------------------------------------------------------------------------------------------------------------
HARRIS COUNTY
| 0 0| 0 0| 0 0| 0 0| 0 0 | 0 0| 4 0| 0 0| 0 0| 4 0 | 4 0
HART COUNTY
| 0 0| 0 0| 0 0| 0 0| 0 0 | 1 1| 3 0| 1 0| 0 0| 5 0 | 5 0
HEARD COUNTY
| 0 0| 0 0| 0 0| 0 0| 0 0 | 0 0| 2 0| 0 0| 0 0| 2 0 | 2 0
HENRY COUNTY
| 0 0| 0 0| 0 0| 0 0| 0 0 | 4 2| 6 0| 7 1| 0 0| 17 1 | 17 1
HOUSTON COUNTY
| 0 0| 0 0| 0 0| 0 0| 0 0 | 0 0| 20 1| 7 1| 1 2| 28 1 | 28 1
IRWIN COUNTY
| 0 0| 0 0| 0 0| 0 0| 0 0 | 0 0| 2 0| 0 0| 0 0| 2 0 | 2 0
JACKSON COUNTY
| 0 0| 0 0| 0 0| 0 0| 0 0 | 1 1| 10 1| 2 0| 0 0| 13 1 | 13 1
JASPER COUNTY
| 0 0| 0 0| 0 0| 0 0| 0 0 | 0 0| 0 0| 1 0| 0 0| 1 0 | 1 0
JEFF DAVIS COUNTY | 0 0| 0 0| 0 0| 0 0| 0 0 | 1 1| 2 0| 2 0| 0 0| 5 0 | 5 0
JEFFERSON COUNTY | 0 0| 0 0| 0 0| 0 0| 0 0 | 0 0| 11 1| 3 0| 0 0| 14 1 | 14 1
JENKINS COUNTY
| 0 0| 0 0| 0 0| 0 0| 0 0 | 0 0| 8 0| 0 0| 0 0| 8 0 | 8 0
JOHNSON COUNTY
| 0 0| 0 0| 0 0| 0 0| 0 0 | 0 0| 3 0| 0 0| 0 0| 3 0 | 3 0
JONES COUNTY
| 0 0| 0 0| 0 0| 0 0| 0 0 | 0 0| 3 0| 0 0| 0 0| 3 0 | 3 0
LAMAR COUNTY
| 0 0| 0 0| 0 0| 0 0| 0 0 | 0 0| 1 0| 3 0| 0 0| 4 0 | 4 0
LANIER COUNTY
| 0 0| 0 0| 0 0| 0 0| 0 0 | 0 0| 4 0| 1 0| 0 0| 5 0 | 5 0
LAURENS COUNTY
| 0 0| 0 0| 0 0| 0 0| 0 0 | 1 1| 9 1| 3 0| 2 3| 15 1 | 15 1
LEE COUNTY
| 0 0| 0 0| 0 0| 0 0| 0 0 | 0 0| 0 0| 0 0| 0 0| 0 0 | 0 0
LIBERTY COUNTY
| 0 0| 0 0| 0 0| 0 0| 0 0 | 0 0| 11 1| 5 1| 0 0| 16 1 | 16 1
LINCOLN COUNTY
| 0 0| 0 0| 0 0| 0 0| 0 0 | 0 0| 1 0| 0 0| 0 0| 1 0 | 1 0
LONG COUNTY
| 0 0| 0 0| 0 0| 0 0| 0 0 | 0 0| 3 0| 0 0| 0 0| 3 0 | 3 0
LOWNDES COUNTY
| 0 0| 0 0| 0 0| 0 0| 0 0 | 2 1| 23 1| 12 2| 1 2| 38 2 | 38 2
LUMPKIN COUNTY
| 0 0| 0 0| 0 0| 0 0| 0 0 | 0 0| 3 0| 1 0| 0 0| 4 0 | 4 0
MACON COUNTY
| 0 0| 0 0| 0 0| 0 0| 0 0 | 0 0| 2 0| 3 0| 0 0| 5 0 | 5 0
MADISON COUNTY
| 0 0| 0 0| 0 0| 0 0| 0 0 | 0 0| 6 0| 1 0| 1 2| 8 0 | 8 0
MARION COUNTY
| 0 0| 0 0| 0 0| 0 0| 0 0 | 0 0| 0 0| 1 0| 0 0| 1 0 | 1 0
MCDUFFIE COUNTY
| 0 0| 0 0| 0 0| 0 0| 0 0 | 1 1| 6 0| 0 0| 0 0| 7 0 | 7 0
MCINTOSH COUNTY
| 0 0| 0 0| 0 0| 0 0| 0 0 | 0 0| 0 0| 0 0| 0 0| 0 0 | 0 0
MERIWETHER COUNTY | 0 0| 0 0| 0 0| 0 0| 0 0 | 0 0| 6 0| 3 0| 2 3| 11 0 | 11 0
MILLER COUNTY
| 0 0| 0 0| 0 0| 0 0| 0 0 | 1 1| 2 0| 0 0| 0 0| 3 0 | 3 0
MITCHELL COUNTY
| 0 0| 0 0| 0 0| 0 0| 0 0 | 3 2| 10 1| 3 0| 0 0| 16 1 | 16 1
MONROE COUNTY
| 0 0| 0 0| 0 0| 0 0| 0 0 | 0 0| 1 0| 1 0| 0 0| 2 0 | 2 0
MONTGOMERY COUNTY | 0 0| 0 0| 0 0| 0 0| 0 0 | 0 0| 3 0| 0 0| 0 0| 3 0 | 3 0
MORGAN COUNTY
| 0 0| 0 0| 0 0| 0 0| 0 0 | 0 0| 5 0| 0 0| 0 0| 5 0 | 5 0
MURRAY COUNTY
| 0 0| 0 0| 0 0| 0 0| 0 0 | 1 1| 9 1| 3 0| 0 0| 13 1 | 13 1
MUSCOGEE COUNTY
| 0 0| 0 0| 0 0| 0 0| 0 0 | 6 4| 60 4| 30 5| 1 2| 97 4 | 97 4
------------------------------------------------------------------------------------------------------------------------------------
Georgia Dept. of Corrections
44
(continued)
Georgia Dept. of Corrections
45
Page 34 Run 05/01/00
Georgia Department of Corrections Office of Planning and Analysis
FEMALES ONLY Inmate statistical profile
Sample: ACTIVE PRISONERS EXCLUDING JAIL
Requestor: Statistics
Active inmates 05/01/2000
Home County by current age & sex
(CONTINUED)
|
MEN
|
WOMEN
|
| Age | Age | Age | Age | Men
| Age | Age | Age | Age |Women
|Grand
Home County
|00-21 %|22-39 %|40-54 %|55-99 %|Total % |00-21 %|22-39 %|40-54 %|55-99 %|Total % |Total %
------------------------------------------------------------------------------------------------------------------------------------
NEWTON COUNTY
| 0 0| 0 0| 0 0| 0 0| 0 0 | 1 1| 11 1| 3 0| 3 5| 18 1 | 18 1
OCONEE COUNTY
| 0 0| 0 0| 0 0| 0 0| 0 0 | 1 1| 0 0| 1 0| 0 0| 2 0 | 2 0
OGLETHORPE COUNTY | 0 0| 0 0| 0 0| 0 0| 0 0 | 0 0| 0 0| 0 0| 0 0| 0 0 | 0 0
PAULDING COUNTY
| 0 0| 0 0| 0 0| 0 0| 0 0 | 0 0| 8 0| 5 1| 1 2| 14 1 | 14 1
PEACH COUNTY
| 0 0| 0 0| 0 0| 0 0| 0 0 | 0 0| 1 0| 1 0| 0 0| 2 0 | 2 0
PICKENS COUNTY
| 0 0| 0 0| 0 0| 0 0| 0 0 | 1 1| 5 0| 6 1| 0 0| 12 0 | 12 0
PIERCE COUNTY
| 0 0| 0 0| 0 0| 0 0| 0 0 | 0 0| 0 0| 0 0| 0 0| 0 0 | 0 0
PIKE COUNTY
| 0 0| 0 0| 0 0| 0 0| 0 0 | 0 0| 0 0| 0 0| 0 0| 0 0 | 0 0
POLK COUNTY
| 0 0| 0 0| 0 0| 0 0| 0 0 | 0 0| 3 0| 0 0| 0 0| 3 0 | 3 0
PULASKI COUNTY
| 0 0| 0 0| 0 0| 0 0| 0 0 | 1 1| 4 0| 1 0| 0 0| 6 0 | 6 0
PUTNAM COUNTY
| 0 0| 0 0| 0 0| 0 0| 0 0 | 0 0| 3 0| 2 0| 1 2| 6 0 | 6 0
QUITMAN COUNTY
| 0 0| 0 0| 0 0| 0 0| 0 0 | 0 0| 0 0| 1 0| 1 2| 2 0 | 2 0
RABUN COUNTY
| 0 0| 0 0| 0 0| 0 0| 0 0 | 0 0| 0 0| 2 0| 0 0| 2 0 | 2 0
RANDOLPH COUNTY
| 0 0| 0 0| 0 0| 0 0| 0 0 | 0 0| 0 0| 2 0| 0 0| 2 0 | 2 0
RICHMOND COUNTY
| 0 0| 0 0| 0 0| 0 0| 0 0 | 6 4| 85 5| 43 7| 1 2| 135 5 | 135 5
ROCKDALE COUNTY
| 0 0| 0 0| 0 0| 0 0| 0 0 | 1 1| 9 1| 8 1| 0 0| 18 1 | 18 1
SCHLEY COUNTY
| 0 0| 0 0| 0 0| 0 0| 0 0 | 0 0| 1 0| 0 0| 0 0| 1 0 | 1 0
SCREVEN COUNTY
| 0 0| 0 0| 0 0| 0 0| 0 0 | 3 2| 8 0| 1 0| 0 0| 12 0 | 12 0
SEMINOLE COUNTY
| 0 0| 0 0| 0 0| 0 0| 0 0 | 1 1| 2 0| 2 0| 0 0| 5 0 | 5 0
SPALDING COUNTY
| 0 0| 0 0| 0 0| 0 0| 0 0 | 6 4| 23 1| 8 1| 2 3| 39 2 | 39 2
STEPHENS COUNTY
| 0 0| 0 0| 0 0| 0 0| 0 0 | 0 0| 7 0| 1 0| 0 0| 8 0 | 8 0
STEWART COUNTY
| 0 0| 0 0| 0 0| 0 0| 0 0 | 0 0| 1 0| 0 0| 0 0| 1 0 | 1 0
SUMTER COUNTY
| 0 0| 0 0| 0 0| 0 0| 0 0 | 0 0| 7 0| 4 1| 0 0| 11 0 | 11 0
TALBOT COUNTY
| 0 0| 0 0| 0 0| 0 0| 0 0 | 1 1| 3 0| 1 0| 0 0| 5 0 | 5 0
TALIAFERRO COUNTY | 0 0| 0 0| 0 0| 0 0| 0 0 | 0 0| 1 0| 1 0| 0 0| 2 0 | 2 0
TATTNALL COUNTY
| 0 0| 0 0| 0 0| 0 0| 0 0 | 0 0| 1 0| 5 1| 0 0| 6 0 | 6 0
TAYLOR COUNTY
| 0 0| 0 0| 0 0| 0 0| 0 0 | 2 1| 2 0| 0 0| 0 0| 4 0 | 4 0
TELFAIR COUNTY
| 0 0| 0 0| 0 0| 0 0| 0 0 | 1 1| 7 0| 2 0| 0 0| 10 0 | 10 0
TERRELL COUNTY
| 0 0| 0 0| 0 0| 0 0| 0 0 | 0 0| 2 0| 0 0| 0 0| 2 0 | 2 0
THOMAS COUNTY
| 0 0| 0 0| 0 0| 0 0| 0 0 | 0 0| 14 1| 3 0| 0 0| 17 1 | 17 1
TIFT COUNTY
| 0 0| 0 0| 0 0| 0 0| 0 0 | 2 1| 7 0| 1 0| 1 2| 11 0 | 11 0
TOOMBS COUNTY
| 0 0| 0 0| 0 0| 0 0| 0 0 | 2 1| 13 1| 3 0| 0 0| 18 1 | 18 1
TOWNS COUNTY
| 0 0| 0 0| 0 0| 0 0| 0 0 | 0 0| 0 0| 0 0| 0 0| 0 0 | 0 0
TREUTLEN COUNTY
| 0 0| 0 0| 0 0| 0 0| 0 0 | 0 0| 0 0| 1 0| 0 0| 1 0 | 1 0
TROUP COUNTY
| 0 0| 0 0| 0 0| 0 0| 0 0 | 3 2| 28 2| 12 2| 0 0| 43 2 | 43 2
------------------------------------------------------------------------------------------------------------------------------------
Georgia Dept. of Corrections
46
Page 35 Run 05/01/00
Georgia Department of Corrections Office of Planning and Analysis
FEMALES ONLY Inmate statistical profile
(continued)
Sample: ACTIVE PRISONERS EXCLUDING JAIL
Requestor: Statistics
Active inmates 05/01/2000
Home County by current age & sex
(CONTINUED)
|
MEN
|
WOMEN
|
| Age | Age | Age | Age | Men
| Age | Age | Age | Age |Women
|Grand
Home County
|00-21 %|22-39 %|40-54 %|55-99 %|Total % |00-21 %|22-39 %|40-54 %|55-99 %|Total % |Total %
------------------------------------------------------------------------------------------------------------------------------------
TURNER COUNTY
| 0 0| 0 0| 0 0| 0 0| 0 0 | 0 0| 4 0| 0 0| 0 0| 4 0 | 4 0
TWIGGS COUNTY
| 0 0| 0 0| 0 0| 0 0| 0 0 | 0 0| 0 0| 0 0| 0 0| 0 0 | 0 0
UNION COUNTY
| 0 0| 0 0| 0 0| 0 0| 0 0 | 0 0| 0 0| 0 0| 0 0| 0 0 | 0 0
UPSON COUNTY
| 0 0| 0 0| 0 0| 0 0| 0 0 | 1 1| 8 0| 1 0| 1 2| 11 0 | 11 0
WALKER COUNTY
| 0 0| 0 0| 0 0| 0 0| 0 0 | 0 0| 13 1| 5 1| 1 2| 19 1 | 19 1
WALTON COUNTY
| 0 0| 0 0| 0 0| 0 0| 0 0 | 0 0| 12 1| 2 0| 0 0| 14 1 | 14 1
WARE COUNTY
| 0 0| 0 0| 0 0| 0 0| 0 0 | 1 1| 13 1| 4 1| 0 0| 18 1 | 18 1
WARREN COUNTY
| 0 0| 0 0| 0 0| 0 0| 0 0 | 0 0| 1 0| 1 0| 0 0| 2 0 | 2 0
WASHINGTON COUNTY | 0 0| 0 0| 0 0| 0 0| 0 0 | 1 1| 3 0| 3 0| 0 0| 7 0 | 7 0
WAYNE COUNTY
| 0 0| 0 0| 0 0| 0 0| 0 0 | 0 0| 2 0| 1 0| 0 0| 3 0 | 3 0
WEBSTER COUNTY
| 0 0| 0 0| 0 0| 0 0| 0 0 | 0 0| 0 0| 0 0| 0 0| 0 0 | 0 0
WHEELER COUNTY
| 0 0| 0 0| 0 0| 0 0| 0 0 | 0 0| 0 0| 0 0| 0 0| 0 0 | 0 0
WHITE COUNTY
| 0 0| 0 0| 0 0| 0 0| 0 0 | 0 0| 3 0| 0 0| 0 0| 3 0 | 3 0
WHITFIELD COUNTY | 0 0| 0 0| 0 0| 0 0| 0 0 | 1 1| 28 2| 5 1| 0 0| 34 1 | 34 1
WILCOX COUNTY
| 0 0| 0 0| 0 0| 0 0| 0 0 | 0 0| 4 0| 0 0| 0 0| 4 0 | 4 0
WILKES COUNTY
| 0 0| 0 0| 0 0| 0 0| 0 0 | 0 0| 3 0| 0 0| 0 0| 3 0 | 3 0
WILKINSON COUNTY | 0 0| 0 0| 0 0| 0 0| 0 0 | 0 0| 3 0| 0 0| 0 0| 3 0 | 3 0
WORTH COUNTY
| 0 0| 0 0| 0 0| 0 0| 0 0 | 0 0| 5 0| 0 0| 0 0| 5 0 | 5 0
OUT OF STATE
| 0 0| 0 0| 0 0| 0 0| 0 0 | 0 0| 0 0| 0 0| 0 0| 0 0 | 0 0
------------------------------------------------------------------------------------------------------------------------------------
Total reported
| 0 0| 0 0| 0 0| 0 0| 0 0 | 168 100| 1623 100| 633 100| 62 100| 2486 100 | 2486 100
|
|
|
|
|
|
|
|
|
|
|
Percent reported |
.0|
.0|
.0|
.0|
.0 |
91.3|
92.6|
92.8|
93.9|
92.6 |
92.6
|
|
|
|
|
|
|
|
|
|
|
|
|
|
|
|
|
|
|
|
|
|
UNKNOWN
|0|0|0|0|0
| 16 | 130 | 49 | 4 | 199
| 199
------------------------------------------------------------------------------------------------------------------------------------
Total
|0|0|0|0|0
| 184 | 1753 | 682 | 66 | 2685
| 2685
Georgia Dept. of Corrections
47
Page
36 Run 05/01/00
Georgia Department of Corrections Office of Planning and Analysis
FEMALES ONLY Inmate statistical profile
Sample: ACTIVE PRISONERS EXCLUDING JAIL Active inmates 05/01/2000
Requestor: Statistics Prison Sentence In Years by current age & sex
|
MEN
|
WOMEN
|
| Age | Age | Age | Age | Men
| Age | Age | Age | Age |Women
|Grand
Sentence In Years |00-21 %|22-39 %|40-54 %|55-99 %|Total % |00-21 %|22-39 %|40-54 %|55-99 %|Total % |Total %
------------------------------------------------------------------------------------------------------------------------------------
0-1
| 0 0| 0 0| 0 0| 0 0| 0 0 | 1 1| 13 1| 8 1| 1 2| 23 1 | 23 1
1.1-2
| 0 0| 0 0| 0 0| 0 0| 0 0 | 6 3| 59 4| 27 4| 0 0| 92 4 | 92 4
2.1-3
| 0 0| 0 0| 0 0| 0 0| 0 0 | 25 14| 130 8| 45 7| 1 2| 201 8 | 201 8
3.1-4
| 0 0| 0 0| 0 0| 0 0| 0 0 | 20 11| 187 11| 62 9| 3 5| 272 11 | 272 11
4.1-5
| 0 0| 0 0| 0 0| 0 0| 0 0 | 16 9| 106 6| 43 6| 3 5| 168 6 | 168 6
5.1-6
| 0 0| 0 0| 0 0| 0 0| 0 0 | 32 18| 308 18| 105 16| 6 9| 451 17 | 451 17
6.1-7
| 0 0| 0 0| 0 0| 0 0| 0 0 | 9 5| 81 5| 29 4| 0 0| 119 5 | 119 5
7.1-8
| 0 0| 0 0| 0 0| 0 0| 0 0 | 5 3| 68 4| 27 4| 0 0| 100 4 | 100 4
8.1-9
| 0 0| 0 0| 0 0| 0 0| 0 0 | 10 6| 60 4| 24 4| 2 3| 96 4 | 96 4
9.1-10
| 0 0| 0 0| 0 0| 0 0| 0 0 | 0 0| 23 1| 8 1| 1 2| 32 1 | 32 1
10.1-12
| 0 0| 0 0| 0 0| 0 0| 0 0 | 27 16| 235 14| 75 11| 5 8| 342 13 | 342 13
12.1-15
| 0 0| 0 0| 0 0| 0 0| 0 0 | 4 2| 81 5| 33 5| 4 6| 122 5 | 122 5
15.1-20
| 0 0| 0 0| 0 0| 0 0| 0 0 | 2 1| 96 6| 52 8| 6 9| 156 6 | 156 6
20.1-OVER
| 0 0| 0 0| 0 0| 0 0| 0 0 | 7 4| 105 6| 53 8| 7 11| 172 7 | 172 7
LIFE
| 0 0| 0 0| 0 0| 0 0| 0 0 | 10 6| 128 8| 72 11| 26 40| 236 9 | 236 9
DEATH
| 0 0| 0 0| 0 0| 0 0| 0 0 | 0 0| 1 0| 0 0| 0 0| 1 0 | 1 0
LIFE W/O PAROLE
| 0 0| 0 0| 0 0| 0 0| 0 0 | 0 0| 2 0| 0 0| 0 0| 2 0 | 2 0
YOUTHFUL OFFENDERS | 0 0| 0 0| 0 0| 0 0| 0 0 | 0 0| 0 0| 0 0| 0 0| 0 0 | 0 0
------------------------------------------------------------------------------------------------------------------------------------
Total reported
| 0 0| 0 0| 0 0| 0 0| 0 0 | 174 100| 1683 100| 663 100| 65 100| 2585 100 | 2585 100
|
|
|
|
|
|
|
|
|
|
|
Percent reported |
.0|
.0|
.0|
.0|
.0 |
94.6|
96.0|
97.2|
98.5|
96.3 |
96.3
|
|
|
|
|
|
|
|
|
|
|
|
|
|
|
|
|
|
|
|
|
|
NOT REPORTED
|0|0|0|0|0
| 10 | 70 | 19 | 1 | 100
| 100
------------------------------------------------------------------------------------------------------------------------------------
Total
|0|0|0|0|0
| 184 | 1753 | 682 | 66 | 2685
| 2685
|
|
|
|
|
|
|
|
|
|
|
|
|
|
|
|
|
|
|
|
|
|
|
|
|
|
|
|
|
|
|
|
|
|
|
|
|
|
|
|
|
|
|
|
|
|
|
|
|
|
|
|
|
|
|
AVG EXCLUDING
|
|
|
|
|
|
|
|
|
|
|
Georgia Dept. of Corrections
48
LIFE, DEATH, YO
|
|
|
|
|
|
AVG INCLUDING
|
LIFE=21, YO=3 YRS |
.00 | | | | | | |
.00 |
.00 | | | | | | |
.00 |
.00 | | | | | | |
.00 |
.00 | | | | | | |
.00 |
.00 | 6.28 | 7.77 | 8.42 | 10.93 | 7.88 | 7.88
|
|
|
|
|
|
|
|
|
|
|
|
|
|
|
|
|
|
|
|
|
|
|
|
|
|
|
|
|
|
|
|
|
|
|
|
.00 | 7.12 | 8.77 | 9.78 | 14.96 | 9.08 | 9.08
Georgia Dept. of Corrections
49
Page 37 Run 05/01/00
Georgia Department of Corrections Office of Planning and Analysis
FEMALES ONLY Inmate statistical profile
Sample: ACTIVE PRISONERS EXCLUDING JAIL Active inmates 05/01/2000
Requestor: Statistics Probation To Follow Prison by current age & sex
|
MEN
|
WOMEN
|
| Age | Age | Age | Age | Men
| Age | Age | Age | Age |Women
|Grand
Prob After Prison |00-21 %|22-39 %|40-54 %|55-99 %|Total % |00-21 %|22-39 %|40-54 %|55-99 %|Total % |Total %
------------------------------------------------------------------------------------------------------------------------------------
PROBATION TO FOLLOW | 0 0| 0 0| 0 0| 0 0| 0 0 | 77 42| 525 30| 220 32| 20 30| 842 31 | 842 31
NO PROBATION
| 0 0| 0 0| 0 0| 0 0| 0 0 | 107 58| 1228 70| 462 68| 46 70| 1843 69 | 1843 69
------------------------------------------------------------------------------------------------------------------------------------
Total reported
| 0 0| 0 0| 0 0| 0 0| 0 0 | 184 100| 1753 100| 682 100| 66 100| 2685 100 | 2685 100
|
|
|
|
|
|
|
|
|
|
|
Percent reported |
.0|
.0|
.0|
.0|
.0 | 100.0| 100.0| 100.0| 100.0| 100.0 | 100.0
|
|
|
|
|
|
|
|
|
|
|
|
|
|
|
|
|
|
|
|
|
|
NOT REPORTED
|0|0|0|0|0
|0|0|0|0|0
|0
------------------------------------------------------------------------------------------------------------------------------------
Total
|0|0|0|0|0
| 184 | 1753 | 682 | 66 | 2685
| 2685
Georgia Dept. of Corrections
50
Page
38 Run 05/01/00
Georgia Department of Corrections Office of Planning and Analysis
FEMALES ONLY Inmate statistical profile
Sample: ACTIVE PRISONERS EXCLUDING JAIL Active inmates 05/01/2000
Requestor: Statistics Admission Type by current age & sex
|
MEN
|
WOMEN
|
| Age | Age | Age | Age | Men
| Age | Age | Age | Age |Women
|Grand
Admission Type
|00-21 %|22-39 %|40-54 %|55-99 %|Total % |00-21 %|22-39 %|40-54 %|55-99 %|Total % |Total %
------------------------------------------------------------------------------------------------------------------------------------
COMMITTED FROM COURT| 0 0| 0 0| 0 0| 0 0| 0 0 | 141 81| 1055 63| 433 65| 55 85| 1684 65 | 1684 65
RETURN APPEAL/BOND | 0 0| 0 0| 0 0| 0 0| 0 0 | 1 1| 0 0| 0 0| 0 0| 1 0 | 1 0
PAROLE REV/NEW SENT | 0 0| 0 0| 0 0| 0 0| 0 0 | 2 1| 202 12| 95 14| 4 6| 303 12 | 303 12
PAR REV/NO NEW SENT | 0 0| 0 0| 0 0| 0 0| 0 0 | 2 1| 77 5| 24 4| 2 3| 105 4 | 105 4
PROB VIOL/TOTAL REV | 0 0| 0 0| 0 0| 0 0| 0 0 | 0 0| 0 0| 0 0| 0 0| 0 0 | 0 0
PROB VIOL/PARTIAL | 0 0| 0 0| 0 0| 0 0| 0 0 | 9 5| 119 7| 46 7| 2 3| 176 7 | 176 7
ADMIT FM OTHER CUST | 0 0| 0 0| 0 0| 0 0| 0 0 | 0 0| 1 0| 0 0| 0 0| 1 0 | 1 0
SHOCK INCARCERATION | 0 0| 0 0| 0 0| 0 0| 0 0 | 0 0| 0 0| 0 0| 0 0| 0 0 | 0 0
PROB REV/REMAINDER | 0 0| 0 0| 0 0| 0 0| 0 0 | 19 11| 227 13| 62 9| 2 3| 310 12 | 310 12
NEW SENT/PAR REV PND| 0 0| 0 0| 0 0| 0 0| 0 0 | 0 0| 2 0| 3 0| 0 0| 5 0 | 5 0
LIFE W/O PAROLE
| 0 0| 0 0| 0 0| 0 0| 0 0 | 0 0| 0 0| 0 0| 0 0| 0 0 | 0 0
PAROLE REV BOOT CAMP| 0 0| 0 0| 0 0| 0 0| 0 0 | 0 0| 0 0| 0 0| 0 0| 0 0 | 0 0
PAR REV/RSN UNKNOWN | 0 0| 0 0| 0 0| 0 0| 0 0 | 0 0| 0 0| 0 0| 0 0| 0 0 | 0 0
PROBATION/PAROLE REV| 0 0| 0 0| 0 0| 0 0| 0 0 | 0 0| 0 0| 0 0| 0 0| 0 0 | 0 0
PB PAROLE RESCINDED | 0 0| 0 0| 0 0| 0 0| 0 0 | 0 0| 0 0| 0 0| 0 0| 0 0 | 0 0
PROB REVOCATION/SC | 0 0| 0 0| 0 0| 0 0| 0 0 | 0 0| 2 0| 0 0| 0 0| 2 0 | 2 0
PAR REV/REVOC CENTER| 0 0| 0 0| 0 0| 0 0| 0 0 | 0 0| 0 0| 0 0| 0 0| 0 0 | 0 0
INFORMATION ONLY | 0 0| 0 0| 0 0| 0 0| 0 0 | 0 0| 0 0| 0 0| 0 0| 0 0 | 0 0
INCOMPLETE SENT PKG | 0 0| 0 0| 0 0| 0 0| 0 0 | 0 0| 0 0| 0 0| 0 0| 0 0 | 0 0
HANCOCK REVOC CENTER| 0 0| 0 0| 0 0| 0 0| 0 0 | 0 0| 0 0| 0 0| 0 0| 0 0 | 0 0
WHITWORTH DETENTION | 0 0| 0 0| 0 0| 0 0| 0 0 | 0 0| 0 0| 0 0| 0 0| 0 0 | 0 0
DCYS AT RISK
| 0 0| 0 0| 0 0| 0 0| 0 0 | 0 0| 0 0| 0 0| 0 0| 0 0 | 0 0
OTHER
| 0 0| 0 0| 0 0| 0 0| 0 0 | 0 0| 0 0| 0 0| 0 0| 0 0 | 0 0
------------------------------------------------------------------------------------------------------------------------------------
Total reported
| 0 0| 0 0| 0 0| 0 0| 0 0 | 174 100| 1685 100| 663 100| 65 100| 2587 100 | 2587 100
|
|
|
|
|
|
|
|
|
|
|
Percent reported |
.0|
.0|
.0|
.0|
.0 |
94.6|
96.1|
97.2|
98.5|
96.4 |
96.4
|
|
|
|
|
|
|
|
|
|
|
|
|
|
|
|
|
|
|
|
|
|
UNKNOWN
|0|0|0|0|0
| 10 | 68 | 19 | 1 | 98
| 98
------------------------------------------------------------------------------------------------------------------------------------
Total
|0|0|0|0|0
| 184 | 1753 | 682 | 66 | 2685
| 2685
Georgia Dept. of Corrections
51
Page 39 Run 05/01/00
Georgia Department of Corrections Office of Planning and Analysis
FEMALES ONLY Inmate statistical profile
Sample: ACTIVE PRISONERS EXCLUDING JAIL Active inmates 05/01/2000
Requestor: Statistics Release Type by current age & sex
|
MEN
|
WOMEN
|
| Age | Age | Age | Age | Men
| Age | Age | Age | Age |Women
|Grand
Release Type
|00-21 %|22-39 %|40-54 %|55-99 %|Total % |00-21 %|22-39 %|40-54 %|55-99 %|Total % |Total %
------------------------------------------------------------------------------------------------------------------------------------
PAROLE
| 0 0| 0 0| 0 0| 0 0| 0 0 | 10 5| 68 4| 19 3| 1 2| 98 4 | 98 4
Active
| 0 0| 0 0| 0 0| 0 0| 0 0 | 184 100| 1753 100| 682 100| 66 100| 2685 100 | 2685 100
------------------------------------------------------------------------------------------------------------------------------------
Total
|0|0|0|0|0
| 184 | 1753 | 682 | 66 | 2685
| 2685
Georgia Dept. of Corrections
52
Page
40 Run 05/01/00
Georgia Department of Corrections Office of Planning and Analysis
FEMALES ONLY Inmate statistical profile
Sample: ACTIVE PRISONERS EXCLUDING JAIL Active inmates 05/01/2000
Requestor: Statistics Inst By Group by current age & sex
|
MEN
|
WOMEN
|
| Age | Age | Age | Age | Men
| Age | Age | Age | Age |Women
|Grand
Inst By Group
|00-21 %|22-39 %|40-54 %|55-99 %|Total % |00-21 %|22-39 %|40-54 %|55-99 %|Total % |Total %
------------------------------------------------------------------------------------------------------------------------------------
County jails
| 0 0| 0 0| 0 0| 0 0| 0 0 | 0 0| 0 0| 0 0| 0 0| 0 0 | 0 0
Transitional centers| 0 0| 0 0| 0 0| 0 0| 0 0 | 5 3| 131 7| 47 7| 5 8| 188 7 | 188 7
County camps
| 0 0| 0 0| 0 0| 0 0| 0 0 | 0 0| 0 0| 0 0| 0 0| 0 0 | 0 0
Inmate boot camps | 0 0| 0 0| 0 0| 0 0| 0 0 | 0 0| 0 0| 0 0| 0 0| 0 0 | 0 0
State prisons
| 0 0| 0 0| 0 0| 0 0| 0 0 | 179 97| 1622 93| 635 93| 61 92| 2497 93 | 2497 93
Private prisons
| 0 0| 0 0| 0 0| 0 0| 0 0 | 0 0| 0 0| 0 0| 0 0| 0 0 | 0 0
Other
| 0 0| 0 0| 0 0| 0 0| 0 0 | 0 0| 0 0| 0 0| 0 0| 0 0 | 0 0
------------------------------------------------------------------------------------------------------------------------------------
Total reported
| 0 0| 0 0| 0 0| 0 0| 0 0 | 184 100| 1753 100| 682 100| 66 100| 2685 100 | 2685 100
|
|
|
|
|
|
|
|
|
|
|
Percent reported |
.0|
.0|
.0|
.0|
.0 | 100.0| 100.0| 100.0| 100.0| 100.0 | 100.0
|
|
|
|
|
|
|
|
|
|
|
|
|
|
|
|
|
|
|
|
|
|
Not reported
|0|0|0|0|0
|0|0|0|0|0
|0
------------------------------------------------------------------------------------------------------------------------------------
Total
|0|0|0|0|0
| 184 | 1753 | 682 | 66 | 2685
| 2685
Georgia Dept. of Corrections
53
Page
41 Run 05/01/00
Georgia Department of Corrections Office of Planning and Analysis
FEMALES ONLY Inmate statistical profile
Sample: ACTIVE PRISONERS EXCLUDING JAIL Active inmates 05/01/2000
Requestor: Statistics Institution by current age & sex
|
MEN
|
WOMEN
|
| Age | Age | Age | Age | Men
| Age | Age | Age | Age |Women
|Grand
Institution
|00-21 %|22-39 %|40-54 %|55-99 %|Total % |00-21 %|22-39 %|40-54 %|55-99 %|Total % |Total %
------------------------------------------------------------------------------------------------------------------------------------
Metro Trans Ctr (W) | 0 0| 0 0| 0 0| 0 0| 0 0 | 3 2| 83 5| 30 4| 4 6| 120 4 | 120 4
Savannah Womens TC | 0 0| 0 0| 0 0| 0 0| 0 0 | 2 1| 48 3| 17 2| 1 2| 68 3 | 68 3
Augusta Med Prison | 0 0| 0 0| 0 0| 0 0| 0 0 | 0 0| 1 0| 0 0| 0 0| 1 0 | 1 0
Washingtn Women Pris| 0 0| 0 0| 0 0| 0 0| 0 0 | 47 26| 518 30| 235 34| 19 29| 819 31 | 819 31
Metro Womens Prison | 0 0| 0 0| 0 0| 0 0| 0 0 | 50 27| 426 24| 162 24| 23 35| 661 25 | 661 25
Pulaski Womens Pris | 0 0| 0 0| 0 0| 0 0| 0 0 | 82 45| 677 39| 238 35| 19 29| 1016 38 | 1016 38
------------------------------------------------------------------------------------------------------------------------------------
Total reported
| 0 0| 0 0| 0 0| 0 0| 0 0 | 184 100| 1753 100| 682 100| 66 100| 2685 100 | 2685 100
|
|
|
|
|
|
|
|
|
|
|
Percent reported |
.0|
.0|
.0|
.0|
.0 | 100.0| 100.0| 100.0| 100.0| 100.0 | 100.0
|
|
|
|
|
|
|
|
|
|
|
|
|
|
|
|
|
|
|
|
|
|
Not Reported
|0|0|0|0|0
|0|0|0|0|0
|0
------------------------------------------------------------------------------------------------------------------------------------
Total
|0|0|0|0|0
| 184 | 1753 | 682 | 66 | 2685
| 2685
Georgia Dept. of Corrections
54
Page 42 Run 05/01/00
Georgia Department of Corrections Office of Planning and Analysis
FEMALES ONLY Inmate statistical profile
Sample: ACTIVE PRISONERS EXCLUDING JAIL Active inmates 05/01/2000
Requestor: Statistics Misdemeanors And Felonies by current age & sex
|
MEN
|
WOMEN
|
| Age | Age | Age | Age | Men
| Age | Age | Age | Age |Women
|Grand
Crime Type
|00-21 %|22-39 %|40-54 %|55-99 %|Total % |00-21 %|22-39 %|40-54 %|55-99 %|Total % |Total %
------------------------------------------------------------------------------------------------------------------------------------
MISDEMEANOR
| 0 0| 0 0| 0 0| 0 0| 0 0 | 0 0| 7 0| 4 1| 0 0| 11 0 | 11 0
FELONY
| 0 0| 0 0| 0 0| 0 0| 0 0 | 174 100| 1677 100| 659 99| 65 100| 2575 100 | 2575 100
------------------------------------------------------------------------------------------------------------------------------------
Total reported
| 0 0| 0 0| 0 0| 0 0| 0 0 | 174 100| 1684 100| 663 100| 65 100| 2586 100 | 2586 100
|
|
|
|
|
|
|
|
|
|
|
Percent reported |
.0|
.0|
.0|
.0|
.0 |
94.6|
96.1|
97.2|
98.5|
96.3 |
96.3
|
|
|
|
|
|
|
|
|
|
|
|
|
|
|
|
|
|
|
|
|
|
NOT REPORTED
|0|0|0|0|0
| 10 | 69 | 19 | 1 | 99
| 99
------------------------------------------------------------------------------------------------------------------------------------
Total
|0|0|0|0|0
| 184 | 1753 | 682 | 66 | 2685
| 2685
Georgia Dept. of Corrections
55
Page
43 Run 05/01/00
Georgia Department of Corrections Office of Planning and Analysis
FEMALES ONLY Inmate statistical profile
Sample: ACTIVE PRISONERS EXCLUDING JAIL Active inmates 05/01/2000
Requestor: Statistics Crimes By Group by current age & sex
|
MEN
|
WOMEN
|
| Age | Age | Age | Age | Men
| Age | Age | Age | Age |Women
|Grand
Crimes By Group
|00-21 %|22-39 %|40-54 %|55-99 %|Total % |00-21 %|22-39 %|40-54 %|55-99 %|Total % |Total %
------------------------------------------------------------------------------------------------------------------------------------
HOMICIDE
| 0 0| 0 0| 0 0| 0 0| 0 0 | 20 11| 211 13| 113 17| 34 52| 378 15 | 378 15
ABORTION
| 0 0| 0 0| 0 0| 0 0| 0 0 | 0 0| 0 0| 0 0| 0 0| 0 0 | 0 0
BODILY INJRY&REL OFF| 0 0| 0 0| 0 0| 0 0| 0 0 | 15 9| 177 11| 75 11| 4 6| 271 10 | 271 10
ARSON & REL OFF
| 0 0| 0 0| 0 0| 0 0| 0 0 | 0 0| 16 1| 9 1| 1 2| 26 1 | 26 1
DAMAGE OF PROPERTY | 0 0| 0 0| 0 0| 0 0| 0 0 | 1 1| 4 0| 1 0| 0 0| 6 0 | 6 0
BURGLARY & REL OFF | 0 0| 0 0| 0 0| 0 0| 0 0 | 19 11| 120 7| 36 5| 0 0| 175 7 | 175 7
FORGERY & REL OFF | 0 0| 0 0| 0 0| 0 0| 0 0 | 15 9| 259 15| 87 13| 3 5| 364 14 | 364 14
THEFT
| 0 0| 0 0| 0 0| 0 0| 0 0 | 18 10| 191 11| 101 15| 4 6| 314 12 | 314 12
ROBBERY
| 0 0| 0 0| 0 0| 0 0| 0 0 | 47 27| 135 8| 35 5| 1 2| 218 8 | 218 8
SEXUAL OFFENSES
| 0 0| 0 0| 0 0| 0 0| 0 0 | 5 3| 40 2| 19 3| 0 0| 64 2 | 64 2
OBSCENITY CRIMES | 0 0| 0 0| 0 0| 0 0| 0 0 | 0 0| 0 0| 0 0| 0 0| 0 0 | 0 0
TREASON & REL OFF | 0 0| 0 0| 0 0| 0 0| 0 0 | 0 0| 0 0| 0 0| 0 0| 0 0 | 0 0
CRIMES INVOLVNG GOVT| 0 0| 0 0| 0 0| 0 0| 0 0 | 2 1| 28 2| 15 2| 0 0| 45 2 | 45 2
FALSIFICATIONS
| 0 0| 0 0| 0 0| 0 0| 0 0 | 0 0| 2 0| 1 0| 0 0| 3 0 | 3 0
OBSTRUCT LAW ENFORCE| 0 0| 0 0| 0 0| 0 0| 0 0 | 1 1| 2 0| 3 0| 0 0| 6 0 | 6 0
DISORDERLY CONDUCT | 0 0| 0 0| 0 0| 0 0| 0 0 | 1 1| 0 0| 1 0| 0 0| 2 0 | 2 0
GAMBLING & REL OFF | 0 0| 0 0| 0 0| 0 0| 0 0 | 0 0| 1 0| 0 0| 0 0| 1 0 | 1 0
CRUELTY TO CHILDREN | 0 0| 0 0| 0 0| 0 0| 0 0 | 4 2| 62 4| 8 1| 0 0| 74 3 | 74 3
CRIMES WITH GUNS | 0 0| 0 0| 0 0| 0 0| 0 0 | 0 0| 2 0| 0 0| 0 0| 2 0 | 2 0
INVASION PRIVACY | 0 0| 0 0| 0 0| 0 0| 0 0 | 0 0| 0 0| 0 0| 0 0| 0 0 | 0 0
RACKETEERING
| 0 0| 0 0| 0 0| 0 0| 0 0 | 0 0| 2 0| 1 0| 0 0| 3 0 | 3 0
DRUG ABUSE OFFENSES | 0 0| 0 0| 0 0| 0 0| 0 0 | 21 12| 351 21| 122 18| 16 25| 510 20 | 510 20
DRUG TRAFFICKING | 0 0| 0 0| 0 0| 0 0| 0 0 | 2 1| 44 3| 23 3| 1 2| 70 3 | 70 3
AUTO CRIMES
| 0 0| 0 0| 0 0| 0 0| 0 0 | 0 0| 17 1| 7 1| 1 2| 25 1 | 25 1
REVENUE & CONTRABAND| 0 0| 0 0| 0 0| 0 0| 0 0 | 0 0| 0 0| 0 0| 0 0| 0 0 | 0 0
CRIMES OF OTH STATES| 0 0| 0 0| 0 0| 0 0| 0 0 | 0 0| 0 0| 0 0| 0 0| 0 0 | 0 0
MISC. FELONIES
| 0 0| 0 0| 0 0| 0 0| 0 0 | 3 2| 13 1| 2 0| 0 0| 18 1 | 18 1
MISDEMEANORS
| 0 0| 0 0| 0 0| 0 0| 0 0 | 0 0| 7 0| 4 1| 0 0| 11 0 | 11 0
------------------------------------------------------------------------------------------------------------------------------------
Total reported
| 0 0| 0 0| 0 0| 0 0| 0 0 | 174 100| 1684 100| 663 100| 65 100| 2586 100 | 2586 100
|
|
|
|
|
|
|
|
|
|
|
Percent reported |
.0|
.0|
.0|
.0|
.0 |
94.6|
96.1|
97.2|
98.5|
96.3 |
96.3
|
|
|
|
|
|
|
|
|
|
|
Georgia Dept. of Corrections
56
|
|
|
|
|
|
|
|
|
|
|
NOT REPORTED
|0|0|0|0|0
| 10 | 69 | 19 | 1 | 99
| 99
------------------------------------------------------------------------------------------------------------------------------------
Total
|0|0|0|0|0
| 184 | 1753 | 682 | 66 | 2685
| 2685
Georgia Dept. of Corrections
57
Page
44 Run 05/01/00
Georgia Department of Corrections Office of Planning and Analysis
FEMALES ONLY Inmate statistical profile
Sample: ACTIVE PRISONERS EXCLUDING JAIL Active inmates 05/01/2000
Requestor: Statistics Most Serious Offense by current age & sex
|
MEN
|
WOMEN
|
| Age | Age | Age | Age | Men
| Age | Age | Age | Age |Women
|Grand
Most Serious Offense|00-21 %|22-39 %|40-54 %|55-99 %|Total % |00-21 %|22-39 %|40-54 %|55-99 %|Total % |Total %
------------------------------------------------------------------------------------------------------------------------------------
Misdemeanors
|
|
|
------------------------------------------------------------------------------------------------------------------------------------
------------------------------------------------------------------------------------------------------------------------------------
simple assault
| 0 0| 0 0| 0 0| 0 0| 0 0 | 0 0| 1 0| 0 0| 0 0| 1 0 | 1 0
simple battery
| 0 0| 0 0| 0 0| 0 0| 0 0 | 0 0| 0 0| 1 0| 0 0| 1 0 | 1 0
bad checks
| 0 0| 0 0| 0 0| 0 0| 0 0 | 0 0| 2 0| 1 0| 0 0| 3 0 | 3 0
fraudulent checks | 0 0| 0 0| 0 0| 0 0| 0 0 | 0 0| 1 0| 0 0| 0 0| 1 0 | 1 0
d.u.i.
| 0 0| 0 0| 0 0| 0 0| 0 0 | 0 0| 1 0| 1 0| 0 0| 2 0 | 2 0
criminal trespassing| 0 0| 0 0| 0 0| 0 0| 0 0 | 0 0| 1 0| 1 0| 0 0| 2 0 | 2 0
------------------------------------------------------------------------------------------------------------------------------------
FELONIES
|
|
|
------------------------------------------------------------------------------------------------------------------------------------
------------------------------------------------------------------------------------------------------------------------------------
misc misdemeanor | 0 0| 0 0| 0 0| 0 0| 0 0 | 0 0| 1 0| 0 0| 0 0| 1 0 | 1 0
MURDER
| 0 0| 0 0| 0 0| 0 0| 0 0 | 10 6| 111 7| 59 9| 25 38| 205 8 | 205 8
VOLUNTARY MANSLAUGHT| 0 0| 0 0| 0 0| 0 0| 0 0 | 9 5| 72 4| 45 7| 7 11| 133 5 | 133 5
INVOLUNTARY MANSLAUG| 0 0| 0 0| 0 0| 0 0| 0 0 | 0 0| 13 1| 2 0| 0 0| 15 1 | 15 1
RECKLESS ABANDONMENT| 0 0| 0 0| 0 0| 0 0| 0 0 | 1 1| 0 0| 0 0| 0 0| 1 0 | 1 0
VEHICULAR HOMICIDE | 0 0| 0 0| 0 0| 0 0| 0 0 | 0 0| 15 1| 6 1| 2 3| 23 1 | 23 1
HOMICIDE BY PILOT,DU| 0 0| 0 0| 0 0| 0 0| 0 0 | 0 0| 0 0| 1 0| 0 0| 1 0 | 1 0
AGGRAVATED ASSAULT | 0 0| 0 0| 0 0| 0 0| 0 0 | 10 6| 122 7| 53 8| 4 6| 189 7 | 189 7
AGGRAVATED BATTERY | 0 0| 0 0| 0 0| 0 0| 0 0 | 2 1| 19 1| 9 1| 0 0| 30 1 | 30 1
TERRORIST THREATS & | 0 0| 0 0| 0 0| 0 0| 0 0 | 0 0| 5 0| 5 1| 0 0| 10 0 | 10 0
FALSE IMPRISONMENT | 0 0| 0 0| 0 0| 0 0| 0 0 | 0 0| 2 0| 1 0| 0 0| 3 0 | 3 0
KIDNAPPING
| 0 0| 0 0| 0 0| 0 0| 0 0 | 2 1| 14 1| 5 1| 0 0| 21 1 | 21 1
AGG ASSLT ON POLICE | 0 0| 0 0| 0 0| 0 0| 0 0 | 0 0| 6 0| 2 0| 0 0| 8 0 | 8 0
RECK COND-HIV INFCTD| 0 0| 0 0| 0 0| 0 0| 0 0 | 0 0| 7 0| 0 0| 0 0| 7 0 | 7 0
AGGRAVATED STALKING | 0 0| 0 0| 0 0| 0 0| 0 0 | 1 1| 2 0| 0 0| 0 0| 3 0 | 3 0
MISC. ARSON
| 0 0| 0 0| 0 0| 0 0| 0 0 | 0 0| 0 0| 1 0| 0 0| 1 0 | 1 0
FIRST DEGREE ARSON | 0 0| 0 0| 0 0| 0 0| 0 0 | 0 0| 14 1| 8 1| 1 2| 23 1 | 23 1
SECOND DEGREE ARSON | 0 0| 0 0| 0 0| 0 0| 0 0 | 0 0| 1 0| 0 0| 0 0| 1 0 | 1 0
THIRD DEGREE ARSON | 0 0| 0 0| 0 0| 0 0| 0 0 | 0 0| 1 0| 0 0| 0 0| 1 0 | 1 0
CRIM. DAMAGE 1ST DEG| 0 0| 0 0| 0 0| 0 0| 0 0 | 0 0| 1 0| 0 0| 0 0| 1 0 | 1 0
CRIM. DAMAGE 2ND DEG| 0 0| 0 0| 0 0| 0 0| 0 0 | 1 1| 2 0| 1 0| 0 0| 4 0 | 4 0
VANDALISM TO CHURCH | 0 0| 0 0| 0 0| 0 0| 0 0 | 0 0| 1 0| 0 0| 0 0| 1 0 | 1 0
Georgia Dept. of Corrections
58
BURGLARY
| 0 0| 0 0| 0 0| 0 0| 0 0 | 19 11| 119 7| 36 5| 0 0| 174 7 | 174 7
------------------------------------------------------------------------------------------------------------------------------------
(continued)
Georgia Department of Corrections
Page 45 Run 05/01/00
Office of Planning and Analysis
FEMALES ONLY Inmate statistical profile
Sample: ACTIVE PRISONERS EXCLUDING JAIL
Requestor: Statistics
Active inmates 05/01/2000
Most Serious Offense by current age & sex
(CONTINUED)
|
MEN
|
WOMEN
|
| Age | Age | Age | Age | Men
| Age | Age | Age | Age |Women
|Grand
Most Serious Offense|00-21 %|22-39 %|40-54 %|55-99 %|Total % |00-21 %|22-39 %|40-54 %|55-99 %|Total % |Total %
------------------------------------------------------------------------------------------------------------------------------------
POSS BURGLAR TOOLS | 0 0| 0 0| 0 0| 0 0| 0 0 | 0 0| 1 0| 0 0| 0 0| 1 0 | 1 0
MISC. FORGERY
| 0 0| 0 0| 0 0| 0 0| 0 0 | 0 0| 1 0| 0 0| 0 0| 1 0 | 1 0
FORGERY 1ST DEGREE | 0 0| 0 0| 0 0| 0 0| 0 0 | 10 6| 236 14| 72 11| 2 3| 320 12 | 320 12
FORGERY 2ND DEGREE | 0 0| 0 0| 0 0| 0 0| 0 0 | 1 1| 4 0| 2 0| 0 0| 7 0 | 7 0
BAD CHECKS
| 0 0| 0 0| 0 0| 0 0| 0 0 | 0 0| 2 0| 0 0| 0 0| 2 0 | 2 0
THEFT CREDIT CARD | 0 0| 0 0| 0 0| 0 0| 0 0 | 2 1| 0 0| 2 0| 0 0| 4 0 | 4 0
FRAUDULENT CREDIT CA| 0 0| 0 0| 0 0| 0 0| 0 0 | 2 1| 10 1| 5 1| 0 0| 17 1 | 17 1
RECV GDS,SRVS FRAUD | 0 0| 0 0| 0 0| 0 0| 0 0 | 0 0| 1 0| 0 0| 0 0| 1 0 | 1 0
MISC. FRAUD
| 0 0| 0 0| 0 0| 0 0| 0 0 | 0 0| 5 0| 6 1| 1 2| 12 0 | 12 0
THEFT BY TAKING
| 0 0| 0 0| 0 0| 0 0| 0 0 | 7 4| 45 3| 29 4| 1 2| 82 3 | 82 3
THEFT BY DECEPTION | 0 0| 0 0| 0 0| 0 0| 0 0 | 0 0| 5 0| 1 0| 0 0| 6 0 | 6 0
THEFT BY REC STOLEN | 0 0| 0 0| 0 0| 0 0| 0 0 | 1 1| 21 1| 2 0| 0 0| 24 1 | 24 1
THEFT BY CONVERSION | 0 0| 0 0| 0 0| 0 0| 0 0 | 0 0| 3 0| 1 0| 1 2| 5 0 | 5 0
THEFT OF MOTOR VEH, | 0 0| 0 0| 0 0| 0 0| 0 0 | 0 0| 6 0| 0 0| 0 0| 6 0 | 6 0
THEFT BRING PROP IN | 0 0| 0 0| 0 0| 0 0| 0 0 | 0 0| 0 0| 1 0| 0 0| 1 0 | 1 0
THEFT BY SHOPLIFTING| 0 0| 0 0| 0 0| 0 0| 0 0 | 10 6| 106 6| 67 10| 2 3| 185 7 | 185 7
ENTERING VEHICLE | 0 0| 0 0| 0 0| 0 0| 0 0 | 0 0| 5 0| 0 0| 0 0| 5 0 | 5 0
ROBBERY
| 0 0| 0 0| 0 0| 0 0| 0 0 | 34 20| 87 5| 23 3| 1 2| 145 6 | 145 6
ARMED ROBBERY
| 0 0| 0 0| 0 0| 0 0| 0 0 | 11 6| 39 2| 12 2| 0 0| 62 2 | 62 2
HIJACKING MOTOR VEHI| 0 0| 0 0| 0 0| 0 0| 0 0 | 1 1| 0 0| 0 0| 0 0| 1 0 | 1 0
CRIMINAL ATTEMPT ROB| 0 0| 0 0| 0 0| 0 0| 0 0 | 0 0| 3 0| 0 0| 0 0| 3 0 | 3 0
CRMNL ATMPT ARMED RO| 0 0| 0 0| 0 0| 0 0| 0 0 | 1 1| 6 0| 0 0| 0 0| 7 0 | 7 0
MISC. SEXUAL
| 0 0| 0 0| 0 0| 0 0| 0 0 | 0 0| 1 0| 1 0| 0 0| 2 0 | 2 0
RAPE
| 0 0| 0 0| 0 0| 0 0| 0 0 | 0 0| 2 0| 2 0| 0 0| 4 0 | 4 0
AGGRAVATED SODOMY | 0 0| 0 0| 0 0| 0 0| 0 0 | 0 0| 1 0| 3 0| 0 0| 4 0 | 4 0
AGGRAVATED SEXUAL BA| 0 0| 0 0| 0 0| 0 0| 0 0 | 0 0| 1 0| 0 0| 0 0| 1 0 | 1 0
STATUATORY RAPE
| 0 0| 0 0| 0 0| 0 0| 0 0 | 2 1| 2 0| 0 0| 0 0| 4 0 | 4 0
CHILD MOLESTATION | 0 0| 0 0| 0 0| 0 0| 0 0 | 2 1| 16 1| 8 1| 0 0| 26 1 | 26 1
ENTICING CHILD-INDEC| 0 0| 0 0| 0 0| 0 0| 0 0 | 0 0| 2 0| 0 0| 0 0| 2 0 | 2 0
AGGRAV. CHILD MOLEST| 0 0| 0 0| 0 0| 0 0| 0 0 | 1 1| 15 1| 5 1| 0 0| 21 1 | 21 1
DEFRAUDING STATE | 0 0| 0 0| 0 0| 0 0| 0 0 | 0 0| 2 0| 1 0| 0 0| 3 0 | 3 0
OBSTR OF LAW ENF OFF| 0 0| 0 0| 0 0| 0 0| 0 0 | 2 1| 26 2| 14 2| 0 0| 42 2 | 42 2
PERJURY
| 0 0| 0 0| 0 0| 0 0| 0 0 | 0 0| 1 0| 0 0| 0 0| 1 0 | 1 0
FALSE STATEMENTS GOV| 0 0| 0 0| 0 0| 0 0| 0 0 | 0 0| 1 0| 1 0| 0 0| 2 0 | 2 0
ESCAPE
| 0 0| 0 0| 0 0| 0 0| 0 0 | 0 0| 2 0| 1 0| 0 0| 3 0 | 3 0
Georgia Dept. of Corrections
59
-----------------------------------------------------------------------------------------------------------------------------------(continued)
Georgia Dept. of Corrections
60
Page 46 Run 05/01/00
Georgia Department of Corrections Office of Planning and Analysis
FEMALES ONLY Inmate statistical profile
Sample: ACTIVE PRISONERS EXCLUDING JAIL
Requestor: Statistics
Active inmates 05/01/2000
Most Serious Offense by current age & sex
(CONTINUED)
|
MEN
|
WOMEN
|
| Age | Age | Age | Age | Men
| Age | Age | Age | Age |Women
|Grand
Most Serious Offense|00-21 %|22-39 %|40-54 %|55-99 %|Total % |00-21 %|22-39 %|40-54 %|55-99 %|Total % |Total %
------------------------------------------------------------------------------------------------------------------------------------
AIDING ESCAPE
| 0 0| 0 0| 0 0| 0 0| 0 0 | 1 1| 0 0| 0 0| 0 0| 1 0 | 1 0
HINDERING APPREH OR | 0 0| 0 0| 0 0| 0 0| 0 0 | 0 0| 0 0| 2 0| 0 0| 2 0 | 2 0
CRIM INTER WITH GOVT| 0 0| 0 0| 0 0| 0 0| 0 0 | 1 1| 0 0| 1 0| 0 0| 2 0 | 2 0
SOLICIT/ACCEPTING BR| 0 0| 0 0| 0 0| 0 0| 0 0 | 0 0| 1 0| 0 0| 0 0| 1 0 | 1 0
CRUELTY TO CHILDREN | 0 0| 0 0| 0 0| 0 0| 0 0 | 4 2| 62 4| 7 1| 0 0| 73 3 | 73 3
CNTRBTNG DELINQENCY | 0 0| 0 0| 0 0| 0 0| 0 0 | 0 0| 0 0| 1 0| 0 0| 1 0 | 1 0
POSS FIREARM CONVCT | 0 0| 0 0| 0 0| 0 0| 0 0 | 0 0| 1 0| 0 0| 0 0| 1 0 | 1 0
CARRYING WEAPON AT S| 0 0| 0 0| 0 0| 0 0| 0 0 | 0 0| 1 0| 0 0| 0 0| 1 0 | 1 0
RACKETEERING
| 0 0| 0 0| 0 0| 0 0| 0 0 | 0 0| 2 0| 1 0| 0 0| 3 0 | 3 0
S/D NARCOTICS, OPIAT| 0 0| 0 0| 0 0| 0 0| 0 0 | 0 0| 4 0| 2 0| 1 2| 7 0 | 7 0
S/D DEP,STIM,CNTRF D| 0 0| 0 0| 0 0| 0 0| 0 0 | 0 0| 2 0| 2 0| 1 2| 5 0 | 5 0
SALE/DIST OF MARIJUA| 0 0| 0 0| 0 0| 0 0| 0 0 | 1 1| 11 1| 3 0| 2 3| 17 1 | 17 1
POSS NARCOTICS, OPIA| 0 0| 0 0| 0 0| 0 0| 0 0 | 0 0| 13 1| 8 1| 1 2| 22 1 | 22 1
POSS DEP,STIM,CNTRF | 0 0| 0 0| 0 0| 0 0| 0 0 | 1 1| 11 1| 2 0| 2 3| 16 1 | 16 1
POSS OF L.S.D.
| 0 0| 0 0| 0 0| 0 0| 0 0 | 0 0| 0 0| 1 0| 0 0| 1 0 | 1 0
POSS OF MARIJUANA | 0 0| 0 0| 0 0| 0 0| 0 0 | 1 1| 17 1| 0 0| 2 3| 20 1 | 20 1
ILLEGAL ATTM TO OBT | 0 0| 0 0| 0 0| 0 0| 0 0 | 0 0| 4 0| 3 0| 0 0| 7 0 | 7 0
VIOLATE GA CNTRL SBS| 0 0| 0 0| 0 0| 0 0| 0 0 | 0 0| 3 0| 3 0| 0 0| 6 0 | 6 0
UNLWFL MFG/DEL/DIST | 0 0| 0 0| 0 0| 0 0| 0 0 | 0 0| 2 0| 0 0| 0 0| 2 0 | 2 0
SALE/DIST CONT SUB P| 0 0| 0 0| 0 0| 0 0| 0 0 | 1 1| 2 0| 0 0| 0 0| 3 0 | 3 0
SALE/DISTRIBUTION CO| 0 0| 0 0| 0 0| 0 0| 0 0 | 4 2| 122 7| 33 5| 4 6| 163 6 | 163 6
POSSESSION OF COCAIN| 0 0| 0 0| 0 0| 0 0| 0 0 | 13 7| 159 9| 64 10| 3 5| 239 9 | 239 9
CRMNL ATPT VIOL SUBS| 0 0| 0 0| 0 0| 0 0| 0 0 | 0 0| 1 0| 1 0| 0 0| 2 0 | 2 0
MISC. DRUGS TRAFFICK| 0 0| 0 0| 0 0| 0 0| 0 0 | 1 1| 12 1| 8 1| 0 0| 21 1 | 21 1
COCAINE LESS 200 GRA| 0 0| 0 0| 0 0| 0 0| 0 0 | 0 0| 14 1| 9 1| 0 0| 23 1 | 23 1
COCAINE 201-400 GRAM| 0 0| 0 0| 0 0| 0 0| 0 0 | 0 0| 4 0| 3 0| 1 2| 8 0 | 8 0
COCAINE 401 OR MORE | 0 0| 0 0| 0 0| 0 0| 0 0 | 1 1| 8 0| 1 0| 0 0| 10 0 | 10 0
MARIJUANA 101-2000 P| 0 0| 0 0| 0 0| 0 0| 0 0 | 0 0| 1 0| 0 0| 0 0| 1 0 | 1 0
AMPHETAMINE 28-199 G| 0 0| 0 0| 0 0| 0 0| 0 0 | 0 0| 1 0| 1 0| 0 0| 2 0 | 2 0
AMPHETAMINE 200-399 | 0 0| 0 0| 0 0| 0 0| 0 0 | 0 0| 1 0| 0 0| 0 0| 1 0 | 1 0
AMPHETAMINE 400+ GRA| 0 0| 0 0| 0 0| 0 0| 0 0 | 0 0| 1 0| 0 0| 0 0| 1 0 | 1 0
ATT/CONSPRCY COMMT C| 0 0| 0 0| 0 0| 0 0| 0 0 | 0 0| 2 0| 1 0| 0 0| 3 0 | 3 0
VIOL MOTOR VEHICLE L| 0 0| 0 0| 0 0| 0 0| 0 0 | 0 0| 9 1| 3 0| 0 0| 12 0 | 12 0
DRVNG HABTL VIOLATOR| 0 0| 0 0| 0 0| 0 0| 0 0 | 0 0| 8 0| 4 1| 1 2| 13 1 | 13 1
CONSPIRACY
| 0 0| 0 0| 0 0| 0 0| 0 0 | 2 1| 12 1| 2 0| 0 0| 16 1 | 16 1
------------------------------------------------------------------------------------------------------------------------------------
(continued)
Georgia Dept. of Corrections
61
Page
47 Run 05/01/00
Georgia Department of Corrections Office of Planning and Analysis
FEMALES ONLY Inmate statistical profile
Sample: ACTIVE PRISONERS EXCLUDING JAIL
Requestor: Statistics
Active inmates 05/01/2000
Most Serious Offense by current age & sex
(CONTINUED)
|
MEN
|
WOMEN
|
| Age | Age | Age | Age | Men
| Age | Age | Age | Age |Women
|Grand
Most Serious Offense|00-21 %|22-39 %|40-54 %|55-99 %|Total % |00-21 %|22-39 %|40-54 %|55-99 %|Total % |Total %
------------------------------------------------------------------------------------------------------------------------------------
CRIMINAL ATTEMPT | 0 0| 0 0| 0 0| 0 0| 0 0 | 0 0| 1 0| 0 0| 0 0| 1 0 | 1 0
PARTY TO A CRIME | 0 0| 0 0| 0 0| 0 0| 0 0 | 1 1| 0 0| 0 0| 0 0| 1 0 | 1 0
------------------------------------------------------------------------------------------------------------------------------------
Total reported
| 0 0| 0 0| 0 0| 0 0| 0 0 | 174 100| 1684 100| 663 100| 65 100| 2586 100 | 2586 100
|
|
|
|
|
|
|
|
|
|
|
Percent reported |
.0|
.0|
.0|
.0|
.0 |
94.6|
96.1|
97.2|
98.5|
96.3 |
96.3
|
|
|
|
|
|
|
|
|
|
|
|
|
|
|
|
|
|
|
|
|
|
NOT REPORTED
|0|0|0|0|0
| 10 | 69 | 19 | 1 | 99
| 99
------------------------------------------------------------------------------------------------------------------------------------
Total
|0|0|0|0|0
| 184 | 1753 | 682 | 66 | 2685
| 2685
Georgia Dept. of Corrections
62
Page
48 Run 05/01/00
Georgia Department of Corrections Office of Planning and Analysis
FEMALES ONLY Inmate statistical profile
Sample: ACTIVE PRISONERS EXCLUDING JAIL Active inmates 05/01/2000
Requestor: Statistics Most Serious Crime Type by current age & sex
|
MEN
|
WOMEN
|
| Age | Age | Age | Age | Men
| Age | Age | Age | Age |Women
|Grand
Crime Type
|00-21 %|22-39 %|40-54 %|55-99 %|Total % |00-21 %|22-39 %|40-54 %|55-99 %|Total % |Total %
------------------------------------------------------------------------------------------------------------------------------------
VIOL/PERSN
| 0 0| 0 0| 0 0| 0 0| 0 0 | 86 49| 586 35| 231 35| 39 60| 942 36 | 942 36
NVIOL/PERS
| 0 0| 0 0| 0 0| 0 0| 0 0 | 0 0| 1 0| 0 0| 0 0| 1 0 | 1 0
PROPERTY
| 0 0| 0 0| 0 0| 0 0| 0 0 | 53 30| 598 36| 238 36| 8 12| 897 35 | 897 35
DRUG SALES
| 0 0| 0 0| 0 0| 0 0| 0 0 | 8 5| 187 11| 63 10| 9 14| 267 10 | 267 10
DRUG POSSN
| 0 0| 0 0| 0 0| 0 0| 0 0 | 15 9| 208 12| 82 12| 8 12| 313 12 | 313 12
ALCOHOL
| 0 0| 0 0| 0 0| 0 0| 0 0 | 0 0| 0 0| 0 0| 0 0| 0 0 | 0 0
HABIT/DUI
| 0 0| 0 0| 0 0| 0 0| 0 0 | 0 0| 18 1| 8 1| 1 2| 27 1 | 27 1
SEX OFFEND
| 0 0| 0 0| 0 0| 0 0| 0 0 | 5 3| 40 2| 19 3| 0 0| 64 2 | 64 2
OTHER
| 0 0| 0 0| 0 0| 0 0| 0 0 | 7 4| 46 3| 22 3| 0 0| 75 3 | 75 3
------------------------------------------------------------------------------------------------------------------------------------
Total reported
| 0 0| 0 0| 0 0| 0 0| 0 0 | 174 100| 1684 100| 663 100| 65 100| 2586 100 | 2586 100
|
|
|
|
|
|
|
|
|
|
|
Percent reported |
.0|
.0|
.0|
.0|
.0 |
94.6|
96.1|
97.2|
98.5|
96.3 |
96.3
|
|
|
|
|
|
|
|
|
|
|
|
|
|
|
|
|
|
|
|
|
|
NOT REPORTED
|0|0|0|0|0
| 10 | 69 | 19 | 1 | 99
| 99
------------------------------------------------------------------------------------------------------------------------------------
Total
|0|0|0|0|0
| 184 | 1753 | 682 | 66 | 2685
| 2685
Georgia Dept. of Corrections
63
Georgia Dept. of Corrections
64