- Collection:
- Georgia Government Publications
- Title:
- Inmate statistical profile: active life without parole, Oct. 2004
- Creator:
- Georgia. Department of Corrections. Planning and Analysis Section
- Publisher:
- Atlanta, GA. : Georgia Dept. of Corrections, Office of Planning and Analysis, 2004-10
- Date of Original:
- 2004-10
- Subject:
- Prisoners--Georgia
- Location:
- United States, Georgia, 32.75042, -83.50018
- Medium:
- state government records
- Type:
- Text
- Format:
- application/pdf
- External Identifiers:
- Call Number GA R300.P5 P1 A26 2004/10
- Metadata URL:
- https://dlg.galileo.usg.edu/id:dlg_ggpd_i-ga-br300-pp5-bp1-ba26-b2004-s10-belec-p-btext
- Digital Object URL:
- https://dlg.galileo.usg.edu/do:dlg_ggpd_i-ga-br300-pp5-bp1-ba26-b2004-s10-belec-p-btext
- Language:
- eng
- Holding Institution:
- University of Georgia. Map and Government Information Library
- Rights:
-

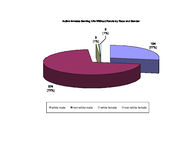
Active Inmates Serving Life Without Parole by Race and Gender
3 (1%)
2 (1%)
104 (27%)
274 (72%)
white male
non-white male
white female
non-white female
200
184
180
(48%)
160
140
120
100
80
60
40
20
0 zero
Active Inmates Serving Life Without Parole by Prior Incarcerations
78 (20%)
one
41 (11%)
two
40 (10%)
three
24 (6%)
four
16 (4%)
five or more
Active Inmates Serving LWOP by Crime Type
4 (1%)
5 (1%)
1
50 (13%)
323 (84%)
viol/persn property drug sales drug possn sex offend
Georgia Department of Corrections Page 1 Run 10/21/04 9:46 am
Office of Planning and Analysis
Inmate statistical profile TABLE OF CONTENTS FOR ACTIVE PRISONERS EXCLUDING JAIL
Title
PAGE
-----
----
RACE AND SEX............................ 2
Culture Fair IQ Scores.................. 3
Self-Rpt Socioeconomic Class............ 4
Self-Rpt Environment To Age 16.......... 5
Self-Rpt Education Level................ 6
Functional Reading Level (WRAT Scores).. 7
Functional Math Level (WRAT Scores)..... 8
Functional Spelling Level (WRAT Scores). 9
Self-Rpt Guardian Status To Age 16......10
Self-Rpt Employment Status Before Prison11
Self-Rpt Marital Status At Admission....12
Self-Rpt Number Of Children At Admission13
Self-Rpt Religious Affiliation..........14
Self-Rpt Family Behavior Patterns *.....15
Inmate Diagnostic Behavior Problem *....16
Physical Profile (General Condition)....17
Security Status.........................18
Number Of Sentences.....................19
Number Of Disciplinaries................20
Number Of Escapes.......................21
Number Of Prior Georgia Incarcerations *22
Number Of Transfers.....................23
County Of Conviction....................24
Circ Of Conviction......................27
Home County.............................29
Prison Sentence In Years................32
Probation To Follow Prison..............33
Admission Type..........................34
Release Type............................35
Inst By Group...........................36
Institution.............................37
Misdemeanors And Felonies...............38
Crimes By Group.........................39
Most Serious Offense....................40
Most Serious Crime Type.................41
Page 2 Run 10/21/04 9:46 am
Georgia Department of Corrections Office of Planning and Analysis
Inmate statistical profile
Sample: ACTIVE PRISONERS EXCLUDING JAIL Active inmates 10/21/2004
Requestor: Statistics RACE AND SEX by current age & sex
|
MEN
|
WOMEN
|
| Age | Age | Age | Age | Men
| Age | Age | Age | Age |Women
|Grand
RACE AND SEX
|00-21 %|22-39 %|40-54 %|55-99 %|Total % |00-21 %|22-39 %|40-54 %|55-99 %|Total % |Total %
------------------------------------------------------------------------------------------------------------------------------------
WHITE MALE
| 1 50| 53 25| 34 25| 16 53| 104 28 | 0 0| 0 0| 0 0| 0 0| 0 0 | 104 27
NON WHITE MALE
| 1 50| 159 75| 100 75| 14 47| 274 72 | 0 0| 0 0| 0 0| 0 0| 0 0 | 274 72
WHITE FEMALE
| 0 0| 0 0| 0 0| 0 0| 0 0 | 0 0| 2 67| 1 50| 0 0| 3 60 | 3 1
NON WHITE FEMALE | 0 0| 0 0| 0 0| 0 0| 0 0 | 0 0| 1 33| 1 50| 0 0| 2 40 | 2 1
------------------------------------------------------------------------------------------------------------------------------------
Total reported
| 2 100| 212 100| 134 100| 30 100| 378 100 | 0 0| 3 100| 2 100| 0 0| 5 100 | 383 100
|
|
|
|
|
|
|
|
|
|
|
Percent reported | 100.0| 100.0| 100.0| 100.0| 100.0 |
.0| 100.0| 100.0|
.0| 100.0 | 100.0
|
|
|
|
|
|
|
|
|
|
|
|
|
|
|
|
|
|
|
|
|
|
NOT REPORTED
|0|0|0|0|0
|0|0|0|0|0
|0
------------------------------------------------------------------------------------------------------------------------------------
Total
| 2 | 212 | 134 | 30 | 378
|0|3|2|0|5
| 383
|
|
|
|
|
|
|
|
|
|
|
|
|
|
|
|
|
|
|
|
|
|
|
|
|
|
|
|
|
|
|
|
|
|
|
|
|
|
|
|
|
|
|
|
|
|
|
|
|
|
|
|
|
|
|
AVERAGE AGE
| 20.50 | 31.46 | 45.84 | 60.47 | 38.80 | .00 | 31.33 | 47.50 | .00 | 37.80 | 38.79
Page 3 Run 10/21/04 9:46 am
Georgia Department of Corrections Office of Planning and Analysis
Inmate statistical profile
Sample: ACTIVE PRISONERS EXCLUDING JAIL Active inmates 10/21/2004
Requestor: Statistics Culture Fair IQ Scores by current age & sex
|
MEN
|
WOMEN
|
| Age | Age | Age | Age | Men
| Age | Age | Age | Age |Women
|Grand
IQ Score
|00-21 %|22-39 %|40-54 %|55-99 %|Total % |00-21 %|22-39 %|40-54 %|55-99 %|Total % |Total %
------------------------------------------------------------------------------------------------------------------------------------
LESS THAN 70
| 0 0| 5 3| 12 10| 0 0| 17 5 | 0 0| 0 0| 0 0| 0 0| 0 0 | 17 5
70 AND UP
| 2 100| 187 97| 105 90| 25 100| 319 95 | 0 0| 3 100| 2 100| 0 0| 5 100 | 324 95
------------------------------------------------------------------------------------------------------------------------------------
Total reported
| 2 100| 192 100| 117 100| 25 100| 336 100 | 0 0| 3 100| 2 100| 0 0| 5 100 | 341 100
|
|
|
|
|
|
|
|
|
|
|
Percent reported | 100.0|
90.6|
87.3|
83.3|
88.9 |
.0| 100.0| 100.0|
.0| 100.0 |
89.0
|
|
|
|
|
|
|
|
|
|
|
|
|
|
|
|
|
|
|
|
|
|
NOT REPORTED
| 0 | 20 | 17 | 5 | 42
|0|0|0|0|0
| 42
------------------------------------------------------------------------------------------------------------------------------------
Total
| 2 | 212 | 134 | 30 | 378
|0|3|2|0|5
| 383
|
|
|
|
|
|
|
|
|
|
|
|
|
|
|
|
|
|
|
|
|
|
|
|
|
|
|
|
|
|
|
|
|
|
|
|
|
|
|
|
|
|
|
|
|
|
|
|
|
|
|
|
|
|
|
AVERAGE IQ
| 90.00 | 101.13 | 94.77 | 99.92 | 98.76 | .00 | 113.67 | 91.00 | .00 | 104.60 | 98.84
Page 4 Run 10/21/04 9:46 am
Georgia Department of Corrections Office of Planning and Analysis
Inmate statistical profile
Sample: ACTIVE PRISONERS EXCLUDING JAIL
Requestor: Statistics
Active inmates 10/21/2004
Self-Rpt Socioeconomic Class by current age & sex
|
MEN
|
WOMEN
|
| Age | Age | Age | Age | Men
| Age | Age | Age | Age |Women
|Grand
Socioeconomic Class |00-21 %|22-39 %|40-54 %|55-99 %|Total % |00-21 %|22-39 %|40-54 %|55-99 %|Total % |Total %
------------------------------------------------------------------------------------------------------------------------------------
WELFARE
| 0 0| 12 6| 8 6| 1 3| 21 6 | 0 0| 0 0| 0 0| 0 0| 0 0 | 21 6
OCC EMPLOY
| 0 0| 10 5| 7 5| 0 0| 17 5 | 0 0| 0 0| 0 0| 0 0| 0 0 | 17 5
MINIMUM STD
| 2 100| 114 55| 68 52| 14 48| 198 54 | 0 0| 0 0| 1 50| 0 0| 1 20 | 199 53
MIDDLE
| 0 0| 68 33| 45 34| 13 45| 126 34 | 0 0| 2 67| 1 50| 0 0| 3 60 | 129 34
OTHER
| 0 0| 2 1| 4 3| 1 3| 7 2 | 0 0| 1 33| 0 0| 0 0| 1 20 | 8 2
------------------------------------------------------------------------------------------------------------------------------------
Total reported
| 2 100| 206 100| 132 100| 29 100| 369 100 | 0 0| 3 100| 2 100| 0 0| 5 100 | 374 100
|
|
|
|
|
|
|
|
|
|
|
Percent reported | 100.0|
97.2|
98.5|
96.7|
97.6 |
.0| 100.0| 100.0|
.0| 100.0 |
97.7
|
|
|
|
|
|
|
|
|
|
|
|
|
|
|
|
|
|
|
|
|
|
NOT RPTD
|0|6|2|1|9
|0|0|0|0|0
|9
------------------------------------------------------------------------------------------------------------------------------------
Total
| 2 | 212 | 134 | 30 | 378
|0|3|2|0|5
| 383
Page 5 Run 10/21/04 9:46 am
Georgia Department of Corrections Office of Planning and Analysis
Inmate statistical profile
Sample: ACTIVE PRISONERS EXCLUDING JAIL
Requestor: Statistics
Active inmates 10/21/2004
Self-Rpt Environment To Age 16 by current age & sex
|
MEN
|
WOMEN
|
| Age | Age | Age | Age | Men
| Age | Age | Age | Age |Women
|Grand
Environment
|00-21 %|22-39 %|40-54 %|55-99 %|Total % |00-21 %|22-39 %|40-54 %|55-99 %|Total % |Total %
------------------------------------------------------------------------------------------------------------------------------------
RURAL/FARM
| 0 0| 1 0| 4 3| 4 13| 9 2 | 0 0| 0 0| 0 0| 0 0| 0 0 | 9 2
RURAL/NFARM
| 0 0| 6 3| 10 8| 3 10| 19 5 | 0 0| 1 33| 1 50| 0 0| 2 40 | 21 6
S.M.S.A
| 1 50| 96 47| 45 34| 9 30| 151 41 | 0 0| 0 0| 0 0| 0 0| 0 0 | 151 40
URBAN
| 0 0| 38 18| 27 20| 2 7| 67 18 | 0 0| 1 33| 1 50| 0 0| 2 40 | 69 18
SMALL TOWN
| 1 50| 64 31| 45 34| 12 40| 122 33 | 0 0| 1 33| 0 0| 0 0| 1 20 | 123 33
OTHER
| 0 0| 1 0| 1 1| 0 0| 2 1 | 0 0| 0 0| 0 0| 0 0| 0 0 | 2 1
------------------------------------------------------------------------------------------------------------------------------------
Total reported
| 2 100| 206 100| 132 100| 30 100| 370 100 | 0 0| 3 100| 2 100| 0 0| 5 100 | 375 100
|
|
|
|
|
|
|
|
|
|
|
Percent reported | 100.0|
97.2|
98.5| 100.0|
97.9 |
.0| 100.0| 100.0|
.0| 100.0 |
97.9
|
|
|
|
|
|
|
|
|
|
|
|
|
|
|
|
|
|
|
|
|
|
NOT RPTD
|0|6|2|0|8
|0|0|0|0|0
|8
------------------------------------------------------------------------------------------------------------------------------------
Total
| 2 | 212 | 134 | 30 | 378
|0|3|2|0|5
| 383
Page 6 Run 10/21/04 9:46 am
Georgia Department of Corrections Office of Planning and Analysis
Inmate statistical profile
Sample: ACTIVE PRISONERS EXCLUDING JAIL Active inmates 10/21/2004
Requestor: Statistics Self-Rpt Education Level by current age & sex
|
MEN
|
WOMEN
|
| Age | Age | Age | Age | Men
| Age | Age | Age | Age |Women
|Grand
Education Level
|00-21 %|22-39 %|40-54 %|55-99 %|Total % |00-21 %|22-39 %|40-54 %|55-99 %|Total % |Total %
------------------------------------------------------------------------------------------------------------------------------------
LESS THAN GRADE 7 | 0 0| 6 3| 5 4| 3 10| 14 4 | 0 0| 0 0| 0 0| 0 0| 0 0 | 14 4
GRADE 7
| 0 0| 6 3| 8 6| 2 7| 16 4 | 0 0| 0 0| 0 0| 0 0| 0 0 | 16 4
GRADE 8
| 1 50| 25 12| 10 8| 4 13| 40 11 | 0 0| 0 0| 0 0| 0 0| 0 0 | 40 11
GRADE 9
| 0 0| 30 14| 15 11| 5 17| 50 13 | 0 0| 1 33| 0 0| 0 0| 1 20 | 51 14
GRADE 10
| 1 50| 43 21| 33 25| 1 3| 78 21 | 0 0| 0 0| 1 50| 0 0| 1 20 | 79 21
GRADE 11
| 0 0| 34 16| 13 10| 4 13| 51 14 | 0 0| 2 67| 0 0| 0 0| 2 40 | 53 14
GRADE 12
| 0 0| 38 18| 17 13| 5 17| 60 16 | 0 0| 0 0| 1 50| 0 0| 1 20 | 61 16
MORE THAN GRADE 12 | 0 0| 26 13| 31 23| 6 20| 63 17 | 0 0| 0 0| 0 0| 0 0| 0 0 | 63 17
------------------------------------------------------------------------------------------------------------------------------------
Total reported
| 2 100| 208 100| 132 100| 30 100| 372 100 | 0 0| 3 100| 2 100| 0 0| 5 100 | 377 100
|
|
|
|
|
|
|
|
|
|
|
Percent reported | 100.0|
98.1|
98.5| 100.0|
98.4 |
.0| 100.0| 100.0|
.0| 100.0 |
98.4
|
|
|
|
|
|
|
|
|
|
|
|
|
|
|
|
|
|
|
|
|
|
NOT REPORTED
|0|4|2|0|6
|0|0|0|0|0
|6
------------------------------------------------------------------------------------------------------------------------------------
Total
| 2 | 212 | 134 | 30 | 378
|0|3|2|0|5
| 383
|
|
|
|
|
|
|
|
|
|
|
|
|
|
|
|
|
|
|
|
|
|
|
|
|
|
|
|
|
|
|
|
|
|
|
|
|
|
|
|
|
|
|
|
|
|
|
|
|
|
|
|
|
|
|
AVG EDUCATION LEVEL | 9.00 | 11.21 | 11.83 | 11.03 | 11.40 | .00 | 10.33 | 11.00 | .00 | 10.60 | 11.39
* NOTE: THE FIELD LABLED "LESS THAN GRADE 7" WAS CORRECTED IN MARCH 1989: MISSING DATA FOR INMATES STILL IN DIAGNOSTICS NOW HAS BEEN REMOVED FROM THIS FIELD AND IDENTIFIED AS "NOT REPORTED" INFORMATION.
Page 7 Run 10/21/04 9:46 am
Georgia Department of Corrections Office of Planning and Analysis
Inmate statistical profile
Sample: ACTIVE PRISONERS EXCLUDING JAIL
Requestor: Statistics
Active inmates 10/21/2004
Functional Reading Level (WRAT Scores) by current age & sex
|
MEN
|
WOMEN
|
| Age | Age | Age | Age | Men
| Age | Age | Age | Age |Women
|Grand
WRAT Reading Score |00-21 %|22-39 %|40-54 %|55-99 %|Total % |00-21 %|22-39 %|40-54 %|55-99 %|Total % |Total %
------------------------------------------------------------------------------------------------------------------------------------
LESS THAN GRADE 6 | 1 50| 53 27| 51 42| 8 32| 113 33 | 0 0| 1 33| 1 50| 0 0| 2 40 | 115 33
6TH THRU 8TH GRADE | 1 50| 42 22| 22 18| 6 24| 71 21 | 0 0| 0 0| 0 0| 0 0| 0 0 | 71 21
GRADE 9
| 0 0| 18 9| 16 13| 2 8| 36 11 | 0 0| 1 33| 0 0| 0 0| 1 20 | 37 11
GRADE 10
| 0 0| 5 3| 3 2| 2 8| 10 3 | 0 0| 0 0| 0 0| 0 0| 0 0 | 10 3
GRADE 11
| 0 0| 11 6| 6 5| 2 8| 19 6 | 0 0| 0 0| 0 0| 0 0| 0 0 | 19 5
GRADE 12
| 0 0| 38 20| 14 12| 4 16| 56 16 | 0 0| 0 0| 0 0| 0 0| 0 0 | 56 16
MORE THAN GRADE 12 | 0 0| 26 13| 9 7| 1 4| 36 11 | 0 0| 1 33| 1 50| 0 0| 2 40 | 38 11
------------------------------------------------------------------------------------------------------------------------------------
Total reported
| 2 100| 193 100| 121 100| 25 100| 341 100 | 0 0| 3 100| 2 100| 0 0| 5 100 | 346 100
|
|
|
|
|
|
|
|
|
|
|
Percent reported | 100.0|
91.0|
90.3|
83.3|
90.2 |
.0| 100.0| 100.0|
.0| 100.0 |
90.3
|
|
|
|
|
|
|
|
|
|
|
|
|
|
|
|
|
|
|
|
|
|
NOT REPORTED
| 0 | 19 | 13 | 5 | 37
|0|0|0|0|0
| 37
------------------------------------------------------------------------------------------------------------------------------------
Total
| 2 | 212 | 134 | 30 | 378
|0|3|2|0|5
| 383
|
|
|
|
|
|
|
|
|
|
|
|
|
|
|
|
|
|
|
|
|
|
|
|
|
|
|
|
|
|
|
|
|
|
|
|
|
|
|
|
|
|
|
|
|
|
|
|
|
|
|
|
|
|
|
AVG READING SCORE | 7.00 | 8.76 | 7.29 | 8.00 | 8.17 | .00 | 9.13 | 7.85 | .00 | 8.62 | 8.18
Page 8 Run 10/21/04 9:46 am
Georgia Department of Corrections Office of Planning and Analysis
Inmate statistical profile
Sample: ACTIVE PRISONERS EXCLUDING JAIL
Requestor: Statistics
Active inmates 10/21/2004
Functional Math Level (WRAT Scores) by current age & sex
|
MEN
|
WOMEN
|
| Age | Age | Age | Age | Men
| Age | Age | Age | Age |Women
|Grand
WRAT Math Score
|00-21 %|22-39 %|40-54 %|55-99 %|Total % |00-21 %|22-39 %|40-54 %|55-99 %|Total % |Total %
------------------------------------------------------------------------------------------------------------------------------------
LESS THAN GRADE 6 | 1 50| 53 27| 53 44| 12 48| 119 35 | 0 0| 0 0| 1 50| 0 0| 1 20 | 120 35
6TH THRU 8TH GRADE | 1 50| 90 47| 45 37| 7 28| 143 42 | 0 0| 1 33| 0 0| 0 0| 1 20 | 144 42
GRADE 9
| 0 0| 23 12| 11 9| 1 4| 35 10 | 0 0| 1 33| 1 50| 0 0| 2 40 | 37 11
GRADE 10
| 0 0| 13 7| 5 4| 2 8| 20 6 | 0 0| 0 0| 0 0| 0 0| 0 0 | 20 6
GRADE 11
| 0 0| 9 5| 0 0| 1 4| 10 3 | 0 0| 0 0| 0 0| 0 0| 0 0 | 10 3
GRADE 12
| 0 0| 4 2| 4 3| 1 4| 9 3 | 0 0| 0 0| 0 0| 0 0| 0 0 | 9 3
MORE THAN GRADE 12 | 0 0| 1 1| 3 2| 1 4| 5 1 | 0 0| 1 33| 0 0| 0 0| 1 20 | 6 2
------------------------------------------------------------------------------------------------------------------------------------
Total reported
| 2 100| 193 100| 121 100| 25 100| 341 100 | 0 0| 3 100| 2 100| 0 0| 5 100 | 346 100
|
|
|
|
|
|
|
|
|
|
|
Percent reported | 100.0|
91.0|
90.3|
83.3|
90.2 |
.0| 100.0| 100.0|
.0| 100.0 |
90.3
|
|
|
|
|
|
|
|
|
|
|
|
|
|
|
|
|
|
|
|
|
|
NOT REPORTED
| 0 | 19 | 13 | 5 | 37
|0|0|0|0|0
| 37
------------------------------------------------------------------------------------------------------------------------------------
Total
| 2 | 212 | 134 | 30 | 378
|0|3|2|0|5
| 383
|
|
|
|
|
|
|
|
|
|
|
|
|
|
|
|
|
|
|
|
|
|
|
|
|
|
|
|
|
|
|
|
|
|
|
|
|
|
|
|
|
|
|
|
|
|
|
|
|
|
|
|
|
|
|
AVG MATH SCORE
| 5.75 | 7.32 | 6.51 | 6.64 | 6.97 | .00 | 10.20 | 6.90 | .00 | 8.88 | 7.00
Page 9 Run 10/21/04 9:46 am
Georgia Department of Corrections Office of Planning and Analysis
Inmate statistical profile
Sample: ACTIVE PRISONERS EXCLUDING JAIL
Requestor: Statistics
Active inmates 10/21/2004
Functional Spelling Level (WRAT Scores) by current age & sex
|
MEN
|
WOMEN
|
| Age | Age | Age | Age | Men
| Age | Age | Age | Age |Women
|Grand
WRAT Spelling Score |00-21 %|22-39 %|40-54 %|55-99 %|Total % |00-21 %|22-39 %|40-54 %|55-99 %|Total % |Total %
------------------------------------------------------------------------------------------------------------------------------------
LESS THAN GRADE 6 | 1 50| 55 28| 62 51| 12 48| 130 38 | 0 0| 0 0| 1 50| 0 0| 1 20 | 131 38
6TH THRU 8TH GRADE | 1 50| 58 30| 32 26| 8 32| 99 29 | 0 0| 1 33| 0 0| 0 0| 1 20 | 100 29
GRADE 9
| 0 0| 24 12| 6 5| 1 4| 31 9 | 0 0| 0 0| 0 0| 0 0| 0 0 | 31 9
GRADE 10
| 0 0| 16 8| 5 4| 0 0| 21 6 | 0 0| 0 0| 0 0| 0 0| 0 0 | 21 6
GRADE 11
| 0 0| 12 6| 4 3| 1 4| 17 5 | 0 0| 0 0| 0 0| 0 0| 0 0 | 17 5
GRADE 12
| 0 0| 16 8| 7 6| 2 8| 25 7 | 0 0| 1 33| 1 50| 0 0| 2 40 | 27 8
MORE THAN GRADE 12 | 0 0| 12 6| 5 4| 1 4| 18 5 | 0 0| 1 33| 0 0| 0 0| 1 20 | 19 5
------------------------------------------------------------------------------------------------------------------------------------
Total reported
| 2 100| 193 100| 121 100| 25 100| 341 100 | 0 0| 3 100| 2 100| 0 0| 5 100 | 346 100
|
|
|
|
|
|
|
|
|
|
|
Percent reported | 100.0|
91.0|
90.3|
83.3|
90.2 |
.0| 100.0| 100.0|
.0| 100.0 |
90.3
|
|
|
|
|
|
|
|
|
|
|
|
|
|
|
|
|
|
|
|
|
|
NOT REPORTED
| 0 | 19 | 13 | 5 | 37
|0|0|0|0|0
| 37
------------------------------------------------------------------------------------------------------------------------------------
Total
| 2 | 212 | 134 | 30 | 378
|0|3|2|0|5
| 383
|
|
|
|
|
|
|
|
|
|
|
|
|
|
|
|
|
|
|
|
|
|
|
|
|
|
|
|
|
|
|
|
|
|
|
|
|
|
|
|
|
|
|
|
|
|
|
|
|
|
|
|
|
|
|
AVG SPELLING SCORE | 4.95 | 8.00 | 6.23 | 6.64 | 7.25 | .00 | 10.57 | 8.20 | .00 | 9.62 | 7.29
Page 10 Run 10/21/04 9:46 am
Georgia Department of Corrections Office of Planning and Analysis
Inmate statistical profile
Sample: ACTIVE PRISONERS EXCLUDING JAIL
Requestor: Statistics
Active inmates 10/21/2004
Self-Rpt Guardian Status To Age 16 by current age & sex
|
MEN
|
WOMEN
|
| Age | Age | Age | Age | Men
| Age | Age | Age | Age |Women
|Grand
Guardian Status
|00-21 %|22-39 %|40-54 %|55-99 %|Total % |00-21 %|22-39 %|40-54 %|55-99 %|Total % |Total %
------------------------------------------------------------------------------------------------------------------------------------
ORPHANAGE
| 2 100| 212 101| 134 101| 30 100| 378 101 | 0 0| 3 100| 2 100| 0 0| 5 100 | 383 101
FATHER ONLY
| 0 0| 8 4| 2 2| 0 0| 10 3 | 0 0| 0 0| 0 0| 0 0| 0 0 | 10 3
FTR MTR HD
| 0 0| 18 9| 7 5| 2 7| 27 7 | 0 0| 0 0| 0 0| 0 0| 0 0 | 27 7
MOTHER ONLY
| 1 50| 79 38| 56 42| 5 17| 141 38 | 0 0| 0 0| 0 0| 0 0| 0 0 | 141 37
MTR FTR HD
| 0 0| 61 29| 48 36| 15 50| 124 33 | 0 0| 2 67| 2 100| 0 0| 4 80 | 128 34
OTH FEMALE
| 0 0| 7 3| 3 2| 3 10| 13 3 | 0 0| 0 0| 0 0| 0 0| 0 0 | 13 3
OTH MALE
| 0 0| 2 1| 0 0| 0 0| 2 1 | 0 0| 0 0| 0 0| 0 0| 0 0 | 2 1
STEP-PARNTS
| 1 50| 7 3| 1 1| 2 7| 11 3 | 0 0| 0 0| 0 0| 0 0| 0 0 | 11 3
FOSTER HOME
| 0 0| 7 3| 1 1| 1 3| 9 2 | 0 0| 0 0| 0 0| 0 0| 0 0 | 9 2
GRAND PRNTS
| 0 0| 12 6| 11 8| 1 3| 24 6 | 0 0| 1 33| 0 0| 0 0| 1 20 | 25 7
OTHER
| 0 0| 8 4| 4 3| 1 3| 13 3 | 0 0| 0 0| 0 0| 0 0| 0 0 | 13 3
------------------------------------------------------------------------------------------------------------------------------------
Total reported
| 4 100| 421 100| 267 100| 60 100| 752 100 | 0 0| 6 100| 4 100| 0 0| 10 100 | 762 100
|
|
|
|
|
|
|
|
|
|
|
Percent reported | 100.0|
98.6|
99.3| 100.0|
98.9 |
.0| 100.0| 100.0|
.0| 100.0 |
99.0
|
|
|
|
|
|
|
|
|
|
|
|
|
|
|
|
|
|
|
|
|
|
NOT RPTD
|0|3|1|0|4
|0|0|0|0|0
|4
------------------------------------------------------------------------------------------------------------------------------------
Total
| 2 | 212 | 134 | 30 | 378
|0|3|2|0|5
| 383
Page 11 Run 10/21/04 9:46 am
Georgia Department of Corrections Office of Planning and Analysis
Inmate statistical profile
Sample: ACTIVE PRISONERS EXCLUDING JAIL
Requestor: Statistics
Active inmates 10/21/2004
Self-Rpt Employment Status Before Prison by current age & sex
|
MEN
|
WOMEN
|
| Age | Age | Age | Age | Men
| Age | Age | Age | Age |Women
|Grand
Employment
|00-21 %|22-39 %|40-54 %|55-99 %|Total % |00-21 %|22-39 %|40-54 %|55-99 %|Total % |Total %
------------------------------------------------------------------------------------------------------------------------------------
FULL TIME
| 1 50| 94 49| 80 67| 20 69| 195 57 | 0 0| 3 100| 1 100| 0 0| 4 100 | 199 58
PART TIME
| 0 0| 13 7| 4 3| 0 0| 17 5 | 0 0| 0 0| 0 0| 0 0| 0 0 | 17 5
UNEMPL < 6M
| 0 0| 24 13| 11 9| 1 3| 36 11 | 0 0| 0 0| 0 0| 0 0| 0 0 | 36 10
UNEMPL > 6M
| 0 0| 34 18| 17 14| 2 7| 53 15 | 0 0| 0 0| 0 0| 0 0| 0 0 | 53 15
NEVER WORKD
| 1 50| 22 11| 2 2| 1 3| 26 8 | 0 0| 0 0| 0 0| 0 0| 0 0 | 26 8
STUDENT
| 0 0| 1 1| 0 0| 0 0| 1 0 | 0 0| 0 0| 0 0| 0 0| 0 0 | 1 0
INCAPABLE
| 0 0| 4 2| 5 4| 5 17| 14 4 | 0 0| 0 0| 0 0| 0 0| 0 0 | 14 4
OTHER
| 0 0| 0 0| 0 0| 0 0| 0 0 | 0 0| 0 0| 0 0| 0 0| 0 0 | 0 0
------------------------------------------------------------------------------------------------------------------------------------
Total reported
| 2 100| 192 100| 119 100| 29 100| 342 100 | 0 0| 3 100| 1 100| 0 0| 4 100 | 346 100
|
|
|
|
|
|
|
|
|
|
|
Percent reported | 100.0|
90.6|
88.8|
96.7|
90.5 |
.0| 100.0|
50.0|
.0|
80.0 |
90.3
|
|
|
|
|
|
|
|
|
|
|
|
|
|
|
|
|
|
|
|
|
|
NOT RPTD
| 0 | 20 | 15 | 1 | 36
|0|0|1|0|1
| 37
------------------------------------------------------------------------------------------------------------------------------------
Total
| 2 | 212 | 134 | 30 | 378
|0|3|2|0|5
| 383
* NOTE: THE FIELD LABELD "OTHER" WAS CORRECTED IN APRIL 1989; INMATES CODED "PRE-OTIS NOT REPORTED" NOW HAVE BEEN REMOVED FROM THIS FIELD AND IDENTIFIED AS "NOT REPORTED".
Page 12 Run 10/21/04 9:46 am
Georgia Department of Corrections Office of Planning and Analysis
Inmate statistical profile
Sample: ACTIVE PRISONERS EXCLUDING JAIL
Requestor: Statistics
Active inmates 10/21/2004
Self-Rpt Marital Status At Admission by current age & sex
|
MEN
|
WOMEN
|
| Age | Age | Age | Age | Men
| Age | Age | Age | Age |Women
|Grand
Marital Status
|00-21 %|22-39 %|40-54 %|55-99 %|Total % |00-21 %|22-39 %|40-54 %|55-99 %|Total % |Total %
------------------------------------------------------------------------------------------------------------------------------------
SINGLE
| 2 100| 152 73| 56 42| 3 10| 213 57 | 0 0| 2 67| 1 50| 0 0| 3 60 | 216 57
MARRIED
| 0 0| 21 10| 18 14| 13 43| 52 14 | 0 0| 0 0| 0 0| 0 0| 0 0 | 52 14
SEPARATED
| 0 0| 2 1| 11 8| 0 0| 13 3 | 0 0| 0 0| 0 0| 0 0| 0 0 | 13 3
DIVORCED
| 0 0| 14 7| 25 19| 8 27| 47 13 | 0 0| 0 0| 1 50| 0 0| 1 20 | 48 13
WIDOWED
| 0 0| 2 1| 7 5| 1 3| 10 3 | 0 0| 1 33| 0 0| 0 0| 1 20 | 11 3
COMMON LAW
| 0 0| 18 9| 16 12| 5 17| 39 10 | 0 0| 0 0| 0 0| 0 0| 0 0 | 39 10
OTHER
| 0 0| 0 0| 0 0| 0 0| 0 0 | 0 0| 0 0| 0 0| 0 0| 0 0 | 0 0
------------------------------------------------------------------------------------------------------------------------------------
Total reported
| 2 100| 209 100| 133 100| 30 100| 374 100 | 0 0| 3 100| 2 100| 0 0| 5 100 | 379 100
|
|
|
|
|
|
|
|
|
|
|
Percent reported | 100.0|
98.6|
99.3| 100.0|
98.9 |
.0| 100.0| 100.0|
.0| 100.0 |
99.0
|
|
|
|
|
|
|
|
|
|
|
|
|
|
|
|
|
|
|
|
|
|
NOT RPTD
|0|3|1|0|4
|0|0|0|0|0
|4
------------------------------------------------------------------------------------------------------------------------------------
Total
| 2 | 212 | 134 | 30 | 378
|0|3|2|0|5
| 383
Page 13 Run 10/21/04 9:46 am
Georgia Department of Corrections Office of Planning and Analysis
Inmate statistical profile
Sample: ACTIVE PRISONERS EXCLUDING JAIL
Requestor: Statistics
Active inmates 10/21/2004
Self-Rpt Number Of Children At Admission by current age & sex
|
MEN
|
WOMEN
|
| Age | Age | Age | Age | Men
| Age | Age | Age | Age |Women
|Grand
Number Of Children |00-21 %|22-39 %|40-54 %|55-99 %|Total % |00-21 %|22-39 %|40-54 %|55-99 %|Total % |Total %
------------------------------------------------------------------------------------------------------------------------------------
NO CHILDREN
| 1 50| 86 41| 46 35| 2 7| 135 36 | 0 0| 1 33| 0 0| 0 0| 1 20 | 136 36
ONE CHILD
| 1 50| 58 27| 30 23| 8 27| 97 26 | 0 0| 1 33| 2 100| 0 0| 3 60 | 100 26
TWO CHILDREN
| 0 0| 33 16| 24 18| 8 27| 65 17 | 0 0| 1 33| 0 0| 0 0| 1 20 | 66 17
THREE CHILDREN
| 0 0| 18 9| 21 16| 6 20| 45 12 | 0 0| 0 0| 0 0| 0 0| 0 0 | 45 12
FOUR CHILDREN
| 0 0| 11 5| 3 2| 2 7| 16 4 | 0 0| 0 0| 0 0| 0 0| 0 0 | 16 4
FIVE CHILDREN
| 0 0| 4 2| 5 4| 2 7| 11 3 | 0 0| 0 0| 0 0| 0 0| 0 0 | 11 3
MORE THAN 5 CHILDREN| 0 0| 1 0| 4 3| 2 7| 7 2 | 0 0| 0 0| 0 0| 0 0| 0 0 | 7 2
------------------------------------------------------------------------------------------------------------------------------------
Total reported
| 2 100| 211 100| 133 100| 30 100| 376 100 | 0 0| 3 100| 2 100| 0 0| 5 100 | 381 100
|
|
|
|
|
|
|
|
|
|
|
Percent reported | 100.0|
99.5|
99.3| 100.0|
99.5 |
.0| 100.0| 100.0|
.0| 100.0 |
99.5
|
|
|
|
|
|
|
|
|
|
|
|
|
|
|
|
|
|
|
|
|
|
NOT REPORTED
|0|1|1|0|2
|0|0|0|0|0
|2
------------------------------------------------------------------------------------------------------------------------------------
Total
| 2 | 212 | 134 | 30 | 378
|0|3|2|0|5
| 383
|
|
|
|
|
|
|
|
|
|
|
|
|
|
|
|
|
|
|
|
|
|
|
|
|
|
|
|
|
|
|
|
|
|
|
|
|
|
|
|
|
|
|
|
|
|
|
|
|
|
|
|
|
|
|
AVG NUM CHILDREN | .50 | 1.18 | 1.61 | 2.67 | 1.44 | .00 | 1.00 | 1.00 | .00 | 1.00 | 1.44
* NOTE: THE FIELD LABLED "NO CHILDREN" WAS CORRECTED IN MARCH 1989: MISSING DATA FOR INMATES STILL IN DIAGNOSTICS NOW HAS BEEN REMOVED FROM THIS FIELD AND IDENTIFIED AS "NOT REPORTED" INFORMATION.
Page 14 Run 10/21/04 9:46 am
Georgia Department of Corrections Office of Planning and Analysis
Inmate statistical profile
Sample: ACTIVE PRISONERS EXCLUDING JAIL
Requestor: Statistics
Active inmates 10/21/2004
Self-Rpt Religious Affiliation by current age & sex
|
MEN
|
WOMEN
|
| Age | Age | Age | Age | Men
| Age | Age | Age | Age |Women
|Grand
Religion
|00-21 %|22-39 %|40-54 %|55-99 %|Total % |00-21 %|22-39 %|40-54 %|55-99 %|Total % |Total %
------------------------------------------------------------------------------------------------------------------------------------
ISLAM
| 0 0| 20 10| 8 6| 2 7| 30 8 | 0 0| 0 0| 0 0| 0 0| 0 0 | 30 8
CATHOLIC
| 1 50| 6 3| 2 2| 0 0| 9 2 | 0 0| 0 0| 0 0| 0 0| 0 0 | 9 2
BAPTIST
| 1 50| 64 31| 71 54| 12 40| 148 40 | 0 0| 1 33| 2 100| 0 0| 3 60 | 151 40
METHODIST
| 0 0| 2 1| 1 1| 2 7| 5 1 | 0 0| 0 0| 0 0| 0 0| 0 0 | 5 1
EPISCOPLN
| 0 0| 0 0| 0 0| 0 0| 0 0 | 0 0| 0 0| 0 0| 0 0| 0 0 | 0 0
PRESBYTRN
| 0 0| 0 0| 0 0| 0 0| 0 0 | 0 0| 0 0| 0 0| 0 0| 0 0 | 0 0
CHC OF GOD
| 0 0| 1 0| 1 1| 0 0| 2 1 | 0 0| 0 0| 0 0| 0 0| 0 0 | 2 1
HOLINESS
| 0 0| 2 1| 3 2| 3 10| 8 2 | 0 0| 1 33| 0 0| 0 0| 1 20 | 9 2
JEWISH
| 0 0| 1 0| 0 0| 0 0| 1 0 | 0 0| 0 0| 0 0| 0 0| 0 0 | 1 0
ANGLICAN
| 0 0| 0 0| 0 0| 0 0| 0 0 | 0 0| 0 0| 0 0| 0 0| 0 0 | 0 0
GRK ORTHDX
| 0 0| 0 0| 0 0| 0 0| 0 0 | 0 0| 0 0| 0 0| 0 0| 0 0 | 0 0
HINDU
| 0 0| 0 0| 0 0| 0 0| 0 0 | 0 0| 0 0| 0 0| 0 0| 0 0 | 0 0
BUDDHIST
| 0 0| 0 0| 0 0| 0 0| 0 0 | 0 0| 0 0| 0 0| 0 0| 0 0 | 0 0
TAOIST
| 0 0| 0 0| 0 0| 0 0| 0 0 | 0 0| 0 0| 0 0| 0 0| 0 0 | 0 0
SHINTOIST
| 0 0| 0 0| 0 0| 0 0| 0 0 | 0 0| 0 0| 0 0| 0 0| 0 0 | 0 0
SEVEN D AD
| 0 0| 1 0| 2 2| 1 3| 4 1 | 0 0| 0 0| 0 0| 0 0| 0 0 | 4 1
JEHOVAH WT
| 0 0| 4 2| 1 1| 1 3| 6 2 | 0 0| 0 0| 0 0| 0 0| 0 0 | 6 2
LATR DAY S
| 0 0| 0 0| 0 0| 0 0| 0 0 | 0 0| 0 0| 0 0| 0 0| 0 0 | 0 0
QUAKER
| 0 0| 0 0| 0 0| 0 0| 0 0 | 0 0| 0 0| 0 0| 0 0| 0 0 | 0 0
OTHER PROD
| 0 0| 32 16| 11 8| 2 7| 45 12 | 0 0| 1 33| 0 0| 0 0| 1 20 | 46 12
NONE
| 0 0| 44 22| 22 17| 7 23| 73 20 | 0 0| 0 0| 0 0| 0 0| 0 0 | 73 20
OTHER
| 0 0| 27 13| 10 8| 0 0| 37 10 | 0 0| 0 0| 0 0| 0 0| 0 0 | 37 10
------------------------------------------------------------------------------------------------------------------------------------
Total reported
| 2 100| 204 100| 132 100| 30 100| 368 100 | 0 0| 3 100| 2 100| 0 0| 5 100 | 373 100
|
|
|
|
|
|
|
|
|
|
|
Percent reported | 100.0|
96.2|
98.5| 100.0|
97.4 |
.0| 100.0| 100.0|
.0| 100.0 |
97.4
|
|
|
|
|
|
|
|
|
|
|
|
|
|
|
|
|
|
|
|
|
|
NOT RPTD
| 0 | 8 | 2 | 0 | 10
|0|0|0|0|0
| 10
------------------------------------------------------------------------------------------------------------------------------------
Total
| 2 | 212 | 134 | 30 | 378
|0|3|2|0|5
| 383
Page 15 Run 10/21/04 9:46 am
Georgia Department of Corrections Office of Planning and Analysis
Inmate statistical profile
Sample: ACTIVE PRISONERS EXCLUDING JAIL
Requestor: Statistics
Active inmates 10/21/2004
Self-Rpt Family Behavior Patterns * by current age & sex
|
MEN
|
WOMEN
|
| Age | Age | Age | Age | Men
| Age | Age | Age | Age |Women
|Grand
Family Behavior
|00-21 %|22-39 %|40-54 %|55-99 %|Total % |00-21 %|22-39 %|40-54 %|55-99 %|Total % |Total %
------------------------------------------------------------------------------------------------------------------------------------
CRIMINLTY
| 0 0| 63 20| 45 23| 6 21| 114 21 | 0 0| 1 9| 1 100| 0 0| 2 17 | 116 21
ALCOHOLISM
| 1 33| 43 14| 29 15| 5 18| 78 15 | 0 0| 1 9| 0 0| 0 0| 1 8 | 79 14
DRUG ABUSE
| 0 0| 29 9| 15 8| 1 4| 45 8 | 0 0| 2 18| 0 0| 0 0| 2 17 | 47 9
DOMINERING
| 0 0| 1 0| 0 0| 0 0| 1 0 | 0 0| 1 9| 0 0| 0 0| 1 8 | 2 0
MIGRANT
| 0 0| 3 1| 3 2| 0 0| 6 1 | 0 0| 0 0| 0 0| 0 0| 0 0 | 6 1
INFL BTGS
| 0 0| 14 5| 8 4| 2 7| 24 4 | 0 0| 1 9| 0 0| 0 0| 1 8 | 25 5
PERMISSIVE
| 0 0| 1 0| 0 0| 0 0| 1 0 | 0 0| 2 18| 0 0| 0 0| 2 17 | 3 1
FATH ABSNT
| 2 67| 114 37| 71 37| 11 39| 198 37 | 0 0| 1 9| 0 0| 0 0| 1 8 | 199 36
MOTH ABSNT
| 0 0| 36 12| 19 10| 3 11| 58 11 | 0 0| 1 9| 0 0| 0 0| 1 8 | 59 11
NONE
| 0 0| 5 2| 4 2| 0 0| 9 2 | 0 0| 1 9| 0 0| 0 0| 1 8 | 10 2
------------------------------------------------------------------------------------------------------------------------------------
Total reported
| 3 100| 309 100| 194 100| 28 100| 534 100 | 0 0| 11 100| 1 100| 0 0| 12 100 | 546 100
|
|
|
|
|
|
|
|
|
|
|
Percent reported | 100.0|
74.5|
77.6|
63.3|
74.9 |
.0| 100.0|
50.0|
.0|
80.0 |
74.9
|
|
|
|
|
|
|
|
|
|
|
|
|
|
|
|
|
|
|
|
|
|
OTHER
| 0 | 54 | 30 | 11 | 95
|0|0|1|0|1
| 96
------------------------------------------------------------------------------------------------------------------------------------
Total
| 2 | 212 | 134 | 30 | 378
|0|3|2|0|5
| 383
* NOTE: SINCE THERE CAN BE UP TO FIVE BEHAVIOR CODES PER INMATE, THE NUMBER OF CASES REPORTED IN THE DETAIL LINES AND THE TOTAL REPORTED LINE MAY EXCEED THE TOTAL NUMBER OF CASES. IN SHORT, THIS TABLE COUNTS THE NUMBER OF BEHAVIOR PROBLEMS, NOT INMATES.
Page 16 Run 10/21/04 9:46 am
Georgia Department of Corrections Office of Planning and Analysis Inmate statistical profile
Sample: ACTIVE PRISONERS EXCLUDING JAIL
Requestor: Statistics
Active inmates 10/21/2004
Inmate Diagnostic Behavior Problem * by current age & sex
|
MEN
|
WOMEN
|
| Age | Age | Age | Age | Men
| Age | Age | Age | Age |Women
|Grand
Diagnostic Problem |00-21 %|22-39 %|40-54 %|55-99 %|Total % |00-21 %|22-39 %|40-54 %|55-99 %|Total % |Total %
------------------------------------------------------------------------------------------------------------------------------------
ALCOHOLIC
| 1 17| 11 2| 9 3| 4 6| 25 3 | 0 0| 1 14| 0 0| 0 0| 1 8 | 26 3
ALCOH ABSE
| 0 0| 50 10| 35 11| 4 6| 89 10 | 0 0| 1 14| 0 0| 0 0| 1 8 | 90 10
DRUG EXP
| 1 17| 67 13| 36 11| 9 14| 113 13 | 0 0| 0 0| 1 20| 0 0| 1 8 | 114 13
DRUG ABSE
| 1 17| 81 16| 51 16| 4 6| 137 15 | 0 0| 2 29| 0 0| 0 0| 2 17 | 139 15
NARC ADDCT
| 0 0| 6 1| 4 1| 0 0| 10 1 | 0 0| 0 0| 0 0| 0 0| 0 0 | 10 1
EPILEPTIC
| 0 0| 4 1| 2 1| 0 0| 6 1 | 0 0| 0 0| 0 0| 0 0| 0 0 | 6 1
MANIPULTVE
| 1 17| 49 10| 27 9| 5 8| 82 9 | 0 0| 0 0| 0 0| 0 0| 0 0 | 82 9
ASSAULTIVE
| 2 33| 174 34| 104 33| 24 38| 304 34 | 0 0| 3 43| 2 40| 0 0| 5 42 | 309 34
ESCPE TEND
| 0 0| 22 4| 17 5| 7 11| 46 5 | 0 0| 0 0| 0 0| 0 0| 0 0 | 46 5
SUICIDAL
| 0 0| 18 4| 6 2| 2 3| 26 3 | 0 0| 0 0| 1 20| 0 0| 1 8 | 27 3
WITHDRAWN
| 0 0| 1 0| 2 1| 0 0| 3 0 | 0 0| 0 0| 1 20| 0 0| 1 8 | 4 0
PR RLTY CT
| 0 0| 8 2| 4 1| 0 0| 12 1 | 0 0| 0 0| 0 0| 0 0| 0 0 | 12 1
HOMOSEXUAL
| 0 0| 1 0| 1 0| 0 0| 2 0 | 0 0| 0 0| 0 0| 0 0| 0 0 | 2 0
NONE
| 0 0| 3 1| 1 0| 1 2| 5 1 | 0 0| 0 0| 0 0| 0 0| 0 0 | 5 1
OTHER
| 0 0| 7 1| 10 3| 1 2| 18 2 | 0 0| 0 0| 0 0| 0 0| 0 0 | 18 2
NOT RPTD
| 0 0| 6 1| 4 1| 2 3| 12 1 | 0 0| 0 0| 0 0| 0 0| 0 0 | 12 1
------------------------------------------------------------------------------------------------------------------------------------
Total reported
| 6 100| 508 100| 314 100| 63 100| 891 100 | 0 0| 7 100| 5 100| 0 0| 12 100 | 903 100
|
|
|
|
|
|
|
|
|
|
|
Percent reported | 100.0| 100.0|
99.3| 100.0|
99.7 |
.0| 100.0| 100.0|
.0| 100.0 |
99.7
|
|
|
|
|
|
|
|
|
|
|
|
|
|
|
|
|
|
|
|
|
|
UNKNOWN
|0|0|1|0|1
|0|0|0|0|0
|1
------------------------------------------------------------------------------------------------------------------------------------
Total
| 2 | 212 | 134 | 30 | 378
|0|3|2|0|5
| 383
* NOTE: SINCE THERE CAN BE UP TO FIVE BEHAVIOR CODES PER INMATE, THE NUMBER OF CASES REPORTED IN THE DETAIL LINES AND THE TOTAL REPORTED LINE MAY EXCEED THE TOTAL NUMBER OF CASES. IN SHORT, THIS TABLE COUNTS THE NUMBER OF BEHAVIOR PROBLEMS, NOT INMATES.
Page 17 Run 10/21/04 9:46 am
Georgia Department of Corrections Office of Planning and Analysis Inmate statistical profile
Sample: ACTIVE PRISONERS EXCLUDING JAIL
Requestor: Statistics
Active inmates 10/21/2004
Physical Profile (General Condition) by current age & sex
|
MEN
|
WOMEN
|
| Age | Age | Age | Age | Men
| Age | Age | Age | Age |Women
|Grand
Physical Profile |00-21 %|22-39 %|40-54 %|55-99 %|Total % |00-21 %|22-39 %|40-54 %|55-99 %|Total % |Total %
------------------------------------------------------------------------------------------------------------------------------------
NO LIMITATION
| 2 100| 164 78| 60 45| 8 27| 234 63 | 0 0| 2 67| 1 50| 0 0| 3 60 | 237 63
DEFECT NO MAJOR LIMT| 0 0| 32 15| 50 38| 11 37| 93 25 | 0 0| 1 33| 1 50| 0 0| 2 40 | 95 25
DEFECT MAJOR LIMIT | 0 0| 12 6| 22 17| 9 30| 43 11 | 0 0| 0 0| 0 0| 0 0| 0 0 | 43 11
VERY MAJOR DEFECT | 0 0| 1 0| 1 1| 2 7| 4 1 | 0 0| 0 0| 0 0| 0 0| 0 0 | 4 1
------------------------------------------------------------------------------------------------------------------------------------
Total reported
| 2 100| 209 100| 133 100| 30 100| 374 100 | 0 0| 3 100| 2 100| 0 0| 5 100 | 379 100
|
|
|
|
|
|
|
|
|
|
|
Percent reported | 100.0|
98.6|
99.3| 100.0|
98.9 |
.0| 100.0| 100.0|
.0| 100.0 |
99.0
|
|
|
|
|
|
|
|
|
|
|
|
|
|
|
|
|
|
|
|
|
|
NOT REPORTED
|0|3|1|0|4
|0|0|0|0|0
|4
------------------------------------------------------------------------------------------------------------------------------------
Total
| 2 | 212 | 134 | 30 | 378
|0|3|2|0|5
| 383
Page 18 Run 10/21/04 9:46 am
Georgia Department of Corrections Office of Planning and Analysis
Inmate statistical profile
Sample: ACTIVE PRISONERS EXCLUDING JAIL Active inmates 10/21/2004
Requestor: Statistics Security Status by current age & sex
|
MEN
|
WOMEN
|
| Age | Age | Age | Age | Men
| Age | Age | Age | Age |Women
|Grand
Security
|00-21 %|22-39 %|40-54 %|55-99 %|Total % |00-21 %|22-39 %|40-54 %|55-99 %|Total % |Total %
------------------------------------------------------------------------------------------------------------------------------------
DIAG INCOM
| 0 0| 0 0| 0 0| 0 0| 0 0 | 0 0| 0 0| 0 0| 0 0| 0 0 | 0 0
WRK RELEAS
| 0 0| 0 0| 0 0| 0 0| 0 0 | 0 0| 0 0| 0 0| 0 0| 0 0 | 0 0
TRUSTY
| 0 0| 0 0| 1 1| 0 0| 1 0 | 0 0| 0 0| 0 0| 0 0| 0 0 | 1 0
MINIMUM
| 0 0| 0 0| 2 1| 0 0| 2 1 | 0 0| 1 33| 0 0| 0 0| 1 20 | 3 1
MEDIUM
| 0 0| 66 31| 57 43| 21 70| 144 38 | 0 0| 0 0| 0 0| 0 0| 0 0 | 144 38
CLOSE
| 2 100| 125 59| 68 51| 8 27| 203 54 | 0 0| 2 67| 2 100| 0 0| 4 80 | 207 54
MAXIMUM
| 0 0| 13 6| 6 4| 1 3| 20 5 | 0 0| 0 0| 0 0| 0 0| 0 0 | 20 5
DIAGNOSTIC
| 0 0| 8 4| 0 0| 0 0| 8 2 | 0 0| 0 0| 0 0| 0 0| 0 0 | 8 2
------------------------------------------------------------------------------------------------------------------------------------
Total reported
| 2 100| 212 100| 134 100| 30 100| 378 100 | 0 0| 3 100| 2 100| 0 0| 5 100 | 383 100
|
|
|
|
|
|
|
|
|
|
|
Percent reported | 100.0| 100.0| 100.0| 100.0| 100.0 |
.0| 100.0| 100.0|
.0| 100.0 | 100.0
|
|
|
|
|
|
|
|
|
|
|
|
|
|
|
|
|
|
|
|
|
|
NOT RPTD
|0|0|0|0|0
|0|0|0|0|0
|0
------------------------------------------------------------------------------------------------------------------------------------
Total
| 2 | 212 | 134 | 30 | 378
|0|3|2|0|5
| 383
* NOTE: BEGINNING IN JULY 1987, THE FACILITIES DIVISION NO LONGER CODED INMATES AS BEING WORK RELEASE
Page 19 Run 10/21/04 9:46 am
Georgia Department of Corrections Office of Planning and Analysis
Inmate statistical profile
Sample: ACTIVE PRISONERS EXCLUDING JAIL Active inmates 10/21/2004
Requestor: Statistics Number Of Sentences by current age & sex
|
MEN
|
WOMEN
|
| Age | Age | Age | Age | Men
| Age | Age | Age | Age |Women
|Grand
Number Of Sentences |00-21 %|22-39 %|40-54 %|55-99 %|Total % |00-21 %|22-39 %|40-54 %|55-99 %|Total % |Total %
------------------------------------------------------------------------------------------------------------------------------------
ONE
| 0 0| 19 9| 24 18| 5 17| 48 13 | 0 0| 0 0| 1 50| 0 0| 1 20 | 49 13
TWO
| 0 0| 36 17| 26 19| 7 23| 69 18 | 0 0| 1 33| 0 0| 0 0| 1 20 | 70 18
THREE
| 1 50| 39 18| 24 18| 6 20| 70 19 | 0 0| 0 0| 1 50| 0 0| 1 20 | 71 19
FOUR
| 0 0| 31 15| 19 14| 1 3| 51 13 | 0 0| 0 0| 0 0| 0 0| 0 0 | 51 13
FIVE
| 0 0| 21 10| 11 8| 4 13| 36 10 | 0 0| 2 67| 0 0| 0 0| 2 40 | 38 10
MORE THAN FIVE
| 1 50| 66 31| 30 22| 7 23| 104 28 | 0 0| 0 0| 0 0| 0 0| 0 0 | 104 27
------------------------------------------------------------------------------------------------------------------------------------
Total reported
| 2 100| 212 100| 134 100| 30 100| 378 100 | 0 0| 3 100| 2 100| 0 0| 5 100 | 383 100
|
|
|
|
|
|
|
|
|
|
|
Percent reported | 100.0| 100.0| 100.0| 100.0| 100.0 |
.0| 100.0| 100.0|
.0| 100.0 | 100.0
|
|
|
|
|
|
|
|
|
|
|
|
|
|
|
|
|
|
|
|
|
|
NOT REPORTED
|0|0|0|0|0
|0|0|0|0|0
|0
------------------------------------------------------------------------------------------------------------------------------------
Total
| 2 | 212 | 134 | 30 | 378
|0|3|2|0|5
| 383
|
|
|
|
|
|
|
|
|
|
|
|
|
|
|
|
|
|
|
|
|
|
|
|
|
|
|
|
|
|
|
|
|
|
|
|
|
|
|
|
|
|
|
|
|
|
|
|
|
|
|
|
|
|
|
AVG NUM SENTENCES | 5.50 | 4.91 | 4.22 | 4.33 | 4.62 | .00 | 4.00 | 2.00 | .00 | 3.20 | 4.60
Page 20 Run 10/21/04 9:46 am
Georgia Department of Corrections Office of Planning and Analysis Inmate statistical profile
Sample: ACTIVE PRISONERS EXCLUDING JAIL Active inmates 10/21/2004
Requestor: Statistics Number Of Disciplinaries by current age & sex
|
MEN
|
WOMEN
|
| Age | Age | Age | Age | Men
| Age | Age | Age | Age |Women
|Grand
Disciplinaries
|00-21 %|22-39 %|40-54 %|55-99 %|Total % |00-21 %|22-39 %|40-54 %|55-99 %|Total % |Total %
------------------------------------------------------------------------------------------------------------------------------------
ZERO
| 0 0| 42 20| 36 27| 8 27| 86 23 | 0 0| 1 33| 2 100| 0 0| 3 60 | 89 23
ONE
| 1 50| 24 11| 19 14| 6 20| 50 13 | 0 0| 0 0| 0 0| 0 0| 0 0 | 50 13
TWO
| 0 0| 19 9| 11 8| 5 17| 35 9 | 0 0| 0 0| 0 0| 0 0| 0 0 | 35 9
THREE
| 0 0| 12 6| 12 9| 4 13| 28 7 | 0 0| 0 0| 0 0| 0 0| 0 0 | 28 7
FOUR
| 0 0| 16 8| 11 8| 3 10| 30 8 | 0 0| 0 0| 0 0| 0 0| 0 0 | 30 8
FIVE
| 0 0| 7 3| 8 6| 1 3| 16 4 | 0 0| 1 33| 0 0| 0 0| 1 20 | 17 4
MORE THAN FIVE
| 1 50| 92 43| 37 28| 3 10| 133 35 | 0 0| 1 33| 0 0| 0 0| 1 20 | 134 35
------------------------------------------------------------------------------------------------------------------------------------
Total reported
| 2 100| 212 100| 134 100| 30 100| 378 100 | 0 0| 3 100| 2 100| 0 0| 5 100 | 383 100
|
|
|
|
|
|
|
|
|
|
|
Percent reported | 100.0| 100.0| 100.0| 100.0| 100.0 |
.0| 100.0| 100.0|
.0| 100.0 | 100.0
|
|
|
|
|
|
|
|
|
|
|
|
|
|
|
|
|
|
|
|
|
|
NOT REPORTED
|0|0|0|0|0
|0|0|0|0|0
|0
------------------------------------------------------------------------------------------------------------------------------------
Total
| 2 | 212 | 134 | 30 | 378
|0|3|2|0|5
| 383
|
|
|
|
|
|
|
|
|
|
|
|
|
|
|
|
|
|
|
|
|
|
|
|
|
|
|
|
|
|
|
|
|
|
|
|
|
|
|
|
|
|
|
|
|
|
|
|
|
|
|
|
|
|
|
AVG NUM DISCIP
| 7.00 | 8.67 | 5.19 | 2.50 | 6.94 | .00 | 11.00 | .00 | .00 | 6.60 | 6.93
Page 21 Run 10/21/04 9:46 am
Georgia Department of Corrections Office of Planning and Analysis Inmate statistical profile
Sample: ACTIVE PRISONERS EXCLUDING JAIL Active inmates 10/21/2004
Requestor: Statistics Number Of Escapes by current age & sex
|
MEN
|
WOMEN
|
| Age | Age | Age | Age | Men
| Age | Age | Age | Age |Women
|Grand
Escapes
|00-21 %|22-39 %|40-54 %|55-99 %|Total % |00-21 %|22-39 %|40-54 %|55-99 %|Total % |Total %
------------------------------------------------------------------------------------------------------------------------------------
ZERO
| 2 100| 211 100| 134 100| 30 100| 377 100 | 0 0| 3 100| 2 100| 0 0| 5 100 | 382 100
ONE
| 0 0| 1 0| 0 0| 0 0| 1 0 | 0 0| 0 0| 0 0| 0 0| 0 0 | 1 0
TWO
| 0 0| 0 0| 0 0| 0 0| 0 0 | 0 0| 0 0| 0 0| 0 0| 0 0 | 0 0
THREE
| 0 0| 0 0| 0 0| 0 0| 0 0 | 0 0| 0 0| 0 0| 0 0| 0 0 | 0 0
FOUR
| 0 0| 0 0| 0 0| 0 0| 0 0 | 0 0| 0 0| 0 0| 0 0| 0 0 | 0 0
FIVE
| 0 0| 0 0| 0 0| 0 0| 0 0 | 0 0| 0 0| 0 0| 0 0| 0 0 | 0 0
MORE THAN FIVE
| 0 0| 0 0| 0 0| 0 0| 0 0 | 0 0| 0 0| 0 0| 0 0| 0 0 | 0 0
------------------------------------------------------------------------------------------------------------------------------------
Total reported
| 2 100| 212 100| 134 100| 30 100| 378 100 | 0 0| 3 100| 2 100| 0 0| 5 100 | 383 100
|
|
|
|
|
|
|
|
|
|
|
Percent reported | 100.0| 100.0| 100.0| 100.0| 100.0 |
.0| 100.0| 100.0|
.0| 100.0 | 100.0
|
|
|
|
|
|
|
|
|
|
|
|
|
|
|
|
|
|
|
|
|
|
NOT REPORTED
|0|0|0|0|0
|0|0|0|0|0
|0
------------------------------------------------------------------------------------------------------------------------------------
Total
| 2 | 212 | 134 | 30 | 378
|0|3|2|0|5
| 383
|
|
|
|
|
|
|
|
|
|
|
|
|
|
|
|
|
|
|
|
|
|
|
|
|
|
|
|
|
|
|
|
|
|
|
|
|
|
|
|
|
|
|
|
|
|
|
|
|
|
|
|
|
|
|
AVG NUM ESCAPES
| .00 | .00 | .00 | .00 | .00 | .00 | .00 | .00 | .00 | .00 | .00
Page 22 Run 10/21/04 9:46 am
Georgia Department of Corrections Office of Planning and Analysis
Inmate statistical profile
Sample: ACTIVE PRISONERS EXCLUDING JAIL
Requestor: Statistics
Active inmates 10/21/2004
Number Of Prior Georgia Incarcerations * by current age & sex
|
MEN
|
WOMEN
|
| Age | Age | Age | Age | Men
| Age | Age | Age | Age |Women
|Grand
Prior Incarcerations|00-21 %|22-39 %|40-54 %|55-99 %|Total % |00-21 %|22-39 %|40-54 %|55-99 %|Total % |Total %
------------------------------------------------------------------------------------------------------------------------------------
ZERO
| 2 100| 120 57| 43 32| 14 47| 179 47 | 0 0| 3 100| 2 100| 0 0| 5 100 | 184 48
ONE
| 0 0| 43 20| 28 21| 7 23| 78 21 | 0 0| 0 0| 0 0| 0 0| 0 0 | 78 20
TWO
| 0 0| 20 9| 19 14| 2 7| 41 11 | 0 0| 0 0| 0 0| 0 0| 0 0 | 41 11
THREE
| 0 0| 19 9| 18 13| 3 10| 40 11 | 0 0| 0 0| 0 0| 0 0| 0 0 | 40 10
FOUR
| 0 0| 7 3| 15 11| 2 7| 24 6 | 0 0| 0 0| 0 0| 0 0| 0 0 | 24 6
FIVE
| 0 0| 2 1| 6 4| 1 3| 9 2 | 0 0| 0 0| 0 0| 0 0| 0 0 | 9 2
MORE THAN FIVE
| 0 0| 1 0| 5 4| 1 3| 7 2 | 0 0| 0 0| 0 0| 0 0| 0 0 | 7 2
------------------------------------------------------------------------------------------------------------------------------------
Total reported
| 2 100| 212 100| 134 100| 30 100| 378 100 | 0 0| 3 100| 2 100| 0 0| 5 100 | 383 100
|
|
|
|
|
|
|
|
|
|
|
Percent reported | 100.0| 100.0| 100.0| 100.0| 100.0 |
.0| 100.0| 100.0|
.0| 100.0 | 100.0
|
|
|
|
|
|
|
|
|
|
|
|
|
|
|
|
|
|
|
|
|
|
NOT REPORTED
|0|0|0|0|0
|0|0|0|0|0
|0
------------------------------------------------------------------------------------------------------------------------------------
Total
| 2 | 212 | 134 | 30 | 378
|0|3|2|0|5
| 383
|
|
|
|
|
|
|
|
|
|
|
|
|
|
|
|
|
|
|
|
|
|
|
|
|
|
|
|
|
|
|
|
|
|
|
|
|
|
|
|
|
|
|
|
|
|
|
|
|
|
|
|
|
|
|
AVG # INCARCERATIONS| .00 | .87 | 1.84 | 1.30 | 1.24 | .00 | .00 | .00 | .00 | .00 | 1.23
* This data counts a parole revocation on an existing sentenCE AS A prior incarceration. Also, this data counts, for any cohort of inmates, the total number of Georgia incarcerations the inmate has had during his entire criminal career. For example, if an inmate was admitted to prison first in FY72, and then re-admitted in FY79 and FY85, he had two prior incarcerations before the FY85 admission. This inmate's records show two prior incarcerations in all three of his records since he has had two prior incarcerations in his criminal career. If the cohort of FY72 admissions is selected for analysis, two
prior incarcerations will be listed for this inmate even though in FY72, he had no prior incarcerations.
Page 23 Run 10/21/04 9:46 am
Georgia Department of Corrections Office of Planning and Analysis
Inmate statistical profile
Sample: ACTIVE PRISONERS EXCLUDING JAIL Active inmates 10/21/2004
Requestor: Statistics Number Of Transfers by current age & sex
|
MEN
|
WOMEN
|
| Age | Age | Age | Age | Men
| Age | Age | Age | Age |Women
|Grand
Transfers
|00-21 %|22-39 %|40-54 %|55-99 %|Total % |00-21 %|22-39 %|40-54 %|55-99 %|Total % |Total %
------------------------------------------------------------------------------------------------------------------------------------
ZERO
| 0 0| 11 5| 3 2| 0 0| 14 4 | 0 0| 1 33| 0 0| 0 0| 1 20 | 15 4
ONE
| 1 50| 80 38| 51 38| 12 40| 144 38 | 0 0| 2 67| 2 100| 0 0| 4 80 | 148 39
TWO
| 1 50| 54 25| 36 27| 6 20| 97 26 | 0 0| 0 0| 0 0| 0 0| 0 0 | 97 25
THREE
| 0 0| 31 15| 22 16| 7 23| 60 16 | 0 0| 0 0| 0 0| 0 0| 0 0 | 60 16
FOUR
| 0 0| 11 5| 10 7| 3 10| 24 6 | 0 0| 0 0| 0 0| 0 0| 0 0 | 24 6
FIVE
| 0 0| 10 5| 5 4| 1 3| 16 4 | 0 0| 0 0| 0 0| 0 0| 0 0 | 16 4
MORE THAN FIVE
| 0 0| 15 7| 7 5| 1 3| 23 6 | 0 0| 0 0| 0 0| 0 0| 0 0 | 23 6
------------------------------------------------------------------------------------------------------------------------------------
Total reported
| 2 100| 212 100| 134 100| 30 100| 378 100 | 0 0| 3 100| 2 100| 0 0| 5 100 | 383 100
|
|
|
|
|
|
|
|
|
|
|
Percent reported | 100.0| 100.0| 100.0| 100.0| 100.0 |
.0| 100.0| 100.0|
.0| 100.0 | 100.0
|
|
|
|
|
|
|
|
|
|
|
|
|
|
|
|
|
|
|
|
|
|
NOT REPORTED
|0|0|0|0|0
|0|0|0|0|0
|0
------------------------------------------------------------------------------------------------------------------------------------
Total
| 2 | 212 | 134 | 30 | 378
|0|3|2|0|5
| 383
|
|
|
|
|
|
|
|
|
|
|
|
|
|
|
|
|
|
|
|
|
|
|
|
|
|
|
|
|
|
|
|
|
|
|
|
|
|
|
|
|
|
|
|
|
|
|
|
|
|
|
|
|
|
|
AVG NUM TRANSFERS | 1.50 | 2.28 | 2.24 | 2.37 | 2.27 | .00 | .67 | 1.00 | .00 | .80 | 2.25
Page 24 Run 10/21/04 9:46 am
Georgia Department of Corrections Office of Planning and Analysis
Inmate statistical profile
Sample: ACTIVE PRISONERS EXCLUDING JAIL Active inmates 10/21/2004
Requestor: Statistics County Of Conviction by current age & sex
|
MEN
|
WOMEN
|
| Age | Age | Age | Age | Men
| Age | Age | Age | Age |Women
|Grand
County Of Conviction|00-21 %|22-39 %|40-54 %|55-99 %|Total % |00-21 %|22-39 %|40-54 %|55-99 %|Total % |Total %
------------------------------------------------------------------------------------------------------------------------------------
Appling
| 0 0| 1 0| 0 0| 1 3| 2 1 | 0 0| 0 0| 0 0| 0 0| 0 0 | 2 1
Atkinson
| 0 0| 0 0| 0 0| 1 3| 1 0 | 0 0| 0 0| 0 0| 0 0| 0 0 | 1 0
Bacon
| 0 0| 0 0| 1 1| 0 0| 1 0 | 0 0| 0 0| 0 0| 0 0| 0 0 | 1 0
Baldwin
| 0 0| 2 1| 3 2| 0 0| 5 1 | 0 0| 0 0| 0 0| 0 0| 0 0 | 5 1
Banks
| 0 0| 0 0| 0 0| 1 3| 1 0 | 0 0| 0 0| 0 0| 0 0| 0 0 | 1 0
Barrow
| 0 0| 2 1| 0 0| 1 3| 3 1 | 0 0| 0 0| 0 0| 0 0| 0 0 | 3 1
Bartow
| 0 0| 0 0| 2 1| 0 0| 2 1 | 0 0| 0 0| 0 0| 0 0| 0 0 | 2 1
Ben Hill
| 0 0| 2 1| 0 0| 0 0| 2 1 | 0 0| 0 0| 0 0| 0 0| 0 0 | 2 1
Berrien
| 0 0| 1 0| 0 0| 0 0| 1 0 | 0 0| 0 0| 0 0| 0 0| 0 0 | 1 0
Bibb
| 0 0| 9 4| 2 1| 3 10| 14 4 | 0 0| 0 0| 0 0| 0 0| 0 0 | 14 4
Bleckley
| 0 0| 1 0| 0 0| 0 0| 1 0 | 0 0| 0 0| 0 0| 0 0| 0 0 | 1 0
Brantley
| 0 0| 1 0| 1 1| 0 0| 2 1 | 0 0| 0 0| 0 0| 0 0| 0 0 | 2 1
Brooks
| 0 0| 0 0| 1 1| 0 0| 1 0 | 0 0| 0 0| 0 0| 0 0| 0 0 | 1 0
Bulloch
| 0 0| 0 0| 1 1| 0 0| 1 0 | 0 0| 0 0| 0 0| 0 0| 0 0 | 1 0
Burke
| 0 0| 3 1| 2 1| 0 0| 5 1 | 0 0| 0 0| 0 0| 0 0| 0 0 | 5 1
Butts
| 0 0| 1 0| 1 1| 1 3| 3 1 | 0 0| 0 0| 0 0| 0 0| 0 0 | 3 1
Camden
| 0 0| 0 0| 1 1| 0 0| 1 0 | 0 0| 0 0| 0 0| 0 0| 0 0 | 1 0
Carroll
| 0 0| 2 1| 0 0| 0 0| 2 1 | 0 0| 0 0| 0 0| 0 0| 0 0 | 2 1
Catoosa
| 0 0| 0 0| 1 1| 1 3| 2 1 | 0 0| 0 0| 0 0| 0 0| 0 0 | 2 1
Charlton
| 0 0| 0 0| 1 1| 0 0| 1 0 | 0 0| 0 0| 0 0| 0 0| 0 0 | 1 0
Chatham
| 0 0| 11 5| 4 3| 1 3| 16 4 | 0 0| 0 0| 0 0| 0 0| 0 0 | 16 4
Chattooga
| 0 0| 1 0| 0 0| 0 0| 1 0 | 0 0| 0 0| 0 0| 0 0| 0 0 | 1 0
Cherokee
| 0 0| 1 0| 1 1| 0 0| 2 1 | 0 0| 0 0| 0 0| 0 0| 0 0 | 2 1
Clarke
| 0 0| 5 2| 6 4| 0 0| 11 3 | 0 0| 0 0| 0 0| 0 0| 0 0 | 11 3
Clayton
| 0 0| 9 4| 2 1| 1 3| 12 3 | 0 0| 0 0| 0 0| 0 0| 0 0 | 12 3
Cobb
| 0 0| 8 4| 4 3| 1 3| 13 3 | 0 0| 0 0| 0 0| 0 0| 0 0 | 13 3
Coffee
| 0 0| 1 0| 1 1| 0 0| 2 1 | 0 0| 0 0| 0 0| 0 0| 0 0 | 2 1
Colquit
| 0 0| 1 0| 2 1| 0 0| 3 1 | 0 0| 0 0| 0 0| 0 0| 0 0 | 3 1
Columbia
| 0 0| 2 1| 2 1| 0 0| 4 1 | 0 0| 0 0| 0 0| 0 0| 0 0 | 4 1
Cook
| 0 0| 3 1| 0 0| 0 0| 3 1 | 0 0| 0 0| 0 0| 0 0| 0 0 | 3 1
Coweta
| 0 0| 2 1| 0 0| 0 0| 2 1 | 0 0| 0 0| 0 0| 0 0| 0 0 | 2 1
Crisp
| 0 0| 0 0| 1 1| 0 0| 1 0 | 0 0| 0 0| 0 0| 0 0| 0 0 | 1 0
Dade
| 0 0| 1 0| 0 0| 0 0| 1 0 | 0 0| 0 0| 0 0| 0 0| 0 0 | 1 0
Decatur
| 0 0| 0 0| 1 1| 0 0| 1 0 | 0 0| 0 0| 0 0| 0 0| 0 0 | 1 0
DeKalb
| 0 0| 15 7| 10 7| 2 7| 27 7 | 0 0| 1 33| 0 0| 0 0| 1 20 | 28 7
Dodge
| 0 0| 1 0| 0 0| 0 0| 1 0 | 0 0| 0 0| 0 0| 0 0| 0 0 | 1 0
------------------------------------------------------------------------------------------------------------------------------------
(continued)
Page 25 Run 10/21/04 9:46 am
Georgia Department of Corrections Office of Planning and Analysis
Inmate statistical profile
Sample: ACTIVE PRISONERS EXCLUDING JAIL
Requestor:
Active inmates 10/21/2004
County Of Conviction by current age & sex
Statistics (continued)
|
MEN
|
WOMEN
|
| Age | Age | Age | Age | Men
| Age | Age | Age | Age |Women
|Grand
County Of Conviction|00-21 %|22-39 %|40-54 %|55-99 %|Total % |00-21 %|22-39 %|40-54 %|55-99 %|Total % |Total %
------------------------------------------------------------------------------------------------------------------------------------
Dougherty
| 0 0| 7 3| 3 2| 1 3| 11 3 | 0 0| 0 0| 0 0| 0 0| 0 0 | 11 3
Douglas
| 0 0| 6 3| 5 4| 0 0| 11 3 | 0 0| 0 0| 1 50| 0 0| 1 20 | 12 3
Effingham
| 0 0| 1 0| 0 0| 0 0| 1 0 | 0 0| 0 0| 0 0| 0 0| 0 0 | 1 0
Elbert
| 0 0| 1 0| 0 0| 1 3| 2 1 | 0 0| 0 0| 0 0| 0 0| 0 0 | 2 1
Emanuel
| 0 0| 1 0| 0 0| 0 0| 1 0 | 0 0| 0 0| 0 0| 0 0| 0 0 | 1 0
Fayette
| 0 0| 0 0| 1 1| 1 3| 2 1 | 0 0| 0 0| 0 0| 0 0| 0 0 | 2 1
Floyd
| 0 0| 3 1| 1 1| 0 0| 4 1 | 0 0| 0 0| 0 0| 0 0| 0 0 | 4 1
Forsyth
| 0 0| 0 0| 1 1| 0 0| 1 0 | 0 0| 0 0| 0 0| 0 0| 0 0 | 1 0
Franklin
| 0 0| 1 0| 0 0| 0 0| 1 0 | 0 0| 0 0| 0 0| 0 0| 0 0 | 1 0
Fulton
| 0 0| 16 8| 16 12| 2 7| 34 9 | 0 0| 0 0| 0 0| 0 0| 0 0 | 34 9
Gilmer
| 0 0| 1 0| 0 0| 0 0| 1 0 | 0 0| 0 0| 0 0| 0 0| 0 0 | 1 0
Glynn
| 0 0| 5 2| 4 3| 1 3| 10 3 | 0 0| 0 0| 0 0| 0 0| 0 0 | 10 3
Gordon
| 0 0| 0 0| 0 0| 1 3| 1 0 | 0 0| 0 0| 0 0| 0 0| 0 0 | 1 0
Greene
| 0 0| 1 0| 0 0| 0 0| 1 0 | 0 0| 0 0| 0 0| 0 0| 0 0 | 1 0
Gwinnett
| 0 0| 4 2| 1 1| 0 0| 5 1 | 0 0| 0 0| 0 0| 0 0| 0 0 | 5 1
Habersham
| 0 0| 0 0| 1 1| 0 0| 1 0 | 0 0| 0 0| 0 0| 0 0| 0 0 | 1 0
Hall
| 0 0| 5 2| 2 1| 0 0| 7 2 | 0 0| 0 0| 0 0| 0 0| 0 0 | 7 2
Harris
| 0 0| 2 1| 0 0| 0 0| 2 1 | 0 0| 0 0| 0 0| 0 0| 0 0 | 2 1
Hart
| 0 0| 2 1| 2 1| 0 0| 4 1 | 0 0| 0 0| 0 0| 0 0| 0 0 | 4 1
Henry
| 0 0| 6 3| 2 1| 0 0| 8 2 | 0 0| 0 0| 0 0| 0 0| 0 0 | 8 2
Houston
| 0 0| 2 1| 4 3| 0 0| 6 2 | 0 0| 0 0| 0 0| 0 0| 0 0 | 6 2
Jackson
| 1 50| 3 1| 1 1| 1 3| 6 2 | 0 0| 0 0| 0 0| 0 0| 0 0 | 6 2
Jasper
| 0 0| 1 0| 0 0| 0 0| 1 0 | 0 0| 0 0| 0 0| 0 0| 0 0 | 1 0
Jeff Davis
| 0 0| 1 0| 0 0| 0 0| 1 0 | 0 0| 0 0| 0 0| 0 0| 0 0 | 1 0
Jones
| 0 0| 1 0| 0 0| 0 0| 1 0 | 0 0| 0 0| 0 0| 0 0| 0 0 | 1 0
Laurens
| 0 0| 1 0| 1 1| 0 0| 2 1 | 0 0| 0 0| 0 0| 0 0| 0 0 | 2 1
Lee
| 0 0| 1 0| 0 0| 0 0| 1 0 | 0 0| 0 0| 0 0| 0 0| 0 0 | 1 0
Liberty
| 0 0| 2 1| 0 0| 0 0| 2 1 | 0 0| 0 0| 0 0| 0 0| 0 0 | 2 1
Long
| 0 0| 3 1| 0 0| 0 0| 3 1 | 0 0| 0 0| 0 0| 0 0| 0 0 | 3 1
Lowndes
| 0 0| 2 1| 1 1| 0 0| 3 1 | 0 0| 0 0| 0 0| 0 0| 0 0 | 3 1
Madison
| 0 0| 1 0| 0 0| 0 0| 1 0 | 0 0| 0 0| 0 0| 0 0| 0 0 | 1 0
Marion
| 0 0| 1 0| 0 0| 0 0| 1 0 | 0 0| 0 0| 0 0| 0 0| 0 0 | 1 0
McIntosh
| 0 0| 0 0| 1 1| 0 0| 1 0 | 0 0| 0 0| 0 0| 0 0| 0 0 | 1 0
Miller
| 0 0| 1 0| 0 0| 0 0| 1 0 | 0 0| 0 0| 0 0| 0 0| 0 0 | 1 0
Monroe
| 0 0| 0 0| 2 1| 0 0| 2 1 | 0 0| 0 0| 0 0| 0 0| 0 0 | 2 1
------------------------------------------------------------------------------------------------------------------------------------
(continued)
Georgia Department of Corrections
Page 26 Run 10/21/04 9:46 am
Office of Planning and Analysis
Inmate statistical profile
Sample: ACTIVE PRISONERS EXCLUDING JAIL
Requestor:
Active inmates 10/21/2004
County Of Conviction by current age & sex
Statistics (continued)
|
MEN
|
WOMEN
|
| Age | Age | Age | Age | Men
| Age | Age | Age | Age |Women
|Grand
County Of Conviction|00-21 %|22-39 %|40-54 %|55-99 %|Total % |00-21 %|22-39 %|40-54 %|55-99 %|Total % |Total %
------------------------------------------------------------------------------------------------------------------------------------
Murray
| 0 0| 1 0| 0 0| 0 0| 1 0 | 0 0| 0 0| 0 0| 0 0| 0 0 | 1 0
Muscogee
| 0 0| 6 3| 7 5| 1 3| 14 4 | 0 0| 0 0| 0 0| 0 0| 0 0 | 14 4
Newton
| 0 0| 2 1| 1 1| 0 0| 3 1 | 0 0| 0 0| 0 0| 0 0| 0 0 | 3 1
Oglethorpe
| 0 0| 0 0| 1 1| 0 0| 1 0 | 0 0| 0 0| 0 0| 0 0| 0 0 | 1 0
Paulding
| 0 0| 0 0| 1 1| 0 0| 1 0 | 0 0| 0 0| 0 0| 0 0| 0 0 | 1 0
Pierce
| 0 0| 0 0| 1 1| 0 0| 1 0 | 0 0| 0 0| 0 0| 0 0| 0 0 | 1 0
Pike
| 0 0| 1 0| 1 1| 1 3| 3 1 | 0 0| 0 0| 1 50| 0 0| 1 20 | 4 1
Polk
| 0 0| 1 0| 0 0| 0 0| 1 0 | 0 0| 0 0| 0 0| 0 0| 0 0 | 1 0
Pulaski
| 0 0| 1 0| 0 0| 0 0| 1 0 | 0 0| 0 0| 0 0| 0 0| 0 0 | 1 0
Putnam
| 0 0| 3 1| 1 1| 0 0| 4 1 | 0 0| 0 0| 0 0| 0 0| 0 0 | 4 1
Rabun
| 0 0| 1 0| 0 0| 0 0| 1 0 | 0 0| 0 0| 0 0| 0 0| 0 0 | 1 0
Randolph
| 0 0| 1 0| 0 0| 0 0| 1 0 | 0 0| 0 0| 0 0| 0 0| 0 0 | 1 0
Richmond
| 1 50| 7 3| 4 3| 2 7| 14 4 | 0 0| 1 33| 0 0| 0 0| 1 20 | 15 4
Rockdale
| 0 0| 3 1| 1 1| 0 0| 4 1 | 0 0| 0 0| 0 0| 0 0| 0 0 | 4 1
Spalding
| 0 0| 3 1| 2 1| 0 0| 5 1 | 0 0| 0 0| 0 0| 0 0| 0 0 | 5 1
Sumter
| 0 0| 0 0| 1 1| 0 0| 1 0 | 0 0| 0 0| 0 0| 0 0| 0 0 | 1 0
Terrell
| 0 0| 0 0| 0 0| 1 3| 1 0 | 0 0| 0 0| 0 0| 0 0| 0 0 | 1 0
Thomas
| 0 0| 1 0| 1 1| 0 0| 2 1 | 0 0| 0 0| 0 0| 0 0| 0 0 | 2 1
Tift
| 0 0| 0 0| 1 1| 1 3| 2 1 | 0 0| 0 0| 0 0| 0 0| 0 0 | 2 1
Toombs
| 0 0| 2 1| 1 1| 0 0| 3 1 | 0 0| 0 0| 0 0| 0 0| 0 0 | 3 1
Towns
| 0 0| 1 0| 0 0| 0 0| 1 0 | 0 0| 0 0| 0 0| 0 0| 0 0 | 1 0
Troup
| 0 0| 0 0| 1 1| 0 0| 1 0 | 0 0| 0 0| 0 0| 0 0| 0 0 | 1 0
Union
| 0 0| 0 0| 1 1| 0 0| 1 0 | 0 0| 0 0| 0 0| 0 0| 0 0 | 1 0
Upson
| 0 0| 0 0| 1 1| 0 0| 1 0 | 0 0| 0 0| 0 0| 0 0| 0 0 | 1 0
Walker
| 0 0| 2 1| 0 0| 0 0| 2 1 | 0 0| 1 33| 0 0| 0 0| 1 20 | 3 1
Walton
| 0 0| 0 0| 2 1| 0 0| 2 1 | 0 0| 0 0| 0 0| 0 0| 0 0 | 2 1
Ware
| 0 0| 4 2| 3 2| 0 0| 7 2 | 0 0| 0 0| 0 0| 0 0| 0 0 | 7 2
Washington
| 0 0| 2 1| 0 0| 0 0| 2 1 | 0 0| 0 0| 0 0| 0 0| 0 0 | 2 1
Wayne
| 0 0| 1 0| 0 0| 0 0| 1 0 | 0 0| 0 0| 0 0| 0 0| 0 0 | 1 0
Whitfield
| 0 0| 0 0| 2 1| 2 7| 4 1 | 0 0| 0 0| 0 0| 0 0| 0 0 | 4 1
Wilkes
| 0 0| 1 0| 0 0| 0 0| 1 0 | 0 0| 0 0| 0 0| 0 0| 0 0 | 1 0
------------------------------------------------------------------------------------------------------------------------------------
Total reported
| 2 100| 212 100| 134 100| 30 100| 378 100 | 0 0| 3 100| 2 100| 0 0| 5 100 | 383 100
|
|
|
|
|
|
|
|
|
|
|
Percent reported | 100.0| 100.0| 100.0| 100.0| 100.0 |
.0| 100.0| 100.0|
.0| 100.0 | 100.0
|
|
|
|
|
|
|
|
|
|
|
|
|
|
|
|
|
|
|
|
|
|
Not reported
|0|0|0|0|0
|0|0|0|0|0
|0
------------------------------------------------------------------------------------------------------------------------------------
Total
| 2 | 212 | 134 | 30 | 378
|0|3|2|0|5
| 383
Page 27 Run 10/21/04 9:46 am
Georgia Department of Corrections Office of Planning and Analysis Inmate statistical profile
Sample: ACTIVE PRISONERS EXCLUDING JAIL Active inmates 10/21/2004
Requestor: Statistics Circ Of Conviction by current age & sex
|
MEN
|
WOMEN
|
| Age | Age | Age | Age | Men
| Age | Age | Age | Age |Women
|Grand
Circ Of Conviction |00-21 %|22-39 %|40-54 %|55-99 %|Total % |00-21 %|22-39 %|40-54 %|55-99 %|Total % |Total %
------------------------------------------------------------------------------------------------------------------------------------
Alapaha
| 0 0| 4 2| 0 0| 1 3| 5 1 | 0 0| 0 0| 0 0| 0 0| 0 0 | 5 1
Alcovy
| 0 0| 2 1| 3 2| 0 0| 5 1 | 0 0| 0 0| 0 0| 0 0| 0 0 | 5 1
Atlanta
| 0 0| 16 8| 16 12| 2 7| 34 9 | 0 0| 0 0| 0 0| 0 0| 0 0 | 34 9
Atlantic
| 0 0| 5 2| 1 1| 0 0| 6 2 | 0 0| 0 0| 0 0| 0 0| 0 0 | 6 2
Augusta
| 1 50| 12 6| 8 6| 2 7| 23 6 | 0 0| 1 33| 0 0| 0 0| 1 20 | 24 6
Blue Ridge
| 0 0| 1 0| 1 1| 0 0| 2 1 | 0 0| 0 0| 0 0| 0 0| 0 0 | 2 1
Brunswick
| 0 0| 8 4| 5 4| 2 7| 15 4 | 0 0| 0 0| 0 0| 0 0| 0 0 | 15 4
Chattahoochee
| 0 0| 9 4| 7 5| 1 3| 17 4 | 0 0| 0 0| 0 0| 0 0| 0 0 | 17 4
Cherokee
| 0 0| 0 0| 2 1| 1 3| 3 1 | 0 0| 0 0| 0 0| 0 0| 0 0 | 3 1
Clayton
| 0 0| 9 4| 2 1| 1 3| 12 3 | 0 0| 0 0| 0 0| 0 0| 0 0 | 12 3
Cobb
| 0 0| 8 4| 4 3| 1 3| 13 3 | 0 0| 0 0| 0 0| 0 0| 0 0 | 13 3
Conasauga
| 0 0| 1 0| 2 1| 2 7| 5 1 | 0 0| 0 0| 0 0| 0 0| 0 0 | 5 1
Cordele
| 0 0| 2 1| 1 1| 0 0| 3 1 | 0 0| 0 0| 0 0| 0 0| 0 0 | 3 1
Coweta
| 0 0| 4 2| 1 1| 0 0| 5 1 | 0 0| 0 0| 0 0| 0 0| 0 0 | 5 1
Dougherty
| 0 0| 7 3| 3 2| 1 3| 11 3 | 0 0| 0 0| 0 0| 0 0| 0 0 | 11 3
Dublin
| 0 0| 1 0| 1 1| 0 0| 2 1 | 0 0| 0 0| 0 0| 0 0| 0 0 | 2 1
Eastern
| 0 0| 11 5| 4 3| 1 3| 16 4 | 0 0| 0 0| 0 0| 0 0| 0 0 | 16 4
Flint
| 0 0| 6 3| 2 1| 0 0| 8 2 | 0 0| 0 0| 0 0| 0 0| 0 0 | 8 2
Griffin
| 0 0| 4 2| 5 4| 2 7| 11 3 | 0 0| 0 0| 1 50| 0 0| 1 20 | 12 3
Gwinnett
| 0 0| 4 2| 1 1| 0 0| 5 1 | 0 0| 0 0| 0 0| 0 0| 0 0 | 5 1
Houston
| 0 0| 2 1| 4 3| 0 0| 6 2 | 0 0| 0 0| 0 0| 0 0| 0 0 | 6 2
Lookout Mountain | 0 0| 4 2| 1 1| 1 3| 6 2 | 0 0| 1 33| 0 0| 0 0| 1 20 | 7 2
Macon
| 0 0| 9 4| 2 1| 3 10| 14 4 | 0 0| 0 0| 0 0| 0 0| 0 0 | 14 4
Middle
| 0 0| 5 2| 1 1| 0 0| 6 2 | 0 0| 0 0| 0 0| 0 0| 0 0 | 6 2
Mountain
| 0 0| 1 0| 1 1| 0 0| 2 1 | 0 0| 0 0| 0 0| 0 0| 0 0 | 2 1
Northeastern
| 0 0| 5 2| 2 1| 0 0| 7 2 | 0 0| 0 0| 0 0| 0 0| 0 0 | 7 2
Northern
| 0 0| 5 2| 3 2| 1 3| 9 2 | 0 0| 0 0| 0 0| 0 0| 0 0 | 9 2
Ocmulgee
| 0 0| 8 4| 4 3| 0 0| 12 3 | 0 0| 0 0| 0 0| 0 0| 0 0 | 12 3
Oconee
| 0 0| 3 1| 0 0| 0 0| 3 1 | 0 0| 0 0| 0 0| 0 0| 0 0 | 3 1
Ogeechee
| 0 0| 1 0| 1 1| 0 0| 2 1 | 0 0| 0 0| 0 0| 0 0| 0 0 | 2 1
Pataula
| 0 0| 2 1| 0 0| 1 3| 3 1 | 0 0| 0 0| 0 0| 0 0| 0 0 | 3 1
Piedmont
| 1 50| 5 2| 1 1| 3 10| 10 3 | 0 0| 0 0| 0 0| 0 0| 0 0 | 10 3
Rome
| 0 0| 3 1| 1 1| 0 0| 4 1 | 0 0| 0 0| 0 0| 0 0| 0 0 | 4 1
South Georgia
| 0 0| 0 0| 1 1| 0 0| 1 0 | 0 0| 0 0| 0 0| 0 0| 0 0 | 1 0
Southern
| 0 0| 4 2| 5 4| 0 0| 9 2 | 0 0| 0 0| 0 0| 0 0| 0 0 | 9 2
Southwestern
| 0 0| 1 0| 1 1| 0 0| 2 1 | 0 0| 0 0| 0 0| 0 0| 0 0 | 2 1
------------------------------------------------------------------------------------------------------------------------------------
(continued)
Page 28 Run 10/21/04 9:46 am
Georgia Department of Corrections Office of Planning and Analysis
Inmate statistical profile
Sample: ACTIVE PRISONERS EXCLUDING JAIL
Requestor:
Active inmates 10/21/2004
Circ Of Conviction by current age & sex
Statistics (continued)
|
MEN
|
WOMEN
|
| Age | Age | Age | Age | Men
| Age | Age | Age | Age |Women
|Grand
Circ Of Conviction |00-21 %|22-39 %|40-54 %|55-99 %|Total % |00-21 %|22-39 %|40-54 %|55-99 %|Total % |Total %
------------------------------------------------------------------------------------------------------------------------------------
Stone Mountain
| 0 0| 15 7| 10 7| 2 7| 27 7 | 0 0| 1 33| 0 0| 0 0| 1 20 | 28 7
Tallapoosa
| 0 0| 1 0| 0 0| 0 0| 1 0 | 0 0| 0 0| 0 0| 0 0| 0 0 | 1 0
Tifton
| 0 0| 0 0| 1 1| 1 3| 2 1 | 0 0| 0 0| 0 0| 0 0| 0 0 | 2 1
Toombs
| 0 0| 1 0| 0 0| 0 0| 1 0 | 0 0| 0 0| 0 0| 0 0| 0 0 | 1 0
Waycross
| 0 0| 6 3| 8 6| 0 0| 14 4 | 0 0| 0 0| 0 0| 0 0| 0 0 | 14 4
Western
| 0 0| 5 2| 6 4| 0 0| 11 3 | 0 0| 0 0| 0 0| 0 0| 0 0 | 11 3
Rockdale
| 0 0| 3 1| 1 1| 0 0| 4 1 | 0 0| 0 0| 0 0| 0 0| 0 0 | 4 1
Douglas
| 0 0| 6 3| 5 4| 0 0| 11 3 | 0 0| 0 0| 1 50| 0 0| 1 20 | 12 3
Appalachian
| 0 0| 1 0| 0 0| 0 0| 1 0 | 0 0| 0 0| 0 0| 0 0| 0 0 | 1 0
Enotah
| 0 0| 1 0| 1 1| 0 0| 2 1 | 0 0| 0 0| 0 0| 0 0| 0 0 | 2 1
Bell-Forsyth
| 0 0| 0 0| 1 1| 0 0| 1 0 | 0 0| 0 0| 0 0| 0 0| 0 0 | 1 0
Towaliga
| 0 0| 1 0| 3 2| 1 3| 5 1 | 0 0| 0 0| 0 0| 0 0| 0 0 | 5 1
Paulding
| 0 0| 0 0| 1 1| 0 0| 1 0 | 0 0| 0 0| 0 0| 0 0| 0 0 | 1 0
------------------------------------------------------------------------------------------------------------------------------------
Total reported
| 2 100| 212 100| 134 100| 30 100| 378 100 | 0 0| 3 100| 2 100| 0 0| 5 100 | 383 100
|
|
|
|
|
|
|
|
|
|
|
Percent reported | 100.0| 100.0| 100.0| 100.0| 100.0 |
.0| 100.0| 100.0|
.0| 100.0 | 100.0
|
|
|
|
|
|
|
|
|
|
|
|
|
|
|
|
|
|
|
|
|
|
Not reported
|0|0|0|0|0
|0|0|0|0|0
|0
------------------------------------------------------------------------------------------------------------------------------------
Total
| 2 | 212 | 134 | 30 | 378
|0|3|2|0|5
| 383
Page 29 Run 10/21/04 9:46 am
Georgia Department of Corrections Office of Planning and Analysis
Inmate statistical profile
Sample: ACTIVE PRISONERS EXCLUDING JAIL Active inmates 10/21/2004
Requestor: Statistics Home County by current age & sex
|
MEN
|
WOMEN
|
| Age | Age | Age | Age | Men
| Age | Age | Age | Age |Women
|Grand
Home County
|00-21 %|22-39 %|40-54 %|55-99 %|Total % |00-21 %|22-39 %|40-54 %|55-99 %|Total % |Total %
------------------------------------------------------------------------------------------------------------------------------------
Appling
| 0 0| 1 1| 0 0| 1 4| 2 1 | 0 0| 0 0| 0 0| 0 0| 0 0 | 2 1
Atkinson
| 0 0| 0 0| 0 0| 1 4| 1 0 | 0 0| 0 0| 0 0| 0 0| 0 0 | 1 0
Baldwin
| 0 0| 1 1| 2 2| 0 0| 3 1 | 0 0| 0 0| 0 0| 0 0| 0 0 | 3 1
Barrow
| 0 0| 2 1| 0 0| 1 4| 3 1 | 0 0| 0 0| 0 0| 0 0| 0 0 | 3 1
Bartow
| 0 0| 0 0| 3 3| 0 0| 3 1 | 0 0| 0 0| 0 0| 0 0| 0 0 | 3 1
Ben Hill
| 0 0| 2 1| 0 0| 0 0| 2 1 | 0 0| 0 0| 0 0| 0 0| 0 0 | 2 1
Bibb
| 0 0| 4 2| 1 1| 2 9| 7 2 | 0 0| 0 0| 0 0| 0 0| 0 0 | 7 2
Bleckley
| 0 0| 2 1| 1 1| 0 0| 3 1 | 0 0| 0 0| 0 0| 0 0| 0 0 | 3 1
Brooks
| 0 0| 1 1| 0 0| 0 0| 1 0 | 0 0| 0 0| 0 0| 0 0| 0 0 | 1 0
Bulloch
| 0 0| 0 0| 1 1| 0 0| 1 0 | 0 0| 0 0| 0 0| 0 0| 0 0 | 1 0
Burke
| 0 0| 2 1| 1 1| 0 0| 3 1 | 0 0| 0 0| 0 0| 0 0| 0 0 | 3 1
Butts
| 0 0| 0 0| 0 0| 1 4| 1 0 | 0 0| 0 0| 0 0| 0 0| 0 0 | 1 0
Camden
| 0 0| 0 0| 1 1| 0 0| 1 0 | 0 0| 0 0| 0 0| 0 0| 0 0 | 1 0
Carroll
| 0 0| 1 1| 1 1| 0 0| 2 1 | 0 0| 0 0| 0 0| 0 0| 0 0 | 2 1
Catoosa
| 0 0| 0 0| 1 1| 0 0| 1 0 | 0 0| 0 0| 0 0| 0 0| 0 0 | 1 0
Chatham
| 0 0| 10 6| 7 6| 1 4| 18 6 | 0 0| 0 0| 0 0| 0 0| 0 0 | 18 5
Chattooga
| 0 0| 1 1| 0 0| 0 0| 1 0 | 0 0| 0 0| 0 0| 0 0| 0 0 | 1 0
Cherokee
| 0 0| 1 1| 1 1| 0 0| 2 1 | 0 0| 0 0| 0 0| 0 0| 0 0 | 2 1
Clarke
| 0 0| 5 3| 4 3| 0 0| 9 3 | 0 0| 0 0| 0 0| 0 0| 0 0 | 9 3
Clayton
| 0 0| 7 4| 1 1| 1 4| 9 3 | 0 0| 1 33| 0 0| 0 0| 1 20 | 10 3
Cobb
| 0 0| 6 3| 5 4| 1 4| 12 4 | 0 0| 0 0| 0 0| 0 0| 0 0 | 12 4
Coffee
| 0 0| 0 0| 1 1| 0 0| 1 0 | 0 0| 0 0| 0 0| 0 0| 0 0 | 1 0
Colquit
| 0 0| 0 0| 2 2| 0 0| 2 1 | 0 0| 0 0| 0 0| 0 0| 0 0 | 2 1
Columbia
| 0 0| 0 0| 0 0| 1 4| 1 0 | 0 0| 0 0| 0 0| 0 0| 0 0 | 1 0
Cook
| 0 0| 1 1| 0 0| 0 0| 1 0 | 0 0| 0 0| 0 0| 0 0| 0 0 | 1 0
Coweta
| 0 0| 1 1| 0 0| 0 0| 1 0 | 0 0| 0 0| 0 0| 0 0| 0 0 | 1 0
Crisp
| 0 0| 0 0| 1 1| 0 0| 1 0 | 0 0| 0 0| 0 0| 0 0| 0 0 | 1 0
Decatur
| 0 0| 0 0| 2 2| 0 0| 2 1 | 0 0| 0 0| 0 0| 0 0| 0 0 | 2 1
DeKalb
| 0 0| 21 12| 6 5| 0 0| 27 8 | 0 0| 0 0| 0 0| 0 0| 0 0 | 27 8
Dougherty
| 0 0| 5 3| 3 3| 1 4| 9 3 | 0 0| 0 0| 0 0| 0 0| 0 0 | 9 3
Douglas
| 0 0| 2 1| 3 3| 0 0| 5 2 | 0 0| 0 0| 1 50| 0 0| 1 20 | 6 2
Effingham
| 0 0| 1 1| 0 0| 0 0| 1 0 | 0 0| 0 0| 0 0| 0 0| 0 0 | 1 0
Elbert
| 0 0| 1 1| 0 0| 1 4| 2 1 | 0 0| 0 0| 0 0| 0 0| 0 0 | 2 1
Fayette
| 0 0| 0 0| 1 1| 1 4| 2 1 | 0 0| 0 0| 0 0| 0 0| 0 0 | 2 1
Floyd
| 0 0| 3 2| 0 0| 0 0| 3 1 | 0 0| 0 0| 0 0| 0 0| 0 0 | 3 1
Franklin
| 0 0| 2 1| 0 0| 0 0| 2 1 | 0 0| 0 0| 0 0| 0 0| 0 0 | 2 1
------------------------------------------------------------------------------------------------------------------------------------
(continued)
Page 30 Run 10/21/04 9:46 am
Georgia Department of Corrections Office of Planning and Analysis
Inmate statistical profile
Sample: ACTIVE PRISONERS EXCLUDING JAIL
Requestor: Statistics
Active inmates 10/21/2004
Home County by current age & sex
(continued)
|
MEN
|
WOMEN
|
| Age | Age | Age | Age | Men
| Age | Age | Age | Age |Women
|Grand
Home County
|00-21 %|22-39 %|40-54 %|55-99 %|Total % |00-21 %|22-39 %|40-54 %|55-99 %|Total % |Total %
------------------------------------------------------------------------------------------------------------------------------------
Fulton
| 0 0| 22 12| 19 16| 2 9| 43 13 | 0 0| 0 0| 0 0| 0 0| 0 0 | 43 13
Gilmer
| 0 0| 1 1| 0 0| 0 0| 1 0 | 0 0| 0 0| 0 0| 0 0| 0 0 | 1 0
Glynn
| 0 0| 4 2| 2 2| 1 4| 7 2 | 0 0| 0 0| 0 0| 0 0| 0 0 | 7 2
Gordon
| 0 0| 1 1| 1 1| 1 4| 3 1 | 0 0| 0 0| 0 0| 0 0| 0 0 | 3 1
Greene
| 0 0| 1 1| 0 0| 0 0| 1 0 | 0 0| 0 0| 0 0| 0 0| 0 0 | 1 0
Gwinnett
| 0 0| 2 1| 4 3| 0 0| 6 2 | 0 0| 0 0| 0 0| 0 0| 0 0 | 6 2
Habersham
| 0 0| 0 0| 1 1| 0 0| 1 0 | 0 0| 0 0| 0 0| 0 0| 0 0 | 1 0
Hall
| 0 0| 4 2| 1 1| 1 4| 6 2 | 0 0| 0 0| 0 0| 0 0| 0 0 | 6 2
Hancock
| 0 0| 0 0| 2 2| 0 0| 2 1 | 0 0| 0 0| 0 0| 0 0| 0 0 | 2 1
Harris
| 0 0| 0 0| 1 1| 0 0| 1 0 | 0 0| 0 0| 0 0| 0 0| 0 0 | 1 0
Hart
| 0 0| 1 1| 1 1| 0 0| 2 1 | 0 0| 0 0| 0 0| 0 0| 0 0 | 2 1
Henry
| 0 0| 2 1| 1 1| 0 0| 3 1 | 0 0| 0 0| 0 0| 0 0| 0 0 | 3 1
Houston
| 0 0| 2 1| 4 3| 0 0| 6 2 | 0 0| 0 0| 0 0| 0 0| 0 0 | 6 2
Jackson
| 1 50| 0 0| 1 1| 1 4| 3 1 | 0 0| 0 0| 0 0| 0 0| 0 0 | 3 1
Jeff Davis
| 0 0| 1 1| 0 0| 0 0| 1 0 | 0 0| 0 0| 0 0| 0 0| 0 0 | 1 0
Jenkins
| 0 0| 2 1| 0 0| 0 0| 2 1 | 0 0| 0 0| 0 0| 0 0| 0 0 | 2 1
Laurens
| 0 0| 2 1| 0 0| 0 0| 2 1 | 0 0| 0 0| 0 0| 0 0| 0 0 | 2 1
Liberty
| 0 0| 2 1| 1 1| 0 0| 3 1 | 0 0| 0 0| 0 0| 0 0| 0 0 | 3 1
Lincoln
| 0 0| 1 1| 0 0| 0 0| 1 0 | 0 0| 0 0| 0 0| 0 0| 0 0 | 1 0
Long
| 0 0| 1 1| 0 0| 0 0| 1 0 | 0 0| 0 0| 0 0| 0 0| 0 0 | 1 0
Lowndes
| 0 0| 2 1| 1 1| 0 0| 3 1 | 0 0| 0 0| 0 0| 0 0| 0 0 | 3 1
Marion
| 0 0| 1 1| 0 0| 0 0| 1 0 | 0 0| 0 0| 0 0| 0 0| 0 0 | 1 0
McDuffie
| 0 0| 0 0| 1 1| 0 0| 1 0 | 0 0| 0 0| 0 0| 0 0| 0 0 | 1 0
McIntosh
| 0 0| 1 1| 1 1| 0 0| 2 1 | 0 0| 0 0| 0 0| 0 0| 0 0 | 2 1
Miller
| 0 0| 1 1| 0 0| 0 0| 1 0 | 0 0| 0 0| 0 0| 0 0| 0 0 | 1 0
Mitchell
| 0 0| 1 1| 0 0| 0 0| 1 0 | 0 0| 0 0| 0 0| 0 0| 0 0 | 1 0
Monroe
| 0 0| 0 0| 1 1| 0 0| 1 0 | 0 0| 0 0| 0 0| 0 0| 0 0 | 1 0
Morgan
| 0 0| 1 1| 0 0| 0 0| 1 0 | 0 0| 0 0| 0 0| 0 0| 0 0 | 1 0
Muscogee
| 0 0| 6 3| 5 4| 0 0| 11 3 | 0 0| 0 0| 0 0| 0 0| 0 0 | 11 3
Newton
| 0 0| 2 1| 0 0| 0 0| 2 1 | 0 0| 0 0| 0 0| 0 0| 0 0 | 2 1
Oglethorpe
| 0 0| 1 1| 0 0| 1 4| 2 1 | 0 0| 0 0| 0 0| 0 0| 0 0 | 2 1
Paulding
| 0 0| 0 0| 1 1| 0 0| 1 0 | 0 0| 0 0| 0 0| 0 0| 0 0 | 1 0
Pierce
| 0 0| 0 0| 1 1| 0 0| 1 0 | 0 0| 0 0| 0 0| 0 0| 0 0 | 1 0
Pike
| 0 0| 1 1| 1 1| 0 0| 2 1 | 0 0| 0 0| 1 50| 0 0| 1 20 | 3 1
Polk
| 0 0| 1 1| 0 0| 0 0| 1 0 | 0 0| 0 0| 0 0| 0 0| 0 0 | 1 0
------------------------------------------------------------------------------------------------------------------------------------
(continued)
Page 31 Run 10/21/04 9:46 am
Georgia Department of Corrections Office of Planning and Analysis
Inmate statistical profile
Sample: ACTIVE PRISONERS EXCLUDING JAIL
Requestor: Statistics
Active inmates 10/21/2004
Home County by current age & sex
(continued)
|
MEN
|
WOMEN
|
| Age | Age | Age | Age | Men
| Age | Age | Age | Age |Women
|Grand
Home County
|00-21 %|22-39 %|40-54 %|55-99 %|Total % |00-21 %|22-39 %|40-54 %|55-99 %|Total % |Total %
------------------------------------------------------------------------------------------------------------------------------------
Putnam
| 0 0| 1 1| 1 1| 0 0| 2 1 | 0 0| 0 0| 0 0| 0 0| 0 0 | 2 1
Rabun
| 0 0| 1 1| 0 0| 0 0| 1 0 | 0 0| 0 0| 0 0| 0 0| 0 0 | 1 0
Randolph
| 0 0| 1 1| 0 0| 1 4| 2 1 | 0 0| 0 0| 0 0| 0 0| 0 0 | 2 1
Richmond
| 1 50| 6 3| 4 3| 1 4| 12 4 | 0 0| 1 33| 0 0| 0 0| 1 20 | 13 4
Rockdale
| 0 0| 0 0| 1 1| 0 0| 1 0 | 0 0| 0 0| 0 0| 0 0| 0 0 | 1 0
Seminole
| 0 0| 1 1| 0 0| 0 0| 1 0 | 0 0| 0 0| 0 0| 0 0| 0 0 | 1 0
Spalding
| 0 0| 3 2| 2 2| 0 0| 5 2 | 0 0| 0 0| 0 0| 0 0| 0 0 | 5 2
Stephens
| 0 0| 0 0| 1 1| 0 0| 1 0 | 0 0| 0 0| 0 0| 0 0| 0 0 | 1 0
Sumter
| 0 0| 0 0| 1 1| 0 0| 1 0 | 0 0| 0 0| 0 0| 0 0| 0 0 | 1 0
Tattnall
| 0 0| 1 1| 0 0| 0 0| 1 0 | 0 0| 0 0| 0 0| 0 0| 0 0 | 1 0
Thomas
| 0 0| 1 1| 1 1| 0 0| 2 1 | 0 0| 0 0| 0 0| 0 0| 0 0 | 2 1
Tift
| 0 0| 0 0| 1 1| 1 4| 2 1 | 0 0| 0 0| 0 0| 0 0| 0 0 | 2 1
Toombs
| 0 0| 2 1| 1 1| 0 0| 3 1 | 0 0| 0 0| 0 0| 0 0| 0 0 | 3 1
Troup
| 0 0| 1 1| 0 0| 0 0| 1 0 | 0 0| 0 0| 0 0| 0 0| 0 0 | 1 0
Union
| 0 0| 0 0| 1 1| 0 0| 1 0 | 0 0| 0 0| 0 0| 0 0| 0 0 | 1 0
Upson
| 0 0| 0 0| 1 1| 0 0| 1 0 | 0 0| 0 0| 0 0| 0 0| 0 0 | 1 0
Walker
| 0 0| 2 1| 0 0| 0 0| 2 1 | 0 0| 1 33| 0 0| 0 0| 1 20 | 3 1
Walton
| 0 0| 0 0| 2 2| 0 0| 2 1 | 0 0| 0 0| 0 0| 0 0| 0 0 | 2 1
Ware
| 0 0| 4 2| 1 1| 0 0| 5 2 | 0 0| 0 0| 0 0| 0 0| 0 0 | 5 2
Washington
| 0 0| 3 2| 0 0| 0 0| 3 1 | 0 0| 0 0| 0 0| 0 0| 0 0 | 3 1
Wayne
| 0 0| 2 1| 0 0| 0 0| 2 1 | 0 0| 0 0| 0 0| 0 0| 0 0 | 2 1
Whitfield
| 0 0| 0 0| 1 1| 0 0| 1 0 | 0 0| 0 0| 0 0| 0 0| 0 0 | 1 0
Wilkinson
| 0 0| 1 1| 0 0| 0 0| 1 0 | 0 0| 0 0| 0 0| 0 0| 0 0 | 1 0
------------------------------------------------------------------------------------------------------------------------------------
Total reported
| 2 100| 180 100| 119 100| 23 100| 324 100 | 0 0| 3 100| 2 100| 0 0| 5 100 | 329 100
|
|
|
|
|
|
|
|
|
|
|
Percent reported | 100.0|
84.9|
88.8|
76.7|
85.7 |
.0| 100.0| 100.0|
.0| 100.0 |
85.9
|
|
|
|
|
|
|
|
|
|
|
|
|
|
|
|
|
|
|
|
|
|
Not reported
| 0 | 32 | 15 | 7 | 54
|0|0|0|0|0
| 54
------------------------------------------------------------------------------------------------------------------------------------
Total
| 2 | 212 | 134 | 30 | 378
|0|3|2|0|5
| 383
Georgia Department of Corrections
Page 32 Run 10/21/04 9:46 am
Sample: ACTIVE PRISONERS EXCLUDING JAIL Active inmates 10/21/2004
Office of Planning and Analysis Inmate statistical profile Requestor: Statistics
Prison Sentence In Years by current age & sex
|
MEN
|
WOMEN
|
| Age | Age | Age | Age | Men
| Age | Age | Age | Age |Women
|Grand
Sentence In Years |00-21 %|22-39 %|40-54 %|55-99 %|Total % |00-21 %|22-39 %|40-54 %|55-99 %|Total % |Total %
------------------------------------------------------------------------------------------------------------------------------------
0-1
| 0 0| 0 0| 0 0| 0 0| 0 0 | 0 0| 0 0| 0 0| 0 0| 0 0 | 0 0
1.1-2
| 0 0| 0 0| 0 0| 0 0| 0 0 | 0 0| 0 0| 0 0| 0 0| 0 0 | 0 0
2.1-3
| 0 0| 0 0| 0 0| 0 0| 0 0 | 0 0| 0 0| 0 0| 0 0| 0 0 | 0 0
3.1-4
| 0 0| 0 0| 0 0| 0 0| 0 0 | 0 0| 0 0| 0 0| 0 0| 0 0 | 0 0
4.1-5
| 0 0| 0 0| 0 0| 0 0| 0 0 | 0 0| 0 0| 0 0| 0 0| 0 0 | 0 0
5.1-6
| 0 0| 0 0| 0 0| 0 0| 0 0 | 0 0| 0 0| 0 0| 0 0| 0 0 | 0 0
6.1-7
| 0 0| 0 0| 0 0| 0 0| 0 0 | 0 0| 0 0| 0 0| 0 0| 0 0 | 0 0
7.1-8
| 0 0| 0 0| 0 0| 0 0| 0 0 | 0 0| 0 0| 0 0| 0 0| 0 0 | 0 0
8.1-9
| 0 0| 0 0| 0 0| 0 0| 0 0 | 0 0| 0 0| 0 0| 0 0| 0 0 | 0 0
9.1-10
| 0 0| 0 0| 0 0| 0 0| 0 0 | 0 0| 0 0| 0 0| 0 0| 0 0 | 0 0
10.1-12
| 0 0| 0 0| 0 0| 0 0| 0 0 | 0 0| 0 0| 0 0| 0 0| 0 0 | 0 0
12.1-15
| 0 0| 0 0| 0 0| 0 0| 0 0 | 0 0| 0 0| 0 0| 0 0| 0 0 | 0 0
15.1-20
| 0 0| 0 0| 0 0| 0 0| 0 0 | 0 0| 0 0| 0 0| 0 0| 0 0 | 0 0
20.1-OVER
| 0 0| 0 0| 0 0| 0 0| 0 0 | 0 0| 0 0| 0 0| 0 0| 0 0 | 0 0
LIFE
| 0 0| 0 0| 0 0| 0 0| 0 0 | 0 0| 0 0| 0 0| 0 0| 0 0 | 0 0
DEATH
| 0 0| 0 0| 0 0| 0 0| 0 0 | 0 0| 0 0| 0 0| 0 0| 0 0 | 0 0
LIFE W/O PAROLE
| 2 100| 212 100| 134 100| 30 100| 378 100 | 0 0| 3 100| 2 100| 0 0| 5 100 | 383 100
YOUTHFUL OFFENDERS | 0 0| 0 0| 0 0| 0 0| 0 0 | 0 0| 0 0| 0 0| 0 0| 0 0 | 0 0
------------------------------------------------------------------------------------------------------------------------------------
Total reported
| 2 100| 212 100| 134 100| 30 100| 378 100 | 0 0| 3 100| 2 100| 0 0| 5 100 | 383 100
|
|
|
|
|
|
|
|
|
|
|
Percent reported | 100.0| 100.0| 100.0| 100.0| 100.0 |
.0| 100.0| 100.0|
.0| 100.0 | 100.0
|
|
|
|
|
|
|
|
|
|
|
|
|
|
|
|
|
|
|
|
|
|
NOT REPORTED
|0|0|0|0|0
|0|0|0|0|0
|0
------------------------------------------------------------------------------------------------------------------------------------
Total
| 2 | 212 | 134 | 30 | 378
|0|3|2|0|5
| 383
|
|
|
|
|
|
|
|
|
|
|
|
|
|
|
|
|
|
|
|
|
|
|
|
|
|
|
|
|
|
|
|
|
|
|
|
|
|
|
|
|
|
|
|
|
|
|
|
|
|
|
|
|
|
|
AVG EXCLUDING
|
|
|
|
|
|
|
|
|
|
|
LIFE, DEATH, YO
| .00 | .00 | .00 | .00 | .00 | .00 | .00 | .00 | .00 | .00 | .00
|
|
|
|
|
|
|
|
|
|
|
|
|
|
|
|
|
|
|
|
|
|
|
|
|
|
|
|
|
|
|
|
|
|
|
|
|
|
|
|
|
|
|
|
|
|
|
|
|
|
|
|
|
|
|
AVG INCLUDING
|
|
|
|
|
|
|
|
|
|
|
LIFE=21, YO=3 YRS | 3.00 | 3.00 | 3.00 | 3.00 | 3.00 | .00 | 3.00 | 3.00 |
Page 33 Run 10/21/04 9:46 am
Georgia Department of Corrections Office of Planning and Analysis
Inmate statistical profile
.00 | 3.00 | 3.00
Sample: ACTIVE PRISONERS EXCLUDING JAIL Active inmates 10/21/2004
Requestor: Statistics Probation To Follow Prison by current age & sex
|
MEN
|
WOMEN
|
| Age | Age | Age | Age | Men
| Age | Age | Age | Age |Women
|Grand
Prob After Prison |00-21 %|22-39 %|40-54 %|55-99 %|Total % |00-21 %|22-39 %|40-54 %|55-99 %|Total % |Total %
------------------------------------------------------------------------------------------------------------------------------------
PROBATION TO FOLLOW | 0 0| 8 4| 9 7| 1 3| 18 5 | 0 0| 0 0| 0 0| 0 0| 0 0 | 18 5
NO PROBATION
| 2 100| 204 96| 125 93| 29 97| 360 95 | 0 0| 3 100| 2 100| 0 0| 5 100 | 365 95
------------------------------------------------------------------------------------------------------------------------------------
Total reported
| 2 100| 212 100| 134 100| 30 100| 378 100 | 0 0| 3 100| 2 100| 0 0| 5 100 | 383 100
|
|
|
|
|
|
|
|
|
|
|
Percent reported | 100.0| 100.0| 100.0| 100.0| 100.0 |
.0| 100.0| 100.0|
.0| 100.0 | 100.0
|
|
|
|
|
|
|
|
|
|
|
|
|
|
|
|
|
|
|
|
|
|
NOT REPORTED
|0|0|0|0|0
|0|0|0|0|0
|0
------------------------------------------------------------------------------------------------------------------------------------
Total
| 2 | 212 | 134 | 30 | 378
|0|3|2|0|5
| 383
Page 34 Run 10/21/04 9:46 am
Georgia Department of Corrections Office of Planning and Analysis
Inmate statistical profile
Sample: ACTIVE PRISONERS EXCLUDING JAIL Active inmates 10/21/2004
Requestor: Statistics Admission Type by current age & sex
|
MEN
|
WOMEN
|
| Age | Age | Age | Age | Men
| Age | Age | Age | Age |Women
|Grand
Admission Type
|00-21 %|22-39 %|40-54 %|55-99 %|Total % |00-21 %|22-39 %|40-54 %|55-99 %|Total % |Total %
------------------------------------------------------------------------------------------------------------------------------------
COMMITTED FROM COURT| 0 0| 60 28| 37 28| 8 27| 105 28 | 0 0| 2 67| 0 0| 0 0| 2 40 | 107 28
RETURN APPEAL/BOND | 0 0| 0 0| 0 0| 0 0| 0 0 | 0 0| 0 0| 0 0| 0 0| 0 0 | 0 0
PAROLE REV/NEW SENT | 0 0| 12 6| 17 13| 3 10| 32 8 | 0 0| 0 0| 0 0| 0 0| 0 0 | 32 8
PAR REV/NO NEW SENT | 0 0| 3 1| 1 1| 0 0| 4 1 | 0 0| 0 0| 0 0| 0 0| 0 0 | 4 1
PROB VIOL/TOTAL REV | 0 0| 0 0| 0 0| 0 0| 0 0 | 0 0| 0 0| 0 0| 0 0| 0 0 | 0 0
PROB VIOL/PARTIAL | 0 0| 2 1| 1 1| 0 0| 3 1 | 0 0| 0 0| 0 0| 0 0| 0 0 | 3 1
ADMIT FM OTHER CUST | 0 0| 0 0| 0 0| 0 0| 0 0 | 0 0| 0 0| 0 0| 0 0| 0 0 | 0 0
SHOCK INCARCERATION | 0 0| 0 0| 0 0| 0 0| 0 0 | 0 0| 0 0| 0 0| 0 0| 0 0 | 0 0
PROB REV/REMAINDER | 0 0| 7 3| 3 2| 0 0| 10 3 | 0 0| 0 0| 0 0| 0 0| 0 0 | 10 3
NEW SENT/PAR REV PND| 0 0| 0 0| 1 1| 0 0| 1 0 | 0 0| 0 0| 0 0| 0 0| 0 0 | 1 0
LIFE W/O PAROLE
| 2 100| 128 60| 73 54| 19 63| 222 59 | 0 0| 1 33| 2 100| 0 0| 3 60 | 225 59
PAROLE REV BOOT CAMP| 0 0| 0 0| 0 0| 0 0| 0 0 | 0 0| 0 0| 0 0| 0 0| 0 0 | 0 0
PAR REV/RSN UNKNOWN | 0 0| 0 0| 1 1| 0 0| 1 0 | 0 0| 0 0| 0 0| 0 0| 0 0 | 1 0
PROBATION/PAROLE REV| 0 0| 0 0| 0 0| 0 0| 0 0 | 0 0| 0 0| 0 0| 0 0| 0 0 | 0 0
PB PAROLE RESCINDED | 0 0| 0 0| 0 0| 0 0| 0 0 | 0 0| 0 0| 0 0| 0 0| 0 0 | 0 0
PROB REVOC/SPEC COND| 0 0| 0 0| 0 0| 0 0| 0 0 | 0 0| 0 0| 0 0| 0 0| 0 0 | 0 0
PAR REV/REVOC CENTER| 0 0| 0 0| 0 0| 0 0| 0 0 | 0 0| 0 0| 0 0| 0 0| 0 0 | 0 0
INFORMATION ONLY | 0 0| 0 0| 0 0| 0 0| 0 0 | 0 0| 0 0| 0 0| 0 0| 0 0 | 0 0
INCOMPLETE SENT PKG | 0 0| 0 0| 0 0| 0 0| 0 0 | 0 0| 0 0| 0 0| 0 0| 0 0 | 0 0
HANCOCK REVOC CENTER| 0 0| 0 0| 0 0| 0 0| 0 0 | 0 0| 0 0| 0 0| 0 0| 0 0 | 0 0
WHITWORTH DETENTION | 0 0| 0 0| 0 0| 0 0| 0 0 | 0 0| 0 0| 0 0| 0 0| 0 0 | 0 0
DCYS AT RISK
| 0 0| 0 0| 0 0| 0 0| 0 0 | 0 0| 0 0| 0 0| 0 0| 0 0 | 0 0
OTHER
| 0 0| 0 0| 0 0| 0 0| 0 0 | 0 0| 0 0| 0 0| 0 0| 0 0 | 0 0
------------------------------------------------------------------------------------------------------------------------------------
Total reported
| 2 100| 212 100| 134 100| 30 100| 378 100 | 0 0| 3 100| 2 100| 0 0| 5 100 | 383 100
|
|
|
|
|
|
|
|
|
|
|
Percent reported | 100.0| 100.0| 100.0| 100.0| 100.0 |
.0| 100.0| 100.0|
.0| 100.0 | 100.0
|
|
|
|
|
|
|
|
|
|
|
|
|
|
|
|
|
|
|
|
|
|
UNKNOWN
|0|0|0|0|0
|0|0|0|0|0
|0
------------------------------------------------------------------------------------------------------------------------------------
Total
| 2 | 212 | 134 | 30 | 378
|0|3|2|0|5
| 383
Page 35 Run 10/21/04 9:46 am
Georgia Department of Corrections Office of Planning and Analysis
Inmate statistical profile
Sample: ACTIVE PRISONERS EXCLUDING JAIL Active inmates 10/21/2004
Requestor: Statistics Release Type by current age & sex
|
MEN
|
WOMEN
|
| Age | Age | Age | Age | Men
| Age | Age | Age | Age |Women
|Grand
Release Type
|00-21 %|22-39 %|40-54 %|55-99 %|Total % |00-21 %|22-39 %|40-54 %|55-99 %|Total % |Total %
------------------------------------------------------------------------------------------------------------------------------------
Active
| 2 100| 212 100| 134 100| 30 100| 378 100 | 0 0| 3 100| 2 100| 0 0| 5 100 | 383 100
------------------------------------------------------------------------------------------------------------------------------------
Total
| 2 | 212 | 134 | 30 | 378
|0|3|2|0|5
| 383
Page 36 Run 10/21/04 9:46 am
Georgia Department of Corrections Office of Planning and Analysis Inmate statistical profile
Sample: ACTIVE PRISONERS EXCLUDING JAIL Active inmates 10/21/2004
Requestor: Statistics Inst By Group by current age & sex
|
MEN
|
WOMEN
|
| Age | Age | Age | Age | Men
| Age | Age | Age | Age |Women
|Grand
Inst By Group
|00-21 %|22-39 %|40-54 %|55-99 %|Total % |00-21 %|22-39 %|40-54 %|55-99 %|Total % |Total %
------------------------------------------------------------------------------------------------------------------------------------
State prison
| 2 100| 212 100| 134 100| 30 100| 378 100 | 0 0| 3 100| 2 100| 0 0| 5 100 | 383 100
Page 37 Run 10/21/04 9:46 am
Georgia Department of Corrections Office of Planning and Analysis
Inmate statistical profile
Sample: ACTIVE PRISONERS EXCLUDING JAIL Active inmates 10/21/2004
Requestor: Statistics Institution by current age & sex
|
MEN
|
WOMEN
|
| Age | Age | Age | Age | Men
| Age | Age | Age | Age |Women
|Grand
Institution
|00-21 %|22-39 %|40-54 %|55-99 %|Total % |00-21 %|22-39 %|40-54 %|55-99 %|Total % |Total %
------------------------------------------------------------------------------------------------------------------------------------
Ware Prison
| 0 0| 15 7| 13 10| 2 7| 30 8 | 0 0| 0 0| 0 0| 0 0| 0 0 | 30 8
Phillips Prison
| 0 0| 11 5| 5 4| 1 3| 17 4 | 0 0| 0 0| 0 0| 0 0| 0 0 | 17 4
Arrendale Prison | 0 0| 10 5| 9 7| 0 0| 19 5 | 0 0| 0 0| 0 0| 0 0| 0 0 | 19 5
Georgia State Prison| 0 0| 30 14| 17 13| 6 20| 53 14 | 0 0| 0 0| 0 0| 0 0| 0 0 | 53 14
Mens Prison
| 0 0| 0 0| 0 0| 1 3| 1 0 | 0 0| 0 0| 0 0| 0 0| 0 0 | 1 0
Jackson Prison-Diag | 0 0| 6 3| 3 2| 0 0| 9 2 | 0 0| 0 0| 0 0| 0 0| 0 0 | 9 2
Jackson Prison-Perm | 0 0| 0 0| 1 1| 0 0| 1 0 | 0 0| 0 0| 0 0| 0 0| 0 0 | 1 0
Coastal Prison
| 0 0| 7 3| 1 1| 0 0| 8 2 | 0 0| 0 0| 0 0| 0 0| 0 0 | 8 2
Central Prison
| 0 0| 0 0| 0 0| 1 3| 1 0 | 0 0| 0 0| 0 0| 0 0| 0 0 | 1 0
Augusta Med Prison | 0 0| 8 4| 3 2| 4 13| 15 4 | 0 0| 0 0| 0 0| 0 0| 0 0 | 15 4
Valdosta Prison
| 0 0| 20 9| 12 9| 0 0| 32 8 | 0 0| 0 0| 0 0| 0 0| 0 0 | 32 8
Hays Prison
| 1 50| 15 7| 14 10| 4 13| 34 9 | 0 0| 0 0| 0 0| 0 0| 0 0 | 34 9
Hancock Prison
| 0 0| 17 8| 6 4| 1 3| 24 6 | 0 0| 0 0| 0 0| 0 0| 0 0 | 24 6
Telfair Prison
| 1 50| 25 12| 19 14| 2 7| 47 12 | 0 0| 0 0| 0 0| 0 0| 0 0 | 47 12
Macon Prison
| 0 0| 27 13| 21 16| 3 10| 51 13 | 0 0| 0 0| 0 0| 0 0| 0 0 | 51 13
Smith Prison
| 0 0| 20 9| 10 7| 5 17| 35 9 | 0 0| 0 0| 0 0| 0 0| 0 0 | 35 9
Washingtn Women Pris| 0 0| 0 0| 0 0| 0 0| 0 0 | 0 0| 0 0| 2 100| 0 0| 2 40 | 2 1
Baldwin Prison
| 0 0| 1 0| 0 0| 0 0| 1 0 | 0 0| 0 0| 0 0| 0 0| 0 0 | 1 0
Metro Womens Prison | 0 0| 0 0| 0 0| 0 0| 0 0 | 0 0| 1 33| 0 0| 0 0| 1 20 | 1 0
Pulaski Womens Pris | 0 0| 0 0| 0 0| 0 0| 0 0 | 0 0| 2 67| 0 0| 0 0| 2 40 | 2 1
------------------------------------------------------------------------------------------------------------------------------------
Total reported
| 4 100| 424 100| 268 100| 60 100| 756 100 | 0 0| 6 100| 4 100| 0 0| 10 100 | 766 100
|
|
|
|
|
|
|
|
|
|
|
Percent reported | 100.0| 100.0| 100.0| 100.0| 100.0 |
.0| 100.0| 100.0|
.0| 100.0 | 100.0
|
|
|
|
|
|
|
|
|
|
|
|
|
|
|
|
|
|
|
|
|
|
Not Reported
|0|0|0|0|0
|0|0|0|0|0
|0
------------------------------------------------------------------------------------------------------------------------------------
Total
| 2 | 212 | 134 | 30 | 378
|0|3|2|0|5
| 383
Page 38 Run 10/21/04 9:46 am
Georgia Department of Corrections Office of Planning and Analysis
Inmate statistical profile
Sample: ACTIVE PRISONERS EXCLUDING JAIL Active inmates 10/21/2004
Requestor: Statistics Misdemeanors And Felonies by current age & sex
|
MEN
|
WOMEN
|
| Age | Age | Age | Age | Men
| Age | Age | Age | Age |Women
|Grand
Crime Type
|00-21 %|22-39 %|40-54 %|55-99 %|Total % |00-21 %|22-39 %|40-54 %|55-99 %|Total % |Total %
------------------------------------------------------------------------------------------------------------------------------------
MISDEMEANOR
| 0 0| 0 0| 0 0| 0 0| 0 0 | 0 0| 0 0| 0 0| 0 0| 0 0 | 0 0
FELONY
| 2 100| 212 100| 134 100| 30 100| 378 100 | 0 0| 3 100| 2 100| 0 0| 5 100 | 383 100
------------------------------------------------------------------------------------------------------------------------------------
Total reported
| 2 100| 212 100| 134 100| 30 100| 378 100 | 0 0| 3 100| 2 100| 0 0| 5 100 | 383 100
|
|
|
|
|
|
|
|
|
|
|
Percent reported | 100.0| 100.0| 100.0| 100.0| 100.0 |
.0| 100.0| 100.0|
.0| 100.0 | 100.0
|
|
|
|
|
|
|
|
|
|
|
|
|
|
|
|
|
|
|
|
|
|
NOT REPORTED
|0|0|0|0|0
|0|0|0|0|0
|0
------------------------------------------------------------------------------------------------------------------------------------
Total
| 2 | 212 | 134 | 30 | 378
|0|3|2|0|5
| 383
Page 39 Run 10/21/04 9:46 am
Georgia Department of Corrections Office of Planning and Analysis
Inmate statistical profile
Sample: ACTIVE PRISONERS EXCLUDING JAIL Active inmates 10/21/2004
Requestor: Statistics Crimes By Group by current age & sex
|
MEN
|
WOMEN
|
| Age | Age | Age | Age | Men
| Age | Age | Age | Age |Women
|Grand
Crimes By Group
|00-21 %|22-39 %|40-54 %|55-99 %|Total % |00-21 %|22-39 %|40-54 %|55-99 %|Total % |Total %
------------------------------------------------------------------------------------------------------------------------------------
HOMICIDE
| 2 100| 143 67| 56 42| 17 57| 218 58 | 0 0| 3 100| 2 100| 0 0| 5 100 | 223 58
ABORTION
| 0 0| 0 0| 0 0| 0 0| 0 0 | 0 0| 0 0| 0 0| 0 0| 0 0 | 0 0
BODILY INJRY&REL OFF| 0 0| 18 8| 22 16| 2 7| 42 11 | 0 0| 0 0| 0 0| 0 0| 0 0 | 42 11
ARSON & REL OFF
| 0 0| 0 0| 0 0| 0 0| 0 0 | 0 0| 0 0| 0 0| 0 0| 0 0 | 0 0
DAMAGE OF PROPERTY | 0 0| 0 0| 0 0| 0 0| 0 0 | 0 0| 0 0| 0 0| 0 0| 0 0 | 0 0
BURGLARY & REL OFF | 0 0| 0 0| 1 1| 0 0| 1 0 | 0 0| 0 0| 0 0| 0 0| 0 0 | 1 0
FORGERY & REL OFF | 0 0| 0 0| 0 0| 0 0| 0 0 | 0 0| 0 0| 0 0| 0 0| 0 0 | 0 0
THEFT
| 0 0| 0 0| 0 0| 0 0| 0 0 | 0 0| 0 0| 0 0| 0 0| 0 0 | 0 0
ROBBERY
| 0 0| 26 12| 24 18| 8 27| 58 15 | 0 0| 0 0| 0 0| 0 0| 0 0 | 58 15
SEXUAL OFFENSES
| 0 0| 21 10| 26 19| 3 10| 50 13 | 0 0| 0 0| 0 0| 0 0| 0 0 | 50 13
OBSCENITY CRIMES | 0 0| 0 0| 0 0| 0 0| 0 0 | 0 0| 0 0| 0 0| 0 0| 0 0 | 0 0
TREASON & REL OFF | 0 0| 0 0| 0 0| 0 0| 0 0 | 0 0| 0 0| 0 0| 0 0| 0 0 | 0 0
CRIMES INVOLVNG GOVT| 0 0| 0 0| 0 0| 0 0| 0 0 | 0 0| 0 0| 0 0| 0 0| 0 0 | 0 0
FALSIFICATIONS
| 0 0| 0 0| 0 0| 0 0| 0 0 | 0 0| 0 0| 0 0| 0 0| 0 0 | 0 0
OBSTRUCT LAW ENFORCE| 0 0| 0 0| 0 0| 0 0| 0 0 | 0 0| 0 0| 0 0| 0 0| 0 0 | 0 0
DISORDERLY CONDUCT | 0 0| 0 0| 0 0| 0 0| 0 0 | 0 0| 0 0| 0 0| 0 0| 0 0 | 0 0
GAMBLING & REL OFF | 0 0| 0 0| 0 0| 0 0| 0 0 | 0 0| 0 0| 0 0| 0 0| 0 0 | 0 0
CRUELTY TO CHILDREN | 0 0| 0 0| 0 0| 0 0| 0 0 | 0 0| 0 0| 0 0| 0 0| 0 0 | 0 0
CRIMES WITH GUNS | 0 0| 0 0| 0 0| 0 0| 0 0 | 0 0| 0 0| 0 0| 0 0| 0 0 | 0 0
INVASION PRIVACY | 0 0| 0 0| 0 0| 0 0| 0 0 | 0 0| 0 0| 0 0| 0 0| 0 0 | 0 0
RACKETEERING
| 0 0| 0 0| 0 0| 0 0| 0 0 | 0 0| 0 0| 0 0| 0 0| 0 0 | 0 0
DRUG ABUSE OFFENSES | 0 0| 3 1| 5 4| 0 0| 8 2 | 0 0| 0 0| 0 0| 0 0| 0 0 | 8 2
DRUG TRAFFICKING | 0 0| 1 0| 0 0| 0 0| 1 0 | 0 0| 0 0| 0 0| 0 0| 0 0 | 1 0
AUTO CRIMES
| 0 0| 0 0| 0 0| 0 0| 0 0 | 0 0| 0 0| 0 0| 0 0| 0 0 | 0 0
REVENUE & CONTRABAND| 0 0| 0 0| 0 0| 0 0| 0 0 | 0 0| 0 0| 0 0| 0 0| 0 0 | 0 0
CRIMES OF OTH STATES| 0 0| 0 0| 0 0| 0 0| 0 0 | 0 0| 0 0| 0 0| 0 0| 0 0 | 0 0
MISC. FELONIES
| 0 0| 0 0| 0 0| 0 0| 0 0 | 0 0| 0 0| 0 0| 0 0| 0 0 | 0 0
MISDEMEANORS
| 0 0| 0 0| 0 0| 0 0| 0 0 | 0 0| 0 0| 0 0| 0 0| 0 0 | 0 0
------------------------------------------------------------------------------------------------------------------------------------
Total reported
| 2 100| 212 100| 134 100| 30 100| 378 100 | 0 0| 3 100| 2 100| 0 0| 5 100 | 383 100
|
|
|
|
|
|
|
|
|
|
|
Percent reported | 100.0| 100.0| 100.0| 100.0| 100.0 |
.0| 100.0| 100.0|
.0| 100.0 | 100.0
|
|
|
|
|
|
|
|
|
|
|
|
|
|
|
|
|
|
|
|
|
|
NOT REPORTED
|0|0|0|0|0
|0|0|0|0|0
|0
------------------------------------------------------------------------------------------------------------------------------------
Total
| 2 | 212 | 134 | 30 | 378
|0|3|2|0|5
| 383
Page 40 Run 10/21/04 9:46 am
Georgia Department of Corrections Office of Planning and Analysis Inmate statistical profile
Sample: ACTIVE PRISONERS EXCLUDING JAIL Active inmates 10/21/2004
Requestor: Statistics Most Serious Offense by current age & sex
|
MEN
|
WOMEN
|
| Age | Age | Age | Age | Men
| Age | Age | Age | Age |Women
|Grand
Most Serious Offense|00-21 %|22-39 %|40-54 %|55-99 %|Total % |00-21 %|22-39 %|40-54 %|55-99 %|Total % |Total %
------------------------------------------------------------------------------------------------------------------------------------
NOTE: In the table below, misdemeanors come first, and are in lower-case letters. AFTER THAT COME FELONIES, IN UPPER-CASE LETTERS.
------------------------------------------------------------------------------------------------------------------------------------
MURDER
| 2 100| 143 67| 55 41| 17 57| 217 57 | 0 0| 3 100| 2 100| 0 0| 5 100 | 222 58
VOLUNTARY MANSLAUGHT| 0 0| 0 0| 1 1| 0 0| 1 0 | 0 0| 0 0| 0 0| 0 0| 0 0 | 1 0
KIDNAPPING
| 0 0| 18 8| 22 16| 2 7| 42 11 | 0 0| 0 0| 0 0| 0 0| 0 0 | 42 11
BURGLARY
| 0 0| 0 0| 1 1| 0 0| 1 0 | 0 0| 0 0| 0 0| 0 0| 0 0 | 1 0
ARMED ROBBERY
| 0 0| 26 12| 23 17| 8 27| 57 15 | 0 0| 0 0| 0 0| 0 0| 0 0 | 57 15
HIJACKING MOTOR VEHI| 0 0| 0 0| 1 1| 0 0| 1 0 | 0 0| 0 0| 0 0| 0 0| 0 0 | 1 0
RAPE
| 0 0| 17 8| 20 15| 3 10| 40 11 | 0 0| 0 0| 0 0| 0 0| 0 0 | 40 10
AGGRAV SODOMY
| 0 0| 1 0| 0 0| 0 0| 1 0 | 0 0| 0 0| 0 0| 0 0| 0 0 | 1 0
AGGRAV SEXUAL BATTER| 0 0| 0 0| 2 1| 0 0| 2 1 | 0 0| 0 0| 0 0| 0 0| 0 0 | 2 1
CHILD MOLESTATION | 0 0| 0 0| 2 1| 0 0| 2 1 | 0 0| 0 0| 0 0| 0 0| 0 0 | 2 1
AGGRAV CHILD MOLESTA| 0 0| 3 1| 2 1| 0 0| 5 1 | 0 0| 0 0| 0 0| 0 0| 0 0 | 5 1
VIOL GA CNTRL SBST A| 0 0| 0 0| 1 1| 0 0| 1 0 | 0 0| 0 0| 0 0| 0 0| 0 0 | 1 0
S/D CONT SUB SCHOOL | 0 0| 1 0| 0 0| 0 0| 1 0 | 0 0| 0 0| 0 0| 0 0| 0 0 | 1 0
S/D COCAINE
| 0 0| 2 1| 1 1| 0 0| 3 1 | 0 0| 0 0| 0 0| 0 0| 0 0 | 3 1
POSS OF COCAINE
| 0 0| 0 0| 3 2| 0 0| 3 1 | 0 0| 0 0| 0 0| 0 0| 0 0 | 3 1
ATT/CONSPRCY COMMT C| 0 0| 1 0| 0 0| 0 0| 1 0 | 0 0| 0 0| 0 0| 0 0| 0 0 | 1 0
------------------------------------------------------------------------------------------------------------------------------------
Total
| 2 | 212 | 134 | 30 | 378
|0|3|2|0|5
| 383
Page 41 Run 10/21/04 9:46 am
Georgia Department of Corrections Office of Planning and Analysis
Inmate statistical profile
Sample: ACTIVE PRISONERS EXCLUDING JAIL Active inmates 10/21/2004
Requestor: Statistics Most Serious Crime Type by current age & sex
|
MEN
|
WOMEN
|
| Age | Age | Age | Age | Men
| Age | Age | Age | Age |Women
|Grand
Crime Type
|00-21 %|22-39 %|40-54 %|55-99 %|Total % |00-21 %|22-39 %|40-54 %|55-99 %|Total % |Total %
------------------------------------------------------------------------------------------------------------------------------------
VIOL/PERSN
| 2 100| 187 88| 102 76| 27 90| 318 84 | 0 0| 3 100| 2 100| 0 0| 5 100 | 323 84
NVIOL/PERS
| 0 0| 0 0| 0 0| 0 0| 0 0 | 0 0| 0 0| 0 0| 0 0| 0 0 | 0 0
PROPERTY
| 0 0| 0 0| 1 1| 0 0| 1 0 | 0 0| 0 0| 0 0| 0 0| 0 0 | 1 0
DRUG SALES
| 0 0| 4 2| 1 1| 0 0| 5 1 | 0 0| 0 0| 0 0| 0 0| 0 0 | 5 1
DRUG POSSN
| 0 0| 0 0| 4 3| 0 0| 4 1 | 0 0| 0 0| 0 0| 0 0| 0 0 | 4 1
ALCOHOL
| 0 0| 0 0| 0 0| 0 0| 0 0 | 0 0| 0 0| 0 0| 0 0| 0 0 | 0 0
HABIT/DUI
| 0 0| 0 0| 0 0| 0 0| 0 0 | 0 0| 0 0| 0 0| 0 0| 0 0 | 0 0
SEX OFFEND
| 0 0| 21 10| 26 19| 3 10| 50 13 | 0 0| 0 0| 0 0| 0 0| 0 0 | 50 13
OTHER
| 0 0| 0 0| 0 0| 0 0| 0 0 | 0 0| 0 0| 0 0| 0 0| 0 0 | 0 0
------------------------------------------------------------------------------------------------------------------------------------
Total
| 2 | 212 | 134 | 30 | 378
|0|3|2|0|5
| 383