- Collection:
- Georgia Government Publications
- Title:
- Inmate statistical profile: active life without parole, 2000-06-01
- Creator:
- Georgia. Department of Corrections. Planning and Analysis Section
- Publisher:
- Atlanta, GA. : Georgia Dept. of Corrections, Office of Planning and Analysis, 2000-06-01
- Date of Original:
- 2000-06-01
- Subject:
- Prisoners--Georgia
- Location:
- United States, Georgia, 32.75042, -83.50018
- Medium:
- state government records
- Type:
- Text
- Format:
- application/pdf
- External Identifiers:
- Call Number GA R300.P5 P1 A26 2000/6
- Metadata URL:
- https://dlg.galileo.usg.edu/id:dlg_ggpd_i-ga-br300-pp5-bp1-ba26-b2000-s6-belec-p-btext
- Digital Object URL:
- https://dlg.galileo.usg.edu/do:dlg_ggpd_i-ga-br300-pp5-bp1-ba26-b2000-s6-belec-p-btext
- Language:
- eng
- Holding Institution:
- University of Georgia. Map and Government Information Library
- Rights:
-

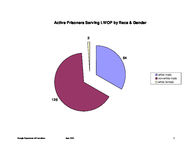
Active Prisoners Serving LWOP by Race & Gender
2
64
white male non-white male white female
126
Georgia Department of Corrections
June, 2000
1
120
103 100
Prior Incarcerations for Inmates Serving Life Without Parole
80
Number of Inmates
60
40
38
20
0
zero
one
20 16
8
two
three
four
Priors
Georgia Department of Corrections
June, 2000
7 five or more
2
Active Inmates Serving LWOP by Crime Type
23 3 3
viol/persn drug sales drug possn sex offend
163
Georgia Department of Corrections
June, 2000
3
Georgia Department of Corrections
Page 1 Run 06/20/00
Office of Planning and Analysis
Inmate statistical profile TABLE OF CONTENTS FOR ACTIVE PRISONERS EXCLUDING JAIL
TITLE ----RACE AND SEX............................ 2 Culture Fair IQ Scores.................. 3 Self-Rpt Socioeconomic Class............ 4 Self-Rpt Environment To Age 16.......... 5 Self-Rpt Education Level................ 6 Functional Reading Level (WRAT Scores).. 7 Functional Math Level (WRAT Scores)..... 8 Functional Spelling Level (WRAT Scores). 9 Self-Rpt Guardian Status To Age 16......10 Self-Rpt Employment Status Before Prison11 Self-Rpt Marital Status At Admission....12 Self-Rpt Number Of Children At Admission13 Self-Rpt Religious Affiliation..........14 Self-Rpt Family Behavior Patterns *.....15 Inmate Diagnostic Behavior Problem *....16 Physical Profile (General Condition)....17 Security Status.........................18 Number Of Sentences.....................19 Number Of Disciplinaries................20 Number Of Escapes.......................21 Number Of Prior Georgia Incarcerations *22 Number Of Transfers.....................23 County Of Conviction....................24 Circuit Of Conviction...................29 Home County.............................31 Prison Sentence In Years................36 Probation To Follow Prison..............37 Admission Type..........................38 Release Type............................39 Inst By Group...........................40 Institution.............................41 Misdemeanors And Felonies...............42 Crimes By Group.........................43 Most Serious Offense....................44 Most Serious Crime Type.................45
PAGE ----
Georgia Department of Corrections
June, 2000
4
Page 2 Run 06/20/00
Georgia Department of Corrections Office of Planning and Analysis
Inmate statistical profile
Sample: ACTIVE PRISONERS EXCLUDING JAIL Active inmates 06/20/2000
Requestor: Statistics RACE AND SEX by current age & sex
|
MEN
|
WOMEN
|
| Age | Age | Age | Age | Men
| Age | Age | Age | Age |Women
|Grand
RACE AND SEX
|00-21 %|22-39 %|40-54 %|55-99 %|Total % |00-21 %|22-39 %|40-54 %|55-99 %|Total % |Total %
------------------------------------------------------------------------------------------------------------------------------------
WHITE MALE
| 1 33| 34 30| 24 39| 5 50| 64 34 | 0 0| 0 0| 0 0| 0 0| 0 0 | 64 33
NON WHITE MALE
| 2 67| 81 70| 38 61| 5 50| 126 66 | 0 0| 0 0| 0 0| 0 0| 0 0 | 126 66
WHITE FEMALE
| 0 0| 0 0| 0 0| 0 0| 0 0 | 0 0| 2 100| 0 0| 0 0| 2 100 | 2 1
NON WHITE FEMALE | 0 0| 0 0| 0 0| 0 0| 0 0 | 0 0| 0 0| 0 0| 0 0| 0 0 | 0 0
------------------------------------------------------------------------------------------------------------------------------------
Total reported
| 3 100| 115 100| 62 100| 10 100| 190 100 | 0 0| 2 100| 0 0| 0 0| 2 100 | 192 100
|
|
|
|
|
|
|
|
|
|
|
Percent reported | 100.0| 100.0| 100.0| 100.0| 100.0 |
.0| 100.0|
.0|
.0| 100.0 | 100.0
|
|
|
|
|
|
|
|
|
|
|
|
|
|
|
|
|
|
|
|
|
|
NOT REPORTED
|0|0|0|0|0
|0|0|0|0|0
|0
------------------------------------------------------------------------------------------------------------------------------------
Total
| 3 | 115 | 62 | 10 | 190
|0|2|0|0|2
| 192
|
|
|
|
|
|
|
|
|
|
|
|
|
|
|
|
|
|
|
|
|
|
|
|
|
|
|
|
|
|
|
|
|
|
|
|
|
|
|
|
|
|
|
|
|
|
|
|
|
|
|
|
|
|
|
AVERAGE AGE
| 20.67 | 30.00 | 45.47 | 60.80 | 36.52 | .00 | 30.00 | .00 | .00 | 30.00 | 36.45
Georgia Department of Corrections
June, 2000
5
Page 3 Run 06/20/00
Georgia Department of Corrections Office of Planning and Analysis
Inmate statistical profile
Sample: ACTIVE PRISONERS EXCLUDING JAIL Active inmates 06/20/2000
Requestor: Statistics Culture Fair IQ Scores by current age & sex
|
MEN
|
WOMEN
|
| Age | Age | Age | Age | Men
| Age | Age | Age | Age |Women
|Grand
IQ Score
|00-21 %|22-39 %|40-54 %|55-99 %|Total % |00-21 %|22-39 %|40-54 %|55-99 %|Total % |Total %
------------------------------------------------------------------------------------------------------------------------------------
LESS THAN 70
| 0 0| 5 5| 8 15| 0 0| 13 8 | 0 0| 0 0| 0 0| 0 0| 0 0 | 13 7
70 AND UP
| 2 100| 103 95| 46 85| 8 100| 159 92 | 0 0| 2 100| 0 0| 0 0| 2 100 | 161 93
------------------------------------------------------------------------------------------------------------------------------------
Total reported
| 2 100| 108 100| 54 100| 8 100| 172 100 | 0 0| 2 100| 0 0| 0 0| 2 100 | 174 100
|
|
|
|
|
|
|
|
|
|
|
Percent reported |
66.7|
93.9|
87.1|
80.0|
90.5 |
.0| 100.0|
.0|
.0| 100.0 |
90.6
|
|
|
|
|
|
|
|
|
|
|
|
|
|
|
|
|
|
|
|
|
|
NOT REPORTED
| 1 | 7 | 8 | 2 | 18
|0|0|0|0|0
| 18
------------------------------------------------------------------------------------------------------------------------------------
Total
| 3 | 115 | 62 | 10 | 190
|0|2|0|0|2
| 192
|
|
|
|
|
|
|
|
|
|
|
|
|
|
|
|
|
|
|
|
|
|
|
|
|
|
|
|
|
|
|
|
|
|
|
|
|
|
|
|
|
|
|
|
|
|
|
|
|
|
|
|
|
|
|
AVERAGE IQ
| 106.50 | 100.08 | 95.26 | 91.75 | 98.26 | .00 | 107.00 | .00 | .00 | 107.00 | 98.36
Georgia Department of Corrections
June, 2000
6
Page 4 Run 06/20/00
Georgia Department of Corrections Office of Planning and Analysis
Inmate statistical profile
Sample: ACTIVE PRISONERS EXCLUDING JAIL
Requestor: Statistics
Active inmates 06/20/2000
Self-Rpt Socioeconomic Class by current age & sex
|
MEN
|
WOMEN
|
| Age | Age | Age | Age | Men
| Age | Age | Age | Age |Women
|Grand
Socioeconomic Class |00-21 %|22-39 %|40-54 %|55-99 %|Total % |00-21 %|22-39 %|40-54 %|55-99 %|Total % |Total %
------------------------------------------------------------------------------------------------------------------------------------
WELFARE
| 0 0| 5 4| 1 2| 0 0| 6 3 | 0 0| 0 0| 0 0| 0 0| 0 0 | 6 3
OCC EMPLOY
| 0 0| 6 5| 2 3| 0 0| 8 4 | 0 0| 0 0| 0 0| 0 0| 0 0 | 8 4
MINIMUM STD
| 3 100| 65 58| 27 44| 7 70| 102 55 | 0 0| 0 0| 0 0| 0 0| 0 0 | 102 54
MIDDLE
| 0 0| 36 32| 30 49| 3 30| 69 37 | 0 0| 1 50| 0 0| 0 0| 1 50 | 70 37
OTHER
| 0 0| 1 1| 1 2| 0 0| 2 1 | 0 0| 1 50| 0 0| 0 0| 1 50 | 3 2
------------------------------------------------------------------------------------------------------------------------------------
Total reported
| 3 100| 113 100| 61 100| 10 100| 187 100 | 0 0| 2 100| 0 0| 0 0| 2 100 | 189 100
|
|
|
|
|
|
|
|
|
|
|
Percent reported | 100.0|
98.3|
98.4| 100.0|
98.4 |
.0| 100.0|
.0|
.0| 100.0 |
98.4
|
|
|
|
|
|
|
|
|
|
|
|
|
|
|
|
|
|
|
|
|
|
NOT RPTD
|0|2|1|0|3
|0|0|0|0|0
|3
------------------------------------------------------------------------------------------------------------------------------------
Total
| 3 | 115 | 62 | 10 | 190
|0|2|0|0|2
| 192
Georgia Department of Corrections
June, 2000
7
Page 5 Run 06/20/00
Georgia Department of Corrections Office of Planning and Analysis
Inmate statistical profile
Sample: ACTIVE PRISONERS EXCLUDING JAIL
Requestor: Statistics
Active inmates 06/20/2000
Self-Rpt Environment To Age 16 by current age & sex
|
MEN
|
WOMEN
|
| Age | Age | Age | Age | Men
| Age | Age | Age | Age |Women
|Grand
Environment
|00-21 %|22-39 %|40-54 %|55-99 %|Total % |00-21 %|22-39 %|40-54 %|55-99 %|Total % |Total %
------------------------------------------------------------------------------------------------------------------------------------
RURAL/FARM
| 0 0| 0 0| 3 5| 2 20| 5 3 | 0 0| 0 0| 0 0| 0 0| 0 0 | 5 3
RURAL/NFARM
| 0 0| 11 10| 4 7| 1 10| 16 9 | 0 0| 1 50| 0 0| 0 0| 1 50 | 17 9
S.M.S.A
| 0 0| 50 45| 20 33| 4 40| 74 40 | 0 0| 0 0| 0 0| 0 0| 0 0 | 74 40
URBAN
| 0 0| 18 16| 12 20| 0 0| 30 16 | 0 0| 0 0| 0 0| 0 0| 0 0 | 30 16
SMALL TOWN
| 3 100| 31 28| 22 36| 3 30| 59 32 | 0 0| 1 50| 0 0| 0 0| 1 50 | 60 32
OTHER
| 0 0| 1 1| 0 0| 0 0| 1 1 | 0 0| 0 0| 0 0| 0 0| 0 0 | 1 1
------------------------------------------------------------------------------------------------------------------------------------
Total reported
| 3 100| 111 100| 61 100| 10 100| 185 100 | 0 0| 2 100| 0 0| 0 0| 2 100 | 187 100
|
|
|
|
|
|
|
|
|
|
|
Percent reported | 100.0|
96.5|
98.4| 100.0|
97.4 |
.0| 100.0|
.0|
.0| 100.0 |
97.4
|
|
|
|
|
|
|
|
|
|
|
|
|
|
|
|
|
|
|
|
|
|
NOT RPTD
|0|4|1|0|5
|0|0|0|0|0
|5
------------------------------------------------------------------------------------------------------------------------------------
Total
| 3 | 115 | 62 | 10 | 190
|0|2|0|0|2
| 192
Georgia Department of Corrections
June, 2000
8
Page 6 Run 06/20/00
Georgia Department of Corrections Office of Planning and Analysis
Inmate statistical profile
Sample: ACTIVE PRISONERS EXCLUDING JAIL Active inmates 06/20/2000
Requestor: Statistics Self-Rpt Education Level by current age & sex
|
MEN
|
WOMEN
|
| Age | Age | Age | Age | Men
| Age | Age | Age | Age |Women
|Grand
Education Level
|00-21 %|22-39 %|40-54 %|55-99 %|Total % |00-21 %|22-39 %|40-54 %|55-99 %|Total % |Total %
------------------------------------------------------------------------------------------------------------------------------------
LESS THAN GRADE 7 | 0 0| 2 2| 3 5| 2 20| 7 4 | 0 0| 0 0| 0 0| 0 0| 0 0 | 7 4
GRADE 7
| 0 0| 3 3| 5 8| 1 10| 9 5 | 0 0| 0 0| 0 0| 0 0| 0 0 | 9 5
GRADE 8
| 2 67| 15 13| 3 5| 4 40| 24 13 | 0 0| 0 0| 0 0| 0 0| 0 0 | 24 13
GRADE 9
| 1 33| 18 16| 9 15| 1 10| 29 15 | 0 0| 0 0| 0 0| 0 0| 0 0 | 29 15
GRADE 10
| 0 0| 30 26| 8 13| 0 0| 38 20 | 0 0| 0 0| 0 0| 0 0| 0 0 | 38 20
GRADE 11
| 0 0| 15 13| 5 8| 0 0| 20 11 | 0 0| 2 100| 0 0| 0 0| 2 100 | 22 12
GRADE 12
| 0 0| 16 14| 5 8| 1 10| 22 12 | 0 0| 0 0| 0 0| 0 0| 0 0 | 22 12
MORE THAN GRADE 12 | 0 0| 16 14| 23 38| 1 10| 40 21 | 0 0| 0 0| 0 0| 0 0| 0 0 | 40 21
------------------------------------------------------------------------------------------------------------------------------------
Total reported
| 3 100| 115 100| 61 100| 10 100| 189 100 | 0 0| 2 100| 0 0| 0 0| 2 100 | 191 100
|
|
|
|
|
|
|
|
|
|
|
Percent reported | 100.0| 100.0|
98.4| 100.0|
99.5 |
.0| 100.0|
.0|
.0| 100.0 |
99.5
|
|
|
|
|
|
|
|
|
|
|
|
|
|
|
|
|
|
|
|
|
|
NOT REPORTED
|0|0|1|0|1
|0|0|0|0|0
|1
------------------------------------------------------------------------------------------------------------------------------------
Total
| 3 | 115 | 62 | 10 | 190
|0|2|0|0|2
| 192
|
|
|
|
|
|
|
|
|
|
|
|
|
|
|
|
|
|
|
|
|
|
|
|
|
|
|
|
|
|
|
|
|
|
|
|
|
|
|
|
|
|
|
|
|
|
|
|
|
|
|
|
|
|
|
AVG EDUCATION LEVEL | 8.33 | 11.81 | 12.57 | 10.10 | 11.91 | .00 | 11.00 | .00 | .00 | 11.00 | 11.90
* NOTE: THE FIELD LABLED "LESS THAN GRADE 7" WAS CORRECTED IN MARCH 1989: MISSING DATA FOR INMATES STILL IN DIAGNOSTICS NOW HAS BEEN REMOVED FROM THIS FIELD AND IDENTIFIED AS "NOT REPORTED" INFORMATION.
Georgia Department of Corrections
June, 2000
9
Page 7 Run 06/20/00
Georgia Department of Corrections Office of Planning and Analysis
Inmate statistical profile
Sample: ACTIVE PRISONERS EXCLUDING JAIL
Requestor: Statistics
Active inmates 06/20/2000
Functional Reading Level (WRAT Scores) by current age & sex
|
MEN
|
WOMEN
|
| Age | Age | Age | Age | Men
| Age | Age | Age | Age |Women
|Grand
WRAT Reading Score |00-21 %|22-39 %|40-54 %|55-99 %|Total % |00-21 %|22-39 %|40-54 %|55-99 %|Total % |Total %
------------------------------------------------------------------------------------------------------------------------------------
LESS THAN GRADE 6 | 1 50| 37 34| 20 37| 5 63| 63 36 | 0 0| 1 50| 0 0| 0 0| 1 50 | 64 37
6TH THRU 8TH GRADE | 0 0| 22 20| 9 17| 2 25| 33 19 | 0 0| 0 0| 0 0| 0 0| 0 0 | 33 19
GRADE 9
| 0 0| 13 12| 3 6| 0 0| 16 9 | 0 0| 0 0| 0 0| 0 0| 0 0 | 16 9
GRADE 10
| 1 50| 3 3| 3 6| 0 0| 7 4 | 0 0| 0 0| 0 0| 0 0| 0 0 | 7 4
GRADE 11
| 0 0| 5 5| 4 7| 0 0| 9 5 | 0 0| 0 0| 0 0| 0 0| 0 0 | 9 5
GRADE 12
| 0 0| 19 17| 11 20| 1 13| 31 18 | 0 0| 0 0| 0 0| 0 0| 0 0 | 31 18
MORE THAN GRADE 12 | 0 0| 10 9| 4 7| 0 0| 14 8 | 0 0| 1 50| 0 0| 0 0| 1 50 | 15 9
------------------------------------------------------------------------------------------------------------------------------------
Total reported
| 2 100| 109 100| 54 100| 8 100| 173 100 | 0 0| 2 100| 0 0| 0 0| 2 100 | 175 100
|
|
|
|
|
|
|
|
|
|
|
Percent reported |
66.7|
94.8|
87.1|
80.0|
91.1 |
.0| 100.0|
.0|
.0| 100.0 |
91.1
|
|
|
|
|
|
|
|
|
|
|
|
|
|
|
|
|
|
|
|
|
|
NOT REPORTED
| 1 | 6 | 8 | 2 | 17
|0|0|0|0|0
| 17
------------------------------------------------------------------------------------------------------------------------------------
Total
| 3 | 115 | 62 | 10 | 190
|0|2|0|0|2
| 192
|
|
|
|
|
|
|
|
|
|
|
|
|
|
|
|
|
|
|
|
|
|
|
|
|
|
|
|
|
|
|
|
|
|
|
|
|
|
|
|
|
|
|
|
|
|
|
|
|
|
|
|
|
|
|
AVG READING SCORE | 7.45 | 8.03 | 7.84 | 5.14 | 7.83 | .00 | 9.10 | .00 | .00 | 9.10 | 7.85
Georgia Department of Corrections
June, 2000
10
Page 8 Run 06/20/00
Georgia Department of Corrections Office of Planning and Analysis
Inmate statistical profile
Sample: ACTIVE PRISONERS EXCLUDING JAIL
Requestor: Statistics
Active inmates 06/20/2000
Functional Math Level (WRAT Scores) by current age & sex
|
MEN
|
WOMEN
|
| Age | Age | Age | Age | Men
| Age | Age | Age | Age |Women
|Grand
WRAT Math Score
|00-21 %|22-39 %|40-54 %|55-99 %|Total % |00-21 %|22-39 %|40-54 %|55-99 %|Total % |Total %
------------------------------------------------------------------------------------------------------------------------------------
LESS THAN GRADE 6 | 1 50| 39 36| 28 52| 6 75| 74 43 | 0 0| 0 0| 0 0| 0 0| 0 0 | 74 42
6TH THRU 8TH GRADE | 1 50| 46 42| 15 28| 1 13| 63 36 | 0 0| 0 0| 0 0| 0 0| 0 0 | 63 36
GRADE 9
| 0 0| 11 10| 3 6| 0 0| 14 8 | 0 0| 1 50| 0 0| 0 0| 1 50 | 15 9
GRADE 10
| 0 0| 8 7| 3 6| 1 13| 12 7 | 0 0| 0 0| 0 0| 0 0| 0 0 | 12 7
GRADE 11
| 0 0| 2 2| 1 2| 0 0| 3 2 | 0 0| 0 0| 0 0| 0 0| 0 0 | 3 2
GRADE 12
| 0 0| 2 2| 3 6| 0 0| 5 3 | 0 0| 0 0| 0 0| 0 0| 0 0 | 5 3
MORE THAN GRADE 12 | 0 0| 1 1| 1 2| 0 0| 2 1 | 0 0| 1 50| 0 0| 0 0| 1 50 | 3 2
------------------------------------------------------------------------------------------------------------------------------------
Total reported
| 2 100| 109 100| 54 100| 8 100| 173 100 | 0 0| 2 100| 0 0| 0 0| 2 100 | 175 100
|
|
|
|
|
|
|
|
|
|
|
Percent reported |
66.7|
94.8|
87.1|
80.0|
91.1 |
.0| 100.0|
.0|
.0| 100.0 |
91.1
|
|
|
|
|
|
|
|
|
|
|
|
|
|
|
|
|
|
|
|
|
|
NOT REPORTED
| 1 | 6 | 8 | 2 | 17
|0|0|0|0|0
| 17
------------------------------------------------------------------------------------------------------------------------------------
Total
| 3 | 115 | 62 | 10 | 190
|0|2|0|0|2
| 192
|
|
|
|
|
|
|
|
|
|
|
|
|
|
|
|
|
|
|
|
|
|
|
|
|
|
|
|
|
|
|
|
|
|
|
|
|
|
|
|
|
|
|
|
|
|
|
|
|
|
|
|
|
|
|
AVG MATH SCORE
| 6.20 | 6.88 | 6.37 | 4.40 | 6.60 | .00 | 11.40 | .00 | .00 | 11.40 | 6.66
Georgia Department of Corrections
June, 2000
11
Page 9 Run 06/20/00
Georgia Department of Corrections Office of Planning and Analysis
Inmate statistical profile
Sample: ACTIVE PRISONERS EXCLUDING JAIL
Requestor: Statistics
Active inmates 06/20/2000
Functional Spelling Level (WRAT Scores) by current age & sex
|
MEN
|
WOMEN
|
| Age | Age | Age | Age | Men
| Age | Age | Age | Age |Women
|Grand
WRAT Spelling Score |00-21 %|22-39 %|40-54 %|55-99 %|Total % |00-21 %|22-39 %|40-54 %|55-99 %|Total % |Total %
------------------------------------------------------------------------------------------------------------------------------------
LESS THAN GRADE 6 | 2 100| 42 39| 29 54| 5 63| 78 45 | 0 0| 0 0| 0 0| 0 0| 0 0 | 78 45
6TH THRU 8TH GRADE | 0 0| 30 28| 13 24| 1 13| 44 25 | 0 0| 1 50| 0 0| 0 0| 1 50 | 45 26
GRADE 9
| 0 0| 12 11| 3 6| 1 13| 16 9 | 0 0| 0 0| 0 0| 0 0| 0 0 | 16 9
GRADE 10
| 0 0| 8 7| 0 0| 0 0| 8 5 | 0 0| 0 0| 0 0| 0 0| 0 0 | 8 5
GRADE 11
| 0 0| 4 4| 3 6| 0 0| 7 4 | 0 0| 0 0| 0 0| 0 0| 0 0 | 7 4
GRADE 12
| 0 0| 10 9| 3 6| 1 13| 14 8 | 0 0| 0 0| 0 0| 0 0| 0 0 | 14 8
MORE THAN GRADE 12 | 0 0| 3 3| 3 6| 0 0| 6 3 | 0 0| 1 50| 0 0| 0 0| 1 50 | 7 4
------------------------------------------------------------------------------------------------------------------------------------
Total reported
| 2 100| 109 100| 54 100| 8 100| 173 100 | 0 0| 2 100| 0 0| 0 0| 2 100 | 175 100
|
|
|
|
|
|
|
|
|
|
|
Percent reported |
66.7|
94.8|
87.1|
80.0|
91.1 |
.0| 100.0|
.0|
.0| 100.0 |
91.1
|
|
|
|
|
|
|
|
|
|
|
|
|
|
|
|
|
|
|
|
|
|
NOT REPORTED
| 1 | 6 | 8 | 2 | 17
|0|0|0|0|0
| 17
------------------------------------------------------------------------------------------------------------------------------------
Total
| 3 | 115 | 62 | 10 | 190
|0|2|0|0|2
| 192
|
|
|
|
|
|
|
|
|
|
|
|
|
|
|
|
|
|
|
|
|
|
|
|
|
|
|
|
|
|
|
|
|
|
|
|
|
|
|
|
|
|
|
|
|
|
|
|
|
|
|
|
|
|
|
AVG SPELLING SCORE | 4.80 | 7.14 | 6.08 | 5.00 | 6.68 | .00 | 9.70 | .00 | .00 | 9.70 | 6.71
Georgia Department of Corrections
June, 2000
12
Page 10 Run 06/20/00
Georgia Department of Corrections Office of Planning and Analysis
Inmate statistical profile
Sample: ACTIVE PRISONERS EXCLUDING JAIL
Requestor: Statistics
Active inmates 06/20/2000
Self-Rpt Guardian Status To Age 16 by current age & sex
|
MEN
|
WOMEN
|
| Age | Age | Age | Age | Men
| Age | Age | Age | Age |Women
|Grand
Guardian Status
|00-21 %|22-39 %|40-54 %|55-99 %|Total % |00-21 %|22-39 %|40-54 %|55-99 %|Total % |Total %
------------------------------------------------------------------------------------------------------------------------------------
ORPHANAGE
| 0 0| 0 0| 0 0| 0 0| 0 0 | 0 0| 0 0| 0 0| 0 0| 0 0 | 0 0
FATHER ONLY
| 1 33| 5 4| 1 2| 0 0| 7 4 | 0 0| 0 0| 0 0| 0 0| 0 0 | 7 4
FTR MTR HD
| 2 67| 6 5| 2 3| 0 0| 10 5 | 0 0| 0 0| 0 0| 0 0| 0 0 | 10 5
MOTHER ONLY
| 0 0| 42 37| 19 31| 3 30| 64 34 | 0 0| 0 0| 0 0| 0 0| 0 0 | 64 34
MTR FTR HD
| 0 0| 34 30| 26 43| 5 50| 65 34 | 0 0| 2 100| 0 0| 0 0| 2 100 | 67 35
OTH FEMALE
| 0 0| 5 4| 4 7| 0 0| 9 5 | 0 0| 0 0| 0 0| 0 0| 0 0 | 9 5
OTH MALE
| 0 0| 0 0| 0 0| 0 0| 0 0 | 0 0| 0 0| 0 0| 0 0| 0 0 | 0 0
STEP-PARNTS
| 0 0| 2 2| 2 3| 0 0| 4 2 | 0 0| 0 0| 0 0| 0 0| 0 0 | 4 2
FOSTER HOME
| 0 0| 6 5| 0 0| 1 10| 7 4 | 0 0| 0 0| 0 0| 0 0| 0 0 | 7 4
GRAND PRNTS
| 0 0| 9 8| 4 7| 1 10| 14 7 | 0 0| 0 0| 0 0| 0 0| 0 0 | 14 7
OTHER
| 0 0| 6 5| 3 5| 0 0| 9 5 | 0 0| 0 0| 0 0| 0 0| 0 0 | 9 5
------------------------------------------------------------------------------------------------------------------------------------
Total reported
| 3 100| 115 100| 61 100| 10 100| 189 100 | 0 0| 2 100| 0 0| 0 0| 2 100 | 191 100
|
|
|
|
|
|
|
|
|
|
|
Percent reported | 100.0| 100.0|
98.4| 100.0|
99.5 |
.0| 100.0|
.0|
.0| 100.0 |
99.5
|
|
|
|
|
|
|
|
|
|
|
|
|
|
|
|
|
|
|
|
|
|
NOT RPTD
|0|0|1|0|1
|0|0|0|0|0
|1
------------------------------------------------------------------------------------------------------------------------------------
Total
| 3 | 115 | 62 | 10 | 190
|0|2|0|0|2
| 192
Georgia Department of Corrections
June, 2000
13
Page 11 Run 06/20/00
Georgia Department of Corrections Office of Planning and Analysis
Inmate statistical profile
Sample: ACTIVE PRISONERS EXCLUDING JAIL
Requestor: Statistics
Active inmates 06/20/2000
Self-Rpt Employment Status Before Prison by current age & sex
|
MEN
|
WOMEN
|
| Age | Age | Age | Age | Men
| Age | Age | Age | Age |Women
|Grand
Employment
|00-21 %|22-39 %|40-54 %|55-99 %|Total % |00-21 %|22-39 %|40-54 %|55-99 %|Total % |Total %
------------------------------------------------------------------------------------------------------------------------------------
FULL TIME
| 0 0| 62 56| 38 68| 4 44| 104 58 | 0 0| 2 100| 0 0| 0 0| 2 100 | 106 59
PART TIME
| 0 0| 6 5| 1 2| 0 0| 7 4 | 0 0| 0 0| 0 0| 0 0| 0 0 | 7 4
UNEMPL < 6M
| 0 0| 14 13| 7 13| 0 0| 21 12 | 0 0| 0 0| 0 0| 0 0| 0 0 | 21 12
UNEMPL > 6M
| 1 33| 23 21| 8 14| 2 22| 34 19 | 0 0| 0 0| 0 0| 0 0| 0 0 | 34 19
NEVER WORKD
| 2 67| 4 4| 1 2| 1 11| 8 4 | 0 0| 0 0| 0 0| 0 0| 0 0 | 8 4
STUDENT
| 0 0| 0 0| 0 0| 0 0| 0 0 | 0 0| 0 0| 0 0| 0 0| 0 0 | 0 0
INCAPABLE
| 0 0| 1 1| 1 2| 2 22| 4 2 | 0 0| 0 0| 0 0| 0 0| 0 0 | 4 2
OTHER
| 0 0| 0 0| 0 0| 0 0| 0 0 | 0 0| 0 0| 0 0| 0 0| 0 0 | 0 0
------------------------------------------------------------------------------------------------------------------------------------
Total reported
| 3 100| 110 100| 56 100| 9 100| 178 100 | 0 0| 2 100| 0 0| 0 0| 2 100 | 180 100
|
|
|
|
|
|
|
|
|
|
|
Percent reported | 100.0|
95.7|
90.3|
90.0|
93.7 |
.0| 100.0|
.0|
.0| 100.0 |
93.8
|
|
|
|
|
|
|
|
|
|
|
|
|
|
|
|
|
|
|
|
|
|
NOT RPTD
| 0 | 5 | 6 | 1 | 12
|0|0|0|0|0
| 12
------------------------------------------------------------------------------------------------------------------------------------
Total
| 3 | 115 | 62 | 10 | 190
|0|2|0|0|2
| 192
* NOTE: THE FIELD LABELD "OTHER" WAS CORRECTED IN APRIL 1989; INMATES CODED "PRE-OTIS NOT REPORTED" NOW HAVE BEEN REMOVED FROM THIS FIELD AND IDENTIFIED AS "NOT REPORTED".
Georgia Department of Corrections
June, 2000
14
Page 12 Run 06/20/00
Georgia Department of Corrections Office of Planning and Analysis
Inmate statistical profile
Sample: ACTIVE PRISONERS EXCLUDING JAIL
Requestor: Statistics
Active inmates 06/20/2000
Self-Rpt Marital Status At Admission by current age & sex
|
MEN
|
WOMEN
|
| Age | Age | Age | Age | Men
| Age | Age | Age | Age |Women
|Grand
Marital Status
|00-21 %|22-39 %|40-54 %|55-99 %|Total % |00-21 %|22-39 %|40-54 %|55-99 %|Total % |Total %
------------------------------------------------------------------------------------------------------------------------------------
SINGLE
| 3 100| 78 68| 22 36| 0 0| 103 54 | 0 0| 1 50| 0 0| 0 0| 1 50 | 104 54
MARRIED
| 0 0| 9 8| 13 21| 4 40| 26 14 | 0 0| 0 0| 0 0| 0 0| 0 0 | 26 14
SEPARATED
| 0 0| 2 2| 4 7| 2 20| 8 4 | 0 0| 0 0| 0 0| 0 0| 0 0 | 8 4
DIVORCED
| 0 0| 6 5| 12 20| 2 20| 20 11 | 0 0| 0 0| 0 0| 0 0| 0 0 | 20 10
WIDOWED
| 0 0| 4 3| 4 7| 1 10| 9 5 | 0 0| 1 50| 0 0| 0 0| 1 50 | 10 5
COMMON LAW
| 0 0| 16 14| 6 10| 1 10| 23 12 | 0 0| 0 0| 0 0| 0 0| 0 0 | 23 12
OTHER
| 0 0| 0 0| 0 0| 0 0| 0 0 | 0 0| 0 0| 0 0| 0 0| 0 0 | 0 0
------------------------------------------------------------------------------------------------------------------------------------
Total reported
| 3 100| 115 100| 61 100| 10 100| 189 100 | 0 0| 2 100| 0 0| 0 0| 2 100 | 191 100
|
|
|
|
|
|
|
|
|
|
|
Percent reported | 100.0| 100.0|
98.4| 100.0|
99.5 |
.0| 100.0|
.0|
.0| 100.0 |
99.5
|
|
|
|
|
|
|
|
|
|
|
|
|
|
|
|
|
|
|
|
|
|
NOT RPTD
|0|0|1|0|1
|0|0|0|0|0
|1
------------------------------------------------------------------------------------------------------------------------------------
Total
| 3 | 115 | 62 | 10 | 190
|0|2|0|0|2
| 192
Georgia Department of Corrections
June, 2000
15
Page 13 Run 06/20/00
Georgia Department of Corrections Office of Planning and Analysis
Inmate statistical profile
Sample: ACTIVE PRISONERS EXCLUDING JAIL
Requestor: Statistics
Active inmates 06/20/2000
Self-Rpt Number Of Children At Admission by current age & sex
|
MEN
|
WOMEN
|
| Age | Age | Age | Age | Men
| Age | Age | Age | Age |Women
|Grand
Number Of Children |00-21 %|22-39 %|40-54 %|55-99 %|Total % |00-21 %|22-39 %|40-54 %|55-99 %|Total % |Total %
------------------------------------------------------------------------------------------------------------------------------------
NO CHILDREN
| 0 0| 1 1| 0 0| 0 0| 1 1 | 0 0| 0 0| 0 0| 0 0| 0 0 | 1 1
ONE CHILD
| 1 100| 32 44| 13 30| 5 56| 51 40 | 0 0| 0 0| 0 0| 0 0| 0 0 | 51 40
TWO CHILDREN
| 0 0| 22 30| 16 36| 0 0| 38 30 | 0 0| 1 100| 0 0| 0 0| 1 100 | 39 30
THREE CHILDREN
| 0 0| 10 14| 10 23| 0 0| 20 16 | 0 0| 0 0| 0 0| 0 0| 0 0 | 20 16
FOUR CHILDREN
| 0 0| 6 8| 2 5| 2 22| 10 8 | 0 0| 0 0| 0 0| 0 0| 0 0 | 10 8
FIVE CHILDREN
| 0 0| 1 1| 2 5| 0 0| 3 2 | 0 0| 0 0| 0 0| 0 0| 0 0 | 3 2
MORE THAN 5 CHILDREN| 0 0| 1 1| 1 2| 2 22| 4 3 | 0 0| 0 0| 0 0| 0 0| 0 0 | 4 3
------------------------------------------------------------------------------------------------------------------------------------
Total reported
| 1 100| 73 100| 44 100| 9 100| 127 100 | 0 0| 1 100| 0 0| 0 0| 1 100 | 128 100
|
|
|
|
|
|
|
|
|
|
|
Percent reported |
33.3|
63.5|
71.0|
90.0|
66.8 |
.0|
50.0|
.0|
.0|
50.0 |
66.7
|
|
|
|
|
|
|
|
|
|
|
|
|
|
|
|
|
|
|
|
|
|
NOT REPORTED
| 2 | 42 | 18 | 1 | 63
|0|1|0|0|1
| 64
------------------------------------------------------------------------------------------------------------------------------------
Total
| 3 | 115 | 62 | 10 | 190
|0|2|0|0|2
| 192
|
|
|
|
|
|
|
|
|
|
|
|
|
|
|
|
|
|
|
|
|
|
|
|
|
|
|
|
|
|
|
|
|
|
|
|
|
|
|
|
|
|
|
|
|
|
|
|
|
|
|
|
|
|
|
AVG NUM CHILDREN | 1.00 | 1.93 | 2.36 | 3.33 | 2.17 | .00 | 2.00 | .00 | .00 | 2.00 | 2.17
* NOTE: THE FIELD LABLED "NO CHILDREN" WAS CORRECTED IN MARCH 1989: MISSING DATA FOR INMATES STILL IN DIAGNOSTICS NOW HAS BEEN REMOVED FROM THIS FIELD AND IDENTIFIED AS "NOT REPORTED" INFORMATION.
Georgia Department of Corrections
June, 2000
16
Page 14 Run 06/20/00
Georgia Department of Corrections Office of Planning and Analysis
Inmate statistical profile
Sample: ACTIVE PRISONERS EXCLUDING JAIL
Requestor: Statistics
Active inmates 06/20/2000
Self-Rpt Religious Affiliation by current age & sex
|
MEN
|
WOMEN
|
| Age | Age | Age | Age | Men
| Age | Age | Age | Age |Women
|Grand
Religion
|00-21 %|22-39 %|40-54 %|55-99 %|Total % |00-21 %|22-39 %|40-54 %|55-99 %|Total % |Total %
------------------------------------------------------------------------------------------------------------------------------------
ISLAM
| 0 0| 9 8| 4 7| 0 0| 13 7 | 0 0| 0 0| 0 0| 0 0| 0 0 | 13 7
CATHOLIC
| 0 0| 2 2| 2 3| 0 0| 4 2 | 0 0| 0 0| 0 0| 0 0| 0 0 | 4 2
BAPTIST
| 0 0| 47 42| 33 54| 6 60| 86 46 | 0 0| 1 50| 0 0| 0 0| 1 50 | 87 46
METHODIST
| 0 0| 1 1| 1 2| 0 0| 2 1 | 0 0| 0 0| 0 0| 0 0| 0 0 | 2 1
EPISCOPLN
| 0 0| 0 0| 0 0| 0 0| 0 0 | 0 0| 0 0| 0 0| 0 0| 0 0 | 0 0
PRESBYTRN
| 0 0| 0 0| 0 0| 0 0| 0 0 | 0 0| 0 0| 0 0| 0 0| 0 0 | 0 0
CHC OF GOD
| 0 0| 1 1| 0 0| 0 0| 1 1 | 0 0| 0 0| 0 0| 0 0| 0 0 | 1 1
HOLINESS
| 0 0| 1 1| 1 2| 1 10| 3 2 | 0 0| 1 50| 0 0| 0 0| 1 50 | 4 2
JEWISH
| 0 0| 1 1| 0 0| 0 0| 1 1 | 0 0| 0 0| 0 0| 0 0| 0 0 | 1 1
ANGLICAN
| 0 0| 0 0| 0 0| 0 0| 0 0 | 0 0| 0 0| 0 0| 0 0| 0 0 | 0 0
GRK ORTHDX
| 0 0| 0 0| 0 0| 0 0| 0 0 | 0 0| 0 0| 0 0| 0 0| 0 0 | 0 0
HINDU
| 0 0| 0 0| 0 0| 0 0| 0 0 | 0 0| 0 0| 0 0| 0 0| 0 0 | 0 0
BUDDHIST
| 0 0| 0 0| 0 0| 0 0| 0 0 | 0 0| 0 0| 0 0| 0 0| 0 0 | 0 0
TAOIST
| 0 0| 0 0| 0 0| 0 0| 0 0 | 0 0| 0 0| 0 0| 0 0| 0 0 | 0 0
SHINTOIST
| 0 0| 0 0| 0 0| 0 0| 0 0 | 0 0| 0 0| 0 0| 0 0| 0 0 | 0 0
SEVEN D AD
| 0 0| 0 0| 2 3| 0 0| 2 1 | 0 0| 0 0| 0 0| 0 0| 0 0 | 2 1
JEHOVAH WT
| 0 0| 2 2| 1 2| 0 0| 3 2 | 0 0| 0 0| 0 0| 0 0| 0 0 | 3 2
LATR DAY S
| 0 0| 0 0| 0 0| 0 0| 0 0 | 0 0| 0 0| 0 0| 0 0| 0 0 | 0 0
QUAKER
| 0 0| 0 0| 0 0| 0 0| 0 0 | 0 0| 0 0| 0 0| 0 0| 0 0 | 0 0
OTHER PROD
| 0 0| 12 11| 5 8| 0 0| 17 9 | 0 0| 0 0| 0 0| 0 0| 0 0 | 17 9
NONE
| 2 67| 25 22| 10 16| 3 30| 40 21 | 0 0| 0 0| 0 0| 0 0| 0 0 | 40 21
OTHER
| 1 33| 12 11| 2 3| 0 0| 15 8 | 0 0| 0 0| 0 0| 0 0| 0 0 | 15 8
------------------------------------------------------------------------------------------------------------------------------------
Total reported
| 3 100| 113 100| 61 100| 10 100| 187 100 | 0 0| 2 100| 0 0| 0 0| 2 100 | 189 100
|
|
|
|
|
|
|
|
|
|
|
Percent reported | 100.0|
98.3|
98.4| 100.0|
98.4 |
.0| 100.0|
.0|
.0| 100.0 |
98.4
|
|
|
|
|
|
|
|
|
|
|
|
|
|
|
|
|
|
|
|
|
|
NOT RPTD
|0|2|1|0|3
|0|0|0|0|0
|3
------------------------------------------------------------------------------------------------------------------------------------
Total
| 3 | 115 | 62 | 10 | 190
|0|2|0|0|2
| 192
Georgia Department of Corrections
June, 2000
17
Page 15 Run 06/20/00
Georgia Department of Corrections Office of Planning and Analysis
Inmate statistical profile
Sample: ACTIVE PRISONERS EXCLUDING JAIL
Requestor: Statistics
Active inmates 06/20/2000
Self-Rpt Family Behavior Patterns * by current age & sex
|
MEN
|
WOMEN
|
| Age | Age | Age | Age | Men
| Age | Age | Age | Age |Women
|Grand
Family Behavior
|00-21 %|22-39 %|40-54 %|55-99 %|Total % |00-21 %|22-39 %|40-54 %|55-99 %|Total % |Total %
------------------------------------------------------------------------------------------------------------------------------------
CRIMINLTY
| 0 0| 36 19| 21 23| 2 17| 59 20 | 0 0| 1 17| 0 0| 0 0| 1 17 | 60 20
ALCOHOLISM
| 2 40| 25 13| 16 17| 1 8| 44 15 | 0 0| 1 17| 0 0| 0 0| 1 17 | 45 15
DRUG ABUSE
| 2 40| 15 8| 9 10| 0 0| 26 9 | 0 0| 1 17| 0 0| 0 0| 1 17 | 27 9
DOMINERING
| 0 0| 1 1| 0 0| 0 0| 1 0 | 0 0| 1 17| 0 0| 0 0| 1 17 | 2 1
MIGRANT
| 0 0| 2 1| 1 1| 0 0| 3 1 | 0 0| 0 0| 0 0| 0 0| 0 0 | 3 1
INFL BTGS
| 0 0| 11 6| 4 4| 2 17| 17 6 | 0 0| 0 0| 0 0| 0 0| 0 0 | 17 6
PERMISSIVE
| 0 0| 0 0| 0 0| 0 0| 0 0 | 0 0| 1 17| 0 0| 0 0| 1 17 | 1 0
FATH ABSNT
| 0 0| 67 36| 29 32| 5 42| 101 34 | 0 0| 0 0| 0 0| 0 0| 0 0 | 101 33
MOTH ABSNT
| 1 20| 26 14| 11 12| 2 17| 40 14 | 0 0| 0 0| 0 0| 0 0| 0 0 | 40 13
NONE
| 0 0| 4 2| 1 1| 0 0| 5 2 | 0 0| 1 17| 0 0| 0 0| 1 17 | 6 2
------------------------------------------------------------------------------------------------------------------------------------
Total reported
| 5 100| 187 100| 92 100| 12 100| 296 100 | 0 0| 6 100| 0 0| 0 0| 6 100 | 302 100
|
|
|
|
|
|
|
|
|
|
|
Percent reported | 100.0|
78.3|
74.2|
70.0|
76.8 |
.0| 100.0|
.0|
.0| 100.0 |
77.1
|
|
|
|
|
|
|
|
|
|
|
|
|
|
|
|
|
|
|
|
|
|
OTHER
| 0 | 25 | 16 | 3 | 44
|0|0|0|0|0
| 44
------------------------------------------------------------------------------------------------------------------------------------
Total
| 3 | 115 | 62 | 10 | 190
|0|2|0|0|2
| 192
* NOTE: SINCE THERE CAN BE UP TO FIVE BEHAVIOR CODES PER INMATE, THE NUMBER OF CASES REPORTED IN THE DETAIL LINES AND THE TOTAL REPORTED LINE MAY EXCEED THE TOTAL NUMBER OF CASES. IN SHORT, THIS TABLE COUNTS THE NUMBER OF BEHAVIOR PROBLEMS, NOT INMATES.
Georgia Department of Corrections
June, 2000
18
Page 16 Run 06/20/00
Georgia Department of Corrections Office of Planning and Analysis
Inmate statistical profile
Sample: ACTIVE PRISONERS EXCLUDING JAIL
Requestor: Statistics
Active inmates 06/20/2000
Inmate Diagnostic Behavior Problem * by current age & sex
|
MEN
|
WOMEN
|
| Age | Age | Age | Age | Men
| Age | Age | Age | Age |Women
|Grand
Diagnostic Problem |00-21 %|22-39 %|40-54 %|55-99 %|Total % |00-21 %|22-39 %|40-54 %|55-99 %|Total % |Total %
------------------------------------------------------------------------------------------------------------------------------------
ALCOHOLIC
| 0 0| 5 2| 5 4| 3 17| 13 3 | 0 0| 1 25| 0 0| 0 0| 1 25 | 14 3
ALCOH ABSE
| 2 17| 23 9| 12 9| 1 6| 38 9 | 0 0| 0 0| 0 0| 0 0| 0 0 | 38 9
DRUG EXP
| 1 8| 43 16| 21 16| 2 11| 67 16 | 0 0| 0 0| 0 0| 0 0| 0 0 | 67 15
DRUG ABSE
| 3 25| 45 17| 17 13| 2 11| 67 16 | 0 0| 1 25| 0 0| 0 0| 1 25 | 68 16
NARC ADDCT
| 0 0| 2 1| 2 2| 0 0| 4 1 | 0 0| 0 0| 0 0| 0 0| 0 0 | 4 1
EPILEPTIC
| 0 0| 1 0| 1 1| 0 0| 2 0 | 0 0| 0 0| 0 0| 0 0| 0 0 | 2 0
MANIPULTVE
| 0 0| 17 6| 4 3| 2 11| 23 5 | 0 0| 0 0| 0 0| 0 0| 0 0 | 23 5
ASSAULTIVE
| 3 25| 89 33| 48 36| 6 33| 146 34 | 0 0| 2 50| 0 0| 0 0| 2 50 | 148 34
ESCPE TEND
| 2 17| 13 5| 14 11| 0 0| 29 7 | 0 0| 0 0| 0 0| 0 0| 0 0 | 29 7
SUICIDAL
| 1 8| 14 5| 4 3| 0 0| 19 4 | 0 0| 0 0| 0 0| 0 0| 0 0 | 19 4
WITHDRAWN
| 0 0| 1 0| 0 0| 0 0| 1 0 | 0 0| 0 0| 0 0| 0 0| 0 0 | 1 0
PR RLTY CT
| 0 0| 3 1| 2 2| 0 0| 5 1 | 0 0| 0 0| 0 0| 0 0| 0 0 | 5 1
HOMOSEXUAL
| 0 0| 0 0| 0 0| 0 0| 0 0 | 0 0| 0 0| 0 0| 0 0| 0 0 | 0 0
NONE
| 0 0| 1 0| 1 1| 1 6| 3 1 | 0 0| 0 0| 0 0| 0 0| 0 0 | 3 1
OTHER
| 0 0| 7 3| 0 0| 0 0| 7 2 | 0 0| 0 0| 0 0| 0 0| 0 0 | 7 2
NOT RPTD
| 0 0| 5 2| 1 1| 1 6| 7 2 | 0 0| 0 0| 0 0| 0 0| 0 0 | 7 2
------------------------------------------------------------------------------------------------------------------------------------
Total reported
| 12 100| 270 100| 132 100| 18 100| 432 100 | 0 0| 4 100| 0 0| 0 0| 4 100 | 436 100
|
|
|
|
|
|
|
|
|
|
|
Percent reported | 100.0|
99.1| 100.0| 100.0|
99.5 |
.0| 100.0|
.0|
.0| 100.0 |
99.5
|
|
|
|
|
|
|
|
|
|
|
|
|
|
|
|
|
|
|
|
|
|
UNKNOWN
|0|1|0|0|1
|0|0|0|0|0
|1
------------------------------------------------------------------------------------------------------------------------------------
Total
| 3 | 115 | 62 | 10 | 190
|0|2|0|0|2
| 192
* NOTE: SINCE THERE CAN BE UP TO FIVE BEHAVIOR CODES PER INMATE, THE NUMBER OF CASES REPORTED IN THE DETAIL LINES AND THE TOTAL REPORTED LINE MAY EXCEED THE TOTAL NUMBER OF CASES. IN SHORT, THIS TABLE COUNTS THE NUMBER OF BEHAVIOR PROBLEMS, NOT INMATES.
Georgia Department of Corrections
June, 2000
19
Page 17 Run 06/20/00
Georgia Department of Corrections Office of Planning and Analysis
Inmate statistical profile
Sample: ACTIVE PRISONERS EXCLUDING JAIL
Requestor: Statistics
Active inmates 06/20/2000
Physical Profile (General Condition) by current age & sex
|
MEN
|
WOMEN
|
| Age | Age | Age | Age | Men
| Age | Age | Age | Age |Women
|Grand
Physical Profile |00-21 %|22-39 %|40-54 %|55-99 %|Total % |00-21 %|22-39 %|40-54 %|55-99 %|Total % |Total %
------------------------------------------------------------------------------------------------------------------------------------
NO LIMITATION
| 3 100| 83 73| 36 58| 4 40| 126 67 | 0 0| 2 100| 0 0| 0 0| 2 100 | 128 67
DEFECT NO MAJOR LIMT| 0 0| 17 15| 11 18| 1 10| 29 15 | 0 0| 0 0| 0 0| 0 0| 0 0 | 29 15
DEFECT MAJOR LIMIT | 0 0| 13 12| 15 24| 5 50| 33 18 | 0 0| 0 0| 0 0| 0 0| 0 0 | 33 17
VERY MAJOR DEFECT | 0 0| 0 0| 0 0| 0 0| 0 0 | 0 0| 0 0| 0 0| 0 0| 0 0 | 0 0
------------------------------------------------------------------------------------------------------------------------------------
Total reported
| 3 100| 113 100| 62 100| 10 100| 188 100 | 0 0| 2 100| 0 0| 0 0| 2 100 | 190 100
|
|
|
|
|
|
|
|
|
|
|
Percent reported | 100.0|
98.3| 100.0| 100.0|
98.9 |
.0| 100.0|
.0|
.0| 100.0 |
99.0
|
|
|
|
|
|
|
|
|
|
|
|
|
|
|
|
|
|
|
|
|
|
NOT REPORTED
|0|2|0|0|2
|0|0|0|0|0
|2
------------------------------------------------------------------------------------------------------------------------------------
Total
| 3 | 115 | 62 | 10 | 190
|0|2|0|0|2
| 192
Georgia Department of Corrections
June, 2000
20
Page 18 Run 06/20/00
Georgia Department of Corrections Office of Planning and Analysis
Inmate statistical profile
Sample: ACTIVE PRISONERS EXCLUDING JAIL Active inmates 06/20/2000
Requestor: Statistics Security Status by current age & sex
|
MEN
|
WOMEN
|
| Age | Age | Age | Age | Men
| Age | Age | Age | Age |Women
|Grand
Security
|00-21 %|22-39 %|40-54 %|55-99 %|Total % |00-21 %|22-39 %|40-54 %|55-99 %|Total % |Total %
------------------------------------------------------------------------------------------------------------------------------------
DIAG INCOM
| 0 0| 0 0| 0 0| 0 0| 0 0 | 0 0| 0 0| 0 0| 0 0| 0 0 | 0 0
WRK RELEAS
| 0 0| 0 0| 0 0| 0 0| 0 0 | 0 0| 0 0| 0 0| 0 0| 0 0 | 0 0
TRUSTY
| 0 0| 0 0| 0 0| 0 0| 0 0 | 0 0| 0 0| 0 0| 0 0| 0 0 | 0 0
MINIMUM
| 0 0| 0 0| 0 0| 0 0| 0 0 | 0 0| 0 0| 0 0| 0 0| 0 0 | 0 0
MEDIUM
| 0 0| 30 26| 19 31| 5 50| 54 28 | 0 0| 1 50| 0 0| 0 0| 1 50 | 55 29
CLOSE
| 3 100| 70 61| 39 63| 4 40| 116 61 | 0 0| 0 0| 0 0| 0 0| 0 0 | 116 60
MAXIMUM
| 0 0| 15 13| 3 5| 1 10| 19 10 | 0 0| 1 50| 0 0| 0 0| 1 50 | 20 10
DIAGNOSTIC
| 0 0| 0 0| 1 2| 0 0| 1 1 | 0 0| 0 0| 0 0| 0 0| 0 0 | 1 1
------------------------------------------------------------------------------------------------------------------------------------
Total reported
| 3 100| 115 100| 62 100| 10 100| 190 100 | 0 0| 2 100| 0 0| 0 0| 2 100 | 192 100
|
|
|
|
|
|
|
|
|
|
|
Percent reported | 100.0| 100.0| 100.0| 100.0| 100.0 |
.0| 100.0|
.0|
.0| 100.0 | 100.0
|
|
|
|
|
|
|
|
|
|
|
|
|
|
|
|
|
|
|
|
|
|
NOT RPTD
|0|0|0|0|0
|0|0|0|0|0
|0
------------------------------------------------------------------------------------------------------------------------------------
Total
| 3 | 115 | 62 | 10 | 190
|0|2|0|0|2
| 192
* NOTE: BEGINNING IN JULY 1987, THE FACILITIES DIVISION NO LONGER CODED INMATES AS BEING WORK RELEASE
Georgia Department of Corrections
June, 2000
21
Page 19 Run 06/20/00
Georgia Department of Corrections Office of Planning and Analysis
Inmate statistical profile
Sample: ACTIVE PRISONERS EXCLUDING JAIL Active inmates 06/20/2000
Requestor: Statistics Number Of Sentences by current age & sex
|
MEN
|
WOMEN
|
| Age | Age | Age | Age | Men
| Age | Age | Age | Age |Women
|Grand
Number Of Sentences |00-21 %|22-39 %|40-54 %|55-99 %|Total % |00-21 %|22-39 %|40-54 %|55-99 %|Total % |Total %
------------------------------------------------------------------------------------------------------------------------------------
ONE
| 0 0| 14 12| 8 13| 2 20| 24 13 | 0 0| 0 0| 0 0| 0 0| 0 0 | 24 13
TWO
| 0 0| 19 17| 11 18| 4 40| 34 18 | 0 0| 1 50| 0 0| 0 0| 1 50 | 35 18
THREE
| 0 0| 22 19| 13 21| 0 0| 35 18 | 0 0| 0 0| 0 0| 0 0| 0 0 | 35 18
FOUR
| 0 0| 16 14| 8 13| 0 0| 24 13 | 0 0| 0 0| 0 0| 0 0| 0 0 | 24 13
FIVE
| 0 0| 11 10| 5 8| 2 20| 18 9 | 0 0| 1 50| 0 0| 0 0| 1 50 | 19 10
MORE THAN FIVE
| 3 100| 33 29| 17 27| 2 20| 55 29 | 0 0| 0 0| 0 0| 0 0| 0 0 | 55 29
------------------------------------------------------------------------------------------------------------------------------------
Total reported
| 3 100| 115 100| 62 100| 10 100| 190 100 | 0 0| 2 100| 0 0| 0 0| 2 100 | 192 100
|
|
|
|
|
|
|
|
|
|
|
Percent reported | 100.0| 100.0| 100.0| 100.0| 100.0 |
.0| 100.0|
.0|
.0| 100.0 | 100.0
|
|
|
|
|
|
|
|
|
|
|
|
|
|
|
|
|
|
|
|
|
|
NOT REPORTED
|0|0|0|0|0
|0|0|0|0|0
|0
------------------------------------------------------------------------------------------------------------------------------------
Total
| 3 | 115 | 62 | 10 | 190
|0|2|0|0|2
| 192
|
|
|
|
|
|
|
|
|
|
|
|
|
|
|
|
|
|
|
|
|
|
|
|
|
|
|
|
|
|
|
|
|
|
|
|
|
|
|
|
|
|
|
|
|
|
|
|
|
|
|
|
|
|
|
AVG NUM SENTENCES | 7.00 | 4.68 | 4.52 | 3.30 | 4.59 | .00 | 3.50 | .00 | .00 | 3.50 | 4.58
Georgia Department of Corrections
June, 2000
22
Page 20 Run 06/20/00
Georgia Department of Corrections Office of Planning and Analysis
Inmate statistical profile
Sample: ACTIVE PRISONERS EXCLUDING JAIL Active inmates 06/20/2000
Requestor: Statistics Number Of Disciplinaries by current age & sex
|
MEN
|
WOMEN
|
| Age | Age | Age | Age | Men
| Age | Age | Age | Age |Women
|Grand
Disciplinaries
|00-21 %|22-39 %|40-54 %|55-99 %|Total % |00-21 %|22-39 %|40-54 %|55-99 %|Total % |Total %
------------------------------------------------------------------------------------------------------------------------------------
ZERO
| 0 0| 22 19| 25 40| 4 40| 51 27 | 0 0| 0 0| 0 0| 0 0| 0 0 | 51 27
ONE
| 0 0| 19 17| 14 23| 3 30| 36 19 | 0 0| 0 0| 0 0| 0 0| 0 0 | 36 19
TWO
| 0 0| 17 15| 5 8| 2 20| 24 13 | 0 0| 1 50| 0 0| 0 0| 1 50 | 25 13
THREE
| 0 0| 11 10| 4 6| 0 0| 15 8 | 0 0| 0 0| 0 0| 0 0| 0 0 | 15 8
FOUR
| 0 0| 7 6| 8 13| 0 0| 15 8 | 0 0| 1 50| 0 0| 0 0| 1 50 | 16 8
FIVE
| 1 33| 6 5| 0 0| 0 0| 7 4 | 0 0| 0 0| 0 0| 0 0| 0 0 | 7 4
MORE THAN FIVE
| 2 67| 33 29| 6 10| 1 10| 42 22 | 0 0| 0 0| 0 0| 0 0| 0 0 | 42 22
------------------------------------------------------------------------------------------------------------------------------------
Total reported
| 3 100| 115 100| 62 100| 10 100| 190 100 | 0 0| 2 100| 0 0| 0 0| 2 100 | 192 100
|
|
|
|
|
|
|
|
|
|
|
Percent reported | 100.0| 100.0| 100.0| 100.0| 100.0 |
.0| 100.0|
.0|
.0| 100.0 | 100.0
|
|
|
|
|
|
|
|
|
|
|
|
|
|
|
|
|
|
|
|
|
|
NOT REPORTED
|0|0|0|0|0
|0|0|0|0|0
|0
------------------------------------------------------------------------------------------------------------------------------------
Total
| 3 | 115 | 62 | 10 | 190
|0|2|0|0|2
| 192
|
|
|
|
|
|
|
|
|
|
|
|
|
|
|
|
|
|
|
|
|
|
|
|
|
|
|
|
|
|
|
|
|
|
|
|
|
|
|
|
|
|
|
|
|
|
|
|
|
|
|
|
|
|
|
AVG NUM DISCIP
| 7.33 | 4.97 | 2.29 | 1.40 | 3.95 | .00 | 3.00 | .00 | .00 | 3.00 | 3.94
Georgia Department of Corrections
June, 2000
23
Page 21 Run 06/20/00
Georgia Department of Corrections Office of Planning and Analysis
Inmate statistical profile
Sample: ACTIVE PRISONERS EXCLUDING JAIL Active inmates 06/20/2000
Requestor: Statistics Number Of Escapes by current age & sex
|
MEN
|
WOMEN
|
| Age | Age | Age | Age | Men
| Age | Age | Age | Age |Women
|Grand
Escapes
|00-21 %|22-39 %|40-54 %|55-99 %|Total % |00-21 %|22-39 %|40-54 %|55-99 %|Total % |Total %
------------------------------------------------------------------------------------------------------------------------------------
ZERO
| 3 100| 114 99| 62 100| 10 100| 189 99 | 0 0| 2 100| 0 0| 0 0| 2 100 | 191 99
ONE
| 0 0| 1 1| 0 0| 0 0| 1 1 | 0 0| 0 0| 0 0| 0 0| 0 0 | 1 1
TWO
| 0 0| 0 0| 0 0| 0 0| 0 0 | 0 0| 0 0| 0 0| 0 0| 0 0 | 0 0
THREE
| 0 0| 0 0| 0 0| 0 0| 0 0 | 0 0| 0 0| 0 0| 0 0| 0 0 | 0 0
FOUR
| 0 0| 0 0| 0 0| 0 0| 0 0 | 0 0| 0 0| 0 0| 0 0| 0 0 | 0 0
FIVE
| 0 0| 0 0| 0 0| 0 0| 0 0 | 0 0| 0 0| 0 0| 0 0| 0 0 | 0 0
MORE THAN FIVE
| 0 0| 0 0| 0 0| 0 0| 0 0 | 0 0| 0 0| 0 0| 0 0| 0 0 | 0 0
------------------------------------------------------------------------------------------------------------------------------------
Total reported
| 3 100| 115 100| 62 100| 10 100| 190 100 | 0 0| 2 100| 0 0| 0 0| 2 100 | 192 100
|
|
|
|
|
|
|
|
|
|
|
Percent reported | 100.0| 100.0| 100.0| 100.0| 100.0 |
.0| 100.0|
.0|
.0| 100.0 | 100.0
|
|
|
|
|
|
|
|
|
|
|
|
|
|
|
|
|
|
|
|
|
|
NOT REPORTED
|0|0|0|0|0
|0|0|0|0|0
|0
------------------------------------------------------------------------------------------------------------------------------------
Total
| 3 | 115 | 62 | 10 | 190
|0|2|0|0|2
| 192
|
|
|
|
|
|
|
|
|
|
|
|
|
|
|
|
|
|
|
|
|
|
|
|
|
|
|
|
|
|
|
|
|
|
|
|
|
|
|
|
|
|
|
|
|
|
|
|
|
|
|
|
|
|
|
AVG NUM ESCAPES
| .00 | .01 | .00 | .00 | .01 | .00 | .00 | .00 | .00 | .00 | .01
Georgia Department of Corrections
June, 2000
24
Page 22 Run 06/20/00
Georgia Department of Corrections Office of Planning and Analysis
Inmate statistical profile
Sample: ACTIVE PRISONERS EXCLUDING JAIL
Requestor: Statistics
Active inmates 06/20/2000
Number Of Prior Georgia Incarcerations * by current age & sex
|
MEN
|
WOMEN
|
| Age | Age | Age | Age | Men
| Age | Age | Age | Age |Women
|Grand
Prior Incarcerations|00-21 %|22-39 %|40-54 %|55-99 %|Total % |00-21 %|22-39 %|40-54 %|55-99 %|Total % |Total %
------------------------------------------------------------------------------------------------------------------------------------
ZERO
| 3 100| 68 59| 26 42| 4 40| 101 53 | 0 0| 2 100| 0 0| 0 0| 2 100 | 103 54
ONE
| 0 0| 22 19| 12 19| 4 40| 38 20 | 0 0| 0 0| 0 0| 0 0| 0 0 | 38 20
TWO
| 0 0| 12 10| 7 11| 1 10| 20 11 | 0 0| 0 0| 0 0| 0 0| 0 0 | 20 10
THREE
| 0 0| 10 9| 6 10| 0 0| 16 8 | 0 0| 0 0| 0 0| 0 0| 0 0 | 16 8
FOUR
| 0 0| 2 2| 6 10| 0 0| 8 4 | 0 0| 0 0| 0 0| 0 0| 0 0 | 8 4
FIVE
| 0 0| 1 1| 3 5| 0 0| 4 2 | 0 0| 0 0| 0 0| 0 0| 0 0 | 4 2
MORE THAN FIVE
| 0 0| 0 0| 2 3| 1 10| 3 2 | 0 0| 0 0| 0 0| 0 0| 0 0 | 3 2
------------------------------------------------------------------------------------------------------------------------------------
Total reported
| 3 100| 115 100| 62 100| 10 100| 190 100 | 0 0| 2 100| 0 0| 0 0| 2 100 | 192 100
|
|
|
|
|
|
|
|
|
|
|
Percent reported | 100.0| 100.0| 100.0| 100.0| 100.0 |
.0| 100.0|
.0|
.0| 100.0 | 100.0
|
|
|
|
|
|
|
|
|
|
|
|
|
|
|
|
|
|
|
|
|
|
NOT REPORTED
|0|0|0|0|0
|0|0|0|0|0
|0
------------------------------------------------------------------------------------------------------------------------------------
Total
| 3 | 115 | 62 | 10 | 190
|0|2|0|0|2
| 192
|
|
|
|
|
|
|
|
|
|
|
|
|
|
|
|
|
|
|
|
|
|
|
|
|
|
|
|
|
|
|
|
|
|
|
|
|
|
|
|
|
|
|
|
|
|
|
|
|
|
|
|
|
|
|
AVG # INCARCERATIONS| .00 | .77 | 1.60 | 1.20 | 1.05 | .00 | .00 | .00 | .00 | .00 | 1.04
* This data counts a parole revocation on an existing sentenCE AS A prior incarceration. Also, this data counts, for any cohort of inmates, the total number of Georgia incarcerations the inmate has had during his entire criminal career. For example, if an inmate was admitted to prison first in FY72, and then re-admitted in FY79 and FY85, he had two prior incarcerations before the FY85 admission. This inmate's records show two prior incarcerations in all three of his records since he has had two prior incarcerations in his criminal career. If the cohort of FY72 admissions is selected for analysis, two prior incarcerations will be listed for this inmate even though in FY72, he had no prior incarcerations.
Georgia Department of Corrections
June, 2000
25
Page 23 Run 06/20/00
Georgia Department of Corrections Office of Planning and Analysis
Inmate statistical profile
Sample: ACTIVE PRISONERS EXCLUDING JAIL Active inmates 06/20/2000
Requestor: Statistics Number Of Transfers by current age & sex
|
MEN
|
WOMEN
|
| Age | Age | Age | Age | Men
| Age | Age | Age | Age |Women
|Grand
Transfers
|00-21 %|22-39 %|40-54 %|55-99 %|Total % |00-21 %|22-39 %|40-54 %|55-99 %|Total % |Total %
------------------------------------------------------------------------------------------------------------------------------------
ZERO
| 0 0| 2 2| 1 2| 0 0| 3 2 | 0 0| 1 50| 0 0| 0 0| 1 50 | 4 2
ONE
| 1 33| 64 56| 36 58| 4 40| 105 55 | 0 0| 1 50| 0 0| 0 0| 1 50 | 106 55
TWO
| 1 33| 27 23| 15 24| 2 20| 45 24 | 0 0| 0 0| 0 0| 0 0| 0 0 | 45 23
THREE
| 1 33| 10 9| 8 13| 3 30| 22 12 | 0 0| 0 0| 0 0| 0 0| 0 0 | 22 11
FOUR
| 0 0| 4 3| 0 0| 1 10| 5 3 | 0 0| 0 0| 0 0| 0 0| 0 0 | 5 3
FIVE
| 0 0| 3 3| 1 2| 0 0| 4 2 | 0 0| 0 0| 0 0| 0 0| 0 0 | 4 2
MORE THAN FIVE
| 0 0| 5 4| 1 2| 0 0| 6 3 | 0 0| 0 0| 0 0| 0 0| 0 0 | 6 3
------------------------------------------------------------------------------------------------------------------------------------
Total reported
| 3 100| 115 100| 62 100| 10 100| 190 100 | 0 0| 2 100| 0 0| 0 0| 2 100 | 192 100
|
|
|
|
|
|
|
|
|
|
|
Percent reported | 100.0| 100.0| 100.0| 100.0| 100.0 |
.0| 100.0|
.0|
.0| 100.0 | 100.0
|
|
|
|
|
|
|
|
|
|
|
|
|
|
|
|
|
|
|
|
|
|
NOT REPORTED
|0|0|0|0|0
|0|0|0|0|0
|0
------------------------------------------------------------------------------------------------------------------------------------
Total
| 3 | 115 | 62 | 10 | 190
|0|2|0|0|2
| 192
|
|
|
|
|
|
|
|
|
|
|
|
|
|
|
|
|
|
|
|
|
|
|
|
|
|
|
|
|
|
|
|
|
|
|
|
|
|
|
|
|
|
|
|
|
|
|
|
|
|
|
|
|
|
|
AVG NUM TRANSFERS | 2.00 | 1.83 | 1.63 | 2.10 | 1.78 | .00 | .50 | .00 | .00 | .50 | 1.77
Georgia Department of Corrections
June, 2000
26
Page 24 Run 06/20/00
Georgia Department of Corrections Office of Planning and Analysis
Inmate statistical profile
Sample: ACTIVE PRISONERS EXCLUDING JAIL Active inmates 06/20/2000
Requestor: Statistics County Of Conviction by current age & sex
|
MEN
|
WOMEN
|
| Age | Age | Age | Age | Men
| Age | Age | Age | Age |Women
|Grand
County Of Conviction|00-21 %|22-39 %|40-54 %|55-99 %|Total % |00-21 %|22-39 %|40-54 %|55-99 %|Total % |Total %
------------------------------------------------------------------------------------------------------------------------------------
APPLING COUNTY
| 0 0| 1 1| 1 2| 0 0| 2 1 | 0 0| 0 0| 0 0| 0 0| 0 0 | 2 1
ATKINSON COUNTY
| 0 0| 0 0| 0 0| 1 10| 1 1 | 0 0| 0 0| 0 0| 0 0| 0 0 | 1 1
BACON COUNTY
| 0 0| 0 0| 1 2| 0 0| 1 1 | 0 0| 0 0| 0 0| 0 0| 0 0 | 1 1
BAKER COUNTY
| 0 0| 0 0| 0 0| 0 0| 0 0 | 0 0| 0 0| 0 0| 0 0| 0 0 | 0 0
BALDWIN COUNTY
| 0 0| 1 1| 2 3| 0 0| 3 2 | 0 0| 0 0| 0 0| 0 0| 0 0 | 3 2
BANKS COUNTY
| 0 0| 0 0| 1 2| 0 0| 1 1 | 0 0| 0 0| 0 0| 0 0| 0 0 | 1 1
BARROW COUNTY
| 0 0| 1 1| 1 2| 0 0| 2 1 | 0 0| 0 0| 0 0| 0 0| 0 0 | 2 1
BARTOW COUNTY
| 0 0| 0 0| 1 2| 0 0| 1 1 | 0 0| 0 0| 0 0| 0 0| 0 0 | 1 1
BEN HILL COUNTY
| 0 0| 0 0| 0 0| 0 0| 0 0 | 0 0| 0 0| 0 0| 0 0| 0 0 | 0 0
BERRIEN COUNTY
| 0 0| 1 1| 0 0| 0 0| 1 1 | 0 0| 0 0| 0 0| 0 0| 0 0 | 1 1
BIBB COUNTY
| 0 0| 4 3| 1 2| 0 0| 5 3 | 0 0| 0 0| 0 0| 0 0| 0 0 | 5 3
BLECKLEY COUNTY
| 0 0| 1 1| 0 0| 0 0| 1 1 | 0 0| 0 0| 0 0| 0 0| 0 0 | 1 1
BRANTLEY COUNTY
| 0 0| 0 0| 1 2| 0 0| 1 1 | 0 0| 0 0| 0 0| 0 0| 0 0 | 1 1
BROOKS COUNTY
| 0 0| 1 1| 0 0| 0 0| 1 1 | 0 0| 0 0| 0 0| 0 0| 0 0 | 1 1
BRYAN COUNTY
| 0 0| 0 0| 0 0| 0 0| 0 0 | 0 0| 0 0| 0 0| 0 0| 0 0 | 0 0
BULLOCH COUNTY
| 0 0| 0 0| 0 0| 0 0| 0 0 | 0 0| 0 0| 0 0| 0 0| 0 0 | 0 0
BURKE COUNTY
| 0 0| 4 3| 0 0| 0 0| 4 2 | 0 0| 0 0| 0 0| 0 0| 0 0 | 4 2
BUTTS COUNTY
| 0 0| 0 0| 0 0| 1 10| 1 1 | 0 0| 0 0| 0 0| 0 0| 0 0 | 1 1
CALHOUN COUNTY
| 0 0| 0 0| 0 0| 0 0| 0 0 | 0 0| 0 0| 0 0| 0 0| 0 0 | 0 0
CAMDEN COUNTY
| 0 0| 0 0| 1 2| 0 0| 1 1 | 0 0| 0 0| 0 0| 0 0| 0 0 | 1 1
CANDLER COUNTY
| 0 0| 0 0| 0 0| 0 0| 0 0 | 0 0| 0 0| 0 0| 0 0| 0 0 | 0 0
CARROLL COUNTY
| 0 0| 1 1| 0 0| 0 0| 1 1 | 0 0| 0 0| 0 0| 0 0| 0 0 | 1 1
CATOOSA COUNTY
| 0 0| 0 0| 0 0| 0 0| 0 0 | 0 0| 0 0| 0 0| 0 0| 0 0 | 0 0
CHARLTON COUNTY
| 0 0| 0 0| 0 0| 0 0| 0 0 | 0 0| 0 0| 0 0| 0 0| 0 0 | 0 0
CHATHAM COUNTY
| 0 0| 7 6| 0 0| 0 0| 7 4 | 0 0| 0 0| 0 0| 0 0| 0 0 | 7 4
CHATTAHOOCHEE COUNTY| 0 0| 0 0| 0 0| 0 0| 0 0 | 0 0| 0 0| 0 0| 0 0| 0 0 | 0 0
CHATTOOGA COUNTY | 0 0| 1 1| 0 0| 0 0| 1 1 | 0 0| 0 0| 0 0| 0 0| 0 0 | 1 1
CHEROKEE COUNTY
| 0 0| 1 1| 1 2| 0 0| 2 1 | 0 0| 0 0| 0 0| 0 0| 0 0 | 2 1
CLARKE COUNTY
| 0 0| 4 3| 4 6| 0 0| 8 4 | 0 0| 0 0| 0 0| 0 0| 0 0 | 8 4
CLAY COUNTY
| 0 0| 0 0| 0 0| 0 0| 0 0 | 0 0| 0 0| 0 0| 0 0| 0 0 | 0 0
CLAYTON COUNTY
| 0 0| 3 3| 1 2| 1 10| 5 3 | 0 0| 0 0| 0 0| 0 0| 0 0 | 5 3
CLINCH COUNTY
| 0 0| 0 0| 0 0| 0 0| 0 0 | 0 0| 0 0| 0 0| 0 0| 0 0 | 0 0
COBB COUNTY
| 0 0| 1 1| 1 2| 0 0| 2 1 | 0 0| 0 0| 0 0| 0 0| 0 0 | 2 1
COFFEE COUNTY
| 0 0| 1 1| 0 0| 0 0| 1 1 | 0 0| 0 0| 0 0| 0 0| 0 0 | 1 1
COLQUITT COUNTY
| 1 33| 0 0| 1 2| 0 0| 2 1 | 0 0| 0 0| 0 0| 0 0| 0 0 | 2 1
COLUMBIA COUNTY
| 0 0| 1 1| 1 2| 0 0| 2 1 | 0 0| 0 0| 0 0| 0 0| 0 0 | 2 1
------------------------------------------------------------------------------------------------------------------------------------
(continued)
Georgia Department of Corrections
June, 2000
27
Page 25 Run 06/20/00
Georgia Department of Corrections Office of Planning and Analysis
Inmate statistical profile
Sample: ACTIVE PRISONERS EXCLUDING JAIL
Requestor:
Active inmates 06/20/2000
County Of Conviction by current age & sex
Statistics (CONTINUED)
|
MEN
|
WOMEN
|
| Age | Age | Age | Age | Men
| Age | Age | Age | Age |Women
|Grand
County Of Conviction|00-21 %|22-39 %|40-54 %|55-99 %|Total % |00-21 %|22-39 %|40-54 %|55-99 %|Total % |Total %
------------------------------------------------------------------------------------------------------------------------------------
COOK COUNTY
| 0 0| 0 0| 0 0| 0 0| 0 0 | 0 0| 0 0| 0 0| 0 0| 0 0 | 0 0
COWETA COUNTY
| 0 0| 0 0| 0 0| 0 0| 0 0 | 0 0| 0 0| 0 0| 0 0| 0 0 | 0 0
CRAWFORD COUNTY
| 0 0| 0 0| 0 0| 0 0| 0 0 | 0 0| 0 0| 0 0| 0 0| 0 0 | 0 0
CRISP COUNTY
| 0 0| 1 1| 0 0| 0 0| 1 1 | 0 0| 0 0| 0 0| 0 0| 0 0 | 1 1
DADE COUNTY
| 0 0| 1 1| 0 0| 0 0| 1 1 | 0 0| 0 0| 0 0| 0 0| 0 0 | 1 1
DAWSON COUNTY
| 0 0| 0 0| 0 0| 0 0| 0 0 | 0 0| 0 0| 0 0| 0 0| 0 0 | 0 0
DECATUR COUNTY
| 0 0| 0 0| 1 2| 0 0| 1 1 | 0 0| 0 0| 0 0| 0 0| 0 0 | 1 1
DEKALB COUNTY
| 0 0| 11 10| 4 6| 2 20| 17 9 | 0 0| 0 0| 0 0| 0 0| 0 0 | 17 9
DODGE COUNTY
| 1 33| 0 0| 0 0| 0 0| 1 1 | 0 0| 0 0| 0 0| 0 0| 0 0 | 1 1
DOOLY COUNTY
| 0 0| 0 0| 0 0| 0 0| 0 0 | 0 0| 0 0| 0 0| 0 0| 0 0 | 0 0
DOUGHERTY COUNTY | 0 0| 2 2| 1 2| 0 0| 3 2 | 0 0| 0 0| 0 0| 0 0| 0 0 | 3 2
DOUGLAS COUNTY
| 0 0| 4 3| 1 2| 0 0| 5 3 | 0 0| 0 0| 0 0| 0 0| 0 0 | 5 3
EARLY COUNTY
| 0 0| 0 0| 0 0| 0 0| 0 0 | 0 0| 0 0| 0 0| 0 0| 0 0 | 0 0
ECHOLS COUNTY.
| 0 0| 0 0| 0 0| 0 0| 0 0 | 0 0| 0 0| 0 0| 0 0| 0 0 | 0 0
EFFINGHAM COUNTY | 0 0| 0 0| 0 0| 0 0| 0 0 | 0 0| 0 0| 0 0| 0 0| 0 0 | 0 0
ELBERT COUNTY
| 0 0| 0 0| 0 0| 1 10| 1 1 | 0 0| 0 0| 0 0| 0 0| 0 0 | 1 1
EMANUEL COUNTY
| 0 0| 1 1| 0 0| 0 0| 1 1 | 0 0| 0 0| 0 0| 0 0| 0 0 | 1 1
EVANS COUNTY
| 0 0| 0 0| 0 0| 0 0| 0 0 | 0 0| 0 0| 0 0| 0 0| 0 0 | 0 0
FANNIN COUNTY
| 0 0| 0 0| 0 0| 0 0| 0 0 | 0 0| 0 0| 0 0| 0 0| 0 0 | 0 0
FAYETTE COUNTY
| 0 0| 1 1| 1 2| 0 0| 2 1 | 0 0| 0 0| 0 0| 0 0| 0 0 | 2 1
FLOYD COUNTY
| 0 0| 4 3| 0 0| 0 0| 4 2 | 0 0| 0 0| 0 0| 0 0| 0 0 | 4 2
FORSYTH COUNTY
| 0 0| 0 0| 1 2| 0 0| 1 1 | 0 0| 0 0| 0 0| 0 0| 0 0 | 1 1
FRANKLIN COUNTY
| 0 0| 0 0| 0 0| 0 0| 0 0 | 0 0| 0 0| 0 0| 0 0| 0 0 | 0 0
FULTON COUNTY
| 0 0| 5 4| 5 8| 0 0| 10 5 | 0 0| 0 0| 0 0| 0 0| 0 0 | 10 5
GILMER COUNTY
| 0 0| 1 1| 0 0| 0 0| 1 1 | 0 0| 0 0| 0 0| 0 0| 0 0 | 1 1
GLASCOCK COUNTY
| 0 0| 0 0| 0 0| 0 0| 0 0 | 0 0| 0 0| 0 0| 0 0| 0 0 | 0 0
GLYNN COUNTY
| 0 0| 4 3| 2 3| 1 10| 7 4 | 0 0| 0 0| 0 0| 0 0| 0 0 | 7 4
GORDON COUNTY
| 0 0| 0 0| 0 0| 1 10| 1 1 | 0 0| 0 0| 0 0| 0 0| 0 0 | 1 1
GRADY COUNTY
| 0 0| 0 0| 0 0| 0 0| 0 0 | 0 0| 0 0| 0 0| 0 0| 0 0 | 0 0
GREENE COUNTY
| 0 0| 1 1| 0 0| 0 0| 1 1 | 0 0| 0 0| 0 0| 0 0| 0 0 | 1 1
GWINNETT COUNTY
| 0 0| 1 1| 0 0| 0 0| 1 1 | 0 0| 0 0| 0 0| 0 0| 0 0 | 1 1
HABERSHAM COUNTY | 0 0| 1 1| 0 0| 0 0| 1 1 | 0 0| 0 0| 0 0| 0 0| 0 0 | 1 1
HALL COUNTY
| 0 0| 2 2| 0 0| 0 0| 2 1 | 0 0| 0 0| 0 0| 0 0| 0 0 | 2 1
HANCOCK COUNTY
| 0 0| 0 0| 0 0| 0 0| 0 0 | 0 0| 0 0| 0 0| 0 0| 0 0 | 0 0
HARALSON COUNTY
| 0 0| 0 0| 0 0| 0 0| 0 0 | 0 0| 0 0| 0 0| 0 0| 0 0 | 0 0
------------------------------------------------------------------------------------------------------------------------------------
(continued)
Georgia Department of Corrections
June, 2000
28
Page 26 Run 06/20/00
Georgia Department of Corrections Office of Planning and Analysis
Inmate statistical profile
Sample: ACTIVE PRISONERS EXCLUDING JAIL
Requestor:
Active inmates 06/20/2000
County Of Conviction by current age & sex
Statistics (CONTINUED)
|
MEN
|
WOMEN
|
| Age | Age | Age | Age | Men
| Age | Age | Age | Age |Women
|Grand
County Of Conviction|00-21 %|22-39 %|40-54 %|55-99 %|Total % |00-21 %|22-39 %|40-54 %|55-99 %|Total % |Total %
------------------------------------------------------------------------------------------------------------------------------------
HARRIS COUNTY
| 0 0| 0 0| 0 0| 0 0| 0 0 | 0 0| 0 0| 0 0| 0 0| 0 0 | 0 0
HART COUNTY
| 0 0| 1 1| 0 0| 0 0| 1 1 | 0 0| 0 0| 0 0| 0 0| 0 0 | 1 1
HEARD COUNTY
| 0 0| 0 0| 0 0| 0 0| 0 0 | 0 0| 0 0| 0 0| 0 0| 0 0 | 0 0
HENRY COUNTY
| 0 0| 3 3| 0 0| 0 0| 3 2 | 0 0| 0 0| 0 0| 0 0| 0 0 | 3 2
HOUSTON COUNTY
| 0 0| 2 2| 2 3| 0 0| 4 2 | 0 0| 0 0| 0 0| 0 0| 0 0 | 4 2
IRWIN COUNTY
| 0 0| 0 0| 0 0| 0 0| 0 0 | 0 0| 0 0| 0 0| 0 0| 0 0 | 0 0
JACKSON COUNTY
| 0 0| 0 0| 0 0| 0 0| 0 0 | 0 0| 0 0| 0 0| 0 0| 0 0 | 0 0
JASPER COUNTY
| 0 0| 1 1| 0 0| 0 0| 1 1 | 0 0| 0 0| 0 0| 0 0| 0 0 | 1 1
JEFF DAVIS COUNTY | 0 0| 0 0| 0 0| 0 0| 0 0 | 0 0| 0 0| 0 0| 0 0| 0 0 | 0 0
JEFFERSON COUNTY | 0 0| 0 0| 0 0| 0 0| 0 0 | 0 0| 0 0| 0 0| 0 0| 0 0 | 0 0
JENKINS COUNTY
| 0 0| 0 0| 0 0| 0 0| 0 0 | 0 0| 0 0| 0 0| 0 0| 0 0 | 0 0
JOHNSON COUNTY
| 0 0| 0 0| 0 0| 0 0| 0 0 | 0 0| 0 0| 0 0| 0 0| 0 0 | 0 0
JONES COUNTY
| 0 0| 0 0| 0 0| 0 0| 0 0 | 0 0| 0 0| 0 0| 0 0| 0 0 | 0 0
LAMAR COUNTY
| 0 0| 0 0| 0 0| 0 0| 0 0 | 0 0| 0 0| 0 0| 0 0| 0 0 | 0 0
LANIER COUNTY
| 0 0| 0 0| 0 0| 0 0| 0 0 | 0 0| 0 0| 0 0| 0 0| 0 0 | 0 0
LAURENS COUNTY
| 0 0| 0 0| 0 0| 0 0| 0 0 | 0 0| 0 0| 0 0| 0 0| 0 0 | 0 0
LEE COUNTY
| 0 0| 1 1| 0 0| 0 0| 1 1 | 0 0| 0 0| 0 0| 0 0| 0 0 | 1 1
LIBERTY COUNTY
| 0 0| 1 1| 1 2| 0 0| 2 1 | 0 0| 0 0| 0 0| 0 0| 0 0 | 2 1
LINCOLN COUNTY
| 0 0| 0 0| 0 0| 0 0| 0 0 | 0 0| 0 0| 0 0| 0 0| 0 0 | 0 0
LONG COUNTY
| 0 0| 2 2| 0 0| 0 0| 2 1 | 0 0| 0 0| 0 0| 0 0| 0 0 | 2 1
LOWNDES COUNTY
| 0 0| 1 1| 0 0| 0 0| 1 1 | 0 0| 0 0| 0 0| 0 0| 0 0 | 1 1
LUMPKIN COUNTY
| 0 0| 0 0| 0 0| 0 0| 0 0 | 0 0| 0 0| 0 0| 0 0| 0 0 | 0 0
MACON COUNTY
| 0 0| 0 0| 0 0| 0 0| 0 0 | 0 0| 0 0| 0 0| 0 0| 0 0 | 0 0
MADISON COUNTY
| 0 0| 0 0| 0 0| 0 0| 0 0 | 0 0| 0 0| 0 0| 0 0| 0 0 | 0 0
MARION COUNTY
| 0 0| 1 1| 0 0| 0 0| 1 1 | 0 0| 0 0| 0 0| 0 0| 0 0 | 1 1
MCDUFFIE COUNTY
| 0 0| 0 0| 0 0| 0 0| 0 0 | 0 0| 0 0| 0 0| 0 0| 0 0 | 0 0
MCINTOSH COUNTY
| 0 0| 1 1| 0 0| 0 0| 1 1 | 0 0| 0 0| 0 0| 0 0| 0 0 | 1 1
MERIWETHER COUNTY | 0 0| 0 0| 0 0| 0 0| 0 0 | 0 0| 0 0| 0 0| 0 0| 0 0 | 0 0
MILLER COUNTY
| 0 0| 0 0| 0 0| 0 0| 0 0 | 0 0| 0 0| 0 0| 0 0| 0 0 | 0 0
MITCHELL COUNTY
| 0 0| 0 0| 0 0| 0 0| 0 0 | 0 0| 0 0| 0 0| 0 0| 0 0 | 0 0
MONROE COUNTY
| 0 0| 0 0| 1 2| 0 0| 1 1 | 0 0| 0 0| 0 0| 0 0| 0 0 | 1 1
MONTGOMERY COUNTY | 0 0| 0 0| 0 0| 0 0| 0 0 | 0 0| 0 0| 0 0| 0 0| 0 0 | 0 0
MORGAN COUNTY
| 0 0| 0 0| 0 0| 0 0| 0 0 | 0 0| 0 0| 0 0| 0 0| 0 0 | 0 0
MURRAY COUNTY
| 0 0| 0 0| 0 0| 0 0| 0 0 | 0 0| 0 0| 0 0| 0 0| 0 0 | 0 0
MUSCOGEE COUNTY
| 0 0| 4 3| 3 5| 0 0| 7 4 | 0 0| 0 0| 0 0| 0 0| 0 0 | 7 4
------------------------------------------------------------------------------------------------------------------------------------
(continued)
Georgia Department of Corrections
June, 2000
29
Page 27 Run 06/20/00
Georgia Department of Corrections Office of Planning and Analysis
Inmate statistical profile
Sample: ACTIVE PRISONERS EXCLUDING JAIL
Requestor:
Active inmates 06/20/2000
County Of Conviction by current age & sex
Statistics (CONTINUED)
|
MEN
|
WOMEN
|
| Age | Age | Age | Age | Men
| Age | Age | Age | Age |Women
|Grand
County Of Conviction|00-21 %|22-39 %|40-54 %|55-99 %|Total % |00-21 %|22-39 %|40-54 %|55-99 %|Total % |Total %
------------------------------------------------------------------------------------------------------------------------------------
NEWTON COUNTY
| 0 0| 1 1| 0 0| 0 0| 1 1 | 0 0| 0 0| 0 0| 0 0| 0 0 | 1 1
OCONEE COUNTY
| 0 0| 0 0| 0 0| 0 0| 0 0 | 0 0| 0 0| 0 0| 0 0| 0 0 | 0 0
OGLETHORPE COUNTY | 0 0| 1 1| 0 0| 0 0| 1 1 | 0 0| 0 0| 0 0| 0 0| 0 0 | 1 1
PAULDING COUNTY
| 0 0| 0 0| 1 2| 0 0| 1 1 | 0 0| 0 0| 0 0| 0 0| 0 0 | 1 1
PEACH COUNTY
| 0 0| 0 0| 0 0| 0 0| 0 0 | 0 0| 0 0| 0 0| 0 0| 0 0 | 0 0
PICKENS COUNTY
| 0 0| 0 0| 0 0| 0 0| 0 0 | 0 0| 0 0| 0 0| 0 0| 0 0 | 0 0
PIERCE COUNTY
| 0 0| 0 0| 0 0| 0 0| 0 0 | 0 0| 0 0| 0 0| 0 0| 0 0 | 0 0
PIKE COUNTY
| 0 0| 0 0| 1 2| 0 0| 1 1 | 0 0| 0 0| 0 0| 0 0| 0 0 | 1 1
POLK COUNTY
| 0 0| 0 0| 0 0| 0 0| 0 0 | 0 0| 0 0| 0 0| 0 0| 0 0 | 0 0
PULASKI COUNTY
| 0 0| 0 0| 0 0| 0 0| 0 0 | 0 0| 0 0| 0 0| 0 0| 0 0 | 0 0
PUTNAM COUNTY
| 0 0| 3 3| 1 2| 0 0| 4 2 | 0 0| 0 0| 0 0| 0 0| 0 0 | 4 2
QUITMAN COUNTY
| 0 0| 0 0| 0 0| 0 0| 0 0 | 0 0| 0 0| 0 0| 0 0| 0 0 | 0 0
RABUN COUNTY
| 0 0| 0 0| 0 0| 0 0| 0 0 | 0 0| 0 0| 0 0| 0 0| 0 0 | 0 0
RANDOLPH COUNTY
| 0 0| 0 0| 0 0| 0 0| 0 0 | 0 0| 0 0| 0 0| 0 0| 0 0 | 0 0
RICHMOND COUNTY
| 1 33| 4 3| 4 6| 0 0| 9 5 | 0 0| 1 50| 0 0| 0 0| 1 50 | 10 5
ROCKDALE COUNTY
| 0 0| 2 2| 1 2| 0 0| 3 2 | 0 0| 0 0| 0 0| 0 0| 0 0 | 3 2
SCHLEY COUNTY
| 0 0| 0 0| 0 0| 0 0| 0 0 | 0 0| 0 0| 0 0| 0 0| 0 0 | 0 0
SCREVEN COUNTY
| 0 0| 0 0| 0 0| 0 0| 0 0 | 0 0| 0 0| 0 0| 0 0| 0 0 | 0 0
SEMINOLE COUNTY
| 0 0| 0 0| 0 0| 0 0| 0 0 | 0 0| 0 0| 0 0| 0 0| 0 0 | 0 0
SPALDING COUNTY
| 0 0| 2 2| 0 0| 0 0| 2 1 | 0 0| 0 0| 0 0| 0 0| 0 0 | 2 1
STEPHENS COUNTY
| 0 0| 0 0| 0 0| 0 0| 0 0 | 0 0| 0 0| 0 0| 0 0| 0 0 | 0 0
STEWART COUNTY
| 0 0| 0 0| 0 0| 0 0| 0 0 | 0 0| 0 0| 0 0| 0 0| 0 0 | 0 0
SUMTER COUNTY
| 0 0| 0 0| 0 0| 0 0| 0 0 | 0 0| 0 0| 0 0| 0 0| 0 0 | 0 0
TALBOT COUNTY
| 0 0| 0 0| 0 0| 0 0| 0 0 | 0 0| 0 0| 0 0| 0 0| 0 0 | 0 0
TALIAFERRO COUNTY | 0 0| 0 0| 0 0| 0 0| 0 0 | 0 0| 0 0| 0 0| 0 0| 0 0 | 0 0
TATTNALL COUNTY
| 0 0| 0 0| 0 0| 0 0| 0 0 | 0 0| 0 0| 0 0| 0 0| 0 0 | 0 0
TAYLOR COUNTY
| 0 0| 0 0| 0 0| 0 0| 0 0 | 0 0| 0 0| 0 0| 0 0| 0 0 | 0 0
TELFAIR COUNTY
| 0 0| 0 0| 0 0| 0 0| 0 0 | 0 0| 0 0| 0 0| 0 0| 0 0 | 0 0
TERRELL COUNTY
| 0 0| 0 0| 1 2| 0 0| 1 1 | 0 0| 0 0| 0 0| 0 0| 0 0 | 1 1
THOMAS COUNTY
| 0 0| 1 1| 1 2| 0 0| 2 1 | 0 0| 0 0| 0 0| 0 0| 0 0 | 2 1
TIFT COUNTY
| 0 0| 1 1| 0 0| 1 10| 2 1 | 0 0| 0 0| 0 0| 0 0| 0 0 | 2 1
TOOMBS COUNTY
| 0 0| 1 1| 0 0| 0 0| 1 1 | 0 0| 0 0| 0 0| 0 0| 0 0 | 1 1
TOWNS COUNTY
| 0 0| 1 1| 0 0| 0 0| 1 1 | 0 0| 0 0| 0 0| 0 0| 0 0 | 1 1
TREUTLEN COUNTY
| 0 0| 0 0| 0 0| 0 0| 0 0 | 0 0| 0 0| 0 0| 0 0| 0 0 | 0 0
TROUP COUNTY
| 0 0| 0 0| 1 2| 1 10| 2 1 | 0 0| 0 0| 0 0| 0 0| 0 0 | 2 1
------------------------------------------------------------------------------------------------------------------------------------
(continued)
Georgia Department of Corrections
June, 2000
30
Page 28 Run 06/20/00
Georgia Department of Corrections Office of Planning and Analysis
Inmate statistical profile
Sample: ACTIVE PRISONERS EXCLUDING JAIL
Requestor:
Active inmates 06/20/2000
County Of Conviction by current age & sex
Statistics (CONTINUED)
|
MEN
|
WOMEN
|
| Age | Age | Age | Age | Men
| Age | Age | Age | Age |Women
|Grand
County Of Conviction|00-21 %|22-39 %|40-54 %|55-99 %|Total % |00-21 %|22-39 %|40-54 %|55-99 %|Total % |Total %
------------------------------------------------------------------------------------------------------------------------------------
TURNER COUNTY
| 0 0| 0 0| 0 0| 0 0| 0 0 | 0 0| 0 0| 0 0| 0 0| 0 0 | 0 0
TWIGGS COUNTY
| 0 0| 0 0| 0 0| 0 0| 0 0 | 0 0| 0 0| 0 0| 0 0| 0 0 | 0 0
UNION COUNTY
| 0 0| 0 0| 1 2| 0 0| 1 1 | 0 0| 0 0| 0 0| 0 0| 0 0 | 1 1
UPSON COUNTY
| 0 0| 0 0| 0 0| 0 0| 0 0 | 0 0| 0 0| 0 0| 0 0| 0 0 | 0 0
WALKER COUNTY
| 0 0| 1 1| 1 2| 0 0| 2 1 | 0 0| 1 50| 0 0| 0 0| 1 50 | 3 2
WALTON COUNTY
| 0 0| 1 1| 1 2| 0 0| 2 1 | 0 0| 0 0| 0 0| 0 0| 0 0 | 2 1
WARE COUNTY
| 0 0| 3 3| 2 3| 0 0| 5 3 | 0 0| 0 0| 0 0| 0 0| 0 0 | 5 3
WARREN COUNTY
| 0 0| 0 0| 0 0| 0 0| 0 0 | 0 0| 0 0| 0 0| 0 0| 0 0 | 0 0
WASHINGTON COUNTY | 0 0| 0 0| 0 0| 0 0| 0 0 | 0 0| 0 0| 0 0| 0 0| 0 0 | 0 0
WAYNE COUNTY
| 0 0| 0 0| 0 0| 0 0| 0 0 | 0 0| 0 0| 0 0| 0 0| 0 0 | 0 0
WEBSTER COUNTY
| 0 0| 0 0| 0 0| 0 0| 0 0 | 0 0| 0 0| 0 0| 0 0| 0 0 | 0 0
WHEELER COUNTY
| 0 0| 0 0| 0 0| 0 0| 0 0 | 0 0| 0 0| 0 0| 0 0| 0 0 | 0 0
WHITE COUNTY
| 0 0| 0 0| 0 0| 0 0| 0 0 | 0 0| 0 0| 0 0| 0 0| 0 0 | 0 0
WHITFIELD COUNTY | 0 0| 0 0| 4 6| 0 0| 4 2 | 0 0| 0 0| 0 0| 0 0| 0 0 | 4 2
WILCOX COUNTY
| 0 0| 0 0| 0 0| 0 0| 0 0 | 0 0| 0 0| 0 0| 0 0| 0 0 | 0 0
WILKES COUNTY
| 0 0| 1 1| 0 0| 0 0| 1 1 | 0 0| 0 0| 0 0| 0 0| 0 0 | 1 1
WILKINSON COUNTY | 0 0| 0 0| 0 0| 0 0| 0 0 | 0 0| 0 0| 0 0| 0 0| 0 0 | 0 0
WORTH COUNTY
| 0 0| 0 0| 0 0| 0 0| 0 0 | 0 0| 0 0| 0 0| 0 0| 0 0 | 0 0
CONVERSION
| 0 0| 0 0| 0 0| 0 0| 0 0 | 0 0| 0 0| 0 0| 0 0| 0 0 | 0 0
------------------------------------------------------------------------------------------------------------------------------------
Total reported
| 3 100| 115 100| 62 100| 10 100| 190 100 | 0 0| 2 100| 0 0| 0 0| 2 100 | 192 100
|
|
|
|
|
|
|
|
|
|
|
Percent reported | 100.0| 100.0| 100.0| 100.0| 100.0 |
.0| 100.0|
.0|
.0| 100.0 | 100.0
|
|
|
|
|
|
|
|
|
|
|
|
|
|
|
|
|
|
|
|
|
|
UNKNOWN
|0|0|0|0|0
|0|0|0|0|0
|0
------------------------------------------------------------------------------------------------------------------------------------
Total
| 3 | 115 | 62 | 10 | 190
|0|2|0|0|2
| 192
Georgia Department of Corrections
June, 2000
31
Page 29 Run 06/20/00
Georgia Department of Corrections Office of Planning and Analysis
Inmate statistical profile
Sample: ACTIVE PRISONERS EXCLUDING JAIL Active inmates 06/20/2000
Requestor: Statistics Circuit Of Conviction by current age & sex
|
MEN
|
WOMEN
|
| Age | Age | Age | Age | Men
| Age | Age | Age | Age |Women
|Grand
Circ Of Conviction |00-21 %|22-39 %|40-54 %|55-99 %|Total % |00-21 %|22-39 %|40-54 %|55-99 %|Total % |Total %
------------------------------------------------------------------------------------------------------------------------------------
ALAPAHA CIRCUIT
| 0 0| 1 1| 0 0| 1 10| 2 1 | 0 0| 0 0| 0 0| 0 0| 0 0 | 2 1
ALCOVY CIRCUIT
| 0 0| 2 2| 1 2| 0 0| 3 2 | 0 0| 0 0| 0 0| 0 0| 0 0 | 3 2
ATLANTA CIRCUIT
| 0 0| 5 4| 5 8| 0 0| 10 5 | 0 0| 0 0| 0 0| 0 0| 0 0 | 10 5
ATLANTIC CIRCUIT | 0 0| 4 3| 1 2| 0 0| 5 3 | 0 0| 0 0| 0 0| 0 0| 0 0 | 5 3
AUGUSTA CIRCUIT
| 1 33| 9 8| 5 8| 0 0| 15 8 | 0 0| 1 50| 0 0| 0 0| 1 50 | 16 8
BLUE RIDGE CIRCUIT | 0 0| 1 1| 1 2| 0 0| 2 1 | 0 0| 0 0| 0 0| 0 0| 0 0 | 2 1
BRUNSWICK CIRCUIT | 0 0| 5 4| 4 6| 1 10| 10 5 | 0 0| 0 0| 0 0| 0 0| 0 0 | 10 5
CHATTAHOOCHEE CIRCUI| 0 0| 5 4| 3 5| 0 0| 8 4 | 0 0| 0 0| 0 0| 0 0| 0 0 | 8 4
CHEROKEE CIRCUIT | 0 0| 0 0| 1 2| 1 10| 2 1 | 0 0| 0 0| 0 0| 0 0| 0 0 | 2 1
CLAYTON CIRCUIT
| 0 0| 3 3| 1 2| 1 10| 5 3 | 0 0| 0 0| 0 0| 0 0| 0 0 | 5 3
COBB CIRCUIT
| 0 0| 1 1| 1 2| 0 0| 2 1 | 0 0| 0 0| 0 0| 0 0| 0 0 | 2 1
CONASAUGA CIRCUIT | 0 0| 0 0| 4 6| 0 0| 4 2 | 0 0| 0 0| 0 0| 0 0| 0 0 | 4 2
CORDELE CIRCUIT
| 0 0| 1 1| 0 0| 0 0| 1 1 | 0 0| 0 0| 0 0| 0 0| 0 0 | 1 1
COWETA CIRCUIT
| 0 0| 1 1| 1 2| 1 10| 3 2 | 0 0| 0 0| 0 0| 0 0| 0 0 | 3 2
DOUGHERTY CIRCUIT | 0 0| 2 2| 1 2| 0 0| 3 2 | 0 0| 0 0| 0 0| 0 0| 0 0 | 3 2
DUBLIN CIRCUIT
| 0 0| 0 0| 0 0| 0 0| 0 0 | 0 0| 0 0| 0 0| 0 0| 0 0 | 0 0
EASTERN CIRCUIT
| 0 0| 7 6| 0 0| 0 0| 7 4 | 0 0| 0 0| 0 0| 0 0| 0 0 | 7 4
FLINT CIRCUIT
| 0 0| 3 3| 1 2| 1 10| 5 3 | 0 0| 0 0| 0 0| 0 0| 0 0 | 5 3
GRIFFIN CIRCUIT
| 0 0| 3 3| 2 3| 0 0| 5 3 | 0 0| 0 0| 0 0| 0 0| 0 0 | 5 3
GWINNETT CIRCUIT | 0 0| 1 1| 0 0| 0 0| 1 1 | 0 0| 0 0| 0 0| 0 0| 0 0 | 1 1
HOUSTON CIRCUIT
| 0 0| 2 2| 2 3| 0 0| 4 2 | 0 0| 0 0| 0 0| 0 0| 0 0 | 4 2
LOOKOUT MOUNTAIN CIR| 0 0| 3 3| 1 2| 0 0| 4 2 | 0 0| 1 50| 0 0| 0 0| 1 50 | 5 3
MACON CIRCUIT
| 0 0| 4 3| 1 2| 0 0| 5 3 | 0 0| 0 0| 0 0| 0 0| 0 0 | 5 3
MIDDLE CIRCUIT
| 0 0| 2 2| 0 0| 0 0| 2 1 | 0 0| 0 0| 0 0| 0 0| 0 0 | 2 1
MOUNTAIN CIRCUIT | 0 0| 1 1| 0 0| 0 0| 1 1 | 0 0| 0 0| 0 0| 0 0| 0 0 | 1 1
NORTHEASTERN CIRCUIT| 0 0| 2 2| 0 0| 0 0| 2 1 | 0 0| 0 0| 0 0| 0 0| 0 0 | 2 1
NORTHERN CIRCUIT | 0 0| 2 2| 0 0| 1 10| 3 2 | 0 0| 0 0| 0 0| 0 0| 0 0 | 3 2
OCMULGEE CIRCUIT | 0 0| 6 5| 3 5| 0 0| 9 5 | 0 0| 0 0| 0 0| 0 0| 0 0 | 9 5
OCONEE CIRCUIT
| 1 33| 1 1| 0 0| 0 0| 2 1 | 0 0| 0 0| 0 0| 0 0| 0 0 | 2 1
OGEECHEE CIRCUIT | 0 0| 0 0| 0 0| 0 0| 0 0 | 0 0| 0 0| 0 0| 0 0| 0 0 | 0 0
PATAULA CIRCUIT
| 0 0| 0 0| 1 2| 0 0| 1 1 | 0 0| 0 0| 0 0| 0 0| 0 0 | 1 1
PIEDMONT CIRCUIT | 0 0| 1 1| 2 3| 0 0| 3 2 | 0 0| 0 0| 0 0| 0 0| 0 0 | 3 2
ROME CIRCUIT
| 0 0| 4 3| 0 0| 0 0| 4 2 | 0 0| 0 0| 0 0| 0 0| 0 0 | 4 2
SOUTH GEORGIA CIRCUI| 0 0| 0 0| 1 2| 0 0| 1 1 | 0 0| 0 0| 0 0| 0 0| 0 0 | 1 1
SOUTHERN CIRCUIT | 1 33| 3 3| 2 3| 0 0| 6 3 | 0 0| 0 0| 0 0| 0 0| 0 0 | 6 3
------------------------------------------------------------------------------------------------------------------------------------
(continued)
Georgia Department of Corrections
June, 2000
32
Page 30 Run 06/20/00
Georgia Department of Corrections Office of Planning and Analysis
Inmate statistical profile
Sample: ACTIVE PRISONERS EXCLUDING JAIL
Requestor:
Active inmates 06/20/2000
Circuit Of Conviction by current age & sex
Statistics (Continued)
|
MEN
|
WOMEN
|
| Age | Age | Age | Age | Men
| Age | Age | Age | Age |Women
|Grand
Circ Of Conviction |00-21 %|22-39 %|40-54 %|55-99 %|Total % |00-21 %|22-39 %|40-54 %|55-99 %|Total % |Total %
------------------------------------------------------------------------------------------------------------------------------------
SOUTHWESTERN CIRCUIT| 0 0| 1 1| 0 0| 0 0| 1 1 | 0 0| 0 0| 0 0| 0 0| 0 0 | 1 1
STONE MOUNTAIN CIRCU| 0 0| 11 10| 4 6| 2 20| 17 9 | 0 0| 0 0| 0 0| 0 0| 0 0 | 17 9
TALLAPOOSA CIRCUIT | 0 0| 0 0| 1 2| 0 0| 1 1 | 0 0| 0 0| 0 0| 0 0| 0 0 | 1 1
TIFTON CIRCUIT
| 0 0| 1 1| 0 0| 1 10| 2 1 | 0 0| 0 0| 0 0| 0 0| 0 0 | 2 1
TOOMBS CIRCUIT
| 0 0| 1 1| 0 0| 0 0| 1 1 | 0 0| 0 0| 0 0| 0 0| 0 0 | 1 1
WAYCROSS CIRCUIT | 0 0| 4 3| 4 6| 0 0| 8 4 | 0 0| 0 0| 0 0| 0 0| 0 0 | 8 4
WESTERN CIRCUIT
| 0 0| 4 3| 4 6| 0 0| 8 4 | 0 0| 0 0| 0 0| 0 0| 0 0 | 8 4
ROCKDALE CIRCUIT | 0 0| 2 2| 1 2| 0 0| 3 2 | 0 0| 0 0| 0 0| 0 0| 0 0 | 3 2
DOUGLAS CIRCUIT
| 0 0| 4 3| 1 2| 0 0| 5 3 | 0 0| 0 0| 0 0| 0 0| 0 0 | 5 3
APPALACHIAN CIRCUIT | 0 0| 1 1| 0 0| 0 0| 1 1 | 0 0| 0 0| 0 0| 0 0| 0 0 | 1 1
ENOTAH CIRCUIT
| 0 0| 1 1| 1 2| 0 0| 2 1 | 0 0| 0 0| 0 0| 0 0| 0 0 | 2 1
BELL-FORSYTH CIRCUIT| 0 0| 0 0| 1 2| 0 0| 1 1 | 0 0| 0 0| 0 0| 0 0| 0 0 | 1 1
------------------------------------------------------------------------------------------------------------------------------------
Total reported
| 3 100| 115 100| 62 100| 10 100| 190 100 | 0 0| 2 100| 0 0| 0 0| 2 100 | 192 100
|
|
|
|
|
|
|
|
|
|
|
Percent reported | 100.0| 100.0| 100.0| 100.0| 100.0 |
.0| 100.0|
.0|
.0| 100.0 | 100.0
|
|
|
|
|
|
|
|
|
|
|
|
|
|
|
|
|
|
|
|
|
|
NOT REPORTED
|0|0|0|0|0
|0|0|0|0|0
|0
------------------------------------------------------------------------------------------------------------------------------------
Total
| 3 | 115 | 62 | 10 | 190
|0|2|0|0|2
| 192
Georgia Department of Corrections
June, 2000
33
Page 31 Run 06/20/00
Georgia Department of Corrections Office of Planning and Analysis
Inmate statistical profile
Sample: ACTIVE PRISONERS EXCLUDING JAIL Active inmates 06/20/2000
Requestor: Statistics Home County by current age & sex
|
MEN
|
WOMEN
|
| Age | Age | Age | Age | Men
| Age | Age | Age | Age |Women
|Grand
Home County
|00-21 %|22-39 %|40-54 %|55-99 %|Total % |00-21 %|22-39 %|40-54 %|55-99 %|Total % |Total %
------------------------------------------------------------------------------------------------------------------------------------
APPLING COUNTY
| 0 0| 1 1| 1 2| 0 0| 2 1 | 0 0| 0 0| 0 0| 0 0| 0 0 | 2 1
ATKINSON COUNTY
| 0 0| 0 0| 0 0| 1 13| 1 1 | 0 0| 0 0| 0 0| 0 0| 0 0 | 1 1
BACON COUNTY
| 0 0| 0 0| 0 0| 0 0| 0 0 | 0 0| 0 0| 0 0| 0 0| 0 0 | 0 0
BAKER COUNTY
| 0 0| 0 0| 0 0| 0 0| 0 0 | 0 0| 0 0| 0 0| 0 0| 0 0 | 0 0
BALDWIN COUNTY
| 0 0| 1 1| 2 4| 0 0| 3 2 | 0 0| 0 0| 0 0| 0 0| 0 0 | 3 2
BANKS COUNTY
| 0 0| 0 0| 0 0| 0 0| 0 0 | 0 0| 0 0| 0 0| 0 0| 0 0 | 0 0
BARROW COUNTY
| 0 0| 1 1| 1 2| 0 0| 2 1 | 0 0| 0 0| 0 0| 0 0| 0 0 | 2 1
BARTOW COUNTY
| 0 0| 1 1| 2 4| 0 0| 3 2 | 0 0| 0 0| 0 0| 0 0| 0 0 | 3 2
BEN HILL COUNTY
| 0 0| 0 0| 0 0| 0 0| 0 0 | 0 0| 0 0| 0 0| 0 0| 0 0 | 0 0
BERRIEN COUNTY
| 0 0| 0 0| 0 0| 0 0| 0 0 | 0 0| 0 0| 0 0| 0 0| 0 0 | 0 0
BIBB COUNTY
| 0 0| 0 0| 0 0| 0 0| 0 0 | 0 0| 0 0| 0 0| 0 0| 0 0 | 0 0
BLECKLEY COUNTY
| 1 33| 1 1| 0 0| 0 0| 2 1 | 0 0| 0 0| 0 0| 0 0| 0 0 | 2 1
BRANTLEY COUNTY
| 0 0| 0 0| 0 0| 0 0| 0 0 | 0 0| 0 0| 0 0| 0 0| 0 0 | 0 0
BROOKS COUNTY
| 0 0| 1 1| 0 0| 0 0| 1 1 | 0 0| 0 0| 0 0| 0 0| 0 0 | 1 1
BRYAN COUNTY
| 0 0| 0 0| 0 0| 0 0| 0 0 | 0 0| 0 0| 0 0| 0 0| 0 0 | 0 0
BULLOCH COUNTY
| 0 0| 0 0| 0 0| 0 0| 0 0 | 0 0| 0 0| 0 0| 0 0| 0 0 | 0 0
BURKE COUNTY
| 0 0| 3 3| 0 0| 0 0| 3 2 | 0 0| 0 0| 0 0| 0 0| 0 0 | 3 2
BUTTS COUNTY
| 0 0| 0 0| 0 0| 1 13| 1 1 | 0 0| 0 0| 0 0| 0 0| 0 0 | 1 1
CALHOUN COUNTY
| 0 0| 0 0| 0 0| 0 0| 0 0 | 0 0| 0 0| 0 0| 0 0| 0 0 | 0 0
CAMDEN COUNTY
| 0 0| 0 0| 1 2| 0 0| 1 1 | 0 0| 0 0| 0 0| 0 0| 0 0 | 1 1
CANDLER COUNTY
| 0 0| 0 0| 0 0| 0 0| 0 0 | 0 0| 0 0| 0 0| 0 0| 0 0 | 0 0
CARROLL COUNTY
| 0 0| 2 2| 0 0| 0 0| 2 1 | 0 0| 0 0| 0 0| 0 0| 0 0 | 2 1
CATOOSA COUNTY
| 0 0| 0 0| 0 0| 0 0| 0 0 | 0 0| 0 0| 0 0| 0 0| 0 0 | 0 0
CHARLTON COUNTY
| 0 0| 0 0| 0 0| 0 0| 0 0 | 0 0| 0 0| 0 0| 0 0| 0 0 | 0 0
CHATHAM COUNTY
| 0 0| 8 8| 0 0| 0 0| 8 5 | 0 0| 0 0| 0 0| 0 0| 0 0 | 8 5
CHATTAHOOCHEE COUNTY| 0 0| 0 0| 0 0| 0 0| 0 0 | 0 0| 0 0| 0 0| 0 0| 0 0 | 0 0
CHATTOOGA COUNTY | 0 0| 1 1| 0 0| 0 0| 1 1 | 0 0| 0 0| 0 0| 0 0| 0 0 | 1 1
CHEROKEE COUNTY
| 0 0| 1 1| 1 2| 0 0| 2 1 | 0 0| 0 0| 0 0| 0 0| 0 0 | 2 1
CLARKE COUNTY
| 0 0| 3 3| 3 6| 0 0| 6 4 | 0 0| 0 0| 0 0| 0 0| 0 0 | 6 4
CLAY COUNTY
| 0 0| 0 0| 0 0| 0 0| 0 0 | 0 0| 0 0| 0 0| 0 0| 0 0 | 0 0
CLAYTON COUNTY
| 0 0| 4 4| 0 0| 1 13| 5 3 | 0 0| 0 0| 0 0| 0 0| 0 0 | 5 3
CLINCH COUNTY
| 0 0| 0 0| 0 0| 0 0| 0 0 | 0 0| 0 0| 0 0| 0 0| 0 0 | 0 0
COBB COUNTY
| 0 0| 0 0| 1 2| 0 0| 1 1 | 0 0| 0 0| 0 0| 0 0| 0 0 | 1 1
COFFEE COUNTY
| 0 0| 0 0| 0 0| 0 0| 0 0 | 0 0| 0 0| 0 0| 0 0| 0 0 | 0 0
COLQUITT COUNTY
| 0 0| 0 0| 1 2| 0 0| 1 1 | 0 0| 0 0| 0 0| 0 0| 0 0 | 1 1
COLUMBIA COUNTY
| 0 0| 0 0| 1 2| 0 0| 1 1 | 0 0| 0 0| 0 0| 0 0| 0 0 | 1 1
------------------------------------------------------------------------------------------------------------------------------------
(continued)
Georgia Department of Corrections
June, 2000
34
Page 32 Run 06/20/00
Georgia Department of Corrections Office of Planning and Analysis
Inmate statistical profile
Sample: ACTIVE PRISONERS EXCLUDING JAIL
Requestor:
Active inmates 06/20/2000
Home County by current age & sex
Statistics (CONTINUED)
|
MEN
|
WOMEN
|
| Age | Age | Age | Age | Men
| Age | Age | Age | Age |Women
|Grand
Home County
|00-21 %|22-39 %|40-54 %|55-99 %|Total % |00-21 %|22-39 %|40-54 %|55-99 %|Total % |Total %
------------------------------------------------------------------------------------------------------------------------------------
COOK COUNTY
| 0 0| 0 0| 0 0| 0 0| 0 0 | 0 0| 0 0| 0 0| 0 0| 0 0 | 0 0
COWETA COUNTY
| 0 0| 0 0| 0 0| 0 0| 0 0 | 0 0| 0 0| 0 0| 0 0| 0 0 | 0 0
CRAWFORD COUNTY
| 0 0| 0 0| 0 0| 0 0| 0 0 | 0 0| 0 0| 0 0| 0 0| 0 0 | 0 0
CRISP COUNTY
| 0 0| 1 1| 0 0| 0 0| 1 1 | 0 0| 0 0| 0 0| 0 0| 0 0 | 1 1
DADE COUNTY
| 0 0| 0 0| 0 0| 0 0| 0 0 | 0 0| 0 0| 0 0| 0 0| 0 0 | 0 0
DAWSON COUNTY
| 0 0| 0 0| 0 0| 0 0| 0 0 | 0 0| 0 0| 0 0| 0 0| 0 0 | 0 0
DECATUR COUNTY
| 0 0| 1 1| 1 2| 0 0| 2 1 | 0 0| 0 0| 0 0| 0 0| 0 0 | 2 1
DEKALB COUNTY
| 0 0| 11 11| 1 2| 0 0| 12 7 | 0 0| 0 0| 0 0| 0 0| 0 0 | 12 7
DODGE COUNTY
| 0 0| 0 0| 0 0| 0 0| 0 0 | 0 0| 0 0| 0 0| 0 0| 0 0 | 0 0
DOOLY COUNTY
| 0 0| 0 0| 0 0| 0 0| 0 0 | 0 0| 0 0| 0 0| 0 0| 0 0 | 0 0
DOUGHERTY COUNTY | 0 0| 2 2| 1 2| 0 0| 3 2 | 0 0| 0 0| 0 0| 0 0| 0 0 | 3 2
DOUGLAS COUNTY
| 0 0| 0 0| 1 2| 0 0| 1 1 | 0 0| 0 0| 0 0| 0 0| 0 0 | 1 1
EARLY COUNTY
| 0 0| 0 0| 0 0| 0 0| 0 0 | 0 0| 0 0| 0 0| 0 0| 0 0 | 0 0
ECHOLS COUNTY.
| 0 0| 0 0| 0 0| 0 0| 0 0 | 0 0| 0 0| 0 0| 0 0| 0 0 | 0 0
EFFINGHAM COUNTY | 0 0| 0 0| 0 0| 0 0| 0 0 | 0 0| 0 0| 0 0| 0 0| 0 0 | 0 0
ELBERT COUNTY
| 0 0| 0 0| 0 0| 1 13| 1 1 | 0 0| 0 0| 0 0| 0 0| 0 0 | 1 1
EMANUEL COUNTY
| 0 0| 0 0| 0 0| 0 0| 0 0 | 0 0| 0 0| 0 0| 0 0| 0 0 | 0 0
EVANS COUNTY
| 0 0| 0 0| 0 0| 0 0| 0 0 | 0 0| 0 0| 0 0| 0 0| 0 0 | 0 0
FANNIN COUNTY
| 0 0| 0 0| 0 0| 0 0| 0 0 | 0 0| 0 0| 0 0| 0 0| 0 0 | 0 0
FAYETTE COUNTY
| 0 0| 0 0| 1 2| 0 0| 1 1 | 0 0| 0 0| 0 0| 0 0| 0 0 | 1 1
FLOYD COUNTY
| 0 0| 3 3| 0 0| 0 0| 3 2 | 0 0| 0 0| 0 0| 0 0| 0 0 | 3 2
FORSYTH COUNTY
| 0 0| 0 0| 0 0| 0 0| 0 0 | 0 0| 0 0| 0 0| 0 0| 0 0 | 0 0
FRANKLIN COUNTY
| 0 0| 0 0| 0 0| 0 0| 0 0 | 0 0| 0 0| 0 0| 0 0| 0 0 | 0 0
FULTON COUNTY
| 0 0| 13 13| 8 16| 0 0| 21 13 | 0 0| 0 0| 0 0| 0 0| 0 0 | 21 13
GILMER COUNTY
| 0 0| 1 1| 0 0| 0 0| 1 1 | 0 0| 0 0| 0 0| 0 0| 0 0 | 1 1
GLASCOCK COUNTY
| 0 0| 0 0| 0 0| 0 0| 0 0 | 0 0| 0 0| 0 0| 0 0| 0 0 | 0 0
GLYNN COUNTY
| 0 0| 2 2| 0 0| 1 13| 3 2 | 0 0| 0 0| 0 0| 0 0| 0 0 | 3 2
GORDON COUNTY
| 0 0| 0 0| 0 0| 1 13| 1 1 | 0 0| 0 0| 0 0| 0 0| 0 0 | 1 1
GRADY COUNTY
| 0 0| 0 0| 0 0| 0 0| 0 0 | 0 0| 0 0| 0 0| 0 0| 0 0 | 0 0
GREENE COUNTY
| 0 0| 1 1| 0 0| 0 0| 1 1 | 0 0| 0 0| 0 0| 0 0| 0 0 | 1 1
GWINNETT COUNTY
| 0 0| 0 0| 1 2| 0 0| 1 1 | 0 0| 0 0| 0 0| 0 0| 0 0 | 1 1
HABERSHAM COUNTY | 0 0| 1 1| 0 0| 0 0| 1 1 | 0 0| 0 0| 0 0| 0 0| 0 0 | 1 1
HALL COUNTY
| 0 0| 1 1| 1 2| 0 0| 2 1 | 0 0| 0 0| 0 0| 0 0| 0 0 | 2 1
HANCOCK COUNTY
| 0 0| 0 0| 0 0| 0 0| 0 0 | 0 0| 0 0| 0 0| 0 0| 0 0 | 0 0
HARALSON COUNTY
| 0 0| 0 0| 0 0| 0 0| 0 0 | 0 0| 0 0| 0 0| 0 0| 0 0 | 0 0
------------------------------------------------------------------------------------------------------------------------------------
(continued)
Georgia Department of Corrections
June, 2000
35
Page 33 Run 06/20/00
Georgia Department of Corrections Office of Planning and Analysis
Inmate statistical profile
Sample: ACTIVE PRISONERS EXCLUDING JAIL
Requestor:
Active inmates 06/20/2000
Home County by current age & sex
Statistics (CONTINUED)
|
MEN
|
WOMEN
|
| Age | Age | Age | Age | Men
| Age | Age | Age | Age |Women
|Grand
Home County
|00-21 %|22-39 %|40-54 %|55-99 %|Total % |00-21 %|22-39 %|40-54 %|55-99 %|Total % |Total %
------------------------------------------------------------------------------------------------------------------------------------
HARRIS COUNTY
| 0 0| 0 0| 1 2| 0 0| 1 1 | 0 0| 0 0| 0 0| 0 0| 0 0 | 1 1
HART COUNTY
| 0 0| 0 0| 0 0| 0 0| 0 0 | 0 0| 0 0| 0 0| 0 0| 0 0 | 0 0
HEARD COUNTY
| 0 0| 0 0| 0 0| 0 0| 0 0 | 0 0| 0 0| 0 0| 0 0| 0 0 | 0 0
HENRY COUNTY
| 0 0| 2 2| 1 2| 0 0| 3 2 | 0 0| 0 0| 0 0| 0 0| 0 0 | 3 2
HOUSTON COUNTY
| 0 0| 2 2| 1 2| 0 0| 3 2 | 0 0| 0 0| 0 0| 0 0| 0 0 | 3 2
IRWIN COUNTY
| 0 0| 0 0| 0 0| 0 0| 0 0 | 0 0| 0 0| 0 0| 0 0| 0 0 | 0 0
JACKSON COUNTY
| 0 0| 0 0| 1 2| 0 0| 1 1 | 0 0| 0 0| 0 0| 0 0| 0 0 | 1 1
JASPER COUNTY
| 0 0| 0 0| 0 0| 0 0| 0 0 | 0 0| 0 0| 0 0| 0 0| 0 0 | 0 0
JEFF DAVIS COUNTY | 0 0| 0 0| 0 0| 0 0| 0 0 | 0 0| 0 0| 0 0| 0 0| 0 0 | 0 0
JEFFERSON COUNTY | 0 0| 0 0| 0 0| 0 0| 0 0 | 0 0| 0 0| 0 0| 0 0| 0 0 | 0 0
JENKINS COUNTY
| 0 0| 2 2| 0 0| 0 0| 2 1 | 0 0| 0 0| 0 0| 0 0| 0 0 | 2 1
JOHNSON COUNTY
| 0 0| 0 0| 0 0| 0 0| 0 0 | 0 0| 0 0| 0 0| 0 0| 0 0 | 0 0
JONES COUNTY
| 0 0| 0 0| 0 0| 0 0| 0 0 | 0 0| 0 0| 0 0| 0 0| 0 0 | 0 0
LAMAR COUNTY
| 0 0| 0 0| 0 0| 0 0| 0 0 | 0 0| 0 0| 0 0| 0 0| 0 0 | 0 0
LANIER COUNTY
| 0 0| 0 0| 0 0| 0 0| 0 0 | 0 0| 0 0| 0 0| 0 0| 0 0 | 0 0
LAURENS COUNTY
| 0 0| 1 1| 0 0| 0 0| 1 1 | 0 0| 0 0| 0 0| 0 0| 0 0 | 1 1
LEE COUNTY
| 0 0| 0 0| 0 0| 0 0| 0 0 | 0 0| 0 0| 0 0| 0 0| 0 0 | 0 0
LIBERTY COUNTY
| 0 0| 2 2| 1 2| 0 0| 3 2 | 0 0| 0 0| 0 0| 0 0| 0 0 | 3 2
LINCOLN COUNTY
| 0 0| 1 1| 0 0| 0 0| 1 1 | 0 0| 0 0| 0 0| 0 0| 0 0 | 1 1
LONG COUNTY
| 0 0| 0 0| 0 0| 0 0| 0 0 | 0 0| 0 0| 0 0| 0 0| 0 0 | 0 0
LOWNDES COUNTY
| 0 0| 1 1| 0 0| 0 0| 1 1 | 0 0| 0 0| 0 0| 0 0| 0 0 | 1 1
LUMPKIN COUNTY
| 0 0| 0 0| 0 0| 0 0| 0 0 | 0 0| 0 0| 0 0| 0 0| 0 0 | 0 0
MACON COUNTY
| 0 0| 0 0| 0 0| 0 0| 0 0 | 0 0| 0 0| 0 0| 0 0| 0 0 | 0 0
MADISON COUNTY
| 0 0| 0 0| 0 0| 0 0| 0 0 | 0 0| 0 0| 0 0| 0 0| 0 0 | 0 0
MARION COUNTY
| 0 0| 1 1| 0 0| 0 0| 1 1 | 0 0| 0 0| 0 0| 0 0| 0 0 | 1 1
MCDUFFIE COUNTY
| 0 0| 1 1| 0 0| 0 0| 1 1 | 0 0| 0 0| 0 0| 0 0| 0 0 | 1 1
MCINTOSH COUNTY
| 0 0| 2 2| 0 0| 0 0| 2 1 | 0 0| 0 0| 0 0| 0 0| 0 0 | 2 1
MERIWETHER COUNTY | 0 0| 0 0| 0 0| 0 0| 0 0 | 0 0| 0 0| 0 0| 0 0| 0 0 | 0 0
MILLER COUNTY
| 0 0| 0 0| 0 0| 0 0| 0 0 | 0 0| 0 0| 0 0| 0 0| 0 0 | 0 0
MITCHELL COUNTY
| 1 33| 0 0| 0 0| 0 0| 1 1 | 0 0| 0 0| 0 0| 0 0| 0 0 | 1 1
MONROE COUNTY
| 0 0| 0 0| 1 2| 0 0| 1 1 | 0 0| 0 0| 0 0| 0 0| 0 0 | 1 1
MONTGOMERY COUNTY | 0 0| 0 0| 0 0| 0 0| 0 0 | 0 0| 0 0| 0 0| 0 0| 0 0 | 0 0
MORGAN COUNTY
| 0 0| 1 1| 0 0| 0 0| 1 1 | 0 0| 0 0| 0 0| 0 0| 0 0 | 1 1
MURRAY COUNTY
| 0 0| 0 0| 0 0| 0 0| 0 0 | 0 0| 0 0| 0 0| 0 0| 0 0 | 0 0
MUSCOGEE COUNTY
| 0 0| 2 2| 3 6| 0 0| 5 3 | 0 0| 0 0| 0 0| 0 0| 0 0 | 5 3
------------------------------------------------------------------------------------------------------------------------------------
(continued)
Georgia Department of Corrections
June, 2000
36
Page 34 Run 06/20/00
Georgia Department of Corrections Office of Planning and Analysis
Inmate statistical profile
Sample: ACTIVE PRISONERS EXCLUDING JAIL
Requestor:
Active inmates 06/20/2000
Home County by current age & sex
Statistics (CONTINUED)
|
MEN
|
WOMEN
|
| Age | Age | Age | Age | Men
| Age | Age | Age | Age |Women
|Grand
Home County
|00-21 %|22-39 %|40-54 %|55-99 %|Total % |00-21 %|22-39 %|40-54 %|55-99 %|Total % |Total %
------------------------------------------------------------------------------------------------------------------------------------
NEWTON COUNTY
| 0 0| 1 1| 0 0| 0 0| 1 1 | 0 0| 0 0| 0 0| 0 0| 0 0 | 1 1
OCONEE COUNTY
| 0 0| 0 0| 0 0| 0 0| 0 0 | 0 0| 0 0| 0 0| 0 0| 0 0 | 0 0
OGLETHORPE COUNTY | 0 0| 0 0| 0 0| 0 0| 0 0 | 0 0| 0 0| 0 0| 0 0| 0 0 | 0 0
PAULDING COUNTY
| 0 0| 0 0| 1 2| 0 0| 1 1 | 0 0| 0 0| 0 0| 0 0| 0 0 | 1 1
PEACH COUNTY
| 0 0| 0 0| 0 0| 0 0| 0 0 | 0 0| 0 0| 0 0| 0 0| 0 0 | 0 0
PICKENS COUNTY
| 0 0| 0 0| 0 0| 0 0| 0 0 | 0 0| 0 0| 0 0| 0 0| 0 0 | 0 0
PIERCE COUNTY
| 0 0| 0 0| 1 2| 0 0| 1 1 | 0 0| 0 0| 0 0| 0 0| 0 0 | 1 1
PIKE COUNTY
| 0 0| 0 0| 1 2| 0 0| 1 1 | 0 0| 0 0| 0 0| 0 0| 0 0 | 1 1
POLK COUNTY
| 0 0| 0 0| 0 0| 0 0| 0 0 | 0 0| 0 0| 0 0| 0 0| 0 0 | 0 0
PULASKI COUNTY
| 0 0| 0 0| 0 0| 0 0| 0 0 | 0 0| 0 0| 0 0| 0 0| 0 0 | 0 0
PUTNAM COUNTY
| 0 0| 1 1| 1 2| 0 0| 2 1 | 0 0| 0 0| 0 0| 0 0| 0 0 | 2 1
QUITMAN COUNTY
| 0 0| 0 0| 0 0| 0 0| 0 0 | 0 0| 0 0| 0 0| 0 0| 0 0 | 0 0
RABUN COUNTY
| 0 0| 0 0| 0 0| 0 0| 0 0 | 0 0| 0 0| 0 0| 0 0| 0 0 | 0 0
RANDOLPH COUNTY
| 0 0| 0 0| 1 2| 0 0| 1 1 | 0 0| 0 0| 0 0| 0 0| 0 0 | 1 1
RICHMOND COUNTY
| 1 33| 3 3| 2 4| 0 0| 6 4 | 0 0| 1 50| 0 0| 0 0| 1 50 | 7 4
ROCKDALE COUNTY
| 0 0| 0 0| 1 2| 0 0| 1 1 | 0 0| 0 0| 0 0| 0 0| 0 0 | 1 1
SCHLEY COUNTY
| 0 0| 0 0| 0 0| 0 0| 0 0 | 0 0| 0 0| 0 0| 0 0| 0 0 | 0 0
SCREVEN COUNTY
| 0 0| 0 0| 0 0| 0 0| 0 0 | 0 0| 0 0| 0 0| 0 0| 0 0 | 0 0
SEMINOLE COUNTY
| 0 0| 0 0| 0 0| 0 0| 0 0 | 0 0| 0 0| 0 0| 0 0| 0 0 | 0 0
SPALDING COUNTY
| 0 0| 2 2| 0 0| 0 0| 2 1 | 0 0| 0 0| 0 0| 0 0| 0 0 | 2 1
STEPHENS COUNTY
| 0 0| 0 0| 0 0| 0 0| 0 0 | 0 0| 0 0| 0 0| 0 0| 0 0 | 0 0
STEWART COUNTY
| 0 0| 0 0| 0 0| 0 0| 0 0 | 0 0| 0 0| 0 0| 0 0| 0 0 | 0 0
SUMTER COUNTY
| 0 0| 0 0| 0 0| 0 0| 0 0 | 0 0| 0 0| 0 0| 0 0| 0 0 | 0 0
TALBOT COUNTY
| 0 0| 0 0| 0 0| 0 0| 0 0 | 0 0| 0 0| 0 0| 0 0| 0 0 | 0 0
TALIAFERRO COUNTY | 0 0| 0 0| 0 0| 0 0| 0 0 | 0 0| 0 0| 0 0| 0 0| 0 0 | 0 0
TATTNALL COUNTY
| 0 0| 1 1| 0 0| 0 0| 1 1 | 0 0| 0 0| 0 0| 0 0| 0 0 | 1 1
TAYLOR COUNTY
| 0 0| 0 0| 0 0| 0 0| 0 0 | 0 0| 0 0| 0 0| 0 0| 0 0 | 0 0
TELFAIR COUNTY
| 0 0| 0 0| 0 0| 0 0| 0 0 | 0 0| 0 0| 0 0| 0 0| 0 0 | 0 0
TERRELL COUNTY
| 0 0| 0 0| 0 0| 0 0| 0 0 | 0 0| 0 0| 0 0| 0 0| 0 0 | 0 0
THOMAS COUNTY
| 0 0| 1 1| 1 2| 0 0| 2 1 | 0 0| 0 0| 0 0| 0 0| 0 0 | 2 1
TIFT COUNTY
| 0 0| 1 1| 0 0| 1 13| 2 1 | 0 0| 0 0| 0 0| 0 0| 0 0 | 2 1
TOOMBS COUNTY
| 0 0| 1 1| 0 0| 0 0| 1 1 | 0 0| 0 0| 0 0| 0 0| 0 0 | 1 1
TOWNS COUNTY
| 0 0| 0 0| 0 0| 0 0| 0 0 | 0 0| 0 0| 0 0| 0 0| 0 0 | 0 0
TREUTLEN COUNTY
| 0 0| 0 0| 0 0| 0 0| 0 0 | 0 0| 0 0| 0 0| 0 0| 0 0 | 0 0
TROUP COUNTY
| 0 0| 0 0| 0 0| 1 13| 1 1 | 0 0| 0 0| 0 0| 0 0| 0 0 | 1 1
------------------------------------------------------------------------------------------------------------------------------------
(continued)
Georgia Department of Corrections
June, 2000
37
Page 35 Run 06/20/00
Georgia Department of Corrections Office of Planning and Analysis
Inmate statistical profile
Sample: ACTIVE PRISONERS EXCLUDING JAIL
Requestor:
Active inmates 06/20/2000
Home County by current age & sex
Statistics (CONTINUED)
|
MEN
|
WOMEN
|
| Age | Age | Age | Age | Men
| Age | Age | Age | Age |Women
|Grand
Home County
|00-21 %|22-39 %|40-54 %|55-99 %|Total % |00-21 %|22-39 %|40-54 %|55-99 %|Total % |Total %
------------------------------------------------------------------------------------------------------------------------------------
TURNER COUNTY
| 0 0| 0 0| 0 0| 0 0| 0 0 | 0 0| 0 0| 0 0| 0 0| 0 0 | 0 0
TWIGGS COUNTY
| 0 0| 0 0| 0 0| 0 0| 0 0 | 0 0| 0 0| 0 0| 0 0| 0 0 | 0 0
UNION COUNTY
| 0 0| 0 0| 1 2| 0 0| 1 1 | 0 0| 0 0| 0 0| 0 0| 0 0 | 1 1
UPSON COUNTY
| 0 0| 0 0| 0 0| 0 0| 0 0 | 0 0| 0 0| 0 0| 0 0| 0 0 | 0 0
WALKER COUNTY
| 0 0| 2 2| 0 0| 0 0| 2 1 | 0 0| 1 50| 0 0| 0 0| 1 50 | 3 2
WALTON COUNTY
| 0 0| 1 1| 1 2| 0 0| 2 1 | 0 0| 0 0| 0 0| 0 0| 0 0 | 2 1
WARE COUNTY
| 0 0| 3 3| 1 2| 0 0| 4 2 | 0 0| 0 0| 0 0| 0 0| 0 0 | 4 2
WARREN COUNTY
| 0 0| 0 0| 0 0| 0 0| 0 0 | 0 0| 0 0| 0 0| 0 0| 0 0 | 0 0
WASHINGTON COUNTY | 0 0| 0 0| 0 0| 0 0| 0 0 | 0 0| 0 0| 0 0| 0 0| 0 0 | 0 0
WAYNE COUNTY
| 0 0| 1 1| 0 0| 0 0| 1 1 | 0 0| 0 0| 0 0| 0 0| 0 0 | 1 1
WEBSTER COUNTY
| 0 0| 0 0| 0 0| 0 0| 0 0 | 0 0| 0 0| 0 0| 0 0| 0 0 | 0 0
WHEELER COUNTY
| 0 0| 0 0| 0 0| 0 0| 0 0 | 0 0| 0 0| 0 0| 0 0| 0 0 | 0 0
WHITE COUNTY
| 0 0| 0 0| 0 0| 0 0| 0 0 | 0 0| 0 0| 0 0| 0 0| 0 0 | 0 0
WHITFIELD COUNTY | 0 0| 0 0| 1 2| 0 0| 1 1 | 0 0| 0 0| 0 0| 0 0| 0 0 | 1 1
WILCOX COUNTY
| 0 0| 0 0| 0 0| 0 0| 0 0 | 0 0| 0 0| 0 0| 0 0| 0 0 | 0 0
WILKES COUNTY
| 0 0| 0 0| 0 0| 0 0| 0 0 | 0 0| 0 0| 0 0| 0 0| 0 0 | 0 0
WILKINSON COUNTY | 0 0| 1 1| 0 0| 0 0| 1 1 | 0 0| 0 0| 0 0| 0 0| 0 0 | 1 1
WORTH COUNTY
| 0 0| 0 0| 0 0| 0 0| 0 0 | 0 0| 0 0| 0 0| 0 0| 0 0 | 0 0
OUT OF STATE
| 0 0| 0 0| 0 0| 0 0| 0 0 | 0 0| 0 0| 0 0| 0 0| 0 0 | 0 0
------------------------------------------------------------------------------------------------------------------------------------
Total reported
| 3 100| 102 100| 51 100| 8 100| 164 100 | 0 0| 2 100| 0 0| 0 0| 2 100 | 166 100
|
|
|
|
|
|
|
|
|
|
|
Percent reported | 100.0|
88.7|
82.3|
80.0|
86.3 |
.0| 100.0|
.0|
.0| 100.0 |
86.5
|
|
|
|
|
|
|
|
|
|
|
|
|
|
|
|
|
|
|
|
|
|
UNKNOWN
| 0 | 13 | 11 | 2 | 26
|0|0|0|0|0
| 26
------------------------------------------------------------------------------------------------------------------------------------
Total
| 3 | 115 | 62 | 10 | 190
|0|2|0|0|2
| 192
Georgia Department of Corrections
June, 2000
38
Georgia Department of Corrections
Page 36 Run 06/20/00
Office of Planning and Analysis
Inmate statistical profile
Sample: ACTIVE PRISONERS EXCLUDING JAIL
Requestor: Statistics
Active inmates 06/20/2000
Prison Sentence In Years by current age & sex
|
MEN
|
WOMEN
|
| Age | Age | Age | Age | Men
| Age | Age | Age | Age |Women
|Grand
Sentence In Years |00-21 %|22-39 %|40-54 %|55-99 %|Total % |00-21 %|22-39 %|40-54 %|55-99 %|Total % |Total %
------------------------------------------------------------------------------------------------------------------------------------
0-1
| 0 0| 0 0| 0 0| 0 0| 0 0 | 0 0| 0 0| 0 0| 0 0| 0 0 | 0 0
1.1-2
| 0 0| 0 0| 0 0| 0 0| 0 0 | 0 0| 0 0| 0 0| 0 0| 0 0 | 0 0
2.1-3
| 0 0| 0 0| 0 0| 0 0| 0 0 | 0 0| 0 0| 0 0| 0 0| 0 0 | 0 0
3.1-4
| 0 0| 0 0| 0 0| 0 0| 0 0 | 0 0| 0 0| 0 0| 0 0| 0 0 | 0 0
4.1-5
| 0 0| 0 0| 0 0| 0 0| 0 0 | 0 0| 0 0| 0 0| 0 0| 0 0 | 0 0
5.1-6
| 0 0| 0 0| 0 0| 0 0| 0 0 | 0 0| 0 0| 0 0| 0 0| 0 0 | 0 0
6.1-7
| 0 0| 0 0| 0 0| 0 0| 0 0 | 0 0| 0 0| 0 0| 0 0| 0 0 | 0 0
7.1-8
| 0 0| 0 0| 0 0| 0 0| 0 0 | 0 0| 0 0| 0 0| 0 0| 0 0 | 0 0
8.1-9
| 0 0| 0 0| 0 0| 0 0| 0 0 | 0 0| 0 0| 0 0| 0 0| 0 0 | 0 0
9.1-10
| 0 0| 0 0| 0 0| 0 0| 0 0 | 0 0| 0 0| 0 0| 0 0| 0 0 | 0 0
10.1-12
| 0 0| 0 0| 0 0| 0 0| 0 0 | 0 0| 0 0| 0 0| 0 0| 0 0 | 0 0
12.1-15
| 0 0| 0 0| 0 0| 0 0| 0 0 | 0 0| 0 0| 0 0| 0 0| 0 0 | 0 0
15.1-20
| 0 0| 0 0| 0 0| 0 0| 0 0 | 0 0| 0 0| 0 0| 0 0| 0 0 | 0 0
20.1-OVER
| 0 0| 0 0| 0 0| 0 0| 0 0 | 0 0| 0 0| 0 0| 0 0| 0 0 | 0 0
LIFE
| 0 0| 0 0| 0 0| 0 0| 0 0 | 0 0| 0 0| 0 0| 0 0| 0 0 | 0 0
DEATH
| 0 0| 0 0| 0 0| 0 0| 0 0 | 0 0| 0 0| 0 0| 0 0| 0 0 | 0 0
LIFE W/O PAROLE
| 3 100| 115 100| 62 100| 10 100| 190 100 | 0 0| 2 100| 0 0| 0 0| 2 100 | 192 100
YOUTHFUL OFFENDERS | 0 0| 0 0| 0 0| 0 0| 0 0 | 0 0| 0 0| 0 0| 0 0| 0 0 | 0 0
------------------------------------------------------------------------------------------------------------------------------------
Total reported
| 3 100| 115 100| 62 100| 10 100| 190 100 | 0 0| 2 100| 0 0| 0 0| 2 100 | 192 100
|
|
|
|
|
|
|
|
|
|
|
Percent reported | 100.0| 100.0| 100.0| 100.0| 100.0 |
.0| 100.0|
.0|
.0| 100.0 | 100.0
|
|
|
|
|
|
|
|
|
|
|
|
|
|
|
|
|
|
|
|
|
|
NOT REPORTED
|0|0|0|0|0
|0|0|0|0|0
|0
------------------------------------------------------------------------------------------------------------------------------------
Total
| 3 | 115 | 62 | 10 | 190
|0|2|0|0|2
| 192
|
|
|
|
|
|
|
|
|
|
|
|
|
|
|
|
|
|
|
|
|
|
|
|
|
|
|
|
|
|
|
|
|
|
|
|
|
|
|
|
|
|
|
|
|
|
|
|
|
|
|
|
|
|
|
AVG EXCLUDING
|
|
|
|
|
|
|
|
|
|
|
LIFE, DEATH, YO
| .00 | .00 | .00 | .00 | .00 | .00 | .00 | .00 | .00 | .00 | .00
|
|
|
|
|
|
|
|
|
|
|
|
|
|
|
|
|
|
|
|
|
|
|
|
|
|
|
|
|
|
|
|
|
|
|
|
|
|
|
|
|
|
|
|
|
|
|
|
|
|
|
|
|
|
|
AVG INCLUDING
|
|
|
|
|
|
|
|
|
|
|
LIFE=21, YO=3 YRS | 3.00 | 3.00 | 3.00 | 3.00 | 3.00 | .00 | 3.00 | .00 | .00 | 3.00 | 3.00
Georgia Department of Corrections
June, 2000
39
Page 37 Run 06/20/00
Georgia Department of Corrections Office of Planning and Analysis
Inmate statistical profile
Sample: ACTIVE PRISONERS EXCLUDING JAIL Active inmates 06/20/2000
Requestor: Statistics Probation To Follow Prison by current age & sex
|
MEN
|
WOMEN
|
| Age | Age | Age | Age | Men
| Age | Age | Age | Age |Women
|Grand
Prob After Prison |00-21 %|22-39 %|40-54 %|55-99 %|Total % |00-21 %|22-39 %|40-54 %|55-99 %|Total % |Total %
------------------------------------------------------------------------------------------------------------------------------------
PROBATION TO FOLLOW | 0 0| 3 3| 0 0| 0 0| 3 2 | 0 0| 0 0| 0 0| 0 0| 0 0 | 3 2
NO PROBATION
| 3 100| 112 97| 62 100| 10 100| 187 98 | 0 0| 2 100| 0 0| 0 0| 2 100 | 189 98
------------------------------------------------------------------------------------------------------------------------------------
Total reported
| 3 100| 115 100| 62 100| 10 100| 190 100 | 0 0| 2 100| 0 0| 0 0| 2 100 | 192 100
|
|
|
|
|
|
|
|
|
|
|
Percent reported | 100.0| 100.0| 100.0| 100.0| 100.0 |
.0| 100.0|
.0|
.0| 100.0 | 100.0
|
|
|
|
|
|
|
|
|
|
|
|
|
|
|
|
|
|
|
|
|
|
NOT REPORTED
|0|0|0|0|0
|0|0|0|0|0
|0
------------------------------------------------------------------------------------------------------------------------------------
Total
| 3 | 115 | 62 | 10 | 190
|0|2|0|0|2
| 192
Georgia Department of Corrections
June, 2000
40
Page 38 Run 06/20/00
Georgia Department of Corrections Office of Planning and Analysis
Inmate statistical profile
Sample: ACTIVE PRISONERS EXCLUDING JAIL Active inmates 06/20/2000
Requestor: Statistics Admission Type by current age & sex
|
MEN
|
WOMEN
|
| Age | Age | Age | Age | Men
| Age | Age | Age | Age |Women
|Grand
Admission Type
|00-21 %|22-39 %|40-54 %|55-99 %|Total % |00-21 %|22-39 %|40-54 %|55-99 %|Total % |Total %
------------------------------------------------------------------------------------------------------------------------------------
COMMITTED FROM COURT| 1 33| 34 30| 20 32| 2 20| 57 30 | 0 0| 2 100| 0 0| 0 0| 2 100 | 59 31
RETURN APPEAL/BOND | 0 0| 0 0| 0 0| 0 0| 0 0 | 0 0| 0 0| 0 0| 0 0| 0 0 | 0 0
PAROLE REV/NEW SENT | 0 0| 11 10| 7 11| 0 0| 18 9 | 0 0| 0 0| 0 0| 0 0| 0 0 | 18 9
PAR REV/NO NEW SENT | 0 0| 3 3| 1 2| 0 0| 4 2 | 0 0| 0 0| 0 0| 0 0| 0 0 | 4 2
PROB VIOL/TOTAL REV | 0 0| 0 0| 0 0| 0 0| 0 0 | 0 0| 0 0| 0 0| 0 0| 0 0 | 0 0
PROB VIOL/PARTIAL | 0 0| 0 0| 0 0| 0 0| 0 0 | 0 0| 0 0| 0 0| 0 0| 0 0 | 0 0
ADMIT FM OTHER CUST | 0 0| 0 0| 0 0| 0 0| 0 0 | 0 0| 0 0| 0 0| 0 0| 0 0 | 0 0
SHOCK INCARCERATION | 0 0| 0 0| 0 0| 0 0| 0 0 | 0 0| 0 0| 0 0| 0 0| 0 0 | 0 0
PROB REV/REMAINDER | 0 0| 2 2| 1 2| 0 0| 3 2 | 0 0| 0 0| 0 0| 0 0| 0 0 | 3 2
NEW SENT/PAR REV PND| 0 0| 0 0| 1 2| 0 0| 1 1 | 0 0| 0 0| 0 0| 0 0| 0 0 | 1 1
LIFE W/O PAROLE
| 2 67| 65 57| 32 52| 7 70| 106 56 | 0 0| 0 0| 0 0| 0 0| 0 0 | 106 55
PAROLE REV BOOT CAMP| 0 0| 0 0| 0 0| 0 0| 0 0 | 0 0| 0 0| 0 0| 0 0| 0 0 | 0 0
PAR REV/RSN UNKNOWN | 0 0| 0 0| 0 0| 1 10| 1 1 | 0 0| 0 0| 0 0| 0 0| 0 0 | 1 1
PROBATION/PAROLE REV| 0 0| 0 0| 0 0| 0 0| 0 0 | 0 0| 0 0| 0 0| 0 0| 0 0 | 0 0
PB PAROLE RESCINDED | 0 0| 0 0| 0 0| 0 0| 0 0 | 0 0| 0 0| 0 0| 0 0| 0 0 | 0 0
PROB REVOCATION/SC | 0 0| 0 0| 0 0| 0 0| 0 0 | 0 0| 0 0| 0 0| 0 0| 0 0 | 0 0
PAR REV/REVOC CENTER| 0 0| 0 0| 0 0| 0 0| 0 0 | 0 0| 0 0| 0 0| 0 0| 0 0 | 0 0
INFORMATION ONLY | 0 0| 0 0| 0 0| 0 0| 0 0 | 0 0| 0 0| 0 0| 0 0| 0 0 | 0 0
INCOMPLETE SENT PKG | 0 0| 0 0| 0 0| 0 0| 0 0 | 0 0| 0 0| 0 0| 0 0| 0 0 | 0 0
HANCOCK REVOC CENTER| 0 0| 0 0| 0 0| 0 0| 0 0 | 0 0| 0 0| 0 0| 0 0| 0 0 | 0 0
WHITWORTH DETENTION | 0 0| 0 0| 0 0| 0 0| 0 0 | 0 0| 0 0| 0 0| 0 0| 0 0 | 0 0
DCYS AT RISK
| 0 0| 0 0| 0 0| 0 0| 0 0 | 0 0| 0 0| 0 0| 0 0| 0 0 | 0 0
OTHER
| 0 0| 0 0| 0 0| 0 0| 0 0 | 0 0| 0 0| 0 0| 0 0| 0 0 | 0 0
------------------------------------------------------------------------------------------------------------------------------------
Total reported
| 3 100| 115 100| 62 100| 10 100| 190 100 | 0 0| 2 100| 0 0| 0 0| 2 100 | 192 100
|
|
|
|
|
|
|
|
|
|
|
Percent reported | 100.0| 100.0| 100.0| 100.0| 100.0 |
.0| 100.0|
.0|
.0| 100.0 | 100.0
|
|
|
|
|
|
|
|
|
|
|
|
|
|
|
|
|
|
|
|
|
|
UNKNOWN
|0|0|0|0|0
|0|0|0|0|0
|0
------------------------------------------------------------------------------------------------------------------------------------
Total
| 3 | 115 | 62 | 10 | 190
|0|2|0|0|2
| 192
Georgia Department of Corrections
June, 2000
41
Page 39 Run 06/20/00
Georgia Department of Corrections Office of Planning and Analysis
Inmate statistical profile
Sample: ACTIVE PRISONERS EXCLUDING JAIL Active inmates 06/20/2000
Requestor: Statistics Release Type by current age & sex
|
MEN
|
WOMEN
|
| Age | Age | Age | Age | Men
| Age | Age | Age | Age |Women
|Grand
Release Type
|00-21 %|22-39 %|40-54 %|55-99 %|Total % |00-21 %|22-39 %|40-54 %|55-99 %|Total % |Total %
------------------------------------------------------------------------------------------------------------------------------------
Active
| 3 100| 115 100| 62 100| 10 100| 190 100 | 0 0| 2 100| 0 0| 0 0| 2 100 | 192 100
------------------------------------------------------------------------------------------------------------------------------------
Total
| 3 | 115 | 62 | 10 | 190
|0|2|0|0|2
| 192
Georgia Department of Corrections
June, 2000
42
Page 40 Run 06/20/00
Georgia Department of Corrections Office of Planning and Analysis
Inmate statistical profile
Sample: ACTIVE PRISONERS EXCLUDING JAIL Active inmates 06/20/2000
Requestor: Statistics Inst By Group by current age & sex
|
MEN
|
WOMEN
|
| Age | Age | Age | Age | Men
| Age | Age | Age | Age |Women
|Grand
Inst By Group
|00-21 %|22-39 %|40-54 %|55-99 %|Total % |00-21 %|22-39 %|40-54 %|55-99 %|Total % |Total %
------------------------------------------------------------------------------------------------------------------------------------
County jails
| 0 0| 0 0| 0 0| 0 0| 0 0 | 0 0| 0 0| 0 0| 0 0| 0 0 | 0 0
Transitional centers| 0 0| 0 0| 0 0| 0 0| 0 0 | 0 0| 0 0| 0 0| 0 0| 0 0 | 0 0
County camps
| 0 0| 0 0| 0 0| 0 0| 0 0 | 0 0| 0 0| 0 0| 0 0| 0 0 | 0 0
Inmate boot camps | 0 0| 0 0| 0 0| 0 0| 0 0 | 0 0| 0 0| 0 0| 0 0| 0 0 | 0 0
State prisons
| 3 100| 115 100| 62 100| 10 100| 190 100 | 0 0| 2 100| 0 0| 0 0| 2 100 | 192 100
Private prisons
| 0 0| 0 0| 0 0| 0 0| 0 0 | 0 0| 0 0| 0 0| 0 0| 0 0 | 0 0
Other
| 0 0| 0 0| 0 0| 0 0| 0 0 | 0 0| 0 0| 0 0| 0 0| 0 0 | 0 0
------------------------------------------------------------------------------------------------------------------------------------
Total reported
| 3 100| 115 100| 62 100| 10 100| 190 100 | 0 0| 2 100| 0 0| 0 0| 2 100 | 192 100
|
|
|
|
|
|
|
|
|
|
|
Percent reported | 100.0| 100.0| 100.0| 100.0| 100.0 |
.0| 100.0|
.0|
.0| 100.0 | 100.0
|
|
|
|
|
|
|
|
|
|
|
|
|
|
|
|
|
|
|
|
|
|
Not reported
|0|0|0|0|0
|0|0|0|0|0
|0
------------------------------------------------------------------------------------------------------------------------------------
Total
| 3 | 115 | 62 | 10 | 190
|0|2|0|0|2
| 192
Georgia Department of Corrections
June, 2000
43
Page 41 Run 06/20/00
Georgia Department of Corrections Office of Planning and Analysis
Inmate statistical profile
Sample: ACTIVE PRISONERS EXCLUDING JAIL Active inmates 06/20/2000
Requestor: Statistics Institution by current age & sex
|
MEN
|
WOMEN
|
| Age | Age | Age | Age | Men
| Age | Age | Age | Age |Women
|Grand
Institution
|00-21 %|22-39 %|40-54 %|55-99 %|Total % |00-21 %|22-39 %|40-54 %|55-99 %|Total % |Total %
------------------------------------------------------------------------------------------------------------------------------------
Ware Prison
| 0 0| 10 9| 8 13| 0 0| 18 9 | 0 0| 0 0| 0 0| 0 0| 0 0 | 18 9
Phillips Prison
| 0 0| 6 5| 1 2| 0 0| 7 4 | 0 0| 0 0| 0 0| 0 0| 0 0 | 7 4
Arrendale Prison | 1 33| 3 3| 0 0| 0 0| 4 2 | 0 0| 0 0| 0 0| 0 0| 0 0 | 4 2
Georgia State Prison| 0 0| 20 17| 8 13| 1 10| 29 15 | 0 0| 0 0| 0 0| 0 0| 0 0 | 29 15
Mens Prison
| 0 0| 0 0| 0 0| 1 10| 1 1 | 0 0| 0 0| 0 0| 0 0| 0 0 | 1 1
Jackson Prison-Diag | 0 0| 1 1| 1 2| 0 0| 2 1 | 0 0| 0 0| 0 0| 0 0| 0 0 | 2 1
Augusta Med Prison | 0 0| 3 3| 2 3| 4 40| 9 5 | 0 0| 0 0| 0 0| 0 0| 0 0 | 9 5
Valdosta Prison
| 1 33| 24 21| 12 19| 1 10| 38 20 | 0 0| 0 0| 0 0| 0 0| 0 0 | 38 20
Hays Prison
| 0 0| 10 9| 9 15| 2 20| 21 11 | 0 0| 0 0| 0 0| 0 0| 0 0 | 21 11
Hancock Prison
| 0 0| 5 4| 4 6| 0 0| 9 5 | 0 0| 0 0| 0 0| 0 0| 0 0 | 9 5
Telfair Prison
| 0 0| 10 9| 5 8| 0 0| 15 8 | 0 0| 0 0| 0 0| 0 0| 0 0 | 15 8
Macon Prison
| 0 0| 9 8| 7 11| 0 0| 16 8 | 0 0| 0 0| 0 0| 0 0| 0 0 | 16 8
Smith Prison
| 1 33| 14 12| 5 8| 1 10| 21 11 | 0 0| 0 0| 0 0| 0 0| 0 0 | 21 11
Metro Womens Prison | 0 0| 0 0| 0 0| 0 0| 0 0 | 0 0| 1 50| 0 0| 0 0| 1 50 | 1 1
Pulaski Womens Pris | 0 0| 0 0| 0 0| 0 0| 0 0 | 0 0| 1 50| 0 0| 0 0| 1 50 | 1 1
------------------------------------------------------------------------------------------------------------------------------------
Total reported
| 3 100| 115 100| 62 100| 10 100| 190 100 | 0 0| 2 100| 0 0| 0 0| 2 100 | 192 100
|
|
|
|
|
|
|
|
|
|
|
Percent reported | 100.0| 100.0| 100.0| 100.0| 100.0 |
.0| 100.0|
.0|
.0| 100.0 | 100.0
|
|
|
|
|
|
|
|
|
|
|
|
|
|
|
|
|
|
|
|
|
|
Not Reported
|0|0|0|0|0
|0|0|0|0|0
|0
------------------------------------------------------------------------------------------------------------------------------------
Total
| 3 | 115 | 62 | 10 | 190
|0|2|0|0|2
| 192
Georgia Department of Corrections
June, 2000
44
Page 42 Run 06/20/00
Georgia Department of Corrections Office of Planning and Analysis
Inmate statistical profile
Sample: ACTIVE PRISONERS EXCLUDING JAIL Active inmates 06/20/2000
Requestor: Statistics Misdemeanors And Felonies by current age & sex
|
MEN
|
WOMEN
|
| Age | Age | Age | Age | Men
| Age | Age | Age | Age |Women
|Grand
Crime Type
|00-21 %|22-39 %|40-54 %|55-99 %|Total % |00-21 %|22-39 %|40-54 %|55-99 %|Total % |Total %
------------------------------------------------------------------------------------------------------------------------------------
MISDEMEANOR
| 0 0| 0 0| 0 0| 0 0| 0 0 | 0 0| 0 0| 0 0| 0 0| 0 0 | 0 0
FELONY
| 3 100| 115 100| 62 100| 10 100| 190 100 | 0 0| 2 100| 0 0| 0 0| 2 100 | 192 100
------------------------------------------------------------------------------------------------------------------------------------
Total reported
| 3 100| 115 100| 62 100| 10 100| 190 100 | 0 0| 2 100| 0 0| 0 0| 2 100 | 192 100
|
|
|
|
|
|
|
|
|
|
|
Percent reported | 100.0| 100.0| 100.0| 100.0| 100.0 |
.0| 100.0|
.0|
.0| 100.0 | 100.0
|
|
|
|
|
|
|
|
|
|
|
|
|
|
|
|
|
|
|
|
|
|
NOT REPORTED
|0|0|0|0|0
|0|0|0|0|0
|0
------------------------------------------------------------------------------------------------------------------------------------
Total
| 3 | 115 | 62 | 10 | 190
|0|2|0|0|2
| 192
Georgia Department of Corrections
June, 2000
45
Page 43 Run 06/20/00
Georgia Department of Corrections Office of Planning and Analysis
Inmate statistical profile
Sample: ACTIVE PRISONERS EXCLUDING JAIL Active inmates 06/20/2000
Requestor: Statistics Crimes By Group by current age & sex
|
MEN
|
WOMEN
|
| Age | Age | Age | Age | Men
| Age | Age | Age | Age |Women
|Grand
Crimes By Group
|00-21 %|22-39 %|40-54 %|55-99 %|Total % |00-21 %|22-39 %|40-54 %|55-99 %|Total % |Total %
------------------------------------------------------------------------------------------------------------------------------------
HOMICIDE
| 3 100| 81 70| 23 37| 6 60| 113 59 | 0 0| 2 100| 0 0| 0 0| 2 100 | 115 60
ABORTION
| 0 0| 0 0| 0 0| 0 0| 0 0 | 0 0| 0 0| 0 0| 0 0| 0 0 | 0 0
BODILY INJRY&REL OFF| 0 0| 6 5| 13 21| 2 20| 21 11 | 0 0| 0 0| 0 0| 0 0| 0 0 | 21 11
ARSON & REL OFF
| 0 0| 0 0| 0 0| 0 0| 0 0 | 0 0| 0 0| 0 0| 0 0| 0 0 | 0 0
DAMAGE OF PROPERTY | 0 0| 0 0| 0 0| 0 0| 0 0 | 0 0| 0 0| 0 0| 0 0| 0 0 | 0 0
BURGLARY & REL OFF | 0 0| 0 0| 0 0| 0 0| 0 0 | 0 0| 0 0| 0 0| 0 0| 0 0 | 0 0
FORGERY & REL OFF | 0 0| 0 0| 0 0| 0 0| 0 0 | 0 0| 0 0| 0 0| 0 0| 0 0 | 0 0
THEFT
| 0 0| 0 0| 0 0| 0 0| 0 0 | 0 0| 0 0| 0 0| 0 0| 0 0 | 0 0
ROBBERY
| 0 0| 13 11| 13 21| 1 10| 27 14 | 0 0| 0 0| 0 0| 0 0| 0 0 | 27 14
SEXUAL OFFENSES
| 0 0| 10 9| 12 19| 1 10| 23 12 | 0 0| 0 0| 0 0| 0 0| 0 0 | 23 12
OBSCENITY CRIMES | 0 0| 0 0| 0 0| 0 0| 0 0 | 0 0| 0 0| 0 0| 0 0| 0 0 | 0 0
TREASON & REL OFF | 0 0| 0 0| 0 0| 0 0| 0 0 | 0 0| 0 0| 0 0| 0 0| 0 0 | 0 0
CRIMES INVOLVNG GOVT| 0 0| 0 0| 0 0| 0 0| 0 0 | 0 0| 0 0| 0 0| 0 0| 0 0 | 0 0
FALSIFICATIONS
| 0 0| 0 0| 0 0| 0 0| 0 0 | 0 0| 0 0| 0 0| 0 0| 0 0 | 0 0
OBSTRUCT LAW ENFORCE| 0 0| 0 0| 0 0| 0 0| 0 0 | 0 0| 0 0| 0 0| 0 0| 0 0 | 0 0
DISORDERLY CONDUCT | 0 0| 0 0| 0 0| 0 0| 0 0 | 0 0| 0 0| 0 0| 0 0| 0 0 | 0 0
GAMBLING & REL OFF | 0 0| 0 0| 0 0| 0 0| 0 0 | 0 0| 0 0| 0 0| 0 0| 0 0 | 0 0
CRUELTY TO CHILDREN | 0 0| 0 0| 0 0| 0 0| 0 0 | 0 0| 0 0| 0 0| 0 0| 0 0 | 0 0
CRIMES WITH GUNS | 0 0| 0 0| 0 0| 0 0| 0 0 | 0 0| 0 0| 0 0| 0 0| 0 0 | 0 0
INVASION PRIVACY | 0 0| 0 0| 0 0| 0 0| 0 0 | 0 0| 0 0| 0 0| 0 0| 0 0 | 0 0
RACKETEERING
| 0 0| 0 0| 0 0| 0 0| 0 0 | 0 0| 0 0| 0 0| 0 0| 0 0 | 0 0
DRUG ABUSE OFFENSES | 0 0| 4 3| 1 2| 0 0| 5 3 | 0 0| 0 0| 0 0| 0 0| 0 0 | 5 3
DRUG TRAFFICKING | 0 0| 1 1| 0 0| 0 0| 1 1 | 0 0| 0 0| 0 0| 0 0| 0 0 | 1 1
AUTO CRIMES
| 0 0| 0 0| 0 0| 0 0| 0 0 | 0 0| 0 0| 0 0| 0 0| 0 0 | 0 0
REVENUE & CONTRABAND| 0 0| 0 0| 0 0| 0 0| 0 0 | 0 0| 0 0| 0 0| 0 0| 0 0 | 0 0
CRIMES OF OTH STATES| 0 0| 0 0| 0 0| 0 0| 0 0 | 0 0| 0 0| 0 0| 0 0| 0 0 | 0 0
MISC. FELONIES
| 0 0| 0 0| 0 0| 0 0| 0 0 | 0 0| 0 0| 0 0| 0 0| 0 0 | 0 0
MISDEMEANORS
| 0 0| 0 0| 0 0| 0 0| 0 0 | 0 0| 0 0| 0 0| 0 0| 0 0 | 0 0
------------------------------------------------------------------------------------------------------------------------------------
Total reported
| 3 100| 115 100| 62 100| 10 100| 190 100 | 0 0| 2 100| 0 0| 0 0| 2 100 | 192 100
|
|
|
|
|
|
|
|
|
|
|
Percent reported | 100.0| 100.0| 100.0| 100.0| 100.0 |
.0| 100.0|
.0|
.0| 100.0 | 100.0
|
|
|
|
|
|
|
|
|
|
|
|
|
|
|
|
|
|
|
|
|
|
NOT REPORTED
|0|0|0|0|0
|0|0|0|0|0
|0
------------------------------------------------------------------------------------------------------------------------------------
Total
| 3 | 115 | 62 | 10 | 190
|0|2|0|0|2
| 192
Georgia Department of Corrections
June, 2000
46
Page 44 Run 06/20/00
Georgia Department of Corrections Office of Planning and Analysis
Inmate statistical profile
Sample: ACTIVE PRISONERS EXCLUDING JAIL Active inmates 06/20/2000
Requestor: Statistics Most Serious Offense by current age & sex
|
MEN
|
WOMEN
|
| Age | Age | Age | Age | Men
| Age | Age | Age | Age |Women
|Grand
Most Serious Offense|00-21 %|22-39 %|40-54 %|55-99 %|Total % |00-21 %|22-39 %|40-54 %|55-99 %|Total % |Total %
------------------------------------------------------------------------------------------------------------------------------------
Misdemeanors
|
|
|
------------------------------------------------------------------------------------------------------------------------------------
------------------------------------------------------------------------------------------------------------------------------------
------------------------------------------------------------------------------------------------------------------------------------
FELONIES
|
|
|
------------------------------------------------------------------------------------------------------------------------------------
------------------------------------------------------------------------------------------------------------------------------------
MURDER
| 3 100| 81 70| 23 37| 6 60| 113 59 | 0 0| 2 100| 0 0| 0 0| 2 100 | 115 60
KIDNAPPING
| 0 0| 6 5| 13 21| 2 20| 21 11 | 0 0| 0 0| 0 0| 0 0| 0 0 | 21 11
ARMED ROBBERY
| 0 0| 13 11| 13 21| 1 10| 27 14 | 0 0| 0 0| 0 0| 0 0| 0 0 | 27 14
RAPE
| 0 0| 6 5| 11 18| 1 10| 18 9 | 0 0| 0 0| 0 0| 0 0| 0 0 | 18 9
AGGRAV. CHILD MOLEST| 0 0| 4 3| 1 2| 0 0| 5 3 | 0 0| 0 0| 0 0| 0 0| 0 0 | 5 3
VIOLATE GA CNTRL SBS| 0 0| 1 1| 0 0| 0 0| 1 1 | 0 0| 0 0| 0 0| 0 0| 0 0 | 1 1
SALE/DISTRIBUTION CO| 0 0| 2 2| 0 0| 0 0| 2 1 | 0 0| 0 0| 0 0| 0 0| 0 0 | 2 1
POSSESSION OF COCAIN| 0 0| 1 1| 1 2| 0 0| 2 1 | 0 0| 0 0| 0 0| 0 0| 0 0 | 2 1
ATT/CONSPRCY COMMT C| 0 0| 1 1| 0 0| 0 0| 1 1 | 0 0| 0 0| 0 0| 0 0| 0 0 | 1 1
------------------------------------------------------------------------------------------------------------------------------------
Total reported
| 3 100| 115 100| 62 100| 10 100| 190 100 | 0 0| 2 100| 0 0| 0 0| 2 100 | 192 100
|
|
|
|
|
|
|
|
|
|
|
Percent reported | 100.0| 100.0| 100.0| 100.0| 100.0 |
.0| 100.0|
.0|
.0| 100.0 | 100.0
|
|
|
|
|
|
|
|
|
|
|
|
|
|
|
|
|
|
|
|
|
|
NOT REPORTED
|0|0|0|0|0
|0|0|0|0|0
|0
------------------------------------------------------------------------------------------------------------------------------------
Total
| 3 | 115 | 62 | 10 | 190
|0|2|0|0|2
| 192
Georgia Department of Corrections
June, 2000
47
Page 45 Run 06/20/00
Georgia Department of Corrections Office of Planning and Analysis
Inmate statistical profile
Sample: ACTIVE PRISONERS EXCLUDING JAIL Active inmates 06/20/2000
Requestor: Statistics Most Serious Crime Type by current age & sex
|
MEN
|
WOMEN
|
| Age | Age | Age | Age | Men
| Age | Age | Age | Age |Women
|Grand
Crime Type
|00-21 %|22-39 %|40-54 %|55-99 %|Total % |00-21 %|22-39 %|40-54 %|55-99 %|Total % |Total %
------------------------------------------------------------------------------------------------------------------------------------
VIOL/PERSN
| 3 100| 100 87| 49 79| 9 90| 161 85 | 0 0| 2 100| 0 0| 0 0| 2 100 | 163 85
NVIOL/PERS
| 0 0| 0 0| 0 0| 0 0| 0 0 | 0 0| 0 0| 0 0| 0 0| 0 0 | 0 0
PROPERTY
| 0 0| 0 0| 0 0| 0 0| 0 0 | 0 0| 0 0| 0 0| 0 0| 0 0 | 0 0
DRUG SALES
| 0 0| 3 3| 0 0| 0 0| 3 2 | 0 0| 0 0| 0 0| 0 0| 0 0 | 3 2
DRUG POSSN
| 0 0| 2 2| 1 2| 0 0| 3 2 | 0 0| 0 0| 0 0| 0 0| 0 0 | 3 2
ALCOHOL
| 0 0| 0 0| 0 0| 0 0| 0 0 | 0 0| 0 0| 0 0| 0 0| 0 0 | 0 0
HABIT/DUI
| 0 0| 0 0| 0 0| 0 0| 0 0 | 0 0| 0 0| 0 0| 0 0| 0 0 | 0 0
SEX OFFEND
| 0 0| 10 9| 12 19| 1 10| 23 12 | 0 0| 0 0| 0 0| 0 0| 0 0 | 23 12
OTHER
| 0 0| 0 0| 0 0| 0 0| 0 0 | 0 0| 0 0| 0 0| 0 0| 0 0 | 0 0
------------------------------------------------------------------------------------------------------------------------------------
Total reported
| 3 100| 115 100| 62 100| 10 100| 190 100 | 0 0| 2 100| 0 0| 0 0| 2 100 | 192 100
|
|
|
|
|
|
|
|
|
|
|
Percent reported | 100.0| 100.0| 100.0| 100.0| 100.0 |
.0| 100.0|
.0|
.0| 100.0 | 100.0
|
|
|
|
|
|
|
|
|
|
|
|
|
|
|
|
|
|
|
|
|
|
NOT REPORTED
|0|0|0|0|0
|0|0|0|0|0
|0
------------------------------------------------------------------------------------------------------------------------------------
Total
| 3 | 115 | 62 | 10 | 190
|0|2|0|0|2
| 192
Georgia Department of Corrections
June, 2000
48
Georgia Department of Corrections
June, 2000
49