- Collection:
- Georgia Government Publications
- Title:
- Dimensions: measuring Georgia's workforce, 2022 November
- Creator:
- Georgia. Department of Labor
- Contributor to Resource:
- Georgia. Department of Labor
- Publisher:
- Atlanta, Ga. : Georgia. Department of Labor
- Date of Original:
- 2022-11
- Subject:
- Labor market--Georgia--Statistics--Periodicals
Wages--Georgia--Statistics--Periodicals
Hours of labor--Georgia--Statistics--Periodicals - Location:
- United States, Georgia, 32.75042, -83.50018
- Medium:
- serials (publications)
- Type:
- Text
- Format:
- application/pdf
- Description:
- Monthly employment statistics for Georgia
- External Identifiers:
- Call Number GA L200.E46 P1 T7 48/11
- Metadata URL:
- https://dlg.galileo.usg.edu/id:dlg_ggpd_i-ga-bl200-pe46-bp1-bt7-b48-s11-belec-p-btext
- Digital Object URL:
- https://dlg.galileo.usg.edu/do:dlg_ggpd_i-ga-bl200-pe46-bp1-bt7-b48-s11-belec-p-btext
- Language:
- eng
- Holding Institution:
- University of Georgia. Map and Government Information Library
- Rights:
-

Jackson Madison Elbert
Polk
Cobb
Gwinnett Barrow Clarke
D I M E N S I O Paulding
Haralson Douglas
DeKalb Rock-
Walton
Oconee Oglethorpe Wilkes
Lincoln
EdgefieSlCd,
Carroll
Fulton Clayton
dale Newton
Morgan Greene Taliaferro
Columbia
Fayette Henry
McDuffie Warren
Heard
Coweta
Spalding Butts Jasper Putnam Hancock
Glascock
Richmond
AikenSC,
N
S
Russell, AL
Measuring Georgia's Workforce Troup Meriwether Pike Lamar Monroe Upson
Jones
Baldwin
Jefferson Washington
Burke
Bibb
Harris
Talbot
Crawford
November
Muscogee
2022
DataTaylor
Peach
Wilkinson Twiggs
Johnson
Jenkins Emanuel
Screven
Volume XLVIII, Number 11
November 2022 Employment Situation Marion Chattahoo-
Houston Bleckley Macon
Laurens
Treutlen
chee
In millions
CandlGereorgBuialloEcmh ploEyfmfinegnhatm
(Seasonally Adjusted)
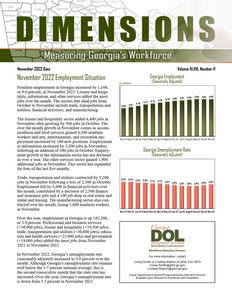
Nonfarm employSmchleeny t in GeorgDioaoliyncrPeualassekdi byD1od,1ge00, or S0t.e0waprtercWenebt,stienr NoSvumemterber 2022. Leisure and hospi-
Montgomery
Wheeler
Toombs
Evans
Bryan
Qutjiaotmlbiatsyno, vinefrotrhmeamtioonnt,ha.nTdhoethseecrtsoerCrsvritsihpcaets
adWdilecodx the mosTtelfair shed jobs from
OctoRabnedroltpohNoTvereremll ber iLneeclude tradTeu,rntrear nsportBaetnioHnilland
Jeff Da4v.i6s5
Tattnall 4.6A7 pp4l.i7n0g 4.73 4.75
4.76
4.78 4.80
Liberty
Long
Chatham
4.81 4.82 4.84
4.83
4.83
utilities; financial activities; and manufacturing.
Clay Calhoun Dougherty Worth
Irwin
Coffee
The leisure and hospitality sector addeTdift4,400 jobs in
Bacon
Wayne
McIntosh
NEoavrleymber aftBearkegrrowing by 500 jobs in October. The
Pierce
omvoedratthMioeilnlemraonndthfogordowMseitthrcvhieincll eNs ogvaCeinomleqbdueit4tr,c3o0Cm0ooenksoanBsfeararricemncomA-tkinson
Ware
Brantley
Glynn
workers and arts, entertainment, and recreation emLa-nier ploSyemmineonlet increased by 100 new positions. Employment
ClincNhov-21 Dec-21
Jan-22
Feb-22
Mar-22
Apr-22 May-22
Camden
Jun-22
Jul-22
Aug-22 Sep-22
Oct-22
Nov-22
in informDaetcioatnurincreGarasdeyd byTh3om,2a0s 0 jBorbosokisn NoLvowemndbeser,
Charlton
following an addition of 300 jobs in October. EmploEcyh-ols
Georgia Unemployment Rate
ment growth in the information sector has not declined
(Seasonally Adjusted)
in over a year. The other services sector gained 1,900
additional jobs in November. This sector has expanded
for four of the last five months.
Trade, transportation and utilities contracted by 5,200 jobs in November following a loss of 2,300 in October. Employment fell by 2,600 in financial activities over the month, constituted by a decrease of 2,500 finance and insurance jobs and a 100 job drop in real estate and rental and leasing. The manufacturing sector also contracted over the month, losing 1,800 nonfarm workers in November.
Over the year, employment in Georgia is up 182,200, or 3.9 percent. Professional and business services (+38,900 jobs), leisure and hospitality (+35,500 jobs), trade, transportation and utilities (+30,800 jobs), education and health services (+21,900 jobs) and government (+19,000 jobs) added the most jobs from November 2021 to November 2022.
In November 2022, Georgia's unemployment rate (seasonally adjusted) increased to 3.0 percent over the month. Although Georgia's unemployment rate remains well below the 3.7 percent national average, this is the second consecutive month that the state rate has increased. Over the year, Georgia's unemployment rate is down from 3.3 percent in November 2021.
3.3% 3.3% 3.2% 3.2% 3.1% 3.1% 3.0% 2.9% 2.8% 2.8% 2.8% 2.9% 3.0%
Nov-21 Dec-21 Jan-22 Feb-22 Mar-22 Apr-22 May-22 Jun-22 Jul-22 Aug-22 Sep-22 Oct-22 Nov-22
Workforce Statistics Division For more information, contact Corey Smith or Lindsey Adams at (404) 232-3875 Corey.Smith@gdol.ga.gov Lindsey.Adams@gdol.ga.gov Equal Opportunity Employer/ProgramAuxiliary Aids and Services Available upon Request to Individuals with Disabilities
GEORGIA Nonfarm Employment
(In thousands)
(Seasonally Adjusted)
Preliminary
Revised Revised
NOV 2022 OCT 2022 NOV 2021
Change in Jobs from OCT 2022
Net %
Change in Jobs from NOV 2021
Net %
Total Nonfarm
4,833.6
4,832.5
4,651.4
1.1 0.0
182.2 3.9
Total Private
4,145.2
4,144.5
3,982.0
0.7 0.0
163.2 4.1
Goods Producing
626.5
628.5
620.0
-2.0 -0.3
6.5 1.0
Service-Providing
4,207.1
4,204.0
4,031.4
3.1 0.1
175.7 4.4
Private Service-Providing
3,518.7
3,516.0
3,362.0
2.7 0.1
156.7 4.7
Mining and Logging
10.1
10.0
9.6
0.1 1.0
0.5 5.2
Mining, Logging and Construction
216.2
216.4
218.2
-0.2 -0.1
-2.0 -0.9
Construction
206.1
206.4
208.6
-0.3 -0.1
-2.5 -1.2
Manufacturing
410.3
412.1
401.8
-1.8 -0.4
8.5 2.1
Durable Goods
209.1
210.3
201.6
-1.2 -0.6
7.5 3.7
Non-Durable Goods
201.2
201.8
200.2
-0.6 -0.3
1.0 0.5
Trade, Transportation, and Utilities
1,012.8
1,018.0
982.0
-5.2 -0.5
30.8 3.1
Wholesale Trade
228.9
230.2
214.2
-1.3 -0.6
14.7 6.9
Retail Trade
512.7
516.1
506.3
-3.4 -0.7
6.4 1.3
Transportation, Warehousing, and Utilities
271.2
271.7
261.5
-0.5 -0.2
9.7 3.7
Information
143.1
139.9
127.2
3.2 2.3
15.9 12.5
Financial Activities
271.1
273.7
262.7
-2.6 -0.9
8.4 3.2
Finance and Insurance
194.7
197.2
188.3
-2.5 -1.3
6.4 3.4
Real Estate and Rental and Leasing
76.4
76.5
74.4
-0.1 -0.1
2.0 2.7
Professional and Business Services
784.9
784.6
746.0
0.3 0.0
38.9 5.2
Professional, Scientific, and Technical Services
321.6
322.3
304.6
-0.7 -0.2
17.0 5.6
Management of Companies and Enterprises
91.7
91.0
89.2
0.7 0.8
2.5 2.8
Admin and Support, Waste Mngmnt and Remediation
371.6
371.3
352.2
0.3 0.1
19.4 5.5
Education and Health Services
637.7
637.0
615.8
0.7 0.1
21.9 3.6
Educational Services
94.9
94.7
94.7
0.2 0.2
0.2 0.2
Health Care and Social Assistance
542.8
542.3
521.1
0.5 0.1
21.7 4.2
Leisure and Hospitality
503.7
499.3
468.2
4.4 0.9
35.5 7.6
Arts, Entertainment, and Recreation
58.7
58.6
54.6
0.1 0.2
4.1 7.5
Accommodation and Food Services
445.0
440.7
413.6
4.3 1.0
31.4 7.6
Other Services
165.4
163.5
160.1
1.9 1.2
5.3 3.3
Government
688.4
688.0
669.4
0.4 0.1
19.0 2.8
Federal Government
107.6
107.9
106.6
-0.3 -0.3
1.0 0.9
State Government
160.4
159.7
153.2
0.7 0.4
7.2 4.7
Local Government
420.4
420.4
409.6
0.0 0.0
10.8 2.6
?Note: These seasonally adjusted estimates were prepared in cooperation with the U.S. Department of Labor, Bureau of Labor Statistics, based upon monthly reports submitted by selected
employers throughout Georgia. The estimates include all full- and part-time wage and salary workers who were employed during or received pay for any part of the pay period that includes the twelfth of the month. Proprietors, domestic workers, self-employed persons, unpaid family workers and personnel of the armed forces are excluded. Estimates based on 2021 benchmark.
Source: Georgia Department of Labor, Workforce Statistics Division
Georgia Department of Labor, Mark Butler, Commissioner Equal Opportunity Employer/Program Auxiliary Aids and Services Available Upon Request to Individuals With Disabilities
2
GEORGIA Nonfarm Employment
(In thousands)
(Not Seasonally Adjusted)
Preliminary
Revised
Revised
NOV 2022 OCT 2022 NOV 2021
Change in Jobs from OCT 2022
Net %
Change in Jobs from NOV 2021
Net %
Total Nonfarm
4,872.0
4,850.5
4,697.3
21.5 0.4
174.7 3.7
Total Private
4,175.1
4,155.5
4,020.4
19.6 0.5
154.7 3.9
Goods Producing
627.8
629.0
621.4
-1.2 -0.2
6.4 1.0
Service-Providing
4,244.2
4,221.5
4,075.9
22.7 0.5
168.3 4.1
Private Service-Providing
3,547.3
3,526.5
3,399.0
20.8 0.6
148.3 4.4
Mining and Logging
10.1
10.0
9.6
0.1 1.0
0.5 5.2
Mining, Logging and Construction
216.9
217.3
218.2
-0.4 -0.2
-1.3 -0.6
Construction
206.8
207.3
208.6
-0.5 -0.2
-1.8 -0.9
Construction of Buildings
47.7
47.6
46.6
0.1 0.2
1.1 2.4
Heavy and Civil Engineering Construction
33.8
33.7
34.2
0.1 0.3
-0.4 -1.2
Specialty Trade Contractors
125.3
126.0
127.8
-0.7 -0.6
-2.5 -2.0
Manufacturing
410.9
411.7
403.2
-0.8 -0.2
7.7 1.9
Durable Goods
209.2
210.1
202.0
-0.9 -0.4
7.2 3.6
Transportation Equipment Manufacturing
53.6
53.7
51.3
-0.1 -0.2
2.3 4.5
Non-Durable Goods
201.7
201.6
201.2
0.1 0.1
0.5 0.3
Food Manufacturing
70.7
70.6
68.4
0.1 0.1
2.3 3.4
Textile Mills
16.8
16.7
17.0
0.1 0.6
-0.2 -1.2
Textile Product Mills
25.4
25.1
26.1
0.3 1.2
-0.7 -2.7
Trade, Transportation, and Utilities
1,030.0
1,018.0
1,003.2
12.0 1.2
26.8 2.7
Wholesale Trade
229.7
230.6
215.4
-0.9 -0.4
14.3 6.6
Merchant Wholesalers, Durable Goods
121.9
122.1
113.4
-0.2 -0.2
8.5 7.5
Merchant Wholesalers, Nondurable Goods
65.8
65.9
61.9
-0.1 -0.2
3.9 6.3
Wholesale Electronic Markets and Agents and Brokers 42.0
42.6
40.1
-0.6 -1.4
1.9 4.7
Retail Trade
522.4
514.5
518.2
7.9 1.5
4.2 0.8
Food and Beverage Stores
96.9
95.4
96.6
1.5 1.6
0.3 0.3
General Merchandise Stores
122.0
116.5
119.2
5.5 4.7
2.8 2.4
Miscellaneous Store Retailers
21.6
21.6
20.9
0.0 0.0
0.7 3.4
Transportation, Warehousing, and Utilities
277.9
272.9
269.6
5.0 1.8
8.3 3.1
Utilities
20.3
20.2
20.0
0.1 0.5
0.3 1.5
Transportation and Warehousing
257.6
252.7
249.6
4.9 1.9
8.0 3.2
Air Transportation
31.0
30.9
28.3
0.1 0.3
2.7 9.5
Truck Transportation
64.0
63.9
60.7
0.1 0.2
3.3 5.4
Couriers and Messengers
39.5
34.9
36.8
4.6 13.2
2.7 7.3
Warehousing and Storage
77.0
77.5
73.4
-0.5 -0.7
3.6 4.9
Information
144.8
141.3
128.6
3.5 2.5
16.2 12.6
Telecommunications
35.0
35.0
35.9
0.0 0.0
-0.9 -2.5
Wired and Wireless Telecommunications Carriers
29.4
29.4
30.1
0.0 0.0
-0.7 -2.3
Data Processing, Hosting, and Related Services
21.0
20.9
20.3
0.1 0.5
0.7 3.5
Financial Activities
271.9
274.1
263.7
-2.2 -0.8
8.2 3.1
Finance and Insurance
195.0
197.5
188.3
-2.5 -1.3
6.7 3.6
Insurance Carriers and Related Activities
99.9
100.4
93.6
-0.5 -0.5
6.3 6.7
Real Estate and Rental and Leasing
76.9
76.6
75.4
0.3 0.4
1.5 2.0
Professional and Business Services
788.7
789.6
755.2
-0.9 -0.1
33.5 4.4
Professional, Scientific, and Technical Services
321.2
321.8
305.2
-0.6 -0.2
16.0 5.2
Accounting, Tax Prep, and Bookkeeping Services
39.2
38.7
35.9
0.5 1.3
3.3 9.2
Architectural, Engineering, and Related Services
47.0
47.4
45.4
-0.4 -0.8
1.6 3.5
Computer Systems Design and Related Services
82.7
83.1
78.5
-0.4 -0.5
4.2 5.4
Management and Technical Consulting Services
60.7
59.6
54.4
1.1 1.9
6.3 11.6
Management of Companies and Enterprises
91.4
91.0
89.0
0.4 0.4
2.4 2.7
Admin and Support, Waste Mngmnt and Remediation
376.1
376.8
361.0
-0.7 -0.2
15.1 4.2
Employment Services
191.3
190.8
187.3
0.5 0.3
4.0 2.1
Education and Health Services
644.6
642.3
622.5
2.3 0.4
22.1 3.6
Educational Services
98.9
98.2
98.5
0.7 0.7
0.4 0.4
Colleges, Universities, and Professional Schools
46.1
45.2
47.6
0.9 2.0
-1.5 -3.2
Health Care and Social Assistance
545.7
544.1
524.0
1.6 0.3
21.7 4.1
Ambulatory Health Care Services
257.9
256.6
241.6
1.3 0.5
16.3 6.8
Hospitals
163.1
162.4
156.3
0.7 0.4
6.8 4.4
Nursing and Residential Care Facilities
54.2
54.5
54.5
-0.3 -0.6
-0.3 -0.6
Social Assistance
70.5
70.6
71.6
-0.1 -0.1
-1.1 -1.5
Leisure and Hospitality
503.0
497.1
466.9
5.9 1.2
36.1 7.7
Arts, Entertainment, and Recreation
58.0
57.9
53.4
0.1 0.2
4.6 8.6
Amusement, Gambling, and Recreation Industries
39.8
40.6
36.6
-0.8 -2.0
3.2 8.7
Accommodation and Food Services
445.0
439.2
413.5
5.8 1.3
31.5 7.6
Accommodation
43.8
42.8
41.0
1.0 2.3
2.8 6.8
Food Services and Drinking Places
401.2
396.4
372.5
4.8 1.2
28.7 7.7
Other Services
164.3
164.1
158.9
0.2 0.1
5.4 3.4
Repair and Maintenance
43.5
43.3
41.9
0.2 0.5
1.6 3.8
Personal and Laundry Services
43.2
42.7
39.2
0.5 1.2
4.0 10.2
Religious, Grantmaking, Civic, Professional, and Similar
77.6
78.1
77.8
-0.5 -0.6
-0.2 -0.3
Government
696.9
695.0
676.9
1.9 0.3
20.0 3.0
Federal Government
108.8
108.2
107.7
0.6 0.6
1.1 1.0
Department of Defense
44.3
44.3
44.5
0.0 0.0
-0.2 -0.5
State Government
163.4
163.3
155.8
0.1 0.1
7.6 4.9
State Government Educational Services
100.0
99.7
94.3
0.3 0.3
5.7 6.0
State Government excluding Educational Services
63.4
63.6
61.5
-0.2 -0.3
1.9 3.1
Local Government
424.7
423.5
413.4
1.2 0.3
11.3 2.7
Local Government Educational Services
252.7
251.2
244.2
1.5 0.6
8.5 3.5
Local Government excluding Educational Services
172.0
172.3
169.2
-0.3 -0.2
2.8 1.7
?Note: These not seasonally adjusted estimates were prepared in cooperation with the U.S. Department of Labor, Bureau of Labor Statistics, based upon monthly reports submitted by selected
employers throughout Georgia. The estimates include all full- and part-time wage and salary workers who were employed during or received pay for any part of the pay period that includes the
twelfth of the month. Proprietors, domestic workers, self-employed persons, unpaid family workers and personnel of the armed forces are excluded. Estimates based on 2021 benchmark.
Source: Georgia Department of Labor, Workforce Statistics Division
3
ALBANY MSA Nonfarm Employment
(Not Seasonally Adjusted)
(In thousands)
Preliminary
Revised
Revised
NOV 2022 OCT 2022 NOV 2021
Change in Jobs from OCT 2022
Net %
Change in Jobs from NOV 2021
Net %
Total Nonfarm
63.6
62.9
61.8
0.7 1.1
1.8 2.9
Total Private
51.9
51.3
50.2
0.6 1.2
1.7 3.4
Goods Producing
7.4
7.3
7.0
0.1 1.4
0.4 5.7
Service-Providing
56.2
55.6
54.8
0.6 1.1
1.4 2.6
Private Service-Providing
44.5
44.0
43.2
0.5 1.1
1.3 3.0
Trade, Transportation, and Utilities
13.2
13.0
12.9
0.2 1.5
0.3 2.3
Retail Trade
7.8
7.6
7.7
0.2 2.6
0.1 1.3
Government
11.7
11.6
11.6
0.1 0.9
0.1 0.9
Federal Government
2.5
2.5
2.5
0.0 0.0
0.0 0.0
State Government
2.4
2.3
2.3
0.1 4.4
0.1 4.4
Local Government
6.8
6.8
6.8
0.0 0.0
0.0 0.0
?Note: These not seasonally adjusted estimates were prepared in cooperation with the U.S. Department of Labor, Bureau of Labor Statistics, based upon monthly reports submitted by
selected employers in the Albany Metropolitan Statistical Area, which includes Baker, Dougherty, Lee, Terrell and Worth counties. The estimates include all full- and part-time wage and salary workers who were employed during or received pay for any part of the pay period that includes the twelfth of the month. Proprietors, domestic workers, self-employed persons, unpaid familyworkers and personnel of the armed forces are excluded. Estimates based on 2021 benchmark.
Source: Georgia Department of Labor, Workforce Statistics Division
ATHENS-CLARKE COUNTY MSA Nonfarm Employment
(In thousands)
(Not Seasonally Adjusted)
Preliminary
Revised
Revised
NOV 2022 OCT 2022 NOV 2021
Change in Jobs from OCT 2022
Net %
Change in Jobs from NOV 2021
Net %
Total Nonfarm
105.0
104.4
99.6
0.6 0.6
5.4 5.4
Total Private Goods Producing Service-Providing
74.3
73.7
71.4
10.1
10.0
9.8
94.9
94.4
89.8
0.6 0.8 0.1 1.0 0.5 0.5
2.9 4.1 0.3 3.1 5.1 5.7
Private Service-Providing Trade, Transportation, and Utilities
Retail Trade
64.2
63.7
61.6
18.1
17.9
17.9
11.4
11.3
11.6
0.5 0.8 0.2 1.1 0.1 0.9
2.6 4.2 0.2 1.1 -0.2 -1.7
Professional and Business Services Leisure and Hospitality Government
9.5
9.5
9.1
12.0
11.8
11.1
30.7
30.7
28.2
0.0 0.0 0.2 1.7 0.0 0.0
0.4 4.4 0.9 8.1 2.5 8.9
Federal Government State Government Local Government
1.2
1.1
1.2
0.1 9.1
21.2
21.3
18.9
-0.1 -0.5
8.3
8.3
8.1
0.0 0.0
0.0 0.0 2.3 12.2 0.2 2.5
?Note: These not seasonally adjusted estimates were prepared in cooperation with the U.S. Department of Labor, Bureau of Labor Statistics, based upon monthly reports submitted by selected
employers in the Athens-Clarke County Metropolitan Statistical Area, which includes Clarke, Madison, Oconee and Oglethorpe counties. The estimates include all full- and part-time wage and salary workers who were employed during or received pay for any part of the pay period that includes the twelfth of the month. Proprietors, domestic workers, self-employed persons, unpaid family workers and personnel of the armed forces are excluded. Estimates based on 2021 benchmark.
Source: Georgia Department of Labor, Workforce Statistics Division
4
ATLANTA MSA Nonfarm Employment
(In thousands)
(Not Seasonally Adjusted)
Preliminary
Revised
NOV 2022 OCT 2022
Revised NOV 2021
Change in Jobs from OCT 2022
Net %
Change in Jobs from NOV 2021
Net %
Total Nonfarm
3,037.6
3,019.4
2,899.4
18.2 0.6
138.2 4.8
Total Private
2,695.1
2,677.0
2,566.3
18.1 0.7
128.8 5.0
Goods Producing
311.2
311.1
308.7
0.1 0.0
2.5 0.8
Service-Providing
2,726.4
2,708.3
2,590.7
18.1 0.7
135.7 5.2
Private Service-Providing
2,383.9
2,365.9
2,257.6
18.0 0.8
126.3 5.6
Mining and Logging
2.0
2.0
1.9
0.0 0.0
0.1 5.3
Mining, Logging and Construction
135.1
134.7
135.9
0.4 0.3
-0.8 -0.6
Construction
133.1
132.7
134.0
0.4 0.3
-0.9 -0.7
Construction of Buildings
31.4
31.4
31.0
0.0 0.0
0.4 1.3
Specialty Trade Contractors
82.9
82.8
85.3
0.1 0.1
-2.4 -2.8
Manufacturing
176.1
176.4
172.8
-0.3 -0.2
3.3 1.9
Durable Goods
95.5
95.5
90.7
0.0 0.0
4.8 5.3
Transportation Equipment Manufacturing
15.8
15.7
15.2
0.1 0.6
0.6 4.0
Non-Durable Goods
80.6
80.9
82.1
-0.3 -0.4
-1.5 -1.8
Food Manufacturing
24.9
24.8
24.6
0.1 0.4
0.3 1.2
Trade, Transportation, and Utilities
657.0
646.6
632.0
10.4 1.6
25.0 4.0
Wholesale Trade
164.6
163.1
151.4
1.5 0.9
13.2 8.7
Merchant Wholesalers, Durable Goods
89.4
88.7
82.3
0.7 0.8
7.1 8.6
Merchant Wholesalers, Nondurable Goods
41.2
40.7
38.6
0.5 1.2
2.6 6.7
Wholesale Electronic Markets and Agents and Brokers
34.0
33.7
30.5
0.3 0.9
3.5 11.5
Retail Trade
303.5
298.6
300.5
4.9 1.6
3.0 1.0
Food and Beverage Stores
59.4
58.8
59.1
0.6 1.0
0.3 0.5
General Merchandise Stores
66.0
62.8
64.3
3.2 5.1
1.7 2.6
Miscellaneous Store Retailers
13.8
13.9
13.5
-0.1 -0.7
0.3 2.2
Transportation, Warehousing, and Utilities
188.9
184.9
180.1
4.0 2.2
8.8 4.9
Utilities
10.9
10.7
10.4
0.2 1.9
0.5 4.8
Transportation and Warehousing
178.0
174.2
169.7
3.8 2.2
8.3 4.9
Air Transportation
30.5
30.4
27.7
0.1 0.3
2.8 10.1
Truck Transportation
40.9
40.5
37.6
0.4 1.0
3.3 8.8
Couriers and Messengers
29.3
26.0
27.1
3.3 12.7
2.2 8.1
Information
126.6
124.3
112.8
2.3 1.9
13.8 12.2
Telecommunications
28.8
28.7
29.8
0.1 0.4
-1.0 -3.4
Wired and Wireless Telecommunications Carriers
24.4
24.4
25.1
0.0 0.0
-0.7 -2.8
Data Processing, Hosting, and Related Services
20.3
20.2
19.6
0.1 0.5
0.7 3.6
Financial Activities
198.3
199.1
188.8
-0.8 -0.4
9.5 5.0
Finance and Insurance
140.5
141.8
133.9
-1.3 -0.9
6.6 4.9
Insurance Carriers and Related Activities
73.2
73.9
66.8
-0.7 -1.0
6.4 9.6
Real Estate and Rental and Leasing
57.8
57.3
54.9
0.5 0.9
2.9 5.3
Professional and Business Services
598.5
599.5
569.0
-1.0 -0.2
29.5 5.2
Professional, Scientific, and Technical Services
263.9
264.4
247.7
-0.5 -0.2
16.2 6.5
Accounting, Tax Prep, and Bookkeeping Services
29.3
29.3
26.7
0.0 0.0
2.6 9.7
Architectural, Engineering, and Related Services
36.6
36.5
34.6
0.1 0.3
2.0 5.8
Computer Systems Design and Related Services
69.6
69.9
67.4
-0.3 -0.4
2.2 3.3
Management and Technical Consulting Services
54.0
52.6
47.9
1.4 2.7
6.1 12.7
Management of Companies and Enterprises
79.4
79.1
76.2
0.3 0.4
3.2 4.2
Admin and Support, Waste Mngmnt and Remediation
255.2
256.0
245.1
-0.8 -0.3
10.1 4.1
Employment Services
135.1
136.2
131.3
-1.1 -0.8
3.8 2.9
Education and Health Services
399.0
396.5
382.1
2.5 0.6
16.9 4.4
Educational Services
69.7
69.0
68.9
0.7 1.0
0.8 1.2
Health Care and Social Assistance
329.3
327.5
313.2
1.8 0.6
16.1 5.1
Ambulatory Health Care Services
164.9
163.3
153.3
1.6 1.0
11.6 7.6
Hospitals
90.1
90.1
86.1
0.0 0.0
4.0 4.7
Social Assistance
44.1
44.4
44.6
-0.3 -0.7
-0.5 -1.1
Leisure and Hospitality
301.1
297.3
273.7
3.8 1.3
27.4 10.0
Arts, Entertainment, and Recreation
40.6
41.0
35.9
-0.4 -1.0
4.7 13.1
Accommodation and Food Services
260.5
256.3
237.8
4.2 1.6
22.7 9.6
Accommodation
22.1
21.8
19.8
0.3 1.4
2.3 11.6
Food Services and Drinking Places
238.4
234.5
218.0
3.9 1.7
20.4 9.4
Other Services
103.4
102.6
99.2
0.8 0.8
4.2 4.2
Repair and Maintenance
26.0
25.7
24.6
0.3 1.2
1.4 5.7
Personal and Laundry Services
30.3
29.7
27.6
0.6 2.0
2.7 9.8
Government
342.5
342.4
333.1
0.1 0.0
9.4 2.8
Federal Government
53.1
52.5
52.3
0.6 1.1
0.8 1.5
State Government
73.8
73.5
70.6
0.3 0.4
3.2 4.5
Local Government
215.6
216.4
210.2
-0.8 -0.4
5.4 2.6
?Note: These not seasonally adjusted estimates were prepared in cooperation with the U.S. Department of Labor, Bureau of Labor Statistics, based upon monthly reports submitted by
selected employers in the Atlanta Metropolitan Statistical Area, which includes Barrow, Bartow, Butts, Carroll, Cherokee, Clayton, Cobb, Coweta, Dawson, DeKalb, Douglas, Fayette, Forsyth,
Fulton, Gwinnett, Haralson, Heard, Henry, Jasper, Lamar, Meriwether, Morgan, Newton, Paulding, Pickens, Pike, Rockdale, Spalding and Walton counties. The estimates include all full- and
part-time wage and salary workers who were employed during or received pay for any part of the pay period that includes the twelfth of the month. Proprietors, domestic workers, self-employed
persons, unpaid family workers and personnel of the armed forces are excluded. Estimates based on 2021 benchmark.
Source: Georgia Department of Labor, Workforce Statistics Division
5
AUGUSTA-RICHMOND COUNTY MSA Nonfarm Employment
(In thousands)
(Not Seasonally Adjusted)
Preliminary
Revised
Revised
NOV 2022 OCT 2022 NOV 2021
Change in Jobs
from OCT 2022
Net
%
Change in Jobs from NOV 2021
Net %
Total Nonfarm Total Private Goods Producing Service-Providing Private Service-Providing Mining, Logging and Construction Manufacturing Trade, Transportation, and Utilities
Wholesale Trade Retail Trade Transportation, Warehousing, and Utilities Information Financial Activities Professional and Business Services Education and Health Services Leisure and Hospitality Other Services Government Federal Government State Government Local Government
246.3 201.8
43.0 203.3 158.8
19.2 23.8 46.1
5.7 31.2
9.2 2.0 6.6 34.2 35.0 25.9 9.0 44.5 9.4 13.5 21.6
243.4 199.3
42.8 200.6 156.5
19.2 23.6 44.8
5.7 30.1
9.0 2.0 6.7 33.6 35.3 25.2 8.9 44.1 9.3 13.4 21.4
240.6 196.4
42.2 198.4 154.2
18.5 23.7 44.0
5.5 29.5
9.0 2.0 6.6 32.5 35.5 24.9 8.7 44.2 9.6 13.2 21.4
2.9 1.2 2.5 1.3 0.2 0.5 2.7 1.4 2.3 1.5 0.0 0.0 0.2 0.9 1.3 2.9 0.0 0.0 1.1 3.7 0.2 2.2 0.0 0.0 -0.1 -1.5 0.6 1.8 -0.3 -0.9 0.7 2.8 0.1 1.1 0.4 0.9 0.1 1.1 0.1 0.8 0.2 0.9
5.7 2.4 5.4 2.8 0.8 1.9 4.9 2.5 4.6 3.0 0.7 3.8 0.1 0.4 2.1 4.8 0.2 3.6 1.7 5.8 0.2 2.2 0.0 0.0 0.0 0.0 1.7 5.2 -0.5 -1.4 1.0 4.0 0.3 3.5 0.3 0.7 -0.2 -2.1 0.3 2.3 0.2 0.9
?Note: These not seasonally adjusted estimates were prepared in cooperation with the U.S. Department of Labor, Bureau of Labor Statistics, based upon monthly reports submitted by se-
lected employers in the Septembera-Richmond County Metropolitan Statistical Area, which includes Burke, Columbia, Lincoln, McDuffie and Richmond counties in Georgia and Aiken and Edgefield counties in South Carolina. The estimates include all full- and part-time wage and salary workers who were employed during or received pay for any part of the pay period that includes the twelfth of the month. Proprietors, domestic workers, self-employed persons, unpaid family workers and personnel of the armed forces are excluded. Estimates based on 2021 benchmark.
BRUNSWICK MSA Nonfarm Employment
(In thousands)
(Not Seasonally Adjusted)
Preliminary
Revised
Revised
NOV 2022 OCT 2022 NOV 2021
Change in Jobs from OCT 2022
Net %
Change in Jobs from NOV 2021
Net %
Total Nonfarm Total Private Goods Producing Service-Providing Private Service-Providing Trade, Transportation, and Utilities
Retail Trade Government
Federal Government State Government Local Government
45.9
45.5
44.2
37.2
36.8
35.9
4.1
4.1
4.0
41.8
41.4
40.2
33.1
32.7
31.9
8.6
8.4
8.8
5.6
5.6
5.8
8.7
8.7
8.3
2.1
2.1
2.1
1.8
1.8
1.6
4.8
4.8
4.6
0.4 0.9 0.4 1.1 0.0 0.0 0.4 1.0 0.4 1.2 0.2 2.4 0.0 0.0 0.0 0.0 0.0 0.0 0.0 0.0 0.0 0.0
1.7 3.9 1.3 3.6 0.1 2.5 1.6 4.0 1.2 3.8 -0.2 -2.3 -0.2 -3.5 0.4 4.8 0.0 0.0 0.2 12.5 0.2 4.4
?Note: These not seasonally adjusted estimates were prepared in cooperation with the U.S. Department of Labor, Bureau of Labor Statistics, based upon monthly reports submitted by
selected employers in the Brunswick Metropolitan Statistical Area, which includes Brantley, Glynn and McIntosh counties. The estimates include all full- and part-time wage and salary workers who were employed during or received pay for any part of the pay period that includes the twelfth of the month. Proprietors, domestic workers, self-employed persons, unpaid family workers and personnel of the armed forces are excluded. Estimates based on 2021 benchmark.
Source: Georgia Department of Labor, Workforce Statistics Division
6
COLUMBUS MSA Nonfarm Employment
(In thousands)
(Not Seasonally Adjusted)
Preliminary
Revised
Revised
NOV 2022 OCT 2022 NOV 2021
Change in Jobs from OCT 2022
Net %
Change in Jobs from NOV 2021
Net %
Total Nonfarm Total Private Goods Producing Service-Providing Private Service-Providing Mining, Logging and Construction Manufacturing Trade, Transportation, and Utilities
Wholesale Trade Retail Trade Transportation, Warehousing, and Utilities Information Financial Activities Finance and Insurance
Insurance Carriers and Related Activities Professional and Business Services Education and Health Services Leisure and Hospitality Other Services Government
Federal Government State Government Local Government
123.3 99.8 15.0
108.3 84.8 4.8 10.2 18.6 2.9 12.9 2.8 1.2 11.0 9.0 3.8 16.8 17.5 15.5 4.2 23.5 6.7 4.3 12.5
122.5 99.1 15.0
107.5 84.1 4.8 10.2 18.2 2.9 12.6 2.7 1.2 11.0 9.1 3.8 16.9 17.3 15.4 4.1 23.4 6.8 4.3 12.3
120.4 97.2 14.8
105.6 82.4 4.7 10.1 18.7 2.8 13.2 2.7 1.2 10.9 9.1 3.7 16.5 16.5 14.6 4.0 23.2 6.6 4.1 12.5
0.8 0.7 0.7 0.7 0.0 0.0 0.8 0.7 0.7 0.8 0.0 0.0 0.0 0.0 0.4 2.2 0.0 0.0 0.3 2.4 0.1 3.7 0.0 0.0 0.0 0.0 -0.1 -1.1 0.0 0.0 -0.1 -0.6 0.2 1.2 0.1 0.7 0.1 2.4 0.1 0.4 -0.1 -1.5 0.0 0.0 0.2 1.6
2.9 2.4 2.6 2.7 0.2 1.4 2.7 2.6 2.4 2.9 0.1 2.1 0.1 1.0 -0.1 -0.5 0.1 3.6 -0.3 -2.3 0.1 3.7 0.0 0.0 0.1 0.9 -0.1 -1.1 0.1 2.7 0.3 1.8 1.0 6.1 0.9 6.2 0.2 5.0 0.3 1.3 0.1 1.5 0.2 4.9 0.0 0.0
?Note: These not seasonally adjusted estimates were prepared in cooperation with the U.S. Department of Labor, Bureau of Labor Statistics, based upon monthly reports submitted by
selected employers in the Columbus Metropolitan Statistical Area, which includes Chattahoochee, Harris, Marion and Muscogee counties in Georgia and Russell County in Alabama. The estimates include all full- and part-time wage and salary workers who were employed during or received pay for any part of the pay period that includes the twelfth of the month. Proprietors, domestic workers, self-employed persons, unpaid family workers and personnel of the armed forces are excluded. Estimates based on 2021 benchmark.
DALTON MSA Nonfarm Employment
(In thousands)
(Not Seasonally Adjusted)
Preliminary
Revised Revised
NOV 2022 OCT 2022 NOV 2021
Change in Jobs from OCT 2022
Net %
Change in Jobs from NOV 2021
Net %
Total Nonfarm Total Private Goods Producing
67.1
66.3
66.6
59.9
59.3
59.7
24.0
23.7
24.5
0.8 1.2 0.6 1.0 0.3 1.3
0.5 0.8 0.2 0.3 -0.5 -2.0
Service-Providing Private Service-Providing Manufacturing
43.1
42.6
42.1
35.9
35.6
35.2
22.6
22.4
22.9
0.5 1.2 0.3 0.8 0.2 0.9
1.0 2.4 0.7 2.0 -0.3 -1.3
Textile Mills Textile Product Mills Trade, Transportation, and Utilities
4.3
4.2
4.2
13.1
12.9
13.7
14.4
14.2
14.0
0.1 2.4 0.2 1.6 0.2 1.4
0.1 2.4 -0.6 -4.4 0.4 2.9
Retail Trade Transportation, Warehousing, and Utilities Professional and Business Services
6.5
6.5
6.4
0.0 0.0
3.8
3.7
3.7
0.1 2.7
7.0
7.0
6.6
0.0 0.0
0.1 1.6 0.1 2.7 0.4 6.1
Government Federal Government State Government
7.2
7.0
6.9
0.2 2.9
0.3
0.3
0.2
0.0 0.0
1.0
0.9
1.0
0.1 11.1
0.3 4.4 0.1 50.0 0.0 0.0
Local Government
5.9
5.8
5.7
0.1 1.7
0.2 3.5
?Note: These not seasonally adjusted estimates were prepared in cooperation with the U.S. Department of Labor, Bureau of Labor Statistics, based upon monthly reports submitted by
selected employers in the Dalton Metropolitan Statistical Area, which includes Murray and Whitfield counties. The estimates include all full- and part-time wage and salary workers who were employed during or received pay for any part of the pay period that includes the twelfth of the month. Proprietors, domestic workers, self-employed persons, unpaid family workers and personnel of the armed forces are excluded. Estimates based on 2021 benchmark.
Source: Georgia Department of Labor, Workforce Statistics Division
7
GAINESVILLE MSA Nonfarm Employment
(In thousands)
(Not Seasonally Adjusted)
Preliminary
Revised
Revised
NOV 2022 OCT 2022 NOV 2021
Change in Jobs from OCT 2022
Net %
Change in Jobs from NOV 2021
Net %
Total Nonfarm
99.2
99.0
97.9
0.2 0.2
1.3 1.3
Total Private
88.1
87.9
87.1
0.2 0.2
1.0 1.2
Goods Producing
25.2
24.9
25.0
0.3 1.2
0.2 0.8
Service-Providing
74.0
74.1
72.9
-0.1 -0.1
1.1 1.5
Private Service-Providing
62.9
63.0
62.1
-0.1 -0.2
0.8 1.3
Trade, Transportation, and Utilities
19.6
19.2
19.0
0.4 2.1
0.6 3.2
Retail Trade
9.7
9.5
9.7
0.2 2.1
0.0 0.0
Government
11.1
11.1
10.8
0.0 0.0
0.3 2.8
Federal Government
0.5
0.5
0.5
0.0 0.0
0.0 0.0
State Government
2.7
2.7
2.6
0.0 0.0
0.1 3.9
Local Government
7.9
7.9
7.7
0.0 0.0
0.2 2.6
?Note: These not seasonally adjusted estimates were prepared in cooperation with the U.S. Department of Labor, Bureau of Labor Statistics, based upon monthly reports submitted by se-
lected employers in the Gainesville Metropolitan Statistical Area, which comprises Hall county. The estimates include all full- and part-time wage and salary workers who were employed during or received pay for any part of the pay period that includes the twelfth of the month. Proprietors, domestic workers, self-employed persons, unpaid family workers and personnel of the armed forces are excluded. Estimates based on 2021 benchmark.
HINESVILLE MSA Nonfarm Employment
(In thousands)
(Not Seasonally Adjusted)
Preliminary Revised Revised NOV 2022 OCT 2022 NOV 2021
Change in Jobs from OCT 2022
Net %
Change in Jobs from NOV 2021
Net %
Total Nonfarm Total Private
21.6
21.5
21.4
14.1
14.0
13.8
0.1 0.5 0.1 0.7
0.2 0.9 0.3 2.2
Goods Producing Service-Providing Private Service-Providing
2.5
2.5
2.4
19.1
19.0
19.0
11.6
11.5
11.4
0.0 0.0 0.1 0.5 0.1 0.9
0.1 4.2 0.1 0.5 0.2 1.8
Government Federal Government State Government
7.5
7.5
7.6
0.0 0.0
3.6
3.6
3.7
0.0 0.0
0.4
0.4
0.4
0.0 0.0
-0.1 -1.3 -0.1 -2.7 0.0 0.0
Local Government
3.5
3.5
3.5
0.0 0.0
0.0 0.0
?Note: These not seasonally adjusted estimates were prepared in cooperation with the U.S. Department of Labor, Bureau of Labor Statistics, based upon monthly reports submitted by
selected employers in the Hinesville Metropolitan Statistical Area, which includes Liberty and Long counties. The estimates include all full- and part-time wage and salary workers who were employed during or received pay for any part of the pay period that includes the twelfth of the month. Proprietors, domestic workers, self-employed persons, unpaid family workers and personnel of the armed forces are excluded. Estimates based on 2021 benchmark.
Source: Georgia Department of Labor, Workforce Statistics Division
8
MACON-BIBB COUNTY MSA Nonfarm Employment
(In thousands)
(Not Seasonally Adjusted)
Preliminary
Revised
Revised
NOV 2022 OCT 2022 NOV 2021
Change in Jobs from OCT 2022
Net %
Change in Jobs from NOV 2021
Net %
Total Nonfarm
105.3
103.7
103.6
1.6 1.5
1.7 1.6
Total Private
91.3
89.7
89.4
1.6 1.8
1.9 2.1
Goods Producing
11.0
10.9
10.4
0.1 0.9
0.6 5.8
Service-Providing
94.3
92.8
93.2
1.5 1.6
1.1 1.2
Private Service-Providing
80.3
78.8
79.0
1.5 1.9
1.3 1.7
Trade, Transportation, and Utilities
21.3
20.6
20.5
0.7 3.4
0.8 3.9
Retail Trade
12.8
12.5
12.3
0.3 2.4
0.5 4.1
Transportation, Warehousing, and Utilities
5.3
5.1
5.1
0.2 3.9
0.2 3.9
Financial Activities
9.3
9.3
9.2
0.0 0.0
0.1 1.1
Professional and Business Services
11.8
11.5
12.2
0.3 2.6
-0.4 -3.3
Education and Health Services
22.5
22.4
22.1
0.1 0.5
0.4 1.8
Leisure and Hospitality
10.9
10.9
10.5
0.0 0.0
0.4 3.8
Government
14.0
14.0
14.2
0.0 0.0
-0.2 -1.4
Federal Government
1.0
1.0
1.2
0.0 0.0
-0.2 -16.7
State Government
3.9
4.0
4.0
-0.1 -2.5
-0.1 -2.5
Local Government
9.1
9.0
9.0
0.1 1.1
0.1 1.1
?Note: These not seasonally adjusted estimates were prepared in cooperation with the U.S. Department of Labor, Bureau of Labor Statistics, based upon monthly reports submitted by
selected employers in the Macon-Bibb County Metropolitan Statistical Area, which includes Bibb, Crawford, Jones, Monroe and Twiggs counties. The estimates include all full- and part-time wage and salary workers who were employed during or received pay for any part of the pay period that includes the twelfth of the month. Proprietors, domestic workers, self-employed persons, unpaid family workers and personnel of the armed forces are excluded. Estimates based on 2021 benchmark.
ROME MSA Nonfarm Employment
(In thousands)
(Not Seasonally Adjusted)
Preliminary
Revised
Revised
NOV 2022 OCT 2022 NOV 2021
Change in Jobs from OCT 2022
Net %
Change in Jobs from NOV 2021
Net %
Total Nonfarm Total Private
43.0
42.7
41.8
37.2
36.9
36.2
0.3 0.7 0.3 0.8
1.2 2.9 1.0 2.8
Goods Producing Service-Providing Private Service-Providing
7.3
7.3
7.2
35.7
35.4
34.6
29.9
29.6
29.0
0.0 0.0 0.3 0.9 0.3 1.0
0.1 1.4 1.1 3.2 0.9 3.1
Manufacturing Trade, Transportation, and Utilities
Retail Trade
6.5
6.5
6.3
0.0 0.0
8.2
7.9
7.8
0.3 3.8
5.0
4.9
4.7
0.1 2.0
0.2 3.2 0.4 5.1 0.3 6.4
Education and Health Services Government
Federal Government
10.8
10.7
10.6
5.8
5.8
5.6
0.2
0.2
0.2
0.1 0.9 0.0 0.0 0.0 0.0
0.2 1.9 0.2 3.6 0.0 0.0
State Government Local Government
1.6
1.6
1.5
0.0 0.0
4.0
4.0
3.9
0.0 0.0
0.1 6.7 0.1 2.6
?Note: These not seasonally adjusted estimates were prepared in cooperation with the U.S. Department of Labor, Bureau of Labor Statistics, based upon monthly reports submitted by
selected employers in the Rome Metropolitan Statistical Area, which comprises Floyd county. The estimates include all full- and part-time wage and salary workers who were employed during or received pay for any part of the pay period that includes the twelfth of the month. Proprietors, domestic workers, self-employed persons, unpaid family workers and personnel of the armed forces are excluded. Estimates based on 2021 benchmark.
Source: Georgia Department of Labor, Workforce Statistics Division
9
SAVANNAH MSA Nonfarm Employment
(In thousands)
(Not Seasonally Adjusted)
Preliminary Revised
Revised
NOV 2022 OCT 2022 NOV 2021
Change in Jobs from OCT 2022
Net %
Change in Jobs from NOV 2021
Net %
Total Nonfarm
201.8
202.1
195.5
-0.3 -0.2
6.3 3.2
Total Private
177.9
178.3
171.5
-0.4 -0.2
6.4 3.7
Goods Producing
27.9
27.8
26.3
0.1 0.4
1.6 6.1
Service-Providing
173.9
174.3
169.2
-0.4 -0.2
4.7 2.8
Private Service-Providing
150.0
150.5
145.2
-0.5 -0.3
4.8 3.3
Mining, Logging and Construction
8.9
8.9
8.1
0.0 0.0
0.8 9.9
Manufacturing
19.0
18.9
18.2
0.1 0.5
0.8 4.4
Trade, Transportation, and Utilities
49.4
49.5
47.8
-0.1 -0.2
1.6 3.4
Wholesale Trade
7.2
7.2
6.9
0.0 0.0
0.3 4.4
Retail Trade
23.6
23.3
23.0
0.3 1.3
0.6 2.6
Transportation, Warehousing, and Utilities
18.6
19.0
17.9
-0.4 -2.1
0.7 3.9
Information
3.9
3.8
3.4
0.1 2.6
0.5 14.7
Financial Activities
6.7
6.7
6.7
0.0 0.0
0.0 0.0
Professional and Business Services
26.6
28.0
27.2
-1.4 -5.0
-0.6 -2.2
Education and Health Services
28.0
27.8
26.4
0.2 0.7
1.6 6.1
Leisure and Hospitality
27.7
27.0
26.2
0.7 2.6
1.5 5.7
Other Services
7.7
7.7
7.5
0.0 0.0
0.2 2.7
Government
23.9
23.8
24.0
0.1 0.4
-0.1 -0.4
Federal Government
2.9
2.8
2.9
0.1 3.6
0.0 0.0
State Government
4.8
4.7
4.8
0.1 2.1
0.0 0.0
Local Government
16.2
16.3
16.3
-0.1 -0.6
-0.1 -0.6
?Note: These not seasonally adjusted estimates were prepared in cooperation with the U.S. Department of Labor, Bureau of Labor Statistics, based upon monthly reports submitted by
selected employers in the Savannah Metropolitan Statistical Area, which includes Bryan, Chatham and Effingham counties. The estimates include all full- and part-time wage and salary workers who were employed during or received pay for any part of the pay period that includes the twelfth of the month. Proprietors, domestic workers, self-employed persons, unpaid family workers and personnel of the armed forces are excluded. Estimates based on 2021 benchmark.
VALDOSTA MSA Nonfarm Employment
(In thousands)
(Not Seasonally Adjusted)
Preliminary Revised
Revised
NOV 2022 OCT 2022 NOV 2021
Change in Jobs from OCT 2022
Net %
Change in Jobs from NOV 2021
Net %
Total Nonfarm Total Private Goods Producing
57.1
56.7
56.8
44.4
43.9
44.1
7.3
7.3
7.4
0.4 0.7 0.5 1.1 0.0 0.0
0.3 0.5 0.3 0.7 -0.1 -1.4
Service-Providing Private Service-Providing
49.8
49.4
49.4
37.1
36.6
36.7
0.4 0.8 0.5 1.4
0.4 0.8 0.4 1.1
Trade, Transportation, and Utilities
13.6
13.5
13.2
0.1 0.7
0.4 3.0
Retail Trade Government
7.5
7.4
7.3
0.1 1.4
12.7
12.8
12.7
-0.1 -0.8
0.2 2.7 0.0 0.0
Federal Government
1.2
1.2
1.1
0.0 0.0
0.1 9.1
State Government Local Government
3.0
3.0
3.2
0.0 0.0
8.5
8.6
8.4
-0.1 -1.2
-0.2 -6.3 0.1 1.2
?Note: These not seasonally adjusted estimates were prepared in cooperation with the U.S. Department of Labor, Bureau of Labor Statistics, based upon monthly reports submitted by
selected employers in the Valdosta Metropolitan Statistical Area, which includes Brooks, Echols, Lanier and Lowndes counties. The estimates include all full- and part-time wage and salary workers who were employed during or received pay for any part of the pay period that includes the twelfth of the month. Proprietors, domestic workers, self-employed persons, unpaid family workers and personnel of the armed forces are excluded. Estimates based on 2021 benchmark.
Source: Georgia Department of Labor, Workforce Statistics Division
10
WARNER ROBINS MSA Nonfarm Employment
(In thousands)
(Not Seasonally Adjusted)
Preliminary Revised
Revised
NOV 2022 OCT 2022 NOV 2021
Change in Jobs from OCT 2022
Net %
Change in Jobs from NOV 2021
Net %
Total Nonfarm Total Private Goods Producing Service-Providing Private Service-Providing Trade, Transportation, and Utilities
Retail Trade Government
Federal Government State Government Local Government
79.9
79.5
79.0
0.4 0.5
51.7
51.1
51.2
0.6 1.2
10.6
10.5
10.2
0.1 1.0
69.3
69.0
68.8
0.3 0.4
41.1
40.6
41.0
0.5 1.2
12.3
12.0
12.3
0.3 2.5
9.7
9.4
9.7
0.3 3.2
28.2
28.4
27.8
-0.2 -0.7
15.5
15.5
15.5
0.0 0.0
2.3
2.6
2.3
-0.3 -11.5
10.4
10.3
10.0
0.1 1.0
0.9 1.1 0.5 1.0 0.4 3.9 0.5 0.7 0.1 0.2 0.0 0.0 0.0 0.0 0.4 1.4 0.0 0.0 0.0 0.0 0.4 4.0
?Note: These not seasonally adjusted estimates were prepared in cooperation with the U.S. Department of Labor, Bureau of Labor Statistics, based upon monthly reports submitted by
selected employers in the Warner Robins Metropolitan Statistical Area, which includes Houston, Peach and Pulaski counties. The estimates include all full- and part-time wage and salary workers who were employed during or received pay for any part of the pay period that includes the twelfth of the month. Proprietors, domestic workers, self-employed persons, unpaid family workers and personnel of the armed forces are excluded. Estimates based on 2021 benchmark.
Total Nonfarm Employment by Metro Statistical Area
(In thousands)
(Seasonally Adjusted)
Preliminary
Revised
Revised
NOV 2022 OCT 2022 NOV 2021
Change in Jobs from OCT 2022
Net %
Change in Jobs from NOV 2021
Net %
Albany MSA
63.1
62.8
61.3
0.3 0.5
1.8 2.9
Athens-Clarke County MSA
103.8
103.2
98.6
0.6 0.6
5.2 5.3
Atlanta MSA
3,015.9
3,008.6
2,876.7
7.3 0.2
139.2 4.8
Augusta-Richmond County MSA
245.5
244.2
239.9
1.3 0.5
5.6 2.3
Brunswick MSA
46.0
45.7
44.4
0.3 0.7
1.6 3.6
Columbus MSA
122.6
122.3
119.7
0.3 0.2
2.9 2.4
Dalton MSA
67.0
66.4
66.6
0.6 0.9
0.4 0.6
Gainesville MSA
98.0
98.4
96.8
-0.4 -0.4
1.2 1.2
Hinesville MSA
21.4
21.4
21.2
0.0 0.0
0.2 0.9
Macon-Bibb County MSA
104.3
103.8
102.5
0.5 0.5
1.8 1.8
Rome MSA
42.7
42.5
41.5
0.2 0.5
1.2 2.9
Savannah MSA
201.0
202.5
194.5
-1.5 -0.7
6.5 3.3
Valdosta MSA
56.2
56.2
55.7
0.0 0.0
0.5 0.9
Warner Robins MSA
79.3
79.3
78.4
0.0 0.0
0.9 1.1
?Note: These seasonally adjusted estimates were prepared in cooperation with the U.S. Department of Labor, Bureau of Labor Statistics, based upon monthly reports submitted by selected
employers throughout Georgia. The estimates include all full- and part-time wage and salary workers who were employed during or received pay for any part of the pay period that includes the twelfth of the month. Proprietors, domestic workers, self-employed persons, unpaid family workers and personnel of the armed forces are excluded. Estimates based on 2021 benchmark.
Source: Georgia Department of Labor, Workforce Statistics Division
11
Georgia Statewide Hours and Earnings
All Employee
Average Weekly Earnings (AWE)
Preliminary NOV 2022
Revised OCT 2022
Revised NOV 2021
Total Private..................................................................................................$1,049.58..........................$1,075.90.................... $1,014.28 Goods Producing....................................................................................... $1,220.14...........................$1,241.14..................... $1,217.11 Private Service Providing........................................................................... $1,019.31.......................... $1,047.54.......................$976.02 Construction............................................................................................$1,233.88..........................$1,282.57.................... $1,213.38 Manufacturing......................................................................................... $1,168.67.......................... $1,173.44.................... $1,150.24 Trade, Transportation, and Utilities............................................................ $871.79.............................$902.15.......................$828.78 Financial Activities..................................................................................$1,382.26..........................$1,436.79....................$1,360.45 Professional and Business Services......................................................$1,361.94.......................... $1,407.61....................$1,270.92 Educational and Health Services............................................................ $1,152.82..........................$1,204.75..................... $1,147.51 Leisure and Hospitality...............................................................................$477.05.............................$484.74...................... $436.86 Other Services...........................................................................................$837.50............................ $873.20.......................$793.09
Average Weekly Hours (AWH)
Preliminary NOV 2022
Revised OCT 2022
Revised NOV 2021
Total Private...........................................................................................................34.3...................................35.0.............................34.7 Goods Producing................................................................................................39.9...................................40.8............................. 42.1 Private Service Providing....................................................................................33.3...................................34.0.............................33.3 Construction.....................................................................................................39.7................................... 41.4.............................42.5 Manufacturing..................................................................................................39.9.................................. 40.2............................. 41.6 Trade, Transportation, and Utilities..................................................................33.3...................................33.7.............................33.8 Financial Activities...........................................................................................36.5................................... 37.9.............................35.0 Professional and Business Services...............................................................36.7................................... 37.9.............................36.7 Educational and Health Services.....................................................................34.3...................................34.1.............................33.8 Leisure and Hospitality.....................................................................................26.4...................................26.9.............................26.9 Other Services.................................................................................................33.3.................................. 34.5.............................32.2
Average Hourly Earnings (AHE)
Preliminary NOV 2022
Revised OCT 2022
Revised NOV 2021
Total Private...................................................................................................... $30.60...............................$30.74.........................$29.23 Goods Producing........................................................................................... $30.58.............................. $30.42.........................$28.91 Private Service Providing................................................................................$30.61...............................$30.81.........................$29.31 Construction.................................................................................................$31.08.............................. $30.98.........................$28.55 Manufacturing..............................................................................................$29.29............................... $29.19......................... $27.65 Trade, Transportation, and Utilities.............................................................. $26.18...............................$26.77.........................$24.52 Financial Activities....................................................................................... $37.87............................... $37.91.........................$38.87 Professional and Business Services............................................................$37.11............................... $37.14.........................$34.63 Educational and Health Services.................................................................$33.61.............................. $35.33.........................$33.95 Leisure and Hospitality.................................................................................$18.07...............................$18.02.........................$16.24 Other Services............................................................................................. $25.15...............................$25.31.........................$24.63
Read more about the hours and earnings series at http://www.bls.gov/sae/home.htm
?Note: These not seasonally adjusted estimates were prepared in cooperation with the U.S. Department of Labor, Bureau of Labor Statistics, based upon monthly reports submitted by
selected employers throughout Georgia. The estimates include all full- and part-time wage and salary workers who were employed during or received pay for any part of the pay period that includes the twelfth of the month. Proprietors, domestic workers, self-employed persons, unpaid family workers and personnel of the armed forces are excluded. Estimates based on 2021 benchmark.
Source: Georgia Department of Labor, Workforce Statistics Division
12
Georgia MSA Hours and Earnings
All Employee Total Private
Average Weekly Earnings (AWE)
Preliminary NOV 2022
Revised OCT 2022
Revised NOV 2021
Albany MSA ................................................................................................... $738.34............................ $788.53....................... $701.25 Athens-Clarke County MSA ...........................................................................$816.54.............................$827.29.......................$758.78 Atlanta MSA ................................................................................................$1,137.26.......................... $1,181.60....................$1,096.82 Augusta-Richmond County MSA .................................................................. $905.96.............................$927.99.......................$915.63 Brunswick MSA ............................................................................................ $796.92............................ $765.55....................... $719.30 Columbus MSA ............................................................................................. $825.66............................ $835.54....................... $721.03 Dalton MSA ...................................................................................................$781.32............................ $796.95.......................$722.40 Gainesville MSA .......................................................................................... $1,120.03.......................... $1,146.68....................$1,249.64 Hinesville MSA ............................................................................................... $519.79.............................$510.65...................... $546.08 Macon-Bibb County MSA .............................................................................. $861.19............................ $890.31.......................$802.03 Rome MSA ......................................................................................................$717.19.............................$744.79.......................$845.71 Savannah MSA ..............................................................................................$875.02............................ $895.98....................... $817.38 Valdosta MSA ................................................................................................. $817.66............................ $823.04.......................$823.37 Warner Robins MSA ...................................................................................... $848.01.............................$841.82.......................$822.02
Average Weekly Hours (AWH)
Preliminary NOV 2022
Revised OCT 2022
Revised NOV 2021
Albany MSA ..........................................................................................................33.9...................................34.6................................33 Athens-Clarke County MSA ....................................................................................31...................................31.6............................. 31.2 Atlanta MSA ........................................................................................................34.4......................................35.............................34.6 Augusta-Richmond County MSA .........................................................................34.2.................................. 34.9.............................35.6 Brunswick MSA ...................................................................................................33.4...................................34.1.............................34.4 Columbus MSA .......................................................................................................33.................................. 33.8............................. 31.2 Dalton MSA ............................................................................................................34.................................. 34.5.............................34.4 Gainesville MSA ...................................................................................................35.5...................................36.6............................. 39.1 Hinesville MSA .....................................................................................................29.5...................................29.5.............................30.8 Macon-Bibb County MSA ....................................................................................34.6...................................35.4.............................34.6 Rome MSA ...........................................................................................................30.9.................................. 32.2.............................35.4 Savannah MSA ....................................................................................................31.9...................................32.7.............................33.2 Valdosta MSA .......................................................................................................31.4...................................32.1.............................30.7 Warner Robins MSA .............................................................................................34.5...................................34.7.............................33.8
Average Hourly Earnings (AHE)
Preliminary NOV 2022
Revised OCT 2022
Revised NOV 2021
Albany MSA ...................................................................................................... $21.78...............................$22.79.........................$21.25 Athens-Clarke County MSA ............................................................................ $26.34............................... $26.18.........................$24.32 Atlanta MSA ................................................................................................... $33.06...............................$33.76......................... $31.70 Augusta-Richmond County MSA .....................................................................$26.49.............................. $26.59.........................$25.72 Brunswick MSA .............................................................................................. $23.86.............................. $22.45.........................$20.91 Columbus MSA ................................................................................................$25.02...............................$24.72......................... $23.11 Dalton MSA .................................................................................................... $22.98............................... $23.10.........................$21.00 Gainesville MSA ...............................................................................................$31.55...............................$31.33.........................$31.96 Hinesville MSA ................................................................................................. $17.62............................... $17.31..........................$17.73 Macon-Bibb County MSA ................................................................................$24.89............................... $25.15......................... $23.18 Rome MSA .......................................................................................................$23.21............................... $23.13.........................$23.89 Savannah MSA ................................................................................................ $27.43...............................$27.40.........................$24.62 Valdosta MSA ...................................................................................................$26.04.............................. $25.64.........................$26.82 Warner Robins MSA .........................................................................................$24.58...............................$24.26.........................$24.32
Read more about the hours and earnings series at http://www.bls.gov/sae/home.htm
?Note: These not seasonally adjusted estimates were prepared in cooperation with the U.S. Department of Labor, Bureau of Labor Statistics, based upon monthly reports submitted by
selected employers throughout Georgia. The estimates include all full- and part-time wage and salary workers who were employed during or received pay for any part of the pay period that includes the twelfth of the month. Proprietors, domestic workers, self-employed persons, unpaid family workers and personnel of the armed forces are excluded. Estimates based on 2021 benchmark.
Source: Georgia Department of Labor, Workforce Statistics Division
13
Dimensions - Measuring Georgia's Labor Force
Unemployment rates -- Georgia and U.S.
8%
6%
4%
2%
0% Nov Dec Jan Feb Mar Apr May Jun Jul Aug Sep Oct Nov
Georgia
U.S.
WA 4.0
OR
4.4
ID
3.0
NV
4.9
UT
CA
2.2
4.1
AZ 4.1
AK 4.5
StSattaeteuUnenmempploloyymmeenntt Rraatteess
November 2022
National Unemployment Rate: 3.7% Rates are seasonally adjusted
MT 2.9
WY 3.6
CO 3.5 NM 4.1
ND 2.3 SD 2.4
NE 2.5
KS 2.8
MN 2.3
WI 3.3
IA 3.1
IL 4.7 MO 2.7
OK 3.4 TX 4.0
AR 3.7
MS 3.9
LA 3.3
NH
2.6 ME
VT
3.7
2.5
MI 4.3
OH
IN
4.2
3.0
KY 4.0 TN 3.5
PA 4.0
WV
4.1
VA
2.8
NC 3.9
SC 3.3
AL
GA
2.7
3.0
FL 2.6
MA 3.4
NY 4.3
RI 3.6
CT
NJ 3.4
4.2
DE
4.4
DC 4.6
MD 4.3
Unemployment rate
4.0% or greater 3.5% to 3.9% 3.0% to 3.4% 2.5% to 2.9% Less than 2.5%
HI 3.3
Source: Georgia Department of Labor, Workforce Statistics Division
14
Georgia Labor Force Estimates
Place of Residence - Persons 16 Years and Older
Georgia
(Seasonally adjusted)
Employment Status
Civilian labor force Employed Unemployed Rate
Preliminary NOV 2022
5,262,128 5,106,079
156,049 3.0
Revised OCT 2022
5,268,917 5,116,812
152,105 2.9
Revised NOV 2021
5,200,289 5,026,198
174,091 3.3
Change From
OCT 2022
NOV 2021
-6,789 -10,733
3,944
61,839 79,881 -18,042
Georgia
(Not Seasonally adjusted)
Civilian labor force Employed Unemployed Rate
5,256,085 5,108,604
147,481 2.8
5,271,358 5,110,866
160,492 3.0
5,227,324 5,075,808
151,516 2.9
-15,273 -2,262 -13,011
28,761 32,796 -4,035
Albany MSA
Civilian labor force Employed Unemployed
Rate
65,453 63,074
2,379 3.6
65,548 63,039
2,509 3.8
65,715 63,223
2,492 3.8
-95
-262
35
-149
-130
-113
Athens-Clarke County MSA
Civilian labor force Employed Unemployed Rate
103,967 101,341
2,626 2.5
104,475 101,483
2,992 2.9
101,755 99,237
2,518 2.5
-508 -142 -366
2,212 2,104
108
Atlanta MSA
Civilian labor force Employed Unemployed
Rate
3,209,119 3,122,631
86,488 2.7
3,214,918 3,121,630
93,288 2.9
3,169,178 3,077,812
91,366 2.9
-5,799 1,001 -6,800
39,941 44,819 -4,878
Augusta-Richmond County MSA
Civilian labor force Employed Unemployed
Rate
263,585 255,085
8,500 3.2
263,449 253,807
9,642 3.7
265,125 256,822
8,303 3.1
136 1,278 -1,142
-1,540 -1,737
197
Brunswick MSA
Civilian labor force Employed Unemployed
Rate
52,714
52,962
52,503
-248
211
51,243
51,315
51,016
-72
227
1,471
1,647
1,487
-176
-16
2.8
3.1
2.8
Columbus MSA
Civilian labor force Employed Unemployed Rate
121,677 117,455
4,222 3.5
122,253 117,717
4,536 3.7
122,101 117,927
4,174 3.4
-576 -262 -314
-424 -472
48
Dalton MSA
Civilian labor force Employed Unemployed Rate
57,898 55,829
2,069 3.6
58,206 55,649
2,557 4.4
58,795 57,094
1,701 2.9
-308 180 -488
-897 -1,265
368
Gainesville MSA
Civilian labor force Employed Unemployed Rate
105,561 103,269
2,292 2.2
106,155 103,532
2,623 2.5
106,204 104,013
2,191 2.1
-594 -263 -331
-643 -744 101
?Note: MSA data are not seasonally adjusted. Employment includes nonagricultural wage and salary employment, self-employment, unpaid family and private
household workers and agricultural workers. Persons in labor disputes are counted as employed. The use of unrounded data does not imply that the numbers are exact.
Albany MSA: Baker, Dougherty, Lee, Terrell, and Worth counties. Athens-Clarke County MSA: Clarke, Madison, Oconee, and Oglethorpe counties. Atlanta MSA: Barrow, Bartow, Butts, Carroll, Cherokee, Clayton, Cobb, Coweta, Dawson, DeKalb, Douglas, Fayette, Forsyth, Fulton, Gwinnett, Haralson, Heard, Henry, Jasper, Lamar, Meriwether, Morgan, Newton, Paulding, Pickens, Pike, Rockdale, Spalding, and Walton counties.
Augusta-Richmond County MSA: Burke, Columbia, Lincoln, McDuffie, and Richmond counties in Georgia and Aiken and Edgefield counties in South Carolina. Brunswick MSA: Brantley, Glynn, and McIntosh counties. Columbus MSA: Chattahoochee, Harris, Marion, and Muscogee counties in Georgia and Russell County in Alabama. Dalton MSA: Murray and Whitfield counties. Gainesville MSA: Hall County. Hinesville MSA: Liberty and Long counties. Macon-Bibb County MSA: Bibb, Crawford, Jones, Monroe, and Twiggs counties. Rome MSA: Floyd County. Savannah MSA: Bryan, Chatham, and Effingham counties. Valdosta MSA: Brooks, Echols, Lanier, and Lowndes counties. Warner Robins MSA: Houston, Peach and Pulaski counties.
Source: Georgia Department of Labor, Workforce Statistics Division
15
Hinesville MSA
Macon-Bibb County MSA Rome MSA Savannah MSA
Valdosta MSA Warner Robins MSA
Georgia Labor Force Estimates
Place of Residence - Persons 16 Years and Older
Employment Status
Civilian labor force Employed Unemployed Rate
Civilian labor force Employed Unemployed Rate
Preliminary NOV 2022
34,293 33,276
1,017 3.0
102,636 99,412 3,224 3.1
Revised OCT 2022
34,393 33,277
1,116 3.2
102,142 98,586
3,556 3.5
Revised NOV 2021
34,785 33,771
1,014 2.9
103,990 100,635
3,355 3.2
Civilian labor force Employed Unemployed Rate
Civilian labor force Employed Unemployed Rate
43,851 42,626
1,225 2.8
198,643 193,442
5,201 2.6
43,882 42,496
1,386 3.2
200,486 194,764
5,722 2.9
43,889 42,718
1,171 2.7
198,932 193,161
5,771 2.9
Civilian labor force Employed Unemployed Rate
Civilian labor force Employed Unemployed Rate
63,028 61,132 1,896
3.0
86,651 84,122 2,529
2.9
63,267 61,206
2,061 3.3
87,044 84,234
2,810 3.2
64,279 62,424
1,855 2.9
88,128 85,680
2,448 2.8
Change From
OCT 2022
NOV 2021
-100 -1
-99
-492 -495
3
494 826 -332
-1,354 -1,223
-131
-31
-38
130
-92
-161
54
-1,843 -1,322
-521
-289 281 -570
-239 -74
-165
-1,251 -1,292
41
-393 -112 -281
-1,477 -1,558
81
Area United States
(Seasonally adjusted)
United States
(Not Seasonally adjusted)
United States Labor Force Estimates
Place of Residence - Persons 16 Years and Older
Employment Status
Civilian labor force Employed Unemployed Rate
Civilian labor force Employed Unemployed Rate
NOV 2022
164,481,000 158,470,000
6,011,000 3.7
164,272,000 158,749,000
5,523,000 3.4
OCT 2022
164,667,000 158,608,000
6,059,000 3.7
164,753,000 159,144,000
5,609,000 3.4
NOV 2021
162,126,000 155,324,000
6,802,000 4.2
162,099,000 155,797,000
6,302,000 3.9
Change From
OCT 2022
NOV 2021
-186,000 -138,000 -48,000
2,355,000 3,146,000 -791,000
-481,000 -395,000
-86,000
2,173,000 2,952,000
-779,000
?Note: MSA data are not seasonally adjusted. Employment includes nonagricultural wage and salary employment, self-employment, unpaid family and private
household workers and agricultural workers. Persons in labor disputes are counted as employed. The use of unrounded data does not imply that the numbers are exact.
Albany MSA: Baker, Dougherty, Lee, Terrell, and Worth counties. Athens-Clarke County MSA: Clarke, Madison, Oconee, and Oglethorpe counties. Atlanta MSA: Barrow, Bartow, Butts, Carroll, Cherokee, Clayton, Cobb, Coweta, Dawson, DeKalb, Douglas, Fayette, Forsyth, Fulton, Gwinnett, Haralson, Heard, Henry, Jasper, Lamar, Meriwether, Morgan, Newton, Paulding, Pickens, Pike, Rockdale, Spalding, and Walton counties. Augusta-Richmond County MSA: Burke, Columbia, Lincoln, McDuffie, and Richmond counties in Georgia and Aiken and Edgefield counties in South Carolina. Brunswick MSA: Brantley, Glynn, and McIntosh counties. Columbus MSA: Chattahoochee, Harris, Marion, and Muscogee counties in Georgia and Russell County in Alabama. Dalton MSA: Murray and Whitfield counties. Gainesville MSA: Hall County. Hinesville MSA: Liberty and Long counties. Macon-Bibb County MSA: Bibb, Crawford, Jones, Monroe, and Twiggs counties. Rome MSA: Floyd County. Savannah MSA: Bryan, Chatham, and Effingham counties. Valdosta MSA: Brooks, Echols, Lanier, and Lowndes counties. Warner Robins MSA: Houston, Peach and Pulaski counties.
Source: Georgia Department of Labor, Workforce Statistics Division
16
Georgia Labor Force Estimates by County (not seasonally adjusted)
Place of Residence - Persons 16 Years and Older
Georgia
Preliminary November 2022
Labor Force
Employment
Unemployment Number Rate
5,256,085 5,108,604 147,481 2.8
Appling Atkinson Bacon Baker Baldwin
8,809 4,450 4,645 1,115 17,723
8,516 4,358 4,514 1,076 17,050
293 3.3 92 2.1 131 2.8 39 3.5
673 3.8
Banks Barrow Bartow Ben Hill Berrien
10,305 10,087
218 2.1
43,434 42,428 1,006 2.3
52,680 51,306 1,374 2.6
5,399 5,183
216 4.0
7,608 7,390
218 2.9
Bibb Bleckley Brantley Brooks Bryan
67,451 65,162 2,289 3.4
4,562 4,389
173 3.8
7,328 7,094
234 3.2
6,688 6,494
194 2.9
20,228 19,739
489 2.4
Bulloch Burke Butts Calhoun Camden
37,416 36,280 1,136 3.0
9,030 8,593
437 4.8
11,427 11,129
298 2.6
2,231 2,171
60 2.7
21,746 21,146 600 2.8
Candler Carroll Catoosa Charlton Chatham
6,092 5,948
144 2.4
57,639 56,062 1,577 2.7
33,231 32,437
794 2.4
4,980 4,836
144 2.9
144,615 140,692 3,923 2.7
Chattahoochee 1,907 1,830
77 4.0
Chattooga
9,079 8,742
337 3.7
Cherokee 143,945 140,838 3,107 2.2
Clarke
61,347 59,661 1,686 2.7
Clay
844
779
65 7.7
Clayton Clinch Cobb Coffee Colquitt
141,804 136,118 5,686 4.0
3,064 2,987
77 2.5
434,998 424,720 10,278 2.4
17,974 17,392
582 3.2
21,852 21,296
556 2.5
Columbia Cook Coweta Crawford Crisp
76,241 74,252 1,989 2.6
8,203 7,972
231 2.8
78,329 76,441 1,888 2.4
5,511 5,368
143 2.6
9,328 8,919
409 4.4
Revised October 2022
Labor Force
Employment
Unemployment Number Rate
5,271,358 5,110,866 160,492 3.0
8,909 4,567 4,731 1,140 17,778
8,597 4,442 4,583 1,098 17,035
312 3.5 125 2.7 148 3.1
42 3.7 743 4.2
10,312 10,067
245 2.4
43,491 42,395 1,096 2.5
52,812 51,294 1,518 2.9
5,516 5,254
262 4.7
7,705 7,464
241 3.1
67,054 64,555 2,499 3.7
4,613
4,415
198 4.3
7,409
7,166
243 3.3
6,795 6,586
209 3.1
20,431 19,895 536 2.6
37,664 36,356 1,308 3.5
9,019 8,562
457 5.1
11,441 11,124
317 2.8
2,243 2,175
68 3.0
21,700 21,042 658 3.0
6,132 5,989
143 2.3
57,864 56,121 1,743 3.0
33,541 32,661 880 2.6
4,979 4,825
154 3.1
145,972 141,652 4,320 3.0
1,919 1,836
83 4.3
9,152 8,792 360 3.9
144,318 140,882 3,436 2.4
61,608 59,671 1,937 3.1
868
803
65 7.5
141,880 135,941 5,939 4.2
3,091 3,006
85 2.7
435,776 424,670 11,106 2.5
18,215 17,546 669 3.7
22,281 21,664
617 2.8
76,051 73,877 2,174 2.9
8,253
7,981
272 3.3
78,449 76,394 2,055 2.6
5,502 5,338
164 3.0
9,329 8,876
453 4.9
Revised November 2021
Labor Force
Employment
Unemployment Number Rate
5,227,324 5,075,808 151,516 2.9
8,954 4,402 4,707 1,111 17,675
8,702 4,307 4,580 1,064 17,063
252 2.8 95 2.2
127 2.7 47 4.2
612 3.5
10,297 10,089 208 2.0
42,773 41,805 968 2.3
51,890 50,547 1,343 2.6
5,464 5,258
206 3.8
7,651 7,441
210 2.7
68,429 65,996 2,433 3.6
4,629 4,461
168 3.6
7,267 7,053
214 2.9
6,765 6,571
194 2.9
20,162 19,709
453 2.2
38,239 9,038 11,259 2,204
21,655
37,103 8,627 10,963 2,139 21,082
1,136 3.0 411 4.5 296 2.6 65 2.9 573 2.6
5,987 5,844
143 2.4
56,796 55,252 1,544 2.7
33,894 33,138
756 2.2
4,954 4,820
134 2.7
145,042 140,496 4,546 3.1
1,920 1,841
79 4.1
9,436 9,111
325 3.4
141,792 138,851 2,941 2.1
60,059 58,415 1,644 2.7
847
776
71 8.4
140,713 134,122 6,591 4.7
3,006 2,935
71 2.4
429,138 418,696 10,442 2.4
18,539 17,994
545 2.9
21,846 21,321
525 2.4
76,489 74,741 1,748 2.3
8,227 8,016
211 2.6
77,280 75,327 1,953 2.5
5,591 5,424
167 3.0
9,551 9,121
430 4.5
Source: Georgia Department of Labor, Workforce Statistics Division
17
Georgia Labor Force Estimates by County (not seasonally adjusted)
Place of Residence - Persons 16 Years and Older
Dade Dawson Decatur DeKalb Dodge
Preliminary November 2022
Labor Force
Employment
Unemployment Number Rate
8,009
7,811
198 2.5
13,518 13,216 302 2.2
11,118 10,774 344 3.1
408,550 396,662 11,888 2.9
6,925 6,698
227 3.3
Dooly Dougherty Douglas Early Echols
4,656 4,471
185 4.0
36,844 35,288 1,556 4.2
75,703 73,450 2,253 3.0
4,133 3,983
150 3.6
1,863 1,822
41 2.2
Effingham Elbert Emanuel Evans Fannin
33,800 7,581 8,709 5,164
11,986
33,011 7,319 8,371 5,033
11,696
789 2.3 262 3.5 338 3.9 131 2.5 290 2.4
Fayette Floyd Forsyth Franklin Fulton
60,019 58,624 1,395 2.3
43,851 42,626 1,225 2.8
131,270 128,519 2,751 2.1
10,071 9,800
271 2.7
580,333 563,154 17,179 3.0
Gilmer Glascock Glynn Gordon Grady
12,316 11,966 350 2.8
1,255 1,220
35 2.8
39,245 38,187 1,058 2.7
28,933 28,207
726 2.5
11,048 10,768 280 2.5
Greene
7,179 6,963
216 3.0
Gwinnett
505,115 492,766 12,349 2.4
Habersham 18,385 17,860
525 2.9
Hall
105,561 103,269 2,292 2.2
Hancock
2,511 2,382
129 5.1
Haralson Harris Hart Heard Henry
13,116 12,757 359 2.7
16,855 16,440
415 2.5
11,634 11,294 340 2.9
5,357 5,219
138 2.6
121,629 118,092 3,537 2.9
Houston Irwin Jackson Jasper Jeff Davis
70,816 68,809 2,007 2.8
3,499 3,370
129 3.7
45,724 44,852
872 1.9
7,247 7,080
167 2.3
6,127 5,915
212 3.5
Revised October 2022
Labor Force
Employment
Unemployment Number Rate
8,139 7,923
216 2.7
13,593 13,265
328 2.4
11,250 10,879
371 3.3
408,915 396,342 12,573 3.1
6,991
6,743
248 3.5
4,676 4,486
190 4.1
36,858 35,227 1,631 4.4
75,841 73,410 2,431 3.2
4,216 4,061
155 3.7
1,898 1,852
46 2.4
34,083 7,624 8,681 5,227
12,070
33,217 7,339 8,323 5,088 11,751
866 2.5 285 3.7 358 4.1 139 2.7 319 2.6
60,116 58,562 1,554 2.6
43,882 42,496 1,386 3.2
131,593 128,507 3,086 2.3
10,132 9,820
312 3.1
581,270 562,882 18,388 3.2
12,491 12,106
385 3.1
1,272 1,232
40 3.1
39,369 38,162 1,207 3.1
29,111 28,295
816 2.8
11,143 10,826
317 2.8
7,234 7,001 233 3.2
506,477 492,930 13,547 2.7
18,567 17,981
586 3.2
106,155 103,532 2,623 2.5
2,539 2,402
137 5.4
13,173 12,772
401 3.0
16,976 16,505
471 2.8
11,752 11,390
362 3.1
5,377 5,226
151 2.8
121,601 117,812 3,789 3.1
71,034 68,824 2,210 3.1
3,551 3,412
139 3.9
44,998 44,049
949 2.1
7,281
7,101
180 2.5
6,139 5,920
219 3.6
Revised November 2021
Labor Force
Employment
Unemployment Number Rate
8,140 7,965
175 2.1
13,319 13,031
288 2.2
11,274 10,951
323 2.9
404,402 390,993 13,409 3.3
7,060 6,816
244 3.5
4,741 4,545
196 4.1
37,033 35,398 1,635 4.4
74,795 72,403 2,392 3.2
4,266 4,108
158 3.7
1,877 1,834
43 2.3
33,728 7,654 8,639 5,183 11,917
32,956 7,377 8,311 5,047
11,639
772 2.3 277 3.6 328 3.8 136 2.6 278 2.3
59,100 57,775 1,325 2.2
43,889 42,718 1,171 2.7
129,258 126,665 2,593 2.0
10,101 9,806
295 2.9
574,271 555,059 19,212 3.3
12,379 12,060
319 2.6
1,261 1,232
29 2.3
39,134 38,042 1,092 2.8
28,766 28,085
681 2.4
10,948 10,679
269 2.5
7,167 6,957
210 2.9
498,650 485,828 12,822 2.6
18,520 18,011 509 2.7
106,204 104,013 2,191 2.1
2,489 2,368
121 4.9
12,917 12,578
339 2.6
16,957 16,564
393 2.3
11,738 11,378 360 3.1
5,292 5,139
153 2.9
120,037 116,338 3,699 3.1
72,061 70,130 1,931 2.7
3,545 3,424
121 3.4
44,873 44,047
826 1.8
7,145 6,974
171 2.4
6,016 5,837
179 3.0
Source: Georgia Department of Labor, Workforce Statistics Division
18
Georgia Labor Force Estimates by County (not seasonally adjusted)
Place of Residence - Persons 16 Years and Older
Jefferson Jenkins Johnson Jones Lamar
Preliminary November 2022
Labor Force
6,971 3,146 4,011 13,717 8,451
Employment
6,746 3,011 3,912 13,355 8,195
Unemployment Number Rate
225 3.2 135 4.3
99 2.5 362 2.6 256 3.0
Revised October 2022
Labor Force
7,000 3,189 4,020 13,671 8,484
Employment
6,739 3,046 3,905 13,265 8,208
Unemployment Number Rate
261 3.7 143 4.5 115 2.9 406 3.0 276 3.3
Lanier Laurens Lee Liberty Lincoln
3,797 19,241 15,165 25,915
3,513
3,668 18,548 14,780 25,129
3,403
129 3.4 693 3.6 385 2.5 786 3.0 110 3.1
3,813 19,203 15,175 25,954
3,524
3,681 18,471 14,763 25,092 3,406
132 3.5 732 3.8 412 2.7 862 3.3 118 3.3
Long Lowndes Lumpkin McDuffie McIntosh
8,378 8,147
231 2.8
50,680 49,148 1,532 3.0
17,727 17,333 394 2.2
8,446 8,087
359 4.3
6,141 5,962
179 2.9
8,439 8,185 254 3.0
50,761 49,087 1,674 3.3
17,908 17,441
467 2.6
8,409 8,036
373 4.4
6,184 5,987
197 3.2
Macon Madison Marion Meriwether Miller
4,488 14,151 3,256 9,046 2,722
4,309 13,793
3,146 8,726 2,653
179 4.0 358 2.5 110 3.4 320 3.5
69 2.5
4,567 14,232
3,285 9,099 2,735
4,370 13,834
3,167 8,755 2,663
197 4.3 398 2.8 118 3.6 344 3.8
72 2.6
Mitchell Monroe Montgomery Morgan Murray
7,893 13,162 3,737
9,747 15,213
7,615 12,836
3,602 9,516 14,640
278 3.5 326 2.5 135 3.6 231 2.4 573 3.8
8,001 13,134 3,729 9,839 15,258
7,693 12,770 3,595
9,581 14,609
308 3.8 364 2.8 134 3.6 258 2.6 649 4.3
Muscogee Newton Oconee Oglethorpe Paulding
75,807 72,787 3,020 4.0
54,675 52,981 1,694 3.1
21,165 20,759 406 1.9
7,304
7,128
176 2.4
92,172 89,956 2,216 2.4
76,105 72,905 3,200 4.2
54,800 52,961 1,839 3.4
21,287 20,820
467 2.2
7,348
7,158
190 2.6
92,289 89,865 2,424 2.6
Peach Pickens Pierce Pike Polk
11,842 16,036
8,539 9,270 18,359
11,433 15,671
8,314 9,042 17,834
409 3.5 365 2.3 225 2.6 228 2.5 525 2.9
11,973 16,062
8,558 9,316 18,514
11,502 15,660
8,310 9,064 17,942
471 3.9 402 2.5 248 2.9 252 2.7 572 3.1
Pulaski Putnam Quitman Rabun Randolph
3,993 8,773
765 7,562 2,340
3,880 8,498
721 7,355 2,245
113 2.8 275 3.1
44 5.8 207 2.7
95 4.1
4,037 8,827
769 7,676 2,410
3,908 8,532
727 7,451 2,312
129 3.2 295 3.3
42 5.5 225 2.9
98 4.1
Source: Georgia Department of Labor, Workforce Statistics Division
Revised November 2021
Labor Force
6,966 3,155 4,122 13,842 8,331
Employment
6,734 3,039 4,008 13,510 8,082
Unemployment Number Rate
232 3.3 116 3.7 114 2.8 332 2.4 249 3.0
3,859 19,680 15,190 26,314
3,536
3,743 19,049 14,822 25,525
3,409
116 3.0 631 3.2 368 2.4 789 3.0 127 3.6
8,471 8,246
225 2.7
51,778 50,276 1,502 2.9
17,670 17,302
368 2.1
8,459 8,139
320 3.8
6,102 5,921
181 3.0
4,544 13,855
3,261 8,934 2,733
4,361 13,514
3,168 8,595 2,667
183 4.0 341 2.5
93 2.9 339 3.8
66 2.4
7,996 13,298
3,760 9,611 15,433
7,698 12,983
3,643 9,372 14,958
298 3.7 315 2.4 117 3.1 239 2.5 475 3.1
76,500 53,927 20,706
7,135 90,751
73,426 52,203 20,338
6,970 88,635
3,074 4.0 1,724 3.2
368 1.8 165 2.3 2,116 2.3
12,018 15,798
8,547 9,115 18,516
11,613 15,446
8,339 8,912 18,020
405 3.4 352 2.2 208 2.4 203 2.2 496 2.7
4,049 8,769
754 7,515 2,349
3,937 8,492
722 7,315 2,253
112 2.8 277 3.2
32 4.2 200 2.7
96 4.1
19
Georgia Labor Force Estimates by County (not seasonally adjusted)
Place of Residence - Persons 16 Years and Older
Richmond Rockdale Schley Screven Seminole
Preliminary November 2022
Labor Force
Employment
Unemployment Number Rate
83,143 79,729 3,414 4.1
45,606 44,136 1,470 3.2
2,085 2,014
71 3.4
4,921 4,706
215 4.4
2,919 2,821
98 3.4
Spalding Stephens Stewart Sumter Talbot
29,607 10,344
2,586 11,874 2,785
28,662 10,013 2,491 11,392 2,698
945 3.2 331 3.2
95 3.7 482 4.1
87 3.1
Taliaferro Tattnall Taylor Telfair Terrell
528 9,644 2,792 3,528 3,514
507 9,400 2,673 3,318 3,362
21 4.0 244 2.5 119 4.3 210 6.0 152 4.3
Thomas Tift Toombs Towns Treutlen
17,292 21,662 11,768
4,181 2,539
16,748 21,136 11,329 4,035 2,437
544 3.1 526 2.4 439 3.7 146 3.5 102 4.0
Troup Turner Twiggs Union Upson
37,426 3,193 2,795 11,195 11,737
36,457 3,071 2,691
10,927 11,405
969 2.6 122 3.8 104 3.7 268 2.4 332 2.8
Walker
31,057 30,214 843 2.7
Walton
48,396 47,165 1,231 2.5
Ware
15,228 14,768
460 3.0
Warren
2,640 2,556
84 3.2
Washington 6,548 6,303
245 3.7
Wayne Webster Wheeler White Whitfield
11,611 11,280
331 2.9
973
943
30 3.1
1,613 1,538
75 4.6
16,730 16,363
367 2.2
42,685 41,189 1,496 3.5
Wilcox Wilkes Wilkinson Worth
2,686 3,614 3,599 8,815
2,602 3,482 3,471 8,568
84 3.1 132 3.7 128 3.6 247 2.8
Revised October 2022
Labor Force
Employment
Unemployment Number Rate
82,719 45,653
2,102 4,982 2,964
79,125 3,594 4.3
44,115 1,538 3.4
2,027
75 3.6
4,780
202 4.1
2,859
105 3.5
29,629 10,475 2,591 11,967 2,801
28,660 10,047 2,495 11,454
2,703
969 3.3 428 4.1
96 3.7 513 4.3 98 3.5
538 9,822 2,845 3,580 3,523
512 9,555 2,713 3,357 3,364
26 4.8 267 2.7 132 4.6 223 6.2 159 4.5
17,475 21,695 11,758
4,303 2,549
16,880 21,118 11,328 4,133 2,451
595 3.4 577 2.7 430 3.7 170 4.0
98 3.8
37,501 36,445 1,056 2.8
3,231 3,099
132 4.1
2,781 2,658
123 4.4
11,332 11,030
302 2.7
11,752 11,404 348 3.0
31,364 30,442
922 2.9
48,479 47,131 1,348 2.8
15,231 14,727 504 3.3
2,646 2,534
112 4.2
6,559 6,294
265 4.0
11,746 11,384
362 3.1
989
954
35 3.5
1,635 1,552
83 5.1
16,916 16,509
407 2.4
42,948 41,040 1,908 4.4
2,749 3,664 3,621 8,852
2,648 3,517 3,487 8,587
101 3.7 147 4.0 134 3.7 265 3.0
Revised November 2021
Labor Force
Employment
Unemployment Number Rate
83,664 80,261 3,403 4.1
45,042 43,504 1,538 3.4
2,146 2,073
73 3.4
5,010 4,798
212 4.2
2,947 2,860
87 3.0
29,208 10,534
2,591 12,202
2,776
28,242 10,170
2,511 11,714 2,685
966 3.3 364 3.5
80 3.1 488 4.0
91 3.3
526 9,606 2,856 3,646 3,544
506 9,377 2,729 3,449 3,368
20 3.8 229 2.4 127 4.4 197 5.4 176 5.0
17,372 21,514 11,867
4,107 2,573
16,826 21,007 11,460
3,971 2,493
546 3.1 507 2.4 407 3.4 136 3.3
80 3.1
37,509 3,237 2,830 11,207 11,732
36,372 3,097 2,722
10,953 11,398
1,137 3.0 140 4.3 108 3.8 254 2.3 334 2.8
31,630 47,634 15,236 2,664
6,771
30,846 46,475 14,822
2,575 6,510
784 2.5 1,159 2.4
414 2.7 89 3.3 261 3.9
11,890 11,549
341 2.9
992
958
34 3.4
1,614 1,541
73 4.5
16,749 16,417
332 2.0
43,362 42,136 1,226 2.8
2,727 3,598 3,594 8,837
2,639 3,467 3,481 8,571
88 3.2 131 3.6 113 3.1 266 3.0
Source: Georgia Department of Labor, Workforce Statistics Division
20
City Labor Force Estimates
Place of Residence - Persons 16 Years and Older
Preliminary November 2022
Labor Force
Employment
Unemployment Number Rate
Albany 29,833 28,540 1,293 4.3
Alpharetta 38,205 37,350
855 2.2
Athens 61,347 59,661 1,686 2.7
Atlanta 273,583 264,999 8,584 3.1
Dekalb Part
25,122 24,554
568 2.3
Fulton Part
248,461 240,445 8,016 3.2
Augusta 83,143 79,729 3,414 4.1
Brookhaven
36,213 35,559
654 1.8
Canton 17,382 17,033
349 2.0
Carrollton 11,961 11,581
380 3.2
Chamblee 21,528 21,172
356 1.7
Columbus 75,807 72,787 3,020 4.0
Dalton 13,409 12,928
481 3.6
Decatur 14,656 14,316
340 2.3
Douglasville 17,533 16,953
580 3.3
Duluth 16,414 16,035
379 2.3
Dunwoody
27,867 27,287
580 2.1
East Point
17,033 16,325
708 4.2
Gainesville
21,282 20,770
512 2.4
Hinesville 15,299 14,862
437 2.9
Johns Creek
46,130 45,138
992 2.2
Kennesaw 20,685 20,223
462 2.2
LaGrange 15,447 14,983
464 3.0
Lawrenceville
15,072 14,712
360 2.4
McDonough
12,900 12,392
508 3.9
Macon-Bibb
67,451 65,162 2,289 3.4
Marietta 36,089 35,247
842 2.3
Milton 20,909 20,455
454 2.2
Newnan 20,192 19,608
584 2.9
Peachtree City
19,346 18,970
376 1.9
P'tree Corners
25,854 25,226
628 2.4
Pooler 14,433 14,098
335 2.3
Rome 15,273 14,808
465 3.0
Roswell 55,056 53,932 1,124 2.0
Sandy Springs
67,487 65,951 1,536 2.3
Savannah 68,650 66,485 2,165 3.2
Smyrna 35,618 34,750
868 2.4
Statesboro
14,053 13,504
549 3.9
Stockbridge
14,884 14,404
480 3.2
Sugar Hill 13,644 13,334
310 2.3
Tucker 20,562 20,020
542 2.6
Union City
10,447 10,014
433 4.1
Valdosta 24,520 23,677
843 3.4
Warner Robins
33,810 32,767 1,043 3.1
Woodstock
18,395 18,006
389 2.1
Revised October 2022
Labor Force
Employment
Unemployment Number Rate
29,880 28,491 1,389 4.6
38,237 37,332 905 2.4
61,608 59,671 1,937 3.1
274,093 264,863 9,230 3.4
25,138 24,534
604 2.4
248,955 240,329 8,626 3.5
82,719 79,125 3,594 4.3
36,276 35,530
746 2.1
17,430 17,038 392 2.2
12,048 11,593
455 3.8
21,545 21,155 390 1.8
76,105 72,905 3,200 4.2
13,532 12,881
651 4.8
14,632 14,304
328 2.2
17,563 16,944
619 3.5
16,467 16,040
427 2.6
27,875 27,265
610 2.2
17,109 16,317
792 4.6
21,413 20,823 590 2.8
15,314 14,840
474 3.1
46,235 45,116 1,119 2.4
20,698 20,221
477 2.3
15,506 14,978
528 3.4
15,145 14,716
429 2.8
12,815 12,363
452 3.5
67,054 64,555 2,499 3.7
36,147 35,243 904 2.5
20,933 20,445 488 2.3
20,218 19,596 622 3.1
19,397 18,950
447 2.3
25,847 25,234
613 2.4
14,551 14,195 356 2.4
15,302 14,763 539 3.5
55,177 53,906 1,271 2.3
67,576 65,919 1,657 2.5
69,311 66,939 2,372 3.4
35,625 34,746
879 2.5
14,197 13,533 664 4.7
14,929 14,370 559 3.7
13,680 13,339
341 2.5
20,576 20,004
572 2.8
10,505 10,009 496 4.7
24,585 23,648
937 3.8
33,890 32,776 1,114 3.3
18,440 18,011
429 2.3
Revised November 2021
Labor Force
Employment
Unemployment Number Rate
30,019 37,575 60,059 270,493 24,805 245,688 83,664 35,647 17,128 11,758 21,280 76,500 13,584 14,438 17,283 16,180 27,572 17,013 21,378 15,573 45,460 20,444 15,506 14,971 12,761 68,429 35,619 20,621 19,917 18,998 25,527 14,384 15,283 54,283 66,541 69,004 35,089 14,305 14,741 13,222 20,206 10,008 25,052 34,419 18,169
28,629 36,813 58,415 261,192 24,203 236,989 80,261 35,051 16,793 11,414 20,870 73,426 13,225 14,111 16,711 15,809 26,897 16,090 20,920 15,096 44,489 19,937 14,948 14,504 12,208 65,996 34,747 20,161 19,323 18,695 24,871 14,079 14,840 53,157 65,003 66,393 34,257 13,811 14,190 13,020 19,734
9,592 24,221 33,394 17,752
1,390 4.6 762 2.0
1,644 2.7 9,301 3.4
602 2.4 8,699 3.5 3,403 4.1
596 1.7 335 2.0 344 2.9 410 1.9 3,074 4.0 359 2.6 327 2.3 572 3.3 371 2.3 675 2.4 923 5.4 458 2.1 477 3.1 971 2.1 507 2.5 558 3.6 467 3.1 553 4.3 2,433 3.6 872 2.4 460 2.2 594 3.0 303 1.6 656 2.6 305 2.1 443 2.9 1,126 2.1 1,538 2.3 2,611 3.8 832 2.4 494 3.5 551 3.7 202 1.5 472 2.3 416 4.2 831 3.3 1,025 3.0 417 2.3
Note: City estimates were prepared in cooperation with the U.S. Department of Labor, Bureau of Labor Statistics. All cities listed have total population of 25,000 or more.
Source: Georgia Department of Labor, Workforce Statistics Division
21
UNEMGPeoLrOgiaYUMneEmNploTymReAntTREateBs bYy CCoOunUtyNTIES NOVEMBER 2022 November 2022
Dade 2.5
Catoosa 2.4
Walker
Whitfield
Murray 3.8
Fannin 2.4
Union 2.4
Towns 3.5
Rabun 2.7
2.7
3.5
Chattooga 3.7
Gordon 2.5
Floyd 2.8
Bartow 2.6
Gilmer 2.8
Pickens 2.3
Cherokee 2.2
Lumpkin 2.2
Dawson 2.2
Forsyth 2.1
White Habersham
2.2
2.9
Stephens
3.2
Banks Franklin
Hall
2.1
2.7
2.2
Jackson 1.9
Madison 2.5
Hart 2.9
Elbert 3.5
5.0% or greater 4 counties (2%)
4.0% to 4.9% 20 counties (13%)
3.0% to 3.9% 54 counties (34%)
Polk 2.9
Paulding
Cobb 2.4
Gwinnett 2.4
Barrow 2.3
Clarke 2.7
Oglethorpe 2.4
Less than 3.0% 81 counties (51%)
Haralson 2.7
Carroll 2.7
Heard 2.6
2.4 Douglas 3.0
Coweta 2.4
Fulton 3.0
DeKalb 2.9 Rockdale
Walton 2.5
Oconee 1.9
Wilkes 3.7
Lincoln 3.1
Percentages of number of counties may not total 100 due to rounding
Clayton
4.0
Fayette 2.3
Henry 2.9
Spalding 3.2
3.2 Newton 3.1
Morgan 2.4
Butts 2.6
Jasper 2.3
Putnam 3.1
Greene 3.0
Taliaferro
4.0
McDuffie
Warren 4.3
Columbia 2.6
3.2
Richmond
Hancock
4.1
5.1
Glascock
2.8
Troup 2.6
Meriwether 3.5
Pike 2.5
Lamar 3.0
Monroe 2.5
Jones 2.6
Baldwin 3.8
Washington
Jefferson 3.2
Burke 4.8
Upson
3.7
Harris 2.5
Talbot 3.1
Muscogee 4.0
Marion Chattahoochee 3.4
2.8
Taylor 4.3
Crawford 2.6
Bibb 3.4
Twiggs 3.7
Wilkinson 3.6
Peach
3.5
Houston
Macon
2.8
4.0
Bleckley 3.8
Laurens 3.6
Johnson 2.5
Emanuel 3.9
Jenkins 4.3
Screven 4.4
Treutlen 4.0
Candler 2.4
Bulloch 3.0
Effingham 2.3
4.0
Stewart 3.7
Schley 3.4
Webster 3.1
Sumter 4.1
Quitman
5.8 Randolph Terrell
Lee
4.1
4.3
2.5
Clay 7.7
Calhoun 2.7
Dougherty 4.2
Early 3.6
Miller 2.5
Baker 3.5
Mitchell 3.5
Dooly 4.0
Pulaski 2.8
Dodge 3.3
Crisp 4.4
Wilcox 3.1
Turner 3.8
Ben Hill 4.0
Montgomery
Wheeler 4.6
3.6
Toombs 3.7
Evans 2.5
Tattnall
Telfair
2.5
6.0
Jeff Davis 3.5
Appling 3.3
Long 2.8
Bryan 2.4
Liberty 3.0
Worth 2.8
Colquitt 2.5
Irwin 3.7 Tift 2.4
Coffee 3.2
Berrien
Atkinson
2.9
2.1
Cook
2.8 Lanier
Bacon 2.8
Wayne 2.9
Ware 3.0
Pierce 2.6
Brantley 3.2
McIntosh 2.9
Glynn 2.7
Chatham 2.7
Seminole 3.4
Decatur 3.1
Grady 2.5
Thomas 3.1
Brooks 2.9
3.4
Lowndes 3.0
Clinch 2.5
Charlton 2.9
Camden 2.8
Echols
2.2
Georgia's Unemployment Rate: 2.8%
Georgia's U(nNoet SmeasponlaollyyAmdjusetend)t Rate: 2.8% (not seasonally adjusted) Source: Georgia Department of Labor, Workforce Statistics Division
22
Georgia Unemployment Insurance Claims by County
County
November 2022 Initial
Claims
Average Weekly Benefit
County
November 2022 Initial
Claims
Average Weekly Benefit
County
November 2022 Initial
Claims
Average Weekly Benefit
Georgia
Appling Atkinson Bacon Baker Baldwin Banks Barrow Bartow Ben Hill Berrien Bibb Bleckley Brantley Brooks Bryan Bulloch Burke Butts Calhoun Camden Candler Carroll Catoosa Charlton Chatham Chattahoochee Chattooga Cherokee Clarke Clay Clayton Clinch Cobb Coffee Colquitt Columbia Cook Coweta Crawford Crisp Dade Dawson Decatur DeKalb Dodge Dooly Dougherty Douglas Early Echols Effingham
25,518.............. $323
86.............. $295 19.............. $265 58.............. $287
3.............. $297 75.............. $280 39.............. $268 105.............. $299 245.............. $290 64.............. $210 15.............. $303 371.............. $270 13.............. $231 41.............. $293 18.............. $192 52.............. $257 180.............. $255 122.............. $250 49.............. $281 18.............. $228 49.............. $264 31.............. $283 174.............. $269 136.............. $304 15.............. $313 420.............. $283
6.............. $308 192.............. $279 287.............. $307 121.............. $300
4.............. $234 881.............. $283
10.............. $305 1,281.............. $301
160.............. $248 70.............. $235
185.............. $303 28.............. $264
259.............. $281 17.............. $222 64.............. $264 14.............. $236 40.............. $316 47.............. $312
1,828.............. $292 16.............. $279 19.............. $217
207.............. $262 351.............. $286
40.............. $189 3.............. $259
86.............. $304
Elbert Emanuel Evans Fannin Fayette Floyd Forsyth Franklin Fulton Gilmer Glascock Glynn Gordon Grady Greene Gwinnett Habersham Hall Hancock Haralson Harris Hart Heard Henry Houston Irwin Jackson Jasper Jeff Davis Jefferson Jenkins Johnson Jones Lamar Lanier Laurens Lee Liberty Lincoln Long Lowndes Lumpkin Macon Madison Marion McDuffie McIntosh Meriwether Miller Mitchell Monroe Montgomery Morgan Murray
48.............. $290 143.............. $255
15.............. $280 20.............. $260 167.............. $305 360.............. $266 190.............. $318 39.............. $266 2,518.............. $295 38.............. $295
3.............. $184 114.............. $254 336.............. $287 23.............. $255 22.............. $257 1,530.............. $305 158.............. $271 312.............. $306 14.............. $317 33.............. $286 40.............. $302 36.............. $224
11.............. $335 552.............. $290 321.............. $244
20.............. $242 80.............. $304 19.............. $296 46.............. $295 38.............. $247 32.............. $265 20.............. $239 40.............. $302 54.............. $296 11.............. $318 110.............. $252 41.............. $272 90.............. $256 16.............. $306 21.............. $308 229.............. $250 23.............. $250 45.............. $244 33.............. $253 12.............. $314 86.............. $247 19.............. $266 66.............. $257
5.............. $273 30.............. $297 37.............. $274 74.............. $289 24.............. $279 594.............. $284
Muscogee Newton Oconee Oglethorpe Paulding Peach Pickens Pierce Pike Polk Pulaski Putnam Quitman Rabun Randolph Richmond Rockdale Schley Screven Seminole Spalding Stephens Stewart Sumter Talbot Taliaferro Tattnall Taylor Telfair Terrell Thomas Tift Toombs Towns Treutlen Troup Turner Twiggs Union Upson Walker Walton Ware Warren Washington Wayne Webster Wheeler White Whitfield Wilcox Wilkes Wilkinson Worth
398.............. $264 249.............. $303
17.............. $308 22.............. $275 285.............. $305 45.............. $255 36.............. $299 45.............. $329 51.............. $280 197.............. $295 14.............. $268 27.............. $289
2.............. $259 26.............. $258 11.............. $267 541.............. $281 239.............. $307
8.............. $250 62.............. $306 13.............. $144 263.............. $292 122.............. $251 10.............. $290 107.............. $258 10.............. $324
1.............. $365 64.............. $306 18.............. $249 47.............. $255 29.............. $253 54.............. $259 81.............. $255 288.............. $295 12.............. $272 53.............. $293 199.............. $279 30.............. $249 17.............. $292 21.............. $297 208.............. $255 245.............. $288 138.............. $301 132.............. $313 18.............. $289 35.............. $282 46.............. $306
2.............. $173 17.............. $268 42.............. $289 2,068.............. $286
6.............. $303 5.............. $244 11.............. $246 36.............. $294
?Note: Initial claims include intrastate initial and additional claims, as well as agent state initial and additional claims for regular UI only. Average duration of benefits is represented in weeks.
Data does not include state or federal extended benefits. Source: Georgia Department of Labor, Workforce Statistics Division
23
Mark Butler, Commissioner 148 Andrew Young International Boulevard, N.E. Atlanta, Georgia 30303-1751
Return Service Requested