- Collection:
- Georgia Government Publications
- Title:
- Dimensions: measuring Georgia's workforce, 2020 May
- Creator:
- Georgia. Department of Labor
- Contributor to Resource:
- Georgia. Department of Labor
- Publisher:
- Atlanta, Ga. : Georgia. Department of Labor
- Date of Original:
- 2020-05
- Subject:
- Labor market--Georgia--Statistics--Periodicals
Wages--Georgia--Statistics--Periodicals
Hours of labor--Georgia--Statistics--Periodicals - Location:
- United States, Georgia, 32.75042, -83.50018
- Medium:
- serials (publications)
- Type:
- Text
- Format:
- application/pdf
- External Identifiers:
- Call Number GA L200.E46 P1 T7 46/5
- Metadata URL:
- https://dlg.galileo.usg.edu/id:dlg_ggpd_i-ga-bl200-pe46-bp1-bt7-b46-s5-belec-p-btext
- Digital Object URL:
- https://dlg.galileo.usg.edu/do:dlg_ggpd_i-ga-bl200-pe46-bp1-bt7-b46-s5-belec-p-btext
- Language:
- eng
- Holding Institution:
- University of Georgia. Map and Government Information Library
- Rights:
-

Jackson Madison Elbert
Polk
Cobb
Gwinnett Barrow Clarke
D I M E N S I O Paulding
Haralson Douglas
DeKalb Rock-
Walton
Oconee Oglethorpe
Wilkes
Lincoln
EdgefieSlCd,
Carroll
Fulton Clayton
dale Newton
Morgan Greene Taliaferro
Columbia
Fayette Henry
McDuffie Warren
Heard
Coweta
Spalding Butts Jasper Putnam Hancock
Glascock
Richmond
AikenSC,
N
S
Russell, AL
Measuring Georgia's Workforce Troup Meriwether Pike Lamar Monroe Upson
Jones
Baldwin
Jefferson Washington
Burke
Harris
Talbot
May 2020 Data
Muscogee
Bibb Crawford
Taylor
Peach
Wilkinson Twiggs
Johnson
Jenkins Emanuel
Screven
Volume XLVI, Number 5
May 2020 Employment Situation Marion Chattahoo-
Houston Bleckley Macon
Laurens
Treutlen
chee
In millions
CandlGereorgBuialloEcmh ploEyfmfinegnhatm
(Seasonally Adjusted)
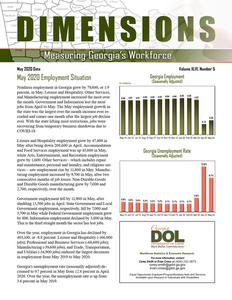
Nonfarm employSmchelneyt in GeorgiDaogolryew Pbuylas7k9i ,60D0o, dogre1.9 perScteewnatr,tin MWeabyst.eLr eisSuurmetaernd Hospitality, Other Services,
Montgomery
Wheeler
Toombs
Evans
Bryan
QuaitnmdanManufacturing employment CinriscpreaseWdiltchoex most ovTeerlfair
4.60
4.61
4.61
Tattnall
4.63 4.63
4.63
4.64
4.64
tjohbesmRfaronondmothlp.AhGporivTleertrroenllMmeany.tLeTaenhde
Information lost the most May emTuprnloeryment gBeronwHitllh
in
Jeff Davis
Appling
Liberty Long
Chatham
4.65 4.65 4.62
tchColeradysetadteaCnwadlahcosoutnmheeslaorDgnoeeusgmtheoorvtnyetrhtWahfoetretmhr othnethlairngcersetaIjsrowebinedveecrlrien-eCoffee
evEearr.lyWith recovering
the state lifting most restrictiToinfts, jobs were froBmaketer mporary business shutdownBsedrruieen to
Atkinson
COVIDMi-ll1e9r .
Mitchell
Colquitt Cook
Bacon
Wayne
Pierce
Ware
Brantley
McIntosh Glynn
4.20 4.12
Lanier
May-19 Jun-19 Jul-19 Aug-19 Sep-19 Oct-19 Nov-19 Dec-19 Jan-20 Feb-20 Mar-20 Apr-20 May-20
LeSiseumrineoalend Hospitality employment grew by 47,400 in Clinch May afterDbeceaitnugr dowGnrad2y08,6T0ho0mians ApBrriolo. kAs ccomLomwnoddeas tion
Charlton
Camden
and Food Services employment was up 45,800 in MayE,chols
Georgia Unemployment Rate
while Arts, Entertainment, and Recreation employment
(Seasonally Adjusted)
grew by 1,600. Other Services which includes repair
and maintenance, personal and laundry, and religious ser-
12.6%
vices saw employment rise by 11,800 in May. Manufac-
turing employment increased by 9,700 in May, after two
9.7%
consecutive months of job losses. Non-Durable Goods
and Durable Goods manufacturing grew by 7,000 and
2,700, respectively, over the month.
Government employment fell by 11,900 in May, after shedding 13,500 jobs in April. State Government and Local Government employment, respectively, fell by 7,000 and 5,700 in May while Federal Government employment grew by 800. Information employment declined by 3,800 in May. This is the third straight month the sector has lost jobs.
4.6% 3.6% 3.5% 3.4% 3.3% 3.2% 3.2% 3.1% 3.1% 3.1% 3.1%
May-19 Jun-19 Jul-19 Aug-19 Sep-19 Oct-19 Nov-19 Dec-19 Jan-20 Feb-20 Mar-20 Apr-20 May-20
Over the year, employment in Georgia has declined by 403,100, or -8.8 percent. Leisure and Hospitality (-166,000 jobs); Professional and Business Services (-68,600 jobs); Manufacturing (-39,600 jobs); and Trade, Transportation, and Utilities (-34,900 jobs) endured the largest decreases in employment from May 2019 to May 2020.
Georgia's unemployment rate (seasonally adjusted) decreased to 9.7 percent in May from 12.6 percent in April 2020. Over the year, the unemployment rate is up from 3.6 percent in May 2019.
Workforce Statistics & Economic Research
For more information, contact Corey Smith or Evan Cross at (404) 232-3875
corey.smith@gdol.ga.gov evan.cross@gdol.ga.gov
Equal Opportunity Employer/ProgramAuxiliary Aids and Services Available upon Request to Individuals with Disabilities
Georgia Nonfarm Employment
(In thousands)
(Seasonally Adjusted)
Preliminary
Revised
MAY 2020 APR 2020
Revised MAY 2019
Change in Jobs from APR 2020
Net %
Change in Jobs from MAY 2019
Net %
Total Nonfarm
4,200.1
4,120.5
4,603.2
79.6 1.9
-403.1 -8.8
Total Private
3,535.7
3,444.2
3,914.6
91.5 2.7
-378.9 -9.7
Goods Producing
573.8
560.2
620.5
13.6 2.4
-46.7 -7.5
Service-Providing
3,626.3
3,560.3
3,982.7
66.0 1.9
-356.4 -8.9
Private Service-Providing
2,961.9
2,884.0
3,294.1
77.9 2.7
-332.2 -10.1
Mining and Logging
9.0
9.0
9.3
0.0 0.0
-0.3 -3.2
Mining, Logging and Construction
206.0
202.1
213.1
3.9 1.9
-7.1 -3.3
Construction
197.0
193.1
203.8
3.9 2.0
-6.8 -3.3
Manufacturing
367.8
358.1
407.4
9.7 2.7
-39.6 -9.7
Durable Goods
183.1
180.4
203.6
2.7 1.5
-20.5 -10.1
Non-Durable Goods
184.7
177.7
203.8
7.0 3.9
-19.1 -9.4
Trade, Transportation, and Utilities
907.6
906.2
942.5
1.4 0.2
-34.9 -3.7
Wholesale Trade
214.4
209.9
216.8
4.5 2.1
-2.4 -1.1
Retail Trade
474.1
471.4
494.1
2.7 0.6
-20.0 -4.0
Transportation, Warehousing, and Utilities
219.1
224.9
231.6
-5.8 -2.6
-12.5 -5.4
Information
104.0
107.8
116.7
-3.8 -3.5
-12.7 -10.9
Financial Activities
243.9
238.8
249.9
5.1 2.1
-6.0 -2.4
Finance and Insurance
182.3
180.2
177.9
2.1 1.2
4.4 2.5
Real Estate and Rental and Leasing
61.6
58.6
72.0
3.0 5.1
-10.4 -14.4
Professional and Business Services
649.3
641.0
717.9
8.3 1.3
-68.6 -9.6
Professional, Scientific, and Technical Services
269.7
265.1
282.1
4.6 1.7
-12.4 -4.4
Management of Companies and Enterprises
81.9
84.5
90.7
-2.6 -3.1
-8.8 -9.7
Admin and Support, Waste Mngmnt and Remediation
297.7
291.4
345.1
6.3 2.2
-47.4 -13.7
Education and Health Services
581.3
573.6
604.7
7.7 1.3
-23.4 -3.9
Educational Services
81.0
84.0
91.6
-3.0 -3.6
-10.6 -11.6
Health Care and Social Assistance
500.3
489.6
513.1
10.7 2.2
-12.8 -2.5
Leisure and Hospitality
332.1
284.7
498.1
47.4 16.6
-166.0 -33.3
Arts, Entertainment, and Recreation
31.4
29.8
56.1
1.6 5.4
-24.7 -44.0
Accommodation and Food Services
300.7
254.9
442.0
45.8 18.0
-141.3 -32.0
Other Services
143.7
131.9
164.3
11.8 8.9
-20.6 -12.5
Government
664.4
676.3
688.6
-11.9 -1.8
-24.2 -3.5
Federal Government
105.3
104.5
102.9
0.8 0.8
2.4 2.3
State Government
158.6
165.6
168.6
-7.0 -4.2
-10.0 -5.9
Local Government
400.5
406.2
417.1
-5.7 -1.4
-16.6 -4.0
Note: These seasonally adjusted estimates were prepared in cooperation with the U.S. Department of Labor, Bureau of Labor Statistics, based upon monthly reports submitted by selected
employers throughout Georgia. The estimates include all full- and part-time wage and salary workers who were employed during or received pay for any part of the pay period that includes the twelfth of the month. Proprietors, domestic workers, self-employed persons, unpaid family workers and personnel of the armed forces are excluded. Estimates based on 2019 benchmark.
Source: Georgia Department of Labor, Workforce Statistics & Economic Research
Georgia Department of Labor, Mark Butler, Commissioner Equal Opportunity Employer/Program Auxiliary Aids and Services Available Upon Request to Individuals With Disabilities
2
Georgia Nonfarm Employment
(In thousands)
(Not Seasonally Adjusted)
Preliminary
Revised
Revised
MAY 2020 APR 2020 MAY 2019
Change in Jobs from APR 2020
Net %
Change in Jobs from MAY 2019
Net %
Total Nonfarm
4,210.2
Total Private
3,545.2
Goods Producing
575.4
Service-Providing
3,634.8
Private Service-Providing
2,969.8
Mining and Logging
9.0
Mining, Logging and Construction
208.1
Construction
199.1
Construction of Buildings
45.3
Heavy and Civil Engineering Construction
34.1
Specialty Trade Contractors
119.7
Manufacturing
367.3
Durable Goods
182.8
Transportation Equipment Manufacturing
41.2
Non-Durable Goods
184.5
Food Manufacturing
63.2
Textile Mills
13.6
Textile Product Mills
25.9
Trade, Transportation, and Utilities
906.5
Wholesale Trade
214.2
Merchant Wholesalers, Durable Goods
115.0
Merchant Wholesalers, Nondurable Goods
64.3
Wholesale Electronic Markets and Agents and Brokers 34.9
Retail Trade
475.3
Food and Beverage Stores
97.7
General Merchandise Stores
107.1
Miscellaneous Store Retailers
21.9
Transportation, Warehousing, and Utilities
217.0
Utilities
19.7
Transportation and Warehousing
197.3
Air Transportation
18.9
Truck Transportation
52.5
Couriers and Messengers
28.0
Warehousing and Storage
56.7
Information
102.1
Telecommunications
35.1
Wired and Wireless Telecommunications Carriers
30.3
Data Processing, Hosting, and Related Services
14.2
Financial Activities
244.0
Finance and Insurance
182.6
Insurance Carriers and Related Activities
88.9
Real Estate and Rental and Leasing
61.4
Professional and Business Services
649.8
Professional, Scientific, and Technical Services
268.6
Accounting, Tax Prep, and Bookkeeping Services
34.9
Architectural, Engineering, and Related Services
43.0
Computer Systems Design and Related Services
68.7
Management and Technical Consulting Services
44.9
Management of Companies and Enterprises
82.0
Admin and Support, Waste Mngmnt and Remediation
299.2
Employment Services
129.3
Education and Health Services
581.9
Educational Services
80.5
Colleges, Universities, and Professional Schools
44.4
Health Care and Social Assistance
501.4
Ambulatory Health Care Services
207.9
Hospitals
163.8
Nursing and Residential Care Facilities
60.5
Social Assistance
69.2
Leisure and Hospitality
341.4
Arts, Entertainment, and Recreation
33.3
Amusement, Gambling, and Recreation Industries
25.0
Accommodation and Food Services
308.1
Accommodation
25.6
Food Services and Drinking Places
282.5
Other Services
144.1
Repair and Maintenance
39.2
Personal and Laundry Services
29.7
Religious, Grantmaking, Civic, Professional, and Similar
75.2
Government
665.0
Federal Government
105.1
Department of Defense
44.5
State Government
157.9
State Government Educational Services
90.2
State Government excluding Educational Services
67.7
Local Government
402.0
Local Government Educational Services
232.5
Local Government excluding Educational Services
169.5
4,123.7 3,444.9
560.3 3,563.4 2,884.6
9.0 202.8 193.8
45.3 34.0 114.5 357.5 180.2 40.1 177.3 62.9 13.1 23.2 902.5 210.3 110.8 64.3 35.2 471.4 96.5 103.1 21.0 220.8 19.7 201.1 22.3 53.5 27.5 56.4 105.7 36.1 31.4 14.3 237.9 179.6 87.7 58.3 641.0 267.3 34.9 42.4 69.0 45.0 83.8 289.9 121.6 575.5 85.8 48.6 489.7 198.2 163.8 61.1 66.6 290.2 31.0 20.4 259.2 27.1 232.1 131.8 37.0 20.4 74.4 678.8 104.3 44.4 167.2 97.0 70.2 407.3 238.3 169.0
4,613.5 3,919.5
620.5 3,993.0 3,299.0
9.3 213.7 204.4 44.5 34.3 125.6 406.8 203.3 55.1 203.5 65.1
19.0 29.0 938.7 216.5 114.8 64.6 37.1 492.5 92.1 105.6 22.3 229.7 19.3 210.4 30.3 55.7 25.6 55.4 115.3 38.3 33.2 13.3 249.5 177.4 85.0 72.1 714.6 280.2 34.0 43.0 72.5 46.8 90.5 343.9 167.2 606.2 92.3 44.5 513.9 219.4 159.5 60.8 74.2 509.5 59.7 42.7 449.8 49.7 400.1 165.2 41.7 40.1 83.4 694.0 102.5 42.9 169.8 99.7 70.1 421.7 249.0 172.7
86.5 100.3
15.1 71.4 85.2 0.0 5.3 5.3 0.0 0.1 5.2 9.8 2.6
1.1 7.2 0.3 0.5 2.7 4.0 3.9 4.2 0.0 -0.3 3.9 1.2 4.0 0.9 -3.8 0.0 -3.8 -3.4 -1.0 0.5 0.3 -3.6 -1.0 -1.1 -0.1 6.1 3.0 1.2 3.1 8.8 1.3 0.0 0.6 -0.3 -0.1 -1.8 9.3 7.7 6.4 -5.3 -4.2 11.7 9.7 0.0 -0.6 2.6 51.2 2.3 4.6 48.9 -1.5 50.4 12.3 2.2 9.3 0.8 -13.8 0.8 0.1 -9.3 -6.8 -2.5 -5.3 -5.8 0.5
2.1 2.9 2.7 2.0 3.0 0.0 2.6 2.7 0.0 0.3 4.5 2.7 1.4 2.7 4.1 0.5 3.8 11.6 0.4 1.9 3.8 0.0 -0.9 0.8 1.2 3.9 4.3 -1.7 0.0 -1.9 -15.3 -1.9 1.8 0.5 -3.4 -2.8 -3.5 -0.7 2.6 1.7 1.4 5.3 1.4 0.5 0.0 1.4 -0.4 -0.2 -2.2 3.2 6.3 1.1 -6.2 -8.6 2.4 4.9 0.0 -1.0 3.9 17.6 7.4 22.6 18.9 -5.5 21.7 9.3 6.0 45.6 1.1 -2.0 0.8 0.2 -5.6 -7.0 -3.6 -1.3 -2.4 0.3
-403.3 -374.3 -45.1 -358.2 -329.2
-0.3 -5.6 -5.3 0.8 -0.2 -5.9 -39.5 -20.5 -13.9 -19.0 -1.9 -5.4 -3.1 -32.2 -2.3 0.2 -0.3 -2.2 -17.2 5.6 1.5 -0.4 -12.7 0.4 -13.1 -11.4 -3.2 2.4 1.3 -13.2 -3.2 -2.9 0.9 -5.5 5.2 3.9 -10.7 -64.8 -11.6 0.9 0.0 -3.8 -1.9 -8.5 -44.7 -37.9 -24.3 -11.8 -0.1 -12.5 -11.5 4.3 -0.3 -5.0 -168.1 -26.4 -17.7 -141.7 -24.1 -117.6 -21.1 -2.5 -10.4 -8.2 -29.0 2.6 1.6 -11.9 -9.5 -2.4 -19.7 -16.5 -3.2
-8.7 -9.6 -7.3 -9.0 -10.0 -3.2 -2.6 -2.6 1.8 -0.6 -4.7 -9.7 -10.1 -25.2 -9.3 -2.9 -28.4 -10.7 -3.4 -1.1 0.2 -0.5 -5.9 -3.5 6.1 1.4 -1.8 -5.5 2.1 -6.2 -37.6 -5.8 9.4 2.4 -11.5 -8.4 -8.7 6.8 -2.2 2.9 4.6 -14.8 -9.1 -4.1 2.7 0.0 -5.2 -4.1 -9.4 -13.0 -22.7 -4.0 -12.8 -0.2 -2.4 -5.2 2.7 -0.5 -6.7 -33.0 -44.2 -41.5 -31.5 -48.5 -29.4 -12.8 -6.0 -25.9 -9.8 -4.2 2.5 3.7 -7.0 -9.5 -3.4 -4.7 -6.6 -1.9
Note: These not seasonally adjusted estimates were prepared in cooperation with the U.S. Department of Labor, Bureau of Labor Statistics, based upon monthly reports submitted by selected
employers throughout Georgia. The estimates include all full- and part-time wage and salary workers who were employed during or received pay for any part of the pay period that includes the twelfth of the month. Proprietors, domestic workers, self-employed persons, unpaid family workers and personnel of the armed forces are excluded. Estimates based on 2019 benchmark.
Source: Georgia Department of Labor, Workforce Statistics & Economic Research
3
Albany MSA Nonfarm Employment
(Not Seasonally Adjusted)
(In thousands)
Preliminary
Revised
Revised
MAY 2020 APR 2020 MAY 2019
Change in Jobs from APR 2020
Net %
Change in Jobs from MAY 2019
Net %
Total Nonfarm Total Private Goods Producing Service-Providing Private Service-Providing Trade, Transportation, and Utilities
Retail Trade Government
Federal Government State Government Local Government
57.9
57.1
62.9
0.8 1.4
46.2
45.1
50.6
1.1 2.4
6.3
6.2
6.9
0.1 1.6
51.6
50.9
56.0
0.7 1.4
39.9
38.9
43.7
1.0 2.6
12.1
12.1
12.6
0.0 0.0
7.5
7.4
7.7
0.1 1.4
11.7
12.0
12.3
-0.3 -2.5
2.7
2.7
2.7
0.0 0.0
2.2
2.3
2.5
-0.1 -4.4
6.8
7.0
7.1
-0.2 -2.9
-5.0 -8.0 -4.4 -8.7 -0.6 -8.7 -4.4 -7.9 -3.8 -8.7 -0.5 -4.0 -0.2 -2.6 -0.6 -4.9 0.0 0.0 -0.3 -12.0 -0.3 -4.2
Note: These not seasonally adjusted estimates were prepared in cooperation with the U.S. Department of Labor, Bureau of Labor Statistics, based upon monthly reports submitted by
selected employers in the Albany Metropolitan Statistical Area, which includes Baker, Dougherty, Lee, Terrell and Worth counties. The estimates include all full- and part-time wage and salary workers who were employed during or received pay for any part of the pay period that includes the twelfth of the month. Proprietors, domestic workers, self-employed persons, unpaid familyworkers and personnel of the armed forces are excluded. Estimates based on 2019 benchmark.
Source: Georgia Department of Labor, Workforce Statistics & Economic Research
Athens-Clarke county MSA Nonfarm Employment
(In thousands)
(Not Seasonally Adjusted)
Preliminary
Revised
Revised
MAY 2020 APR 2020 MAY 2019
Change in Jobs from APR 2020
Net %
Change in Jobs from MAY 2019
Net %
Total Nonfarm Total Private Goods Producing Service-Providing Private Service-Providing Trade, Transportation, and Utilities
Retail Trade Professional and Business Services Leisure and Hospitality Government
Federal Government State Government Local Government
91.0
87.8
96.8
3.2 3.6
65.6
61.9
68.7
3.7 6.0
9.0
8.6
10.1
0.4 4.7
82.0
79.2
86.7
2.8 3.5
56.6
53.3
58.6
3.3 6.2
15.4
15.1
16.2
0.3 2.0
10.1
10.1
10.5
0.0 0.0
7.8
7.7
8.2
0.1 1.3
9.1
6.7
11.5
2.4 35.8
25.4
25.9
28.1
-0.5 -1.9
1.0
1.0
1.0
0.0 0.0
16.8
17.4
19.0
-0.6 -3.5
7.6
7.5
8.1
0.1 1.3
-5.8 -6.0 -3.1 -4.5 -1.1 -10.9 -4.7 -5.4 -2.0 -3.4 -0.8 -4.9 -0.4 -3.8 -0.4 -4.9 -2.4 -20.9 -2.7 -9.6 0.0 0.0 -2.2 -11.6 -0.5 -6.2
Note: These not seasonally adjusted estimates were prepared in cooperation with the U.S. Department of Labor, Bureau of Labor Statistics, based upon monthly reports submitted by selected
employers in the Athens-Clarke County Metropolitan Statistical Area, which includes Clarke, Madison, Oconee and Oglethorpe counties. The estimates include all full- and part-time wage and salary workers who were employed during or received pay for any part of the pay period that includes the twelfth of the month. Proprietors, domestic workers, self-employed persons, unpaid family workers and personnel of the armed forces are excluded. Estimates based on 2019 benchmark.
Source: Georgia Department of Labor, Workforce Statistics & Economic Research
4
Atlanta MSA Nonfarm Employment
(In thousands)
(Not Seasonally Adjusted)
Preliminary
Revised
MAY 2020 APR 2020
Revised MAY 2019
Change in Jobs from APR 2020
Net %
Change in Jobs from MAY 2019
Net %
Total Nonfarm Total Private Goods Producing Service-Providing Private Service-Providing Mining and Logging Mining, Logging and Construction Construction
Construction of Buildings Specialty Trade Contractors Manufacturing Durable Goods Transportation Equipment Manufacturing Non-Durable Goods Food Manufacturing Trade, Transportation, and Utilities Wholesale Trade Merchant Wholesalers, Durable Goods Merchant Wholesalers, Nondurable Goods Wholesale Electronic Markets and Agents and Brokers Retail Trade Food and Beverage Stores General Merchandise Stores Miscellaneous Store Retailers Transportation, Warehousing, and Utilities Utilities Transportation and Warehousing Air Transportation Truck Transportation Couriers and Messengers Information Telecommunications Wired and Wireless Telecommunications Carriers Data Processing, Hosting, and Related Services Financial Activities Finance and Insurance Insurance Carriers and Related Activities Real Estate and Rental and Leasing Professional and Business Services Professional, Scientific, and Technical Services Accounting, Tax Prep, and Bookkeeping Services Architectural, Engineering, and Related Services Computer Systems Design and Related Services Management and Technical Consulting Services Management of Companies and Enterprises Admin and Support, Waste Mngmnt and Remediation Employment Services Education and Health Services Educational Services Health Care and Social Assistance Ambulatory Health Care Services Hospitals Social Assistance Leisure and Hospitality Arts, Entertainment, and Recreation Accommodation and Food Services Accommodation Food Services and Drinking Places Other Services Repair and Maintenance Personal and Laundry Services Government Federal Government State Government Local Government
2,582.7 2,256.6
278.8 2,303.9 1,977.8
1.6 127.4 125.8
30.4 80.4 151.4 81.4 10.1 70.0 23.1 572.0 153.7 86.1 41.9 25.7 280.1 61.2 57.7 14.8 138.2 10.1 128.1 18.3 34.0 21.6 90.2 29.9 26.2 13.7 173.2 127.4 62.7 45.8 497.4 218.8 25.3 33.8 61.5 41.2 70.7 207.9 93.0 353.1 59.4 293.7 129.0 94.4 41.2 203.2 22.0 181.2 14.7 166.5 88.7 23.2 18.9 326.1 48.6 68.6 208.9
2,547.5 2,217.6
275.3 2,272.2 1,942.3
1.5 125.5 124.0
30.3 78.4 149.8 81.1
9.6 68.7 22.7 575.0 149.0 82.4 41.3 25.3 281.6 60.4 55.2 14.0 144.4 10.1 134.3 21.6 35.2 21.2 94.0 30.7 26.8 13.8 167.6 125.1 61.6 42.5 494.4 218.2 25.6 33.4 61.8 40.9 72.8 203.4 86.4 353.3 62.2 291.1 123.1 94.1 43.5 176.7 21.3 155.4 16.9 138.5 81.3 21.6 12.9 329.9 47.9 71.7 210.3
2,843.4 2,506.8
304.2 2,539.2 2,202.6
1.6 132.3 130.7
29.1 83.9 171.9 90.2 15.7 81.7 23.0 598.2 154.7 83.9 41.9 28.9 289.3 57.5 56.9 14.7 154.2 10.1 144.1 29.8 35.1 19.3 99.6 32.1 28.1 12.7 176.7 123.0 60.0 53.7 545.5 227.5 24.7 33.1 62.3 41.3 78.7 239.3 118.8 368.9 66.2 302.7 135.6 90.1 47.4 309.9 42.9 267.0 27.0 240.0 103.8 24.6 28.6 336.6 46.9 74.4 215.3
35.2 39.0
3.5 31.7 35.5
0.1 1.9 1.8 0.1 2.0 1.6 0.3 0.5 1.3 0.4 -3.0 4.7 3.7 0.6 0.4 -1.5 0.8 2.5 0.8 -6.2 0.0 -6.2 -3.3 -1.2 0.4 -3.8 -0.8 -0.6 -0.1 5.6 2.3 1.1 3.3 3.0 0.6 -0.3 0.4 -0.3 0.3 -2.1 4.5 6.6 -0.2 -2.8 2.6 5.9 0.3 -2.3 26.5 0.7 25.8 -2.2 28.0 7.4 1.6 6.0 -3.8 0.7 -3.1 -1.4
1.4 1.8 1.3 1.4 1.8 6.7 1.5 1.5 0.3 2.6 1.1 0.4 5.2 1.9 1.8 -0.5 3.2 4.5 1.5 1.6 -0.5 1.3 4.5 5.7 -4.3 0.0 -4.6 -15.3 -3.4 1.9 -4.0 -2.6 -2.2 -0.7 3.3 1.8 1.8 7.8 0.6 0.3 -1.2 1.2 -0.5 0.7 -2.9 2.2 7.6 -0.1 -4.5 0.9 4.8 0.3 -5.3 15.0 3.3 16.6 -13.0 20.2 9.1 7.4 46.5 -1.2 1.5 -4.3 -0.7
-260.7 -9.2 -250.2 -10.0
-25.4 -8.4 -235.3 -9.3 -224.8 -10.2
0.0 0.0 -4.9 -3.7 -4.9 -3.8 1.3 4.5 -3.5 -4.2 -20.5 -11.9 -8.8 -9.8 -5.6 -35.7 -11.7 -14.3 0.1 0.4 -26.2 -4.4 -1.0 -0.7 2.2 2.6 0.0 0.0 -3.2 -11.1 -9.2 -3.2 3.7 6.4 0.8 1.4 0.1 0.7 -16.0 -10.4 0.0 0.0 -16.0 -11.1 -11.5 -38.6 -1.1 -3.1 2.3 11.9 -9.4 -9.4 -2.2 -6.9 -1.9 -6.8 1.0 7.9 -3.5 -2.0 4.4 3.6 2.7 4.5 -7.9 -14.7 -48.1 -8.8 -8.7 -3.8 0.6 2.4 0.7 2.1 -0.8 -1.3 -0.1 -0.2 -8.0 -10.2 -31.4 -13.1 -25.8 -21.7 -15.8 -4.3 -6.8 -10.3 -9.0 -3.0 -6.6 -4.9 4.3 4.8 -6.2 -13.1 -106.7 -34.4 -20.9 -48.7 -85.8 -32.1 -12.3 -45.6 -73.5 -30.6 -15.1 -14.6 -1.4 -5.7 -9.7 -33.9 -10.5 -3.1 1.7 3.6 -5.8 -7.8 -6.4 -3.0
Note: These not seasonally adjusted estimates were prepared in cooperation with the U.S. Department of Labor, Bureau of Labor Statistics, based upon monthly reports submitted by
selected employers in the Atlanta Metropolitan Statistical Area, which includes Barrow, Bartow, Butts, Carroll, Cherokee, Clayton, Cobb, Coweta, Dawson, DeKalb, Douglas, Fayette, Forsyth, Fulton, Gwinnett, Haralson, Heard, Henry, Jasper, Lamar, Meriwether, Morgan, Newton, Paulding, Pickens, Pike, Rockdale, Spalding and Walton counties. The estimates include all full- and part-time wage and salary workers who were employed during or received pay for any part of the pay period that includes the twelfth of the month. Proprietors, domestic workers, self-employed persons, unpaid family workers and personnel of the armed forces are excluded. Estimates based on 2019 benchmark.
Source: Georgia Department of Labor, Workforce Statistics & Economic Research
5
AUGusta-Richmond county MSA Nonfarm Employment
(In thousands)
(Not Seasonally Adjusted)
Preliminary
Revised
Revised
MAY 2020 APR 2020 MAY 2019
Change in Jobs from APR 2020
Net %
Change in Jobs from MAY 2019
Net %
Total Nonfarm Total Private Goods Producing Service-Providing Private Service-Providing Mining, Logging and Construction Manufacturing Trade, Transportation, and Utilities
Wholesale Trade Retail Trade Transportation, Warehousing, and Utilities Information Financial Activities Professional and Business Services Education and Health Services Leisure and Hospitality Other Services Government Federal Government State Government Local Government
226.7 180.7
44.5 182.2 136.2
21.6 22.9 38.0
5.6 24.9
7.5 2.1 6.3 29.7 32.9 19.8 7.4 46.0 10.0 15.8 20.2
222.2 175.3
43.1 179.1 132.2
20.4 22.7 37.6
5.6 24.5
7.5 2.2 6.3 29.9 31.4 18.0 6.8 46.9 10.0 16.0 20.9
243.4 196.9
42.1 201.3 154.8
19.2 22.9 40.1
5.8 26.5
7.8 2.4 6.6 33.5 35.3 28.4 8.5 46.5 9.8 15.3 21.4
4.5 2.0 5.4 3.1 1.4 3.3 3.1 1.7 4.0 3.0 1.2 5.9 0.2 0.9 0.4 1.1 0.0 0.0 0.4 1.6 0.0 0.0 -0.1 -4.6 0.0 0.0 -0.2 -0.7 1.5 4.8 1.8 10.0 0.6 8.8 -0.9 -1.9 0.0 0.0 -0.2 -1.3 -0.7 -3.4
-16.7 -16.2
2.4 -19.1 -18.6
2.4 0.0 -2.1 -0.2 -1.6 -0.3 -0.3 -0.3 -3.8 -2.4 -8.6 -1.1 -0.5 0.2 0.5 -1.2
-6.9 -8.2 5.7 -9.5 -12.0 12.5 0.0 -5.2 -3.5 -6.0 -3.9 -12.5 -4.6 -11.3 -6.8 -30.3 -12.9 -1.1 2.0 3.3 -5.6
Note: These not seasonally adjusted estimates were prepared in cooperation with the U.S. Department of Labor, Bureau of Labor Statistics, based upon monthly reports submitted by
selected employers in the Augusta-Richmond County Metropolitan Statistical Area, which includes Burke, Columbia, Lincoln, McDuffie and Richmond counties in Georgia and Aiken and Edgefield counties in South Carolina. The estimates include all full- and part-time wage and salary workers who were employed during or received pay for any part of the pay period that includes the twelfth of the month. Proprietors, domestic workers, self-employed persons, unpaid family workers and personnel of the armed forces are excluded. Estimates based on 2019 benchmark.
Brunswick MSA Nonfarm Employment
(In thousands)
(Not Seasonally Adjusted)
Preliminary
Revised
Revised
MAY 2020 APR 2020 MAY 2019
Change in Jobs from APR 2020
Net %
Change in Jobs from MAY 2019
Net %
Total Nonfarm Total Private Goods Producing Service-Providing Private Service-Providing Trade, Transportation, and Utilities
Retail Trade Government
Federal Government State Government Local Government
36.4
35.1
45.2
1.3 3.7
28.1
26.4
36.3
1.7 6.4
3.8
3.7
4.1
0.1 2.7
32.6
31.4
41.1
1.2 3.8
24.3
22.7
32.2
1.6 7.1
8.8
8.8
9.3
0.0 0.0
5.1
5.2
5.6
-0.1 -1.9
8.3
8.7
8.9
-0.4 -4.6
2.0
2.0
2.0
0.0 0.0
1.5
1.7
1.8
-0.2 -11.8
4.8
5.0
5.1
-0.2 -4.0
-8.8 -19.5 -8.2 -22.6 -0.3 -7.3 -8.5 -20.7 -7.9 -24.5 -0.5 -5.4 -0.5 -8.9 -0.6 -6.7 0.0 0.0 -0.3 -16.7 -0.3 -5.9
Note: These not seasonally adjusted estimates were prepared in cooperation with the U.S. Department of Labor, Bureau of Labor Statistics, based upon monthly reports submitted by
selected employers in the Brunswick Metropolitan Statistical Area, which includes Brantley, Glynn and McIntosh counties. The estimates include all full- and part-time wage and salary workers who were employed during or received pay for any part of the pay period that includes the twelfth of the month. Proprietors, domestic workers, self-employed persons, unpaid family workers and personnel of the armed forces are excluded. Estimates based on 2019 benchmark.
Source: Georgia Department of Labor, Workforce Statistics & Economic Research
6
Columbus MSA Nonfarm Employment
(In thousands)
(Not Seasonally Adjusted)
Preliminary
Revised
Revised
MAY 2020 APR 2020 MAY 2019
Change in Jobs from APR 2020
Net %
Change in Jobs from MAY 2019
Net %
Total Nonfarm Total Private Goods Producing Service-Providing Private Service-Providing Mining, Logging and Construction Manufacturing Trade, Transportation, and Utilities
Wholesale Trade Retail Trade Transportation, Warehousing, and Utilities Information Financial Activities Finance and Insurance
Insurance Carriers and Related Activities Professional and Business Services Education and Health Services Leisure and Hospitality Other Services Government
Federal Government State Government Local Government
110.7 88.8 14.7 96.0 74.1
4.6 10.1 17.1
2.5 11.9 2.7 1.2 12.7 11.0 3.9 12.9 15.4 11.1 3.7 21.9 6.4 3.4 12.1
109.2 86.3 14.6 94.6 71.7 4.6 10.0 17.3 2.5 12.1 2.7 1.3 12.3 10.7 3.9 13.0 14.9 9.4 3.5 22.9 6.4 4.2 12.3
123.5 98.9 15.7
107.8 83.2 4.8 10.9 18.0 2.6 12.6 2.8 1.3 12.9 10.9 3.9 15.1 16.2 15.3 4.4 24.6 6.7 4.5 13.4
1.5 1.4 2.5 2.9 0.1 0.7 1.4 1.5 2.4 3.4 0.0 0.0 0.1 1.0 -0.2 -1.2 0.0 0.0 -0.2 -1.7 0.0 0.0 -0.1 -7.7 0.4 3.3 0.3 2.8 0.0 0.0 -0.1 -0.8 0.5 3.4 1.7 18.1 0.2 5.7 -1.0 -4.4 0.0 0.0 -0.8 -19.1 -0.2 -1.6
-12.8 -10.1
-1.0 -11.8 -9.1 -0.2 -0.8 -0.9 -0.1 -0.7 -0.1 -0.1 -0.2
0.1 0.0 -2.2 -0.8 -4.2 -0.7 -2.7 -0.3 -1.1 -1.3
-10.4 -10.2
-6.4 -11.0 -10.9 -4.2 -7.3 -5.0 -3.9 -5.6 -3.6 -7.7 -1.6
0.9 0.0 -14.6 -4.9 -27.5 -15.9 -11.0 -4.5 -24.4 -9.7
Note: These not seasonally adjusted estimates were prepared in cooperation with the U.S. Department of Labor, Bureau of Labor Statistics, based upon monthly reports submitted by
selected employers in the Columbus Metropolitan Statistical Area, which includes Chattahoochee, Harris, Marion and Muscogee counties in Georgia and Russell County in Alabama. The estimates include all full- and part-time wage and salary workers who were employed during or received pay for any part of the pay period that includes the twelfth of the month. Proprietors, domestic workers, self-employed persons, unpaid family workers and personnel of the armed forces are excluded. Estimates based on 2019 benchmark.
Dalton MSA Nonfarm Employment
(In thousands)
(Not Seasonally Adjusted)
Preliminary
Revised
Revised
MAY 2020 APR 2020 MAY 2019
Change in Jobs from APR 2020
Net %
Change in Jobs from MAY 2019
Net %
Total Nonfarm Total Private Goods Producing Service-Providing Private Service-Providing Manufacturing
Textile Mills Textile Product Mills Trade, Transportation, and Utilities Retail Trade Transportation, Warehousing, and Utilities Professional and Business Services Government Federal Government State Government Local Government
62.8
58.9
66.5
55.9
52.1
59.4
23.9
21.4
25.6
38.9
37.5
40.9
32.0
30.7
33.8
22.0
20.6
24.1
3.2
3.1
4.1
13.1
11.7
14.2
12.9
12.8
13.3
5.7
5.5
6.0
3.0
3.0
3.2
6.1
6.0
6.5
6.9
6.8
7.1
0.3
0.2
0.3
1.1
1.1
1.1
5.5
5.5
5.7
3.9 6.6 3.8 7.3 2.5 11.7 1.4 3.7 1.3 4.2 1.4 6.8 0.1 3.2 1.4 12.0 0.1 0.8 0.2 3.6 0.0 0.0 0.1 1.7 0.1 1.5 0.1 50.0 0.0 0.0 0.0 0.0
-3.7 -5.6 -3.5 -5.9 -1.7 -6.6 -2.0 -4.9 -1.8 -5.3 -2.1 -8.7 -0.9 -22.0 -1.1 -7.8 -0.4 -3.0 -0.3 -5.0 -0.2 -6.3 -0.4 -6.2 -0.2 -2.8 0.0 0.0 0.0 0.0 -0.2 -3.5
Note: These not seasonally adjusted estimates were prepared in cooperation with the U.S. Department of Labor, Bureau of Labor Statistics, based upon monthly reports submitted by
selected employers in the Dalton Metropolitan Statistical Area, which includes Murray and Whitfield counties. The estimates include all full- and part-time wage and salary workers who were employed during or received pay for any part of the pay period that includes the twelfth of the month. Proprietors, domestic workers, self-employed persons, unpaid family workers and personnel of the armed forces are excluded. Estimates based on 2019 benchmark.
Source: Georgia Department of Labor, Workforce Statistics & Economic Research
7
Gainesville MSA Nonfarm Employment
(In thousands)
(Not Seasonally Adjusted)
Preliminary
Revised
Revised
MAY 2020 APR 2020 MAY 2019
Change in Jobs from APR 2020
Net %
Change in Jobs from MAY 2019
Net %
Total Nonfarm Total Private Goods Producing
85.8
85.4
93.3
75.8
74.7
82.3
24.2
24.2
25.4
0.4 0.5 1.1 1.5 0.0 0.0
-7.5 -8.0 -6.5 -7.9 -1.2 -4.7
Service-Providing Private Service-Providing
61.6
61.2
67.9
51.6
50.5
56.9
0.4 0.7 1.1 2.2
-6.3 -9.3 -5.3 -9.3
Trade, Transportation, and Utilities
16.2
16.6
17.2
-0.4 -2.4
-1.0 -5.8
Retail Trade Government
8.6
8.8
9.0
-0.2 -2.3
10.0
10.7
11.0
-0.7 -6.5
-0.4 -4.4 -1.0 -9.1
Federal Government
0.5
0.5
0.5
0.0 0.0
0.0 0.0
State Government Local Government
2.6
2.7
2.8
-0.1 -3.7
6.9
7.5
7.7
-0.6 -8.0
-0.2 -7.1 -0.8 -10.4
Note: These not seasonally adjusted estimates were prepared in cooperation with the U.S. Department of Labor, Bureau of Labor Statistics, based upon monthly reports submitted by
selected employers in the Gainesville Metropolitan Statistical Area, which comprises Hall county. The estimates include all full- and part-time wage and salary workers who were employed during or received pay for any part of the pay period that includes the twelfth of the month. Proprietors, domestic workers, self-employed persons, unpaid family workers and personnel of the armed forces are excluded. Estimates based on 2019 benchmark.
Hinesville MSA Nonfarm Employment
(In thousands)
(Not Seasonally Adjusted)
Preliminary Revised Revised MAY 2020 APR 2020 MAY 2019
Change in Jobs from APR 2020
Net %
Change in Jobs from MAY 2019
Net %
Total Nonfarm Total Private Goods Producing Service-Providing Private Service-Providing Government
Federal Government State Government Local Government
20.6
20.1
21.3
12.7
12.2
13.4
2.7
2.6
2.8
17.9
17.5
18.5
10.0
9.6
10.6
7.9
7.9
7.9
3.9
3.9
3.8
0.4
0.4
0.4
3.6
3.6
3.7
0.5 2.5 0.5 4.1 0.1 3.9 0.4 2.3 0.4 4.2 0.0 0.0 0.0 0.0 0.0 0.0 0.0 0.0
-0.7 -3.3 -0.7 -5.2 -0.1 -3.6 -0.6 -3.2 -0.6 -5.7 0.0 0.0 0.1 2.6 0.0 0.0 -0.1 -2.7
Note: These not seasonally adjusted estimates were prepared in cooperation with the U.S. Department of Labor, Bureau of Labor Statistics, based upon monthly reports submitted by
selected employers in the Hinesville Metropolitan Statistical Area, which includes Liberty and Long counties. The estimates include all full- and part-time wage and salary workers who were employed during or received pay for any part of the pay period that includes the twelfth of the month. Proprietors, domestic workers, self-employed persons, unpaid family workers and personnel of the armed forces are excluded. Estimates based on 2019 benchmark.
Source: Georgia Department of Labor, Workforce Statistics & Economic Research
8
Macon-BIBB County MSA Nonfarm Employment
(In thousands)
(Not Seasonally Adjusted)
Preliminary
Revised
Revised
MAY 2020 APR 2020 MAY 2019
Change in Jobs from APR 2020
Net %
Change in Jobs from MAY 2019
Net %
Total Nonfarm Total Private Goods Producing Service-Providing Private Service-Providing Trade, Transportation, and Utilities
Retail Trade Transportation, Warehousing, and Utilities Financial Activities Professional and Business Services Education and Health Services Leisure and Hospitality Government Federal Government State Government Local Government
94.6
93.7
103.1
0.9 1.0
81.2
80.1
88.6
1.1 1.4
9.9
9.9
10.3
0.0 0.0
84.7
83.8
92.8
0.9 1.1
71.3
70.2
78.3
1.1 1.6
19.3
19.4
20.0
-0.1 -0.5
11.2
11.1
11.5
0.1 0.9
5.5
5.5
5.7
0.0 0.0
9.5
9.3
9.7
0.2 2.2
11.2
10.8
12.0
0.4 3.7
20.3
20.1
21.7
0.2 1.0
7.7
6.5
10.6
1.2 18.5
13.4
13.6
14.5
-0.2 -1.5
1.1
1.1
1.1
0.0 0.0
3.9
4.1
4.0
-0.2 -4.9
8.4
8.4
9.4
0.0 0.0
-8.5 -8.2 -7.4 -8.4 -0.4 -3.9 -8.1 -8.7 -7.0 -8.9 -0.7 -3.5 -0.3 -2.6 -0.2 -3.5 -0.2 -2.1 -0.8 -6.7 -1.4 -6.5 -2.9 -27.4 -1.1 -7.6 0.0 0.0 -0.1 -2.5 -1.0 -10.6
Note: These not seasonally adjusted estimates were prepared in cooperation with the U.S. Department of Labor, Bureau of Labor Statistics, based upon monthly reports submitted by
selected employers in the Macon-Bibb County Metropolitan Statistical Area, which includes Bibb, Crawford, Jones, Monroe and Twiggs counties. The estimates include all full- and part-time wage and salary workers who were employed during or received pay for any part of the pay period that includes the twelfth of the month. Proprietors, domestic workers, self-employed persons, unpaid family workers and personnel of the armed forces are excluded. Estimates based on 2019 benchmark.
Rome MSA Nonfarm Employment
(In thousands)
(Not Seasonally Adjusted)
Preliminary
Revised
Revised
MAY 2020 APR 2020 MAY 2019
Change in Jobs from APR 2020
Net %
Change in Jobs from MAY 2019
Net %
Total Nonfarm Total Private Goods Producing Service-Providing Private Service-Providing Manufacturing Trade, Transportation, and Utilities
Retail Trade Education and Health Services Government
Federal Government State Government Local Government
41.2
39.6
41.8
1.6 4.0
35.7
34.0
36.1
1.7 5.0
7.3
7.0
7.3
0.3 4.3
33.9
32.6
34.5
1.3 4.0
28.4
27.0
28.8
1.4 5.2
5.7
5.5
6.2
0.2 3.6
7.8
7.7
7.7
0.1 1.3
4.3
4.2
4.4
0.1 2.4
10.2
10.1
10.6
0.1 1.0
5.5
5.6
5.7
-0.1 -1.8
0.2
0.2
0.2
0.0 0.0
1.5
1.5
1.6
0.0 0.0
3.8
3.9
3.9
-0.1 -2.6
-0.6 -1.4 -0.4 -1.1 0.0 0.0 -0.6 -1.7 -0.4 -1.4 -0.5 -8.1 0.1 1.3 -0.1 -2.3 -0.4 -3.8 -0.2 -3.5 0.0 0.0 -0.1 -6.3 -0.1 -2.6
Note: These not seasonally adjusted estimates were prepared in cooperation with the U.S. Department of Labor, Bureau of Labor Statistics, based upon monthly reports submitted by
selected employers in the Rome Metropolitan Statistical Area, which comprises Floyd county. The estimates include all full- and part-time wage and salary workers who were employed during or received pay for any part of the pay period that includes the twelfth of the month. Proprietors, domestic workers, self-employed persons, unpaid family workers and personnel of the armed forces are excluded. Estimates based on 2019 benchmark.
Source: Georgia Department of Labor, Workforce Statistics & Economic Research
9
Savannah MSA Nonfarm Employment
(In thousands)
(Not Seasonally Adjusted)
Preliminary Revised
Revised
MAY 2020 APR 2020 MAY 2019
Change in Jobs from APR 2020
Net %
Change in Jobs from MAY 2019
Net %
Total Nonfarm Total Private Goods Producing Service-Providing Private Service-Providing Mining, Logging and Construction Manufacturing Trade, Transportation, and Utilities
Wholesale Trade Retail Trade Transportation, Warehousing, and Utilities Information Financial Activities Professional and Business Services Education and Health Services Leisure and Hospitality Other Services Government Federal Government State Government Local Government
167.5 144.6
26.6 140.9 118.0
8.3 18.3 40.8
6.4 19.8 14.6
2.2 6.1 19.7 25.0 17.5 6.7 22.9 2.9 5.2 14.8
160.2 136.7
25.7 134.5 111.0
7.8 17.9 39.2
6.3 19.1 13.8
2.2 6.0 18.8 24.8 14.0 6.0 23.5 2.9 5.5 15.1
187.9 163.2
27.1 160.8 136.1
8.3 18.8 43.3
6.6 22.0 14.7
2.4 6.4 22.1 26.3 27.9 7.7 24.7 2.9 5.7 16.1
7.3 4.6 7.9 5.8 0.9 3.5 6.4 4.8 7.0 6.3 0.5 6.4 0.4 2.2 1.6 4.1 0.1 1.6 0.7 3.7 0.8 5.8 0.0 0.0 0.1 1.7 0.9 4.8 0.2 0.8 3.5 25.0 0.7 11.7 -0.6 -2.6 0.0 0.0 -0.3 -5.5 -0.3 -2.0
-20.4 -18.6
-0.5 -19.9 -18.1
0.0 -0.5 -2.5 -0.2 -2.2 -0.1 -0.2 -0.3 -2.4 -1.3 -10.4 -1.0 -1.8 0.0 -0.5 -1.3
-10.9 -11.4 -1.9 -12.4 -13.3
0.0 -2.7 -5.8 -3.0 -10.0 -0.7 -8.3 -4.7 -10.9 -4.9 -37.3 -13.0 -7.3 0.0 -8.8 -8.1
Note: These not seasonally adjusted estimates were prepared in cooperation with the U.S. Department of Labor, Bureau of Labor Statistics, based upon monthly reports submitted by
selected employers in the Savannah Metropolitan Statistical Area, which includes Bryan, Chatham and Effingham counties. The estimates include all full- and part-time wage and salary workers who were employed during or received pay for any part of the pay period that includes the twelfth of the month. Proprietors, domestic workers, self-employed persons, unpaid family workers and personnel of the armed forces are excluded. Estimates based on 2019 benchmark.
Valdosta MSA Nonfarm Employment
(In thousands)
(Not Seasonally Adjusted)
Preliminary Revised
Revised
MAY 2020 APR 2020 MAY 2019
Change in Jobs from APR 2020
Net %
Change in Jobs from MAY 2019
Net %
Total Nonfarm Total Private Goods Producing Service-Providing Private Service-Providing Trade, Transportation, and Utilities
Retail Trade Government
Federal Government State Government Local Government
53.4
52.1
56.4
1.3 2.5
41.1
39.7
43.2
1.4 3.5
7.7
7.3
7.4
0.4 5.5
45.7
44.8
49.0
0.9 2.0
33.4
32.4
35.8
1.0 3.1
12.5
12.5
12.7
0.0 0.0
6.9
6.9
7.0
0.0 0.0
12.3
12.4
13.2
-0.1 -0.8
1.1
1.1
1.2
0.0 0.0
3.2
3.3
3.7
-0.1 -3.0
8.0
8.0
8.3
0.0 0.0
-3.0 -5.3 -2.1 -4.9 0.3 4.1 -3.3 -6.7 -2.4 -6.7 -0.2 -1.6 -0.1 -1.4 -0.9 -6.8 -0.1 -8.3 -0.5 -13.5 -0.3 -3.6
Note: These not seasonally adjusted estimates were prepared in cooperation with the U.S. Department of Labor, Bureau of Labor Statistics, based upon monthly reports submitted by
selected employers in the Valdosta Metropolitan Statistical Area, which includes Brooks, Echols, Lanier and Lowndes counties. The estimates include all full- and part-time wage and salary workers who were employed during or received pay for any part of the pay period that includes the twelfth of the month. Proprietors, domestic workers, self-employed persons, unpaid family workers and personnel of the armed forces are excluded. Estimates based on 2019 benchmark.
Source: Georgia Department of Labor, Workforce Statistics & Economic Research
10
Warner Robins MSA Nonfarm Employment
(In thousands)
(Not Seasonally Adjusted)
Preliminary
Revised
Revised
MAY 2020 APR 2020 MAY 2019
Change in Jobs from APR 2020
Net %
Change in Jobs from MAY 2019
Net %
Total Nonfarm Total Private Goods Producing Service-Providing Private Service-Providing Trade, Transportation, and Utilities
Retail Trade Government
Federal Government State Government Local Government
71.4
69.3
77.8
2.1 3.0
43.9
41.4
49.8
2.5 6.0
10.1
10.0
10.4
0.1 1.0
61.3
59.3
67.4
2.0 3.4
33.8
31.4
39.4
2.4 7.6
11.3
11.0
11.2
0.3 2.7
8.7
8.5
8.6
0.2 2.4
27.5
27.9
28.0
-0.4 -1.4
16.1
16.0
15.7
0.1 0.6
1.9
2.2
2.3
-0.3 -13.6
9.5
9.7
10.0
-0.2 -2.1
-6.4 -8.2 -5.9 -11.9 -0.3 -2.9 -6.1 -9.1 -5.6 -14.2 0.1 0.9 0.1 1.2 -0.5 -1.8 0.4 2.6 -0.4 -17.4 -0.5 -5.0
Note: These not seasonally adjusted estimates were prepared in cooperation with the U.S. Department of Labor, Bureau of Labor Statistics, based upon monthly reports submitted by
selected employers in the Warner Robins Metropolitan Statistical Area, which includes Houston, Peach and Pulaski counties. The estimates include all full- and part-time wage and salary workers who were employed during or received pay for any part of the pay period that includes the twelfth of the month. Proprietors, domestic workers, self-employed persons, unpaid family workers and personnel of the armed forces are excluded. Estimates based on 2019 benchmark.
Total Nonfarm Employment by Metro Statistical Area
(In thousands)
(Seasonally Adjusted)
Preliminary
Revised
Revised
MAY 2020 APR 2020 MAY 2019
Change in Jobs from APR 2019
Net %
Change in Jobs from MAY 2019
Net %
Albany MSA
57.7
57.1
62.9
0.6 1.1
-5.2 -8.3
Athens-Clarke County MSA
91.2
87.8
97.0
3.4 3.9
-5.8 -6.0
Atlanta MSA
2,580.6
2,551.6
2,840.8
29.0 1.1
-260.2 -9.2
Augusta-Richmond County MSA
227.0
218.4
242.6
8.6 3.9
-15.6 -6.4
Brunswick MSA
35.9
34.9
44.7
1.0 2.9
-8.8 -19.7
Columbus MSA
110.3
109.2
123.0
1.1 1.0
-12.7 -10.3
Dalton MSA
62.4
58.8
66.4
3.6 6.1
-4.0 -6.0
Gainesville MSA
85.4
85.4
93.7
0.0 0.0
-8.3 -8.9
Hinesville MSA
20.5
20.0
21.2
0.5 2.5
-0.7 -3.3
Macon-Bibb County MSA
94.4
94.0
103.0
0.4 0.4
-8.6 -8.3
Rome MSA
41.1
39.5
41.8
1.6 4.1
-0.7 -1.7
Savannah MSA
166.5
159.6
186.9
6.9 4.3
-20.4 -10.9
Valdosta MSA
53.2
51.8
56.4
1.4 2.7
-3.2 -5.7
Warner Robins MSA
70.9
68.9
77.3
2.0 2.9
-6.4 -8.3
Note: These seasonally adjusted estimates were prepared in cooperation with the U.S. Department of Labor, Bureau of Labor Statistics, based upon monthly reports submitted by selected
employers throughout Georgia. The estimates include all full- and part-time wage and salary workers who were employed during or received pay for any part of the pay period that includes the twelfth of the month. Proprietors, domestic workers, self-employed persons, unpaid family workers and personnel of the armed forces are excluded. Estimates based on 2019 benchmark.
Source: Georgia Department of Labor, Workforce Statistics & Economic Research
11
Georgia Statewide Hours and Earnings
All Employee
Average Weekly Earnings (AWE)
Preliminary MAY 2020
Revised APR 2020
Revised MAY 2019
Total Private.................................................................................................... $938.43............................ $945.96.......................$912.40 Goods Producing.......................................................................................$1,082.30.......................... $1,051.86....................$1,059.63 Private Service Providing..............................................................................$910.76.............................$925.74....................... $886.11 Construction............................................................................................ $1,122.85...........................$1,077.12.....................$1,115.30 Manufacturing.........................................................................................$1,048.33..........................$1,036.81.................... $1,010.21 Trade, Transportation, and Utilities............................................................ $817.67............................ $822.50.......................$792.24 Financial Activities..................................................................................$1,322.84.......................... $1,301.10.................... $1,249.61 Professional and Business Services...................................................... $1,184.44...........................$1,197.77..................... $1,137.72 Educational and Health Services.............................................................. $996.32.............................$987.35.................... $1,013.91 Leisure and Hospitality............................................................................... $372.15............................ $342.96....................... $374.01 Other Services...........................................................................................$851.58............................ $833.46.......................$733.79
Average Weekly Hours (AWH)
Preliminary MAY 2020
Revised APR 2020
Revised MAY 2019
Total Private...........................................................................................................34.4...................................33.7.............................34.6 Goods Producing................................................................................................ 40.1.................................. 38.9............................. 41.8 Private Service Providing....................................................................................33.3...................................32.7.............................33.3 Construction..................................................................................................... 41.1...................................39.6............................. 41.6 Manufacturing..................................................................................................39.5.................................. 38.5............................. 41.9 Trade, Transportation, and Utilities..................................................................33.9...................................32.9.............................33.9 Financial Activities........................................................................................... 37.4................................... 37.1.............................36.4 Professional and Business Services...............................................................36.1.................................. 35.5.............................35.3 Educational and Health Services.....................................................................33.4...................................32.5.............................34.3 Leisure and Hospitality.....................................................................................26.3...................................24.0............................. 27.3 Other Services.................................................................................................34.2...................................33.1.............................30.6
Average Hourly Earnings (AHE)
Preliminary MAY 2020
Revised APR 2020
Revised MAY 2019
Total Private.......................................................................................................$27.28...............................$28.07.........................$26.37 Goods Producing........................................................................................... $26.99...............................$27.04.........................$25.35 Private Service Providing................................................................................$27.35...............................$28.31.........................$26.61 Construction................................................................................................. $27.32...............................$27.20.........................$26.81 Manufacturing............................................................................................. $26.54.............................. $26.93......................... $24.11 Trade, Transportation, and Utilities.............................................................. $24.12.............................. $25.00.........................$23.37 Financial Activities.......................................................................................$35.37.............................. $35.07.........................$34.33 Professional and Business Services...........................................................$32.81...............................$33.74.........................$32.23 Educational and Health Services.................................................................$29.83.............................. $30.38.........................$29.56 Leisure and Hospitality................................................................................. $14.15...............................$14.29......................... $13.70 Other Services.............................................................................................$24.90............................... $25.18.........................$23.98
Read more about the hours and earnings series at http://www.bls.gov/sae/home.htm
Note: These not seasonally adjusted estimates were prepared in cooperation with the U.S. Department of Labor, Bureau of Labor Statistics, based upon monthly reports submitted by
selected employers throughout Georgia. The estimates include all full- and part-time wage and salary workers who were employed during or received pay for any part of the pay period that includes the twelfth of the month. Proprietors, domestic workers, self-employed persons, unpaid family workers and personnel of the armed forces are excluded. Estimates based on 2019 benchmark.
Source: Georgia Department of Labor, Workforce Statistics & Economic Research
12
Georgia MSA Hours and Earnings
All Employee Total Private
Average Weekly Earnings (AWE)
Preliminary MAY 2020
Revised APR 2020
Revised MAY 2019
Albany MSA .................................................................................................... $707.30............................ $735.66.......................$750.05 Athens-Clarke County MSA .......................................................................... $800.87.............................$813.42.......................$775.22 Atlanta MSA ...............................................................................................$1,050.02..........................$1,053.32...................... $999.25 Augusta-Richmond County MSA .................................................................. $898.03.............................$915.73.......................$839.00 Brunswick MSA ............................................................................................. $711.83............................ $653.31....................... $637.93 Columbus MSA .............................................................................................. $819.41............................ $832.92...................... $809.55 Dalton MSA .................................................................................................. $603.29............................ $643.50....................... $727.43 Gainesville MSA ...........................................................................................$1,067.18..........................$1,063.47...................... $984.53 Hinesville MSA ............................................................................................... $657.73.............................$661.38........................$757.10 Macon-Bibb County MSA ............................................................................. $858.82............................ $885.68.......................$898.42 Rome MSA .................................................................................................... $798.86.............................$791.89....................... $727.97 Savannah MSA ..............................................................................................$738.02............................. $726.16....................... $747.25 Valdosta MSA ................................................................................................. $916.11............................ $736.89...................... $805.68 Warner Robins MSA .......................................................................................$801.79............................ $843.29....................... $798.17
Average Weekly Hours (AWH)
Preliminary MAY 2020
Revised APR 2020
Revised MAY 2019
Albany MSA ..........................................................................................................32.7.................................. 33.5.............................35.0 Athens-Clarke County MSA .................................................................................33.3................................... 31.7............................. 31.5 Atlanta MSA ........................................................................................................34.7...................................34.0.............................34.6 Augusta-Richmond County MSA .........................................................................35.3...................................34.7.............................34.9 Brunswick MSA ...................................................................................................35.1...................................31.9.............................32.3 Columbus MSA ....................................................................................................33.5...................................33.0.............................34.7 Dalton MSA .........................................................................................................32.4...................................32.5.............................34.2 Gainesville MSA ...................................................................................................38.1................................... 37.9.............................38.7 Hinesville MSA ..................................................................................................... 32.1.................................. 29.2.............................33.5 Macon-Bibb County MSA ....................................................................................36.1.................................. 35.3.............................36.7 Rome MSA ...........................................................................................................34.9.................................. 34.4............................. 35.1 Savannah MSA ....................................................................................................32.2...................................31.3.............................33.3 Valdosta MSA .......................................................................................................35.1...................................31.9............................. 37.3 Warner Robins MSA .............................................................................................34.8...................................35.9.............................38.3
Average Hourly Earnings (AHE)
Preliminary MAY 2020
Revised APR 2020
Revised MAY 2019
Albany MSA ..........................................................................................................32.7.................................. 33.5.............................35.0 Athens-Clarke County MSA .................................................................................33.3................................... 31.7............................. 31.5 Atlanta MSA ........................................................................................................34.7...................................34.0.............................34.6 Augusta-Richmond County MSA .........................................................................35.3...................................34.7.............................34.9 Brunswick MSA ...................................................................................................35.1...................................31.9.............................32.3 Columbus MSA ....................................................................................................33.5...................................33.0.............................34.7 Dalton MSA .........................................................................................................32.4...................................32.5.............................34.2 Gainesville MSA ...................................................................................................38.1................................... 37.9.............................38.7 Hinesville MSA ..................................................................................................... 32.1.................................. 29.2.............................33.5 Macon-Bibb County MSA ....................................................................................36.1.................................. 35.3.............................36.7 Rome MSA ...........................................................................................................34.9.................................. 34.4............................. 35.1 Savannah MSA ....................................................................................................32.2...................................31.3.............................33.3 Valdosta MSA .......................................................................................................35.1...................................31.9............................. 37.3 Warner Robins MSA .............................................................................................34.8...................................35.9.............................38.3
Read more about the hours and earnings series at http://www.bls.gov/sae/home.htm
Note: These not seasonally adjusted estimates were prepared in cooperation with the U.S. Department of Labor, Bureau of Labor Statistics, based upon monthly reports submitted by
selected employers throughout Georgia. The estimates include all full- and part-time wage and salary workers who were employed during or received pay for any part of the pay period that includes the twelfth of the month. Proprietors, domestic workers, self-employed persons, unpaid family workers and personnel of the armed forces are excluded. Estimates based on 2019 benchmark.
Source: Georgia Department of Labor, Workforce Statistics & Economic Research
13
Dimensions - Measuring Georgia's Labor Force
Unemployment rates -- Georgia and U.S.
16%
14%
12%
10%
8%
6%
4%
2% May Jun Jul Aug Sep Oct Nov Dec Jan Feb Mar Apr May
Georgia
U.S.
WA 15.1 OR 14.2 NV 25.3 CA 16.3
AK 12.6
ID 8.9
UT 8.5 AZ 8.9
StaStteatuenUenmepmlopylomymenetnrt aRtaetses
May 2020
National Unemployment Rate: 13.3% Rates are seasonally adjusted
MT 9.0
WY 8.8
CO 10.2 NM 9.2
ND 9.1 SD 9.4
NE 5.2
KS 10.0
MN 9.9
WI 12.0
IA 10.0
IL 15.2 MO 10.1
OK 12.6 TX 13.0
AR 9.5
MS 10.6 LA 13.3
MI 21.2
OH
IN
13.7
12.3
KY 11.0 TN 11.3
PA 13.1
WV 12.9 VA
9.4 NC 12.9 SC 12.5
AL
GA
9.9
9.7
FL 14.5
NH
14.5 ME
VT
9.3
12.7
MA 16.3
NY 14.5
RI 16.3
CT
NJ 15.2
9.4
DE
15.8
DC 8.9
MD 9.9
Unemployment rate
18.0% or greater 16.0% to 17.9% 14.0% to 15.9% 12.0% to 13.9% 10.0% to 11.9% Less than 10.0%
HI 22.6 Source: Georgia Department of Labor, Workforce Statistics & Economic Research
14
Georgia Labor Force Estimates
Place of Residence - Persons 16 Years and Older
Georgia
(Seasonally adjusted)
Georgia
(Not Seasonally adjusted)
Albany MSA Athens-Clarke County MSA
Atlanta MSA
Augusta-Richmond County MSA
Brunswick MSA
Columbus MSA
Dalton MSA
Gainesville MSA
Employment Status
Civilian labor force Employed Unemployed Rate
Civilian labor force Employed Unemployed Rate
Civilian labor force Employed Unemployed Rate
Civilian labor force Employed Unemployed Rate
Civilian labor force Employed Unemployed Rate
Civilian labor force Employed Unemployed Rate
Civilian labor force Employed Unemployed Rate
Civilian labor force Employed Unemployed Rate
Civilian labor force Employed Unemployed Rate
Civilian labor force Employed Unemployed Rate
Preliminary MAY 2020
4,900,139 4,424,801
475,338 9.7
4,900,874 4,436,196
464,678 9.5
63,146 57,690 5,456
8.6
95,758 87,899
7,859 8.2
2,944,498 2,642,581
301,917 10.3
261,253 238,324
22,929 8.8
46,341 41,214
5,127 11.1
116,282 105,198
11,084 9.5
58,440 51,924
6,516 11.1
96,628 88,911
7,717 8.0
Revised APR 2020
4,894,396 4,279,924
614,472 12.6
4,880,560 4,286,140
594,420 12.2
62,751 55,724
7,027 11.2
93,859 83,407 10,452
11.1
2,930,563 2,559,533
371,030 12.7
257,725 230,954
26,771 10.4
46,444 38,938
7,506 16.2
115,519 101,392
14,127 12.2
59,930 48,051 11,879
19.8
96,843 86,528 10,315
10.7
Revised MAY 2019
5,086,318 4,905,393
180,925 3.6
5,085,861 4,917,789
168,072 3.3
66,217 63,488
2,729 4.1
98,265 95,197 3,068
3.1
3,071,436 2,973,704
97,732 3.2
267,303 258,007
9,296 3.5
52,943 51,208
1,735 3.3
123,567 118,864
4,703 3.8
58,494 56,262
2,232 3.8
101,369 98,617 2,752 2.7
Change From
APR 2020
MAY 2019
5,743 144,877 -139,134
-186,179 -480,592
294,413
20,314 150,056 -129,742
-184,987 -481,593 296,606
395 1,966 -1,571
-3,071 -5,798 2,727
1,899 4,492 -2,593
-2,507 -7,298 4,791
13,935 83,048 -69,113
-126,938 -331,123 204,185
3,528 7,370 -3,842
-6,050 -19,683 13,633
-103 2,276 -2,379
-6,602 -9,994 3,392
763 3,806 -3,043
-7,285 -13,666
6,381
-1,490 3,873 -5,363
-54 -4,338 4,284
-215 2,383 -2,598
-4,741 -9,706 4,965
Note: MSA data are not seasonally adjusted. Employment includes nonagricultural wage and salary employment, self-employment, unpaid family and private
household workers and agricultural workers. Persons in labor disputes are counted as employed. The use of unrounded data does not imply that the numbers are exact.
Albany MSA: Baker, Dougherty, Lee, Terrell, and Worth counties. Athens-Clarke County MSA: Clarke, Madison, Oconee, and Oglethorpe counties. Atlanta MSA: Barrow, Bartow, Butts, Carroll, Cherokee, Clayton, Cobb, Coweta, Dawson, DeKalb, Douglas, Fayette, Forsyth, Fulton, Gwinnett, Haralson, Heard, Henry, Jasper, Lamar, Meriwether, Morgan, Newton, Paulding, Pickens, Pike, Rockdale, Spalding, and Walton counties. Augusta-Richmond County MSA: Burke, Columbia, Lincoln, McDuffie, and Richmond counties in Georgia and Aiken and Edgefield counties in South Carolina. Brunswick MSA: Brantley, Glynn, and McIntosh counties. Columbus MSA: Chattahoochee, Harris, Marion, and Muscogee counties in Georgia and Russell County in Alabama. Dalton MSA: Murray and Whitfield counties. Gainesville MSA: Hall County. Hinesville MSA: Liberty and Long counties. Macon-Bibb County MSA: Bibb, Crawford, Jones, Monroe, and Twiggs counties. Rome MSA: Floyd County. Savannah MSA: Bryan, Chatham, and Effingham counties. Valdosta MSA: Brooks, Echols, Lanier, and Lowndes counties. Warner Robins MSA: Houston, Peach and Pulaski counties.
Source: Georgia Department of Labor, Workforce Statistics & Economic Research
15
Hinesville MSA
Macon-Bibb County MSA Rome MSA Savannah MSA
Valdosta MSA Warner Robins MSA
Georgia Labor Force Estimates
Place of Residence - Persons 16 Years and Older
Employment Status
Civilian labor force Employed Unemployed Rate
Civilian labor force Employed Unemployed Rate
Preliminary MAY 2020
32,979 30,517 2,462
7.5
97,463 88,804
8,659 8.9
Revised APR 2020
32,453 29,220
3,233 10.0
97,012 86,322 10,690
11.0
Revised MAY 2019
34,233 32,939
1,294 3.8
102,569 98,816 3,753 3.7
Civilian labor force Employed Unemployed Rate
Civilian labor force Employed Unemployed Rate
44,666 40,589
4,077 9.1
180,031 159,999
20,032 11.1
44,151 38,302
5,849 13.2
178,075 150,752
27,323 15.3
43,562 42,044
1,518 3.5
188,911 183,132
5,779 3.1
Civilian labor force Employed Unemployed Rate
Civilian labor force Employed Unemployed Rate
61,702 56,926
4,776 7.7
80,754 75,022
5,732 7.1
60,524 54,577
5,947 9.8
79,739 71,698
8,041 10.1
63,416 61,365
2,051 3.2
86,152 83,276
2,876 3.3
Change From
APR 2020
MAY 2019
526 1,297
-771
-1,254 -2,422 1,168
451 2,482 -2,031
-5,106 -10,012
4,906
515 2,287 -1,772
1,104 -1,455 2,559
1,956 9,247 -7,291
-8,880 -23,133 14,253
1,178 2,349 -1,171
-1,714 -4,439 2,725
1,015 3,324 -2,309
-5,398 -8,254 2,856
Area United States
(Seasonally adjusted)
United States
(Not Seasonally adjusted)
United States Labor Force Estimates
Place of Residence - Persons 16 Years and Older
Employment Status
Civilian labor force Employed Unemployed Rate
Civilian labor force Employed Unemployed Rate
MAY 2020
158,227,000 137,242,000 20,985,000
13.3
157,975,000 137,461,000 20,514,000
13.0
APR 2020
156,481,000 133,403,000
23,078,000 14.7
155,830,000 133,326,000 22,504,000
14.4
MAY 2019
162,782,000 156,844,000
5,938,000 3.6
162,655,000 157,152,000
5,503,000 3.4
Change From
APR 2020
MAY 2019
1,746,000 3,839,000 -2,093,000
-4,555,000 -19,602,000 15,047,000
2,145,000 4,135,000 -1,990,000
-4,680,000 -19,691,000 15,011,000
Note: MSA data are not seasonally adjusted. Employment includes nonagricultural wage and salary employment, self-employment, unpaid family and private
household workers and agricultural workers. Persons in labor disputes are counted as employed. The use of unrounded data does not imply that the numbers are exact.
Albany MSA: Baker, Dougherty, Lee, Terrell, and Worth counties. Athens-Clarke County MSA: Clarke, Madison, Oconee, and Oglethorpe counties. Atlanta MSA: Barrow, Bartow, Butts, Carroll, Cherokee, Clayton, Cobb, Coweta, Dawson, DeKalb, Douglas, Fayette, Forsyth, Fulton, Gwinnett, Haralson, Heard, Henry, Jasper, Lamar, Meriwether, Morgan, Newton, Paulding, Pickens, Pike, Rockdale, Spalding, and Walton counties. Augusta-Richmond County MSA: Burke, Columbia, Lincoln, McDuffie, and Richmond counties in Georgia and Aiken and Edgefield counties in South Carolina. Brunswick MSA: Brantley, Glynn, and McIntosh counties. Columbus MSA: Chattahoochee, Harris, Marion, and Muscogee counties in Georgia and Russell County in Alabama. Dalton MSA: Murray and Whitfield counties. Gainesville MSA: Hall County. Hinesville MSA: Liberty and Long counties. Macon-Bibb County MSA: Bibb, Crawford, Jones, Monroe, and Twiggs counties. Rome MSA: Floyd County. Savannah MSA: Bryan, Chatham, and Effingham counties. Valdosta MSA: Brooks, Echols, Lanier, and Lowndes counties. Warner Robins MSA: Houston, Peach and Pulaski counties.
Source: Georgia Department of Labor, Workforce Statistics & Economic Research
16
Georgia Labor Force Estimates by County (not seasonally adjusted)
Place of Residence - Persons 16 Years and Older
Georgia
Preliminary May 2020
Labor Force
Employment
Unemployment Number Rate
4,900,874 4,436,196 464,678 9.5
Appling Atkinson Bacon Baker Baldwin
9,533 9,012
521 5.5
4,344 4,148
196 4.5
4,812 4,568
244 5.1
1,119 1,045
74 6.6
17,738 16,232 1,506 8.5
Banks Barrow Bartow Ben Hill Berrien
9,725 9,076
649 6.7
37,873 34,731 3,142 8.3
47,969 43,296 4,673 9.7
5,219 4,859 360 6.9
7,254 6,773
481 6.6
Bibb Bleckley Brantley Brooks Bryan
64,723 58,338 6,385 9.9
4,311 3,999
312 7.2
6,206 5,714
492 7.9
6,620 6,245
375 5.7
17,000 15,534 1,466 8.6
Bulloch Burke Butts Calhoun Camden
36,792 33,563 3,229 8.8
8,763 7,981
782 8.9
10,040 9,195 845 8.4
2,283 2,159
124 5.4
20,089 18,716 1,373 6.8
Candler Carroll Catoosa Charlton Chatham
5,575 5,292
283 5.1
52,318 47,185 5,133 9.8
32,223 30,207 2,016 6.3
4,597 4,396
201 4.4
134,397 118,178 16,219 12.1
Chattahoochee 1,845
Chattooga
10,167
Cherokee 126,504
Clarke
57,765
Clay
960
1,699 8,878 116,687 52,416
825
146 7.9 1,289 12.7 9,817 7.8 5,349 9.3
135 14.1
Clayton Clinch Cobb Coffee Colquitt
136,010 116,768 19,242 14.1
2,579 2,438
141 5.5
400,179 364,457 35,722 8.9
18,785 17,603 1,182 6.3
21,403 20,324 1,079 5.0
Columbia Cook Coweta Crawford Crisp
70,432 66,289 4,143 5.9
7,960 7,558
402 5.1
71,107 64,059 7,048 9.9
5,217 4,863 354 6.8
9,450 8,803
647 6.8
Revised April 2020
Labor Force
Employment
Unemployment Number Rate
4,880,560 4,286,140 594,420 12.2
9,393 4,350 4,816 1,089 17,850
8,725 4,020 4,452 1,001 15,996
668 7.1 330 7.6 364 7.6
88 8.1 1,854 10.4
9,692 38,050 48,992
5,307 7,577
8,817 33,633 41,919
4,728 6,550
875 9.0 4,417 11.6 7,073 14.4
579 10.9 1,027 13.6
64,477 4,279 6,106 6,461
16,729
56,725 3,879 5,408 5,975
14,639
7,752 12.0 400 9.3 698 11.4 486 7.5
2,090 12.5
36,706 8,541
10,047 2,238 20,102
32,639 7,666 8,903 2,104
18,201
4,067 11.1 875 10.2
1,144 11.4 134 6.0
1,901 9.5
5,519 52,340 32,266
4,509 133,316
5,150 369 6.7
45,690 6,650 12.7
29,179 3,087 9.6
4,252
257 5.7
111,354 21,962 16.5
1,835 1,642
193 10.5
10,231 8,546 1,685 16.5
126,937 113,034 13,903 11.0
56,619 49,728 6,891 12.2
942
781
161 17.1
134,689 113,083 21,606 16.0
2,523 2,346
177 7.0
398,408 353,043 45,365 11.4
18,924 17,115 1,809 9.6
21,144 19,583 1,561 7.4
69,694 7,980
71,269 5,213 9,542
63,778 7,359
62,036 4,722 8,607
5,916 8.5 621 7.8
9,233 13.0 491 9.4 935 9.8
Revised May 2019
Labor Force
Employment
Unemployment Number Rate
5,085,861 4,917,789 168,072 3.3
9,159 4,663 5,082 1,145 17,393
8,803 4,529 4,910 1,092 16,714
356 3.9 134 2.9 172 3.4
53 4.6 679 3.9
9,595 9,344
251 2.6
40,150 39,037 1,113 2.8
50,177 48,614 1,563 3.1
5,288 5,015
273 5.2
7,433 7,180
253 3.4
67,578 65,015 2,563 3.8
4,567 4,353
214 4.7
7,252 6,973
279 3.8
6,834 6,615
219 3.2
18,274 17,763
511 2.8
36,749 35,482 1,267 3.4
9,119 8,669
450 4.9
10,676 10,319
357 3.3
2,162 2,085
77 3.6
20,922 20,195
727 3.5
5,559 5,412
147 2.6
54,840 53,017 1,823 3.3
33,270 32,360
910 2.7
4,760 4,581
179 3.8
139,720 135,309 4,411 3.2
1,999 1,910
89 4.5
10,155 9,811
344 3.4
135,001 131,402 3,599 2.7
58,755 56,782 1,973 3.4
845
788
57 6.7
136,902 131,296 5,606 4.1
2,823 2,734
89 3.2
422,650 410,393 12,257 2.9
18,913 18,199
714 3.8
21,273 20,622
651 3.1
74,945 7,943 74,148 5,579 9,442
72,789 7,700
72,023 5,375 9,101
2,156 2.9 243 3.1
2,125 2.9 204 3.7 341 3.6
Source: Georgia Department of Labor, Workforce Statistics & Economic Research
17
Georgia Labor Force Estimates by County (not seasonally adjusted)
Place of Residence - Persons 16 Years and Older
Dade Dawson Decatur DeKalb Dodge
Preliminary May 2020
Labor Force
Employment
Unemployment Number Rate
7,752 7,319 433 5.6
11,489 10,586 903 7.9
11,239 10,669
570 5.1
385,068 340,756 44,312 11.5
6,605 6,142 463 7.0
Dooly Dougherty Douglas Early Echols
5,076 36,632 70,190
4,352 1,859
4,612 32,956 62,407
4,129 1,766
464 9.1 3,676 10.0 7,783 11.1
223 5.1 93 5.0
Effingham Elbert Emanuel Evans Fannin
28,634 26,287 2,347 8.2
7,891 7,249
642 8.1
8,161 7,577 584 7.2
4,826 4,534 292 6.1
12,297 11,550
747 6.1
Fayette Floyd Forsyth Franklin Fulton
54,472 49,738 4,734 8.7 44,666 40,589 4,077 9.1 113,977 104,996 8,981 7.9 10,035 9,191 844 8.4 537,847 475,209 62,638 11.6
Gilmer Glascock Glynn Gordon Grady
11,147 1,214 34,822 28,445 10,145
10,330 1,154
30,614 26,330
9,625
817 7.3 60 4.9 4,208 12.1 2,115 7.4 520 5.1
Greene
7,062 6,531
531 7.5
Gwinnett 464,867 419,366 45,501 9.8
Habersham 18,852 17,397 1,455 7.7
Hall
96,628 88,911 7,717 8.0
Hancock
2,530 2,278
252 10.0
Haralson Harris Hart Heard Henry
11,818 15,411 11,011 4,990 111,424
10,722 1,096 9.3
14,293 1,118 7.3
10,220
791 7.2
4,501 489 9.8
98,603 12,821 11.5
Houston Irwin Jackson Jasper Jeff Davis
65,950 61,218 4,732 7.2
3,391 3,184
207 6.1
36,419 33,665 2,754 7.6
6,409 5,969 440 6.9
5,829 5,475 354 6.1
Revised April 2020
Labor Force
Employment
Unemployment Number Rate
7,658 7,075 583 7.6
11,607 10,251 1,356 11.7
11,151 10,360
791 7.1
380,756 330,081 50,675 13.3
6,518 5,942
576 8.8
5,244 36,462 69,230
4,233 1,793
4,471 31,847 60,452 3,995 1,686
773 14.7 4,615 12.7 8,778 12.7
238 5.6 107 6.0
28,030 7,888 8,109 4,757
12,402
24,759 6,903 7,375 4,383 11,278
3,271 11.7 985 12.5 734 9.1 374 7.9
1,124 9.1
53,715 48,173 5,542 10.3 44,151 38,302 5,849 13.2 113,375 101,689 11,686 10.3 10,190 9,043 1,147 11.3 534,045 460,274 73,771 13.8
11,241 1,194
35,107 29,018 10,175
10,039 1,115
28,917 25,451
9,326
1,202 10.7 79 6.6
6,190 17.6 3,567 12.3
849 8.3
7,095 6,378
717 10.1
464,061 406,247 57,814 12.5
18,815 16,816 1,999 10.6
96,843 86,528 10,315 10.7
2,527 2,230
297 11.8
11,813 15,403 11,070
5,094 110,213
10,385 1,428 12.1
13,827 1,576 10.2
9,967 1,103 10.0
4,356
738 14.5
95,487 14,726 13.4
65,089 3,349
36,555 6,368 5,832
58,511 3,064 32,660 5,776 5,341
6,578 10.1 285 8.5
3,895 10.7 592 9.3 491 8.4
Revised May 2019
Labor Force
Employment
Unemployment Number Rate
8,141 7,888
253 3.1
12,243 11,894
349 2.9
11,451 11,024
427 3.7
397,135 383,704 13,431 3.4
7,180 6,763
417 5.8
4,981 4,793
188 3.8
38,095 36,368 1,727 4.5
72,764 70,270 2,494 3.4
4,302 4,145
157 3.6
1,887 1,837
50 2.6
30,917 7,570 8,306 4,778
11,497
30,060 7,302 7,948 4,615 11,133
857 2.8 268 3.5 358 4.3 163 3.4 364 3.2
57,640 55,966 1,674 2.9 43,562 42,044 1,518 3.5 121,329 118,092 3,237 2.7
9,875 9,531 344 3.5 553,683 534,754 18,929 3.4
11,788 1,270 39,511 28,005 10,377
11,387 1,222 38,270 27,174 10,043
401 3.4 48 3.8
1,241 3.1 831 3.0 334 3.2
6,983 6,718
265 3.8
486,567 472,308 14,259 2.9
19,087 18,483 604 3.2
101,369 98,617 2,752 2.7
2,423 2,304
119 4.9
12,472 12,073
399 3.2
16,686 16,187
499 3.0
11,500 11,138
362 3.1
5,208 5,041
167 3.2
114,824 110,858 3,966 3.5
70,322 68,064 2,258 3.2
3,290 3,148
142 4.3
36,161 35,234
927 2.6
6,893 6,681
212 3.1
6,068 5,801
267 4.4
Source: Georgia Department of Labor, Workforce Statistics & Economic Research
18
Georgia Labor Force Estimates by County (not seasonally adjusted)
Place of Residence - Persons 16 Years and Older
Jefferson Jenkins Johnson Jones Lamar
Preliminary May 2020
Labor Force
6,495 3,083 3,934 12,706 7,623
Employment
6,023 2,836 3,720 11,891 6,984
Unemployment Number Rate
472 7.3 247 8.0 214 5.4 815 6.4 639 8.4
Revised April 2020
Labor Force
6,465 3,004 3,922 12,574 7,559
Employment
5,861 2,747 3,628 11,553 6,767
Unemployment Number Rate
604 9.3 257 8.6 294 7.5 1,021 8.1 792 10.5
Revised May 2019
Labor Force
6,484 3,143 4,084 13,628 8,165
Employment
6,193 2,990 3,937 13,202 7,869
Unemployment Number Rate
291 4.5 153 4.9 147 3.6 426 3.1 296 3.6
Lanier Laurens Lee Liberty Lincoln
3,537 3,325
212 6.0
19,033 17,404 1,629 8.6
13,806 12,885
921 6.7
25,273 23,230 2,043 8.1
3,379 3,146 233 6.9
3,534 19,177 13,731 24,924 3,316
3,189 17,000 12,450 22,247 3,022
345 9.8 2,177 11.4 1,281 9.3 2,677 10.7
294 8.9
3,725 19,330 14,636 26,108
3,533
3,591 18,529 14,210 25,120
3,403
134 3.6 801 4.1 426 2.9 988 3.8 130 3.7
Long Lowndes Lumpkin McDuffie McIntosh
7,706 7,287
419 5.4
49,686 45,590 4,096 8.2
15,899 14,677 1,222 7.7
8,505 7,665 840 9.9
5,313 4,886
427 8.0
7,529 48,736 16,159
8,524 5,231
6,973 43,727 14,414
7,370 4,613
556 7.4 5,009 10.3 1,745 10.8 1,154 13.5
618 11.8
8,125 50,970 16,572
8,795 6,180
7,819 49,322 16,081
8,396 5,965
306 3.8 1,648 3.2
491 3.0 399 4.5 215 3.5
Macon Madison Marion Meriwether Miller
4,522 12,777
2,991 8,609 2,684
4,224 11,821 2,806 7,550 2,581
298 6.6 956 7.5 185 6.2 1,059 12.3 103 3.8
4,494 12,540
2,943 8,679 2,648
4,091 11,222
2,714 7,308 2,501
403 9.0 1,318 10.5
229 7.8 1,371 15.8
147 5.6
4,707 13,211 3,309 8,827
2,740
4,497 12,820
3,171 8,453 2,656
210 4.5 391 3.0 138 4.2 374 4.2
84 3.1
Mitchell Monroe Montgomery Morgan Murray
8,202 12,105 3,853 8,702 15,289
7,656 11,265 3,593
7,967 13,585
546 6.7 840 6.9 260 6.7 735 8.4 1,704 11.1
8,137 12,061 3,822
8,710 15,611
7,459 10,945
3,499 7,706 12,576
678 8.3 1,116 9.3
323 8.5 1,004 11.5 3,035 19.4
8,264 12,926
3,802 9,149 15,334
7,918 12,512 3,607 8,882 14,691
346 4.2 414 3.2 195 5.1 267 2.9 643 4.2
Muscogee Newton Oconee Oglethorpe Paulding
73,085 49,517 18,561 6,655 80,472
65,295 44,424 17,455
6,207 73,800
7,790 10.7 5,093 10.3 1,106 6.0
448 6.7 6,672 8.3
72,942 49,150 18,154 6,546 80,421
63,212 43,017 16,570 5,887 71,468
9,730 13.3 6,133 12.5 1,584 8.7
659 10.1 8,953 11.1
77,696 74,282 3,414 4.4
51,853 49,911 1,942 3.7
19,410 18,928
482 2.5
6,889 6,667
222 3.2
85,392 82,957 2,435 2.9
Peach Pickens Pierce Pike Polk
11,080 10,271 809 7.3
14,103 13,098 1,005 7.1
8,406 7,947
459 5.5
8,232 7,641
591 7.2
18,057 16,383 1,674 9.3
11,014 14,163 8,385 8,214 18,033
9,812 12,686
7,698 7,398 15,906
1,202 10.9 1,477 10.4
687 8.2 816 9.9 2,127 11.8
11,780 15,169 8,700 8,829 18,335
11,325 14,738
8,419 8,577 17,682
455 3.9 431 2.8 281 3.2 252 2.9 653 3.6
Pulaski Putnam Quitman Rabun Randolph
3,724 7,963
766 7,124 2,506
3,533 7,254
724 6,545 2,367
191 5.1 709 8.9
42 5.5 579 8.1 139 5.5
3,636 8,037
730 7,167 2,470
3,375 7,091
693 6,294 2,302
261 7.2 946 11.8
37 5.1 873 12.2 168 6.8
4,050 8,141
798 7,158 2,512
3,887 7,804
757 6,917 2,398
163 4.0 337 4.1
41 5.1 241 3.4 114 4.5
Source: Georgia Department of Labor, Workforce Statistics & Economic Research
19
Georgia Labor Force Estimates by County (not seasonally adjusted)
Place of Residence - Persons 16 Years and Older
Richmond Rockdale Schley Screven Seminole
Preliminary May 2020
Labor Force
Employment
Unemployment Number Rate
82,127 42,649
2,231 5,175 2,994
74,039 38,055
2,094 4,582 2,829
8,088 9.8 4,594 10.8
137 6.1 593 11.5 165 5.5
Spalding Stephens Stewart Sumter Talbot
27,077 10,804
2,565 12,948
2,665
24,362 9,831 2,393
12,005 2,423
2,715 10.0 973 9.0 172 6.7 943 7.3 242 9.1
Taliaferro Tattnall Taylor Telfair Terrell
567 9,242 2,799 3,627 3,272
522 8,816 2,618 3,256 3,018
45 7.9 426 4.6 181 6.5 371 10.2 254 7.8
Thomas Tift Toombs Towns Treutlen
16,579 15,345 1,234 7.4
19,986 18,761 1,225 6.1
12,021 10,994 1,027 8.5
3,653 3,290
363 9.9
2,636 2,455
181 6.9
Troup Turner Twiggs Union Upson
39,000 3,127 2,712
10,215 11,126
34,913 2,900 2,447 9,563 10,128
4,087 10.5 227 7.3 265 9.8 652 6.4 998 9.0
Walker
30,300 28,132 2,168 7.2
Walton
42,963 39,469 3,494 8.1
Ware
15,193 14,180 1,013 6.7
Warren
2,786 2,547
239 8.6
Washington 6,598 6,108
490 7.4
Wayne Webster Wheeler White Whitfield
10,990 994
1,600 16,519 43,151
10,202 938
1,481 15,372 38,339
788 7.2 56 5.6 119 7.4
1,147 6.9 4,812 11.2
Wilcox Wilkes Wilkinson Worth
2,624 3,831 3,931 8,317
2,470 3,555 3,683 7,786
154 5.9 276 7.2 248 6.3 531 6.4
Revised April 2020
Labor Force
Employment
Unemployment Number Rate
81,080 42,224
2,156 5,114 2,972
71,215 36,860
2,033 4,448 2,760
9,865 12.2 5,364 12.7
123 5.7 666 13.0 212 7.1
27,020 10,929
2,490 12,841 2,650
23,590 9,653 2,317 11,642 2,327
3,430 12.7 1,276 11.7
173 6.9 1,199 9.3
323 12.2
567 9,087 2,764 3,641 3,217
510 8,516 2,477 3,201 2,915
57 10.1 571 6.3 287 10.4 440 12.1 302 9.4
16,587 19,954 12,143
3,798 2,646
14,873 18,193 10,708 3,268 2,375
1,714 10.3 1,761 8.8 1,435 11.8
530 14.0 271 10.2
39,923 3,150 2,687
10,284 11,123
33,908 2,825 2,377 9,342 9,777
6,015 15.1 325 10.3 310 11.5 942 9.2
1,346 12.1
30,305 43,414 15,325
2,762 6,582
27,166 38,221 13,739
2,475 5,982
3,139 10.4 5,193 12.0 1,586 10.3
287 10.4 600 9.1
11,082 974
1,591 16,714 44,319
9,947 914
1,438 14,953 35,475
1,135 10.2 60 6.2
153 9.6 1,761 10.5 8,844 20.0
2,611 3,783 3,833 8,252
2,424 3,464 3,566 7,511
187 7.2 319 8.4 267 7.0 741 9.0
Revised May 2019
Labor Force
Employment
Unemployment Number Rate
84,899 81,213 3,686 4.3
44,495 42,834 1,661 3.7
2,208 2,124
84 3.8
5,059 4,823
236 4.7
3,046 2,913
133 4.4
28,499 10,682
2,407 12,706 2,828
27,378 10,291
2,305 12,126 2,699
1,121 3.9 391 3.7 102 4.2 580 4.6 129 4.6
557 9,438 3,119 4,340 3,494
536 9,082 3,004 3,894 3,316
21 3.8 356 3.8 115 3.7 446 10.3 178 5.1
16,205 19,584 11,594
3,920 2,667
15,591 18,980 11,074
3,744 2,549
614 3.8 604 3.1 520 4.5 176 4.5 118 4.4
37,327 3,137 2,858
10,358 11,213
36,209 3,011 2,712
10,038 10,838
1,118 3.0 126 4.0 146 5.1 320 3.1 375 3.3
31,037 30,084 953 3.1
45,756 44,363 1,393 3.0
15,543 15,024
519 3.3
2,795 2,676
119 4.3
6,976 6,699
277 4.0
11,421 11,000
421 3.7
1,000
950
50 5.0
1,628 1,507
121 7.4
16,235 15,828
407 2.5
43,160 41,571 1,589 3.7
2,688 3,792 4,004 8,847
2,555 3,629 3,843 8,502
133 4.9 163 4.3 161 4.0 345 3.9
Source: Georgia Department of Labor, Workforce Statistics & Economic Research
20
City Labor Force Estimates
Place of Residence - Persons 16 Years and Older
Preliminary May 2020
Labor Force
Employment
Unemployment Number Rate
*Albany 29,905 26,834 3,071 10.3
*Alpharetta
34,369 31,554 2,815 8.2
*Athens 57,765 52,416 5,349 9.3
*Atlanta 254,080 222,925 31,155 12.3
Dekalb Part
22,854 20,678 2,176 9.5
Fulton Part
231,226 202,247 28,979 12.5
*Augusta 82,127 74,039 8,088 9.8
*Brookhaven
31,707 29,689 2,018 6.4
*Canton 14,303 13,346
957 6.7
Carrollton 10,953
9,669 1,284 11.7
*Chamblee 18,890 17,635 1,255 6.6
*Columbus
73,085 65,295 7,790 10.7
Dalton 13,718 12,054 1,664 12.1
Decatur 13,361 12,424
937 7.0
Douglasville
16,751 14,735 2,016 12.0
Duluth 15,313 13,796 1,517 9.9
*Dunwoody
25,506 23,674 1,832 7.2
East Point
17,222 14,056 3,166 18.4
Gainesville
18,736 17,138 1,598 8.5
Hinesville 14,701 13,575 1,126 7.7
*Johns Creek
42,056 38,674 3,382 8.0
Kennesaw
18,921 17,221 1,700 9.0
LaGrange 16,249 14,175 2,074 12.8
Lawrenceville
13,829 12,289 1,540 11.1
McDonough
12,075 10,047 2,028 16.8
*Macon-Bibb
64,723 58,338 6,385 9.9
*Marietta 33,430 30,499 2,931 8.8
Milton 18,748 17,347 1,401 7.5
Newnan 17,940 15,764 2,176 12.1
Peachtree City
17,020 15,984 1,036 6.1
P'tree Corners
23,484 21,426 2,058 8.8
Rome 15,886 14,148 1,738 10.9
*Roswell 50,148 46,309 3,839 7.7
*Sandy Springs 61,407 56,511 4,896 8.0
*Savannah
66,069 56,765 9,304 14.1
*Smyrna 33,230 30,198 3,032 9.1
Statesboro
14,041 12,461 1,580 11.3
Stockbridge
14,252 12,291 1,961 13.8
Tucker 18,856 17,017 1,839 9.8
*Valdosta 24,510 22,234 2,276 9.3
*Warner Robins 31,416 28,906 2,510 8.0
Woodstock
16,146 14,927 1,219 7.5
Revised April 2020
Labor Force
Employment
Unemployment Number Rate
29,737 25,931 3,806 12.8
34,208 30,562 3,646 10.7
56,619 49,728 6,891 12.2
249,260 215,922 33,338 13.4
22,467 20,031 2,436 10.8
226,793 195,891 30,902 13.6
81,080 71,215 9,865 12.2
31,167 28,759 2,408 7.7
14,350 12,928 1,422 9.9
10,846
9,363 1,483 13.7
18,576 17,083 1,493 8.0
72,942 63,212 9,730 13.3
14,178 11,154 3,024 21.3
13,116 12,035 1,081 8.2
16,442 14,273 2,169 13.2
15,288 13,364 1,924 12.6
25,162 22,933 2,229 8.9
17,048 13,614 3,434 20.1
18,812 16,679 2,133 11.3
14,458 13,001 1,457 10.1
41,971 37,458 4,513 10.8
18,822 16,681 2,141 11.4
16,613 13,767 2,846 17.1
13,730 11,904 1,826 13.3
11,936
9,729 2,207 18.5
64,477 56,725 7,752 12.0
32,992 29,544 3,448 10.5
18,695 16,802 1,893 10.1
18,049 15,266 2,783 15.4
16,717 15,481 1,236 7.4
23,263 20,756 2,507 10.8
15,826 13,351 2,475 15.6
50,057 44,853 5,204 10.4
60,727 54,735 5,992 9.9
65,613 53,487 12,126 18.5
32,929 29,252 3,677 11.2
13,991 12,118 1,873 13.4
14,067 11,903 2,164 15.4
18,704 16,483 2,221 11.9
23,974 21,326 2,648 11.0
30,932 27,627 3,305 10.7
16,138 14,460 1,678 10.4
Revised May 2019
Labor Force
Employment
Unemployment Number Rate
31,063 36,493 58,755 260,336 23,955 236,381 84,899 34,186 15,397 11,327 20,306 77,696 13,581 13,469 17,194 16,000 27,337 16,627 19,555 15,228 44,742 19,949 15,232 14,320 11,452 67,578 35,419 20,072 18,306 18,457 24,799 15,204 53,486 65,313 67,351 35,064 13,769 14,391 19,747 24,921 33,255 17,274
29,612 35,508 56,782 250,874 23,285 227,589 81,213 33,431 15,028 10,864 19,858 74,282 13,071 13,089 16,591 15,537 26,658 15,817 19,009 14,680 43,519 19,391 14,702 13,840 10,955 65,015 34,344 19,520 17,724 17,985 24,131 14,655 52,111 63,592 64,994 34,004 13,174 13,819 19,161 24,055 32,136 16,809
1,451 4.7 985 2.7
1,973 3.4 9,462 3.6
670 2.8 8,792 3.7 3,686 4.3
755 2.2 369 2.4 463 4.1 448 2.2 3,414 4.4 510 3.8 380 2.8 603 3.5 463 2.9 679 2.5 810 4.9 546 2.8 548 3.6 1,223 2.7 558 2.8 530 3.5 480 3.4 497 4.3 2,563 3.8 1,075 3.0 552 2.8 582 3.2 472 2.6 668 2.7 549 3.6 1,375 2.6 1,721 2.6 2,357 3.5 1,060 3.0 595 4.3 572 4.0 586 3.0 866 3.5 1,119 3.4 465 2.7
Note: City estimates were prepared in cooperation with the U.S. Department of Labor, Bureau of Labor Statistics. All cities listed have total population of 25,000 or more and an asterisks (*) designates cities with population of 50,000 or more.
Source: Georgia Department of Labor, Workforce Statistics & Economic Research
21
UNEMGPeoLrOgiaYUMneEmNploTymReAntTREateBs bYy CCoOunUtyNTIES MAY 2020 May 2020
Dade 5.6
Catoosa 6.3
Walker
Whitfield
Murray 11.1
Fannin 6.1
Union 6.4
Towns 9.9
Rabun 8.1
7.2
11.2
Chattooga 12.7
Gordon 7.4
Floyd 9.1
Bartow 9.7
Gilmer 7.3
Pickens 7.1
Cherokee 7.8
Lumpkin 7.7
Dawson 7.9
Forsyth 7.9
White Habersham
6.9
7.7
Stephens
9.0
Banks Franklin
Hall
6.7
8.4
8.0
Jackson 7.6
Madison 7.5
Hart 7.2
Elbert 8.1
10.0% or greater 21 counties (13%)
8.0% to 9.9% 43 counties (27%)
6.0% to 7.9% 67 counties (42%)
Polk 9.3
Paulding
Cobb 8.9
Gwinnett 9.8
Barrow 8.3
Clarke 9.3
Oglethorpe 6.7
Less than 6.0% 28 counties (18%)
Haralson 9.3
Carroll 9.8
Heard 9.8
8.3 Douglas 11.1
Coweta 9.9
Fulton 11.6
DeKalb 11.5 Rockdale
Walton 8.1
Oconee 6.0
Clayton
10.8 Newton
14.1
Fayette 8.7
Henry 11.5
10.3
Morgan 8.4
Spalding 10.0
Butts 8.4
Jasper 6.9
Putnam 8.9
Wilkes 7.2
Lincoln 6.9
Percentages of number of counties may not total 100 due to rounding
Greene 7.5
Taliaferro
7.9
McDuffie
Warren 9.9
Columbia 5.9
8.6
Richmond
Hancock
9.8
10.0
Glascock
4.9
Troup 10.5
Meriwether 12.3
Pike 7.2
Lamar 8.4
Monroe 6.9
Jones 6.4
Baldwin 8.5
Washington
Jefferson 7.3
Burke 8.9
Upson
7.4
Harris 7.3
Talbot 9.1
Muscogee 10.7
Marion Chattahoochee 6.2
9.0
Taylor 6.5
Crawford 6.8
Bibb 9.9
Twiggs 9.8
Wilkinson 6.3
Peach
7.3
Macon 6.6
Houston 7.2
Bleckley 7.2
Laurens 8.6
Johnson 5.4
Emanuel 7.2
Jenkins 8.0
Screven 11.5
Treutlen 6.9
Candler 5.1
Bulloch 8.8
Effingham 8.2
7.9
Stewart 6.7
Schley 6.1
Webster 5.6
Sumter 7.3
Quitman
5.5 Randolph Terrell
Lee
5.5
7.8
6.7
Clay 14.1
Calhoun 5.4
Dougherty 10.0
Early 5.1
Miller 3.8
Baker 6.6
Mitchell 6.7
Dooly 9.1
Pulaski 5.1
Dodge 7.0
Crisp 6.8
Wilcox 5.9
Turner 7.3
Ben Hill 6.9
Montgomery
Wheeler 7.4
6.7
Toombs 8.5
Evans 6.1
Tattnall
Telfair
4.6
10.2
Jeff Davis 6.1
Appling 5.5
Long 5.4
Bryan 8.6
Liberty 8.1
Worth 6.4
Colquitt 5.0
Irwin 6.1 Tift 6.1
Coffee 6.3
Berrien
Atkinson
6.6
4.5
Cook
5.1 Lanier
Bacon 5.1
Wayne 7.2
Pierce 5.5
Ware 6.7
Brantley 7.9
McIntosh 8.0
Glynn 12.1
Chatham 12.1
Seminole 5.5
Decatur 5.1
Grady 5.1
Thomas 7.4
Brooks 5.7
6.0
Lowndes 8.2
Clinch 5.5
Charlton 4.4
Camden 6.8
Echols
5.0
Georgia's Unemployment Rate: 9.5 %
Georgia's U(nNoet SmeasponlaollyyAmdjusetend)t Rate: 9.5% (not seasonally adjusted) Source: Georgia Department of Labor, Workforce Statistics and Economic Research
22
Georgia Unemployment Insurance Claims by County
County
May 2020 Average Average Initial Weekly Duration
Claims Benefit Weeks
County
May 2020 Average Average Initial Weekly Duration
Claims Benefit Weeks
County
May 2020 Average Average Initial Weekly Duration
Claims Benefit Weeks
Georgia
836,060........ $255.........6.9
Appling
873........ $249.........3.7
Atkinson
429........ $226.........3.3
Bacon
448........ $249.........3.1
Baker
70........ $197.........3.2
Baldwin
2,502........ $213.........2.8
Banks
1,140........ $227.........2.5
Barrow
6,216........ $238.........2.1
Bartow
9,161........ $239.........2.5
Ben Hill
673........ $209.........2.9
Berrien
787........ $230.........2.8
Bibb
10,918........ $217.........2.6
Bleckley
445........ $222.........3.6
Brantley
1,017........ $224.........2.6
Brooks
782........ $203.........2.6
Bryan
2,867........ $221.........2.2
Bulloch
6,362........ $208.........2.5
Burke
839........ $247.........3.8
Butts
1,824........ $229.........2.3
Calhoun
261........ $257.........2.7
Camden
2,465........ $194.........2.3
Candler
465........ $223.........2.7
Carroll
7,950........ $237.........2.5
Catoosa
2,217........ $203.........2.8
Charlton
467........ $199.........2.9
Chatham
29,284........ $219.........2.3
Chattahoochee
74........ $193.........2.8
Chattooga
608........ $272.........3.9
Cherokee 17,725........$229.........2.2
Clarke
10,441........ $212.........2.1
Clay
277........ $217.........2.5
Clayton
30,778........ $231.........2.6
Clinch
196........ $176.........2.7
Cobb
62,153........ $235.........2.3
Coffee
2,001........ $233.........2.9
Colquitt
2,367........ $200.........2.5
Columbia
6,848........ $218.........2.3
Cook
970........ $210.........2.8
Coweta
12,757........ $244.........2.3
Crawford
436........ $239.........3.0
Crisp
1,278........ $208.........3.0
Dade
720........ $232.........2.4
Dawson
2,042........ $221.........2.1
Decatur
1,328........ $204.........3.0
DeKalb
70,067........ $238.........2.5
Dodge
981........ $212.........4.2
Dooly
402........ $219.........3.0
Dougherty
6,001........ $197.........2.8
Douglas
15,082........ $231.........2.3
Early
293........ $184.........3.2
Echols
107........ $210.........2.2
Effingham
3,962........ $226.........2.0
Elbert
1,236........ $241.........3.0
Emanuel
920........ $225.........3.6
Evans
533........ $222.........2.7
Fannin
1,225........ $213.........2.5
Fayette
9,981........ $236.........2.1
Floyd
7,309........ $236.........3.0
Forsyth
15,956........ $223.........2.2
Franklin
1,990........ $241.........2.7
Fulton
112,888........ $237.........2.5
Gilmer
1,800........ $215.........2.5
Glascock
96........ $218.........3.3
Glynn
7,929........ $222.........2.3
Gordon
5,302........ $234.........2.7
Grady
792........ $249.........3.0
Greene
1,310........ $228.........2.5
Gwinnett
80,049........ $235.........2.2
Habersham 2,074........$241.........2.9
Hall
13,451........ $233.........2.2
Hancock
423........ $237.........3.6
Haralson
1,532........ $242.........2.2
Harris
2,360........ $236.........2.6
Hart
1,199........ $246.........3.3
Heard
679........ $260.........2.6
Henry
24,730........ $232.........2.4
Houston
8,291........ $206.........2.5
Irwin
282........ $229.........3.0
Jackson
6,003........ $229.........2.1
Jasper
835........ $243.........2.4
Jeff Davis
703........ $222.........3.3
Jefferson
781........ $240.........3.7
Jenkins
342........ $253.........3.8
Johnson
348........ $224.........3.4
Jones
1,201........ $225.........2.5
Lamar
961........ $240.........2.9
Lanier
335........ $212.........2.4
Laurens
2,684........ $212.........3.5
Lee
3,584........ $237.........2.2
Liberty
4,680........ $198.........2.6
Lincoln
378........ $238.........3.1
Long
881........ $209.........3.1
Lowndes
8,322........ $193.........2.4
Lumpkin
2,098........ $227.........2.5
Macon
658........ $229.........3.7
Madison
2,098........ $231.........2.2
Marion
365........ $223.........2.7
McDuffie
1,214........ $235.........3.8
McIntosh
630........ $215.........2.3
Meriwether 1,589........$256.........3.2
Miller
230........ $180.........3.4
Mitchell
752........ $221.........3.6
Monroe
1,307........ $229.........2.6
Montgomery
657........ $239.........3.2
Morgan
1,304........ $234.........2.4
Murray
3,974........ $237.........3.4
Muscogee Newton Oconee Oglethorpe Paulding Peach Pickens Pierce Pike Polk Pulaski Putnam Quitman Rabun Randolph Richmond Rockdale Schley Screven Seminole Spalding Stephens Stewart Sumter Talbot Taliaferro Tattnall Taylor Telfair Terrell Thomas Tift Toombs Towns Treutlen Troup Turner Twiggs Union Upson Walker Walton Ware Warren Washington Wayne Webster Wheeler White Whitfield Wilcox Wilkes Wilkinson Worth
13,708........ $216.........2.9 8,816........ $235.........2.6 2,566........ $221.........2.0 876........ $231.........2.2 9,808........ $231.........2.3 1,628........ $208.........2.9 2,001........ $229.........2.2 1,035........ $212.........2.4 1,018........ $244.........2.3 2,806........ $246.........2.9 314........ $221.........3.1 1,301........ $237.........2.6 29........ $261.........2.4 807........ $246.........2.7 561........ $281.........2.7
12,230........ $213.........2.9 8,679........ $233.........2.5 181........ $236.........2.8 1,133........ $274.........3.5 294........ $195.........2.8 4,507........ $230.........2.6 1,789........ $249.........2.7 157........ $210.........3.7 1,266........ $216.........3.4 302........ $259.........3.8 73........ $246.........2.7 643........ $220.........3.2 258........ $233.........3.0 328........ $215.........8.0 393........ $207.........2.7 2,313........ $210.........2.5 2,385........ $191.........2.6 1,424........ $237.........3.1 604........ $212.........2.3 264........ $227.........3.7 7,032........ $255.........2.9 371........ $196.........2.9 348........ $227.........3.3 1,162........ $206.........2.2 1,828........ $250.........2.7 3,548........ $228.........3.1 7,385........ $231.........2.2 1,497........ $210.........2.7 331........ $257.........4.7 757........ $207.........2.8 1,765........ $213.........2.8 63........ $248.........3.1 177........ $223.........4.4 1,755........ $228.........2.3 11,043........ $229.........3.2 203........ $220.........3.5 378........ $243.........4.2 458........ $219.........2.9 824........ $219.........2.8
Note: Initial claims include intrastate initial and additional claims, as well as agent state initial and additional claims for regular UI only. Average duration of benefits is represented in weeks.
Data does not include state or federal extended benefits.
Source: Georgia Department of Labor, Workforce Statistics and Economic Research
23
Mark Butler, Commissioner 148 Andrew Young International Boulevard, N.E. Atlanta, Georgia 30303-1751
Return Service Requested