- Collection:
- Georgia Government Publications
- Title:
- Dimensions: measuring Georgia's workforce, 2020 December
- Creator:
- Georgia. Department of Labor
- Contributor to Resource:
- Georgia. Department of Labor
- Publisher:
- Atlanta, Ga. : Georgia. Department of Labor
- Date of Original:
- 2020-12
- Subject:
- Labor market--Georgia--Statistics--Periodicals
Wages--Georgia--Statistics--Periodicals
Hours of labor--Georgia--Statistics--Periodicals - Location:
- United States, Georgia, 32.75042, -83.50018
- Medium:
- serials (publications)
- Type:
- Text
- Format:
- application/pdf
- Description:
- Monthly employment statistics for Georgia
- External Identifiers:
- Call Number GA L200.E46 P1 T7 46/12
- Metadata URL:
- https://dlg.galileo.usg.edu/id:dlg_ggpd_i-ga-bl200-pe46-bp1-bt7-b46-s12-belec-p-btext
- Digital Object URL:
- https://dlg.galileo.usg.edu/do:dlg_ggpd_i-ga-bl200-pe46-bp1-bt7-b46-s12-belec-p-btext
- Language:
- eng
- Holding Institution:
- University of Georgia. Map and Government Information Library
- Rights:
-

Jackson Madison Elbert
D I M E N S I O Polk
Haralson
Paulding Cobb Douglas
Gwinnett Barrow Clarke
Oconee Oglethorpe
DeKalb
Walton
Rock-
Wilkes
Lincoln
EdgefieSlCd,
Carroll
Fulton Clayton
dale Newton
Morgan Greene Taliaferro
Columbia
Fayette Henry
McDuffie Warren
Heard
Coweta
Spalding Butts Jasper Putnam Hancock
Glascock
Richmond
AikenSC,
N
S
Russell, AL
Measuring Georgia's Workforce Troup Meriwether Pike Lamar Monroe Upson
Jones
Baldwin
Jefferson Washington
Burke
Bibb
Wilkinson
Harris
Talbot
Crawford
Twiggs
RMeuvsicsoegede estimatesTafyolorr 2019P--eac2h020 in this issue
Johnson
Jenkins Screven
EmanueAl nnual Issue - Volume XLVI, Number 12
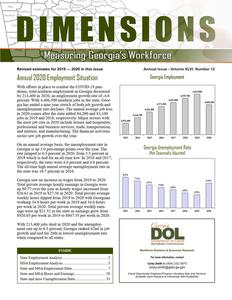
Annual 2020 Employment Situation Marion Chattahoo-
Houston Bleckley Macon
Laurens
Treutlen
CandlGereorgBuialloEcmh ploEyfmfinegnhatm
chee
With efforts in plSaccheleyto combat DthoeolyCOPVuIlaDsk-i19 pDaondg-e demSteicw,arttotaWl nebosntefrarmSuemmtperloyment in Georgia decreased
Montgomery
Wheeler
Toombs
by 213,400 in Qupitemrcanent. With
42,042006,,5a0n0enmopnlfoayrmmCerjinsoptbgsrionwWtihtlcheoxrsattaeteo,fG-4eTo.e6rlf-air
gia hRaansdeonlpdhed Taernreilnl e yeLaerestretch ofTubrontehr job grBoewn Hthilland
Jeff Davis
Appling
Evans Tattnall
Bryan
L4ib,4e5r2t,6y00 4,L37o1n,3g00
Chatham4,619,900 4,535,700
4,406,500
unemployment rate declines. The annual average job loss
4,261,400
ijnoClba2sy0i2n02cC0oa1lmh9oeuasnnadft2e0Dr1otu8hg,ehresertstaypteecWatdiovdrteehldy.8M4,a2Tji0fot0r
anIrdwi8n3,100 sectors with
Coffee
Baco4n,144,700
Wayne
McIntosh
theEamrlyost job cBuatkserin 2020 include leisure and hospitality;
4,032,400
Pierce
professional and business services; trade, transBperoriretnationAt,kinson
and utiMliiltleier s; and maMniutcfhaecllturingC.oTlquhiett finaCnoockial activities
Ware
Brantley
Glynn
sector saw job growth over the year.
Lanier
2013
2014
2015
2016
2017
2018
2019
2020
Seminole
Clinch
On an annDueacaltuarveragGeradbyasisT,htohmeaus nemBropolkosymenLotwrnadteesin
Georgia is up 3.0 percentage rate jumped to 6.5 percent in
points 2020,
over from
the 3.5
ypeearcr.eTnthEiecnhols
Camden
ChaGrlteoonrgia Unemployment Rate
(Not Seasonally Adjusted)
2019 which is tied for an all-time low. In 2018 and 2017,
respectively, the rates were 4.0 percent and 4.8 percent.
The all-time high annual average unemployment rate in
the state was 10.7 percent in 2010.
8.1%
Georgia saw an increase in wages from 2019 to 2020. Total private average hourly earnings in Georgia were up $0.77 over the year as hourly wages increased from $26.61 in 2019 to $27.38 in 2020. Total private average
7.1%
6.1%
6.5%
5.4% 4.8%
4.0%
3.5%
weekly hours dipped from 2019 to 2020 with Georgians
working 34.8 hours per week in 2019 and 34.6 hours
per week in 2020. Total private average weekly earn-
ings were up $21.32 in the state as earnings grew from
2013
2014
2015
2016
2017
2018
2019
2020
$926.03 per week in 2019 to $947.35 per week in 2020.
With 213,400 jobs shed in 2020 and the unemployment rate up to 6.5 percent, Georgia ranked 42nd in job growth and tied for 20th in lowest unemployment rate when compared to all states.
INSIDE
State Employment Analysis................................................ 2 MSA Employment Analysis................................................ 3 State and MSA Employment Data...................................... 7 State and MSA Hours and Earnings.................................. 28 State and Area Unemployment Data................................. 33
Workforce Statistics & Economic Research
For more information, contact
Corey Smith at (404) 232-3875 corey.smith@gdol.ga.gov
Equal Opportunity Employer/ProgramAuxiliary Aids and Services Available upon Request to Individuals with Disabilities
Annual Dimensions - Measuring Georgia's Workforce
150,000 100,000
50,000 0
-50,000 -100,000 -150,000 -200,000 -250,000
Georgia Annual Employment Change
78,500
112,300
116,700 109,900
81,300
83,100
84,200
2013
2014
2015
2016
2017
2018
2019
-213,400 2020
2020 Nonfarm Payroll Employment by Industry Sector
Employment in the Mining and Logging sector in Georgia was unchanged in 2020 and remains steady at 9,500. There has been no job change in the sector since 400 positions were added in 2016. The last time the sector lost jobs was in 2012.
positions were lost in 2019. The transportation, warehousing, and utilities industry added 900 jobs in 2020 after adding 12,600 workers in 2019.
After adding 2,200 jobs in 2019, the Information sector saw employment decline by 8,500 in 2020. Payrolls were down 3,700 in 2018 and up 5,200 in 2017. The Information sector includes telecommunications, data processing, as well as the motion picture, publishing, and sound recording industries.
Employment in the Financial Activities sector grew by 300 in 2020 after growing by 4,600 in 2019 and 4,800 in 2018. In 2020, the finance and insurance industry added 2,600 workers, while the real estate, rental and leasing industry contracted by 2,300 jobs.
Professional and Business Services saw employment drop by 26,100 in 2020 after growing by 15,000 in 2019. The sector is broken into three industries: professional and technical services where 2,400 jobs were cut in 2020, management of companies and enterprises which shed 4,200 positions, and administrative and support services where employment declined by 19,500 over the year.
Construction employment was down 3,500 in 2020 as seven straight years of job growth comes to an end. From 2013-2019 there were 62,200 jobs added across the state. Prior to that growth, job losses totaled 78,800 from 2008 to 2012. Of the 3,500 construction jobs cut this year, specialty trade contractors payrolls were down 3,300, heavy and civil engineering construction saw jobs decline by 300, and construction of buildings employment was up 200.
After growing by 18,400 in 2019, the Education and Health Services sector endured a loss of 18,900 jobs in 2020 as both the education segment and the health services portion of the sector shed employment. The educational services industry cut 3,300 jobs while the health care and social assistance industry cut employment by 15,600 over the year. Over the 10 years prior to 2020, educational and health Services added an average of 14,200 jobs per year.
Georgia's Manufacturing sector lost 20,800 jobs in 2020 after payrolls were up 1,600 in 2019 and 8,500 in 2018. Payrolls in the state are down in 2020 after having grown for nine straight years. Durable goods manufacturing lost 11,300 jobs in 2020 after displaying growth for nine consecutive years. The non-durable goods manufacturing industry saw 9,400 job cuts in 2020, the first annual average job losses in the industry since 2014.
All employee average hourly earnings in the manufacturing sector increased $1.44 over the year as wages were up from $24.41 in 2019 to $25.85 in 2020. Average weekly hours declined as the workweek dropped from 41.9 hours in 2019 to 40.9 hours in 2020. Average weekly earnings in manufacturing increased from $1,022.78 in 2019 to $1,057.27 in 2020.
Production employee average hourly earnings increased $1.40 in the manufacturing sector, from $19.59 in 2019 to $20.99 in 2020. Average weekly hours declined from 42.8 hours in 2019 to 41.9 hours in 2020 while average weekly earnings moved up from $838.45 in 2019 to $879.48 in 2020.
Trade, Transportation, and Utilities employment declined by 24,100 in 2020 after growing by an average of 16,600 each year for the past nine years. The wholesale trade portion of the sector shed 8,400 jobs in 2020 after adding 2,900 jobs in 2019. Retail trade positions were down 16,600 in 2020 after 100
Payrolls in Georgia's Leisure and Hospitality sector were down 85,600 in 2020 after growing by 11,500 in 2019 and 10,700 in 2018. Since growing for 16 consecutive years from 1992-2007, then contracting from 2008-2010, the leisure and hospitality sector had added jobs for nine straight years (20112019) before this loss. The arts and entertainment portion of the sector lost 13,000 jobs in 2020 after growing by 2,300 in 2019 while the accommodation and food services portion of the sector lost 72,600 payroll employees in 2020 after adding 9,100 in 2019.
Employment in Other Services dropped by 15,400 in 2020 after being up 5,400 in 2019 and up 2,100 in 2018. The 15,400 jobs lost in 2020 were a result of repair and maintenance cutting 1,800 workers; personal and laundry services employment going down by 6,200; and religious, civic, and similar organizations losing 1,400 jobs.
After falling for six straight years (2009-2014) and cutting 34,500 jobs, Government employment in Georgia rose for five years in a row (2015-2019) adding 15,300 jobs before cutting 10,900 workers in 2020. Federal government payrolls grew by 4,200 in 2020 after growing by 1,900 in 2019. State government jobs dropped by 5,600 in 2020 and were down 2,800 in 2019. Local government payrolls were down 9,500 in 2020 and up 2,000 in 2019.
Note: Data may not add due to rounding.
2
Source: Georgia Department of Labor, Workforce Statistics & Economic Research
MSA Nonfarm Employment
2013 2020 Annual Employment Change
Albany MSA
1,600
900
900
800
600
0
100
0
0
-800
-700
-1,600
-2,400
-3,200
-2,800
2013
2014
2015
2016
2017
2018
2019
2020
Athens-Clarke County MSA
4,000
2,000
1,000
1,000
2,100
2,700
2,800
1,500
0 -500
-2,000
-4,000
-6,000
-8,000 2013
2014
2015
2016
2017
2018
2019
-5,700 2020
The Albany MSA shed 2,800 jobs in 2020 as average employment in the area decreased to 60,000. The growth comes after employment grew by 600 in 2019. The 2020 job loss, due to the impact of COVID-19, is the largest annual jobs loss ever recorded in the area. Private Service-Providing sector cut 2,100 jobs in 2020 after adding 600 in 2019. Retail Trade employment was down by 500 over the year after being flat in 2019. Government employment declined by 400 in 2020 after it was flat in 2019.
The Athens MSA lost 5,700 jobs in 2020 after jobs were down 500 in 2019. Prior to these two years, employment had grown for eight consecutive years. The average employment in the MSA was 92,100 in 2020. State Government endured 800 job losses in 2020 after shedding 1,100 jobs in 2019. The Private-Service Providing sector cut 4,100 workers in 2020 after growing by 700 the prior year. Leisure and Hospitality employment declined by 2,100 in 2020 and grew by 400 jobs in 2019.
120,000
80,000 40,000
60,100
0
-40,000
-80,000
-120,000
-160,000
-200,000 2013
Atlanta MSA
88,800
78,500
82,600
62,600
58,300
64,500
-150,700
2014
2015
2016
2017
2018
2019
2020
The Atlanta MSA saw employment decrease by 150,700 in 2020 after growing by 64,500 jobs in 2019. Under the cloud of COVID-19, total average employment in the metro area dropped to 2,699,700 in 2020. Leisure and Hospitality; Trade, Transportation, and Utilities; Professional and Business Services; Education and Health Services; and Other Services saw the most job cuts over the year. Leisure and Hospitality employment dropped by 61,500 in 2020, which was the most out of all major sectors. The lone major sector to display job growth from 2019 to 2020 was Financial Activities, which added 13,000 over the year.
Augusta-Richmond County MSA
7,500
5,000 2,500
2,100
4,000
6,000
3,900
3,800
3,400
3,700
0
-2,500
-5,000
-7,500
-10,000
2013
2014
2015
2016
2017
2018
2019
-8,500 2020
There were 8,500 jobs lost in the Augusta MSA in 2020 as average employment in the area decreased to 234,800. The over the year employment decline ends a ten-year run of positive job growth for the MSA. Respectively, with losses of 4,000 and 900, Leisure and Hospitality along with Professional and Business Services cut the most positions in 2020. Education and Health Services shed 700 jobs in 2020, matching the employment drop that Other Services endured. After being down 900 in 2019, Government employment was down 300 in 2020.
Note: MSA = Metropolitan Statistical Area
Source: Georgia Department of Labor, Workforce Statistics & Economic Research
3
MSA Nonfarm Employment
2013 2020 Annual Employment Change
2,000
1,000 200
0
-1,000
Brunswick MSA
1,100
1,200
700 400
0
-100
-2,000
-3,000 2013
2014
2015
2016
2017
2018
2019
-2,300 2020
After job growth each year from 2012 to 2018, the Brunswick MSA has now lost jobs in 2019 and 2020. The 2020 decline of 2,300 jobs, due to the COVID-19 pandemic, brings total employment in the area to 41,700. Employment in the Private Service-Providing sector decreased by 2,000 over the year after being down 200 in 2019. Government employment declined by 200 in 2020 after being up 2020 in 2019 while Trade, Transportation, and Utilities employment held steady in 2020 and was down 400 in 2019.
Columbus MSA
2,000
1,100
1,000
400
1,400 600
300
0
-1,000 -2,000
-500 -900
-3,000
-4,000
-5,000 -6,000
2013
2014
2015
2016
2017
2018
2019
-5,000 2020
The Columbus MSA lost 5,000 jobs in 2020 after the MSA added 300 jobs in 2019 and 1,400 jobs in 2018. Leisure and Hospitality employment fell by 1,800 in 2020 after growing by 300 in 2019. Government employment dropped by 600 in 2020 after being down 200 in 2019. The Financial Activities sector saw jobs decline by 500 over the year. Trade, Transportation, and Utilities employment was down for the second year in a row as 400 jobs were shed in both 2020 and 2019. Manufacturing, Education and Health Services, and Other Services each lost 400 jobs in 2020.
3,000 2,000 1,000
0 -1,000 -2,000 -3,000 -4,000
0 2013
2,300 2014
Dalton MSA
1,600 900
500
-100
2015
2016
2017
2018
-1,100
-2,900
2019
2020
The Dalton MSA saw employment decrease by 2,900 in 2020 after 1,100 jobs were cut in 2018. The Goods Producing sector, which includes manufacturing, saw employment drop by 2,200 in 2020 while the Private Service-Providing sector lost 800 jobs. Trade, Transportation and Utilities experienced job declines of 200 and 300 in 2020 and 2019, respectively. Government jobs, where federal positions were up 100 and local positions were down 100, showed no employment change in 2020 after employment was up 100 in 2019.
5,000 4,000 3,000 2,000 1,000
0 -1,000 -2,000 -3,000
2,300 2013
Gainesville MSA
2,500
4,200
2,700
3,200
2,400
2014
2015
2016
2017
2018
1,600 2019
-1,900 2020
Employment in the Gainesville MSA dropped by 1,900 in 2020, ending nine straight years of annual average job growth. While battling COVID-19, total employment in 2020 declined to 92,000 from 93,900 in 2019. Goods Producing employment was down by 1,000 over the year while the Private Service Providing sector shed 800 jobs. After growing by 400 in 2019, Trade, Transportation, and Utilities employment was unchanged in 2020. Government employment was down 100 in 2020 after being up 100 in 2019.
Note: MSA = Metropolitan Statistical Area
Source: Georgia Department of Labor, Workforce Statistics & Economic Research
4
MSA Nonfarm Employment
2013 2020 Annual Employment Change
Hinesville MSA
900
600
500
500
400
300
100
100
0
0
-300
-400 -600
-700
-900
2013
2014
2015
2016
2017
2018
2019
2020
In the Hinesville MSA, after being up 500 in 2019, employment declined by 700 in 2020. The job loss in 2020 ends five consecutive years of gains for the MSA. Private ServiceProviding employment decreased by 400 in 2020 after 400 jobs were shed in 2019. The Goods Producing sector, which includes Manufacturing and Construction, endured 200 jobs cut in 2020 after there were 100 jobs lost in 2019. Government employment was flat in 2020 and also held steady in 2019.
3,000
1,500 300
0
Macon-Bibb County MSA
2,000
1,400
800
400
0
100
-1,500
-3,000
-4,500
-6,000
2013
2014
2015
2016
2017
2018
2019
-4,700 2020
Employment in the Macon-Bibb MSA felt the impact of COVID-19 as 4,700 jobs were lost in 2020 after employment grew by 100 in 2019. The MSA's average employment in 2019 was 98,200. Employment in the Private Service-Providing sector was down 3,900 in 2020 after being down 100 in 2019. Trade, Transportation, and Utilities employment decreased by 700 in 2020 after cutting 400 positions in 2019. Professional and Business Services employment rose by 900 in 2020. Government employment contracted by 600 in 2020 after expanding by 200 in 2019.
Rome MSA
1,500
1,000
900
500 200
500
400
400
600
200
0
-500
-1,000
-1,500
-2,000 -2,500
2013
2014
2015
2016
2017
2018
-1,900
2019
2020
Employment in the Rome MSA declined by 1,900 in 2020 after eight consecutive years of job growth. The Private Service-Providing sector lost 1,500 jobs over the year. Manufacturing employment was down 300 in 2020 after being down 300 in 2019 as well. Retail Trade employment lost 100 jobs in 2020 after holding steady in 2019. Education and Health Services saw no change in employment in 2020 after growing by 200 in 2019. Government employment was down 100 in 2020 and down 100 in 2019 as well.
9,000 6,000 3,000
0 -3,000 -6,000 -9,000 -12,000
4,300 2013
Savannah MSA
5,500
6,200
4,700
3,100
5,000
2014
2015
2016
2017
2018
4,100 2019
-9,400 2020
Employment in the Savannah MSA was down 9,400 in 2020 as the area was impacted by COVID-19, ending nine consecutive years of job growth. The Savannah MSA's average total employment in 2020 of 180,500 is down sharply from 189,900 in 2019. Leisure and Hospitality declined by 4,600 jobs over the year after enjoying ten straight years of employment growth. Manufacturing jobs were cut by 1,200 in 2020 after growing by 400 in 2019. Education and Health Services employment declined by 700 in 2020 and Information jobs were cut by 1,000. Government employment fell by 200 in 2020 after growing by 200 in 2019.
Note: MSA = Metropolitan Statistical Area
Source: Georgia Department of Labor, Workforce Statistics & Economic Research
5
MSA Nonfarm Employment
2013 2020 Annual Employment Change
1,200 800 400 0 0 -400
Valdosta MSA
1,000
700
800
500 300
-200
-800
-1,200
-1,600
-1,600
-2,000
2013
2014
2015
2016
2017
2018
2019
2020
3,000
2,000
1,000
0
-1,000
-600
-2,000
-3,000 2013
Warner Robins MSA
2,500
1,800
1,800
1,200
600
-400
2014
2015
2016
2017
2018
-2,100
2019
2020
The Valdosta MSA saw employment decline by 1,600 in 2020 after the area grew by 500 jobs in 2019. The Private ServiceProviding sector lost 900 jobs in 2020 after displaying two consecutive years of job growth. Retail Trade employment was down 200 in 2020 after growing by 100 in 2019. There were 400 Government jobs cut in 2020 after employment was flat in 2019 Federal Government employment held steady in 2020, State Government shed 100 jobs, and Local Government employment dropped by 300 in 2020.
While dealing with the COVID-19 pandemic in 2020, employment in the Warner Robins MSA decreased by 2,100 after growing by 2,500 in 2019. The Private Service-Providing sector saw employment drop by 1,700 in 2020, after five consecutive years of job growth. Retail Trade employment was flat over the year in 2020 and was flat in 2019 as well. Government employment was down 200 in 2020 after growing for the prior three consecutive years. Federal Government jobs were up 100 while State Government and Local Government employment fell by 100 and 200, respectively.
Note: MSA = Metropolitan Statistical Area
Source: Georgia Department of Labor, Workforce Statistics & Economic Research
6
Georgia Nonfarm Employment
(Seasonally Adjusted)
(In thousands)
2020 Preliminary Series
Industry Jan Feb Mar Apr M ay Jun Jul Aug Sep
Total Nonfarm Total Private Goods Producing Service-Providing Private Service-Providing Mining and Logging Mining, Logging and Construction Construction Manufacturing
Durable Goods Non-Durable Goods Trade, Transportation, and Utilities Wholesale Trade Retail Trade Transportation, Warehousing, and Utilities Information Financial Activities Finance and Insurance Real Estate and Rental and Leasing Professional and Business Services Professional, Scientific, and Technical Services Management of Companies and Enterprises Admin and Support, Waste Mngmnt and Remediation Education and Health Services Educational Services Health Care and Social Assistance Leisure and Hospitality Arts, Entertainment, and Recreation Accommodation and Food Services Other Services Government Federal Government State Government Local Government
4,663.2 3,969.2
621.7 4,041.5 3,347.5
9.5 217.4 207.9 404.3 202.1 202.2 951.9 217.0 496.0 238.9 118.6 254.5 181.0 73.5 730.4 288.9 92.2 349.3 616.3 93.8 522.5 507.1 56.9 450.2 168.7 694.0 104.1 167.3 422.6
4,666.5 3,972.8
622.4 4,044.1 3,350.4
9.6 217.9 208.3 404.5 202.1 202.4 951.7 217.1 496.3 238.3 120.1 255.0 181.5 73.5 730.1 289.8 92.5 347.8 616.9 94.1 522.8 508.2 56.9 451.3 168.4 693.7 104.4 166.8 422.5
4,637.0 3,943.0
621.1 4,015.9 3,321.9
9.6 217.8 208.2 403.3 201.5 201.8 949.6 216.9 493.9 238.8 120.6 254.9 181.6 73.3 726.6 289.2 92.6 344.8 615.3 93.0 522.3 487.5 53.2 434.3 167.4 694.0 105.1 166.4 422.5
4,057.0 3,380.0
565.6 3,491.4 2,814.4
9.5 206.1 196.6 359.5 179.1 180.4 860.6 204.4 428.7 227.5 103.8 247.4 180.2 67.2 650.0 276.3 85.3 288.4 546.0 83.6 462.4 285.0 25.7 259.3 121.6 677.0 105.3 164.7 407.0
4,185.3 3,516.0
578.5 3,606.8 2,937.5
9.6 207.3 197.7 371.2 184.9 186.3 881.2 204.9 449.2 227.1 103.0 247.6 180.5 67.1 662.8 279.1 83.3 300.4 564.4 84.1 480.3 341.2 29.6 311.6 137.3 669.3 105.6 163.4 400.3
4,296.2 3,622.2
586.7 3,709.5 3,035.5
9.6 208.1 198.5 378.6 188.6 190.0 908.2 205.7 473.0 229.5 102.0 247.9 180.6 67.3 670.8 278.6 83.8 308.4 577.0 87.0 490.0 386.1 35.1 351.0 143.5 674.0 105.6 162.1 406.3
4,322.6 3,640.8
586.4 3,736.2 3,054.4
9.4 208.2 198.8 378.2 189.4 188.8 912.1 205.4 475.3 231.4 102.9 248.0 180.5 67.5 674.7 278.7 85.7 310.3 577.0 86.8 490.2 393.1 39.2 353.9 146.6 681.8 106.6 159.8 415.4
4,360.1 3,676.5
589.3 3,770.8 3,087.2
9.4 208.8 199.4 380.5 189.8 190.7 920.2 206.0 480.7 233.5 102.7 248.6 180.8 67.8 684.6 279.2 86.9 318.5 581.8 87.2 494.6 400.8 41.7 359.1 148.5 683.6 114.5 161.2 407.9
4,383.8 3,706.5
592.1 3,791.7 3,114.4
9.3 209.4 200.1 382.7 190.6 192.1 926.6 206.2 485.2 235.2 108.5 248.7 180.8 67.9 687.2 279.8 85.9 321.5 584.4 87.5 496.9 408.7 43.7 365.0 150.3 677.3 114.1 160.0 403.2
Oct Nov
4,408.7 3,733.5
593.1 3,815.6 3,140.4
9.3 208.7 199.4 384.4 191.0 193.4 932.1 207.4 488.2 236.5 110.0 250.9 180.8 70.1 694.6 278.2 85.2 331.2 586.9 87.9 499.0 415.2 44.8 370.4 150.7 675.2 110.2 159.7 405.3
4,426.1 3,755.2
594.9 3,831.2 3,160.3
9.4 210.1 200.7 384.8 191.2 193.6 945.2 207.1 489.8 248.3 109.4 250.9 181.0 69.9 698.9 278.5 85.1 335.3 587.8 88.2 499.6 417.9 45.6 372.3 150.2 670.9 106.5 159.1 405.3
Dec
4,449.8 3,778.6
598.9 3,850.9 3,179.7
9.5 209.7 200.2 389.2 194.0 195.2 947.2 206.7 491.6 248.9 110.5 252.7 181.6 71.1 704.2 278.9 84.7 340.6 589.1 88.3 500.8 425.6 46.3 379.3 150.4 671.2 106.9 158.6 405.7
(In thousands)
2019 Final Series
Industry Jan Feb Mar Apr M ay Jun Jul Aug Sep Oct Nov Dec
Total Nonfarm
4,592.1 4,598.5 4,600.6 4,600.3 4,606.5 4,614.3 4,620.7 4,629.0 4,633.5 4,640.5 4,648.3 4,656.4
Total Private
3,905.9 3,910.2 3,911.7 3,910.8 3,916.4 3,924.7 3,929.0 3,932.7 3,939.1 3,947.2 3,955.9 3,963.9
Goods Producing
618.6 618.5 619.1 619.4 619.5 620.0 621.9 621.2 620.5 621.0 621.8 622.0
Service-Providing
3,973.5 3,980.0 3,981.5 3,980.9 3,987.0 3,994.3 3,998.8 4,007.8 4,013.0 4,019.5 4,026.5 4,034.4
Private Service-Providing
3,287.3 3,291.7 3,292.6 3,291.4 3,296.9 3,304.7 3,307.1 3,311.5 3,318.6 3,326.2 3,334.1 3,341.9
Mining and Logging
9.4
9.5
9.5
9.4
9.3 9.4
9.6
9.6
9.5
9.6
9.6
9.6
Mining, Logging and Construction
212.1 212.3 212.7 212.8 212.7 213.5 214.6 215.0 215.3 216.0 216.7 216.8
Construction
202.7 202.8 203.2 203.4 203.4 204.1 205.0 205.4 205.8 206.4 207.1 207.2
Manufacturing
406.5 406.2 406.4 406.6 406.8 406.5 407.3 406.2 405.2 405.0 405.1 405.2
Durable Goods
203.9 203.5 203.6 203.6 203.6 203.2 204.2 203.6 203.2 202.9 202.9 203.0
Non-Durable Goods
202.6 202.7 202.8 203.0 203.2 203.3 203.1 202.6 202.0 202.1 202.2 202.2
Trade, Transportation, and Utilities
942.8 942.0 943.6 943.7 945.0 946.0 949.3 946.5 949.3 949.6 950.4 952.8
Wholesale Trade
216.6 216.6 216.9 216.8 217.3 216.7 216.9 217.1 217.8 217.0 217.1 217.2
Retail Trade
496.4 494.2 494.5 494.2 494.3 494.5 494.1 493.5 494.8 495.5 495.6 496.6
Transportation, Warehousing, and Utilities
229.8 231.2 232.2 232.7 233.4 234.8 238.3 235.9 236.7 237.1 237.7 239.0
Information
117.2 119.4 118.2 116.7 116.9 119.1 117.0 117.5 116.5 116.0 121.7 120.4
Financial Activities
247.2 248.1 248.7 248.8 249.2 249.7 250.2 251.2 251.3 253.2 253.4 253.7
Finance and Insurance
175.9 176.5 176.6 177.3 177.5 177.8 178.4 179.1 179.1 179.7 180.2 180.5
Real Estate and Rental and Leasing
71.3 71.6 72.1 71.5 71.7 71.9 71.8 72.1 72.2 73.5 73.2 73.2
Professional and Business Services
716.5 715.5 714.9 715.2 718.4 721.5 720.7 722.5 724.1 724.2 723.7 726.3
Professional, Scientific, and Technical Services
281.3 281.1 281.1 281.9 282.3 282.8 283.5 284.7 285.7 286.4 286.5 288.0
Management of Companies and Enterprises
90.5 90.9 91.4 90.3 90.9 91.5 90.8 91.1 91.7 91.8 91.7 92.2
Admin and Support, Waste Mngmnt and Remediation
344.7 343.5 342.4 343.0 345.2 347.2 346.4 346.7 346.7 346.0 345.5 346.1
Education and Health Services
600.5 601.7 602.5 603.1 603.8 604.9 605.0 606.7 609.4 612.5 613.2 614.8
Educational Services
91.0 91.0 91.7 91.7 91.5 91.8 91.9 91.3 92.3 93.1 93.2 93.8
Health Care and Social Assistance
509.5 510.7 510.8 511.4 512.3 513.1 513.1 515.4 517.1 519.4 520.0 521.0
Leisure and Hospitality
499.3 500.9 500.0 498.3 498.6 498.7 499.4 500.6 501.0 503.4 504.1 505.9
Arts, Entertainment, and Recreation
55.5 55.8 56.0 56.1 56.0 56.1 56.1 56.3 56.3 56.6 56.5 56.9
Accommodation and Food Services
443.8 445.1 444.0 442.2 442.6 442.6 443.3 444.3 444.7 446.8 447.6 449.0
Other Services
163.8 164.1 164.7 165.6 165.0 164.8 165.5 166.5 167.0 167.3 167.6 168.0
Government
686.2 688.3 688.9 689.5 690.1 689.6 691.7 696.3 694.4 693.3 692.4 692.5
Federal Government
101.4 102.7 102.6 102.9 103.0 103.1 103.4 104.4 104.5 103.8 103.6 103.7
State Government
166.8 167.6 167.7 168.2 168.8 167.4 167.5 171.2 168.9 168.1 167.8 167.4
Local Government
418.0 418.0 418.6 418.4 418.3 419.1 420.8 420.7 421.0 421.4 421.0 421.4
Note: These seasonally adjusted estimates were prepared in cooperation with the U.S. Department of Labor, Bureau of Labor Statistics, based upon monthly reports submitted by selected
employers throughout Georgia. The estimates include all full- and part-time wage and salary workers who were employed during or received pay for any part of the pay period that includes the twelfth
of the month. Proprietors, domestic workers, self-employed persons, unpaid family workers and personnel of the armed forces are excluded. Estimates based on 2020 benchmark.
Source: Georgia Department of Labor, Workforce Statistics & Economic Research
7
Georgia Nonfarm Employment
(Not Seasonally Adjusted)
(In thousands)
2020 Preliminary Series
Industry
Annual Jan Feb Mar Apr M ay Jun Jul Aug Sep Oct Nov Dec Average
Total Nonfarm Total Private Goods Producing Service-Providing Private Service-Providing Mining and Logging Mining, Logging and Construction Construction
Construction of Buildings Heavy and Civil Engineering Construction Specialty Trade Contractors Manufacturing Durable Goods Transportation Equipment Manufacturing Non-Durable Goods Food Manufacturing Textile Mills Textile Product Mills Trade, Transportation, and Utilities Wholesale Trade Merchant Wholesalers, Durable Goods Merchant Wholesalers, Nondurable Goods Wholesale Electronic Markets and Agents and Brokers Retail Trade Food and Beverage Stores General Merchandise Stores Miscellaneous Store Retailers Transportation, Warehousing, and Utilities Utilities Transportation and Warehousing Air Transportation Truck Transportation Couriers and Messengers Warehousing and Storage Information Telecommunications Wired and Wireless Telecommunications Carriers Data Processing, Hosting, and Related Services Financial Activities Finance and Insurance Insurance Carriers and Related Activities Real Estate and Rental and Leasing Professional and Business Services Professional, Scientific, and Technical Services Accounting, Tax Prep, and Bookkeeping Services Architectural, Engineering, and Related Services Computer Systems Design and Related Services Management and Technical Consulting Services Management of Companies and Enterprises Admin and Support, Waste Mngmnt and Remediation Employment Services Education and Health Services Educational Services Colleges, Universities, and Professional Schools Health Care and Social Assistance Ambulatory Health Care Services Hospitals Nursing and Residential Care Facilities Social Assistance Leisure and Hospitality Arts, Entertainment, and Recreation Amusement, Gambling, and Recreation Industries Accommodation and Food Services Accommodation Food Services and Drinking Places Other Services Repair and Maintenance Personal and Laundry Services Religious, Grantmaking, Civic, Professional, and Similar Government Federal Government Department of Defense State Government State Government Educational Services State Government excluding Educational Services Local Government Local Government Educational Services Local Government excluding Educational Services
4,626.7 3,932.6
616.2 4,010.5 3,316.4
9.5 213.3 203.8
45.5 35.3 123.0 402.9 201.3 54.2 201.6 66.4 17.8 27.5 951.1 216.0 115.8 63.2 37.0 492.6 92.6 107.2 22.0 242.5 19.6 222.9 29.7 56.3 33.2 60.3 117.2 37.2 31.9 15.7 253.8 180.6 86.4 73.2 722.2 289.5 38.5 43.1 74.8 48.3 92.0 340.7 169.2 615.5 93.6 45.7 521.9 225.1 159.5 61.7 75.6 489.7 50.8 36.4 438.9 47.4 391.5 166.9 42.0 40.5 84.4 694.1 104.3 43.7 167.2 97.7 69.5 422.6 250.4 172.2
4,646.2 3,948.5
620.8 4,025.4 3,327.7
9.6 216.1 206.5
46.0 36.1 124.4 404.7 202.2 54.5 202.5 66.7 17.8 27.8 943.6 216.6 116.1 63.4 37.1 490.3 93.1 104.9 22.1 236.7 19.6 217.1 30.2 55.7 28.4 59.5 120.4 37.2 31.9 15.9 254.5 181.2 86.8 73.3 726.6 291.7 39.5 43.4 75.0 48.4 92.5 342.4 170.1 620.2 95.8 46.9 524.4 226.4 159.6 62.0 76.4 494.8 51.3 36.5 443.5 48.1 395.4 167.6 42.2 40.9 84.5 697.7 104.1 43.8 169.0 99.5 69.5 424.6 251.9 172.7
4,628.8 3,929.6
620.3 4,008.5 3,309.3
9.6 216.5 206.9
46.0 35.9 125.0 403.8 202.0 54.1 201.8 66.5 17.7 27.6 941.6 216.2 115.9 63.2 37.1 489.1 92.7 105.1 21.7 236.3 19.6 216.7 31.0 55.5 27.9 59.3 121.8 37.2 31.8 16.0 254.1 181.2 87.1 72.9 723.3 289.6 39.2 43.2 73.6 48.2 92.7 341.0 168.6 617.7 94.4 46.9 523.3 225.4 161.0 61.5 75.4 484.5 51.1 36.3 433.4 48.1 385.3 166.3 42.2 39.7 84.4 699.2 104.7 44.0 169.0 99.7 69.3 425.5 251.3 174.2
4,058.7 3,377.8
564.5 3,494.2 2,813.3
9.5 205.4 195.9
43.9 34.4 117.6 359.1 179.0 41.1 180.1 62.9 12.8 21.7 850.9 203.3 108.9 59.4 35.0 425.2 93.5 93.9 15.8 222.4 19.5 202.9 23.6 53.5 27.7 60.4 103.7 36.3 31.1 16.0 247.2 180.0 86.4 67.2 650.4 277.6 36.3 42.3 73.0 46.2 85.5 287.3 129.2 547.5 84.8 44.7 462.7 194.7 152.2 59.1 56.7 292.1 29.3 18.8 262.8 27.4 235.4 121.5 36.8 21.4 63.3 680.9 104.9 44.0 166.6 98.2 68.4 409.4 240.9 168.5
4,193.5 3,520.8
579.1 3,614.4 2,941.7
9.6 207.9 198.3
45.0 33.4 119.9 371.2 185.0 45.4 186.2 64.0 14.0 23.7 874.4 204.1 108.7 60.1 35.3 447.8 96.7 99.4 17.7 222.5 19.6 202.9 21.0 53.9 28.8 61.9 102.3 36.2 31.0 15.8 247.2 180.4 86.8 66.8 661.3 277.5 34.8 42.5 72.6 46.5 83.6 300.2 137.8 566.1 84.7 44.0 481.4 209.3 152.3 58.8 61.0 352.1 33.4 23.5 318.7 28.9 289.8 138.3 38.7 29.6 70.0 672.7 105.3 44.2 164.0 96.7 67.3 403.4 234.5 168.9
4,295.9 4,295.1 4,361.9 4,378.4
3,631.0 3,640.8 3,681.1 3,699.1
590.6 587.7 590.8 593.3
3,705.3 3,707.4 3,771.1 3,785.1
3,040.4 3,053.1 3,090.3 3,105.8
9.6
9.4
9.4
9.3
210.7 209.1 210.1 210.7
201.1 199.7 200.7 201.4
45.8 45.1 44.9 45.3
33.8 33.8 34.1 34.3
121.5 120.8 121.7 121.8
379.9 378.6 380.7 382.6
189.5 189.4 190.0 190.5
49.5 49.3 49.6 50.0
190.4 189.2 190.7 192.1
64.8 64.4 64.4 64.7
14.9 15.0 15.7 16.3
25.1 24.5 25.1 25.6
902.1 905.7 914.7 920.5
205.9 205.2 206.5 206.4
109.5 108.8 109.3 109.1
60.6 60.6 61.0 61.1
35.8 35.8 36.2 36.2
470.3 473.1 476.9 479.6
99.3 96.7 96.7 97.1
102.7 103.8 104.0 105.3
18.9 19.3 19.6 19.7
225.9 227.4 231.3 234.5
19.6 19.6 19.7 19.7
206.3 207.8 211.6 214.8
20.9 23.1 23.7 23.4
54.6 55.1 55.0 55.4
29.6 29.4 30.1 31.6
63.3 61.9 63.0 64.1
101.5 102.1 103.0 108.2
36.3 36.0 35.7 35.6
31.1 30.9 30.5 30.5
15.9 16.1 16.1 16.2
248.4 248.4 249.0 248.3
180.9 180.9 181.0 180.5
87.2 86.8 87.1 87.5
67.5 67.5 68.0 67.8
670.3 675.1 686.7 687.5
277.6 278.2 277.9 276.1
35.0 35.0 34.1 33.8
43.0 42.8 42.9 42.3
71.2 71.7 71.9 71.2
46.5 46.5 46.7 46.7
84.2 86.0 86.6 85.6
308.5 310.9 322.2 325.8
144.6 146.6 156.9 160.6
571.9 569.8 579.6 583.5
84.5 82.0 85.4 88.2
43.1 42.0 42.9 45.1
487.4 487.8 494.2 495.3
214.4 215.6 218.8 219.3
153.7 153.0 153.4 153.8
58.4 57.8 57.4 57.0
60.9 61.4 64.6 65.2
399.9 402.6 407.9 408.0
42.0 44.7 43.9 42.6
32.0 34.9 34.3 32.8
357.9 357.9 364.0 365.4
32.5 33.8 34.1 33.5
325.4 324.1 329.9 331.9
146.3 149.4 149.4 149.8
39.8 39.6 39.7 39.9
32.4 33.4 33.9 33.8
74.1 76.4 75.8 76.1
664.9 654.3 680.8 679.3
105.3 106.5 114.3 113.9
44.3 44.6 44.8 44.8
156.0 151.7 159.6 161.6
87.8 84.5 92.6 95.0
68.2 67.2 67.0 66.6
403.6 396.1 406.9 403.8
229.9 225.0 234.0 233.5
173.7 171.1 172.9 170.3
4,435.9 3,754.3
593.7 3,842.2 3,160.6
9.3 209.3 200.0
44.9 35.1 120.0 384.4 190.4 50.3 194.0 65.5 16.1 25.4 934.1 207.8 109.1 61.1 37.6 487.4 96.9 109.7 20.1 238.9 19.7 219.2 23.4 56.2 33.3 65.7 112.0 35.5 30.3 16.4 251.9 180.8 87.3 71.1 702.9 279.2 33.8 42.7 72.5 47.0 85.4 338.3 170.6 594.4 91.3 47.0 503.1 223.7 154.4 57.0 68.0 414.6 43.2 33.2 371.4 32.6 338.8 150.7 40.5 34.7 75.5 681.6 110.7 45.0 162.9 96.2 66.7 408.0 236.3 171.7
4,468.2 3,789.1
595.3 3,872.9 3,193.8
9.4 210.2 200.8
44.5 34.5 121.8 385.1 191.1 50.4 194.0 66.2 16.0 25.2 963.4 207.6 108.6 61.2 37.8 503.3 98.7 117.0 20.1 252.5 19.7 232.8 23.3 56.6 39.9 70.7 111.8 35.5 30.3 16.4 251.1 180.8 87.6 70.3 709.4 279.6 33.9 42.6 71.1 48.4 85.0 344.8 176.4 593.3 91.1 46.8 502.2 222.8 153.9 57.0 68.5 416.0 43.5 32.9 372.5 33.3 339.2 148.8 39.9 33.7 75.2 679.1 107.7 45.1 162.0 96.0 66.0 409.4 236.3 173.1
4,488.3 3,811.1
599.9 3,888.4 3,211.2
9.5 209.2 199.7
44.0 34.3 121.4 390.7 194.2 50.8 196.5 66.9 15.9 25.6 969.3 207.8 109.2 61.0 37.6 504.3 98.7 113.7 20.0 257.2 19.6 237.6 23.3 56.4 43.4 71.1 110.9 35.7 30.4 16.5 253.9 181.4 87.3 72.5 713.8 281.6 36.3 42.8 69.3 48.7 85.1 347.1 177.1 593.3 90.3 46.0 503.0 224.7 154.9 56.9 66.5 420.3 42.8 32.6 377.5 32.6 344.9 149.7 40.2 34.3 75.2 677.2 108.7 45.3 160.0 94.2 65.8 408.5 236.7 171.8
4,406.5 3,726.3
596.0 3,810.5 3,130.3
9.5 210.7 201.2
45.1 34.6 121.6 385.3 192.1 49.9 193.3 65.3 15.8 25.4 922.6 208.6 110.8 61.3 36.5 478.3 96.1 105.6 19.8 235.7 19.6 216.1 24.7 55.4 31.9 63.4 109.6 36.2 31.0 16.1 250.7 180.8 87.0 69.8 694.1 281.3 35.9 42.8 72.3 47.3 87.0 325.8 159.0 587.7 88.8 45.1 498.9 218.4 155.1 58.7 66.7 415.2 43.2 32.0 372.0 36.0 336.0 150.4 40.1 34.0 76.2 680.2 107.5 44.5 162.5 94.8 67.6 410.2 238.4 171.8
Note: These not seasonally adjusted estimates were prepared in cooperation with the U.S. Department of Labor, Bureau of Labor Statistics, based upon monthly reports submit-
ted by selected employers throughout Georgia. The estimates include all full- and part-time wage and salary workers who were employed during or received pay for any part of the pay period that includes the twelfth of the month. Proprietors, domestic workers, self-employed persons, unpaid family workers and personnel of the armed forces are excluded. Estimates based on 2020 benchmark.
Source: Georgia Department of Labor, Workforce Statistics & Economic Research
8
Georgia Nonfarm Employment
(Not Seasonally Adjusted)
(In thousands)
2019 Final Series
Industry
Annual Jan Feb Mar Apr M ay Jun Jul Aug Sep Oct Nov Dec Average
Total Nonfarm Total Private Goods Producing Service-Providing Private Service-Providing Mining and Logging Mining, Logging and Construction Construction
Construction of Buildings Heavy and Civil Engineering Construction Specialty Trade Contractors Manufacturing Durable Goods Transportation Equipment Manufacturing Non-Durable Goods Food Manufacturing Textile Mills Textile Product Mills Trade, Transportation, and Utilities Wholesale Trade Merchant Wholesalers, Durable Goods Merchant Wholesalers, Nondurable Goods Wholesale Electronic Markets and Agents and Brokers Retail Trade Food and Beverage Stores General Merchandise Stores Miscellaneous Store Retailers Transportation, Warehousing, and Utilities Utilities Transportation and Warehousing Air Transportation Truck Transportation Couriers and Messengers Warehousing and Storage Information Telecommunications Wired and Wireless Telecommunications Carriers Data Processing, Hosting, and Related Services Financial Activities Finance and Insurance Insurance Carriers and Related Activities Real Estate and Rental and Leasing Professional and Business Services Professional, Scientific, and Technical Services Accounting, Tax Prep, and Bookkeeping Services Architectural, Engineering, and Related Services Computer Systems Design and Related Services Management and Technical Consulting Services Management of Companies and Enterprises Admin and Support, Waste Mngmnt and Remediation Employment Services Education and Health Services Educational Services Colleges, Universities, and Professional Schools Health Care and Social Assistance Ambulatory Health Care Services Hospitals Nursing and Residential Care Facilities Social Assistance Leisure and Hospitality Arts, Entertainment, and Recreation Amusement, Gambling, and Recreation Industries Accommodation and Food Services Accommodation Food Services and Drinking Places Other Services Repair and Maintenance Personal and Laundry Services Religious, Grantmaking, Civic, Professional, and Similar Government Federal Government Department of Defense State Government State Government Educational Services State Government excluding Educational Services Local Government Local Government Educational Services Local Government excluding Educational Services
4,548.0 3,861.8
612.5 3,935.5 3,249.3
9.4 207.5 198.1
43.2 32.6 122.3 405.0 203.1 55.0 201.9 64.2 19.2 28.8 940.1 215.3 114.3 64.4 36.6 492.9 92.7 108.8 21.6 231.9 19.2 212.7 29.7 54.6 30.2 54.8 115.9 39.2 33.9 13.9 245.9 175.5 83.4 70.4 706.1 281.2 37.2 41.6 72.5 46.9 90.4 334.5 163.6 598.6 90.5 44.7 508.1 214.3 161.4 59.9 72.5 481.1 49.5 34.9 431.6 47.2 384.4 161.6 40.8 39.1 81.7 686.2 101.7 42.8 166.5 96.2 70.3 418.0 248.6 169.4
4,574.9 3,882.7
616.5 3,958.4 3,266.2
9.5 210.3 200.8
43.6 33.0 124.2 406.2 203.6 55.5 202.6 64.7 19.2 28.5 933.8 216.3 114.8 64.7 36.8 488.1 92.9 104.7 21.9 229.4 19.2 210.2 30.3 54.5 26.9 55.2 119.7 39.0 33.8 14.0 247.3 176.2 83.8 71.1 710.5 283.1 38.9 41.8 72.5 46.4 90.9 336.5 164.4 604.2 92.5 45.7 511.7 217.2 160.6 60.1 73.8 487.9 50.5 35.1 437.4 47.9 389.5 162.8 41.3 39.2 82.3 692.2 102.6 42.9 169.6 99.3 70.3 420.0 250.1 169.9
4,592.0 3,897.9
618.3 3,973.7 3,279.6
9.5 211.6 202.1 43.5 33.6 125.0 406.7 204.0 55.6 202.7 64.7 19.2 28.6 936.2 216.3 114.7 64.9 36.7 489.7 92.5 104.7 21.8 230.2 19.3 210.9 30.7 54.7 27.0 55.3 119.2 38.9 33.8 14.2 247.8 176.2 84.5 71.6 711.5 281.6 37.9 42.0 71.7 46.5 91.4 338.5 165.0 604.6 93.0 46.1 511.6 217.8 159.9 60.2 73.7 496.6 53.7 38.1 442.9 48.7 394.2 163.7 41.5 39.6 82.6 694.1 102.3 43.0 170.2 99.9 70.3 421.6 250.2 171.4
4,598.8 3,904.9
617.4 3,981.4 3,287.5
9.4 211.1 201.7 43.7 33.7 124.3 406.3 203.6 55.4 202.7 64.6 19.1 28.9 934.4 215.6 114.7 64.4 36.5 490.3 91.7 104.3 22.0 228.5 19.2 209.3 29.7 55.0 25.6 55.8 116.7 38.3 33.2 14.5 248.2 177.1 85.1 71.1 713.2 283.1 37.5 42.5 72.7 46.7 90.5 339.6 166.5 604.8 93.3 45.7 511.5 218.8 158.7 60.4 73.6 504.8 59.5 43.0 445.3 48.7 396.6 165.4 41.8 40.6 83.0 693.9 102.7 42.7 170.2 100.1 70.1 421.0 249.0 172.0
4,615.2 4,613.8 4,590.5 4,634.8 4,628.0
3,921.6 3,933.3 3,927.1 3,941.9 3,931.5
620.2 623.7 623.8 623.1 621.7
3,995.0 3,990.1 3,966.7 4,011.7 4,006.3
3,301.4 3,309.6 3,303.3 3,318.8 3,309.8
9.3
9.4
9.6
9.6
9.5
213.6 215.9 216.5 216.8 216.6
204.3 206.5 206.9 207.2 207.1
44.4 45.1 45.5 45.6 45.6
34.4 35.4 35.6 36.0 36.1
125.5 126.0 125.8 125.6 125.4
406.6 407.8 407.3 406.3 405.1
203.6 204.1 204.2 203.8 203.0
55.1 55.4 55.6 55.3 55.1
203.0 203.7 203.1 202.5 202.1
64.9 65.5 65.6 65.7 65.9
19.0 18.8 18.7 18.7 18.4
28.9 29.1 28.2 28.0 28.0
938.7 940.2 942.7 940.6 942.5
216.5 216.9 216.9 217.2 217.8
115.0 115.5 115.7 115.5 115.6
64.7 64.5 64.3 64.7 64.8
36.8 36.9 36.9 37.0 37.4
492.6 491.6 491.7 489.7 489.2
92.2 91.6 91.9 91.9 91.6
105.7 105.5 105.7 105.6 106.5
22.3 22.3 22.3 22.4 22.4
229.6 231.7 234.1 233.7 235.5
19.3 19.4 19.5 19.4 19.5
210.3 212.3 214.6 214.3 216.0
29.9 30.1 30.7 29.8 30.3
55.7 56.2 56.9 57.1 56.7
25.7 26.5 26.8 26.9 27.4
55.5 56.1 56.8 57.1 58.3
116.4 118.7 116.3 117.7 116.2
38.2 38.4 38.2 37.7 37.4
33.1 33.3 32.9 32.4 32.2
14.5 14.5 14.5 14.8 14.9
249.1 250.1 250.7 251.6 250.9
177.4 178.0 178.8 179.3 178.8
85.2 85.6 86.0 86.2 86.1
71.7 72.1 71.9 72.3 72.1
716.0 721.0 719.4 726.9 724.5
280.4 281.8 283.2 283.6 281.8
33.9 34.6 34.4 34.6 34.2
42.9 43.0 43.2 43.1 42.8
72.8 72.3 73.2 73.5 73.0
47.0 47.3 47.6 47.9 47.7
91.1 91.9 91.1 90.8 91.3
344.5 347.3 345.1 352.5 351.4
169.3 171.8 170.4 176.3 176.0
605.6 599.5 596.6 605.8 608.7
92.2 89.1 87.1 89.6 93.1
44.4 43.4 43.7 44.0 46.2
513.4 510.4 509.5 516.2 515.6
219.5 219.2 221.0 222.7 222.0
159.1 159.5 157.7 158.0 158.2
60.7 60.5 60.9 61.5 61.7
74.1 71.2 69.9 74.0 73.7
509.8 512.5 509.6 508.7 500.4
59.7 63.0 62.0 58.8 55.3
42.7 46.0 46.0 43.0 39.8
450.1 449.5 447.6 449.9 445.1
49.6 50.0 50.1 49.3 48.9
400.5 399.5 397.5 400.6 396.2
165.8 167.6 168.0 167.5 166.6
42.1 42.2 42.1 42.0 42.1
40.2 40.4 40.4 40.5 40.4
83.5 85.0 85.5 85.0 84.1
693.6 680.5 663.4 692.9 696.5
102.6 102.8 103.1 104.2 104.3
42.9 43.0 43.2 43.2 43.2
169.3 161.3 159.2 169.1 170.7
99.2 91.0 88.8 98.8 100.6
70.1 70.3 70.4 70.3 70.1
421.7 416.4 401.1 419.6 421.5
249.0 240.7 226.0 245.6 248.9
172.7 175.7 175.1 174.0 172.6
4,656.2 3,957.0
621.6 4,034.6 3,335.4
9.6 217.4 207.8
46.4 36.1 125.3 404.2 202.2 54.4 202.0 66.1 18.3 27.9 951.0 217.7 115.8 64.8 37.1 495.2 92.2 108.6 22.7 238.1 19.5 218.6 30.5 56.4 28.5 59.5 116.9 37.4 32.1 15.2 253.8 180.0 86.4 73.8 729.8 286.7 35.1 43.2 74.7 48.6 91.5 351.6 176.3 615.9 95.1 47.1 520.8 224.4 158.1 62.0 76.3 500.9 56.0 39.1 444.9 49.0 395.9 167.1 42.2 40.4 84.5 699.2 103.8 43.4 171.0 101.0 70.0 424.4 251.2 173.2
4,691.2 3,989.2
622.0 4,069.2 3,367.2
9.6 217.0 207.4
46.0 36.2 125.2 405.0 202.4 54.5 202.6 66.7 18.1 28.0 975.9 218.3 116.0 65.1 37.2 512.3 93.9 116.4 22.7 245.3 19.5 225.8 29.8 56.7 33.3 61.4 123.2 37.4 32.1 15.3 254.1 180.5 86.7 73.6 732.0 288.1 35.8 43.1 75.1 48.9 91.7 352.2 178.0 617.1 95.0 46.9 522.1 225.2 158.5 61.9 76.5 498.5 53.4 37.6 445.1 48.9 396.2 166.4 42.1 40.5 83.8 702.0 104.3 43.7 170.7 101.1 69.6 427.0 251.8 175.2
4,695.2 3,996.8
623.0 4,072.2 3,373.8
9.6 216.6 207.0
46.2 36.2 124.6 406.4 203.5 54.8 202.9 66.9 18.0 28.0 983.9 218.9 116.1 65.0 37.8 514.9 94.2 116.8 22.5 250.1 19.7 230.4 29.9 56.8 37.9 61.1 119.8 37.4 32.1 15.5 254.8 180.8 86.8 74.0 731.6 290.0 37.1 43.1 74.6 49.2 92.1 349.5 177.5 617.7 94.4 46.8 523.3 226.3 159.3 61.7 76.0 499.1 53.4 37.7 445.7 48.7 397.0 166.9 42.0 40.8 84.1 698.4 104.7 43.7 169.3 100.0 69.3 424.4 251.6 172.8
4,619.9 3,928.8
620.3 3,999.6 3,308.5
9.5 214.2 204.7
44.9 34.9 124.9 406.1 203.4 55.1 202.7 65.5 18.7 28.4 946.7 217.0 115.3 64.7 37.0 494.9 92.4 107.8 22.2 234.8 19.4 215.5 30.1 55.9 28.6 57.2 118.1 38.1 32.9 14.7 250.4 178.2 85.5 72.1 720.2 283.7 35.9 42.7 73.2 47.6 91.2 345.3 171.3 606.6 92.1 45.4 514.5 220.7 159.1 61.0 73.8 500.8 56.2 40.3 444.6 48.9 395.7 165.8 41.9 40.2 83.8 691.1 103.3 43.1 168.1 98.0 70.1 419.7 246.9 172.8
Note: These not seasonally adjusted estimates were prepared in cooperation with the U.S. Department of Labor, Bureau of Labor Statistics, based upon monthly reports submit-
ted by selected employers throughout Georgia. The estimates include all full- and part-time wage and salary workers who were employed during or received pay for any part of the pay period that includes the twelfth of the month. Proprietors, domestic workers, self-employed persons, unpaid family workers and personnel of the armed forces are excluded. Estimates based on 2020 benchmark.
Source: Georgia Department of Labor, Workforce Statistics & Economic Research
9
(In thousands)
Industry Total Nonfarm Total Private Goods Producing Service-Providing Private Service-Providing Trade, Transportation, and Utilities
Retail Trade Government
Federal Government State Government Local Government
albany msa Nonfarm Employment
(Not Seasonally Adjusted)
2020 Preliminary Series
Annual Jan Feb Mar Apr M ay Jun Jul Aug Sep Oct Nov Dec Average
63.0 63.2 62.8 56.2 57.7 59.2 58.8 59.4 59.6 59.9 60.0 60.4 60.0
50.8 50.8 50.5 44.2 45.8 47.5 47.2 47.6 47.8 48.2 48.4 48.7 48.1
6.9
7.0
7.0
6.4
6.5
6.5 6.6
6.5
6.5
6.5
6.5
6.6
6.6
56.1 56.2 55.8 49.8 51.2 52.7 52.2 52.9 53.1 53.4 53.5 53.8 53.4
43.9 43.8 43.5 37.8 39.3 41.0 40.6 41.1 41.3 41.7 41.9 42.1 41.5
12.6 12.4 12.4 11.3 11.6 12.2 12.1 12.2 12.3 12.3 12.5 12.5 12.2
7.3
7.2
7.1
6.3
6.5
6.9 7.0
7.1
7.1
7.3
7.4
7.4
7.1
12.2 12.4 12.3 12.0 11.9 11.7 11.6 11.8 11.8 11.7 11.6 11.7 11.9
2.7
2.7
2.7
2.7
2.7
2.7 2.8
2.9
2.9
2.8
2.7
2.7
2.8
2.3
2.5
2.4
2.3
2.3
2.1 2.1
2.2
2.3
2.3
2.3
2.3
2.3
7.2
7.2
7.2
7.0
6.9
6.9 6.7
6.7
6.6
6.6
6.6
6.7
6.9
(In thousands)
2019 Final Series
Industry Total Nonfarm Total Private Goods Producing Service-Providing Private Service-Providing Trade, Transportation, and Utilities
Retail Trade Government
Federal Government State Government Local Government
Annual Jan Feb Mar Apr M ay Jun Jul Aug Sep Oct Nov Dec Average
61.9 62.2 62.6 63.1 63.0 63.1 62.1 62.7 62.8 62.9 63.2 63.5 62.8
49.7 49.8 50.1 50.6 50.6 50.7 50.2 50.3 50.4 50.5 50.9 51.2 50.4
6.9
7.0
6.9
6.9
6.9
6.8 6.9
6.8
6.8
6.7
6.8
6.8
6.9
55.0 55.2 55.7 56.2 56.1 56.3 55.2 55.9 56.0 56.2 56.4 56.7 55.9
42.8 42.8 43.2 43.7 43.7 43.9 43.3 43.5 43.6 43.8 44.1 44.4 43.6
12.5 12.5 12.6 12.6 12.6 12.6 12.5 12.5 12.6 12.6 12.9 13.0 12.6
7.7
7.7
7.7
7.7
7.6
7.6 7.5
7.5
7.4
7.5
7.7
7.7
7.6
12.2 12.4 12.5 12.5 12.4 12.4 11.9 12.4 12.4 12.4 12.3 12.3 12.3
2.6
2.7
2.7
2.7
2.7
2.7 2.7
2.7
2.7
2.7
2.7
2.7
2.7
2.4
2.5
2.5
2.5
2.5
2.4 2.3
2.4
2.5
2.5
2.4
2.4
2.4
7.2
7.2
7.3
7.3
7.2
7.3 6.9
7.3
7.2
7.2
7.2
7.2
7.2
Note: These not seasonally adjusted estimates were prepared in cooperation with the U.S. Department of Labor, Bureau of Labor Statistics, based upon monthly reports submitted by selected
employers in the Albany Metropolitan Statistical Area, which includes Baker, Dougherty, Lee, Terrell and Worth counties. The estimates include all full- and part-time wage and salary workers who were employed during or received pay for any part of the pay period that includes the twelfth of the month. Proprietors, domestic workers, self-employed persons, unpaid family workers and personnel of the armed forces are excluded. Estimates based on 2020 benchmark.
Source: Georgia Department of Labor, Workforce Statistics & Economic Research
10
athens-clarke county msa Nonfarm Employment
(In thousands)
Industry Total Nonfarm Total Private Goods Producing Service-Providing Private Service-Providing Trade, Transportation, and Utilities
Retail Trade Professional and Business Services Leisure and Hospitality Government
Federal Government State Government Local Government
(Not Seasonally Adjusted)
2020 Preliminary Series
Annual Jan Feb Mar Apr M ay Jun Jul Aug Sep Oct Nov Dec Average
97.9 98.3 96.9 84.6 87.3 88.8 88.2 91.1 91.9 93.4 93.7 93.4 92.1
69.3 69.7 68.3 57.0 59.9 62.7 62.3 63.2 64.1 65.2 65.6 65.6 64.4
9.5
9.6
9.5
8.8
9.1
9.2 9.0
9.1
9.2
9.3
9.3
9.3
9.2
88.4 88.7 87.4 75.8 78.2 79.6 79.2 82.0 82.7 84.1 84.4 84.1 82.9
59.8 60.1 58.8 48.2 50.8 53.5 53.3 54.1 54.9 55.9 56.3 56.3 55.2
16.7 16.5 16.3 13.7 14.0 15.2 15.4 15.5 15.7 15.9 16.4 16.5 15.7
10.9 10.8 10.7
8.9
9.4
9.8 9.9 10.0 10.2 10.4 10.7 10.6 10.2
8.7
9.0
8.9
7.7
7.9
8.2 8.0
8.0
8.2
8.4
8.4
8.5
8.3
11.4 11.5 10.7
6.5
7.8
8.7 8.6
9.2
9.5
9.6
9.7
9.6
9.4
28.6 28.6 28.6 27.6 27.4 26.1 25.9 27.9 27.8 28.2 28.1 27.8 27.7
1.1
1.0
1.0
1.0
1.0
1.0 1.0
1.1
1.1
1.2
1.2
1.2
1.1
19.4 19.5 19.4 19.0 18.8 17.4 17.3 18.8 18.9 19.1 18.8 18.5 18.7
8.1
8.1
8.2
7.6
7.6
7.7 7.6
8.0
7.8
7.9
8.1
8.1
7.9
(In thousands)
2019 Final Series
Industry
Annual Jan Feb Mar Apr M ay Jun Jul Aug Sep Oct Nov Dec Average
Total Nonfarm Total Private
96.0 96.9 96.4 97.8 97.0 96.1 95.9 99.2 99.3 99.5 100.1 99.3 97.8 67.7 68.5 68.2 69.5 68.9 68.7 68.6 69.1 69.4 70.3 70.9 70.5 69.2
Goods Producing Service-Providing Private Service-Providing
10.0 10.1 10.1 10.2 10.0 10.0 9.9
9.9
9.6
9.6
9.7
9.6
9.9
86.0 86.8 86.3 87.6 87.0 86.1 86.0 89.3 89.7 89.9 90.4 89.7 87.9
57.7 58.4 58.1 59.3 58.9 58.7 58.7 59.2 59.8 60.7 61.2 60.9 59.3
Trade, Transportation, and Utilities Retail Trade
Professional and Business Services
16.2 16.2 16.2 16.5 16.3 16.2 16.2 16.4 16.5 16.7 17.1 17.2 16.5
10.5 10.6 10.5 10.8 10.6 10.6 10.6 10.7 10.8 11.0 11.3 11.3 10.8
8.0
8.1
8.1
8.4
8.3
8.6 8.8
8.7
8.9
9.3
9.4
9.3
8.7
Leisure and Hospitality Government
Federal Government
11.3 11.6 11.4 11.7 11.6 11.2 11.1 11.5 11.8 11.9 11.8 11.5 11.5
28.3 28.4 28.2 28.3 28.1 27.4 27.3 30.1 29.9 29.2 29.2 28.8 28.6
1.1
1.1
1.0
1.0
1.0
1.0 1.0
1.0
1.1
1.1
1.2
1.2
1.1
State Government Local Government
19.2 19.3 19.2 19.2 19.0 18.6 18.7 21.1 20.8 19.9 19.9 19.6 19.5
8.0
8.0
8.0
8.1
8.1
7.8 7.6
8.0
8.0
8.2
8.1
8.0
8.0
Note: These not seasonally adjusted estimates were prepared in cooperation with the U.S. Department of Labor, Bureau of Labor Statistics, based upon monthly reports submitted by selected
employers in the Athens-Clarke County Metropolitan Statistical Area, which includes Clarke, Madison, Oconee and Oglethorpe counties. The estimates include all full- and part-time wage and salary workers who were employed during or received pay for any part of the pay period that includes the twelfth of the month. Proprietors, domestic workers, self-employed persons, unpaid family workers and personnel of the armed forces are excluded. Estimates based on 2020 benchmark.
Source: Georgia Department of Labor, Workforce Statistics & Economic Research
11
atlanta msa Nonfarm Employment
(Not Seasonally Adjusted)
(In thousands)
2020 Preliminary Series
Industry
Annual Jan Feb Mar Apr M ay Jun Jul Aug Sep Oct Nov Dec Average
Total Nonfarm
2,858.4 2,867.9 2,853.7 2,486.4 2,561.2 2,625.1 2,628.9 2,668.8 2,676.0 2,705.1 2,723.2 2,741.6 2,699.7
Total Private
2,520.6 2,528.4 2,513.4 2,155.0 2,232.9 2,301.1 2,311.4 2,337.3 2,345.7 2,374.2 2,393.3 2,411.9 2,368.8
Goods Producing
302.0 304.0 303.9 279.9 285.6 291.4 290.4 291.2 291.5 291.6 291.6 295.2 293.2
Service-Providing
2,556.4 2,563.9 2,549.8 2,206.5 2,275.6 2,333.7 2,338.5 2,377.6 2,384.5 2,413.5 2,431.6 2,446.4 2,406.5
Private Service-Providing
2,218.6 2,224.4 2,209.5 1,875.1 1,947.3 2,009.7 2,021.0 2,046.1 2,054.2 2,082.6 2,101.7 2,116.7 2,075.6
Mining and Logging
1.7
1.7
1.7
1.6
1.6
1.6 1.6
1.6
1.6
1.6
1.7
1.7
1.6
Mining, Logging and Construction
130.8 132.6 132.8 125.8 127.8 129.3 128.6 129.4 129.6 128.2 129.0 129.8 129.5
Construction
129.1 130.9 131.1 124.2 126.2 127.7 127.0 127.8 128.0 126.6 127.3 128.1 127.8
Construction of Buildings
29.7 29.9 29.8 28.9 29.4 29.9 29.4 29.4 29.6 29.0 28.7 28.0 29.3
Specialty Trade Contractors
81.8 82.9 83.4 78.0 79.1 79.9 79.7 80.4 80.5 79.5 80.4 81.5 80.6
Manufacturing
171.2 171.4 171.1 154.1 157.8 162.1 161.8 161.8 161.9 163.4 162.6 165.4 163.7
Durable Goods
90.0 90.3 90.3 81.4 83.4 85.7 85.6 85.3 85.4 85.7 85.3 87.2 86.3
Transportation Equipment Manufacturing
15.7 15.7 15.6 11.4 12.5 14.5 14.4 14.5 14.5 14.6 14.6 14.8 14.4
Non-Durable Goods
81.2 81.1 80.8 72.7 74.4 76.4 76.2 76.5 76.5 77.7 77.3 78.2 77.4
Food Manufacturing
23.8 23.4 23.4 21.1 21.6 22.2 22.5 22.4 22.6 22.7 22.9 22.9 22.6
Trade, Transportation, and Utilities
606.7 601.2 600.7 538.8 550.9 568.3 570.5 575.9 577.8 583.7 602.1 606.5 581.9
Wholesale Trade
154.2 154.4 154.3 145.6 146.1 146.0 145.5 146.2 145.8 146.2 146.8 147.2 148.2
Merchant Wholesalers, Durable Goods
85.3 85.5 85.4 81.5 81.2 80.5 80.1 80.3 80.0 79.8 79.5 79.9 81.6
Merchant Wholesalers, Nondurable Goods
40.4 40.4 40.2 37.3 37.8 38.2 38.0 38.2 38.1 37.9 37.8 37.9 38.5
Wholesale Electronic Markets and Agents and Brokers
28.5 28.5 28.7 26.8 27.1 27.3 27.4 27.7 27.7 28.5 29.5 29.4 28.1
Retail Trade
289.0 287.0 286.3 243.0 255.7 271.3 273.1 275.9 276.3 279.5 288.9 290.2 276.4
Food and Beverage Stores
57.5 57.9 57.7 58.2 60.4 62.1 60.1 60.0 60.2 59.9 61.7 61.6 59.8
General Merchandise Stores
58.7 57.2 57.1 48.4 51.4 54.0 54.6 54.8 55.2 57.8 62.8 62.2 56.2
Miscellaneous Store Retailers
14.7 14.8 14.5 10.4 11.6 12.5 12.8 12.9 12.9 13.2 13.2 13.2 13.1
Transportation, Warehousing, and Utilities
163.5 159.8 160.1 150.2 149.1 151.0 151.9 153.8 155.7 158.0 166.4 169.1 157.4
Utilities
10.2 10.3 10.2 10.1 10.2 10.2 10.2 10.2 10.2 10.2 10.2 10.1 10.2
Transportation and Warehousing
153.3 149.5 149.9 140.1 138.9 140.8 141.7 143.6 145.5 147.8 156.2 159.0 147.2
Air Transportation
29.2 29.6 30.5 23.2 20.5 20.5 22.7 23.3 23.0 22.9 22.9 22.9 24.3
Truck Transportation
35.6 35.2 35.0 34.0 34.1 34.5 34.9 34.9 35.2 35.5 35.5 35.4 35.0
Couriers and Messengers
24.9 21.7 21.3 21.0 21.7 22.2 22.0 22.3 23.4 24.5 29.0 31.5 23.8
Information
102.7 106.0 104.6 90.9 89.6 88.8 89.8 90.7 95.3 98.3 98.8 97.9 96.1
Telecommunications
31.1 31.1 31.1 30.4 30.4 30.5 30.3 30.0 30.0 29.9 29.9 30.1 30.4
Wired and Wireless Telecommunications Carriers
26.7 26.7 26.7 26.2 26.1 26.2 26.1 25.7 25.7 25.6 25.6 25.8 26.1
Data Processing, Hosting, and Related Services
15.1 15.4 15.4 15.5 15.3 15.4 15.6 15.5 15.7 15.8 15.8 15.8 15.5
Financial Activities
180.3 180.8 180.7 176.2 175.8 176.8 177.2 177.4 177.2 180.3 179.4 181.8 178.7
Finance and Insurance
126.0 126.5 126.6 126.1 126.4 127.1 127.7 127.7 127.7 128.2 128.1 128.9 127.3
Insurance Carriers and Related Activities
61.4 61.7 61.9 61.5 61.7 61.9 61.9 62.0 62.5 62.1 62.0 61.6 61.9
Real Estate and Rental and Leasing
54.3 54.3 54.1 50.1 49.4 49.7 49.5 49.7 49.5 52.1 51.3 52.9 51.4
Professional and Business Services
550.3 552.7 549.9 497.0 502.5 508.1 513.6 522.0 521.7 528.5 533.4 535.6 526.3
Professional, Scientific, and Technical Services
234.0 235.4 233.2 224.6 224.2 223.8 225.1 224.9 223.1 224.3 223.7 225.1 226.8
Accounting, Tax Prep, and Bookkeeping Services
27.6 28.2 28.0 26.3 25.4 25.6 25.7 25.1 24.8 24.9 25.3 26.6 26.1
Architectural, Engineering, and Related Services
33.0 33.2 33.0 32.4 32.4 32.8 32.7 32.8 32.3 32.4 32.2 32.2 32.6
Computer Systems Design and Related Services
64.3 64.4 63.1 62.9 62.7 61.2 62.1 62.2 61.4 61.8 60.9 59.4 62.2
Management and Technical Consulting Services
42.6 42.6 42.2 40.7 40.9 40.8 40.9 41.1 41.0 41.4 42.1 42.5 41.6
Management of Companies and Enterprises
80.6 81.1 81.4 74.5 72.7 73.3 75.0 75.7 74.9 74.4 74.3 74.1 76.0
Admin and Support, Waste Mngmnt and Remediation
235.7 236.2 235.3 197.9 205.6 211.0 213.5 221.4 223.7 229.8 235.4 236.4 223.5
Employment Services
120.1 120.0 118.7 93.2 98.8 103.1 105.1 112.1 114.3 120.7 123.7 123.4 112.8
Education and Health Services
374.3 376.6 375.6 328.4 341.1 345.6 344.0 351.1 352.9 358.4 357.6 359.3 355.4
Educational Services
66.4 67.3 66.5 59.5 60.0 60.6 58.7 60.8 62.3 64.6 64.2 64.1 62.9
Health Care and Social Assistance
307.9 309.3 309.1 268.9 281.1 285.0 285.3 290.3 290.6 293.8 293.4 295.2 292.5
Ambulatory Health Care Services
140.3 141.2 140.8 120.1 129.7 133.3 134.3 136.7 136.9 137.6 137.3 139.6 135.7
Hospitals
89.0 89.0 90.2 84.8 84.6 85.4 84.5 84.9 85.2 85.6 85.4 86.2 86.2
Social Assistance
48.2 48.8 48.1 34.9 37.9 37.6 38.2 40.6 40.7 42.6 41.9 40.2 41.6
Leisure and Hospitality
298.4 300.7 292.6 167.9 200.9 230.9 232.6 235.4 235.6 239.9 239.2 243.7 243.2
Arts, Entertainment, and Recreation
36.8 37.0 37.0 20.8 22.8 28.9 30.7 30.2 29.2 29.3 28.8 28.9 30.0
Accommodation and Food Services
261.6 263.7 255.6 147.1 178.1 202.0 201.9 205.2 206.4 210.6 210.4 214.8 213.1
Accommodation
26.1 26.4 26.2 14.4 14.4 15.4 16.0 16.2 15.9 15.7 15.8 15.7 18.2
Food Services and Drinking Places
235.5 237.3 229.4 132.7 163.7 186.6 185.9 189.0 190.5 194.9 194.6 199.1 194.9
Other Services
105.9 106.4 105.4 75.9 86.5 91.2 93.3 93.6 93.7 93.5 91.2 91.9 94.0
Repair and Maintenance
25.2 25.3 25.2 21.3 22.7 23.4 23.3 23.4 23.3 23.7 22.7 23.2 23.6
Personal and Laundry Services
29.1 29.4 28.4 14.3 20.1 22.1 23.1 23.4 23.4 23.7 22.9 23.4 23.6
Government
337.8 339.5 340.3 331.4 328.3 324.0 317.5 331.5 330.3 330.9 329.9 329.7 330.9
Federal Government
47.7 47.6 47.8 47.9 48.1 48.1 48.9 53.1 53.1 51.4 50.1 50.7 49.5
State Government
74.1 74.5 74.5 73.6 72.4 69.5 67.1 70.7 71.6 71.9 71.7 70.5 71.8
Local Government
216.0 217.4 218.0 209.9 207.8 206.4 201.5 207.7 205.6 207.6 208.1 208.5 209.5
Note: These not seasonally adjusted estimates were prepared in cooperation with the U.S. Department of Labor, Bureau of Labor Statistics, based upon monthly reports submitted
by selected employers in the Atlanta Metropolitan Statistical Area, which includes Barrow, Bartow, Butts, Carroll, Cherokee, Clayton, Cobb, Coweta, Dawson, DeKalb, Douglas, Fayette, Forsyth, Fulton, Gwinnett, Haralson, Heard, Henry, Jasper, Lamer, Meriwether, Morgan, Newton, Paulding, Pickens, Pike, Rockdale, Spalding and Walton counties. The estimates include all full- and part-time wage and salary workers who were employed during or received pay for any part of the pay period that includes the twelfth of the month. Proprietors, domestic workers, self-employed persons, unpaid family workers and personnel of the armed forces are excluded. Estimates based on 2020 benchmark.
Source: Georgia Department of Labor, Workforce Statistics & Economic Research
12
atlanta msa Nonfarm Employment
(Not Seasonally Adjusted)
(In thousands)
2019 Final Series
Industry
Annual Jan Feb Mar Apr M ay Jun Jul Aug Sep Oct Nov Dec Average
Total Nonfarm
2,805.1 2,819.9 2,828.7 2,829.4 2,844.7 2,848.5 2,837.3 2,861.5 2,856.3 2,875.3 2,896.8 2,901.2 2,850.4
Total Private
2,472.6 2,484.6 2,492.2 2,492.9 2,507.9 2,517.8 2,516.4 2,525.5 2,517.7 2,535.8 2,555.5 2,561.2 2,515.0
Goods Producing
297.9 299.8 301.2 302.0 304.1 305.0 305.9 306.0 305.7 305.7 305.9 305.9 303.8
Service-Providing
2,507.2 2,520.1 2,527.5 2,527.4 2,540.6 2,543.5 2,531.4 2,555.5 2,550.6 2,569.6 2,590.9 2,595.3 2,546.6
Private Service-Providing
2,174.7 2,184.8 2,191.0 2,190.9 2,203.8 2,212.8 2,210.5 2,219.5 2,212.0 2,230.1 2,249.6 2,255.3 2,211.3
Mining and Logging
1.5
1.5
1.5
1.6
1.6
1.6 1.6
1.6
1.6
1.6
1.7
1.7
1.6
Mining, Logging and Construction
128.3 129.5 130.5 130.6 132.3 133.1 133.5 133.6 133.5 133.7 133.7 133.0 132.1
Construction
126.8 128.0 129.0 129.0 130.7 131.5 131.9 132.0 131.9 132.1 132.0 131.3 130.5
Construction of Buildings
28.5 28.6 28.5 28.6 29.0 29.4 30.0 30.1 30.1 30.5 30.3 30.2 29.5
Specialty Trade Contractors
81.3 82.2 83.0 82.9 84.0 84.2 83.9 83.7 83.6 83.3 83.3 82.8 83.2
Manufacturing
169.6 170.3 170.7 171.4 171.8 171.9 172.4 172.4 172.2 172.0 172.2 172.9 171.7
Durable Goods
89.4 89.5 89.8 90.2 90.4 90.4 90.8 90.8 90.6 90.5 90.5 91.0 90.3
Transportation Equipment Manufacturing
15.6 15.7 15.8 15.8 15.6 15.6 15.8 15.9 15.8 15.7 15.7 15.7 15.7
Non-Durable Goods
80.2 80.8 80.9 81.2 81.4 81.5 81.6 81.6 81.6 81.5 81.7 81.9 81.3
Food Manufacturing
22.4 22.6 22.5 23.0 23.0 23.2 23.5 23.7 23.8 23.9 24.0 24.1 23.3
Trade, Transportation, and Utilities
600.1 596.1 598.1 596.6 599.4 601.4 603.2 601.7 602.7 608.2 624.4 630.2 605.2
Wholesale Trade
154.4 155.1 155.1 155.1 155.5 156.0 155.6 155.6 156.0 155.9 155.9 156.5 155.6
Merchant Wholesalers, Durable Goods
84.3 84.7 84.5 84.7 84.7 85.2 85.2 85.0 85.0 85.3 85.3 85.3 84.9
Merchant Wholesalers, Nondurable Goods
41.3 41.6 41.9 41.8 42.0 41.9 41.5 41.7 41.7 41.5 41.5 41.6 41.7
Wholesale Electronic Markets and Agents and Brokers
28.8 28.8 28.7 28.6 28.8 28.9 28.9 28.9 29.3 29.1 29.1 29.6 29.0
Retail Trade
290.4 286.6 287.6 287.6 289.1 289.0 289.1 287.7 286.8 290.4 301.9 304.2 290.9
Food and Beverage Stores
58.0 58.0 57.9 57.2 57.5 57.2 57.2 57.4 57.1 57.4 58.7 58.8 57.7
General Merchandise Stores
59.4 56.6 56.3 56.0 57.0 57.1 57.2 57.4 57.7 59.0 64.5 65.1 58.6
Miscellaneous Store Retailers
14.3 14.5 14.4 14.5 14.8 14.8 15.0 15.0 14.9 15.1 15.0 14.9 14.8
Transportation, Warehousing, and Utilities
155.3 154.4 155.4 153.9 154.8 156.4 158.5 158.4 159.9 161.9 166.6 169.5 158.8
Utilities
10.0 10.0 10.1 10.0 10.1 10.1 10.2 10.1 10.1 10.1 10.1 10.2 10.1
Transportation and Warehousing
145.3 144.4 145.3 143.9 144.7 146.3 148.3 148.3 149.8 151.8 156.5 159.3 148.7
Air Transportation
29.2 29.8 30.1 29.1 29.4 29.6 30.2 29.3 29.8 29.9 29.2 29.3 29.6
Truck Transportation
34.2 34.3 34.4 34.7 35.3 35.7 36.2 36.5 36.2 36.0 36.4 36.5 35.5
Couriers and Messengers
22.9 20.9 21.0 19.8 19.9 20.5 20.6 20.7 21.1 22.1 25.6 28.4 22.0
Information
100.2 103.1 103.0 101.0 100.7 102.6 101.5 103.0 101.5 102.1 105.3 101.9 102.2
Telecommunications
32.9 32.8 32.7 32.0 32.0 32.3 32.0 31.5 31.3 31.3 31.2 31.2 31.9
Wired and Wireless Telecommunications Carriers
28.7 28.6 28.6 28.0 28.0 28.1 27.8 27.3 27.1 27.0 27.0 26.9 27.8
Data Processing, Hosting, and Related Services
13.4 13.5 13.6 13.9 13.9 13.9 13.9 14.3 14.3 14.6 14.7 14.9 14.1
Financial Activities
173.9 174.8 175.3 175.5 176.3 177.0 177.7 178.5 178.1 180.3 180.6 181.1 177.4
Finance and Insurance
121.6 122.1 122.2 122.8 123.0 123.5 124.4 124.9 124.5 125.6 126.0 126.2 123.9
Insurance Carriers and Related Activities
58.9 59.1 59.7 60.1 60.1 60.4 60.8 61.0 61.0 61.4 61.6 61.8 60.5
Real Estate and Rental and Leasing
52.3 52.7 53.1 52.7 53.3 53.5 53.3 53.6 53.6 54.7 54.6 54.9 53.5
Professional and Business Services
540.3 543.0 541.9 542.3 544.5 548.6 547.8 551.8 550.2 554.6 556.6 556.6 548.2
Professional, Scientific, and Technical Services
228.0 229.4 227.8 229.0 227.4 228.2 229.7 229.9 227.9 232.0 232.7 233.5 229.6
Accounting, Tax Prep, and Bookkeeping Services
26.6 27.8 26.8 26.7 24.7 25.4 25.3 25.4 25.0 25.7 25.9 26.6 26.0
Architectural, Engineering, and Related Services
32.5 32.7 32.8 32.7 33.0 33.2 33.3 33.2 33.0 33.3 33.1 33.2 33.0
Computer Systems Design and Related Services
61.9 62.1 61.3 62.5 62.6 62.0 62.8 63.1 62.4 64.0 64.4 63.7 62.7
Management and Technical Consulting Services
41.5 41.0 41.0 41.1 41.1 41.3 41.6 41.7 41.4 42.1 42.2 42.3 41.5
Management of Companies and Enterprises
78.3 78.9 79.3 78.7 79.3 80.0 79.4 79.1 79.6 79.8 80.0 80.4 79.4
Admin and Support, Waste Mngmnt and Remediation
234.0 234.7 234.8 234.6 237.8 240.4 238.7 242.8 242.7 242.8 243.9 242.7 239.2
Employment Services
116.8 116.5 116.5 117.7 119.3 121.6 120.6 123.8 124.2 124.8 126.5 126.6 121.2
Education and Health Services
365.6 368.9 369.1 367.6 368.6 364.5 362.0 368.0 369.2 374.2 374.8 375.3 369.0
Educational Services
64.9 66.1 66.6 66.5 66.4 64.8 63.3 64.4 65.8 67.3 67.1 66.8 65.8
Health Care and Social Assistance
300.7 302.8 302.5 301.1 302.2 299.7 298.7 303.6 303.4 306.9 307.7 308.5 303.2
Ambulatory Health Care Services
132.8 134.5 134.7 135.2 135.8 135.6 137.0 138.1 137.8 139.6 140.2 141.2 136.9
Hospitals
92.0 91.2 90.8 89.4 89.6 89.8 87.8 88.4 88.3 88.4 88.4 88.7 89.4
Social Assistance
46.8 47.7 47.6 47.0 47.3 45.0 44.4 47.2 47.1 48.8 48.9 48.5 47.2
Leisure and Hospitality
292.9 296.5 300.7 303.5 310.1 313.2 311.9 310.6 304.9 304.8 302.6 304.6 304.7
Arts, Entertainment, and Recreation
35.5 36.4 37.7 40.2 42.9 45.5 44.7 42.1 39.6 40.2 38.0 38.3 40.1
Accommodation and Food Services
257.4 260.1 263.0 263.3 267.2 267.7 267.2 268.5 265.3 264.6 264.6 266.3 264.6
Accommodation
25.8 26.1 26.5 26.5 26.9 27.1 27.2 26.7 26.8 26.5 26.4 26.6 26.6
Food Services and Drinking Places
231.6 234.0 236.5 236.8 240.3 240.6 240.0 241.8 238.5 238.1 238.2 239.7 238.0
Other Services
101.7 102.4 102.9 104.4 104.2 105.5 106.4 105.9 105.4 105.9 105.3 105.6 104.6
Repair and Maintenance
24.3 24.6 24.6 24.8 24.9 25.1 25.2 25.1 25.2 25.3 25.2 25.1 25.0
Personal and Laundry Services
27.7 27.9 28.2 29.1 28.6 28.8 28.9 28.9 28.9 28.9 29.0 29.2 28.7
Government
332.5 335.3 336.5 336.5 336.8 330.7 320.9 336.0 338.6 339.5 341.3 340.0 335.4
Federal Government
46.4 46.9 46.8 47.1 46.9 47.1 47.2 47.9 47.9 47.6 47.9 48.3 47.3
State Government
73.1 74.0 74.5 74.8 74.6 70.6 69.9 74.2 74.8 75.0 74.9 74.4 73.7
Local Government
213.0 214.4 215.2 214.6 215.3 213.0 203.8 213.9 215.9 216.9 218.5 217.3 214.3
Note: These not seasonally adjusted estimates were prepared in cooperation with the U.S. Department of Labor, Bureau of Labor Statistics, based upon monthly reports submitted
by selected employers in the Atlanta Metropolitan Statistical Area, which includes Barrow, Bartow, Butts, Carroll, Cherokee, Clayton, Cobb, Coweta, Dawson, DeKalb, Douglas, Fayette, Forsyth, Fulton, Gwinnett, Haralson, Heard, Henry, Jasper, Lamer, Meriwether, Morgan, Newton, Paulding, Pickens, Pike, Rockdale, Spalding and Walton counties. The estimates include all full- and part-time wage and salary workers who were employed during or received pay for any part of the pay period that includes the twelfth of the month. Proprietors, domestic workers, self-employed persons, unpaid family workers and personnel of the armed forces are excluded. Estimates based on 2020 benchmark.
Source: Georgia Department of Labor, Workforce Statistics & Economic Research
13
augusta-richmond county msa Nonfarm Employment
(In thousands)
Industry Total Nonfarm Total Private Goods Producing Service-Providing Private Service-Providing Mining, Logging and Construction Manufacturing Trade, Transportation, and Utilities
Wholesale Trade Retail Trade Transportation, Warehousing, and Utilities Information Financial Activities Professional and Business Services Education and Health Services Leisure and Hospitality Other Services Government Federal Government State Government Local Government
(Not Seasonally Adjusted)
2020 Preliminary Series
J an
244.7 198.8
44.6 200.1 154.2
21.0 23.6 40.8
6.1 26.5
8.2 2.5 7.2 32.7 36.0 26.3 8.7 45.9 9.9 14.5 21.5
Feb
245.6 199.3
44.9 200.7 154.4
21.2 23.7 40.4
6.1 26.5
7.8 2.5 7.3 33.1 36.2 26.3 8.6 46.3 10.0 14.7 21.6
M ar
245.7 199.3
45.0 200.7 154.3
21.3 23.7 40.3
6.1 26.4
7.8 2.4 7.3 33.4 36.0 26.3 8.6 46.4 10.0 14.7 21.7
Apr
217.6 171.6
40.0 177.6 131.6
19.9 20.1 36.4
5.5 23.6
7.3 2.1 6.3 30.3 32.2 17.7 6.6 46.0 10.1 14.5 21.4
M ay
223.6 178.1
39.1 184.5 139.0
18.7 20.4 38.4
5.5 25.3
7.6 2.1 6.2 30.8 33.2 21.0 7.3 45.5 10.2 14.3 21.0
Jun
229.4 184.7
41.4 188.0 143.3
19.0 22.4 39.5
5.5 26.2
7.8 2.1 6.1 31.3 33.6 22.8 7.9 44.7 10.2 13.6 20.9
Jul
228.9 184.7
40.8 188.1 143.9
19.1 21.7 39.6
5.5 26.3
7.8 2.1 6.1 31.2 34.1 22.7 8.1 44.2 10.3 13.5 20.4
Aug
232.2 186.6
41.0 191.2 145.6
19.5 21.5 39.9
5.5 26.4
8.0 2.1 6.2 31.8 34.7 22.9 8.0 45.6 10.9 13.8 20.9
Sep
234.9 189.0
42.5 192.4 146.5
19.6 22.9 40.3
5.6 26.7
8.0 2.2 6.1 31.9 35.0 22.9 8.1 45.9 10.8 14.0 21.1
Oct
236.9 191.2
42.8 194.1 148.4
19.7 23.1 40.7
5.6 27.0
8.1 2.2 6.2 32.3 35.3 23.7 8.0 45.7 10.5 14.0 21.2
Nov
237.5 192.1
42.8 194.7 149.3
19.6 23.2 41.9
5.6 28.0
8.3 2.2 6.1 31.5 35.3 24.3 8.0 45.4 10.3 14.0 21.1
Annual Dec Average
240.0 194.6
43.4 196.6 151.2
20.0 23.4 41.7
5.6 27.6
8.5 2.2 6.2 33.7 35.2 24.1 8.1 45.4 10.4 13.9 21.1
234.8 189.2
42.4 192.4 146.8
19.9 22.5 40.0
5.7 26.4
7.9 2.2 6.4 32.0 34.7 23.4 8.0 45.6 10.3 14.1 21.2
(In thousands)
2019 Final Series
Industry
Total Nonfarm Total Private Goods Producing Service-Providing Private Service-Providing Mining, Logging and Construction Manufacturing Trade, Transportation, and Utilities
Wholesale Trade Retail Trade Transportation, Warehousing, and Utilities Information Financial Activities Professional and Business Services Education and Health Services Leisure and Hospitality Other Services Government Federal Government State Government Local Government
J an
238.9 192.7
42.2 196.7 150.5
19.8 22.4 40.1
5.8 26.5
7.8 2.4 6.6 32.4 34.8 25.9 8.3 46.2 9.7 15.1 21.4
Feb
239.6 193.2
42.0 197.6 151.2
19.4 22.6 39.8
5.8 26.3
7.7 2.5 6.7 32.4 35.1 26.3 8.4 46.4 9.7 15.2 21.5
M ar
241.3 195.1
42.1 199.2 153.0
19.4 22.7 40.0
5.8 26.5
7.7 2.4 6.7 32.5 35.0 27.9 8.5 46.2 9.7 15.0 21.5
Apr
245.7 199.6
41.9 203.8 157.7
19.2 22.7 39.9
5.9 26.3
7.7 2.5 6.7 33.4 35.1 31.6 8.5 46.1 9.7 15.1 21.3
M ay
243.3 197.1
42.2 201.1 154.9
19.3 22.9 40.2
5.9 26.5
7.8 2.4 6.7 33.4 35.3 28.3 8.6 46.2 9.8 15.1 21.3
Jun
243.1 197.4
43.3 199.8 154.1
20.1 23.2 40.1
5.9 26.4
7.8 2.4 6.7 33.3 35.0 27.8 8.8 45.7 9.8 15.0 20.9
Jul
241.0 196.9
43.6 197.4 153.3
20.4 23.2 40.4
6.0 26.6
7.8 2.4 6.7 32.9 34.9 27.1 8.9 44.1 9.8 14.2 20.1
Aug
243.5 198.0
43.6 199.9 154.4
20.3 23.3 40.3
6.1 26.4
7.8 2.4 6.8 33.4 35.6 27.0 8.9 45.5 9.8 14.9 20.8
Sep
243.8 197.8
43.9 199.9 153.9
20.5 23.4 40.3
6.1 26.4
7.8 2.4 6.7 33.2 35.7 26.7 8.9 46.0 9.8 15.1 21.1
Oct
245.1 199.1
44.4 200.7 154.7
21.0 23.4 40.8
6.1 26.7
8.0 2.4 7.2 32.8 35.9 26.9 8.7 46.0 9.8 14.8 21.4
Nov
246.7 200.5
44.6 202.1 155.9
21.0 23.6 42.0
6.1 27.5
8.4 2.5 7.2 32.4 36.1 27.0 8.7 46.2 9.9 14.8 21.5
Annual Dec Average
247.2 201.1
44.8 202.4 156.3
21.2 23.6 42.2
6.1 27.6
8.5 2.4 7.3 32.6 36.3 26.7 8.8 46.1 9.9 14.6 21.6
243.3 197.4
43.2 200.1 154.2
20.1 23.1 40.5
6.0 26.6
7.9 2.4 6.8 32.9 35.4 27.4 8.7 45.9 9.8 14.9 21.2
Note: These not seasonally adjusted estimates were prepared in cooperation with the U.S. Department of Labor, Bureau of Labor Statistics, based upon monthly reports submitted
by selected employers in the Augusta-Richmond County Metropolitan Statistical Area, which includes Burke, Columbia, Lincoln, McDuffie and Richmond counties in Georgia and Aiken and Edgefield counties in South Carolina. The estimates include all full- and part-time wage and salary workers who were employed during or received pay for any part of the pay period that includes the twelfth of the month. Proprietors, domestic workers, self-employed persons, unpaid family workers and personnel of the armed forces are excluded. Estimates based on 2020 benchmark.
Source: Georgia Department of Labor, Workforce Statistics & Economic Research
14
(In thousands)
Industry Total Nonfarm Total Private Goods Producing Service-Providing Private Service-Providing Trade, Transportation, and Utilities
Retail Trade Government
Federal Government State Government Local Government
brunswick msa Nonfarm Employment
(Not Seasonally Adjusted)
2020 Preliminary Series
Annual Jan Feb Mar Apr M ay Jun Jul Aug Sep Oct Nov Dec Average
43.8 43.9 43.7 36.3 39.2 41.7 41.6 41.8 41.9 42.0 42.1 42.5 41.7
35.0 35.1 34.9 27.8 30.7 33.1 33.2 33.2 33.4 33.5 33.6 34.0 33.1
4.1
4.1
4.1
4.0
4.1
4.0 4.0
4.0
4.0
4.1
4.1
4.1
4.1
39.7 39.8 39.6 32.3 35.1 37.7 37.6 37.8 37.9 37.9 38.0 38.4 37.7
30.9 31.0 30.8 23.8 26.6 29.1 29.2 29.2 29.4 29.4 29.5 29.9 29.1
8.6
8.3
8.4
7.5
8.0
8.2 8.4
8.5
8.6
8.6
8.8
8.8
8.4
5.5
5.5
5.5
4.9
5.2
5.4 5.4
5.4
5.5
5.5
5.6
5.6
5.4
8.8
8.8
8.8
8.5
8.5
8.6 8.4
8.6
8.5
8.5
8.5
8.5
8.6
2.1
2.0
2.0
2.0
2.1
2.1 2.1
2.2
2.1
2.1
2.1
2.1
2.1
1.8
1.9
1.9
1.8
1.8
1.8 1.8
1.8
1.8
1.8
1.8
1.8
1.8
4.9
4.9
4.9
4.7
4.6
4.7 4.5
4.6
4.6
4.6
4.6
4.6
4.7
(In thousands)
2019 Final Series
Industry
Annual Jan Feb Mar Apr M ay Jun Jul Aug Sep Oct Nov Dec Average
Total Nonfarm
42.9 43.2 43.3 43.9 44.3 44.5 44.3 44.3 43.9 44.2 44.6 44.2 44.0
Total Private
34.4 34.5 34.7 35.1 35.4 35.7 35.6 35.3 35.0 35.3 35.7 35.4 35.2
Goods Producing
4.1
4.2
4.1
4.1
4.1
4.1 4.0
4.0
4.0
4.1
4.1
4.1
4.1
Service-Providing
38.8 39.0 39.2 39.8 40.2 40.4 40.3 40.3 39.9 40.1 40.5 40.1 39.9
Private Service-Providing
30.3 30.3 30.6 31.0 31.3 31.6 31.6 31.3 31.0 31.2 31.6 31.3 31.1
Trade, Transportation, and Utilities
8.4
8.3
8.3
8.4
8.4
8.4 8.4
8.3
8.3
8.3
8.8
8.7
8.4
Retail Trade
5.5
5.6
5.6
5.6
5.6
5.6 5.6
5.5
5.5
5.5
5.6
5.6
5.6
Government
8.5
8.7
8.6
8.8
8.9
8.8 8.7
9.0
8.9
8.9
8.9
8.8
8.8
Federal Government
2.0
2.0
2.0
2.0
2.0
2.0 2.0
2.1
2.0
2.1
2.1
2.0
2.0
State Government
1.7
1.8
1.8
1.8
1.8
1.8 1.9
1.9
1.9
1.9
1.9
1.9
1.8
Local Government
4.8
4.9
4.8
5.0
5.1
5.0 4.8
5.0
5.0
4.9
4.9
4.9
4.9
Note: These not seasonally adjusted estimates were prepared in cooperation with the U.S. Department of Labor, Bureau of Labor Statistics, based upon monthly reports submitted by selected
employers in the Brunswick Metropolitan Statistical Area, which includes Brantley, Glynn and McIntosh counties. The estimates include all full- and part-time wage and salary workers who were employed during or received pay for any part of the pay period that includes the twelfth of the month. Proprietors, domestic workers, self-employed persons, unpaid family workers and personnel of the armed forces are excluded. Estimates based on 2020 benchmark.
Source: Georgia Department of Labor, Workforce Statistics & Economic Research
15
(In thousands)
Industry Total Nonfarm Total Private Goods Producing Service-Providing Private Service-Providing Mining, Logging and Construction Manufacturing Trade, Transportation, and Utilities
Wholesale Trade Retail Trade Transportation, Warehousing, and Utilities Information Financial Activities Finance and Insurance
Insurance Carriers and Related Activities Professional and Business Services Education and Health Services Leisure and Hospitality Other Services Government
Federal Government State Government Local Government
columbus msa Nonfarm Employment
(Not Seasonally Adjusted)
2020 Preliminary Series
J an 122.7
98.4 15.6 107.1 82.8
4.7 10.9 17.9
2.8 12.8
2.3 1.3 12.8 10.8 3.7 15.4 16.5 14.7 4.2 24.3 6.8 4.1 13.4
Feb 123.5
99.0 15.9 107.6 83.1
4.8 11.1 17.7 2.8 12.7 2.2 1.2 12.7 10.8 3.7 15.5 16.8 15.0 4.2 24.5 6.8 4.3 13.4
M ar 123.4
98.7 16.0 107.4 82.7
4.9 11.1 17.7 2.8 12.7 2.2 1.2 12.7 10.7 3.7 15.4 16.6 14.9 4.2 24.7 6.9 4.3 13.5
Apr 110.7 86.8 15.0 95.7 71.8
4.7 10.3 16.2
2.9 11.2 2.1 1.1 12.5 10.7 3.7 13.9 15.1 9.8 3.2 23.9 6.9 4.2 12.8
M ay 113.0 89.7 14.8 98.2 74.9
4.9 9.9 16.7 2.8 11.8 2.1 1.1 12.4 10.6 3.7 14.0 15.4 11.7 3.6 23.3 6.9 4.1 12.3
Jun 116.1 92.7 15.2 100.9 77.5
4.9 10.3 17.3
2.8 12.3
2.2 1.1 12.5 10.6 3.7 14.2 15.4 13.1 3.9 23.4 6.9 3.8 12.7
Jul 114.9 92.1 15.1 99.8 77.0
4.7 10.4 17.3
2.8 12.3
2.2 1.0 12.3 10.3 3.7 14.3 15.2 13.0 3.9 22.8 6.9 3.9 12.0
Aug 116.1 92.6 15.2 100.9 77.4
4.7 10.5 17.2
2.7 12.3
2.2 1.0 12.4 10.4 3.7 14.4 15.4 13.1 3.9 23.5 7.1 4.0 12.4
Sep 116.5 92.8 15.1 101.4 77.7
4.7 10.4 17.4
2.7 12.4
2.3 1.1 12.2 10.3 3.7 14.4 15.5 13.2 3.9 23.7 7.1 4.3 12.3
Oct 117.4 93.7 15.2 102.2 78.5
4.8 10.4 17.5
2.7 12.5
2.3 1.1 12.2 10.3 3.6 14.7 15.6 13.5 3.9 23.7 7.0 4.3 12.4
Nov 117.3 93.8 15.1 102.2 78.7
4.7 10.4 17.7
2.7 12.6
2.4 1.1 12.2 10.2 3.6 14.6 15.6 13.6 3.9 23.5 6.9 4.1 12.5
Annual Dec Average
117.9 117.5
94.3 93.7
15.2 15.3
102.7 102.2
79.1 78.4
4.7
4.8
10.5 10.5
17.4 17.3
2.6
2.8
12.4 12.3
2.4
2.2
1.1
1.1
12.2 12.4
10.3 10.5
3.6
3.7
15.2 14.7
15.6 15.7
13.7 13.3
3.9
3.9
23.6 23.7
7.0
6.9
4.1
4.1
12.5 12.7
(In thousands)
2019 Final Series
Industry Total Nonfarm Total Private Goods Producing Service-Providing Private Service-Providing Mining, Logging and Construction Manufacturing Trade, Transportation, and Utilities
Wholesale Trade Retail Trade Transportation, Warehousing, and Utilities Information Financial Activities Finance and Insurance
Insurance Carriers and Related Activities Professional and Business Services Education and Health Services Leisure and Hospitality Other Services Government
Federal Government State Government Local Government
J an 121.5
97.2 15.9 105.6 81.3
4.7 11.2 17.7 2.6 12.8 2.3 1.3 13.0 11.0 3.9 14.8 15.8 14.4 4.3 24.3 6.7 4.2 13.4
Feb 122.1
97.5 15.9 106.2 81.6
4.8 11.1 17.6 2.7 12.7 2.2 1.3 13.0 11.1 3.9 14.8 15.9 14.7 4.3 24.6 6.7 4.5 13.4
M ar 122.7
98.1 16.1 106.6 82.0
5.0 11.1 17.5 2.6 12.7 2.2 1.3 13.0 11.0 3.9 15.1 15.9 14.9 4.3 24.6 6.7 4.5 13.4
Apr 122.4
97.9 15.6 106.8 82.3
4.7 10.9 17.6
2.6 12.7
2.3 1.3 12.8 10.8 3.9 15.1 16.1 15.1 4.3 24.5 6.7 4.4 13.4
M ay 122.8
98.3 15.7 107.1 82.6
4.8 10.9 17.6
2.6 12.7
2.3 1.3 12.8 10.9 3.9 15.0 16.3 15.2 4.4 24.5 6.7 4.5 13.3
Jun 122.1
98.4 15.6 106.5 82.8
4.8 10.8 17.6
2.6 12.7
2.3 1.3 12.9 10.9 3.8 14.9 16.2 15.4 4.5 23.7 6.6 4.2 12.9
Jul 121.1
97.7 15.7 105.4 82.0
4.8 10.9 17.5
2.7 12.6
2.2 1.3 12.9 10.8 3.8 14.7 16.0 15.3 4.3 23.4 6.7 4.1 12.6
Aug 122.0
98.0 15.6 106.4 82.4
4.8 10.8 17.4
2.7 12.5
2.2 1.3 12.9 10.9 3.8 14.9 16.2 15.4 4.3 24.0 6.8 4.2 13.0
Sep 121.8
97.5 15.6 106.2 81.9
4.8 10.8 17.4
2.7 12.5
2.2 1.2 12.8 10.8 3.8 14.9 16.2 15.1 4.3 24.3 6.8 4.5 13.0
Oct 122.7
98.2 15.7 107.0 82.5
4.8 10.9 17.5
2.6 12.6
2.3 1.2 12.9 11.0 3.9 15.2 16.2 15.2 4.3 24.5 6.8 4.4 13.3
Nov 124.3
99.4 15.7 108.6 83.7
4.8 10.9 18.3
2.7 13.2
2.4 1.3 12.9 11.0 3.8 15.3 16.3 15.3 4.3 24.9 6.8 4.4 13.7
Annual Dec Average
124.3 122.5
99.6 98.2
15.7 15.7
108.6 106.8
83.9 82.4
4.8
4.8
10.9 10.9
18.5 17.7
2.8
2.7
13.3 12.8
2.4
2.3
1.3
1.3
12.8 12.9
10.9 10.9
3.8
3.9
15.3 15.0
16.4 16.1
15.3 15.1
4.3
4.3
24.7 24.3
6.8
6.7
4.4
4.4
13.5 13.2
Note: These not seasonally adjusted estimates were prepared in cooperation with the U.S. Department of Labor, Bureau of Labor Statistics, based upon monthly reports submitted by selected
employers in the Columbus Metropolitan Statistical Area, which includes Chattahoochee, Harris, Marion and Muscogee counties in Georgia and Russell County in Alabama. The estimates include all full- and part-time wage and salary workers who were employed during or received pay for any part of the pay period that includes the twelfth of the month. Proprietors, domestic workers, selfemployed persons, unpaid family workers and personnel of the armed forces are excluded. Estimates based on 2020 benchmark.
16
Source: Georgia Department of Labor, Workforce Statistics & Economic Research
(In thousands)
Industry Total Nonfarm Total Private Goods Producing Service-Providing Private Service-Providing Manufacturing
Textile Mills Textile Product Mills Trade, Transportation, and Utilities Retail Trade Transportation, Warehousing, and Utilities Professional and Business Services Government Federal Government State Government Local Government
dalton msa Nonfarm Employment
(Not Seasonally Adjusted)
2020 Preliminary Series
Annual Jan Feb Mar Apr M ay Jun Jul Aug Sep Oct Nov Dec Average
65.9 66.5 66.7 56.6 61.1 63.1 62.6 63.6 64.4 64.4 64.6 64.5 63.7
59.0 59.5 59.6 49.7 54.2 56.2 55.6 56.6 57.4 57.4 57.6 57.8 56.7
24.3 24.5 24.5 19.7 21.8 23.2 22.6 22.9 23.5 23.4 23.3 23.6 23.1
41.6 42.0 42.2 36.9 39.3 39.9 40.0 40.7 40.9 41.0 41.3 40.9 40.6
34.7 35.0 35.1 30.0 32.4 33.0 33.0 33.7 33.9 34.0 34.3 34.2 33.6
22.9 23.1 23.0 18.4 20.4 21.7 21.2 21.6 22.1 21.9 21.8 22.2 21.7
3.9
4.0
4.0
3.0
3.5
3.8 3.7
3.8
4.0
4.0
4.0
4.0
3.8
13.5 13.6 13.5 10.5 11.8 12.6 12.3 12.7 13.1 13.1 13.0 13.2 12.7
13.6 13.5 13.6 12.4 12.8 13.1 13.1 13.3 13.5 13.6 13.7 13.7 13.3
6.2
6.2
6.2
5.8
6.1
6.2 6.2
6.3
6.4
6.4
6.6
6.5
6.3
3.3
3.3
3.4
3.1
3.1
3.2 3.2
3.2
3.3
3.4
3.4
3.5
3.3
6.9
7.1
7.4
6.1
6.6
6.6 6.6
6.9
7.0
7.1
7.2
7.2
6.9
6.9
7.0
7.1
6.9
6.9
6.9 7.0
7.0
7.0
7.0
7.0
6.7
7.0
0.2
0.2
0.3
0.2
0.3
0.3 0.3
0.4
0.4
0.3
0.2
0.2
0.3
1.1
1.1
1.1
1.1
1.1
1.0 1.0
1.0
1.1
1.1
1.1
1.0
1.1
5.6
5.7
5.7
5.6
5.5
5.6 5.7
5.6
5.5
5.6
5.7
5.5
5.6
(In thousands)
2019 Final Series
Industry Total Nonfarm Total Private Goods Producing Service-Providing Private Service-Providing Manufacturing
Textile Mills Textile Product Mills Trade, Transportation, and Utilities Retail Trade Transportation, Warehousing, and Utilities Professional and Business Services Government Federal Government State Government Local Government
Annual Jan Feb Mar Apr M ay Jun Jul Aug Sep Oct Nov Dec Average 66.2 66.2 66.6 66.9 66.7 66.6 66.5 66.6 66.9 66.4 66.7 66.8 66.6
59.4 59.3 59.7 59.7 59.6 59.8 59.7 59.7 59.8 59.4 59.7 59.8 59.6
25.7 25.5 25.7 25.6 25.5 25.5 25.5 25.2 24.9 24.7 24.8 24.7 25.3
40.5 40.7 40.9 41.3 41.2 41.1 41.0 41.4 42.0 41.7 41.9 42.1 41.3
33.7 33.8 34.0 34.1 34.1 34.3 34.2 34.5 34.9 34.7 34.9 35.1 34.4
24.3 24.1 24.2 24.1 24.0 23.9 23.9 23.6 23.4 23.2 23.2 23.2 23.8
4.4
4.3
4.3
4.3
4.1
3.9 4.0
4.0
3.9
4.0
4.0
4.0
4.1
14.1 14.0 14.0 14.1 14.1 14.2 14.1 13.9 13.9 13.8 13.7 13.7 14.0
13.5 13.4 13.4 13.4 13.3 13.3 13.4 13.4 13.5 13.4 13.7 13.7 13.5
6.0
6.0
6.1
6.0
6.0
6.0 6.1
6.1
6.2
6.2
6.4
6.4
6.1
3.3
3.2
3.2
3.2
3.2
3.2 3.2
3.2
3.2
3.2
3.3
3.3
3.2
6.4
6.6
6.7
6.6
6.6
6.8 6.7
6.8
6.9
6.9
6.8
6.9
6.7
6.8
6.9
6.9
7.2
7.1
6.8 6.8
6.9
7.1
7.0
7.0
7.0
7.0
0.2
0.2
0.2
0.3
0.3
0.2 0.2
0.3
0.3
0.2
0.2
0.2
0.2
1.0
1.1
1.1
1.1
1.1
1.0 1.0
1.0
1.1
1.1
1.1
1.1
1.1
5.6
5.6
5.6
5.8
5.7
5.6 5.6
5.6
5.7
5.7
5.7
5.7
5.7
Note: These not seasonally adjusted estimates were prepared in cooperation with the U.S. Department of Labor, Bureau of Labor Statistics, based upon monthly reports submitted by selected
employers in the Dalton Metropolitan Statistical Area, which includes Murray and Whitfield counties. The estimates include all full- and part-time wage and salary workers who were employed during or received pay for any part of the pay period that includes the twelfth of the month. Proprietors, domestic workers, self-employed persons, unpaid family workers and personnel of the armed forces are excluded. Estimates based on 2020 benchmark.
Source: Georgia Department of Labor, Workforce Statistics & Economic Research
17
(In thousands)
Industry Total Nonfarm Total Private Goods Producing Service-Providing Private Service-Providing Trade, Transportation, and Utilities
Retail Trade Government
Federal Government State Government Local Government
gainesville msa Nonfarm Employment
(Not Seasonally Adjusted)
2020 Preliminary Series
Annual Jan Feb Mar Apr M ay Jun Jul Aug Sep Oct Nov Dec Average
94.5 95.0 94.8 85.0 88.3 90.3 90.5 91.7 91.9 93.7 94.3 93.8 92.0
83.5 84.0 83.8 74.1 77.8 79.9 80.0 80.9 81.4 83.0 83.7 83.2 81.3
25.5 25.6 25.6 23.3 23.9 24.2 24.0 24.0 24.2 24.5 24.5 24.7 24.5
69.0 69.4 69.2 61.7 64.4 66.1 66.5 67.7 67.7 69.2 69.8 69.1 67.5
58.0 58.4 58.2 50.8 53.9 55.7 56.0 56.9 57.2 58.5 59.2 58.5 56.8
17.8 17.6 17.5 16.0 16.4 17.3 17.4 17.6 17.9 18.1 18.9 18.8 17.6
9.0
9.0
9.0
8.0
8.4
8.8 8.8
8.9
9.1
9.2
9.3
9.4
8.9
11.0 11.0 11.0 10.9 10.5 10.4 10.5 10.8 10.5 10.7 10.6 10.6 10.7
0.5
0.5
0.5
0.5
0.5
0.5 0.5
0.7
0.6
0.6
0.5
0.5
0.5
2.8
2.7
2.8
2.8
2.8
2.7 2.7
2.8
2.6
2.6
2.6
2.6
2.7
7.7
7.8
7.7
7.6
7.2
7.2 7.3
7.3
7.3
7.5
7.5
7.5
7.5
(In thousands)
2019 Final Series
Industry
Annual Jan Feb Mar Apr M ay Jun Jul Aug Sep Oct Nov Dec Average
Total Nonfarm
92.2 92.7 93.0 92.8 93.3 93.5 93.3 94.3 94.1 95.5 95.7 95.9 93.9
Total Private
81.6 82.0 82.2 81.9 82.3 82.6 82.9 83.5 83.4 84.5 84.6 84.9 83.0
Goods Producing
25.3 25.5 25.5 25.4 25.4 25.6 25.5 25.4 25.4 25.5 25.6 25.7 25.5
Service-Providing
66.9 67.2 67.5 67.4 67.9 67.9 67.8 68.9 68.7 70.0 70.1 70.2 68.4
Private Service-Providing
56.3 56.5 56.7 56.5 56.9 57.0 57.4 58.1 58.0 59.0 59.0 59.2 57.6
Trade, Transportation, and Utilities
17.3 17.3 17.3 17.1 17.1 17.1 17.3 17.5 17.7 18.2 18.5 18.6 17.6
Retail Trade
8.9
8.9
8.9
8.9
9.0
8.9 8.9
9.1
9.4
9.6
9.7
9.4
9.1
Government
10.6 10.7 10.8 10.9 11.0 10.9 10.4 10.8 10.7 11.0 11.1 11.0 10.8
Federal Government
0.4
0.4
0.4
0.4
0.5
0.5 0.5
0.5
0.5
0.5
0.5
0.5
0.5
State Government
2.5
2.6
2.7
2.8
2.8
2.7 2.6
2.7
2.6
2.8
2.8
2.8
2.7
Local Government
7.7
7.7
7.7
7.7
7.7
7.7 7.3
7.6
7.6
7.7
7.8
7.7
7.7
Note: These not seasonally adjusted estimates were prepared in cooperation with the U.S. Department of Labor, Bureau of Labor Statistics, based upon monthly reports submitted by selected
employers in the Gainesville Metropolitan Statistical Area, which comprises Hall county. The estimates include all full- and part-time wage and salary workers who were employed during or received pay for any part of the pay period that includes the twelfth of the month. Proprietors, domestic workers, self-employed persons, unpaid family workers and personnel of the armed forces are excluded. Estimates based on 2020 benchmark.
Source: Georgia Department of Labor, Workforce Statistics & Economic Research
18
(In thousands)
Industry Total Nonfarm Total Private Goods Producing Service-Providing Private Service-Providing Government
Federal Government State Government Local Government
hinesville msa Nonfarm Employment
(Not Seasonally Adjusted)
2020 Preliminary Series
Annual Jan Feb Mar Apr M ay Jun Jul Aug Sep Oct Nov Dec Average
21.2 21.3 21.2 19.5 20.0 20.3 20.1 20.4 20.4 20.6 20.7 20.8 20.5
13.1 13.2 13.1 11.7 12.2 12.4 12.3 12.4 12.5 12.6 12.8 13.0 12.6
2.8
2.8
2.7
2.7
2.7
2.6 2.5
2.5
2.4
2.4
2.4
2.4
2.6
18.4 18.5 18.5 16.8 17.3 17.7 17.6 17.9 18.0 18.2 18.3 18.4 18.0
10.3 10.4 10.4
9.0
9.5
9.8 9.8
9.9 10.1 10.2 10.4 10.6 10.0
8.1
8.1
8.1
7.8
7.8
7.9 7.8
8.0
7.9
8.0
7.9
7.8
7.9
3.9
3.9
3.9
3.9
3.9
3.9 3.9
4.0
4.0
4.0
3.9
3.9
3.9
0.4
0.4
0.4
0.4
0.4
0.4 0.4
0.4
0.4
0.4
0.4
0.4
0.4
3.8
3.8
3.8
3.5
3.5
3.6 3.5
3.6
3.5
3.6
3.6
3.5
3.6
(In thousands)
2019 Final Series
Industry
Annual Jan Feb Mar Apr M ay Jun Jul Aug Sep Oct Nov Dec Average
Total Nonfarm
21.0 21.2 21.3 21.3 21.4 21.0 20.9 21.2 21.0 21.2 21.3 21.3 21.2
Total Private
13.1 13.3 13.3 13.4 13.5 13.2 13.2 13.2 13.1 13.2 13.2 13.2 13.2
Goods Producing
2.9
2.9
2.8
2.9
2.8
2.9 2.9
2.8
2.8
2.8
2.8
2.8
2.8
Service-Providing
18.1 18.3 18.5 18.4 18.6 18.1 18.0 18.4 18.2 18.4 18.5 18.5 18.3
Private Service-Providing
10.2 10.4 10.5 10.5 10.7 10.3 10.3 10.4 10.3 10.4 10.4 10.4 10.4
Government
7.9
7.9
8.0
7.9
7.9
7.8 7.7
8.0
7.9
8.0
8.1
8.1
7.9
Federal Government
3.9
3.8
3.8
3.8
3.8
3.8 3.8
3.8
3.9
3.8
3.9
3.9
3.8
State Government
0.4
0.4
0.4
0.4
0.4
0.4 0.4
0.4
0.4
0.4
0.4
0.4
0.4
Local Government
3.6
3.7
3.8
3.7
3.7
3.6 3.5
3.8
3.6
3.8
3.8
3.8
3.7
Note: These not seasonally adjusted estimates were prepared in cooperation with the U.S. Department of Labor, Bureau of Labor Statistics, based upon monthly reports submitted by se-
lected employers in the Hinesville Metropolitan Statistical Area, which includes Liberty and Long counties. The estimates include all full- and part-time wage and salary workers who were employed during or received pay for any part of the pay period that includes the twelfth of the month. Proprietors, domestic workers, self-employed persons, unpaid family workers and personnel of the armed forces are excluded. Estimates based on 2020 benchmark.
Source: Georgia Department of Labor, Workforce Statistics & Economic Research
19
macon-BIBB County msa Nonfarm Employment
(In thousands)
Industry Total Nonfarm Total Private Goods Producing Service-Providing Private Service-Providing Trade, Transportation, and Utilities
Retail Trade Transportation, Warehousing, and Utilities Financial Activities Professional and Business Services Education and Health Services Leisure and Hospitality Government Federal Government State Government Local Government
(Not Seasonally Adjusted)
2020 Preliminary Series
Annual Jan Feb Mar Apr M AY Jun Jul Aug Sep Oct Nov Dec Average
103.0 103.3 102.8 91.4 94.1 96.5 95.8 97.3 97.4 98.1 99.4 99.7 98.2
88.2 88.5 88.0 77.2 80.1 82.5 82.2 83.3 83.3 84.0 85.3 85.5 84.0
10.3 10.4 10.3
9.9
9.9 10.1 9.9 10.0 10.0
9.9 10.0 10.0 10.1
92.7 92.9 92.5 81.5 84.2 86.4 85.9 87.3 87.4 88.2 89.4 89.7 88.2
77.9 78.1 77.7 67.3 70.2 72.4 72.3 73.3 73.3 74.1 75.3 75.5 74.0
19.5 19.3 19.3 17.0 17.6 18.2 18.4 18.7 19.1 19.1 19.7 20.1 18.8
11.6 11.7 11.7 10.1 10.7 11.2 11.2 11.4 11.6 11.7 11.8 11.9 11.4
5.1
4.8
4.8
4.2
4.2
4.3 4.4
4.6
4.7
4.8
5.1
5.2
4.7
9.8
9.9
9.9
9.7
9.6
9.6 9.6
9.6
9.5
9.6
9.6
9.6
9.7
11.7 11.9 11.8 10.4 10.5 11.0 10.9 11.1 10.9 11.1 11.3 11.3 11.2
21.9 22.0 21.9 19.8 20.2 20.5 20.3 20.6 20.8 21.0 21.1 21.1 20.9
10.7 10.9 10.7
7.1
8.5
9.4 9.4
9.5
9.3
9.5
9.5
9.6
9.5
14.8 14.8 14.8 14.2 14.0 14.0 13.6 14.0 14.1 14.1 14.1 14.2 14.2
1.1
1.1
1.1
1.1
1.1
1.1 1.1
1.3
1.3
1.2
1.1
1.2
1.2
4.2
4.2
4.2
4.2
4.1
4.1 3.7
3.7
3.9
3.9
3.9
3.9
4.0
9.5
9.5
9.5
8.9
8.8
8.8 8.8
9.0
8.9
9.0
9.1
9.1
9.1
(In thousands)
2019 Final Series
Industry
Annual Jan Feb Mar Apr M AY Jun Jul Aug Sep Oct Nov Dec Average
Total Nonfarm Total Private
102.0 102.7 102.9 102.1 102.5 102.5 102.2 103.5 102.9 103.4 87.4 88.0 88.1 87.4 88.0 88.2 88.0 88.3 87.9 88.4
104.1 104.3 89.0 89.4
102.9 88.2
Goods Producing
10.3 10.4 10.4 10.2 10.3 10.4 10.3 10.3 10.2 10.3 10.3 10.4 10.3
Service-Providing Private Service-Providing
91.7 92.3 92.5 91.9 92.2 92.1 91.9 93.2 92.7 93.1 93.8 93.9 92.6 77.1 77.6 77.7 77.2 77.7 77.8 77.7 78.0 77.7 78.1 78.7 79.0 77.9
Trade, Transportation, and Utilities
19.7 19.5 19.4 19.2 19.3 19.3 19.3 19.3 19.4 19.5 20.0 20.2 19.5
Retail Trade
11.9 11.7 11.6 11.6 11.6 11.6 11.5 11.5 11.6 11.8 12.2 12.1 11.7
Transportation, Warehousing, and Utilities
5.0
5.0
5.0
4.9
4.9
5.0 5.0
5.0
5.0
4.9
5.0
5.2
5.0
Financial Activities
9.7
9.7
9.8
9.7
9.7
9.7 9.8
9.7
9.7
9.8
9.8
9.9
9.8
Professional and Business Services
11.6 11.9 12.0 11.9 12.1 12.2 12.0 12.2 12.3 12.1 12.1 12.2 12.1
Education and Health Services
21.6 21.8 21.6 21.6 21.7 21.5 21.4 21.6 21.6 21.9 21.9 21.9 21.7
Leisure and Hospitality
10.2 10.3 10.5 10.6 10.7 10.8 10.9 11.0 10.6 10.7 10.7 10.7 10.6
Government
14.6 14.7 14.8 14.7 14.5 14.3 14.2 15.2 15.0 15.0 15.1 14.9 14.8
Federal Government
1.1
1.1
1.1
1.1
1.1
1.1 1.1
1.1
1.1
1.1
1.1
1.1
1.1
State Government
4.1
4.2
4.2
4.2
4.0
4.1 4.2
4.4
4.5
4.3
4.3
4.3
4.2
Local Government
9.4
9.4
9.5
9.4
9.4
9.1 8.9
9.7
9.4
9.6
9.7
9.5
9.4
Note: These not seasonally adjusted estimates were prepared in cooperation with the U.S. Department of Labor, Bureau of Labor Statistics, based upon monthly reports submitted by se-
lected employers in the Macon-Bibb County Metropolitan Statistical Area, which includes Bibb, Crawford, Jones, Monroe and Twiggs counties. The estimates include all full- and part-time wage and salary workers who were employed during or received pay for any part of the pay period that includes the twelfth of the month. Proprietors, domestic workers, self-employed persons, unpaid family workers and personnel of the armed forces are excluded. Estimates based on 2020 benchmark.
Source: Georgia Department of Labor, Workforce Statistics & Economic Research
20
(In thousands)
Industry Total Nonfarm Total Private Goods Producing Service-Providing Private Service-Providing Manufacturing Trade, Transportation, and Utilities
Retail Trade Education and Health Services Government
Federal Government State Government Local Government
rome msa Nonfarm Employment
(Not Seasonally Adjusted)
2020 Preliminary Series
Annual Jan Feb Mar Apr M ay Jun Jul Aug Sep Oct Nov Dec Average
41.5 41.7 41.6 36.5 38.1 39.0 39.4 39.6 39.8 40.3 40.4 40.7 39.9
35.9 36.0 35.9 30.9 32.5 33.5 33.9 34.0 34.2 34.8 34.9 35.2 34.3
7.1
7.1
7.2
5.7
6.2
6.7 7.0
7.0
7.0
7.1
7.0
7.0
6.8
34.4 34.6 34.4 30.8 31.9 32.3 32.4 32.6 32.8 33.2 33.4 33.7 33.0
28.8 28.9 28.7 25.2 26.3 26.8 26.9 27.0 27.2 27.7 27.9 28.2 27.5
6.1
6.1
6.2
4.7
5.2
5.7 6.0
6.1
6.1
6.1
6.1
6.1
5.9
7.6
7.6
7.5
6.8
7.1
7.3 7.4
7.4
7.4
7.7
7.9
8.1
7.5
4.4
4.4
4.4
3.8
4.1
4.2 4.4
4.4
4.4
4.7
4.8
4.7
4.4
10.9 11.0 11.0 10.5 10.5 10.4 10.3 10.3 10.5 11.0 11.0 11.0 10.7
5.6
5.7
5.7
5.6
5.6
5.5 5.5
5.6
5.6
5.5
5.5
5.5
5.6
0.2
0.2
0.2
0.2
0.2
0.2 0.2
0.3
0.3
0.2
0.2
0.2
0.2
1.5
1.6
1.6
1.6
1.6
1.5 1.5
1.5
1.6
1.6
1.6
1.6
1.6
3.9
3.9
3.9
3.8
3.8
3.8 3.8
3.8
3.7
3.7
3.7
3.7
3.8
(In thousands)
2019 Final Series
Industry
Annual Jan Feb Mar Apr M ay Jun Jul Aug Sep Oct Nov Dec Average
Total Nonfarm
41.6 41.8 42.1 41.9 41.8 41.9 41.6 41.9 41.8 41.8 41.9 41.9 41.8
Total Private
36.0 36.1 36.4 36.2 36.1 36.3 36.0 36.0 36.1 36.1 36.2 36.2 36.1
Goods Producing
7.3
7.2
7.3
7.2
7.3
7.2 7.2
7.2
7.1
7.1
7.1
7.1
7.2
Service-Providing
34.3 34.6 34.8 34.7 34.5 34.7 34.4 34.7 34.7 34.7 34.8 34.8 34.6
Private Service-Providing
28.7 28.9 29.1 29.0 28.8 29.1 28.8 28.8 29.0 29.0 29.1 29.1 29.0
Manufacturing
6.3
6.2
6.3
6.2
6.2
6.2 6.2
6.2
6.1
6.1
6.1
6.1
6.2
Trade, Transportation, and Utilities
7.8
7.7
7.7
7.7
7.7
7.6 7.6
7.6
7.7
7.7
7.8
7.9
7.7
Retail Trade
4.5
4.4
4.5
4.5
4.5
4.4 4.4
4.4
4.5
4.5
4.6
4.6
4.5
Education and Health Services
10.7 10.7 10.7 10.8 10.6 10.6 10.5 10.6 10.8 10.9 10.9 11.0 10.7
Government
5.6
5.7
5.7
5.7
5.7
5.6 5.6
5.9
5.7
5.7
5.7
5.7
5.7
Federal Government
0.2
0.2
0.2
0.2
0.2
0.2 0.2
0.2
0.2
0.2
0.2
0.2
0.2
State Government
1.5
1.6
1.6
1.6
1.6
1.5 1.5
1.6
1.6
1.6
1.6
1.6
1.6
Local Government
3.9
3.9
3.9
3.9
3.9
3.9 3.9
4.1
3.9
3.9
3.9
3.9
3.9
Note: These not seasonally adjusted estimates were prepared in cooperation with the U.S. Department of Labor, Bureau of Labor Statistics, based upon monthly reports submitted by selected
employers in the Rome Metropolitan Statistical Area, which comprises Floyd county. The estimates include all full- and part-time wage and salary workers who were employed during or received pay for any part of the pay period that includes the twelfth of the month. Proprietors, domestic workers, self-employed persons, unpaid family workers and personnel of the armed forces are excluded. Estimates based on 2020 benchmark.
Source: Georgia Department of Labor, Workforce Statistics & Economic Research
21
(In thousands)
Industry Total Nonfarm Total Private Goods Producing Service-Providing Private Service-Providing Mining, Logging and Construction Manufacturing Trade, Transportation, and Utilities
Wholesale Trade Retail Trade Transportation, Warehousing, and Utilities Information Financial Activities Professional and Business Services Education and Health Services Leisure and Hospitality Other Services Government Federal Government State Government Local Government
savannah msa Nonfarm Employment
(Not Seasonally Adjusted)
2020 Preliminary Series
J an 189.3 164.6
26.9 162.4 137.7
8.5 18.4 44.0
6.5 22.1 15.4
1.5 6.4 24.6 27.3 26.1 7.8 24.7 2.9 5.4 16.4
Feb 190.4 165.6
27.0 163.4 138.6
8.6 18.4 44.1
6.5 22.1 15.5
1.5 6.5 24.7 27.5 26.4 7.9 24.8 2.9 5.6 16.3
M ar 192.4 167.3
27.0 165.4 140.3
8.6 18.4 43.6
6.5 22.0 15.1
4.6 6.5 24.0 27.4 26.3 7.9 25.1 3.0 5.6 16.5
Apr 162.2 137.5
25.6 136.6 111.9
8.1 17.5 39.0
6.4 18.5 14.1
1.5 5.9 21.4 24.6 14.2 5.3 24.7 3.0 5.5 16.2
M ay 170.3 145.9
26.0 144.3 119.9
8.3 17.7 40.0
6.4 19.6 14.0
1.5 5.9 22.5 25.1 18.6 6.3 24.4 3.0 5.5 15.9
Jun 175.2 151.0
25.7 149.5 125.3
8.5 17.2 41.5
6.2 20.8 14.5
1.5 6.0 22.6 25.4 21.5 6.8 24.2 3.0 5.2 16.0
Jul 175.1 151.3
25.2 149.9 126.1
8.2 17.0 41.8
6.4 21.0 14.4
1.4 6.0 22.5 25.3 22.2 6.9 23.8 3.0 5.0 15.8
Aug 178.8 153.8
25.1 153.7 128.7
8.2 16.9 43.0
6.4 21.1 15.5
1.4 6.0 23.2 25.4 22.7 7.0 25.0 3.5 5.2 16.3
Sep 179.1 154.5
25.0 154.1 129.5
8.1 16.9 43.0
6.3 21.0 15.7
1.6 5.9 23.9 25.8 22.3 7.0 24.6 3.4 5.3 15.9
Oct 182.2 157.3
24.9 157.3 132.4
8.1 16.8 43.5
6.4 21.2 15.9
1.6 6.0 25.1 26.1 23.0 7.1 24.9 3.3 5.4 16.2
Nov 185.0 160.6
25.6 159.4 135.0
8.5 17.1 45.6
6.4 22.1 17.1
1.6 6.0 25.2 26.2 23.4 7.0 24.4 3.0 5.4 16.0
Annual Dec Average
186.4 180.5
162.0 156.0
26.2 25.9
160.2 154.7
135.8 130.1
8.7
8.4
17.5 17.5
45.5 42.9
6.4
6.4
22.0 21.1
17.1 15.4
1.6
1.8
6.0
6.1
26.8 23.9
26.1 26.0
22.8 22.5
7.0
7.0
24.4 24.6
2.9
3.1
5.3
5.4
16.2 16.1
(In thousands)
2019 Final Series
Industry
Annual Jan Feb Mar Apr M ay Jun Jul Aug Sep Oct Nov Dec Average
Total Nonfarm
186.2 188.2 189.1 188.9 189.9 189.9 188.9 189.9 188.1 190.1 194.5 194.6 189.9
Total Private
161.8 163.6 164.4 164.2 165.2 165.3 164.6 164.4 163.2 165.2 169.7 169.7 165.1
Goods Producing
26.8 27.1 27.0 26.9 27.1 26.9 27.1 26.9 26.9 26.9 26.7 27.0 26.9
Service-Providing
159.4 161.1 162.1 162.0 162.8 163.0 161.8 163.0 161.2 163.2 167.8 167.6 162.9
Private Service-Providing
135.0 136.5 137.4 137.3 138.1 138.4 137.5 137.5 136.3 138.3 143.0 142.7 138.2
Mining, Logging and Construction
8.2
8.4
8.4
8.2
8.3
8.1 8.2
8.1
8.1
8.1
8.2
8.4
8.2
Manufacturing
18.6 18.7 18.6 18.7 18.8 18.8 18.9 18.8 18.8 18.8 18.5 18.6 18.7
Trade, Transportation, and Utilities
43.7 43.2 43.3 42.9 43.2 42.7 43.2 42.8 42.5 43.0 44.6 45.5 43.4
Wholesale Trade
6.6
6.6
6.6
6.4
6.5
6.4 6.4
6.5
6.4
6.4
6.5
6.5
6.5
Retail Trade
22.1 21.9 22.0 21.9 22.1 21.7 22.0 21.7 21.7 22.0 22.8 22.9 22.1
Transportation, Warehousing, and Utilities
15.0 14.7 14.7 14.6 14.6 14.6 14.8 14.6 14.4 14.6 15.3 16.1 14.8
Information
2.5
3.3
3.2
2.5
2.4
2.8 1.7
1.7
1.7
1.8
4.8
4.7
2.8
Financial Activities
6.3
6.3
6.3
6.3
6.3
6.4 6.4
6.4
6.4
6.5
6.5
6.5
6.4
Professional and Business Services
23.4 23.5 23.7 24.1 24.2 24.3 24.0 24.5 24.5 24.9 25.1 24.4 24.2
Education and Health Services
25.8 26.2 26.2 26.4 26.4 26.7 26.8 26.8 26.6 27.2 27.3 27.4 26.7
Leisure and Hospitality
25.9 26.5 27.1 27.5 27.9 27.8 27.8 27.7 27.0 27.1 27.0 26.4 27.1
Other Services
7.4
7.5
7.6
7.6
7.7
7.7 7.6
7.6
7.6
7.8
7.7
7.8
7.6
Government
24.4 24.6 24.7 24.7 24.7 24.6 24.3 25.5 24.9 24.9 24.8 24.9 24.8
Federal Government
2.9
2.9
2.9
2.9
2.9
2.9 2.9
3.0
3.0
3.0
2.9
2.9
2.9
State Government
5.6
5.7
5.7
5.7
5.7
5.5 5.4
5.6
5.7
5.6
5.6
5.6
5.6
Local Government
15.9 16.0 16.1 16.1 16.1 16.2 16.0 16.9 16.2 16.3 16.3 16.4 16.2
Note: These not seasonally adjusted estimates were prepared in cooperation with the U.S. Department of Labor, Bureau of Labor Statistics, based upon monthly reports submitted by
selected employers in the Savannah Metropolitan Statistical Area, which includes Bryan, Chatham and Effingham counties. The estimates include all full- and part-time wage and salary workers who were employed during or received pay for any part of the pay period that includes the twelfth of the month. Proprietors, domestic workers, self-employed persons, unpaid family workers and personnel of the armed forces are excluded. Estimates based on 2020 benchmark.
Source: Georgia Department of Labor, Workforce Statistics & Economic Research
22
(In thousands)
Industry Total Nonfarm Total Private Goods Producing Service-Providing Private Service-Providing Trade, Transportation, and Utilities
Retail Trade Government
Federal Government State Government Local Government
valdosta msa Nonfarm Employment
(Not Seasonally Adjusted)
2020 Preliminary Series
Annual Jan Feb Mar Apr M AY Jun Jul Aug Sep Oct Nov Dec Average
56.9 56.8 56.9 51.5 52.4 53.3 53.7 54.3 54.9 56.2 56.8 56.5 55.0
43.7 43.6 43.7 38.6 39.8 41.0 41.5 41.7 42.2 43.3 44.0 43.9 42.3
7.5
7.3
7.3
7.0
7.0
7.2 7.2
7.2
7.2
7.3
7.3
7.3
7.2
49.4 49.5 49.6 44.5 45.4 46.1 46.5 47.1 47.7 48.9 49.5 49.2 47.8
36.2 36.3 36.4 31.6 32.8 33.8 34.3 34.5 35.0 36.0 36.7 36.6 35.0
13.0 12.9 12.8 11.7 12.1 12.4 12.6 12.8 13.2 13.7 14.5 14.6 13.0
7.1
7.0
7.0
6.1
6.4
6.7 6.7
6.8
6.9
7.0
7.3
7.3
6.9
13.2 13.2 13.2 12.9 12.6 12.3 12.2 12.6 12.7 12.9 12.8 12.6 12.8
1.2
1.2
1.2
1.2
1.2
1.2 1.2
1.2
1.2
1.2
1.2
1.2
1.2
3.7
3.7
3.7
3.7
3.7
3.3 3.3
3.6
3.6
3.6
3.6
3.4
3.6
8.3
8.3
8.3
8.0
7.7
7.8 7.7
7.8
7.9
8.1
8.0
8.0
8.0
(In thousands)
2019 Final Series
Industry Total Nonfarm Total Private Goods Producing Service-Providing Private Service-Providing Trade, Transportation, and Utilities
Retail Trade Government
Federal Government State Government Local Government
Annual Jan Feb Mar Apr M AY Jun Jul Aug Sep Oct Nov Dec Average
55.9 56.0 56.3 56.5 56.5 56.5 55.9 56.4 56.9 57.4 57.3 57.6 56.6
42.6 42.8 43.1 43.2 43.3 43.4 43.3 43.3 43.6 44.1 44.1 44.5 43.4
7.5
7.6
7.5
7.4
7.4
7.6 7.3
7.4
7.5
7.7
7.5
7.6
7.5
48.4 48.4 48.8 49.1 49.1 48.9 48.6 49.0 49.4 49.7 49.8 50.0 49.1
35.1 35.2 35.6 35.8 35.9 35.8 36.0 35.9 36.1 36.4 36.6 36.9 35.9
12.6 12.6 12.6 12.6 12.7 12.7 12.8 12.7 12.8 12.9 13.1 13.3 12.8
7.0
7.0
7.0
7.0
7.0
7.0 7.0
7.0
7.1
7.2
7.4
7.5
7.1
13.3 13.2 13.2 13.3 13.2 13.1 12.6 13.1 13.3 13.3 13.2 13.1 13.2
1.2
1.2
1.2
1.2
1.2
1.2 1.2
1.2
1.2
1.2
1.2
1.2
1.2
3.7
3.7
3.7
3.7
3.7
3.6 3.5
3.8
3.8
3.7
3.7
3.7
3.7
8.4
8.3
8.3
8.4
8.3
8.3 7.9
8.1
8.3
8.4
8.3
8.2
8.3
Note: These not seasonally adjusted estimates were prepared in cooperation with the U.S. Department of Labor, Bureau of Labor Statistics, based upon monthly reports submitted by selected
employers in the Valdosta Metropolitan Statistical Area, which includes Brooks, Echols, Lanier and Lowndes counties. The estimates include all full- and part-time wage and salary workers who were employed during or received pay for any part of the pay period that includes the twelfth of the month. Proprietors, domestic workers, self-employed persons, unpaid family workers and personnel of the armed forces are excluded. Estimates based on 2020 benchmark.
Source: Georgia Department of Labor, Workforce Statistics & Economic Research
23
(In thousands)
Industry Total Nonfarm Total Private Goods Producing Service-Providing Private Service-Providing Trade, Transportation, and Utilities
Retail Trade Government
Federal Government State Government Local Government
warner robins msa Nonfarm Employment
(Not Seasonally Adjusted)
2020 Preliminary Series
Annual Jan Feb Mar Apr M ay Jun Jul Aug Sep Oct Nov Dec Average
78.4 78.9 78.7 70.1 73.3 74.6 75.3 75.4 76.1 76.4 77.2 77.1 76.0
50.3 50.7 50.5 42.1 46.1 47.4 47.6 47.8 47.9 48.2 48.9 48.9 48.0
10.4 10.5 10.5
8.5 10.4 10.2 10.1 10.1 10.2 10.1 10.2 10.2 10.1
68.0 68.4 68.2 61.6 62.9 64.4 65.2 65.3 65.9 66.3 67.0 66.9 65.8
39.9 40.2 40.0 33.6 35.7 37.2 37.5 37.7 37.7 38.1 38.7 38.7 37.9
11.3 11.3 11.3 10.1 10.7 11.1 11.0 11.1 11.2 11.2 11.6 11.5 11.1
8.6
8.6
8.6
7.6
8.1
8.5 8.5
8.6
8.7
8.8
9.3
9.2
8.6
28.1 28.2 28.2 28.0 27.2 27.2 27.7 27.6 28.2 28.2 28.3 28.2 27.9
15.8 15.8 15.8 15.8 15.8 15.9 16.0 16.0 15.9 15.8 15.8 15.7 15.8
2.3
2.4
2.4
2.4
2.2
2.1 2.1
2.2
2.3
2.4
2.4
2.4
2.3
10.0 10.0 10.0
9.8
9.2
9.2 9.6
9.4 10.0 10.0 10.1 10.1
9.8
(In thousands)
2019 Final Series
Industry
Jan Feb Mar Apr M ay Jun
Jul Aug Sep
Annual Oct Nov Dec Average
Total Nonfarm Total Private Goods Producing Service-Providing Private Service-Providing Trade, Transportation, and Utilities
Retail Trade Government
Federal Government State Government Local Government
76.3 77.0 77.5 77.4 78.0 78.0 78.6 78.3 78.7 78.6 79.2 79.4 78.1
48.5 48.9 49.4 49.4 50.0 50.1 50.5 50.7 50.5 50.1 51.0 51.1 50.0
10.2 10.3 10.5 10.3 10.4 10.6 10.7 10.6 10.5 10.1 10.5 10.5 10.4
66.1 66.7 67.0 67.1 67.6 67.4 67.9 67.7 68.2 68.5 68.7 68.9 67.7
38.3 38.6 38.9 39.1 39.6 39.5 39.8 40.1 40.0 40.0 40.5 40.6 39.6
11.1 11.0 11.0 11.1 11.2 11.2 11.1 11.1 11.2 11.2 11.6 11.7 11.2
8.5
8.4
8.5
8.5
8.6
8.6 8.5
8.5
8.5
8.5
8.9
9.0
8.6
27.8 28.1 28.1 28.0 28.0 27.9 28.1 27.6 28.2 28.5 28.2 28.3 28.1
15.4 15.6 15.6 15.6 15.7 15.7 15.8 15.7 15.7 15.7 15.8 15.8 15.7
2.3
2.4
2.4
2.4
2.3
2.3 2.3
2.3
2.5
2.7
2.4
2.4
2.4
10.1 10.1 10.1 10.0 10.0
9.9 10.0
9.6 10.0 10.1 10.0 10.1 10.0
Note: These not seasonally adjusted estimates were prepared in cooperation with the U.S. Department of Labor, Bureau of Labor Statistics, based upon monthly reports submitted by selected
employers in the Warner Robins Metropolitan Statistical Area, which comprises Houston, Peach and Pulaski counties. The estimates include all full- and part-time wage and salary workers who were employed during or received pay for any part of the pay period that includes the twelfth of the month. Proprietors, domestic workers, self-employed persons, unpaid family workers and personnel of the armed forces are excluded. Estimates based on 2020 benchmark.
Source: Georgia Department of Labor, Workforce Statistics & Economic Research
24
total Nonfarm Employment by Metro Statistical Area
(Seasonally Adjusted)
(In thousands)
2020 Preliminary Series
Industry Jan Feb Mar Apr M ay Jun Jul Aug Sep Oct Nov Dec
Albany MSA Athens-Clarke County MSA Atlanta MSA Augusta-Richmond MSA Brunswick MSA Columbus MSA Dalton MSA Gainesville MSA Hinesville MSA Macon-Bibb County MSA Rome MSA Savannah MSA Valdosta MSA Warner Robins MSA
63.3 63.1 62.8 55.8 57.7 59.1 59.6 59.9 59.9 98.1 98.0 97.4 84.6 87.6 89.7 90.3 91.3 91.3 2,886.7 2,881.7 2,864.3 2,493.4 2,560.9 2,625.1 2,637.9 2,665.3 2,678.4 246.2 246.3 245.5 213.8 223.0 229.4 231.0 233.3 236.2 44.7 44.4 44.0 36.1 38.6 41.0 41.1 41.6 42.0 123.2 123.6 122.9 110.4 112.7 116.2 115.8 116.5 117.1 66.5 66.7 66.8 56.6 61.0 62.9 62.6 63.4 64.0 95.3 95.4 95.1 85.5 88.2 90.3 91.1 91.8 92.2 21.4 21.3 21.1 19.4 19.9 20.4 20.1 20.3 20.5 103.3 103.0 102.7 92.1 94.5 96.8 96.2 97.2 97.6 41.6 41.8 41.6 36.4 38.0 38.9 39.5 39.8 39.9 192.1 191.5 192.1 161.0 169.3 175.0 175.6 179.0 180.1 57.1 56.9 56.8 51.1 52.2 53.6 54.4 54.7 55.0 79.2 79.1 78.8 69.9 73.0 74.3 75.4 75.4 76.1
59.5 59.4 92.3 92.5 2,694.3 2,701.9 236.7 236.8 42.1 42.1 116.6 116.7 64.6 64.6 93.3 93.5 20.5 20.6 97.9 98.2 40.0 40.1 182.5 183.9 55.5 55.8 76.5 76.9
59.7 92.7 2,712.8 238.6 42.5 117.0 64.6 93.3 20.7 98.7 40.4 186.0 56.0 77.0
(In thousands)
2019 Final Series
Industry Jan Feb Mar Apr M ay Jun Jul Aug Sep Oct Nov Dec
Albany MSA
62.2 62.3 62.6 63.0 62.8 63.1 62.9 63.1 63.1 62.9 62.5 62.7
Athens-Clarke County MSA
97.3 97.2 96.9 97.4 97.3 97.0 97.7 98.8 98.7 98.3 98.2 98.0
Atlanta MSA
2,834.3 2,837.2 2,838.9 2,839.9 2,843.8 2,848.2 2,850.4 2,854.1 2,859.2 2,861.6 2,864.4 2,871.1
Augusta-Richmond MSA
240.7 240.4 241.1 242.0 242.5 243.1 243.9 244.6 245.0 245.3 245.7 245.6
Brunswick MSA
43.8 43.8 43.6 43.7 43.7 43.8 43.9 43.9 44.0 44.4 44.5 44.3
Columbus MSA
122.3 122.4 122.2 122.2 122.4 122.1 122.2 122.5 122.4 122.7 123.0 123.0
Dalton MSA
66.7 66.4 66.6 66.9 66.6 66.4 66.4 66.1 66.6 66.5 66.7 66.6
Gainesville MSA
93.1 93.2 93.3 93.4 93.3 93.6 93.8 94.3 94.3 94.6 94.7 95.0
Hinesville MSA
21.1 21.2 21.2 21.2 21.2 21.2 21.2 21.1 21.1 21.2 21.2 21.2
Macon-Bibb County MSA
102.5 102.7 102.8 102.5 102.7 102.8 102.9 103.5 103.1 103.3 103.2 103.1
Rome MSA
41.9 41.9 42.1 41.8 41.7 41.8 41.8 42.0 41.8 41.8 41.7 41.6
Savannah MSA
189.1 189.6 189.0 188.7 189.2 189.6 189.2 189.9 189.0 190.3 192.2 193.7
Valdosta MSA
56.3 56.4 56.2 56.3 56.4 56.8 56.7 56.6 57.0 57.1 56.6 57.1
Warner Robins MSA
77.0 77.2 77.6 77.2 77.5 77.7 78.8 78.3 78.7 78.6 78.9 79.1
Note: These seasonally adjusted estimates were prepared in cooperation with the U.S. Department of Labor, Bureau of Labor Statistics, based upon monthly reports submitted by selected
employers throughout Georgia. The estimates include all full- and part-time wage and salary workers who were employed during or received pay for any part of the pay period that includes the twelfth of the month. Proprietors, domestic workers, self-employed persons, unpaid family workers and personnel of the armed forces are excluded. Estimates based on 2020 benchmark.
Source: Georgia Department of Labor, Workforce Statistics & Economic Research
25
msa Nonfarm Employment
2013 2020 Annual Average Employment
Georgia
4,700,000 4,550,000 4,400,000 4,250,000 4,100,000
4,371,300
4,452,600
4,535,700
4,261,400
4,144,700
4,032,400
4,619,900 4,406,500
3,950,000
3,800,000 2013
2014
2015
2016
2017
2018
2019
2020
65,000 64,000 63,000 62,000 61,000 60,000 59,000
61,000 2013
61,100 2014
Albany MSA
61,100
62,000
62,900
62,200
2015
2016
2017
2018
62,800 2019
60,000 2020
Athens-Clarke County MSA
101,000 98,000 95,000 92,000 89,000 86,000 83,000
88,200 2013
89,200 2014
91,300 2015
94,000 2016
96,800 2017
98,300 2018
97,800 92,100
2019
2020
Atlanta MSA
2,850,000 2,750,000 2,650,000 2,550,000 2,450,000
2,850,400
2,785,900
2,727,600 2,665,000
2,699,700
2,582,400 2,503,900
2,415,100
2,350,000
2,250,000
2013
2014
2015
2016
2017
2018
2019
2020
244,000 239,000 234,000 229,000
Augusta-Richmond County MSA
243,300
236,200
239,600
232,400
228,500
234,800
224,000 219,000
218,500
222,500
214,000
2013
2014
2015
2016
2017
2018
2019
2020
46,000 44,000 42,000 40,000 38,000 36,000 34,000
40,700 2013
40,700 2014
Brunswick MSA
41,800
43,000
43,400
44,100
2015
2016
2017
2018
44,000 2019
41,700 2020
124,000 123,000 122,000 121,000 120,000 119,000 118,000 117,000
Columbus MSA
121,200
121,600
120,700
120,200
120,800
122,200
122,500
2013
2014
2015
2016
2017
2018
117,500
2019
2020
70,000 68,000 66,000 64,000 62,000
62,500
64,800
Dalton MSA
66,400
66,900
66,800
67,700
66,600
63,700
60,000
58,000
2013
2014
2015
2016
2017
2018
2019
2020
Source: Georgia Department of Labor, Workforce Statistics & Economic Research
26
msa Nonfarm Employment
2013 2020 Annual Average Employment
94,000 90,000 86,000 82,000 78,000 74,000 70,000
77,300 2013
Gainesville MSA
79,800
84,000
86,700
89,900
92,300
2014
2015
2016
2017
2018
93,900 2019
92,000 2020
Hinesville MSA
22,000
21,500 21,000 20,500 20,000 19,500
19,600
19,600
19,700
19,800
20,300
20,700
21,200
20,500
19,000
2013
2014
2015
2016
2017
2018
2019
2020
Macon-Bibb County MSA
106,000
104,000 102,000 100,000
98,000
100,200
101,000
102,400
102,800
102,800
102,900
98,200
98,200
96,000
94,000
2013
2014
2015
2016
2017
2018
2019
2020
43,000 42,000 41,000 40,000 39,000
38,800
39,700
Rome MSA
40,200
40,600
41,000
41,600
41,800
39,900
38,000
37,000
2013
2014
2015
2016
2017
2018
2019
2020
194,000 188,000 182,000 176,000 170,000 164,000 158,000
Savannah MSA
173,000
177,700
180,800
185,800
189,900
180,500
166,800 161,300
2013
2014
2015
2016
2017
2018
2019
2020
58,000 57,000 56,000 55,000 54,000 53,000 52,000
53,500 2013
54,200 2014
Valdosta MSA
55,200
56,000
55,800
56,100
2015
2016
2017
2018
56,600 2019
55,000 2020
80,000
78,000
76,000
74,000
72,000 70,000
70,600
68,000
2013
Warner Robins MSA
70,200
70,800
72,600
73,800
75,600
2014
2015
2016
2017
2018
78,100 2019
76,000 2020
Source: Georgia Department of Labor, Workforce Statistics & Economic Research
27
Georgia Hours and Earnings
Industry
Total Private Goods Producing Private Service Providing Construction Manufacturing Trade, Transportation, and Utilities Financial Activities Professional and Business Services Educational and Health Services Leisure and Hospitality Other Services
Jan
26.80 26.07 26.96 27.65 24.94 23.79 35.39 32.65 29.17 13.69 23.54
2020 All Employee
Average Hourly Earnings (AHE)
Feb Mar Apr May Jun Jul Aug Sep Oct Nov Dec Average
26.93 26.03 27.13 27.48 25.11 23.67 36.51 32.99 28.98 13.79 24.03
26.58 26.07 26.70 26.93 25.51 23.63 34.95 32.49 29.26 13.64 23.58
28.07 27.04 28.31 27.20 26.93 25.00 35.07 33.74 30.38 14.29 25.18
27.24 26.97 27.30 27.26 26.57 24.18 34.71 32.59 29.85 14.18 25.16
27.21 26.55 27.37 27.20 26.10 23.66 37.82 32.38 29.84 13.73 24.71
27.30 26.48 27.49 27.16 26.00 24.11 38.55 31.61 29.99 13.61 24.38
27.70 26.61 27.95 27.49 25.95 24.18 38.53 32.05 30.48 13.76 24.53
27.61 26.60 27.85 27.46 25.94 24.34 37.01 31.96 30.77 13.84 24.26
27.64 26.71 27.86 28.00 25.56 24.26 37.50 31.54 30.74 14.05 24.88
28.00 26.98 28.23 28.39 25.79 24.15 40.89 31.72 30.83 14.08 25.36
27.59 27.31 27.65 28.54 26.18 23.64 38.54 31.47 31.40 14.35 25.47
27.38 26.61 27.55 27.57 25.85 24.04 37.10 32.25 30.13 13.90 24.56
Industry
Total Private Goods Producing Private Service Providing Construction Manufacturing Trade, Transportation, and Utilities Financial Activities Professional and Business Services Educational and Health Services Leisure and Hospitality Other Services
Jan
34.5 40.7 33.4 39.6 41.6 34.2 37.4 35.3 34.3 25.9 30.9
Average Weekly Hours (AWH)
Feb
34.8 40.4 33.8 39.2 41.5 34.2 38.1 35.9 34.7 26.4 31.4
Mar
34.8 40.9 33.6 40.4 41.6 34.4 38.2 35.7 34.1 25.8 31.5
Apr
33.7 38.9 32.7 39.6 38.5 32.9 37.1 35.5 32.5 24.0 33.1
May
34.4 39.8 33.3 40.9 39.1 33.9 37.5 36.1 33.4 26.3 33.9
Jun
34.3 40.3 33.1 40.5 40.2 34.1 35.2 36.1 33.8 26.8 32.6
Jul
34.2 40.3 33.0 40.8 40.0 33.8 35.5 35.6 33.8 26.8 33.2
Aug
34.9 40.9 33.8 40.5 41.2 34.2 36.7 37.0 34.8 27.1 32.6
Sep
34.4 40.4 33.3 39.9 40.9 34.2 36.0 36.1 34.4 26.7 32.0
Oct
34.7 41.9 33.4 41.2 42.3 34.3 35.5 36.6 34.0 26.8 31.1
Nov
35.1 41.7 33.9 41.0 42.1 34.5 37.0 37.3 34.5 27.1 31.5
Dec
34.9 41.9 33.6 41.6 42.0 34.3 35.4 37.1 34.9 26.3 30.8
Average
34.6 40.7 33.4 40.4 40.9 34.1 36.6 36.2 34.1 26.4 32.0
Industry
Total Private Goods Producing Private Service Providing Construction Manufacturing Trade, Transportation, and Utilities Financial Activities Professional and Business Services Educational and Health Services Leisure and Hospitality Other Services
Average Weekly Earnings (AWE)
Jan
Feb Mar Apr May Jun Jul Aug Sep Oct Nov Dec Average
924.60 937.16 924.98 945.96 937.06 933.30 933.66 966.73 949.78 959.11 982.80 962.89 947.35 1,061.051,051.611,066.261,051.861,073.411,069.97 1,067.14 1,088.35 1,074.64 1,119.15 1,125.07 1,144.29 1,083.03 900.46 916.99 897.12 925.74 909.09 905.95 907.17 944.71 927.41 930.52 957.00 929.04 920.17 1,094.941,077.221,087.971,077.12 1,114.93 1,101.60 1,108.13 1,113.351,095.65 1,153.60 1,163.99 1,187.26 1,113.83 1,037.501,042.071,061.221,036.811,038.891,049.221,040.001,069.14 1,060.95 1,081.19 1,085.761,099.56 1,057.27 813.62 809.51 812.87 822.50 819.70 806.81 814.92 826.96 832.43 832.12 833.18 810.85 819.76 1,323.591,391.031,335.091,301.101,301.63 1,331.261,368.53 1,414.051,332.36 1,331.25 1,512.931,364.32 1,357.86 1,152.551,184.341,159.89 1,197.77 1,176.50 1,168.92 1,125.32 1,185.85 1,153.76 1,154.36 1,183.16 1,167.54 1,167.45 1,000.531,005.61 997.77 987.35 996.991,008.59 1,013.661,060.701,058.491,045.16 1,063.641,095.86 1,027.43 354.57 364.06 351.91 342.96 372.93 367.96 364.75 372.90 369.53 376.54 381.57 377.41 366.96 727.39 754.54 742.77 833.46 852.92 805.55 809.42 799.68 776.32 773.77 798.84 784.48 785.92
28
Source: Georgia Department of Labor, Workforce Statistics & Economic Research
Georgia Hours and Earnings
Industry
Total Private Goods Producing Private Service Providing Construction Manufacturing Trade, Transportation, and Utilities Financial Activities Professional and Business Services Educational and Health Services Leisure and Hospitality Other Services
Jan
26.89 25.21 27.29 26.29 24.00 23.94 36.16 32.17 30.20 13.65 25.24
2019 All Employee
Average Hourly Earnings (AHE)
Feb Mar Apr May Jun Jul Aug Sep Oct Nov Dec Average
26.75 25.47 27.05 26.81 24.15 23.77 35.82 32.19 29.86 13.65 24.61
26.56 25.36 26.84 26.54 24.17 23.48 35.55 32.14 30.17 13.53 24.32
26.50 25.48 26.74 26.54 24.40 23.46 35.33 32.40 30.00 13.81 24.10
26.37 25.35 26.61 26.81 24.11 23.37 34.33 32.23 29.56 13.70 23.98
26.54 25.41 26.81 26.79 24.26 23.51 35.43 32.26 29.68 13.54 24.12
26.28 25.36 26.49 26.94 24.10 23.35 34.77 31.56 29.44 13.62 24.13
26.47 25.34 26.73 26.74 24.16 23.45 34.90 32.03 29.72 13.61 23.59
26.67 25.82 26.87 27.14 24.71 23.67 35.10 32.26 29.27 13.70 23.73
26.80 26.08 26.96 27.06 25.12 23.68 34.46 32.07 30.49 13.85 23.54
26.56 25.82 26.73 27.39 24.69 23.63 34.37 32.04 29.06 13.75 23.91
26.98 26.22 27.15 27.82 25.10 23.76 35.58 33.11 29.11 13.82 24.02
26.61 25.58 26.86 26.90 24.41 23.59 35.15 32.21 29.71 13.69 24.10
Industry
Total Private Goods Producing Private Service Providing Construction Manufacturing Trade, Transportation, and Utilities Financial Activities Professional and Business Services Educational and Health Services Leisure and Hospitality Other Services
Jan
34.5 42.1 33.1 42.1 42.4 33.8 36.9 35.4 34.0 26.0 30.0
Average Weekly Hours (AWH)
Feb
34.6 41.7 33.2 41.6 42.0 33.7 36.9 35.6 34.1 26.4 30.3
Mar
34.8 41.9 33.5 42.0 42.0 33.8 36.7 35.5 34.5 26.4 30.6
Apr
34.5 41.6 33.2 41.9 41.5 33.8 36.2 35.2 33.7 27.5 30.4
May
34.6 41.8 33.3 41.6 41.9 33.9 36.4 35.3 34.3 27.3 30.6
Jun
35.3 42.2 34.0 41.9 42.4 34.6 37.7 36.1 34.9 27.9 31.3
Jul
34.8 41.5 33.5 41.8 41.4 34.6 36.6 35.3 34.6 27.2 29.9
Aug
34.9 41.9 33.6 42.0 41.9 34.5 36.7 35.6 34.7 27.1 31.1
Sep
35.1 41.6 33.9 41.5 41.6 34.6 37.9 36.1 35.0 26.8 31.1
Oct
34.7 41.4 33.5 41.4 41.5 34.4 36.9 35.3 34.5 26.9 30.7
Nov
34.8 40.9 33.7 39.8 41.7 34.5 37.5 35.4 34.8 26.7 30.7
Dec
35.2 41.1 34.1 39.7 42.2 34.8 38.4 36.1 34.9 26.9 30.3
Average
34.8 41.6 33.6 41.4 41.9 34.3 37.1 35.6 34.5 26.9 30.6
Industry
Total Private Goods Producing Private Service Providing Construction Manufacturing Trade, Transportation, and Utilities Financial Activities Professional and Business Services Educational and Health Services Leisure and Hospitality Other Services
Average Weekly Earnings (AWE)
Jan
Feb Mar Apr May Jun Jul Aug Sep Oct Nov Dec Average
927.71 925.55 924.29 914.25 912.40 936.86 914.54 923.80 936.12 929.96 924.29 949.70 926.03 1,061.341,062.101,062.581,059.971,059.631,072.301,052.441,061.75 1,074.11 1,079.71 1,056.04 1,077.64 1,064.13 903.30 898.06 899.14 887.77 886.11 911.54 887.42 898.13 910.89 903.16 900.80 925.82 902.50 1,106.811,115.30 1,114.68 1,112.03 1,115.30 1,122.50 1,126.09 1,123.08 1,126.31 1,120.281,090.12 1,104.45 1,113.66 1,017.601,014.301,015.14 1,012.60 1,010.211,028.62 997.74 1,012.30 1,027.941,042.481,029.571,059.22 1,022.78 809.17 801.05 793.62 792.95 792.24 813.45 807.91 809.03 818.98 814.59 815.24 826.85 809.14 1,334.301,321.761,304.691,278.951,249.611,335.711,272.581,280.831,330.29 1,271.571,288.881,366.27 1,304.07 1,138.821,145.961,140.97 1,140.48 1,137.72 1,164.59 1,114.07 1,140.27 1,164.59 1,132.07 1,134.22 1,195.27 1,146.68 1,026.801,018.231,040.871,011.001,013.911,035.83 1,018.62 1,031.281,024.45 1,051.91 1,011.29 1,015.94 1,025.00 354.90 360.36 357.19 379.78 374.01 377.77 370.46 368.83 367.16 372.57 367.13 371.76 368.26 757.20 745.68 744.19 732.64 733.79 754.96 721.49 733.65 738.00 722.68 734.04 727.81 737.46
Source: Georgia Department of Labor, Workforce Statistics & Economic Research
29
Metro Statistical Area Albany MSA Athens-Clarke County MSA Atlanta MSA Augusta-Richmond County MSA Brunswick MSA Columbus MSA Dalton MSA Gainesville MSA Hinesville MSA Macon-Bibb County MSA Rome MSA Savannah MSA Valdosta MSA Warner Robins MSA
Metro Statistical Area Albany MSA Athens-Clarke County MSA Atlanta MSA Augusta-Richmond County MSA Brunswick MSA Columbus MSA Dalton MSA Gainesville MSA Hinesville MSA Macon-Bibb County MSA Rome MSA Savannah MSA Valdosta MSA Warner Robins MSA
Metro Statistical Area Albany MSA Athens-Clarke County MSA Atlanta MSA Augusta-Richmond County MSA Brunswick MSA Columbus MSA Dalton MSA Gainesville MSA Hinesville MSA Macon-Bibb County MSA Rome MSA Savannah MSA Valdosta MSA Warner Robins MSA
30
msa Hours and Earnings
Jan 21.40 24.73 29.48 24.68 19.91 24.08 20.18 27.04 22.27 23.02 21.72 22.88 21.58 21.00
2020 All Employee
Average Hourly Earnings (AHE)
Feb 21.72 24.96 29.61 24.64 20.02 23.98 19.99 26.83 21.32 23.58 22.53 22.78 21.69 21.07
Mar 21.55 24.86 29.31 24.83 19.61 24.36 19.73 26.87 21.16 23.50 22.19 22.54 21.29 21.46
Apr 21.96 25.66 30.98 26.39 20.48 25.24 19.80 28.06 22.65 25.09 23.02 23.20 23.10 23.49
May 21.47 24.02 30.14 25.47 20.27 24.45 18.89 27.84 20.52 23.90 22.85 22.78 25.72 23.28
Jun 21.40 24.89 29.85 24.96 19.82 23.90 19.28 28.03 21.10 24.14 22.81 22.89 23.88 23.44
Jul 21.48 24.95 30.07 25.52 20.04 24.06 19.06 27.72 22.60 24.53 23.22 22.79 23.77 23.36
Aug 20.87 24.68 30.64 25.79 19.93 24.00 19.58 28.18 21.66 24.37 24.03 23.63 23.44 24.48
Sep 21.04 24.97 30.34 25.96 20.29 23.84 20.12 29.17 21.30 23.68 22.20 23.75 22.65 24.43
Oct 20.85 23.81 30.59 25.83 20.43 23.45 20.16 28.26 20.66 23.69 22.09 22.94 24.09 24.64
Nov 20.44 24.57 30.86 26.55 20.01 23.61 20.15 30.16 20.40 23.93 22.88 23.49 23.68 24.44
Dec 20.08 24.43 30.65 26.82 22.17 22.66 20.38 28.09 19.83 23.77 22.76 22.97 23.19 24.39
Average 21.19 24.70 30.20 25.61 20.24 23.96 19.79 28.02 21.27 23.91 22.69 23.05 23.14 23.23
Jan 34.3 31.2 34.3 34.8 31.4 33.2 33.5 39.3 31.6 37.1 35.3 33.3 35.6 38.5
Average Weekly Hours (AWH)
Feb 34.8 31.4 34.7 35.1 33.1 33.2 34.1 39.7 29.8 36.8 34.7 33.1 35.6 37.6
Mar 33.9 31.9 34.6 35.2 33.1 32.8 32.5 39.1 31.1 36.1 34.5 32.8 35.2 37.2
Apr 33.5 31.7 34.0 34.7 31.9 33.0 32.5 37.9 29.2 35.3 34.4 31.3 31.9 35.9
May 33.4 32.9 34.6 35.4 35.1 33.5 32.9 38.0 31.6 36.1 35.6 32.2 34.6 34.7
Jun 34.1 32.5 34.5 35.2 34.3 34.1 33.2 38.6 31.1 36.0 36.7 31.9 34.5 34.7
Jul 34.2 31.7 34.3 34.6 34.8 33.7 34.2 38.6 29.5 35.9 35.9 31.5 35.6 35.6
Aug 33.5 32.6 35.1 35.3 35.4 33.3 33.8 39.7 30.3 37.0 37.0 32.1 35.2 36.5
Sep 33.7 31.4 34.8 34.7 34.9 33.0 33.5 39.1 30.4 36.1 35.3 32.1 34.0 36.1
Oct 34.4 31.8 34.9 35.2 34.3 33.3 34.2 38.9 30.1 36.2 34.8 32.8 34.4 34.8
Nov 34.5 32.4 35.4 35.0 34.1 33.5 34.6 39.5 30.2 36.6 35.0 33.0 34.1 35.7
Dec 33.5 32.5 35.1 34.6 33.1 33.8 34.0 39.7 30.5 36.6 34.3 32.9 33.8 35.9
Average 34.0 32.0 34.7 35.0 33.8 33.4 33.6 39.0 30.5 36.3 35.3 32.4 34.6 36.1
Average Weekly Earnings (AWE)
Jan
Feb Mar Apr May Jun Jul Aug Sep Oct Nov Dec Average
734.02 755.86 730.55 735.66 717.10 729.74 734.62 699.15 709.05 717.24 705.18 672.68 720.46
771.58 783.74 793.03 813.42 790.26 808.93 790.92 804.57 784.06 757.16 796.07 793.98 790.40
1,011.16 1,027.47 1,014.13 1,053.32 1,042.84 1,029.83 1,031.40 1,075.46 1,055.83 1,067.59 1,092.44 1,075.82 1,047.94
858.86 864.86 874.02 915.73 901.64 878.59 882.99 910.39 900.81 909.22 929.25 927.97 896.35
625.17 662.66 649.09 653.31 711.48 679.83 697.39 705.52 708.12 700.75 682.34 733.83 684.11
799.46 796.14 799.01 832.92 819.08 814.99 810.82 799.20 786.72 780.89 790.94 765.91 800.26
676.03 681.66 641.23 643.50 621.48 640.10 651.85 661.80 674.02 689.47 697.19 692.92 664.94
1,062.671,065.15 1,050.62 1,063.47 1,057.92 1,081.96 1,069.99 1,118.75 1,140.55 1,099.31 1,191.32 1,115.17 1,092.78
703.73 635.34 658.08 661.38 648.43 656.21 666.70 656.30 647.52 621.87 616.08 604.82 648.74
854.04 867.74 848.35 885.68 862.79 869.04 880.63 901.69 854.85 857.58 875.84 869.98 867.93
766.72 781.79 765.56 791.89 813.46 837.13 833.60 889.11 783.66 768.73 800.80 780.67 800.96
761.90 754.02 739.31 726.16 733.52 730.19 717.89 758.52 762.38 752.43 775.17 755.71 746.82
768.25 772.16 749.41 736.89 889.91 823.86 846.21 825.09 770.10 828.70 807.49 783.82 800.64
808.50 792.23 798.31 843.29 807.82 813.37 831.62 893.52 881.92 857.47 872.51 875.60 838.60
Source: Georgia Department of Labor, Workforce Statistics & Economic Research
Metro Statistical Area Albany MSA Athens-Clarke County MSA Atlanta MSA Augusta-Richmond County MSA Brunswick MSA Columbus MSA Dalton MSA Gainesville MSA Hinesville MSA Macon-Bibb County MSA Rome MSA Savannah MSA Valdosta MSA Warner Robins MSA
Metro Statistical Area Albany MSA Athens-Clarke County MSA Atlanta MSA Augusta-Richmond County MSA Brunswick MSA Columbus MSA Dalton MSA Gainesville MSA Hinesville MSA Macon-Bibb County MSA Rome MSA Savannah MSA Valdosta MSA Warner Robins MSA
Metro Statistical Area Albany MSA Athens-Clarke County MSA Atlanta MSA Augusta-Richmond County MSA Brunswick MSA Columbus MSA Dalton MSA Gainesville MSA Hinesville MSA Macon-Bibb County MSA Rome MSA Savannah MSA Valdosta MSA Warner Robins MSA
msa Hours and Earnings
Jan 20.44 25.22 29.43 23.78 20.54 22.57 20.86 25.02 21.61 23.74 20.24 22.96 21.05 21.03
2019 All Employee
Average Hourly Earnings (AHE)
Feb 20.62 24.89 29.18 24.52 20.24 22.52 20.90 24.98 21.42 24.15 19.64 23.04 21.73 21.06
Mar 21.17 25.22 29.06 24.67 19.60 23.13 21.13 24.98 20.87 24.02 20.47 22.40 21.51 20.90
Apr 21.14 24.81 29.04 23.56 19.78 23.46 20.72 24.91 21.51 24.65 20.71 22.80 21.71 20.97
May 21.43 24.61 28.88 24.04 19.75 23.33 21.27 25.44 22.60 24.48 20.74 22.44 21.60 20.84
Jun 21.58 24.65 29.17 24.75 20.06 23.05 20.92 25.51 22.10 24.19 20.69 22.54 21.81 20.88
Jul 21.17 24.60 28.81 23.84 19.69 22.84 20.34 25.29 21.82 23.71 20.87 22.39 21.15 20.78
Aug 21.93 24.76 28.95 24.09 19.88 23.16 20.36 26.53 22.23 23.90 22.44 22.45 21.43 20.57
Sep 22.13 24.39 29.23 24.62 20.06 23.60 20.71 25.90 21.97 23.40 21.09 23.15 21.50 20.50
Oct 21.56 24.93 29.37 24.18 20.15 23.15 20.82 25.85 24.04 23.19 20.95 23.38 21.96 20.76
Nov 21.55 24.55 29.04 24.28 19.77 23.73 20.58 26.80 22.99 23.21 20.79 22.79 21.29 20.85
Dec 21.59 25.76 29.45 24.65 19.97 23.86 20.70 27.07 22.88 23.02 21.34 23.24 21.91 21.29
Average 21.36 24.87 29.13 24.25 19.95 23.20 20.78 25.70 22.16 23.80 20.83 22.80 21.56 20.87
Average Weekly Hours (AWH)
Jan 35.4 31.7 34.4 34.4 30.5 34.8 34.3 39.9 33.9 36.4 36.0 32.8 34.7 36.8
Feb 34.2 31.0 34.4 34.6 30.8 35.0 34.5 39.1 34.5 36.6 35.2 33.3 36.8 37.0
Mar 34.5 31.1 34.8 34.9 32.0 35.3 33.9 38.6 34.1 36.5 35.0 33.3 36.7 38.1
Apr 35.4 31.6 34.3 35.8 32.1 34.8 33.9 38.9 34.4 36.5 34.6 33.1 36.7 37.4
May 35.0 31.5 34.6 34.9 32.3 34.7 34.2 38.7 33.5 36.7 35.1 33.3 37.3 38.3
Jun 35.3 32.3 35.3 35.4 31.9 35.9 34.8 39.6 34.5 37.1 35.4 33.1 37.8 39.6
Jul 35.2 31.7 34.7 35.0 32.0 35.1 34.3 39.7 34.3 36.8 34.8 33.5 36.4 38.7
Aug 35.0 30.0 34.9 35.0 31.7 34.7 34.7 38.7 35.0 36.7 34.1 33.3 36.3 39.8
Sep 35.1 30.7 35.2 35.2 30.0 34.8 34.8 39.2 34.1 37.4 35.3 32.8 35.9 40.4
Oct 35.2 30.6 34.7 35.2 31.2 34.8 34.5 39.0 34.2 36.9 35.3 33.4 35.1 37.9
Nov 35.4 30.8 34.6 35.1 31.2 34.2 33.9 38.7 32.3 37.3 35.3 33.6 35.6 38.7
Dec 34.9 31.7 35.1 35.0 30.4 34.4 34.2 39.4 32.7 37.4 35.3 33.5 37.3 39.1
Average 35.1 31.2 34.8 35.0 31.3 34.9 34.3 39.1 34.0 36.9 35.1 33.3 36.4 38.5
Average Weekly Earnings (AWE)
Jan
Feb Mar Apr May Jun Jul Aug Sep Oct Nov Dec Average
723.58 705.20 730.37 748.36 750.05 761.77 745.18 767.55 776.76 758.91 762.87 753.49 749.74
799.47 771.59 784.34 784.00 775.22 796.20 779.82 742.80 748.77 762.86 756.14 816.59 775.94
1,012.391,003.79 1,011.29 996.07 999.25 1,029.70 999.71 1,010.36 1,028.90 1,019.14 1,004.78 1,033.70 1,013.72
818.03 848.39 860.98 843.45 839.00 876.15 834.40 843.15 866.62 851.14 852.23 862.75 848.75
626.47 623.39 627.20 634.94 637.93 639.91 630.08 630.20 601.80 628.68 616.82 607.09 624.44
785.44 788.20 816.49 816.41 809.55 827.50 801.68 803.65 821.28 805.62 811.57 820.78 809.68
715.50 721.05 716.31 702.41 727.43 728.02 697.66 706.49 720.71 718.29 697.66 707.94 712.75
998.30 976.72 964.23 969.00 984.53 1,010.20 1,004.01 1,026.71 1,015.28 1,008.15 1,037.16 1,066.56 1,004.87
732.58 738.99 711.67 739.94 757.10 762.45 748.43 778.05 749.18 822.17 742.58 748.18 753.44
864.14 883.89 876.73 899.73 898.42 897.45 872.53 877.13 875.16 855.71 865.73 860.95 878.22
728.64 691.33 716.45 716.57 727.97 732.43 726.28 765.20 744.48 739.54 733.89 753.30 731.13
753.09 767.23 745.92 754.68 747.25 746.07 750.07 747.59 759.32 780.89 765.74 778.54 759.24
730.44 799.66 789.42 796.76 805.68 824.42 769.86 777.91 771.85 770.80 757.92 817.24 784.78
773.90 779.22 796.29 784.28 798.17 826.85 804.19 818.69 828.20 786.80 806.90 832.44 803.50
Source: Georgia Department of Labor, Workforce Statistics & Economic Research
31
Industry Manufacturing
Durable Goods Non-Durable Goods
Industry Manufacturing
Durable Goods Non-Durable Goods
Industry Manufacturing
Durable Goods Non-Durable Goods
Industry Manufacturing
Durable Goods Non-Durable Goods
Industry Manufacturing
Durable Goods Non-Durable Goods
Industry Manufacturing
Durable Goods Non-Durable Goods
32
Georgia Production Worker Hours and Earnings
Jan 19.86 22.05 17.77
2020
Average Hourly Earnings (AHE)
Feb Mar Apr May Jun Jul
19.90 20.34 21.56 21.03 21.11 21.35
22.25 17.62
22.92 17.92
24.68 18.73
24.21 18.06
23.83 18.57
24.07 18.67
Aug 21.11 24.29 18.04
Sep 21.32 24.49 18.26
Oct 21.13 24.31 18.23
Nov 21.55 24.44 18.81
Dec 21.81 24.58 19.20
Average 20.99 23.81 18.32
Average Weekly Hours (AWH)
Jan
Feb Mar Apr May Jun Jul Aug Sep Oct Nov Dec Average
43.2
41.7 42.4 40.1 40.7 41.6 40.9 42.2 42.6 42.8 42.2 42.4
41.9
43.2
42.1 42.1 40.4 40.7 41.4 41.8 42.7 43.4 42.5 42.7 42.7 42.2
43.3
41.3 42.7 39.9 40.8 41.7 40.0 41.7 41.8 43.1 41.7 42.1
41.7
Average Weekly Earnings (AWE)
Jan
Feb Mar Apr May Jun Jul Aug Sep Oct Nov Dec Average
857.95 829.83 862.42 864.56 855.92 878.18 873.22 890.84 908.23 904.36 909.41 924.74 879.48
952.56 936.73 964.93 997.07 985.35 986.561,006.13 1,037.181,062.871,033.181,043.591,049.57 1,004.78
769.44 727.71 765.18 747.33 736.85 774.37 746.80 752.27 763.27 785.71 784.38 808.32 763.94
Jan 19.29 21.24 17.38
2019
Average Hourly Earnings (AHE)
Feb 19.42 21.53 17.32
Mar Apr May Jun Jul Aug Sep Oct Nov Dec 19.50 19.72 19.25 19.50 19.65 19.45 19.69 19.86 19.70 20.05 21.52 21.98 21.57 21.63 22.09 21.66 21.79 22.13 22.01 22.53 17.47 17.48 16.91 17.35 17.22 17.23 17.60 17.62 17.44 17.61
Average 19.59 21.80 17.39
Average Weekly Hours (AWH)
Jan
Feb Mar Apr May Jun Jul Aug Sep Oct Nov Dec Average
43.1
42.5 43.0 42.5 42.4 43.1 42.5 43.1 43.3 42.2 42.5 43.2 42.8
43.0
42.7 43.5 42.6 43.1 43.9 42.9 43.6 43.8 42.8 42.9 43.8 43.2
43.1
42.2 42.4 42.4 41.7 42.4 42.0 42.6 42.8 41.7 42.1 42.7 42.3
Average Weekly Earnings (AWE)
Jan
Feb Mar Apr May Jun Jul Aug Sep Oct Nov Dec Average
831.40 825.35 838.50 838.10 816.20 840.45 835.13 838.30 852.58 838.09 837.25 866.16 838.45
913.32 919.33 936.12 936.35 929.67 949.56 947.66 944.38 954.40 947.16 944.23 986.81 941.76
749.08 730.90 740.73 741.15 705.15 735.64 723.24 734.00 753.28 734.75 734.22 751.95 735.60
Note: These average hours and earnings data are of production employees on manufacturing payrolls
Source: Georgia Department of Labor, Workforce Statistics & Economic Research
Georgia Labor Force Estimates
Place of Residence - Persons 16 Years and Older
Area
Employment Status
2020
2019
2018
Change From
2019-2020
2018-2019
Georgia
(Not seasonally adjusted)
Albany MSA Athens-Clarke County MSA
Atlanta MSA Augusta-Richmond
County MSA
Brunswick MSA
Columbus MSA
Dalton MSA
Gainesville MSA
Hinesville MSA
Civilian labor force Employed Unemployed Rate
Civilian labor force Employed Unemployed Rate
Civilian labor force Employed Unemployed Rate
Civilian labor force Employed Unemployed Rate
Civilian labor force Employed Unemployed Rate
Civilian labor force Employed Unemployed Rate
Civilian labor force Employed Unemployed Rate
Civilian labor force Employed Unemployed Rate
Civilian labor force Employed Unemployed Rate
Civilian labor force Employed Unemployed Rate
5,072,155
5,148,312
5,118,256
-76,157
30,056
4,741,191
4,966,157
4,912,487
-224,966
53,670
330,964
182,155
205,769
148,809
-23,614
6.5
3.5
4.0
65,959
66,611
67,234
-652
-623
61,229
63,766
63,874
-2,537
-108
4,730
2,845
3,360
1,885
-515
7.2
4.3
5.0
97,177
100,249
101,953
-3,072
-1,704
91,706
96,878
98,124
-5,172
-1,246
5,471
3,371
3,829
2,100
-458
5.6
3.4
3.8
3,056,029
3,104,791
3,079,392
-48,762
25,399
2,846,578
3,000,035
2,960,617
-153,457
39,418
209,451
104,756
118,775
104,695
-14,019
6.9
3.4
3.9
267,069
268,589
268,074
-1,520
515
251,606
258,762
256,805
-7,156
1,957
15,463
9,827
11,269
5,636
-1,442
5.8
3.7
4.2
51,158
52,180
53,685
-1,022
-1,505
47,836
50,296
51,592
-2,460
-1,296
3,322
1,884
2,093
1,438
-209
6.5
3.6
3.9
122,466
123,798
125,191
-1,332
-1,393
114,156
118,672
119,269
-4,516
-597
8,310
5,126
5,922
3,184
-796
6.8
4.1
4.7
58,625
59,556
61,120
-931
-1,564
54,328
56,741
58,075
-2,413
-1,334
4,297
2,815
3,045
1,482
-230
7.3
4.7
5.0
101,949
102,798
102,283
-849
515
97,133
99,832
98,957
-2,699
875
4,816
2,966
3,326
1,850
-360
4.7
2.9
3.3
33,880
34,316
33,976
-436
340
31,922
32,998
32,527
-1,076
471
1,958
1,318
1,449
640
-131
5.8
3.8
4.3
Note: Georgia and Metropolitan Statistical Area data have not been seasonally adjusted. Employment includes Nonfarm wage and salary employment, self-
employment, unpaid family and private household workers and agricultural workers. Persons in labor disputes are counted as employed. The use of unrounded data does not imply that the numbers are exact.
Albany MSA: Baker, Dougherty, Lee, Terrell, and Worth counties. Athens-Clarke County MSA: Clarke, Madison, Oconee, and Oglethorpe counties. Atlanta MSA: Barrow, Bartow, Butts, Carroll, Cherokee, Clayton, Cobb, Coweta, Dawson, DeKalb, Douglas, Fayette, Forsyth, Fulton, Gwinnett, Haralson, Heard, Henry, Jasper, Lamar, Meriwether, Morgan, Newton, Paulding, Pickens, Pike, Rockdale, Spalding, and Walton counties. Augusta-Richmond County MSA: Burke, Columbia, Lincoln, McDuffie, and Richmond counties in Georgia and Aiken and Edgefield counties in South Carolina. Brunswick MSA: Brantley, Glynn, and McIntosh counties. Columbus MSA: Chattahoochee, Harris, Marion, and Muscogee counties in Georgia and Russell County in Alabama. Dalton MSA: Murray and Whitfield counties. Gainesville MSA: Hall County. Hinesville MSA: Liberty and Long counties. Macon-Bibb County MSA: Bibb, Crawford, Jones, Monroe, and Twiggs counties. Rome MSA: Floyd County. Savannah MSA: Bryan, Chatham, and Effingham counties. Valdosta MSA: Brooks, Echols, Lanier, and Lowndes counties. Warner Robins MSA: Houston, Peach and Pulaski counties.
Source: Georgia Department of Labor, Workforce Statistics & Economic Research
Georgia Department of Labor Mark Butler, Commissioner
33
Equal Opportunity Employer/Program Auxiliary Aids and Services Available Upon Request to Individuals With Disabilities
Georgia Labor Force Estimates Place of Residence - Persons 16 Years and Older
Area
Employment Status
2020
2019
2018
Change From
2019-2020
2018-2019
Macon-Bibb County MSA Rome MSA
Savannah MSA
Valdosta MSA
Warner Robins MSA
Civilian labor force Employed Unemployed Rate
Civilian labor force Employed Unemployed Rate
Civilian labor force Employed Unemployed Rate
Civilian labor force Employed Unemployed Rate
Civilian labor force Employed Unemployed Rate
101,745
103,283
105,041
-1,538
-1,758
94,952
99,274
100,434
-4,322
-1,160
6,793
4,009
4,607
2,784
-598
6.7
3.9
4.4
43,234
44,155
44,477
-921
-322
40,522
42,403
42,542
-1,881
-139
2,712
1,752
1,935
960
-183
6.3
4.0
4.4
190,748
192,640
189,718
-1,892
2,922
177,476
186,359
182,738
-8,883
3,621
13,272
6,281
6,980
6,991
-699
7.0
3.3
3.7
64,063
64,263
64,586
-200
-323
60,326
61,945
61,925
-1,619
20
3,737
2,318
2,661
1,419
-343
5.8
3.6
4.1
86,208
87,180
86,281
-972
899
81,650
84,077
82,602
-2,427
1,475
4,558
3,103
3,679
1,455
-576
5.3
3.6
4.3
Area
United States
(Not Seasonally adjusted)
United States Labor Force Estimates Place of Residence - Persons 16 Years and Older
Employment Status
2020
2019
2018
Change From
2019-2020
2018-2019
Civilian labor force Employed Unemployed
Rate
160,742,000 147,795,000
12,947,000 8.1
163,539,000 157,538,000
6,001,000 3.7
162,075,000
-2,797,000
1,464,000
155,761,000
-9,743,000
1,777,000
6,314,000
6,946,000
-313,000
3.9
Note: Georgia and Metropolitan Statistical Area data have not been seasonally adjusted. Employment includes Nonfarm wage and salary employment, self-
employment, unpaid family and private household workers and agricultural workers. Persons in labor disputes are counted as employed. The use of unrounded data does not imply that the numbers are exact.
Albany MSA: Baker, Dougherty, Lee, Terrell, and Worth counties. Athens-Clarke County MSA: Clarke, Madison, Oconee, and Oglethorpe counties. Atlanta MSA: Barrow, Bartow, Butts, Carroll, Cherokee, Clayton, Cobb, Coweta, Dawson, DeKalb, Douglas, Fayette, Forsyth, Fulton, Gwinnett, Haralson, Heard, Henry, Jasper, Lamar, Meriwether, Morgan, Newton, Paulding, Pickens, Pike, Rockdale, Spalding, and Walton counties. Augusta-Richmond County MSA: Burke, Columbia, Lincoln, McDuffie, and Richmond counties in Georgia and Aiken and Edgefield counties in South Carolina. Brunswick MSA: Brantley, Glynn, and McIntosh counties. Columbus MSA: Chattahoochee, Harris, Marion, and Muscogee counties in Georgia and Russell County in Alabama. Dalton MSA: Murray and Whitfield counties. Gainesville MSA: Hall County. Hinesville MSA: Liberty and Long counties. Macon-Bibb County MSA: Bibb, Crawford, Jones, Monroe, and Twiggs counties. Rome MSA: Floyd County. Savannah MSA: Bryan, Chatham, and Effingham counties. Valdosta MSA: Brooks, Echols, Lanier, and Lowndes counties. Warner Robins MSA: Houston, Peach and Pulaski counties.
Source: Georgia Department of Labor, Workforce Statistics & Economic Research
34
City Labor Force Estimates
Place of Residence - Persons 16 Years and Older
2020 Annual Averages
Labor Force
Employment
Unemployment Number Rate
*Albany 30,641 27,908 2,733 8.9
*Alpharetta 35,836 34,080 1,756 4.9
*Athens 58,206 54,453 3,753 6.4
*Atlanta 263,851 241,530 22,321 8.5
Fulton part 239,961 219,073 20,888 8.7
DeKalb part
23,890 22,457 1,433 6.0
*Augusta 85,112 78,649 6,463 7.6
*Brookhaven
33,775 32,440 1,335 4.0
Canton 15,475 14,811
664 4.3
Carrollton 11,445 10,607
838 7.3
*Chamblee 20,003 19,170
833 4.2
*Columbus 77,258 71,209 6,049 7.8
Dalton 13,665 12,614 1,051 7.7
Decatur 13,866 13,213
653 4.7
Douglasville
16,990 15,601 1,389 8.2
Duluth 15,714 14,740
974 6.2
*Dunwoody 26,392 25,159 1,233 4.7
East Point
17,249 14,976 2,273 13.2
Gainesville 20,365 19,303 1,062 5.2
Hinesville 15,194 14,294
900 5.9
*Johns Creek
43,505 41,306 2,199 5.1
Kennesaw 19,386 18,293 1,093 5.6
LaGrange 15,507 14,128 1,379 8.9
Lawrenceville
14,589 13,551 1,038 7.1
McDonough
12,440 11,092 1,348 10.8
*Macon-Bibb
67,421 62,371 5,050 7.5
*Marietta 34,556 32,521 2,035 5.9
Milton 19,556 18,643
913 4.7
Newnan 18,978 17,532 1,446 7.6
Peachtree City 17,904 17,232
672 3.8
P'tree Corners 24,427 23,037 1,390 5.7
Pooler 13,666 12,856
810 5.9
Rome 15,219 14,074 1,145 7.5
*Roswell 51,852 49,362 2,490 4.8
*Sandy Springs 63,781 60,527 3,254 5.1
*Savannah 67,905 61,756 6,149 9.1
*Smyrna 34,199 32,145 2,054 6.0
Statesboro 14,193 12,980 1,213 8.5
Stockbridge
14,522 13,187 1,335 9.2
Tucker 19,482 18,217 1,265 6.5
*Valdosta 25,252 23,441 1,811 7.2
*Warner Robins 33,751 31,802 1,949 5.8
Woodstock 17,107 16,300
807 4.7
2019 Annual Averages
Labor Force
Employment
Unemployment Number Rate
30,569 29,087 1,482 4.8
36,956 35,918 1,038 2.8
59,737 57,543 2,194 3.7
264,560 254,558 10,002 3.8
240,224 230,886 9,338 3.9
24,336 23,672
664 2.7
85,378 81,390 3,988 4.7
34,973 34,196
777 2.2
16,029 15,612
417 2.6
11,688 11,173
515 4.4
20,682 20,208
474 2.3
77,829 74,179 3,650 4.7
13,830 13,177
653 4.7
14,319 13,928
391 2.7
17,100 16,445
655 3.8
16,020 15,538
482 3.0
27,234 26,521
713 2.6
16,610 15,783
827 5.0
20,469 19,840
629 3.1
15,342 14,783
559 3.6
44,833 43,533 1,300 2.9
19,881 19,282
599 3.0
15,545 14,970
575 3.7
14,807 14,284
523 3.5
12,275 11,689
586 4.8
67,991 65,238 2,753 4.0
35,397 34,280 1,117 3.2
20,226 19,648
578 2.9
19,127 18,472
655 3.4
18,669 18,161
508 2.7
25,007 24,283
724 2.9
13,880 13,501
379 2.7
15,376 14,727
649 4.2
53,462 52,024 1,438 2.7
65,583 63,790 1,793 2.7
67,396 64,853 2,543 3.8
34,927 33,884 1,043 3.0
14,290 13,529
761 5.3
14,497 13,896
601 4.1
19,816 19,203
613 3.1
25,095 24,087 1,008 4.0
33,981 32,755 1,226 3.6
17,679 17,182
497 2.8
2018 Annual Averages
Labor Force
Employment
Unemployment Number Rate
31,553 29,784 1,769 5.6
36,501 35,348 1,153 3.2
60,985 58,519 2,466 4.0
261,062 249,744 11,318 4.3
237,110 226,567 10,543 4.4
23,952 23,177
775 3.2
86,102 81,560 4,542 5.3
34,171 33,276
895 2.6
15,401 14,968
433 2.8
11,396 10,824
572 5.0
20,304 19,766
538 2.6
78,950 74,861 4,089 5.2
14,213 13,492
721 5.1
13,446 13,016
430 3.2
17,272 16,517
755 4.4
16,023 15,476
547 3.4
27,384 26,535
849 3.1
16,684 15,746
938 5.6
19,764 19,075
689 3.5
15,098 14,484
614 4.1
44,789 43,324 1,465 3.3
19,969 19,309
660 3.3
14,995 14,356
639 4.3
14,379 13,785
594 4.1
11,510 10,884
626 5.4
69,251 66,068 3,183 4.6
35,415 34,198 1,217 3.4
20,087 19,433
654 3.3
18,362 17,642
720 3.9
18,476 17,898
578 3.1
24,891 24,035
856 3.4
12,959 12,560
399 3.1
15,557 14,829
728 4.7
53,545 51,877 1,668 3.1
65,351 63,306 2,045 3.1
67,701 64,855 2,846 4.2
35,066 33,860 1,206 3.4
14,007 13,197
810 5.8
14,442 13,742
700 4.8
19,787 19,073
714 3.6
25,425 24,258 1,167 4.6
33,266 31,859 1,407 4.2
17,276 16,742
534 3.1
Note: City estimates were prepared in cooperation with the U.S. Department of Labor, Bureau of Labor Statistics. All cities listed have total population of 25,000 or more and an asterisks (*) designates cities with population of 50,000 or more.
Source: Georgia Department of Labor, Workforce Statistics & Economic Research
35
County Labor Force Estimates (not seasonally adjusted) Place of Residence - Persons 16 Years and Older
2020 Annual Averages
Labor Force
Employment
Unemployment Number Rate
2019 Annual Averages
Labor Force
Employment
Unemployment Number Rate
2018 Annual Averages
Labor Force
Employment
Unemployment Number Rate
Georgia
5,072,155 4,741,191 330,964 6.5
5,148,312 4,966,157 182,155 3.5
5,118,256 4,912,487 205,769 4.0
Appling
9,105
8,674
431 4.7
9,275 8,904
371 4.0
9,070 8,673
397 4.4
Atkinson
4,434 4,262
172 3.9
4,562
4,415
147 3.2
4,365 4,209
156 3.6
Bacon
4,652
4,425
227 4.9
4,957
4,774
183 3.7
5,043 4,849
194 3.8
Baker
1,145
1,076
69 6.0
1,159
1,104
55 4.7
1,166 1,104
62 5.3
Baldwin
17,607 16,388 1,219 6.9
17,711 16,941
770 4.3
17,716 16,826
890 5.0
Banks
9,778 9,359
419 4.3
9,799
9,525
274 2.8
9,561 9,255
306 3.2
Barrow
40,112 38,057 2,055 5.1
41,298 40,096 1,202 2.9
40,197 38,853 1,344 3.3
Bartow
49,719 46,612 3,107 6.2
50,824 49,094 1,730 3.4
50,334 48,395 1,939 3.9
Ben Hill
5,460 5,083
377 6.9
5,458
5,154
304 5.6
5,495 5,167
328 6.0
Berrien
7,405
6,977
428 5.8
7,593
7,281
312 4.1
7,486
7,169
317 4.2
Bibb
67,421 62,371 5,050 7.5
67,991 65,238 2,753 4.0
69,251 66,068 3,183 4.9
Bleckley
4,501 4,209
292 6.5
4,595
4,355
240 5.2
4,623 4,352
271 5.9
Brantley
6,995
6,618
377 5.4
7,250
6,943
307 4.2
7,384 7,048
336 4.6
Brooks
6,842 6,488
354 5.2
6,879
6,639
240 3.5
6,980 6,700
280 4.0
Bryan
18,718 17,732
986 5.3
19,193 18,615
578 3.0
18,366 17,736
630 3.4
Bulloch
37,020 34,601 2,419 6.5
37,544 36,063 1,481 3.9
37,154 35,544 1,610 4.3
Burke
9,026
8,379
647 7.2
9,132
8,650
482 5.3
9,287 8,713
574 6.2
Butts
10,739 10,075
664 6.2
10,989 10,610
379 3.4
10,716 10,272
444 4.1
Calhoun
2,237
2,124
113 5.1
2,264
2,181
83 3.7
2,249 2,153
96 4.3
Camden
21,089 20,092
997 4.7
21,271 20,484
787 3.7
20,955 20,062
893 4.3
Candler
5,633 5,383
250 4.4
5,619
5,449
170 3.0
5,359
5,173
186 3.5
Carroll
54,475 51,009 3,466 6.4
55,720 53,731 1,989 3.6
55,063 52,819 2,244 4.1
Catoosa
32,611 31,194 1,417 4.3
33,507 32,471 1,036 3.1
33,547 32,387 1,160 3.5
Charlton
4,842 4,660
182 3.8
4,918
4,728
190 3.9
4,818 4,606
212 4.4
Chatham
140,631 129,918 10,713 7.6
141,198 136,432 4,766 3.4
140,342 135,020 5,322 3.8
Chattahoochee 1,988 1,864
124 6.2
2,030
1,936
94 4.6
2,040 1,926
114 5.6
Chattooga
9,767
8,947
820 8.4
10,389
9,857
532 9.2
10,518 10,082
436 4.1
Cherokee
133,045 126,581 6,464 4.9
137,310 133,427 3,883 2.8
135,162 130,875 4,287 3.2
Clarke
58,206 54,453 3,753 6.4
59,737 57,543 2,194 3.7
60,985 58,519 2,466 4.0
Clay
896
785
111 12.4
882
820
62 7.0
851
786
65 7.6
Clayton
139,790 125,357 14,433 10.3
138,140 132,093 6,047 4.4
137,491 130,639 6,852 5.0
Clinch
2,943 2,826
117 4.0
2,821
2,715
106 3.8
2,768 2,641
127 4.6
Cobb
414,357 389,904 24,453 5.9
424,056 410,994 13,062 3.1
423,381 408,648 14,733 3.5
Coffee
18,938 17,835 1,103 5.8
19,232 18,472
760 4.0
18,866 18,005
861 4.6
Colquitt
21,917 20,938
979 4.5
21,774 21,076
698 3.2
21,583 20,760
823 3.8
Columbia
74,411 71,266 3,145 4.2
76,158 73,783 2,375 3.1
75,852 73,178 2,674 3.5
Cook
8,102
7,718
384 4.7
8,165
7,885
280 3.4
7,864 7,563
301 3.8
Coweta
73,981 69,397 4,584 6.2
75,413 73,121 2,292 3.0
74,286 71,690 2,596 3.5
Crawford
5,488
5,211
277 5.0
5,647
5,438
209 3.7
5,706 5,465
241 4.2
Crisp
9,515
8,767
748 7.9
9,597
9,218
379 3.9
9,420 8,957
463 4.9
Dade
7,860
7,538
322 4.1
8,130
7,856
274 3.4
8,233 7,928
305 3.7
Dawson
12,319 11,735
584 4.7
12,731 12,360
371 2.9
12,282 11,867
415 3.4
Decatur
11,304 10,763
541 4.8
11,673 11,224
449 3.8
11,520 10,974
546 4.7
DeKalb
395,683 364,209 31,474 8.0
398,089 383,925 14,164 3.6
398,301 381,927 16,374 4.1
Dodge
6,957 6,542
415 6.0
7,163
6,772
391 5.5
7,181 6,803
378 5.3
Dooly
4,925
4,547
378 7.7
5,078
4,883
195 3.8
5,134 4,891
243 4.7
Dougherty
37,712 34,469 3,243 8.6
37,709 35,924 1,785 4.7
38,689 36,578 2,111 5.5
Douglas
72,297 66,930 5,367 7.4
73,229 70,551 2,678 3.7
73,033 69,955 3,078 4.2
Early
4,424
4,168
256 5.8
4,385
4,210
175 4.0
4,545 4,332
213 4.7
Echols
1,899
1,825
74 3.9
1,912
1,858
54 2.8
1,922 1,860
62 3.2
Source: Georgia Department of Labor, Workforce Statistics & Economic Research
36
County Labor Force Estimates (not seasonally adjusted) Place of Residence - Persons 16 Years and Older
2020 Annual Averages
Labor Force
Employment
Unemployment Number Rate
2019 Annual Averages
Labor Force
Employment
Unemployment Number Rate
2018 Annual Averages
Labor Force
Employment
Unemployment Number Rate
Effingham
31,400 29,827 1,573 5.0
32,248 31,311
937 2.9
31,011 29,983 1,028 3.3
Elbert
7,969
7,418
551 6.9
7,855
7,540
315 4.0
7,850 7,467
383 4.9
Emanuel
8,518
7,915
603 7.1
8,420
7,964
456 5.4
8,349 7,847
502 6.0
Evans
5,002
4,745
257 5.1
4,946
4,776
170 3.4
4,917 4,733
184 3.7
Fannin
11,066 10,542
524 4.7
11,493 11,099
394 3.4
11,314 10,858
456 4.0
Fayette
56,444 53,389 3,055 5.4
58,063 56,269 1,794 3.1
57,745 55,695 2,050 3.6
Floyd
43,234 40,522 2,712 6.3
44,155 42,403 1,752 4.0
44,477 42,542 1,935 4.4
Forsyth
120,904 115,371 5,533 4.6
125,115 121,572 3,543 2.8
121,485 117,584 3,901 3.2
Franklin
9,892 9,308
584 5.9
10,205
9,839
366 3.6
10,048 9,656
392 3.9
Fulton
557,232 512,593 44,639 8.0
560,412 540,233 20,179 3.6
555,178 532,352 22,826 4.1
Gilmer
11,963 11,401
562 4.7
12,032 11,599
433 3.6
12,017 11,504
513 4.3
Glascock
1,244
1,193
51 4.1
1,276
1,228
48 3.8
1,290 1,236
54 4.2
Glynn
38,215 35,610 2,605 6.8
38,828 37,478 1,350 3.5
40,034 38,531 1,503 3.8
Gordon
28,062 26,531 1,531 5.5
28,488 27,498
990 3.5
27,566 26,485 1,081 3.9
Grady
10,601 10,139
462 4.4
10,668 10,301
367 3.4
10,669 10,252
417 3.9
Greene
7,080 6,663
417 5.9
7,307
7,020
287 3.9
7,054 6,748
306 4.3
Gwinnett
481,453 450,909 30,544 6.3
490,677 475,310 15,367 3.1
487,901 470,425 17,476 3.6
Habersham 18,691 17,675 1,016 5.4
19,457 18,779
678 3.5
19,461 18,722
739 3.8
Hall
101,949 97,133 4,816 4.7
102,798 99,832 2,966 2.9
102,283 98,957 3,326 3.3
Hancock
2,532 2,309
223 8.8
2,514
2,371
143 5.7
2,475 2,325
150 6.1
Haralson
12,245 11,525
720 5.9
12,580 12,147
433 3.4
12,521 12,030
491 3.9
Harris
16,527 15,763
764 4.6
16,936 16,405
531 3.1
16,908 16,323
585 3.5
Hart
11,373 10,757
616 5.4
11,609 11,195
414 3.6
11,748 11,313
435 3.7
Heard
5,132
4,798
334 6.5
5,228
5,050
178 3.4
5,230 5,024
206 3.9
Henry
115,352 106,831 8,521 7.4
116,855 112,575 4,280 3.7
115,072 110,238 4,834 4.2
Houston
70,418 66,769 3,649 5.2
71,213 68,770 2,443 3.4
70,350 67,476 2,874 4.1
Irwin
3,467 3,276
191 5.5
3,403
3,243
160 4.7
3,330 3,139
191 5.7
Jackson
39,648 37,910 1,738 4.4
37,771 36,734 1,037 2.7
36,442 35,302 1,140 3.1
Jasper
6,756 6,422
334 4.9
6,981
6,757
224 3.2
6,908 6,662
246 3.6
Jeff Davis
6,099
5,785
314 5.1
6,188
5,900
288 4.7
6,093 5,793
300 4.9
Jefferson
6,658 6,209
449 6.7
6,636
6,314
322 4.9
6,727 6,364
363 5.4
Jenkins
3,178
2,978
200 6.3
3,209
3,043
166 5.2
3,188 3,015
173 5.4
Johnson
4,006 3,808
198 4.9
4,076
3,924
152 3.7
4,106 3,942
164 4.0
Jones
13,346 12,737
609 4.6
13,757 13,308
449 3.3
13,939 13,422
517 3.7
Lamar
7,980
7,476
504 6.3
8,208
7,881
327 4.0
8,230 7,843
387 4.7
Lanier
3,723 3,529
194 5.2
3,781
3,627
154 4.1
3,799 3,627
172 4.5
Laurens
19,367 18,075 1,292 6.7
19,567 18,658
909 4.6
19,491 18,540
951 4.9
Lee
14,763 14,081
682 4.6
15,140 14,673
467 3.1
14,834 14,295
539 3.6
Liberty
25,741 24,140 1,601 6.2
25,970 24,965 1,005 3.9
25,910 24,786 1,124 4.3
Lincoln
3,497 3,307
190 5.4
3,552
3,412
140 3.9
3,608 3,427
181 5.0
Long
8,139
7,782
357 5.1
8,345
8,032
313 3.8
8,066
7,741
325 4.0
Lowndes
51,599 48,484 3,115 6.0
51,690 49,820 1,870 3.6
51,885 49,739 2,146 4.1
Lumpkin
16,463 15,671
792 4.8
16,946 16,394
552 3.3
16,749 16,143
606 3.6
McDuffie
8,695
8,016
679 7.8
8,756
8,293
463 5.3
8,941 8,435
506 5.7
McIntosh
5,949 5,609
340 5.7
6,102
5,876
226 3.7
6,267 6,013
254 4.1
Macon
4,614 4,303
311 6.7
4,724
4,503
221 4.7
4,710 4,413
297 6.3
Madison
12,972 12,302
670 5.2
13,419 12,996
423 3.2
13,710 13,218
492 3.6
Marion
3,192 3,029
163 5.1
3,294
3,151
143 4.3
3,378 3,201
177 5.2
Meriwether
8,816 8,061
755 8.6
8,895
8,481
414 4.7
8,884 8,432
452 5.1
Miller
2,772 2,660
112 4.0
2,804
2,711
93 3.3
2,776 2,672
104 3.7
Mitchell
8,289
7,751
538 6.5
8,490
8,097
393 4.6
8,389 7,929
460 5.5
Monroe
12,700 12,050
650 5.1
13,028 12,592
436 3.3
13,218 12,728
490 3.7
Montgomery
3,891
3,681
210 5.4
3,926
3,721
205 5.2
3,868 3,642
226 5.8
Morgan
9,142 8,645
497 5.4
9,383
9,082
301 3.2
9,209 8,875
334 3.6
Murray
15,350 14,191 1,159 7.6
15,625 14,812
813 5.2
16,027 15,164
863 5.4
Source: Georgia Department of Labor, Workforce Statistics & Economic Research
37
County Labor Force Estimates (not seasonally adjusted) Place of Residence - Persons 16 Years and Older
2020 Annual Averages
Labor Force
Employment
Unemployment Number Rate
2019 Annual Averages
Labor Force
Employment
Unemployment Number Rate
2018 Annual Averages
Labor Force
Employment
Unemployment Number Rate
Muscogee
77,258 71,209 6,049 7.8
77,829 74,179 3,650 4.7
78,950 74,861 4,089 5.2
Newton
51,901 48,202 3,699 7.1
52,883 50,779 2,104 4.0
52,056 49,687 2,369 8.7
Oconee
19,208 18,487
721 3.8
20,054 19,531
523 2.6
20,121 19,516
605 3.0
Oglethorpe
6,791 6,464
327 4.8
7,040
6,808
232 3.3
7,138 6,870
268 3.8
Paulding
85,313 80,718 4,595 5.4
87,696 85,048 2,648 3.0
85,545 82,555 2,990 3.5
Peach
11,814 11,084
730 6.2
11,901 11,402
499 4.2
11,884 11,259
625 5.3
Pickens
14,927 14,210
717 4.8
15,457 14,977
480 3.1
15,219 14,671
548 3.6
Pierce
8,500
8,115
385 4.5
8,694
8,390
304 3.5
8,739 8,403
336 3.8
Pike
8,705 8,273
432 5.0
8,992
8,712
280 3.1
8,875 8,551
324 3.7
Polk
18,292 17,200 1,092 6.0
18,576 17,884
692 3.7
18,581 17,788
793 4.3
Pulaski
3,976
3,797
179 4.5
4,066
3,905
161 4.0
4,046 3,867
179 4.4
Putnam
8,210
7,671
539 6.6
8,326
7,956
370 4.4
8,274 7,856
418 5.1
Quitman
800
748
52 6.5
812
770
42 5.2
827
780
47 5.7
Rabun
7,215
6,831
384 5.3
7,321
7,057
264 3.6
7,133 6,843
290 4.1
Randolph
2,490 2,343
147 5.9
2,556
2,431
125 4.9
2,487 2,347
140 5.6
Richmond
85,112 78,649 6,463 7.6
85,378 81,390 3,988 4.7
86,102 81,560 4,542 5.3
Rockdale
43,989 40,657 3,332 7.6
44,606 42,852 1,754 3.9
44,645 42,642 2,003 4.5
Schley
2,145 2,052
93 4.3
2,258
2,170
88 3.9
2,200 2,097
103 4.7
Screven
5,047 4,635
412 8.2
5,159
4,874
285 5.5
5,295 5,005
290 5.5
Seminole
3,093 2,938
155 5.0
3,106
2,971
135 4.3
3,049 2,884
165 5.4
Spalding
28,305 26,156 2,149 7.6
28,741 27,555 1,186 4.1
28,631 27,259 1,372 4.8
Stephens
10,414
9,745
669 6.4
10,838 10,419
419 3.9
10,974 10,464
510 4.6
Stewart
2,509 2,367
142 5.7
2,497
2,388
109 4.4
2,371 2,255
116 4.9
Sumter
12,525 11,601
924 7.4
12,877 12,252
625 4.9
12,727 11,959
768 6.0
Talbot
2,757 2,568
189 6.9
2,827
2,699
128 4.5
2,839 2,694
145 5.1
Taliaferro
530
492
38 7.2
546
518
28 5.1
570
539
31 5.4
Tattnall
9,651 9,237
414 4.3
9,762
9,384
378 3.9
9,701 9,287
414 4.3
Taylor
2,746 2,563
183 6.7
3,036
2,908
128 4.2
2,789 2,606
183 6.6
Telfair
3,782 3,408
374 9.9
4,298
3,893
405 9.4
4,368 4,070
298 6.8
Terrell
3,497 3,235
262 7.5
3,550
3,368
182 5.1
3,581 3,338
243 6.8
Thomas
16,930 15,874 1,056 6.2
17,017 16,334
683 4.0
16,910 16,105
805 4.8
Tift
20,500 19,463 1,037 5.1
20,323 19,638
685 3.4
19,384 18,597
787 4.1
Toombs
12,081 11,287
794 6.6
12,015 11,419
596 5.0
11,891 11,189
702 5.9
Towns
3,841 3,585
256 6.7
3,975
3,780
195 5.1
3,919 3,696
223 5.7
Treutlen
2,710 2,547
163 6.0
2,729
2,585
144 5.3
2,713 2,553
160 5.9
Troup
37,448 34,727 2,721 7.3
38,023 36,795 1,228 3.2
36,732 35,358 1,374 3.7
Turner
3,264 3,028
236 7.2
3,222
3,098
124 3.8
3,181 3,018
163 5.1
Twiggs
2,790 2,583
207 7.4
2,860
2,698
162 5.7
2,929 2,753
176 6.0
Union
10,464 10,006
458 4.4
10,505 10,171
334 3.2
10,347 9,962
385 3.7
Upson
11,328 10,578
750 6.6
11,420 11,005
415 3.6
11,392 10,884
508 4.5
Walker
30,601 29,106 1,495 4.9
31,433 30,280 1,153 3.7
31,344 30,116 1,228 3.9
Walton
44,917 42,476 2,441 5.4
46,218 44,752 1,466 3.2
45,815 44,154 1,661 3.6
Ware
15,284 14,432
852 5.6
15,507 14,922
585 3.8
15,602 14,981
621 4.0
Warren
2,635 2,456
179 6.8
2,763
2,629
134 4.8
2,759 2,621
138 5.0
Washington
6,931 6,486
445 6.4
7,063
6,763
300 4.2
7,161 6,797
364 5.1
Wayne
11,540 10,894
646 5.6
11,523 11,050
473 4.1
11,419 10,879
540 4.7
Webster
1,008
951
57 5.7
1,028
977
51 5.0
1,000
937
63 6.3
Wheeler
1,608
1,492
116 7.2
1,676
1,552
124 7.4
1,671 1,546
125 7.5
White
16,197 15,491
706 4.4
16,570 16,113
457 2.8
16,189 15,689
500 3.1
Whitfield
43,275 40,137 3,138 7.3
43,931 41,929 2,002 4.9
45,093 42,911 2,182 4.8
Wilcox
2,737 2,581
156 5.7
2,714
2,593
121 4.5
2,686 2,543
143 5.3
Wilkes
3,712 3,464
248 6.7
3,812
3,633
179 4.7
3,831 3,650
181 4.7
Wilkinson
3,790 3,587
203 5.4
4,053
3,898
155 3.8
3,850 3,677
173 4.5
Worth
8,844 8,369
475 5.4
9,053
8,697
356 3.9
8,964 8,559
405 4.5
38
Source: Georgia Department of Labor, Workforce Statistics & Economic Research
Mark Butler, Commissioner 148 Andrew Young International Boulevard, N.E. Atlanta, Georgia 30303-1751 Return Service Requested
39