- Collection:
- Georgia Government Publications
- Title:
- Dimensions: measuring Georgia's workforce, 2020 November
- Creator:
- Georgia. Department of Labor
- Contributor to Resource:
- Georgia. Department of Labor
- Publisher:
- Atlanta, Ga. : Georgia. Department of Labor
- Date of Original:
- 2020-11
- Subject:
- Labor market--Georgia--Statistics--Periodicals
Wages--Georgia--Statistics--Periodicals
Hours of labor--Georgia--Statistics--Periodicals - Location:
- United States, Georgia, 32.75042, -83.50018
- Medium:
- serials (publications)
- Type:
- Text
- Format:
- application/pdf
- External Identifiers:
- Call Number GA L200.E46 P1 T7 46/11
- Metadata URL:
- https://dlg.galileo.usg.edu/id:dlg_ggpd_i-ga-bl200-pe46-bp1-bt7-b46-s11-belec-p-btext
- Digital Object URL:
- https://dlg.galileo.usg.edu/do:dlg_ggpd_i-ga-bl200-pe46-bp1-bt7-b46-s11-belec-p-btext
- Language:
- eng
- Holding Institution:
- University of Georgia. Map and Government Information Library
- Rights:
-

Jackson Madison Elbert
Polk
Cobb
Gwinnett Barrow Clarke
D I M E N S I O Paulding
Haralson Douglas
DeKalb Rock-
Walton
Oconee Oglethorpe
Wilkes
Lincoln
EdgefieSlCd,
Carroll
Fulton Clayton
dale Newton
Morgan Greene Taliaferro
Columbia
Fayette Henry
McDuffie Warren
Heard
Coweta
Spalding Butts Jasper Putnam Hancock
Glascock
Richmond
AikenSC,
N
S
Russell, AL
Measuring Georgia's Workforce Troup Meriwether Pike Lamar Monroe Upson
Jones
Baldwin
Jefferson Washington
Burke
Bibb
Harris
Talbot
Crawford
November
Muscogee
2020
DataTaylor
Peach
Wilkinson Twiggs
Johnson
Jenkins Emanuel
Screven
Volume XLVI, Number 11
November 2020 Employment Situation Marion Chattahoo-
Houston Bleckley Macon
Laurens
Treutlen
chee
In millions
CandlGereorgBuialloEcmh ploEyfmfinegnhatm
(Seasonally Adjusted)
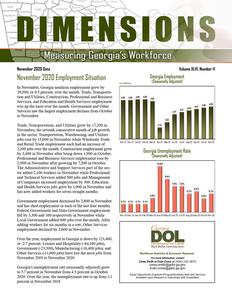
In November, GeSocrhgleiya nonfarm DeomolpyloyPmuleasnkti greDwodbgye 20,S9te0w0a,rtor 0W.5ebpsteerrcenSt,umovteerr the month. Trade, Transporta-
Montgomery
Wheeler
Toombs
QutSwiitoemarnsavRnauiacnpneddstoh,UlpeathnimldiotiETseetdsrr,ouevCcll eaortniotshntLereauemncdtoionHnthe,.aPCGltrrhioospTfvSueersenrsrenivromiWnceiaelcnlsotaxeanmnBdepdnBloOHuyitsllmhineTeeerlnsfatsir
4.64
Jeff Davis
4.64 4.65 Appling
Services saw the toClaNy ovemCablheoru. n
largest employment
Dougherty Worth
declines
frIrowmin
October
Coffee
Tift
Bacon
Evans Tattnall 4.65 4.62
Bryan Chatham Liberty
Long
4.41 4.44 4.37
Wayne
McIntosh
4.22
4.47
4.49
4.52
TrEaadrley, TranspBoarkteartion, and Utilities grew by 1B7e,r2ri0en0 in Atkinson NinotvheemsMebilcleetrro,rt.hTersaenvsepnMotrihttcahcteoilolnns,eWcuaCtirovelqehuomitutosinntghCo,ooafknjdobUgtirlLoiatwnieietshr
Ware
Pierce
4.12
Glynn
Brantley
jobSsemroinsoeleby 13,000 in November while Wholesale Trade and RetaiDl eTcraatudre emGprlaodyymeTnhtoemaacsh hBardooakns incrLeoawsnedeosf
ClincNhov-19 Dec-19 Jan-20 Feb-20 Mar-20 ApCr-2a0mMdaye-n20 Jun-20 Jul-20 Aug-20 Sep-20 Oct-20 Nov-20 Charlton
2,100 jobs over the month. Construction employment gErcehowls by 3,400 in November after being down 1,900 in October.
Georgia Unemployment Rate
(Seasonally Adjusted)
Professional and Business Services employment rose by
2,900 in November after growing by 7,200 in October.
12.6%
The Administrative and Support Services part of the sec-
tor added 2,100 workers in November while Professional
and Technical Services added 500 jobs and Management
9.4%
of Companies increased employment by 300. Education and Health Services jobs grew by 1,900 in November and has now added workers for seven straight months.
7.6% 7.6%
6.3%
5.7%
5.7%
4.6%
4.5%
Government employment decreased by 2,800 in November and has shed employment in each of the last four months.
3.1% 3.1% 3.1% 3.1%
Federal Government and State Government employment
fell by 3,300 and 100 respectively in November while
Nov-19 Dec-19 Jan-20 Feb-20 Mar-20 Apr-20 May-20 Jun-20 Jul-20 Aug-20 Sep-20 Oct-20 Nov-20
Local Government added 600 jobs over the month. After
adding workers for six months in a row, Other Services
employment declined by 2,600 in November.
Over the year, employment in Georgia is down by 123,400, or -2.7 percent. Leisure and Hospitality (-64,100 jobs), Government (-23,500), Manufacturing (-18,400 jobs), and Other Services (-11,600 jobs) have lost the most jobs from November 2019 to November 2020.
Georgia's unemployment rate (seasonally adjusted) grew to 5.7 percent in November from 4.5 percent in October 2020. Over the year, the unemployment rate is up from 3.1 percent in November 2019.
Workforce Statistics & Economic Research
For more information, contact Corey Smith or Evan Cross at (404) 232-3875
corey.smith@gdol.ga.gov evan.cross@gdol.ga.gov
Equal Opportunity Employer/ProgramAuxiliary Aids and Services Available upon Request to Individuals with Disabilities
Georgia Nonfarm Employment
(In thousands)
(Seasonally Adjusted)
Preliminary
Revised Revised
NOV 2020 OCT 2020 NOV 2019
Change in Jobs from OCT 2020
Net %
Change in Jobs from NOV 2019
Net %
Total Nonfarm
4,515.3
4,494.4
4,638.7
20.9 0.5
-123.4 -2.7
Total Private
3,847.1
3,823.4
3,947.0
23.7 0.6
-99.9 -2.5
Goods Producing
599.3
594.7
617.7
4.6 0.8
-18.4 -3.0
Service-Providing
3,916.0
3,899.7
4,021.0
16.3 0.4
-105.0 -2.6
Private Service-Providing
3,247.8
3,228.7
3,329.3
19.1 0.6
-81.5 -2.4
Mining and Logging
8.9
8.9
9.4
0.0 0.0
-0.5 -5.3
Mining, Logging and Construction
213.8
210.4
213.8
3.4 1.6
0.0 0.0
Construction
204.9
201.5
204.4
3.4 1.7
0.5 0.2
Manufacturing
385.5
384.3
403.9
1.2 0.3
-18.4 -4.6
Durable Goods
189.9
188.7
202.6
1.2 0.6
-12.7 -6.3
Non-Durable Goods
195.6
195.6
201.3
0.0 0.0
-5.7 -2.8
Trade, Transportation, and Utilities
974.7
957.5
953.0
17.2 1.8
21.7 2.3
Wholesale Trade
213.6
211.5
219.2
2.1 1.0
-5.6 -2.6
Retail Trade
517.1
515.0
494.7
2.1 0.4
22.4 4.5
Transportation, Warehousing, and Utilities
244.0
231.0
239.1
13.0 5.6
4.9 2.0
Information
105.5
105.7
115.6
-0.2 -0.2
-10.1 -8.7
Financial Activities
249.9
249.7
251.3
0.2 0.1
-1.4 -0.6
Finance and Insurance
185.4
184.4
179.9
1.0 0.5
5.5 3.1
Real Estate and Rental and Leasing
64.5
65.3
71.4
-0.8 -1.2
-6.9 -9.7
Professional and Business Services
701.2
698.3
712.5
2.9 0.4
-11.3 -1.6
Professional, Scientific, and Technical Services
273.1
272.6
284.7
0.5 0.2
-11.6 -4.1
Management of Companies and Enterprises
86.5
86.2
90.1
0.3 0.3
-3.6 -4.0
Admin and Support, Waste Mngmnt and Remediation
341.6
339.5
337.7
2.1 0.6
3.9 1.2
Education and Health Services
617.9
616.0
622.6
1.9 0.3
-4.7 -0.8
Educational Services
91.5
91.4
95.3
0.1 0.1
-3.8 -4.0
Health Care and Social Assistance
526.4
524.6
527.3
1.8 0.3
-0.9 -0.2
Leisure and Hospitality
444.0
444.3
508.1
-0.3 -0.1
-64.1 -12.6
Arts, Entertainment, and Recreation
44.7
43.5
57.1
1.2 2.8
-12.4 -21.7
Accommodation and Food Services
399.3
400.8
451.0
-1.5 -0.4
-51.7 -11.5
Other Services
154.6
157.2
166.2
-2.6 -1.7
-11.6 -7.0
Government
668.2
671.0
691.7
-2.8 -0.4
-23.5 -3.4
Federal Government
107.4
110.7
103.9
-3.3 -3.0
3.5 3.4
State Government
156.1
156.2
167.6
-0.1 -0.1
-11.5 -6.9
Local Government
404.7
404.1
420.2
0.6 0.1
-15.5 -3.7
Note: These seasonally adjusted estimates were prepared in cooperation with the U.S. Department of Labor, Bureau of Labor Statistics, based upon monthly reports submitted by selected
employers throughout Georgia. The estimates include all full- and part-time wage and salary workers who were employed during or received pay for any part of the pay period that includes the twelfth of the month. Proprietors, domestic workers, self-employed persons, unpaid family workers and personnel of the armed forces are excluded. Estimates based on 2019 benchmark.
Source: Georgia Department of Labor, Workforce Statistics & Economic Research
Georgia Department of Labor, Mark Butler, Commissioner Equal Opportunity Employer/Program Auxiliary Aids and Services Available Upon Request to Individuals With Disabilities
2
Georgia Nonfarm Employment
(In thousands)
(Not Seasonally Adjusted)
Preliminary
Revised
Revised
NOV 2020 OCT 2020 NOV 2019
Change in Jobs from OCT 2020
Net %
Change in Jobs from NOV 2019
Net %
Total Nonfarm
4,561.7
Total Private
3,885.3
Goods Producing
599.4
Service-Providing
3,962.3
Private Service-Providing
3,285.9
Mining and Logging
8.9
Mining, Logging and Construction
213.7
Construction
204.8
Construction of Buildings
44.9
Heavy and Civil Engineering Construction
33.9
Specialty Trade Contractors
126.0
Manufacturing
385.7
Durable Goods
189.5
Transportation Equipment Manufacturing
49.8
Non-Durable Goods
196.2
Food Manufacturing
67.7
Textile Mills
14.8
Textile Product Mills
26.7
Trade, Transportation, and Utilities
992.3
Wholesale Trade
214.5
Merchant Wholesalers, Durable Goods
116.2
Merchant Wholesalers, Nondurable Goods
62.8
Wholesale Electronic Markets and Agents and Brokers 35.5
Retail Trade
530.4
Food and Beverage Stores
94.9
General Merchandise Stores
119.5
Miscellaneous Store Retailers
22.5
Transportation, Warehousing, and Utilities
247.4
Utilities
19.6
Transportation and Warehousing
227.8
Air Transportation
22.4
Truck Transportation
54.4
Couriers and Messengers
39.0
Warehousing and Storage
66.3
Information
108.6
Telecommunications
33.7
Wired and Wireless Telecommunications Carriers
28.8
Data Processing, Hosting, and Related Services
14.0
Financial Activities
251.1
Finance and Insurance
185.7
Insurance Carriers and Related Activities
90.3
Real Estate and Rental and Leasing
65.4
Professional and Business Services
711.2
Professional, Scientific, and Technical Services
273.7
Accounting, Tax Prep, and Bookkeeping Services
36.6
Architectural, Engineering, and Related Services
43.7
Computer Systems Design and Related Services
66.8
Management and Technical Consulting Services
48.4
Management of Companies and Enterprises
86.3
Admin and Support, Waste Mngmnt and Remediation
351.2
Employment Services
175.5
Education and Health Services
624.8
Educational Services
95.1
Colleges, Universities, and Professional Schools
49.6
Health Care and Social Assistance
529.7
Ambulatory Health Care Services
231.5
Hospitals
163.2
Nursing and Residential Care Facilities
59.1
Social Assistance
75.9
Leisure and Hospitality
443.4
Arts, Entertainment, and Recreation
43.0
Amusement, Gambling, and Recreation Industries
34.1
Accommodation and Food Services
400.4
Accommodation
38.9
Food Services and Drinking Places
361.5
Other Services
154.5
Repair and Maintenance
42.5
Personal and Laundry Services
34.3
Religious, Grantmaking, Civic, Professional, and Similar
77.7
Government
676.4
Federal Government
108.4
Department of Defense
45.5
State Government
159.2
State Government Educational Services
92.1
State Government excluding Educational Services
67.1
Local Government
408.8
Local Government Educational Services
235.1
Local Government excluding Educational Services
173.7
4,521.6 3,843.1
596.2 3,925.4 3,246.9
8.9 211.5 202.6 45.2 34.3 123.1 384.7 188.5 49.7 196.2 66.4 15.0 26.9 959.5 214.0 116.2 62.8 35.0 513.1 94.8 113.1 22.5 232.4 19.6 212.8 21.9 53.7 32.0 61.3 108.1 33.9 29.0 13.9 251.0 185.0 89.7 66.0 705.1 273.1 36.3 43.7 68.4 46.8 86.1 345.9 170.8 623.2 95.0 50.5 528.2 230.6 163.4 59.4 74.8 443.1 42.6 34.0 400.5 38.2 362.3 156.9 43.0 35.7 78.2 678.5 110.9 45.3 160.2 92.3
67.9 407.4 235.1 172.3
4,674.7 3,974.7
617.9 4,056.8 3,356.8
9.3 213.9 204.6 45.9 35.3 123.4 404.0 202.3 55.0 201.7
67.0 18.4 28.4 967.0 219.2 115.8 66.0 37.4 506.3 94.5 115.0 22.6 241.5 19.5 222.0 30.7 54.6 32.4 59.4 118.1 36.8 32.2 13.7 252.0 179.8 86.8 72.2 720.7 285.3 34.9 44.0 74.1 48.1 90.0 345.4 171.1 629.0 98.4 50.0 530.6 222.8 164.8 62.3 80.7 504.3 54.1 38.4 450.2 49.7 400.5 165.7 43.1 40.8 81.8 700.0 104.6 44.1 170.9 100.9 70.0 424.5 249.9 174.6
40.1 0.9 42.2 1.1
3.2 0.5 36.9 0.9 39.0 1.2
0.0 0.0 2.2 1.0 2.2 1.1 -0.3 -0.7 -0.4 -1.2 2.9 2.4 1.0 0.3 1.0 0.5 0.1 0.2 0.0 0.0 1.3 2.0 -0.2 -1.3 -0.2 -0.7 32.8 3.4 0.5 0.2 0.0 0.0 0.0 0.0 0.5 1.4 17.3 3.4 0.1 0.1 6.4 5.7 0.0 0.0 15.0 6.5 0.0 0.0 15.0 7.1 0.5 2.3 0.7 1.3 7.0 21.9 5.0 8.2 0.5 0.5 -0.2 -0.6 -0.2 -0.7 0.1 0.7 0.1 0.0 0.7 0.4 0.6 0.7 -0.6 -0.9 6.1 0.9 0.6 0.2 0.3 0.8 0.0 0.0 -1.6 -2.3 1.6 3.4 0.2 0.2 5.3 1.5 4.7 2.8 1.6 0.3 0.1 0.1 -0.9 -1.8 1.5 0.3 0.9 0.4 -0.2 -0.1 -0.3 -0.5 1.1 1.5 0.3 0.1 0.4 0.9 0.1 0.3 -0.1 0.0 0.7 1.8 -0.8 -0.2 -2.4 -1.5 -0.5 -1.2 -1.4 -3.9 -0.5 -0.6 -2.1 -0.3 -2.5 -2.3 0.2 0.4 -1.0 -0.6 -0.2 -0.2 -0.8 -1.2 1.4 0.3 0.0 0.0 1.4 0.8
-113.0 -89.4 -18.5 -94.5 -70.9
-0.4 -0.2 0.2 -1.0 -1.4 2.6 -18.3 -12.8 -5.2 -5.5 0.7 -3.6 -1.7 25.3 -4.7 0.4 -3.2 -1.9 24.1 0.4 4.5 -0.1 5.9 0.1 5.8 -8.3 -0.2 6.6 6.9 -9.5 -3.1 -3.4 0.3 -0.9 5.9 3.5 -6.8 -9.5 -11.6 1.7 -0.3 -7.3 0.3 -3.7 5.8 4.4 -4.2 -3.3 -0.4 -0.9 8.7 -1.6 -3.2 -4.8 -60.9 -11.1 -4.3 -49.8 -10.8 -39.0 -11.2 -0.6 -6.5 -4.1 -23.6 3.8 1.4 -11.7 -8.8 -2.9 -15.7 -14.8 -0.9
-2.4 -2.3 -3.0 -2.3 -2.1 -4.3 -0.1 0.1 -2.2 -4.0 2.1 -4.5 -6.3 -9.5 -2.7 1.0 -19.6 -6.0 2.6 -2.1 0.4 -4.9 -5.1 4.8 0.4 3.9 -0.4 2.4 0.5 2.6 -27.0 -0.4 20.4 11.6 -8.0 -8.4 -10.6 2.2 -0.4 3.3 4.0 -9.4 -1.3 -4.1 4.9 -0.7 -9.9 0.6 -4.1 1.7 2.6 -0.7 -3.4 -0.8 -0.2 3.9 -1.0 -5.1 -6.0 -12.1 -20.5 -11.2 -11.1 -21.7 -9.7 -6.8 -1.4 -15.9 -5.0 -3.4 3.6 3.2 -6.9 -8.7 -4.1 -3.7 -5.9 -0.5
Note: These not seasonally adjusted estimates were prepared in cooperation with the U.S. Department of Labor, Bureau of Labor Statistics, based upon monthly reports submitted by selected
employers throughout Georgia. The estimates include all full- and part-time wage and salary workers who were employed during or received pay for any part of the pay period that includes the twelfth of the month. Proprietors, domestic workers, self-employed persons, unpaid family workers and personnel of the armed forces are excluded. Estimates based on 2019 benchmark.
Source: Georgia Department of Labor, Workforce Statistics & Economic Research
3
Albany MSA Nonfarm Employment
(Not Seasonally Adjusted)
(In thousands)
Preliminary
Revised
Revised
NOV 2020 OCT 2020 NOV 2019
Change in Jobs from OCT 2020
Net %
Change in Jobs from NOV 2019
Net %
Total Nonfarm Total Private Goods Producing Service-Providing Private Service-Providing Trade, Transportation, and Utilities
Retail Trade Government
Federal Government State Government Local Government
60.4
60.4
63.6
0.0 0.0
48.6
48.4
51.2
0.2 0.4
6.6
6.4
6.8
0.2 3.1
53.8
54.0
56.8
-0.2 -0.4
42.0
42.0
44.4
0.0 0.0
12.2
12.0
13.1
0.2 1.7
7.8
7.7
8.1
0.1 1.3
11.8
12.0
12.4
-0.2 -1.7
2.7
2.9
2.7
-0.2 -6.9
2.2
2.2
2.5
0.0 0.0
6.9
6.9
7.2
0.0 0.0
-3.2 -5.0 -2.6 -5.1 -0.2 -2.9 -3.0 -5.3 -2.4 -5.4 -0.9 -6.9 -0.3 -3.7 -0.6 -4.8 0.0 0.0 -0.3 -12.0 -0.3 -4.2
Note: These not seasonally adjusted estimates were prepared in cooperation with the U.S. Department of Labor, Bureau of Labor Statistics, based upon monthly reports submitted by
selected employers in the Albany Metropolitan Statistical Area, which includes Baker, Dougherty, Lee, Terrell and Worth counties. The estimates include all full- and part-time wage and salary workers who were employed during or received pay for any part of the pay period that includes the twelfth of the month. Proprietors, domestic workers, self-employed persons, unpaid familyworkers and personnel of the armed forces are excluded. Estimates based on 2019 benchmark.
Source: Georgia Department of Labor, Workforce Statistics & Economic Research
Athens-Clarke county MSA Nonfarm Employment
(In thousands)
(Not Seasonally Adjusted)
Preliminary
Revised
Revised
NOV 2020 OCT 2020 NOV 2019
Change in Jobs from OCT 2020
Net %
Change in Jobs from NOV 2019
Net %
Total Nonfarm Total Private Goods Producing Service-Providing Private Service-Providing Trade, Transportation, and Utilities
Retail Trade Professional and Business Services Leisure and Hospitality Government
Federal Government State Government Local Government
95.1
94.8
98.3
0.3 0.3
70.1
69.8
70.4
0.3 0.4
8.4
8.5
10.0
-0.1 -1.2
86.7
86.3
88.3
0.4 0.5
61.7
61.3
60.4
0.4 0.7
16.9
16.2
16.6
0.7 4.3
11.1
10.8
10.8
0.3 2.8
8.5
8.4
8.5
0.1 1.2
11.8
11.8
11.3
0.0 0.0
25.0
25.0
27.9
0.0 0.0
1.1
1.2
1.2
-0.1 -8.3
15.9
16.1
18.6
-0.2 -1.2
8.0
7.7
8.1
0.3 3.9
-3.2 -3.3 -0.3 -0.4 -1.6 -16.0 -1.6 -1.8 1.3 2.2 0.3 1.8 0.3 2.8 0.0 0.0 0.5 4.4 -2.9 -10.4 -0.1 -8.3 -2.7 -14.5 -0.1 -1.2
Note: These not seasonally adjusted estimates were prepared in cooperation with the U.S. Department of Labor, Bureau of Labor Statistics, based upon monthly reports submitted by selected
employers in the Athens-Clarke County Metropolitan Statistical Area, which includes Clarke, Madison, Oconee and Oglethorpe counties. The estimates include all full- and part-time wage and salary workers who were employed during or received pay for any part of the pay period that includes the twelfth of the month. Proprietors, domestic workers, self-employed persons, unpaid family workers and personnel of the armed forces are excluded. Estimates based on 2019 benchmark.
Source: Georgia Department of Labor, Workforce Statistics & Economic Research
4
Atlanta MSA Nonfarm Employment
(In thousands)
(Not Seasonally Adjusted)
Preliminary
Revised
NOV 2020 OCT 2020
Revised NOV 2019
Change in Jobs from OCT 2020
Net %
Change in Jobs from NOV 2019
Net %
Total Nonfarm Total Private Goods Producing Service-Providing Private Service-Providing Mining and Logging Mining, Logging and Construction Construction
Construction of Buildings Specialty Trade Contractors Manufacturing Durable Goods Transportation Equipment Manufacturing Non-Durable Goods Food Manufacturing Trade, Transportation, and Utilities Wholesale Trade Merchant Wholesalers, Durable Goods Merchant Wholesalers, Nondurable Goods Wholesale Electronic Markets and Agents and Brokers Retail Trade Food and Beverage Stores General Merchandise Stores Miscellaneous Store Retailers Transportation, Warehousing, and Utilities Utilities Transportation and Warehousing Air Transportation Truck Transportation Couriers and Messengers Information Telecommunications Wired and Wireless Telecommunications Carriers Data Processing, Hosting, and Related Services Financial Activities Finance and Insurance Insurance Carriers and Related Activities Real Estate and Rental and Leasing Professional and Business Services Professional, Scientific, and Technical Services Accounting, Tax Prep, and Bookkeeping Services Architectural, Engineering, and Related Services Computer Systems Design and Related Services Management and Technical Consulting Services Management of Companies and Enterprises Admin and Support, Waste Mngmnt and Remediation Employment Services Education and Health Services Educational Services Health Care and Social Assistance Ambulatory Health Care Services Hospitals Social Assistance Leisure and Hospitality Arts, Entertainment, and Recreation Accommodation and Food Services Accommodation Food Services and Drinking Places Other Services Repair and Maintenance Personal and Laundry Services Government Federal Government State Government Local Government
2,808.7 2,478.2
296.0 2,512.7 2,182.2
1.6 133.5 131.9
29.6 83.7 162.5 84.1 11.9 78.4 24.0 627.4 155.5 87.9 40.3 27.3 314.7 61.8 66.6 15.0 157.2 10.1 147.1 21.6 35.1 29.6 96.1 28.6 24.8 13.4 175.4 128.9 62.7 46.5 537.9 222.7 26.4 34.6 59.1 44.3 74.1 241.1 122.2 378.4 70.1 308.3 137.2 94.1 45.7 272.1 27.7 244.4 22.2 222.2 94.9 24.7 21.5 330.5 50.2 70.0 210.3
2,787.2 2,455.8
294.5 2,492.7 2,161.3
1.6 131.6 130.0
29.3 82.7 162.9 83.6 11.9 79.3 23.8 607.5 154.5 87.7 40.1 26.7 304.0 60.6 61.7 15.1 149.0 10.1 138.9 21.1 34.9 24.2 95.5 28.7 25.0 13.4 175.7 128.4 62.6 47.3 532.8 221.7 25.9 34.5 60.3 43.1 74.0 237.1 120.1 377.7 70.8 306.9 136.7 94.1 45.9 274.4 27.8 246.6 22.1 224.5 97.7 25.5 22.7 331.4 51.5 70.1 209.8
2,894.2 2,555.2
304.8 2,589.4 2,250.4
1.5 132.1 130.6
30.1 83.5 172.7 91.4 15.6 81.3 23.4 617.7 156.6 84.7 42.7 29.2 299.8 59.2 63.2 15.0 161.3 10.1 151.2 30.4 35.2 24.0 103.6 31.8 27.7 13.1 178.7 125.6 61.5 53.1 557.6 234.1 25.9 34.2 64.7 42.5 78.1 245.4 128.5 381.6 70.2 311.4 137.5 93.9 48.9 306.4 38.9 267.5 26.7 240.8 104.8 25.3 28.8 339.0 48.0 74.5 216.5
21.5 0.8 22.4 0.9
1.5 0.5 20.0 0.8 20.9 1.0
0.0 0.0 1.9 1.4 1.9 1.5 0.3 1.0 1.0 1.2 -0.4 -0.3 0.5 0.6 0.0 0.0 -0.9 -1.1 0.2 0.8 19.9 3.3 1.0 0.7 0.2 0.2 0.2 0.5 0.6 2.3 10.7 3.5 1.2 2.0 4.9 7.9 -0.1 -0.7 8.2 5.5 0.0 0.0 8.2 5.9 0.5 2.4 0.2 0.6 5.4 22.3 0.6 0.6 -0.1 -0.4 -0.2 -0.8 0.0 0.0 -0.3 -0.2 0.5 0.4 0.1 0.2 -0.8 -1.7 5.1 1.0 1.0 0.5 0.5 1.9 0.1 0.3 -1.2 -2.0 1.2 2.8 0.1 0.1 4.0 1.7 2.1 1.8 0.7 0.2 -0.7 -1.0 1.4 0.5 0.5 0.4 0.0 0.0 -0.2 -0.4 -2.3 -0.8 -0.1 -0.4 -2.2 -0.9 0.1 0.5 -2.3 -1.0 -2.8 -2.9 -0.8 -3.1 -1.2 -5.3 -0.9 -0.3 -1.3 -2.5 -0.1 -0.1 0.5 0.2
-85.5 -3.0 -77.0 -3.0
-8.8 -2.9 -76.7 -3.0 -68.2 -3.0
0.1 6.7 1.4 1.1 1.3 1.0 -0.5 -1.7 0.2 0.2 -10.2 -5.9 -7.3 -8.0 -3.7 -23.7 -2.9 -3.6 0.6 2.6 9.7 1.6 -1.1 -0.7 3.2 3.8 -2.4 -5.6 -1.9 -6.5 14.9 5.0 2.6 4.4 3.4 5.4 0.0 0.0 -4.1 -2.5 0.0 0.0 -4.1 -2.7 -8.8 -29.0 -0.1 -0.3 5.6 23.3 -7.5 -7.2 -3.2 -10.1 -2.9 -10.5 0.3 2.3 -3.3 -1.9 3.3 2.6 1.2 2.0 -6.6 -12.4 -19.7 -3.5 -11.4 -4.9 0.5 1.9 0.4 1.2 -5.6 -8.7 1.8 4.2 -4.0 -5.1 -4.3 -1.8 -6.3 -4.9 -3.2 -0.8 -0.1 -0.1 -3.1 -1.0 -0.3 -0.2 0.2 0.2 -3.2 -6.5 -34.3 -11.2 -11.2 -28.8 -23.1 -8.6 -4.5 -16.9 -18.6 -7.7 -9.9 -9.5 -0.6 -2.4 -7.3 -25.4 -8.5 -2.5 2.2 4.6 -4.5 -6.0 -6.2 -2.9
Note: These not seasonally adjusted estimates were prepared in cooperation with the U.S. Department of Labor, Bureau of Labor Statistics, based upon monthly reports submitted by
selected employers in the Atlanta Metropolitan Statistical Area, which includes Barrow, Bartow, Butts, Carroll, Cherokee, Clayton, Cobb, Coweta, Dawson, DeKalb, Douglas, Fayette, Forsyth, Fulton, Gwinnett, Haralson, Heard, Henry, Jasper, Lamar, Meriwether, Morgan, Newton, Paulding, Pickens, Pike, Rockdale, Spalding and Walton counties. The estimates include all full- and part-time wage and salary workers who were employed during or received pay for any part of the pay period that includes the twelfth of the month. Proprietors, domestic workers, self-employed persons, unpaid family workers and personnel of the armed forces are excluded. Estimates based on 2019 benchmark.
Source: Georgia Department of Labor, Workforce Statistics & Economic Research
5
AUGusta-Richmond county MSA Nonfarm Employment
(In thousands)
(Not Seasonally Adjusted)
Preliminary
Revised
Revised
NOV 2020 OCT 2020 NOV 2019
Change in Jobs from OCT 2020
Net %
Change in Jobs from NOV 2019
Net %
Total Nonfarm Total Private Goods Producing Service-Providing Private Service-Providing Mining, Logging and Construction Manufacturing Trade, Transportation, and Utilities
Wholesale Trade Retail Trade Transportation, Warehousing, and Utilities Information Financial Activities Professional and Business Services Education and Health Services Leisure and Hospitality Other Services Government Federal Government State Government Local Government
232.0 186.5
44.6 187.4 141.9
21.3 23.3 39.5
5.6 25.5
8.4 2.1 6.4 31.2 32.3 22.7 7.7 45.5 9.7 15.2 20.6
231.8 186.0
44.4 187.4 141.6
21.3 23.1 38.2
5.6 24.8
7.8 2.1 6.4 32.2 32.2 22.7 7.8 45.8 10.0 15.2 20.6
244.2 197.9
43.7 200.5 154.2
20.5 23.2 40.5
5.8 26.6
8.1 2.4 6.6 32.8 36.1 27.2 8.6 46.3 9.9 15.3 21.1
0.2 0.1 0.5 0.3 0.2 0.5 0.0 0.0 0.3 0.2 0.0 0.0 0.2 0.9 1.3 3.4 0.0 0.0 0.7 2.8 0.6 7.7 0.0 0.0 0.0 0.0 -1.0 -3.1 0.1 0.3 0.0 0.0 -0.1 -1.3 -0.3 -0.7 -0.3 -3.0 0.0 0.0 0.0 0.0
-12.2 -11.4
0.9 -13.1 -12.3
0.8 0.1 -1.0 -0.2 -1.1 0.3 -0.3 -0.2 -1.6 -3.8 -4.5 -0.9 -0.8 -0.2 -0.1 -0.5
-5.0 -5.8 2.1 -6.5 -8.0 3.9 0.4 -2.5 -3.5 -4.1 3.7 -12.5 -3.0 -4.9 -10.5 -16.5 -10.5 -1.7 -2.0 -0.7 -2.4
Note: These not seasonally adjusted estimates were prepared in cooperation with the U.S. Department of Labor, Bureau of Labor Statistics, based upon monthly reports submitted by
selected employers in the Augusta-Richmond County Metropolitan Statistical Area, which includes Burke, Columbia, Lincoln, McDuffie and Richmond counties in Georgia and Aiken and Edgefield counties in South Carolina. The estimates include all full- and part-time wage and salary workers who were employed during or received pay for any part of the pay period that includes the twelfth of the month. Proprietors, domestic workers, self-employed persons, unpaid family workers and personnel of the armed forces are excluded. Estimates based on 2019 benchmark.
Brunswick MSA Nonfarm Employment
(In thousands)
(Not Seasonally Adjusted)
Preliminary
Revised
Revised
NOV 2020 OCT 2020 NOV 2019
Change in Jobs from OCT 2020
Net %
Change in Jobs from NOV 2019
Net %
Total Nonfarm Total Private Goods Producing Service-Providing Private Service-Providing Trade, Transportation, and Utilities
Retail Trade Government
Federal Government State Government Local Government
39.2
39.0
44.9
30.5
30.3
35.8
3.8
3.7
4.0
35.4
35.3
40.9
26.7
26.6
31.8
9.4
9.1
9.4
5.5
5.4
5.8
8.7
8.7
9.1
2.1
2.1
2.1
1.7
1.7
1.8
4.9
4.9
5.2
0.2 0.5 0.2 0.7 0.1 2.7 0.1 0.3 0.1 0.4 0.3 3.3 0.1 1.9 0.0 0.0 0.0 0.0 0.0 0.0 0.0 0.0
-5.7 -12.7 -5.3 -14.8 -0.2 -5.0 -5.5 -13.5 -5.1 -16.0 0.0 0.0 -0.3 -5.2 -0.4 -4.4 0.0 0.0 -0.1 -5.6 -0.3 -5.8
Note: These not seasonally adjusted estimates were prepared in cooperation with the U.S. Department of Labor, Bureau of Labor Statistics, based upon monthly reports submitted by
selected employers in the Brunswick Metropolitan Statistical Area, which includes Brantley, Glynn and McIntosh counties. The estimates include all full- and part-time wage and salary workers who were employed during or received pay for any part of the pay period that includes the twelfth of the month. Proprietors, domestic workers, self-employed persons, unpaid family workers and personnel of the armed forces are excluded. Estimates based on 2019 benchmark.
Source: Georgia Department of Labor, Workforce Statistics & Economic Research
6
Columbus MSA Nonfarm Employment
(In thousands)
(Not Seasonally Adjusted)
Preliminary
Revised
Revised
NOV 2020 OCT 2020 NOV 2019
Change in Jobs from OCT 2020
Net %
Change in Jobs from NOV 2019
Net %
Total Nonfarm Total Private Goods Producing Service-Providing Private Service-Providing Mining, Logging and Construction Manufacturing Trade, Transportation, and Utilities
Wholesale Trade Retail Trade Transportation, Warehousing, and Utilities Information Financial Activities Finance and Insurance
Insurance Carriers and Related Activities Professional and Business Services Education and Health Services Leisure and Hospitality Other Services Government
Federal Government State Government Local Government
116.5 94.8 14.6 101.9 80.2
4.7 9.9 18.3 2.5 12.8 3.0 1.3 12.7 11.1 3.8 13.8 16.1 14.0 4.0 21.7 6.1 3.8 11.8
116.8 94.8 14.7 102.1 80.1
4.8 9.9 18.1 2.5 12.8 2.8 1.3 12.7 11.1 3.8 13.9 16.1 14.0 4.0 22.0 6.3 4.0 11.7
123.2 99.7 15.5
107.7 84.2 4.8 10.7 18.5 2.7 12.9 2.9 1.3 12.9 11.0 4.0 15.3 16.5 15.3 4.4 23.5 6.6 4.4 12.5
-0.3 -0.3 0.0 0.0 -0.1 -0.7 -0.2 -0.2 0.1 0.1 -0.1 -2.1 0.0 0.0 0.2 1.1 0.0 0.0 0.0 0.0 0.2 7.1 0.0 0.0 0.0 0.0 0.0 0.0 0.0 0.0 -0.1 -0.7 0.0 0.0 0.0 0.0 0.0 0.0 -0.3 -1.4 -0.2 -3.2 -0.2 -5.0 0.1 0.9
-6.7 -5.4 -4.9 -4.9 -0.9 -5.8 -5.8 -5.4 -4.0 -4.8 -0.1 -2.1 -0.8 -7.5 -0.2 -1.1 -0.2 -7.4 -0.1 -0.8 0.1 3.5 0.0 0.0 -0.2 -1.6 0.1 0.9 -0.2 -5.0 -1.5 -9.8 -0.4 -2.4 -1.3 -8.5 -0.4 -9.1 -1.8 -7.7 -0.5 -7.6 -0.6 -13.6 -0.7 -5.6
Note: These not seasonally adjusted estimates were prepared in cooperation with the U.S. Department of Labor, Bureau of Labor Statistics, based upon monthly reports submitted by
selected employers in the Columbus Metropolitan Statistical Area, which includes Chattahoochee, Harris, Marion and Muscogee counties in Georgia and Russell County in Alabama. The estimates include all full- and part-time wage and salary workers who were employed during or received pay for any part of the pay period that includes the twelfth of the month. Proprietors, domestic workers, self-employed persons, unpaid family workers and personnel of the armed forces are excluded. Estimates based on 2019 benchmark.
Dalton MSA Nonfarm Employment
(In thousands)
(Not Seasonally Adjusted)
Preliminary
Revised
Revised
NOV 2020 OCT 2020 NOV 2019
Change in Jobs from OCT 2020
Net %
Change in Jobs from NOV 2019
Net %
Total Nonfarm Total Private Goods Producing Service-Providing Private Service-Providing Manufacturing
Textile Mills Textile Product Mills Trade, Transportation, and Utilities Retail Trade Transportation, Warehousing, and Utilities Professional and Business Services Government Federal Government State Government Local Government
63.8
63.6
66.1
0.2 0.3
56.9
56.7
59.1
0.2 0.4
23.8
23.8
25.1
0.0 0.0
40.0
39.8
41.0
0.2 0.5
33.1
32.9
34.0
0.2 0.6
23.5
23.5
23.7
0.0 0.0
3.5
3.5
3.8
0.0 0.0
14.0
14.0
13.9
0.0 0.0
13.0
12.9
13.1
0.1 0.8
6.0
5.8
6.1
0.2 3.5
3.2
3.1
3.2
0.1 3.2
6.5
6.5
6.7
0.0 0.0
6.9
6.9
7.0
0.0 0.0
0.2
0.3
0.3
-0.1 -33.3
1.1
1.1
1.1
0.0 0.0
5.6
5.5
5.6
0.1 1.8
-2.3 -3.5 -2.2 -3.7 -1.3 -5.2 -1.0 -2.4 -0.9 -2.7 -0.2 -0.8 -0.3 -7.9 0.1 0.7 -0.1 -0.8 -0.1 -1.6 0.0 0.0 -0.2 -3.0 -0.1 -1.4 -0.1 -33.3 0.0 0.0 0.0 0.0
Note: These not seasonally adjusted estimates were prepared in cooperation with the U.S. Department of Labor, Bureau of Labor Statistics, based upon monthly reports submitted by
selected employers in the Dalton Metropolitan Statistical Area, which includes Murray and Whitfield counties. The estimates include all full- and part-time wage and salary workers who were employed during or received pay for any part of the pay period that includes the twelfth of the month. Proprietors, domestic workers, self-employed persons, unpaid family workers and personnel of the armed forces are excluded. Estimates based on 2019 benchmark.
Source: Georgia Department of Labor, Workforce Statistics & Economic Research
7
Gainesville MSA Nonfarm Employment
(In thousands)
(Not Seasonally Adjusted)
Preliminary
Revised
Revised
NOV 2020 OCT 2020 NOV 2019
Change in Jobs from OCT 2020
Net %
Change in Jobs from NOV 2019
Net %
Total Nonfarm Total Private Goods Producing
92.4
92.0
94.9
81.8
81.3
84.0
24.3
24.3
25.7
0.4 0.4 0.5 0.6 0.0 0.0
-2.5 -2.6 -2.2 -2.6 -1.4 -5.5
Service-Providing Private Service-Providing
68.1
67.7
69.2
57.5
57.0
58.3
0.4 0.6 0.5 0.9
-1.1 -1.6 -0.8 -1.4
Trade, Transportation, and Utilities
17.2
16.6
17.6
0.6 3.6
-0.4 -2.3
Retail Trade Government
9.1
9.0
9.1
0.1 1.1
10.6
10.7
10.9
-0.1 -0.9
0.0 0.0 -0.3 -2.8
Federal Government
0.5
0.6
0.5
-0.1 -16.7
0.0 0.0
State Government Local Government
2.8
2.8
2.8
0.0 0.0
7.3
7.3
7.6
0.0 0.0
0.0 0.0 -0.3 -4.0
Note: These not seasonally adjusted estimates were prepared in cooperation with the U.S. Department of Labor, Bureau of Labor Statistics, based upon monthly reports submitted by
selected employers in the Gainesville Metropolitan Statistical Area, which comprises Hall county. The estimates include all full- and part-time wage and salary workers who were employed during or received pay for any part of the pay period that includes the twelfth of the month. Proprietors, domestic workers, self-employed persons, unpaid family workers and personnel of the armed forces are excluded. Estimates based on 2019 benchmark.
Hinesville MSA Nonfarm Employment
(In thousands)
(Not Seasonally Adjusted)
Preliminary Revised Revised NOV 2020 OCT 2020 NOV 2019
Change in Jobs from OCT 2020
Net %
Change in Jobs from NOV 2019
Net %
Total Nonfarm Total Private Goods Producing Service-Providing Private Service-Providing Government
Federal Government State Government Local Government
22.0
21.6
21.7
14.0
13.7
13.6
2.9
2.9
3.0
19.1
18.7
18.7
11.1
10.8
10.6
8.0
7.9
8.1
3.9
3.8
3.9
0.4
0.4
0.4
3.7
3.7
3.8
0.4 1.9 0.3 2.2 0.0 0.0 0.4 2.1 0.3 2.8 0.1 1.3 0.1 2.6 0.0 0.0 0.0 0.0
0.3 1.4 0.4 2.9 -0.1 -3.3 0.4 2.1 0.5 4.7 -0.1 -1.2 0.0 0.0 0.0 0.0 -0.1 -2.6
Note: These not seasonally adjusted estimates were prepared in cooperation with the U.S. Department of Labor, Bureau of Labor Statistics, based upon monthly reports submitted by
selected employers in the Hinesville Metropolitan Statistical Area, which includes Liberty and Long counties. The estimates include all full- and part-time wage and salary workers who were employed during or received pay for any part of the pay period that includes the twelfth of the month. Proprietors, domestic workers, self-employed persons, unpaid family workers and personnel of the armed forces are excluded. Estimates based on 2019 benchmark.
Source: Georgia Department of Labor, Workforce Statistics & Economic Research
8
Macon-BIBB County MSA Nonfarm Employment
(In thousands)
(Not Seasonally Adjusted)
Preliminary
Revised
Revised
NOV 2020 OCT 2020 NOV 2019
Change in Jobs from OCT 2020
Net %
Change in Jobs from NOV 2019
Net %
Total Nonfarm Total Private Goods Producing Service-Providing Private Service-Providing Trade, Transportation, and Utilities
Retail Trade Transportation, Warehousing, and Utilities Financial Activities Professional and Business Services Education and Health Services Leisure and Hospitality Government Federal Government State Government Local Government
101.4 87.8 9.7 91.7 78.1 21.7 12.2 6.1 9.5 12.1 20.7 9.7 13.6 1.1 4.0 8.5
100.2 86.7 9.7 90.5 77.0 20.9 11.9 5.8 9.5 12.2 20.7 9.7 13.5 1.1 4.0 8.4
103.9 89.5 10.4 93.5 79.1 20.9 11.9 6.0 9.7 12.1 22.1 10.7 14.4 1.1 4.2 9.1
1.2 1.2 1.1 1.3 0.0 0.0 1.2 1.3 1.1 1.4 0.8 3.8 0.3 2.5 0.3 5.2 0.0 0.0 -0.1 -0.8 0.0 0.0 0.0 0.0 0.1 0.7 0.0 0.0 0.0 0.0 0.1 1.2
-2.5 -2.4 -1.7 -1.9 -0.7 -6.7 -1.8 -1.9 -1.0 -1.3 0.8 3.8 0.3 2.5 0.1 1.7 -0.2 -2.1 0.0 0.0 -1.4 -6.3 -1.0 -9.4 -0.8 -5.6 0.0 0.0 -0.2 -4.8 -0.6 -6.6
Note: These not seasonally adjusted estimates were prepared in cooperation with the U.S. Department of Labor, Bureau of Labor Statistics, based upon monthly reports submitted by
selected employers in the Macon-Bibb County Metropolitan Statistical Area, which includes Bibb, Crawford, Jones, Monroe and Twiggs counties. The estimates include all full- and part-time wage and salary workers who were employed during or received pay for any part of the pay period that includes the twelfth of the month. Proprietors, domestic workers, self-employed persons, unpaid family workers and personnel of the armed forces are excluded. Estimates based on 2019 benchmark.
Rome MSA Nonfarm Employment
(In thousands)
(Not Seasonally Adjusted)
Preliminary
Revised
Revised
NOV 2020 OCT 2020 NOV 2019
Change in Jobs from OCT 2020
Net %
Change in Jobs from NOV 2019
Net %
Total Nonfarm Total Private Goods Producing Service-Providing Private Service-Providing Manufacturing Trade, Transportation, and Utilities
Retail Trade Education and Health Services Government
Federal Government State Government Local Government
42.6
42.4
42.7
0.2 0.5
37.1
36.9
36.9
0.2 0.5
7.3
7.3
7.3
0.0 0.0
35.3
35.1
35.4
0.2 0.6
29.8
29.6
29.6
0.2 0.7
5.9
5.9
6.1
0.0 0.0
8.2
8.0
8.0
0.2 2.5
4.7
4.6
4.6
0.1 2.2
10.6
10.7
10.9
-0.1 -0.9
5.5
5.5
5.8
0.0 0.0
0.2
0.2
0.2
0.0 0.0
1.5
1.5
1.6
0.0 0.0
3.8
3.8
4.0
0.0 0.0
-0.1 -0.2 0.2 0.5 0.0 0.0 -0.1 -0.3 0.2 0.7 -0.2 -3.3 0.2 2.5 0.1 2.2 -0.3 -2.8 -0.3 -5.2 0.0 0.0 -0.1 -6.3 -0.2 -5.0
Note: These not seasonally adjusted estimates were prepared in cooperation with the U.S. Department of Labor, Bureau of Labor Statistics, based upon monthly reports submitted by
selected employers in the Rome Metropolitan Statistical Area, which comprises Floyd county. The estimates include all full- and part-time wage and salary workers who were employed during or received pay for any part of the pay period that includes the twelfth of the month. Proprietors, domestic workers, self-employed persons, unpaid family workers and personnel of the armed forces are excluded. Estimates based on 2019 benchmark.
Source: Georgia Department of Labor, Workforce Statistics & Economic Research
9
Savannah MSA Nonfarm Employment
(In thousands)
(Not Seasonally Adjusted)
Preliminary Revised
Revised
NOV 2020 OCT 2020 NOV 2019
Change in Jobs from OCT 2020
Net %
Change in Jobs from NOV 2019
Net %
Total Nonfarm Total Private Goods Producing Service-Providing Private Service-Providing Mining, Logging and Construction Manufacturing Trade, Transportation, and Utilities
Wholesale Trade Retail Trade Transportation, Warehousing, and Utilities Information Financial Activities Professional and Business Services Education and Health Services Leisure and Hospitality Other Services Government Federal Government State Government Local Government
182.9 159.8
26.0 156.9 133.8
8.6 17.4 44.8
6.4 21.9 16.5
2.3 6.2 23.5 27.6 22.2 7.2 23.1 2.9 5.4 14.8
180.6 156.9
25.5 155.1 131.4
8.2 17.3 43.1
6.4 21.1 15.6
2.3 6.2 23.1 27.5 21.9 7.3 23.7 3.2 5.4 15.1
187.8 163.8
27.5 160.3 136.3
8.2 19.3 43.8
6.6 22.1 15.1
2.8 6.4 20.6 27.4 27.6 7.7 24.0 2.9 5.7 15.4
2.3 1.3 2.9 1.9 0.5 2.0 1.8 1.2 2.4 1.8 0.4 4.9 0.1 0.6 1.7 3.9 0.0 0.0 0.8 3.8 0.9 5.8 0.0 0.0 0.0 0.0 0.4 1.7 0.1 0.4 0.3 1.4 -0.1 -1.4 -0.6 -2.5 -0.3 -9.4 0.0 0.0 -0.3 -2.0
-4.9 -2.6 -4.0 -2.4 -1.5 -5.5 -3.4 -2.1 -2.5 -1.8 0.4 4.9 -1.9 -9.8 1.0 2.3 -0.2 -3.0 -0.2 -0.9 1.4 9.3 -0.5 -17.9 -0.2 -3.1 2.9 14.1 0.2 0.7 -5.4 -19.6 -0.5 -6.5 -0.9 -3.8 0.0 0.0 -0.3 -5.3 -0.6 -3.9
Note: These not seasonally adjusted estimates were prepared in cooperation with the U.S. Department of Labor, Bureau of Labor Statistics, based upon monthly reports submitted by
selected employers in the Savannah Metropolitan Statistical Area, which includes Bryan, Chatham and Effingham counties. The estimates include all full- and part-time wage and salary workers who were employed during or received pay for any part of the pay period that includes the twelfth of the month. Proprietors, domestic workers, self-employed persons, unpaid family workers and personnel of the armed forces are excluded. Estimates based on 2019 benchmark.
Valdosta MSA Nonfarm Employment
(In thousands)
(Not Seasonally Adjusted)
Preliminary Revised
Revised
NOV 2020 OCT 2020 NOV 2019
Change in Jobs from OCT 2020
Net %
Change in Jobs from NOV 2019
Net %
Total Nonfarm Total Private Goods Producing Service-Providing Private Service-Providing Trade, Transportation, and Utilities
Retail Trade Government
Federal Government State Government Local Government
58.8
57.8
57.1
1.0 1.7
46.1
44.9
43.6
1.2 2.7
7.4
7.3
7.6
0.1 1.4
51.4
50.5
49.5
0.9 1.8
38.7
37.6
36.0
1.1 2.9
14.4
13.6
12.8
0.8 5.9
7.4
7.2
7.1
0.2 2.8
12.7
12.9
13.5
-0.2 -1.6
1.1
1.2
1.2
-0.1 -8.3
3.5
3.5
3.8
0.0 0.0
8.1
8.2
8.5
-0.1 -1.2
1.7 3.0 2.5 5.7 -0.2 -2.6 1.9 3.8 2.7 7.5 1.6 12.5 0.3 4.2 -0.8 -5.9 -0.1 -8.3 -0.3 -7.9 -0.4 -4.7
Note: These not seasonally adjusted estimates were prepared in cooperation with the U.S. Department of Labor, Bureau of Labor Statistics, based upon monthly reports submitted by
selected employers in the Valdosta Metropolitan Statistical Area, which includes Brooks, Echols, Lanier and Lowndes counties. The estimates include all full- and part-time wage and salary workers who were employed during or received pay for any part of the pay period that includes the twelfth of the month. Proprietors, domestic workers, self-employed persons, unpaid family workers and personnel of the armed forces are excluded. Estimates based on 2019 benchmark.
Source: Georgia Department of Labor, Workforce Statistics & Economic Research
10
Warner Robins MSA Nonfarm Employment
(In thousands)
(Not Seasonally Adjusted)
Preliminary
Revised
Revised
NOV 2020 OCT 2020 NOV 2019
Change in Jobs from OCT 2020
Net %
Change in Jobs from NOV 2019
Net %
Total Nonfarm Total Private Goods Producing Service-Providing Private Service-Providing Trade, Transportation, and Utilities
Retail Trade Government
Federal Government State Government Local Government
74.5
73.6
78.0
46.1
45.4
49.8
9.8
9.8
10.1
64.7
63.8
67.9
36.3
35.6
39.7
12.1
11.7
11.5
9.7
9.2
8.9
28.4
28.2
28.2
16.1
16.0
16.0
2.5
2.5
2.3
9.8
9.7
9.9
0.9 1.2 0.7 1.5 0.0 0.0 0.9 1.4 0.7 2.0 0.4 3.4 0.5 5.4 0.2 0.7 0.1 0.6 0.0 0.0 0.1 1.0
-3.5 -4.5 -3.7 -7.4 -0.3 -3.0 -3.2 -4.7 -3.4 -8.6 0.6 5.2 0.8 9.0 0.2 0.7 0.1 0.6 0.2 8.7 -0.1 -1.0
Note: These not seasonally adjusted estimates were prepared in cooperation with the U.S. Department of Labor, Bureau of Labor Statistics, based upon monthly reports submitted by
selected employers in the Warner Robins Metropolitan Statistical Area, which includes Houston, Peach and Pulaski counties. The estimates include all full- and part-time wage and salary workers who were employed during or received pay for any part of the pay period that includes the twelfth of the month. Proprietors, domestic workers, self-employed persons, unpaid family workers and personnel of the armed forces are excluded. Estimates based on 2019 benchmark.
Total Nonfarm Employment by Metro Statistical Area
(In thousands)
(Seasonally Adjusted)
Preliminary
Revised
Revised
NOV 2020 OCT 2020 NOV 2019
Change in Jobs from OCT 2019
Net %
Change in Jobs from NOV 2019
Net %
Albany MSA
59.7
60.0
62.9
-0.3 -0.5
-3.2 -5.1
Athens-Clarke County MSA
93.8
93.6
96.6
0.2 0.2
-2.8 -2.9
Atlanta MSA
2,785.5
2,774.7
2,871.7
10.8 0.4
-86.2 -3.0
Augusta-Richmond County MSA
230.7
230.8
243.3
-0.1 0.0
-12.6 -5.2
Brunswick MSA
39.3
39.0
44.9
0.3 0.8
-5.6 -12.5
Columbus MSA
115.5
116.1
121.8
-0.6 -0.5
-6.3 -5.2
Dalton MSA
63.8
63.6
66.1
0.2 0.3
-2.3 -3.5
Gainesville MSA
91.8
91.7
94.2
0.1 0.1
-2.4 -2.5
Hinesville MSA
21.8
21.6
21.6
0.2 0.9
0.2 0.9
Macon-Bibb County MSA
100.4
100.0
102.9
0.4 0.4
-2.5 -2.4
Rome MSA
42.3
42.1
42.3
0.2 0.5
0.0 0.0
Savannah MSA
182.0
180.6
187.1
1.4 0.8
-5.1 -2.7
Valdosta MSA
58.1
57.5
56.5
0.6 1.0
1.6 2.8
Warner Robins MSA
74.3
73.7
77.8
0.6 0.8
-3.5 -4.5
Note: These seasonally adjusted estimates were prepared in cooperation with the U.S. Department of Labor, Bureau of Labor Statistics, based upon monthly reports submitted by selected
employers throughout Georgia. The estimates include all full- and part-time wage and salary workers who were employed during or received pay for any part of the pay period that includes the twelfth of the month. Proprietors, domestic workers, self-employed persons, unpaid family workers and personnel of the armed forces are excluded. Estimates based on 2019 benchmark.
Source: Georgia Department of Labor, Workforce Statistics & Economic Research
11
Georgia Statewide Hours and Earnings
All Employee
Average Weekly Earnings (AWE)
Preliminary NOV 2020
Revised OCT 2020
Revised NOV 2019
Total Private.....................................................................................................$980.70.............................$961.88.......................$924.29 Goods Producing....................................................................................... $1,120.06.......................... $1,120.83....................$1,056.04 Private Service Providing............................................................................. $955.86............................ $933.20...................... $900.80 Construction............................................................................................ $1,145.20.......................... $1,152.78.................... $1,090.12 Manufacturing......................................................................................... $1,081.59.......................... $1,084.12....................$1,029.57 Trade, Transportation, and Utilities........................................................... $824.22.............................$832.12.......................$815.24 Financial Activities..................................................................................$1,546.60..........................$1,362.77....................$1,288.88 Professional and Business Services...................................................... $1,183.50...........................$1,152.17.................... $1,134.22 Educational and Health Services............................................................ $1,059.18..........................$1,044.82.................... $1,011.29 Leisure and Hospitality.............................................................................. $378.54.............................$376.81....................... $367.13 Other Services...........................................................................................$818.24............................ $778.44.......................$734.04
Average Weekly Hours (AWH)
Preliminary NOV 2020
Revised OCT 2020
Revised NOV 2019
Total Private...........................................................................................................35.0...................................34.7.............................34.8 Goods Producing................................................................................................ 41.7................................... 41.9.............................40.9 Private Service Providing....................................................................................33.8...................................33.4.............................33.7 Construction.....................................................................................................40.9................................... 41.2............................. 39.8 Manufacturing..................................................................................................42.2...................................42.2............................. 41.7 Trade, Transportation, and Utilities..................................................................34.2.................................. 34.3.............................34.5 Financial Activities........................................................................................... 37.0...................................35.6............................. 37.5 Professional and Business Services............................................................... 37.5...................................36.6.............................35.4 Educational and Health Services.....................................................................34.4...................................34.0.............................34.8 Leisure and Hospitality..................................................................................... 27.0...................................26.8.............................26.7 Other Services.................................................................................................32.0...................................31.2.............................30.7
Average Hourly Earnings (AHE)
Preliminary NOV 2020
Revised OCT 2020
Revised NOV 2019
Total Private.......................................................................................................$28.02............................... $27.72.........................$26.56 Goods Producing........................................................................................... $26.86...............................$26.75.........................$25.82 Private Service Providing................................................................................$28.28...............................$27.94.........................$26.73 Construction.................................................................................................$28.00...............................$27.98......................... $27.39 Manufacturing..............................................................................................$25.63.............................. $25.69.........................$24.69 Trade, Transportation, and Utilities.............................................................. $24.10...............................$24.26.........................$23.63 Financial Activities.......................................................................................$41.80.............................. $38.28.........................$34.37 Professional and Business Services...........................................................$31.56...............................$31.48.........................$32.04 Educational and Health Services.................................................................$30.79...............................$30.73.........................$29.06 Leisure and Hospitality.................................................................................$14.02...............................$14.06......................... $13.75 Other Services.............................................................................................$25.57...............................$24.95.........................$23.91
Read more about the hours and earnings series at http://www.bls.gov/sae/home.htm
Note: These not seasonally adjusted estimates were prepared in cooperation with the U.S. Department of Labor, Bureau of Labor Statistics, based upon monthly reports submitted by
selected employers throughout Georgia. The estimates include all full- and part-time wage and salary workers who were employed during or received pay for any part of the pay period that includes the twelfth of the month. Proprietors, domestic workers, self-employed persons, unpaid family workers and personnel of the armed forces are excluded. Estimates based on 2019 benchmark.
Source: Georgia Department of Labor, Workforce Statistics & Economic Research
12
Georgia MSA Hours and Earnings
All Employee Total Private
Average Weekly Earnings (AWE)
Preliminary NOV 2020
Revised OCT 2020
Revised NOV 2019
Albany MSA ................................................................................................... $708.30............................. $713.71.......................$762.87 Athens-Clarke County MSA .......................................................................... $804.48............................ $762.08....................... $756.14 Atlanta MSA ...............................................................................................$1,086.89..........................$1,070.65.................... $1,004.78 Augusta-Richmond County MSA ...................................................................$934.71............................ $909.92.......................$852.23 Brunswick MSA ............................................................................................. $687.76............................. $702.12.......................$616.82 Columbus MSA .............................................................................................. $787.92.............................$777.22....................... $811.57 Dalton MSA .................................................................................................. $699.66.............................$691.21....................... $697.66 Gainesville MSA .......................................................................................... $1,188.25..........................$1,093.66.....................$1,037.16 Hinesville MSA .............................................................................................. $595.54.............................$621.30....................... $742.58 Macon-Bibb County MSA ..............................................................................$897.43............................ $859.54.......................$865.73 Rome MSA ..................................................................................................... $791.70............................ $760.38.......................$733.89 Savannah MSA ..............................................................................................$753.08............................ $754.40....................... $765.74 Valdosta MSA .................................................................................................$795.31............................ $822.50....................... $757.92 Warner Robins MSA .......................................................................................$881.75............................ $862.34...................... $806.90
Average Weekly Hours (AWH)
Preliminary NOV 2020
Revised OCT 2020
Revised NOV 2019
Albany MSA ..........................................................................................................34.3...................................34.1.............................35.4 Athens-Clarke County MSA .................................................................................32.0...................................31.4.............................30.8 Atlanta MSA ........................................................................................................35.3...................................35.0.............................34.6 Augusta-Richmond County MSA .........................................................................35.1.................................. 35.2............................. 35.1 Brunswick MSA ...................................................................................................34.2.................................. 34.3............................. 31.2 Columbus MSA ....................................................................................................33.5.................................. 33.3.............................34.2 Dalton MSA .........................................................................................................34.5...................................34.1.............................33.9 Gainesville MSA ................................................................................................... 39.1...................................38.7.............................38.7 Hinesville MSA .....................................................................................................30.2...................................30.0.............................32.3 Macon-Bibb County MSA ....................................................................................36.6...................................36.1............................. 37.3 Rome MSA ...........................................................................................................35.0.................................. 34.8.............................35.3 Savannah MSA ....................................................................................................32.9...................................32.8.............................33.6 Valdosta MSA .......................................................................................................33.6.................................. 34.4.............................35.6 Warner Robins MSA .............................................................................................35.8.................................. 34.8.............................38.7
Average Hourly Earnings (AHE)
Preliminary NOV 2020
Revised OCT 2020
Revised NOV 2019
Albany MSA ......................................................................................................$20.65...............................$20.93.........................$21.55 Athens-Clarke County MSA ............................................................................. $25.14...............................$24.27.........................$24.55 Atlanta MSA ....................................................................................................$30.79.............................. $30.59.........................$29.04 Augusta-Richmond County MSA .....................................................................$26.63.............................. $25.85.........................$24.28 Brunswick MSA ............................................................................................... $20.11...............................$20.47......................... $19.77 Columbus MSA ................................................................................................$23.52.............................. $23.34.........................$23.73 Dalton MSA .....................................................................................................$20.28.............................. $20.27.........................$20.58 Gainesville MSA .............................................................................................. $30.39.............................. $28.26.........................$26.80 Hinesville MSA ................................................................................................. $19.72...............................$20.71.........................$22.99 Macon-Bibb County MSA ................................................................................$24.52...............................$23.81.........................$23.21 Rome MSA .......................................................................................................$22.62...............................$21.85.........................$20.79 Savannah MSA ............................................................................................... $22.89.............................. $23.00.........................$22.79 Valdosta MSA ...................................................................................................$23.67...............................$23.91.........................$21.29 Warner Robins MSA .........................................................................................$24.63...............................$24.78.........................$20.85
Read more about the hours and earnings series at http://www.bls.gov/sae/home.htm
Note: These not seasonally adjusted estimates were prepared in cooperation with the U.S. Department of Labor, Bureau of Labor Statistics, based upon monthly reports submitted by
selected employers throughout Georgia. The estimates include all full- and part-time wage and salary workers who were employed during or received pay for any part of the pay period that includes the twelfth of the month. Proprietors, domestic workers, self-employed persons, unpaid family workers and personnel of the armed forces are excluded. Estimates based on 2019 benchmark.
Source: Georgia Department of Labor, Workforce Statistics & Economic Research
13
Dimensions - Measuring Georgia's Labor Force
Unemployment rates -- Georgia and U.S.
16%
14%
12%
10%
8%
6%
4%
2% Nov Dec Jan Feb Mar Apr May Jun Jul Aug Sep Oct Nov
Georgia
U.S.
WA 6.0 OR 6.0 NV 10.1 CA 8.2
AK 8.1
ID 4.8
UT 4.3 AZ 7.8
StaStteatuenUenmepmlopylomymenetnrt aRtaetses
November 2020
National Unemployment Rate: 6.7% Rates are seasonally adjusted
MT 4.9
WY 5.1
CO 6.4 NM 7.5
ND 4.5 SD 3.5
NE 3.1
KS 5.6
MN 4.4
WI 5.0
IA 3.6
IL 6.9 MO 4.4
OK 5.9 TX 8.1
AR 6.2
MS 6.4 LA 8.3
MI 6.9
OH
IN
5.7
5.0
KY 5.6 TN 5.3
PA 6.6
WV
6.2
VA
4.9
NC 6.2
SC 4.4
AL
GA
4.4
5.7
FL 6.4
NH
3.8 ME
VT
5.0
3.1
MA 6.7
NY 8.4
RI 7.3
CT
NJ 10.2
8.2
DE
5.1
DC 7.5
MD 6.8
Unemployment rate
10.0% or greater 8.0% to 9.9% 6.0% to 7.9% 4.0% to 5.9% Less than 4.0%
HI 10.1
PR 8.5
Source: Georgia Department of Labor, Workforce Statistics & Economic Research
14
Georgia Labor Force Estimates
Place of Residence - Persons 16 Years and Older
Georgia
(Seasonally adjusted)
Georgia
(Not Seasonally adjusted)
Albany MSA Athens-Clarke County MSA
Atlanta MSA
Augusta-Richmond County MSA
Brunswick MSA
Columbus MSA
Dalton MSA
Gainesville MSA
Employment Status
Civilian labor force Employed Unemployed Rate
Civilian labor force Employed Unemployed Rate
Civilian labor force Employed Unemployed Rate
Civilian labor force Employed Unemployed Rate
Civilian labor force Employed Unemployed Rate
Civilian labor force Employed Unemployed Rate
Civilian labor force Employed Unemployed Rate
Civilian labor force Employed Unemployed Rate
Civilian labor force Employed Unemployed Rate
Civilian labor force Employed Unemployed Rate
Preliminary NOV 2020
5,168,832 4,872,633
296,199 5.7
5,162,384 4,885,700
276,684 5.4
66,394 61,947
4,447 6.7
98,955 94,626
4,329 4.4
3,130,221 2,954,172
176,049 5.6
258,751 246,436
12,315 4.8
48,053 45,453
2,600 5.4
120,090 113,342
6,748 5.6
57,582 54,575
3,007 5.2
102,033 98,450 3,583 3.5
Revised OCT 2020
5,087,554 4,859,874
227,680 4.5
5,087,994 4,863,237
224,757 4.4
65,279 61,638
3,641 5.6
97,837 94,257
3,580 3.7
3,086,646 2,943,261
143,385 4.6
260,743 250,412
10,331 4.0
47,455 45,388
2,067 4.4
119,506 113,536
5,970 5.0
56,827 54,443
2,384 4.2
100,965 98,064 2,901 2.9
Revised NOV 2019
5,138,942 4,977,732
161,210 3.1
5,135,208 4,993,690
141,518 2.8
66,811 64,450
2,361 3.5
99,617 97,094 2,523
2.5
3,113,823 3,032,760
81,063 2.6
266,860 259,129
7,731 2.9
52,488 51,053
1,435 2.7
123,143 119,180
3,963 3.2
58,378 56,164
2,214 3.8
102,867 100,620
2,247 2.2
Change From
OCT 2020
NOV 2019
81,278 12,759 68,519
29,890 -105,099 134,989
74,390 22,463 51,927
27,176 -107,990 135,166
1,115 309 806
-417 -2,503 2,086
1,118 369 749
-662 -2,468 1,806
43,575 10,911 32,664
16,398 -78,588 94,986
-1,992 -3,976 1,984
-8,109 -12,693
4,584
598
-4,435
65
-5,600
533
1,165
584
-3,053
-194
-5,838
778
2,785
755
-796
132
-1,589
623
793
1,068 386 682
-834 -2,170 1,336
Note: MSA data are not seasonally adjusted. Employment includes nonagricultural wage and salary employment, self-employment, unpaid family and private
household workers and agricultural workers. Persons in labor disputes are counted as employed. The use of unrounded data does not imply that the numbers are exact.
Albany MSA: Baker, Dougherty, Lee, Terrell, and Worth counties. Athens-Clarke County MSA: Clarke, Madison, Oconee, and Oglethorpe counties. Atlanta MSA: Barrow, Bartow, Butts, Carroll, Cherokee, Clayton, Cobb, Coweta, Dawson, DeKalb, Douglas, Fayette, Forsyth, Fulton, Gwinnett, Haralson, Heard, Henry, Jasper, Lamar, Meriwether, Morgan, Newton, Paulding, Pickens, Pike, Rockdale, Spalding, and Walton counties. Augusta-Richmond County MSA: Burke, Columbia, Lincoln, McDuffie, and Richmond counties in Georgia and Aiken and Edgefield counties in South Carolina. Brunswick MSA: Brantley, Glynn, and McIntosh counties. Columbus MSA: Chattahoochee, Harris, Marion, and Muscogee counties in Georgia and Russell County in Alabama. Dalton MSA: Murray and Whitfield counties. Gainesville MSA: Hall County. Hinesville MSA: Liberty and Long counties. Macon-Bibb County MSA: Bibb, Crawford, Jones, Monroe, and Twiggs counties. Rome MSA: Floyd County. Savannah MSA: Bryan, Chatham, and Effingham counties. Valdosta MSA: Brooks, Echols, Lanier, and Lowndes counties. Warner Robins MSA: Houston, Peach and Pulaski counties.
Source: Georgia Department of Labor, Workforce Statistics & Economic Research
15
Hinesville MSA
Macon-Bibb County MSA Rome MSA Savannah MSA
Valdosta MSA Warner Robins MSA
Georgia Labor Force Estimates
Place of Residence - Persons 16 Years and Older
Employment Status
Civilian labor force Employed Unemployed Rate
Civilian labor force Employed Unemployed Rate
Preliminary NOV 2020
35,376 33,665
1,711 4.8
103,987 97,895 6,092 5.9
Revised OCT 2020
34,592 33,237
1,355 3.9
102,061 97,063 4,998 4.9
Revised NOV 2019
34,422 33,371
1,051 3.1
102,965 99,878 3,087 3.0
Civilian labor force Employed Unemployed Rate
Civilian labor force Employed Unemployed Rate
45,135 43,142 1,993
4.4
190,474 179,743
10,731 5.6
44,641 43,030
1,611 3.6
186,997 178,243
8,754 4.7
44,454 43,050
1,404 3.2
188,458 183,549
4,909 2.6
Civilian labor force Employed Unemployed Rate
Civilian labor force Employed Unemployed Rate
67,584 64,303
3,281 4.9
84,682 80,786
3,896 4.6
65,836 63,203
2,633 4.0
83,240 79,936
3,304 4.0
64,215 62,316
1,899 3.0
86,159 83,802
2,357 2.7
Change From
OCT 2020
NOV 2019
784
954
428
294
356
660
1,926 832
1,094
1,022 -1,983 3,005
494
681
112
92
382
589
3,477 1,500 1,977
2,016 -3,806 5,822
1,748 1,100
648
3,369 1,987 1,382
1,442 850 592
-1,477 -3,016 1,539
Area United States
(Seasonally adjusted)
United States
(Not Seasonally adjusted)
United States Labor Force Estimates
Place of Residence - Persons 16 Years and Older
Employment Status
Civilian labor force Employed Unemployed Rate
Civilian labor force Employed Unemployed Rate
NOV 2020
160,467,000 149,732,000
10,735,000 6.7
160,468,000 150,203,000
10,264,000 6.4
OCT 2020
160,867,000 149,806,000
11,061,000 6.9
161,053,000 150,433,000
10,620,000 6.6
NOV 2019
164,347,000 158,536,000
5,811,000 3.5
164,386,000 158,945,000
5,441,000 3.3
Change From
OCT 2020
NOV 2019
-400,000 -74,000
-326,000
-3,880,000 -8,804,000 4,924,000
-585,000 -230,000 -356,000
-3,918,000 -8,742,000 4,823,000
Note: MSA data are not seasonally adjusted. Employment includes nonagricultural wage and salary employment, self-employment, unpaid family and private
household workers and agricultural workers. Persons in labor disputes are counted as employed. The use of unrounded data does not imply that the numbers are exact.
Albany MSA: Baker, Dougherty, Lee, Terrell, and Worth counties. Athens-Clarke County MSA: Clarke, Madison, Oconee, and Oglethorpe counties. Atlanta MSA: Barrow, Bartow, Butts, Carroll, Cherokee, Clayton, Cobb, Coweta, Dawson, DeKalb, Douglas, Fayette, Forsyth, Fulton, Gwinnett, Haralson, Heard, Henry, Jasper, Lamar, Meriwether, Morgan, Newton, Paulding, Pickens, Pike, Rockdale, Spalding, and Walton counties. Augusta-Richmond County MSA: Burke, Columbia, Lincoln, McDuffie, and Richmond counties in Georgia and Aiken and Edgefield counties in South Carolina. Brunswick MSA: Brantley, Glynn, and McIntosh counties. Columbus MSA: Chattahoochee, Harris, Marion, and Muscogee counties in Georgia and Russell County in Alabama. Dalton MSA: Murray and Whitfield counties. Gainesville MSA: Hall County. Hinesville MSA: Liberty and Long counties. Macon-Bibb County MSA: Bibb, Crawford, Jones, Monroe, and Twiggs counties. Rome MSA: Floyd County. Savannah MSA: Bryan, Chatham, and Effingham counties. Valdosta MSA: Brooks, Echols, Lanier, and Lowndes counties. Warner Robins MSA: Houston, Peach and Pulaski counties.
Source: Georgia Department of Labor, Workforce Statistics & Economic Research
16
Georgia Labor Force Estimates by County (not seasonally adjusted)
Place of Residence - Persons 16 Years and Older
Georgia
Preliminary November 2020
Labor Force
Employment
Unemployment Number Rate
5,162,384 4,885,700 276,684 5.4
Appling Atkinson Bacon Baker Baldwin
9,684 9,328
356 3.7
4,392 4,253
139 3.2
4,875 4,681
194 4.0
1,176 1,113
63 5.4
18,538 17,450 1,088 5.9
Banks Barrow Bartow Ben Hill Berrien
10,190 9,884 306 3.0
40,365 38,798 1,567 3.9
50,706 48,351 2,355 4.6
5,472 5,107
365 6.7
7,683 7,359
324 4.2
Bibb Bleckley Brantley Brooks Bryan
68,991 64,330 4,661 6.8
4,567 4,303
264 5.8
6,617 6,311 306 4.6
7,329 6,993
336 4.6
18,223 17,451
772 4.2
Bulloch Burke Butts Calhoun Camden
38,481 36,442 2,039 5.3
8,999 8,400
599 6.7
10,853 10,266
587 5.4
2,432 2,327
105 4.3
20,675 19,858
817 4.0
Candler Carroll Catoosa Charlton Chatham
5,797 5,566
231 4.0
55,485 52,735 2,750 5.0
33,637 32,667
970 2.9
4,821 4,660
161 3.3
141,503 132,782 8,721 6.2
Chattahoochee 1,948
Chattooga
9,869
Cherokee 135,294
Clarke
59,436
Clay
971
1,834 9,349 130,520 56,392
863
114 5.9 520 5.3 4,774 3.5 3,044 5.1 108 11.1
Clayton Clinch Cobb Coffee Colquitt
144,130 130,443 13,687 9.5
2,552 2,446
106 4.2
427,356 407,587 19,769 4.6
19,496 18,545
951 4.9
21,982 21,107
875 4.0
Columbia Cook Coweta Crawford Crisp
72,398 70,002 2,396 3.3
8,398 8,046
352 4.2
75,099 71,575 3,524 4.7
5,571 5,350
221 4.0
9,996 9,240
756 7.6
Revised October 2020
Labor Force
Employment
Unemployment Number Rate
5,087,994 4,863,237 224,757 4.4
9,454 4,328 4,758 1,124 18,291
9,171 4,214 4,601 1,077 17,399
283 3.0 114 2.6 157 3.3 47 4.2 892 4.9
9,940 9,684
256 2.6
39,906 38,619 1,287 3.2
49,991 48,110 1,881 3.8
5,380 5,094
286 5.3
7,499 7,245 254 3.4
67,636 63,818 3,818 5.6
4,464
4,241
223 5.0
6,539 6,299
240 3.7
7,085 6,826
259 3.7
17,912 17,309 603 3.4
37,762 36,124 1,638 4.3
8,841 8,373 468 5.3
10,667 10,210
457 4.3
2,302 2,224
78 3.4
20,366 19,718 648 3.2
5,719 5,527
192 3.4
54,776 52,525 2,251 4.1
33,417 32,643
774 2.3
4,739 4,620
119 2.5
138,861 131,698 7,163 5.2
1,916 1,831
85 4.4
9,760 9,325 435 4.5
134,035 130,131 3,904 2.9
58,706 56,168 2,538 4.3
934
857
77 8.2
140,862 129,838 11,024 7.8
2,484 2,402
82 3.3
422,497 406,281 16,216 3.8
19,124 18,359
765 4.0
21,530 20,806
724 3.4
72,190 70,268 1,922 2.7
8,234
7,959
275 3.3
74,130 71,263 2,867 3.9
5,487 5,288
199 3.6
9,723 9,127 596 6.1
Revised November 2019
Labor Force
Employment
Unemployment Number Rate
5,135,208 4,993,690 141,518 2.8
9,446 4,659 4,904 1,175 17,498
9,179 4,561 4,744 1,125 16,829
267 2.8 98 2.1
160 3.3 50 4.3
669 3.8
9,810 9,585
225 2.3
40,722 39,817
905 2.2
50,944 49,598 1,346 2.6
5,309 5,048
261 4.9
7,578 7,249
329 4.3
67,773 65,678 2,095 3.1
4,488 4,306
182 4.1
7,221 6,986
235 3.3
6,973 6,766
207 3.0
18,254 17,814
440 2.4
36,610 35,546 1,064 2.9
9,120 8,750
370 4.1
10,805 10,530
275 2.5
2,298 2,233
65 2.8
20,785 20,193
592 2.8
5,596 55,619 33,711 4,803 139,356
5,475 54,095 32,928
4,662 135,608
121 2.2 1,524 2.7
783 2.3 141 2.9 3,748 2.7
1,986 1,920
66 3.3
10,126 9,789
337 3.3
136,973 134,008 2,965 2.2
59,528 57,894 1,634 2.7
885
829
56 6.3
138,659 133,901 4,758 3.4
2,516 2,432
84 3.3
428,712 418,510 10,202 2.4
18,866 18,293
573 3.0
21,313 20,784
529 2.5
75,101 8,062 75,185 5,603 9,394
73,290 7,815
73,460 5,443 9,098
1,811 2.4 247 3.1
1,725 2.3 160 2.9 296 3.2
Source: Georgia Department of Labor, Workforce Statistics & Economic Research
17
Georgia Labor Force Estimates by County (not seasonally adjusted)
Place of Residence - Persons 16 Years and Older
Dade Dawson Decatur DeKalb Dodge
Preliminary November 2020
Labor Force
Employment
Unemployment Number Rate
8,210 7,967
243 3.0
12,283 11,842
441 3.6
11,626 11,109
517 4.4
408,701 380,991 27,710 6.8
6,859 6,502
357 5.2
Dooly Dougherty Douglas Early Echols
5,220 4,904
316 6.1
38,522 35,401 3,121 8.1
74,452 69,781 4,671 6.3
4,560 4,289
271 5.9
2,024 1,960
64 3.2
Effingham Elbert Emanuel Evans Fannin
30,748 29,510 1,238 4.0
7,964 7,466 498 6.3
8,369 7,785 584 7.0
5,051 4,809
242 4.8
12,641 12,261 380 3.0
Fayette Floyd Forsyth Franklin Fulton
57,955 55,585 2,370 4.1
45,135 43,142 1,993 4.4
121,364 117,358 4,006 3.3
10,210 9,758
452 4.4
570,029 531,212 38,817 6.8
Gilmer Glascock Glynn Gordon Grady
11,536 11,106 430 3.7
1,241 1,202
39 3.1
35,782 33,779 2,003 5.6
29,430 28,266 1,164 4.0
10,448 10,032
416 4.0
Greene
7,212 6,844 368 5.1
Gwinnett 493,826 469,109 24,717 5.0
Habersham 18,976 18,201
775 4.1
Hall
102,033 98,450 3,583 3.5
Hancock
2,657 2,435 222 8.4
Haralson Harris Hart Heard Henry
12,562 11,996 566 4.5
16,018 15,477
541 3.4
11,207 10,702 505 4.5
5,286 5,022 264 5.0
117,339 110,103 7,236 6.2
Houston Irwin Jackson Jasper Jeff Davis
68,998 65,918 3,080 4.5
3,521 3,358
163 4.6
39,388 38,114 1,274 3.2
6,942 6,663
279 4.0
5,917 5,641
276 4.7
Revised October 2020
Labor Force
Employment
Unemployment Number Rate
8,186
7,997
189 2.3
12,164 11,810 354 2.9
11,363 10,944
419 3.7
402,228 379,647 22,581 5.6
6,805
6,518
287 4.2
5,108 4,830
278 5.4
37,848 35,274 2,574 6.8
73,315 69,541 3,774 5.1
4,473 4,262
211 4.7
1,944 1,892
52 2.7
30,224 7,816 8,185 4,957
12,477
29,236 7,415 7,710 4,769
12,182
988 3.3 401 5.1 475 5.8 188 3.8 295 2.4
57,303 55,357 1,946 3.4 44,641 43,030 1,611 3.6 120,178 116,900 3,278 2.7
9,982 9,616 366 3.7 560,845 529,209 31,636 5.6
11,461 11,143
318 2.8
1,228 1,197
31 2.5
35,371 33,770 1,601 4.5
29,066 28,147
919 3.2
10,226 9,906
320 3.1
7,087 6,802
285 4.0
488,077 467,756 20,321 4.2
18,736 18,110
626 3.3
100,965 98,064 2,901 2.9
2,573 2,397
176 6.8
12,428 11,965 463 3.7
15,975 15,532 443 2.8
10,998 10,595
403 3.7
5,201 4,997 204 3.9
115,376 109,531 5,845 5.1
67,825 65,258 2,567 3.8
3,445 3,317
128 3.7
38,268 37,218 1,050 2.7
6,854 6,628
226 3.3
5,815 5,608
207 3.6
Revised November 2019
Labor Force
Employment
Unemployment Number Rate
8,247 8,036
211 2.6
12,407 12,141
266 2.1
11,545 11,185 360 3.1
402,308 391,250 11,058 2.7
7,008 6,690
318 4.5
5,095 4,940
155 3.0
38,413 36,889 1,524 4.0
73,794 71,656 2,138 2.9
4,452 4,299
153 3.4
1,931 1,887
44 2.3
30,848 7,649 8,249 4,896
11,480
30,127 7,388 7,901 4,764 11,172
721 2.3 261 3.4 348 4.2 132 2.7 308 2.7
58,444 57,070 1,374 2.4
44,454 43,050 1,404 3.2
123,107 120,452 2,655 2.2
9,845 9,558
287 2.9
561,031 545,359 15,672 2.8
11,882 11,549
333 2.8
1,276 1,237
39 3.1
39,134 38,099 1,035 2.6
27,929 27,149
780 2.8
10,388 10,091
297 2.9
6,893 6,678
215 3.1
493,509 481,670 11,839 2.4
19,110 18,476
634 3.3
102,867 100,620 2,247 2.2
2,474 2,339
135 5.5
12,664 12,314
350 2.8
16,638 16,240
398 2.4
10,955 10,628
327 3.0
5,293 5,147
146 2.8
116,305 113,041 3,264 2.8
70,316 68,448 1,868 2.7
3,344 3,222
122 3.6
37,669 36,909
760 2.0
6,997 6,824
173 2.5
5,941 5,719
222 3.7
Source: Georgia Department of Labor, Workforce Statistics & Economic Research
18
Georgia Labor Force Estimates by County (not seasonally adjusted)
Place of Residence - Persons 16 Years and Older
Jefferson Jenkins Johnson Jones Lamar
Preliminary November 2020
Labor Force
6,719 3,153 4,064 13,607 8,248
Employment
6,320 2,984 3,884 13,103 7,817
Unemployment Number Rate
399 5.9 169 5.4 180 4.4 504 3.7 431 5.2
Revised October 2020
Labor Force
6,582 3,134 3,963 13,389 8,149
Employment
6,263 2,989 3,830 12,981 7,801
Unemployment Number Rate
319 4.8 145 4.6 133 3.4 408 3.0 348 4.3
Revised November 2019
Labor Force
6,603 3,106 3,978 13,722 8,280
Employment
6,346 2,993 3,861 13,355 8,025
Unemployment Number Rate
257 3.9 113 3.6 117 2.9 367 2.7 255 3.1
Lanier Laurens Lee Liberty Lincoln
3,934 3,759
175 4.4
19,252 18,192 1,060 5.5
14,372 13,843
529 3.7
27,049 25,638 1,411 5.2
3,473 3,318
155 4.5
3,831 3,701
130 3.4
18,855 17,998
857 4.5
14,239 13,791
448 3.1
26,455 25,333 1,122 4.2
3,427 3,301
126 3.7
3,773 18,874 14,804 26,246 3,556
3,648 18,118 14,418 25,429 3,444
125 3.3 756 4.0 386 2.6 817 3.1 112 3.1
Long Lowndes Lumpkin McDuffie McIntosh
8,327 8,027 300 3.6
54,297 51,591 2,706 5.0
16,593 16,068
525 3.2
8,624 8,077
547 6.3
5,654 5,363
291 5.1
8,137 7,904
233 2.9
52,976 50,784 2,192 4.1
16,548 16,106
442 2.7
8,538 8,092
446 5.2
5,545 5,319 226 4.1
8,176 7,942 234 2.9
51,538 50,015 1,523 3.0
16,881 16,481 400 2.4
8,844 8,453
391 4.4
6,133 5,968
165 2.7
Macon Madison Marion Meriwether Miller
4,713 13,266
3,174 9,063 2,764
4,417 12,745 3,041 8,431 2,665
296 6.3 521 3.9 133 4.2 632 7.0
99 3.6
4,613 13,135
3,159 8,898 2,682
4,338 12,711 3,051 8,388 2,609
275 6.0 424 3.2 108 3.4 510 5.7
73 2.7
4,678 13,406
3,294 8,961 2,763
4,510 13,077
3,186 8,634 2,685
168 3.6 329 2.5 108 3.3 327 3.6
78 2.8
Mitchell Monroe Montgomery Morgan Murray
8,568 12,962
3,850 9,292 15,115
8,048 12,423
3,672 8,889 14,280
520 6.1 539 4.2 178 4.6 403 4.3 835 5.5
8,322 12,758 3,794
9,150 14,882
7,905 12,320
3,650 8,837 14,229
417 5.0 438 3.4 144 3.8 313 3.4 653 4.4
8,587 13,000
3,764 9,314 15,363
8,218 12,661
3,615 9,084 14,678
369 4.3 339 2.6 149 4.0 230 2.5 685 4.5
Muscogee Newton Oconee Oglethorpe Paulding
75,847 70,724 5,123 6.8 52,844 49,625 3,219 6.1 19,327 18,819 508 2.6
6,926 6,670 256 3.7 86,036 82,438 3,598 4.2
75,349 71,107 4,242 5.6
51,969 49,393 2,576 5.0
19,180 18,767
413 2.2
6,816
6,611
205 3.0
84,992 82,055 2,937 3.5
77,219 74,413 2,806 3.6
52,531 50,917 1,614 3.1
19,691 19,308 383 1.9
6,992 6,815
177 2.5
86,643 84,611 2,032 2.3
Peach Pickens Pierce Pike Polk
11,722 15,181 8,621 8,862 18,564
11,062 14,641 8,298 8,539 17,688
660 5.6 540 3.6 323 3.7 323 3.6 876 4.7
11,523 15,017 8,480 8,773 18,355
10,923 14,584
8,215 8,505 17,676
600 5.2 433 2.9 265 3.1 268 3.1 679 3.7
11,803 15,394
8,679 8,971 18,499
11,428 15,031 8,446
8,755 17,954
375 3.2 363 2.4 233 2.7 216 2.4 545 2.9
Pulaski Putnam Quitman Rabun Randolph
3,962 8,317
847 7,116 2,658
3,806 7,876
802 6,853 2,516
156 3.9 441 5.3
45 5.3 263 3.7 142 5.3
3,892 8,146
825 7,097 2,612
3,755 7,807
793 6,886 2,507
137 3.5 339 4.2
32 3.9 211 3.0 105 4.0
4,040 8,191
795 7,121 2,536
3,926 7,920
759 6,901 2,432
114 2.8 271 3.3 36 4.5 220 3.1 104 4.1
Source: Georgia Department of Labor, Workforce Statistics & Economic Research
19
Georgia Labor Force Estimates by County (not seasonally adjusted)
Place of Residence - Persons 16 Years and Older
Richmond Rockdale Schley Screven Seminole
Preliminary November 2020
Labor Force
Employment
Unemployment Number Rate
83,763 77,992 5,771 6.9
45,523 42,544 2,979 6.5
2,302 2,225
77 3.3
5,238 4,881
357 6.8
3,079 2,933
146 4.7
Spalding Stephens Stewart Sumter Talbot
29,137 27,219 1,918 6.6
10,842 10,295
547 5.0
2,659 2,530
129 4.9
13,631 12,725 906 6.6
2,796 2,627
169 6.0
Taliaferro Tattnall Taylor Telfair Terrell
578 9,572 2,883 3,667 3,526
547 9,215 2,710 3,349 3,242
31 5.4 357 3.7 173 6.0 318 8.7 284 8.1
Thomas Tift Toombs Towns Treutlen
16,930 21,037 11,906 3,604 2,599
15,972 20,117 11,270 3,417 2,461
958 5.7 920 4.4 636 5.3 187 5.2 138 5.3
Troup Turner Twiggs Union Upson
38,784 36,608 2,176 5.6
3,292 3,033
259 7.9
2,856 2,689
167 5.8
10,418 10,081
337 3.2
11,409 10,805 604 5.3
Walker
31,489 30,409 1,080 3.4
Walton
46,008 44,092 1,916 4.2
Ware
15,506 14,782
724 4.7
Warren
2,825 2,683
142 5.0
Washington
6,810 6,372
438 6.4
Wayne Webster Wheeler White Whitfield
11,149 10,586
563 5.0
1,058 1,008
50 4.7
1,614 1,521
93 5.8
16,716 16,243
473 2.8
42,467 40,295 2,172 5.1
Wilcox Wilkes Wilkinson Worth
2,765 3,952 4,011 8,798
2,618 3,724 3,820 8,348
147 5.3 228 5.8 191 4.8 450 5.1
Revised October 2020
Labor Force
Employment
Unemployment Number Rate
82,825 78,195 4,630 5.6
44,755 42,391 2,364 5.3
2,287 2,220
67 2.9
5,152 4,861
291 5.6
2,999 2,893
106 3.5
28,648 27,100 1,548 5.4
10,659 10,228
431 4.0
2,612 2,504
108 4.1
13,393 12,663
730 5.5
2,761 2,630
131 4.7
567 9,365 2,876 3,559 3,440
543 9,089 2,723 3,306 3,223
24 4.2 276 2.9 153 5.3 253 7.1 217 6.3
16,763 20,396 11,725
3,687 2,563
15,996 19,656 11,219
3,536 2,457
767 4.6 740 3.6 506 4.3 151 4.1 106 4.1
38,078 3,178 2,791
10,266 11,266
36,361 2,988 2,656 9,999 10,757
1,717 4.5 190 6.0 135 4.8 267 2.6 509 4.5
31,214 30,353
861 2.8
45,462 43,889 1,573 3.5
15,211 14,635
576 3.8
2,800 2,683
117 4.2
6,665
6,318
347 5.2
10,965 10,532
433 3.9
1,038
996
42 4.0
1,571 1,500
71 4.5
16,717 16,334
383 2.3
41,945 40,214 1,731 4.1
2,727 3,858 4,019 8,628
2,605 3,679 3,868 8,273
122 4.5 179 4.6 151 3.8 355 4.1
Revised November 2019
Labor Force
Employment
Unemployment Number Rate
84,814 81,721 3,093 3.6
45,036 43,682 1,354 3.0
2,228 2,159
69 3.1
5,034 4,831
203 4.0
3,008 2,906
102 3.4
28,840 10,620
2,422 12,840
2,797
27,929 10,279 2,344 12,333
2,700
911 3.2 341 3.2
78 3.2 507 3.9
97 3.5
566 9,535 3,160 3,854 3,492
535 9,250 3,055 3,498 3,369
31 5.5 285 3.0 105 3.3 356 9.2 123 3.5
16,345 19,937 11,525 3,885 2,546
15,774 19,390 11,101
3,729 2,444
571 3.5 547 2.7 424 3.7 156 4.0 102 4.0
37,302 3,135 2,867
10,276 11,357
36,307 3,033 2,741
10,028 11,010
995 2.7 102 3.3 126 4.4 248 2.4 347 3.1
31,449 46,375 15,525
2,849 7,030
30,629 45,249 15,060
2,741 6,786
820 2.6 1,126 2.4
465 3.0 108 3.8 244 3.5
11,241 10,884
357 3.2
1,022
988
34 3.3
1,590 1,485
105 6.6
16,456 16,115
341 2.1
43,015 41,486 1,529 3.6
2,673 3,789 3,950 8,927
2,581 3,625 3,818 8,649
92 3.4 164 4.3 132 3.3 278 3.1
Source: Georgia Department of Labor, Workforce Statistics & Economic Research
20
City Labor Force Estimates
Place of Residence - Persons 16 Years and Older
Preliminary November 2020
Labor Force
Employment
Unemployment Number Rate
*Albany 31,476
*Alpharetta
36,562
*Athens 59,436
*Atlanta 268,965
Dekalb Part
24,163
Fulton Part
244,802
*Augusta 83,763
*Brookhaven
34,228
*Canton 15,455
Carrollton 11,478
*Chamblee
20,358
*Columbus
75,847
Dalton 13,378
Decatur 14,390
Douglasville
17,736
Duluth 16,172
*Dunwoody
27,461
East Point
17,859
Gainesville 19,830
Hinesville 15,802
*Johns Creek
44,915
Kennesaw
20,085
LaGrange 16,008
Lawrenceville
14,638
McDonough
12,490
*Macon-Bibb
68,991
*Marietta 35,927
Milton 20,053
Newnan 18,810
Peachtree City
18,375
P'tree Corners
25,104
Rome 15,917
*Roswell 53,640
*Sandy Springs 65,829
*Savannah
68,975
*Smyrna 35,384
Statesboro
14,570
Stockbridge
14,880
Tucker 20,013
*Valdosta 26,801
*Warner Robins 32,849
Woodstock
17,272
28,825 35,272 56,392 249,202 23,120 226,082 77,992 33,195 14,928 10,807 19,718 70,724 12,669 13,891 16,476 15,432 26,470 15,712 18,977 14,982 43,231 19,259 14,864 13,746 11,218 64,330 34,109 19,391 17,614 17,863 23,967 15,038 51,766 63,171 63,780 33,772 13,530 13,725 19,026 25,161 31,125 16,696
2,651 8.4 1,290 3.5 3,044 5.1 19,763 7.3 1,043 4.3 18,720 7.6 5,771 6.9 1,033 3.0
527 3.4 671 5.8 640 3.1 5,123 6.8 709 5.3 499 3.5 1,260 7.1 740 4.6 991 3.6 2,147 12.0 853 4.3 820 5.2 1,684 3.7 826 4.1 1,144 7.1 892 6.1 1,272 10.2 4,661 6.8 1,818 5.1 662 3.3 1,196 6.4 512 2.8 1,137 4.5 879 5.5 1,874 3.5 2,658 4.0 5,195 7.5 1,612 4.6 1,040 7.1 1,155 7.8 987 4.9 1,640 6.1 1,724 5.2 576 3.3
Revised October 2020
Labor Force
Employment
Unemployment Number Rate
30,918 28,722 2,196 7.1
36,188 35,139 1,049 2.9
58,706 56,168 2,538 4.3
264,375 248,267 16,108 6.1
23,909 23,038
871 3.6
240,466 225,229 15,237 6.3
82,825 78,195 4,630 5.6
33,897 33,078
819 2.4
15,292 14,883
409 2.7
11,320 10,764
556 4.9
20,161 19,648
513 2.5
75,349 71,107 4,242 5.6
13,231 12,644
587 4.4
14,243 13,842
401 2.8
17,442 16,419 1,023 5.9
15,998 15,388
610 3.8
27,164 26,376
788 2.9
17,353 15,653 1,700 9.8
19,597 18,903 694 3.5
15,436 14,804
632 4.1
44,450 43,068 1,382 3.1
19,889 19,197 692 3.5
15,678 14,763
915 5.8
14,447 13,707
740 5.1
12,162 11,160 1,002 8.2
67,636 63,818 3,818 5.6
35,443 33,999 1,444 4.1
19,867 19,318 549 2.8
18,511 17,537
974 5.3
18,156 17,790 366 2.0
24,817 23,898
919 3.7
15,693 14,998 695 4.4
53,074 51,571 1,503 2.8
65,040 62,932 2,108 3.2
67,514 63,259 4,255 6.3
35,002 33,664 1,338 3.8
14,257 13,412 845 5.9
14,589 13,653 936 6.4
19,807 18,959 848 4.3
26,106 24,768 1,338 5.1
32,234 30,813 1,421 4.4
17,136 16,647 489 2.9
Revised November 2019
Labor Force
Employment
Unemployment Number Rate
31,295 37,001 59,528 263,441 24,239 239,202 84,814 34,709 15,641 11,466 20,605 77,219 13,552 13,592 17,465 16,217 27,727 16,788 19,862 15,329 45,398 20,258 15,229 14,529 11,576 67,773 35,875 20,383 18,563 18,735 25,188 15,537 54,272 66,271 67,123 35,480 13,745 14,570 20,039 25,220 33,266 17,499
30,037 36,212 57,894 255,845 23,742 232,103 81,721 34,089 15,327 11,085 20,249 74,413 13,044 13,287 16,918 15,845 27,182 16,131 19,395 14,860 44,383 19,775 14,741 14,114 11,121 65,678 35,023 19,908 18,078 18,340 24,609 15,005 53,145 64,853 65,137 34,677 13,197 14,091 19,538 24,393 32,318 17,143
1,258 4.0 789 2.1
1,634 2.7 7,596 2.9
497 2.1 7,099 3.0 3,093 3.6
620 1.8 314 2.0 381 3.3 356 1.7 2,806 3.6 508 3.7 305 2.2 547 3.1 372 2.3 545 2.0 657 3.9 467 2.4 469 3.1 1,015 2.2 483 2.4 488 3.2 415 2.9 455 3.9 2,095 3.1 852 2.4 475 2.3 485 2.6 395 2.1 579 2.3 532 3.4 1,127 2.1 1,418 2.1 1,986 3.0 803 2.3 548 4.0 479 3.3 501 2.5 827 3.3 948 2.8 356 2.0
Note: City estimates were prepared in cooperation with the U.S. Department of Labor, Bureau of Labor Statistics. All cities listed have total population of 25,000 or more and an asterisks (*) designates cities with population of 50,000 or more.
Source: Georgia Department of Labor, Workforce Statistics & Economic Research
21
UNEMGPeoLrOgiaYUMneEmNploTymReAntTREateBs bYy CCoOunUtyNTIES NOVEMBER 2020 November 2020
Dade 3.0
Catoosa 2.9
Walker
Whitfield
Murray 5.5
Fannin 3.0
Union 3.2
Towns 5.2
Rabun 3.7
3.4
5.1
Chattooga 5.3
Gordon 4.0
Floyd 4.4
Bartow 4.6
Gilmer 3.7
Pickens 3.6
Cherokee 3.5
Lumpkin 3.2
Dawson 3.6
Forsyth 3.3
White Habersham
2.8
4.1
Stephens
5.0
Banks Franklin
Hall
3.0
4.4
3.5
Jackson 3.2
Madison 3.9
Hart 4.5
Elbert 6.3
6.0% or greater 33 counties (21%)
5.0% to 5.9% 43 counties (27%)
4.0% to 4.9% 47 counties (30%)
Polk 4.7
Paulding
Cobb 4.6
Gwinnett 5.0
Barrow 3.9
Clarke 5.1
Oglethorpe 3.7
Less than 4.0% 36 counties (23%)
Haralson 4.5
Carroll 5.0
Heard 5.0
4.2 Douglas 6.3
Coweta 4.7
Fulton 6.8
DeKalb 6.8 Rockdale
Walton 4.2
Oconee 2.6
Wilkes 5.8
Lincoln 4.5
Percentages of number of counties may not total 100 due to rounding
Clayton
9.5
Fayette 4.1
Henry 6.2
Spalding 6.6
6.5 Newton 6.1
Morgan 4.3
Butts 5.4
Jasper 4.0
Putnam 5.3
Greene 5.1
Taliaferro
5.4
McDuffie
Warren 6.3
Columbia 3.3
5.0
Richmond
Hancock
6.9
8.4
Glascock
3.1
Troup 5.6
Meriwether 7.0
Pike 3.6
Lamar 5.2
Monroe 4.2
Jones 3.7
Baldwin 5.9
Washington
Jefferson 5.9
Burke 6.7
Upson
6.4
Harris 3.4
Talbot 6.0
Muscogee 6.8
Marion Chattahoochee 4.2
5.3
Taylor 6.0
Crawford 4.0
Bibb 6.8
Twiggs 5.8
Wilkinson 4.8
Peach
5.6
Houston
Macon
4.5
6.3
Bleckley 5.8
Laurens 5.5
Johnson 4.4
Emanuel 7.0
Jenkins 5.4
Screven 6.8
Treutlen 5.3
Candler 4.0
Bulloch 5.3
Effingham 4.0
5.9
Stewart 4.9
Schley 3.3
Webster 4.7
Sumter 6.6
Quitman
5.3 Randolph
Terrell
Lee
5.3
8.1
3.7
Clay
Dooly 6.1
Pulaski 3.9
Dodge 5.2
Crisp 7.6
Wilcox 5.3
Turner 7.9
Ben Hill 6.7
Montgomery
Wheeler 5.8
4.6
Toombs 5.3
Evans 4.8
Tattnall
Telfair
3.7
8.7
Jeff Davis 4.7
Appling 3.7
Long 3.6
Bryan 4.2
Liberty 5.2
Chatham 6.2
11.1
Calhoun
Dougherty
4.3
8.1
Early 5.9
Miller 3.6
Baker 5.4
Mitchell 6.1
Worth 5.1
Colquitt 4.0
Irwin 4.6
Tift 4.4
Coffee 4.9
Berrien
Atkinson
4.2
3.2
Cook
4.2 Lanier
Bacon 4.0
Wayne 5.0
Pierce 3.7
Ware 4.7
Brantley 4.6
McIntosh 5.1
Glynn 5.6
Seminole 4.7
Decatur 4.4
Grady 4.0
Thomas 5.7
Brooks 4.6
4.4
Lowndes 5.0
Clinch 4.2
Charlton 3.3
Camden 4.0
Echols
3.2
Georgia's Unemployment Rate: 5.4 %
Georgia's U(nNoet SmeasponlaollyyAmdjusetend)t Rate: 5.4% (not seasonally adjusted) Source: Georgia Department of Labor, Workforce Statistics and Economic Research
22
Georgia Unemployment Insurance Claims by County
County
November 2020 Initial
Claims
Average Weekly Benefit
County
November 2020 Initial
Claims
Average Weekly Benefit
County
November 2020 Initial
Claims
Average Weekly Benefit
Georgia
Appling Atkinson Bacon Baker Baldwin Banks Barrow Bartow Ben Hill Berrien Bibb Bleckley Brantley Brooks Bryan Bulloch Burke Butts Calhoun Camden Candler Carroll Catoosa Charlton Chatham Chattahoochee Chattooga Cherokee Clarke Clay Clayton Clinch Cobb Coffee Colquitt Columbia Cook Coweta Crawford Crisp Dade Dawson Decatur DeKalb Dodge Dooly Dougherty Douglas Early Echols Effingham
104,175............. $246
199............. $230 25............. $225 40............. $181 25............. $204
313............. $214 134............. $219 568............. $221 1,209............. $221
96............. $205 137............. $195 1,486............. $193
74............. $216 129............. $247
92............. $202 300............. $229 678............. $208 188............. $242 187............. $223
49............. $228 301............. $195
70............. $203 1,226............. $210
222............. $221 44............. $232
3,231............. $206 25............. $196 79............. $218
1,797............. $227 1,162............. $199
39............. $214 3,919............. $218
37............. $231 7,588............. $228
225............. $229 284............. $199 852............. $219 224............. $212 1,499............. $221
59............. $217 415............. $216
87............. $214 201............. $210 181............. $197 8,091............. $221 167............. $213
80............. $211 996............. $193 1,797............. $219
53............. $207 8............. $286
368............. $230
Elbert Emanuel Evans Fannin Fayette Floyd Forsyth Franklin Fulton Gilmer Glascock Glynn Gordon Grady Greene Gwinnett Habersham Hall Hancock Haralson Harris Hart Heard Henry Houston Irwin Jackson Jasper Jeff Davis Jefferson Jenkins Johnson Jones Lamar Lanier Laurens Lee Liberty Lincoln Long Lowndes Lumpkin Macon Madison Marion McDuffie McIntosh Meriwether Miller Mitchell Monroe Montgomery Morgan Murray
164............. $234 214............. $216
73............. $207 92............. $220 1,000............. $220 990............. $211 1,193............. $235 202............. $242 12,789............. $220 182............. $218
6............. $288 1,124............. $210
702............. $233 109............. $216 146............. $211 7,729............. $224 302............. $227 1,286............. $215
49............. $230 193............. $206 211............. $218 152............. $260 110............. $230 2,755............. $221 1,099............. $207
62............. $212 493............. $227 107............. $236
60............. $219 111............. $197 61............. $222 61............. $205 151............. $217 245............. $217 52............. $228 545............. $203 336............. $206 426............. $211 49............. $223 71............. $211 1,231............. $195 207............. $205 134............. $221 303............. $220 64............. $218 182............. $217 111............. $207 266............. $232 26............. $187 114............. $214 148............. $223 116............. $220 111............. $231 689............. $232
Muscogee Newton Oconee Oglethorpe Paulding Peach Pickens Pierce Pike Polk Pulaski Putnam Quitman Rabun Randolph Richmond Rockdale Schley Screven Seminole Spalding Stephens Stewart Sumter Talbot Taliaferro Tattnall Taylor Telfair Terrell Thomas Tift Toombs Towns Treutlen Troup Turner Twiggs Union Upson Walker Walton Ware Warren Washington Wayne Webster Wheeler White Whitfield Wilcox Wilkes Wilkinson Worth
2,051............. $208 929............. $218 172............. $221 68............. $216
1,171............. $220 273............. $204 192............. $231 148............. $194 174............. $240 372............. $219 49............. $205 149............. $222 7............. $205 60............. $210 76............. $221
1,896............. $209 1,012............. $219
19............. $213 163............. $229
62............. $228 691............. $226 232............. $231
29............. $268 280............. $201
39............. $226 11............. $217 89............. $220 51............. $254 87............. $207 52............. $195 360............. $209 430............. $187 192............. $214 70............. $198 55............. $211 833............. $217 53............. $212 57............. $223 191............. $195 470............. $240 415............. $224 771............. $223 299............. $195 58............. $195 137............. $209 252............. $239 14............. $230 20............. $215 174............. $213 1,937............. $233 34............. $220 50............. $230 50............. $222 101............. $239
Note: Initial claims include intrastate initial and additional claims, as well as agent state initial and additional claims for regular UI only. Average duration of benefits is represented in weeks.
Data does not include state or federal extended benefits.
Source: Georgia Department of Labor, Workforce Statistics and Economic Research
23
Mark Butler, Commissioner 148 Andrew Young International Boulevard, N.E. Atlanta, Georgia 30303-1751
Return Service Requested