- Collection:
- Georgia Government Publications
- Title:
- Dimensions: measuring Georgia's workforce, 2019 December
- Creator:
- Georgia. Department of Labor
- Contributor to Resource:
- Georgia. Department of Labor
- Publisher:
- Atlanta, Ga. : Georgia. Department of Labor
- Date of Original:
- 2019-12
- Subject:
- Labor market--Georgia--Statistics--Periodicals
Wages--Georgia--Statistics--Periodicals
Hours of labor--Georgia--Statistics--Periodicals - Location:
- United States, Georgia, 32.75042, -83.50018
- Medium:
- serials (publications)
- Type:
- Text
- Format:
- application/pdf
- External Identifiers:
- Call Number GA L200.E46 P1 T7 45/12
- Metadata URL:
- https://dlg.galileo.usg.edu/id:dlg_ggpd_i-ga-bl200-pe46-bp1-bt7-b45-s12-belec-p-btext
- Digital Object URL:
- https://dlg.galileo.usg.edu/do:dlg_ggpd_i-ga-bl200-pe46-bp1-bt7-b45-s12-belec-p-btext
- Language:
- eng
- Holding Institution:
- University of Georgia. Map and Government Information Library
- Rights:
-

Jackson Madison Elbert
D I M E N S I O Polk
Haralson
Paulding Cobb Douglas
Gwinnett Barrow Clarke
Oconee Oglethorpe
DeKalb
Walton
Rock-
Wilkes
Lincoln
EdgefieSlCd,
Carroll
Fulton Clayton
dale Newton
Morgan Greene Taliaferro
Columbia
Fayette Henry
McDuffie Warren
Heard
Coweta
Spalding Butts Jasper Putnam Hancock
Glascock
Richmond
AikenSC,
N
S
Russell, AL
Measuring Georgia's Workforce Troup Meriwether Pike Lamar Monroe Upson
Jones
Baldwin
Jefferson Washington
Burke
Bibb
Wilkinson
Harris
Talbot
Crawford
Twiggs
RMeuvsicsoegede estimatesTafyolorr 2018P--eac2h019 in this issue
Johnson
Jenkins Screven
EmanuelAnnual Issue - Volume XLV, Number 12
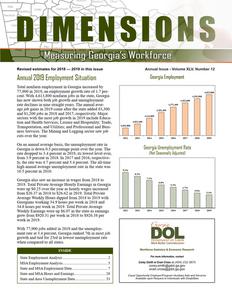
Annual 2019 Employment Situation Marion Chattahoo-
Houston Bleckley Macon
Laurens
Treutlen
CandlGereorgBuialloEcmh ploEyfmfinegnhatm
chee
Total nonfarm emScphlloeyyment in GDeooolrygiaPiunlacsrkeiaseDdobdyge 77,S9te0w0aritn 2W0e1b9s,tearn emSupmltoeryment growth rate of 1.7 per-
Montgomery
Wheeler
Toombs
cent. With 4,613,800 Quhitamsannow shown both
jnoobngfarormwtjhoCbarnsispdinutnheeWmsilptcaoloxtey,mGeenotrgTiealfair
rate Rdaencdloilnphes inTernreinll e strLaeieght years. TTurhneerannualBaevneHri-ll
Jeff Davis
Appling
Evans Tattnall
Long
Bryan
Liberty
4,371,400
Chatham
4,535,900
4,452,600
4,613,800
age job gains in 2019 come after the state added 83,300
4,261,400
asCenlcdatyo8r1s,2wC0ai0tlhhojotuhnbes
inD2o0u1g8heartnyd 2W0o1rt7h, respectiveIlryw.inMajor Coffee most job growth in 201T9iftinclude Educa-
Bacon
4,144,W80a0yne
McIntosh
tioEnarlaynd HealtBhakSeer rvices; Leisure and Hospitality; Trade,
4,032,P40ie0rce
Transportation, and Utilities; and ProfessionalBaernridenBusAi-tkinson 3,953,900
ness SMerilvleirces. The MMiitnchinelgl and CLoolqgugitting Cseoocktor saw job
Ware
Brantley
Glynn
cuts over the year.
Lanier
2012
2013
2014
2015
2016
2017
2018
2019
Seminole
Clinch
On an annDueacaltuarveragGeradbyasisT,htohmeaus nemBropolkosymenLotwrnadteesin
Georgia is down 0.5 percentage point over the rate dropped to 3.4 percent in 2019, its lowest
year. level
eTEvchheeor,ls
Camden
ChaGrlteoonrgia Unemployment Rate
(Not Seasonally Adjusted)
from 3.9 percent in 2018. In 2017 and 2016, respective-
ly, the rate was 4.7 percent and 5.4 percent. The all-time
high annual average unemployment rate in the state was
10.5 percent in 2010.
9.2%
8.2%
Georgia also saw an increase in wages from 2018 to 2019. Total Private Average Hourly Earnings in Georgia were up $0.25 over the year as hourly wages increased from $26.37 in 2018 to $26.62 in 2019. Total Private Average Weekly Hours dipped from 2018 to 2019 with Georgians working 34.9 hours per week in 2018 and 34.8 hours per week in 2019. Total Private Average Weekly Earnings were up $6.07 in the state as earnings grew from $920.31 per week in 2018 to $926.38 per week in 2019.
7.1%
6.0%
5.4%
4.7%
3.9%
3.4%
2012
2013
2014
2015
2016
2017
2018
2019
With 77,900 jobs added in 2019 and the unemployment rate at 3.4 percent, Georgia ranked 7th in most job growth and tied for 23rd in lowest unemployment rate when compared to all states.
INSIDE
State Employment Analysis................................................ 2 MSA Employment Analysis................................................ 3 State and MSA Employment Data...................................... 7 State and MSA Hours and Earnings.................................. 28 State and Area Unemployment Data................................. 33
Workforce Statistics & Economic Research
For more information, contact
Corey Smith or Evan Cross at (404) 232-3875 corey.smith@gdol.ga.gov evan.cross@gdol.ga.gov
Equal Opportunity Employer/ProgramAuxiliary Aids and Services Available upon Request to Individuals with Disabilities
Annual Dimensions - Measuring Georgia's Workforce
140,000 120,000 100,000
80,000
Georgia Annual Employment Change
112,400 116,600 110,000
78,500
81,200
83,300
77,900
60,000 53,700
40,000
20,000
0 2012
2013
2014
2015
2016
2017
2018
2019
2019 Nonfarm Payroll Employment by Industry Sector
Total employment in the Mining and Logging sector in Employment in the Mining and Logging sector in Georgia was down 100 in 2019 and now stands at 9,400. There was no job change in 2018 and 2017 while 400 positions were added in 2016. Prior to 2019 the last time the sector lost jobs was in 2012.
Construction employment was up 7,900 in 2019 and has now grown for seven straight years. There were 8,800, 6,900, 10,000, 10,700, 12,000 and 4,600 jobs added from 2018 to 2013, respectively. Job losses from 2008 to 2012 were, respectively, -17,100, -38,300, -15,900, -3,500, and -4,000. Of the 7,900 Construction jobs added this year, 2,600 were in Construction of Buildings, Heavy and Civil Engineering Construction saw jobs grow by 1,900, and Specialty Trade Contractors payrolls were up 3,500.
portion of the sector added 2,900 jobs in 2019 after adding 5,200 jobs in 2018. Retail Trade positions were down 1,800 in 2019 after no change in 2018. The Transportation, Warehousing, and Utilities industry added 11,600 jobs in 2019 after adding 10,900 workers in 2018.
After losing 3,700 jobs in 2018, the Information sector added 2,200 jobs in 2019. Payrolls were up 5,100 and 600 in 2017 and 2016, respectively. The Information sector includes telecommunications, data processing, as well as the motion picture, publishing, and sound recording industries.
Employment in the Financial Activities sector grew by 4,400 in 2019 after growing by 4,800 in 2016 and 4,100 in 2017. In 2019, the Finance and Insurance industry added 1,600 workers, while the Real Estate, Rental and Leasing industry grew by 2,700.
Professional and Business Services saw employment increase by 9,800 in 2019 after growing by 15,400 in 2018. The sector is broken into three industries: Professional and Technical Services where 5,700 jobs were added in 2018, Management of Companies and Enterprises which grew by 1,200 positions, and Administrative and Support Services where employment was up by 3,000 over the year.
After growing by 14,400 in 2018, the Education and Health Services sector added 22,100 jobs in 2019 as both the education segment and the health services portion of the sector experienced growth. The Educational Services industry grew by 3,500 while the Health Care and Social Assistance industry grew by 18,600 over the year. Over the last 10 years, Educational and Health Services has grown by an average of 14,500 jobs per year.
Georgia's Manufacturing sector added 1,600 jobs in 2019 after payrolls were up 8,500 in 2018 and 8,300 in 2017. After being down for five straight years, Manufacturing payrolls in the state have grown for nine straight years. Durable Goods Manufacturing grew by 1,700 jobs in 2019 and has now grown for nine consecutive years while Non-Durable Goods Manufacturing shed 100 jobs in 2019 after growing for a record five years in a row.
All Employee Average Hourly Earnings in the Manufacturing sector increased $0.60 over the year as wages were up from $23.81 in 2018 to $24.41 in 2019. Average Weekly Hours declined as the workweek dropped from 42.1 hours in 2018 to 41.9 hours in 2019. Average Weekly Earnings in Manufacturing increased from $1,002.40 in 2018 to $1,022.78 in 2019.
Production Employee Average Hourly Earnings increased $0.67 in the Manufacturing sector, from $18.92 in 2018 to $19.59 in 2019. Average Weekly Hours declined from 43.2 hours in 2018 to 42.8 hours in 2019 while Average Weekly Earnings moved up from $817.34 in 2018 to $838.45 in 2019.
Trade, Transportation, and Utilities employment grew by 12,700 in 2019 after growing by 16,100, 13,100, and 19,300, in 2018, 2017, and 2016, respectively. The Wholesale Trade
Payrolls in Georgia's Leisure and Hospitality sector were up 12,800 in 2019 after growing by 10,700 in 2018 and 12,000 in 2017. Since growing for 16 consecutive years from 1992-2007, then contracting from 2008-2010, the Leisure and Hospitality sector has now added jobs for nine straight years (20112019). The Arts and Entertainment portion of the sector added 2,600 jobs in 2019 after growing by 2,700 in 2018 while the Accommodation and Food Services portion of the sector added 10,000 payroll employees in 2019 and 8,100 in 2018.
Employment in Other Services increased by 4,600 in 2019 after being up 2,100 in 2018 and up 1,000 in 2017. The 4,600 new jobs in 2019 were a result of Repair and Maintenance growing by 2,100 workers; Personal and Laundry Services employment rising by 1,100; and Religious, Civic, and Similar Organizations adding 1,400 jobs.
After falling for six straight years (2009-2014) and cutting 34,500 jobs, Government employment in Georgia rose for the fifth year in a row and added 200 workers in 2019. Employment was up 6,000 in 2018. Federal Government payrolls grew by 1,900 in 2019 after growing by 300 in 2018. State Government jobs dropped by 3,200 in 2019 and were up 2,700 in 2018. Local Government payrolls were up 1,500 in 2019 and up 3,000 in 2018.
Note: Data may not add due to rounding.
2
Source: Georgia Department of Labor, Workforce Statistics & Economic Research
MSA Nonfarm Employment
2012 2019 Annual Employment Change
Albany MSA
1,200
900
900
900
700
600
300
100
0
0
0
-100 -300
-600
-700 -900
2012
2013
2014
2015
2016
2017
2018
2019
Athens-Clarke County MSA
4,000
3,000
2,000 1,000
1,300
1,000
1,000
2,100
2,700
2,800
1,500
0
-1,000
-2,000
2012
2013
2014
2015
2016
2017
2018
-1,600 2019
The Albany MSA added 700 jobs in 2019 as average employment in the area increased to 62,900. The growth comes after employment fell by 700 in 2018. The 2019 job gain is the third most annual jobs added in the last seven years. Private Service-Providing sector added 700 jobs in 2019 after being flat in 2018. Retail Trade employment grew by 200 over the year after being down 200 in 2018. Government employment was flat in 2019 after six consecutive years of declining growth.
The Athens MSA lost 1,600 jobs in 2019 after eight consecutive years of job growth. The average employment in the MSA was 96,700 in 2019. State Government, after growing for two straight years, shed 1,900 jobs, its largest year over year job cuts ever recorded. The Private-Services Providing sector grew by 400 workers in 2019, the weakest growth in seven years. Professional and Business Services employment declined by 400 jobs, the second consecutive year of job cuts.
Atlanta MSA
120,000
100,000
80,000
60,000 40,000
42,800
60,200
88,800
78,800
82,600
62,500
57,800
63,800
20,000
0 2012
2013
2014
2015
2016
2017
2018
2019
The Atlanta MSA saw employment increase by 63,800 in 2019 after growing by 57,800 jobs in 2018. Total average employment in the metro area in 2019 was 2,849,400. Education and Health Services; Trade, Transportation, and Utilities; Professional and Business Services; Leisure and Hospitality; and Construction saw the most job growth over the year. Education and Health Services employment grew by 15,200 in 2019, which was the most out of all major sectors. Government added 800 jobs in 2019. The last time the sector added below 1,000 jobs was in 2014 when it gained 900 jobs.
Augusta-Richmond County MSA
7,000
6,000 5,000 4,000
5,600
4,100
4,100
3,700
3,700
3,000
2,000
1,000
800
2,300
2,000
0
2012
2013
2014
2015
2016
2017
2018
2019
There were 2,000 jobs added in the Augusta MSA in 2019 as average employment in the area increased to 242,700. The over the year employment growth marks the tenth straight year of positive gains for the MSA. Mining, Logging, and Construction along with Education and Health Services grew the most in 2019, each gaining 1,300 jobs. This is the sixth consecutive year of job growth in Mining, Logging, and Construction. Government employment declined by 900 in 2019, its worst job growth in seven years.
Note: MSA = Metropolitan Statistical Area
Source: Georgia Department of Labor, Workforce Statistics & Economic Research
3
MSA Nonfarm Employment
2012 2019 Annual Employment Change
Brunswick MSA
2,400
1,800
1,200 600
600
0
-600 2012
200 2013
1,300
1,500
0
2014
2015
2016
400 2017
800 2018
-100 2019
After four consecutive years of job growth, employment in the Brunswick MSA fell by 100 in 2019 after 800 jobs were added in 2018. Employment in the Private Service-Providing sector decreased by 200 over the year after seven straight years of job growth. Trade, Transportation, and Utilities employment declined by 200 in 2019 after adding 200 jobs in 2018. Government employment grew by 200 in 2019 and has now been up for three years in a row.
Columbus MSA
2,400
1,800
1,700
1,200 1,000
1,100
600
600
400
0
-600
-1,200
2012
2013
2014
-900 2015
-500 2016
2017
2018
-100 2019
The Columbus MSA lost 100 jobs in 2019 after the MSA added 1,700 jobs in 2018 and 600 jobs in 2017. Financial Services employment fell by 300 in 2019 after being flat in 2018. Professional and Business Services employment grew by 300 over the year and has been positive for the fifth consecutive year. Manufacturing jobs declined by 200 over the year after two years of negative growth. Trade, Transportation, and Utilities employment was down 200 in 2019, its third straight year of job cuts. Government employment fell by 700 in 2019 after growing by 100 in 2018.
3,000 2,000 1,000
0 -1,000
Dalton MSA
2,300
1,600
500 0
-100
-2,000 -3,000
-2,100 2012
2013
2014
2015
2016
2017
900
-1,300
2018
2019
The Dalton MSA saw employment decrease by 1,300 in 2019 after 900 jobs were added in 2018. The Private Service-Providing sector lost 400 jobs in 2019 after five consecutive years of growth. Professional and Business Services lost 200 jobs in 2019 after growing for five straight years as well. Manufacturing employment was down 900 in 2019 after being up 200 in 2018. Government jobs grew by 100 in 2019, the second consecutive year of job growth in the sector.
Gainesville MSA
5,000
4,000
4,200
3,000
2,000
2,000
2,300
2,500
2,700
3,200
2,400
1,000
1,200
0 2012
2013
2014
2015
2016
2017
2018
2019
Employment in the Gainesville MSA rose by 1,200 in 2019. The area has now experienced job growth for nine years in a row. Total employment in 2019 was 93,500 and breaks the all-time high set last year for the MSA. Private ServiceProviding sector employment increased by 800 jobs in 2019, which is the lowest increase in the last seven years. Trade, Transportation, and Utilities employment rose by 500 in 2019. Government employment was flat in 2019, after two consecutive years of growth.
Note: MSA = Metropolitan Statistical Area
Source: Georgia Department of Labor, Workforce Statistics & Economic Research
4
MSA Nonfarm Employment
2012 2019 Annual Employment Change
Hinesville MSA
800
600
600
500
400 400
200
100
100
0
0
-200
-400
-300
-600 2012
-400 2013
2014
2015
2016
2017
2018
2019
Macon-Bibb County MSA
2,400
2,000
2,000
1,600
1,200 800
1,000
400
300
1,400
800 500
400
0
-400 2012
2013
2014
2015
2016
2017
2018
-100 2019
In the Hinesville MSA, after being up 400 in 2018, employment grew by 600 in 2019. The job growth is the fifth consecutive year of gains for the MSA. Private Service-Providing employment increased by 400 in 2019, which is the sixth consecutive year of employment gains for the sector. The Goods Producing sector, which includes Manufacturing and Construction, was flat in 2019 after two consecutive years of employment growth in the sector. Government employment was up 100 in 2019.
Employment in the Macon-Bibb MSA fell by 100 in 2019 after displaying eight straight years of growth. The MSA's average employment in 2019 was 103,100. Employment in the Private Service-Providing sector was flat in 2019 after growing for eight years in a row. Trade, Transportation, and Utilities employment decreased by 300 in 2019 after increasing by 400 in 2018. Professional and Business Services employment rose by 100 in 2019. This is now three consecutive year of job growth in the sector. Government employment contracted by 200 in 2019 after expanding by 300 in 2018.
Rome MSA
1,200
900
800
400 300
200
600
500
400
400
400
0 2012
2013
2014
2015
2016
2017
2018
2019
Employment in the Rome MSA grew for the eighth consecutive year as 400 jobs were added in 2019. The Private Service-Providing sector expanded by 700 jobs over the year. Manufacturing employment was down 300 in 2019 after five consecutive years of job growth. Retail Trade employment was flat in 2019 after three consecutive years of job gains. Education and Health Services positions grew by 200 in 2019 and have now been up for four straight years. Government employment was down 100 in 2019, after being up 100 in 2018.
7,200
6,000
4,800 3,600
3,600
2,400
1,200
0 2012
Savannah MSA
4,100
5,300
6,200
4,300
3,200
2013
2014
2015
2016
2017
4,900 2018
2,400 2019
Employment in the Savannah MSA was up for the ninth consecutive year with 2,400 jobs added in 2019. The Savannah MSA's average total employment in 2019 of 186,600 breaks the all-time high set last year for the MSA. Leisure and Hospitality grew by 600 jobs over the year and have been up for the tenth consecutive year. Trade, Transportation, and Utilities employment increased by 500 over the year. This is the lowest employment increase in the sector in the past seven years. Education and Health Services employment gained 100 jobs in 2019 after losing 200 in 2018. Government employment fell by 300 in 2019 after four consecutive years of job growth.
Note: MSA = Metropolitan Statistical Area
Source: Georgia Department of Labor, Workforce Statistics & Economic Research
5
MSA Nonfarm Employment
2012 2019 Annual Employment Change
Valdosta MSA
1,600
1,200 800
800
1,000
800 700
400
0
-400 2012
0 2013
2014
2015
2016
-200 2017
300 2018
200 2019
2,400
1,800
1,200
600
0
0
-600
-1,200
2012
Warner Robins MSA
1,800
1,800
1,800
1,200
600
-600 2013
-400 2014
2015
2016
2017
2018
2019
The Valdosta MSA saw employment rise by 200 in 2019 after the area grew by 300 in 2018. The Private Service-Providing sector gained 100 jobs in 2019 and has now displayed a second consecutive year of job growth. Retail Trade employment was flat in 2019 after enduring two consecutive years of job loss. Government employment was flat in 2019 after two consecutive years of job growth. Federal Government employment held steady in 2019, State Government fell by 100 jobs, and Local Government employment grew by 100 in 2019.
In 2019, employment in the Warner Robins MSA increased by 1,800 after growing by the same amount in 2018. The Private Service-Providing sector saw employment expand by 1,400 in 2019, the fifth consecutive year of job growth and the largest in seven years for the sector. Retail Trade employment was flat over the year after four straight years of growth. Government employment was up 400 in 2019, the third consecutive year of growth. Federal Government grew by 700 while State Government and Local Government employment fell by 200 and 100, respectively.
Note: MSA = Metropolitan Statistical Area
Source: Georgia Department of Labor, Workforce Statistics & Economic Research
6
Georgia Nonfarm Employment
(Seasonally Adjusted)
(In thousands)
2019 Preliminary Series
Industry Jan Feb Mar Apr M ay Jun Jul Aug Sep
Total Nonfarm Total Private Goods Producing Service-Providing Private Service-Providing Mining and Logging Mining, Logging and Construction Construction Manufacturing
Durable Goods Non-Durable Goods Trade, Transportation, and Utilities Wholesale Trade Retail Trade Transportation, Warehousing, and Utilities Information Financial Activities Finance and Insurance Real Estate and Rental and Leasing Professional and Business Services Professional, Scientific, and Technical Services Management of Companies and Enterprises Admin and Support, Waste Mngmnt and Remediation Education and Health Services Educational Services Health Care and Social Assistance Leisure and Hospitality Arts, Entertainment, and Recreation Accommodation and Food Services Other Services Government Federal Government State Government Local Government
4,596.8 3,907.4
617.6 3,979.2 3,289.8
9.4 211.3 201.9 406.3 203.6 202.7 943.1 216.7 495.7 230.7 117.0 248.3 176.8 71.5 717.4 281.5 90.7 345.2 601.4 91.1 510.3 498.6 56.1 442.5 164.0 689.4 101.4 169.4 418.6
4,601.5 3,911.4
618.2 3,983.3 3,293.2
9.5 211.9 202.4 406.3 203.5 202.8 940.9 216.7 493.8 230.4 118.7 248.7 176.9 71.8 717.2 281.2 90.9 345.1 602.7 91.1 511.6 500.7 56.2 444.5 164.3 690.1 102.7 169.1 418.3
4,602.3 3,912.0
619.0 3,983.3 3,293.0
9.5 212.2 202.7 406.8 203.8 203.0 941.8 216.7 493.9 231.2 118.0 248.9 176.8 72.1 716.3 281.0 91.5 343.8 603.2 91.6 511.6 500.2 56.6 443.6 164.6 690.3 102.5 169.0 418.8
4,599.6 3,909.9
619.7 3,979.9 3,290.2
9.4 212.3 202.9 407.4 203.8 203.6 941.3 216.3 493.8 231.2 116.7 249.5 177.6 71.9 716.3 281.6 90.6 344.1 603.9 91.6 512.3 497.7 56.1 441.6 164.8 689.7 102.8 168.3 418.6
4,603.2 3,914.6
620.5 3,982.7 3,294.1
9.3 213.1 203.8 407.4 203.6 203.8 942.5 216.8 494.1 231.6 116.7 249.9 177.9 72.0 717.9 282.1 90.7 345.1 604.7 91.6 513.1 498.1 56.1 442.0 164.3 688.6 102.9 168.6 417.1
4,610.1 3,921.2
620.9 3,989.2 3,300.3
9.4 214.1 204.7 406.8 203.2 203.6 944.1 216.9 494.3 232.9 117.4 249.9 177.8 72.1 720.7 282.9 91.2 346.6 605.8 91.9 513.9 498.0 55.7 442.3 164.4 688.9 103.0 167.6 418.3
4,605.3 3,917.1
620.7 3,984.6 3,296.4
9.4 214.0 204.6 406.7 203.6 203.1 943.1 216.6 492.4 234.1 115.9 251.3 179.1 72.2 715.7 282.6 90.1 343.0 607.0 93.1 513.9 499.2 55.8 443.4 164.2 688.2 103.2 166.8 418.2
4,627.0 3,935.4
621.2 4,005.8 3,314.2
9.4 214.2 204.8 407.0 204.7 202.3 943.4 216.7 493.2 233.5 119.3 253.0 180.1 72.9 718.1 282.6 90.1 345.4 610.5 92.6 517.9 503.4 56.8 446.6 166.5 691.6 104.0 169.0 418.6
4,626.1 3,935.5
621.4 4,004.7 3,314.1
9.4 213.5 204.1 407.9 206.0 201.9 945.1 216.5 493.0 235.6 115.7 251.3 179.3 72.0 717.5 282.8 90.9 343.8 614.2 94.4 519.8 505.1 57.8 447.3 165.2 690.6 103.9 167.4 419.3
Oct Nov
4,630.1 3,938.9
615.6 4,014.5 3,323.3
9.3 212.0 202.7 403.6 201.9 201.7 948.5 218.7 492.8 237.0 115.1 250.7 179.8 70.9 716.0 284.1 90.2 341.7 618.9 94.4 524.5 510.3 59.0 451.3 163.8 691.2 103.8 167.2 420.2
4,638.7 3,947.0
617.7 4,021.0 3,329.3
9.4 213.8 204.4 403.9 202.6 201.3 953.0 219.2 494.7 239.1 115.6 251.3 179.9 71.4 712.5 284.7 90.1 337.7 622.6 95.3 527.3 508.1 57.1 451.0 166.2 691.7 103.9 167.6 420.2
Dec
4,640.1 3,947.7
616.6 4,023.5 3,331.1
9.2 213.3 204.1 403.3 202.5 200.8 954.8 219.9 496.8 238.1 115.6 251.7 179.9 71.8 713.9 285.5 90.7 337.7 623.2 93.6 529.6 505.8 55.7 450.1 166.1 692.4 104.2 167.8 420.4
(In thousands)
2018 Final Series
Industry Jan Feb Mar Apr M ay Jun Jul Aug Sep Oct Nov Dec
Total Nonfarm
4,490.9 4,501.3 4,513.0 4,513.4 4,522.3 4,533.2 4,541.1 4,549.1 4,560.0 4,562.4 4,568.6 4,570.0
Total Private
3,801.9 3,813.0 3,824.9 3,826.6 3,831.4 3,842.2 3,849.8 3,856.9 3,869.1 3,871.3 3,877.2 3,878.1
Goods Producing
600.3 604.0 605.8 606.4 608.4 610.3 610.6 612.0 614.3 614.7 613.8 615.4
Service-Providing
3,890.6 3,897.3 3,907.2 3,907.0 3,913.9 3,922.9 3,930.5 3,937.1 3,945.7 3,947.7 3,954.8 3,954.6
Private Service-Providing
3,201.6 3,209.0 3,219.1 3,220.2 3,223.0 3,231.9 3,239.2 3,244.9 3,254.8 3,256.6 3,263.4 3,262.7
Mining and Logging
9.6
9.6
9.6
9.5
9.6 9.6
9.6
9.5
9.6
9.5
9.3
9.4
Mining, Logging and Construction
199.4 201.5 202.8 204.2 204.7 205.5 206.2 206.4 207.6 207.8 206.6 208.0
Construction
189.8 191.9 193.2 194.7 195.1 195.9 196.6 196.9 198.0 198.3 197.3 198.6
Manufacturing
400.9 402.5 403.0 402.2 403.7 404.8 404.4 405.6 406.7 406.9 407.2 407.4
Durable Goods
198.6 199.6 200.0 200.9 201.7 202.5 202.1 202.9 203.2 203.1 203.4 203.6
Non-Durable Goods
202.3 202.9 203.0 201.3 202.0 202.3 202.3 202.7 203.5 203.8 203.8 203.8
Trade, Transportation, and Utilities
920.1 923.3 925.5 928.5 929.1 930.4 932.2 933.3 935.4 935.6 938.9 939.5
Wholesale Trade
211.4 211.8 212.5 212.9 212.9 214.0 215.0 215.0 215.5 216.1 216.3 216.8
Retail Trade
495.1 495.4 496.1 495.8 495.6 495.0 495.3 494.5 495.1 493.1 493.0 492.0
Transportation, Warehousing, and Utilities
213.6 216.1 216.9 219.8 220.6 221.4 221.9 223.8 224.8 226.4 229.6 230.7
Information
116.1 115.3 115.6 114.4 113.9 113.9 113.6 114.7 116.4 116.4 115.7 112.5
Financial Activities
243.4 244.3 244.5 244.8 244.9 245.5 245.5 245.9 247.1 246.8 249.0 247.6
Finance and Insurance
176.1 176.4 176.4 176.3 176.2 176.4 176.2 176.2 176.8 176.6 178.4 176.8
Real Estate and Rental and Leasing
67.3 67.9 68.1 68.5 68.7 69.1 69.3 69.7 70.3 70.2 70.6 70.8
Professional and Business Services
699.9 701.7 705.3 704.2 703.0 705.2 705.5 707.1 709.1 709.8 711.2 711.7
Professional, Scientific, and Technical Services
272.3 273.3 274.6 275.1 276.0 277.2 277.2 278.0 279.0 279.4 279.8 280.3
Management of Companies and Enterprises
89.0 89.0 89.2 89.5 89.6 89.7 89.9 89.6 90.1 89.8 89.2 89.4
Admin and Support, Waste Mngmnt and Remediation
338.6 339.4 341.5 339.6 337.4 338.3 338.4 339.5 340.0 340.6 342.2 342.0
Education and Health Services
579.9 581.2 582.2 583.4 585.3 587.5 590.3 591.4 592.5 593.3 594.3 595.7
Educational Services
87.6 88.1 88.2 88.7 89.2 89.3 89.8 90.2 89.8 89.9 90.0 90.6
Health Care and Social Assistance
492.3 493.1 494.0 494.7 496.1 498.2 500.5 501.2 502.7 503.4 504.3 505.1
Leisure and Hospitality
484.6 485.2 487.4 486.3 487.2 489.1 491.3 491.2 492.1 492.1 492.2 493.1
Arts, Entertainment, and Recreation
52.7 53.0 53.2 53.3 53.6 53.9 53.9 53.8 53.9 54.5 54.6 55.1
Accommodation and Food Services
431.9 432.2 434.2 433.0 433.6 435.2 437.4 437.4 438.2 437.6 437.6 438.0
Other Services
157.6 158.0 158.6 158.6 159.6 160.3 160.8 161.3 162.2 162.6 162.1 162.6
Government
689.0 688.3 688.1 686.8 690.9 691.0 691.3 692.2 690.9 691.1 691.4 691.9
Federal Government
100.7 100.7 100.7 100.9 100.8 101.1 101.3 101.5 101.9 102.1 102.4 102.5
State Government
172.1 170.9 170.7 169.4 171.9 171.6 171.4 172.8 170.9 170.8 170.3 170.2
Local Government
416.2 416.7 416.7 416.5 418.2 418.3 418.6 417.9 418.1 418.2 418.7 419.2
Note: These seasonally adjusted estimates were prepared in cooperation with the U.S. Department of Labor, Bureau of Labor Statistics, based upon monthly reports submitted by selected
employers throughout Georgia. The estimates include all full- and part-time wage and salary workers who were employed during or received pay for any part of the pay period that includes the twelfth
of the month. Proprietors, domestic workers, self-employed persons, unpaid family workers and personnel of the armed forces are excluded. Estimates based on 2019 benchmark.
Source: Georgia Department of Labor, Workforce Statistics & Economic Research
7
Georgia Nonfarm Employment
(Not Seasonally Adjusted)
(In thousands)
2019 Preliminary Series
Industry
Annual Jan Feb Mar Apr M ay Jun Jul Aug Sep Oct Nov Dec Average
Total Nonfarm Total Private Goods Producing Service-Providing Private Service-Providing Mining and Logging Mining, Logging and Construction Construction
Construction of Buildings Heavy and Civil Engineering Construction Specialty Trade Contractors Manufacturing Durable Goods Transportation Equipment Manufacturing Non-Durable Goods Food Manufacturing Textile Mills Textile Product Mills Trade, Transportation, and Utilities Wholesale Trade Merchant Wholesalers, Durable Goods Merchant Wholesalers, Nondurable Goods Wholesale Electronic Markets and Agents and Brokers Retail Trade Food and Beverage Stores General Merchandise Stores Miscellaneous Store Retailers Transportation, Warehousing, and Utilities Utilities Transportation and Warehousing Air Transportation Truck Transportation Couriers and Messengers Warehousing and Storage Information Telecommunications Wired and Wireless Telecommunications Carriers Data Processing, Hosting, and Related Services Financial Activities Finance and Insurance Insurance Carriers and Related Activities Real Estate and Rental and Leasing Professional and Business Services Professional, Scientific, and Technical Services Accounting, Tax Prep, and Bookkeeping Services Architectural, Engineering, and Related Services Computer Systems Design and Related Services Management and Technical Consulting Services Management of Companies and Enterprises Admin and Support, Waste Mngmnt and Remediation Employment Services Education and Health Services Educational Services Colleges, Universities, and Professional Schools Health Care and Social Assistance Ambulatory Health Care Services Hospitals Nursing and Residential Care Facilities Social Assistance Leisure and Hospitality Arts, Entertainment, and Recreation Amusement, Gambling, and Recreation Industries Accommodation and Food Services Accommodation Food Services and Drinking Places Other Services Repair and Maintenance Personal and Laundry Services Religious, Grantmaking, Civic, Professional, and Similar Government Federal Government Department of Defense State Government State Government Educational Services State Government excluding Educational Services Local Government Local Government Educational Services Local Government excluding Educational Services
4,548.7 3,861.9
612.5 3,936.2 3,249.4
9.4 207.5 198.1
43.2 32.6 122.3 405.0 203.1 55.0 201.9 64.2 19.2 28.8 940.1 215.3 114.3 64.4 36.6 492.9 92.7 108.8 21.6 231.9 19.2 212.7 29.7 54.6 30.2 54.8 114.8 39.2 33.9 12.8 245.9 175.5 83.4 70.4 707.3 281.2 37.2 41.6 72.5 46.9 90.4 335.7 163.6 598.6 90.5 44.7 508.1 214.3 161.4 59.9 72.5 481.1 49.5 34.9 431.6 47.2 384.4 161.6 40.8 39.1 81.7 686.8 101.7 42.8 167.1 96.8 70.3 418.0 248.6 169.4
4,575.5 3,882.7
616.5 3,959.0 3,266.2
9.5 210.3 200.8
43.6 33.0 124.2 406.2 203.6 55.5 202.6 64.7 19.2 28.5 933.8 216.3 114.8 64.7 36.8 488.1 92.9 104.7 21.9 229.4 19.2 210.2 30.3 54.5 26.9 55.2 118.5 39.0 33.8 12.9 247.3 176.2 83.8 71.1 711.7 283.1 38.9 41.8 72.5 46.4 90.9 337.7 164.4 604.2 92.5 45.7 511.7 217.2 160.6 60.1 73.8 487.9 50.5 35.1 437.4 47.9 389.5 162.8 41.3 39.2 82.3 692.8 102.6 42.9 170.2 99.9 70.3 420.0 250.1 169.9
4,592.5 3,897.8
618.3 3,974.2 3,279.5
9.5 211.6 202.1 43.5 33.6 125.0 406.7 204.0 55.6 202.7 64.7 19.2 28.6 936.2 216.3 114.7 64.9 36.7 489.7 92.5 104.7 21.8 230.2 19.3 210.9 30.7 54.7 27.0 55.3 118.0 38.9 33.8 13.0 247.8 176.2 84.5 71.6 712.6 281.6 37.9 42.0 71.7 46.5 91.4 339.6 165.0 604.6 93.0 46.1 511.6 217.8 159.9 60.2 73.7 496.6 53.7 38.1 442.9 48.7 394.2 163.7 41.5 39.6 82.6 694.7 102.3 43.0 170.8 100.5 70.3 421.6 250.2 171.4
4,598.1 3,903.7
617.8 3,980.3 3,285.9
9.4 211.2 201.8 43.7 33.7 124.4 406.6 203.5 55.3 203.1 64.9 19.1 28.9 934.8 215.4 114.4 64.2 36.8 490.4 91.7 104.3 22.0 229.0 19.2 209.8 30.7 55.0 25.5 55.5 115.6 38.3 33.3 13.3 248.5 177.0 84.9 71.5 712.5 282.8 37.6 42.5 72.4 46.5 90.5 339.2 164.3 605.2 93.4 45.8 511.8 218.7 158.9 60.5 73.7 504.2 59.5 43.0 444.7 48.8 395.9 165.1 41.6 40.5 83.0 694.4 102.6 42.7 170.9 100.8 70.1 420.9 249.0 171.9
4,613.5 4,609.4 4,586.9 4,624.3 4,619.8
3,919.5 3,928.7 3,922.3 3,936.6 3,926.7
620.5 623.2 622.3 622.6 621.8
3,993.0 3,986.2 3,964.6 4,001.7 3,998.0
3,299.0 3,305.5 3,300.0 3,314.0 3,304.9
9.3
9.4
9.4
9.4
9.3
213.7 215.7 214.6 214.7 214.0
204.4 206.3 205.2 205.3 204.7
44.5 45.1 45.1 46.4 45.7
34.3 35.3 35.5 35.5 36.1
125.6 125.9 124.6 123.4 122.9
406.8 407.5 407.7 407.9 407.8
203.3 203.5 204.0 205.0 205.6
55.1 55.4 55.1 55.6 55.5
203.5 204.0 203.7 202.9 202.2
65.1 65.5 65.9 65.9 65.8
19.0 18.8 18.7 18.6 18.5
29.0 29.2 28.9 28.7 28.6
938.7 940.1 940.3 937.3 938.1
216.5 217.3 216.2 216.6 216.0
114.8 115.4 115.2 115.7 115.3
64.6 64.6 64.0 63.8 64.0
37.1 37.3 37.0 37.1 36.7
492.5 491.4 490.4 488.9 487.5
92.1 91.6 91.5 91.0 90.6
105.6 105.4 105.8 105.5 106.6
22.3 22.2 22.3 22.3 22.1
229.7 231.4 233.7 231.8 234.6
19.3 19.4 19.5 19.4 19.4
210.4 212.0 214.2 212.4 215.2
30.3 30.7 31.4 30.2 30.7
55.7 56.1 55.5 55.7 54.9
25.6 26.4 26.5 26.2 28.4
55.4 55.5 56.2 56.8 57.1
115.3 117.6 117.5 120.0 116.3
38.3 38.6 37.8 37.6 37.1
33.2 33.3 32.8 32.6 32.3
13.3 13.4 13.4 13.4 13.5
249.5 250.3 251.8 253.8 251.1
177.4 177.9 180.0 180.7 179.2
85.0 85.3 86.7 87.2 86.5
72.1 72.4 71.8 73.1 71.9
714.6 719.1 716.2 716.8 716.0
280.2 281.4 283.2 281.2 279.1
34.0 34.7 35.2 35.0 34.6
43.0 43.2 44.0 43.6 43.6
72.5 71.9 72.9 72.9 71.5
46.8 46.9 47.1 46.8 46.4
90.5 91.3 90.4 90.2 90.9
343.9 346.4 342.6 345.4 346.0
167.2 169.2 163.9 168.4 169.2
606.2 600.1 598.1 609.6 616.1
92.3 89.1 87.7 89.3 94.8
44.5 43.6 42.2 43.6 46.7
513.9 511.0 510.4 520.3 521.3
219.4 219.1 219.7 220.7 220.0
159.5 160.1 160.2 162.2 161.8
60.8 60.6 60.8 61.8 62.6
74.2 71.2 69.7 75.6 76.9
509.5 511.5 509.1 509.5 502.8
59.7 62.7 62.0 58.9 57.3
42.7 46.0 45.3 42.1 41.1
449.8 448.8 447.1 450.6 445.5
49.7 50.1 48.7 49.6 49.1
400.1 398.7 398.4 401.0 396.4
165.2 166.8 167.0 167.0 164.5
41.7 41.8 42.3 43.0 43.2
40.1 40.3 40.3 40.3 39.6
83.4 84.7 84.4 83.7 81.7
694.0 680.7 664.6 687.7 693.1
102.5 102.7 103.0 104.2 104.0
42.9 43.0 43.1 43.2 43.4
169.8 161.6 159.5 164.8 169.0
99.7 91.4 89.4 95.0 99.3
70.1 70.2 70.1 69.8 69.7
421.7 416.4 402.1 418.7 420.1
249.0 240.7 226.1 245.4 247.3
172.7 175.7 176.0 173.3 172.8
4,651.0 3,953.5
617.1 4,033.9 3,336.4
9.3 213.4 204.1
45.5 36.0 122.6 403.7 201.5 54.1 202.2 66.5 18.6 28.6 946.4 218.9 116.4 65.0 37.5 490.8 91.5 108.1 22.7 236.7 19.3 217.4 30.7 54.8 28.9 58.3 116.9 37.0 32.3 13.6 251.6 180.0 86.8 71.6 723.5 284.0 35.6 44.1 72.2 47.1 90.3 349.2 172.7 624.8 97.3 49.3 527.5 223.1 163.5 61.9 79.0 508.7 58.8 41.2 449.9 49.4 400.5 164.5 43.6 39.9 81.0 697.5 103.9 43.6 170.5 100.6 69.9 423.1 249.0 174.1
4,674.7 3,974.7
617.9 4,056.8 3,356.8
9.3 213.9 204.6
45.9 35.3 123.4 404.0 202.3 55.0 201.7 67.0 18.4 28.4 967.0 219.2 115.8 66.0 37.4 506.3 94.5 115.0 22.6 241.5 19.5 222.0 30.7 54.6 32.4 59.4 118.1 36.8 32.2 13.7 252.0 179.8 86.8 72.2 720.7 285.3 34.9 44.0 74.1 48.1 90.0 345.4 171.1 629.0 98.4 50.0 530.6 222.8 164.8 62.3 80.7 504.3 54.1 38.4 450.2 49.7 400.5 165.7 43.1 40.8 81.8 700.0 104.6 44.1 170.9 100.9 70.0 424.5 249.9 174.6
4,671.7 3,973.7
616.5 4,055.2 3,357.2
9.2 213.0 203.8
45.0 35.6 123.2 403.5 202.5 55.2 201.0 67.3 18.3 28.2 974.8 220.0 115.9 67.0 37.1 509.5 94.1 115.3 22.6 245.3 19.7 225.6 31.0 54.4 36.3 59.1 115.9 37.0 32.4 13.8 252.4 179.7 86.8 72.7 721.2 287.6 36.3 44.0 74.4 48.5 91.2 342.4 167.9 627.6 95.8 48.3 531.8 224.0 164.4 63.0 80.4 499.6 51.7 37.0 447.9 50.2 397.7 165.7 42.3 41.2 82.2 698.0 105.3 44.3 169.7 100.0 69.7 423.0 249.6 173.4
4,613.8 3,923.5
618.9 3,994.9 3,304.6
9.4 212.8 203.4
44.8 34.7 124.0 406.1 203.5 55.2 202.6 65.6 18.8 28.7 944.0 217.0 115.2 64.8 37.0 493.2 92.2 107.5 22.2 233.8 19.4 214.4 30.6 55.0 28.4 56.6 117.0 38.0 33.0 13.3 250.2 178.3 85.6 71.9 716.0 282.6 36.0 43.1 72.6 47.0 90.7 342.8 167.2 610.3 92.8 45.9 517.5 219.7 161.4 61.2 75.1 502.1 56.5 40.4 445.5 49.1 396.4 165.0 42.2 40.1 82.7 690.4 103.3 43.3 167.9 97.9 70.0 419.2 246.2 172.9
Note: These not seasonally adjusted estimates were prepared in cooperation with the U.S. Department of Labor, Bureau of Labor Statistics, based upon monthly reports submit-
ted by selected employers throughout Georgia. The estimates include all full- and part-time wage and salary workers who were employed during or received pay for any part of the pay period that includes the twelfth of the month. Proprietors, domestic workers, self-employed persons, unpaid family workers and personnel of the armed forces are excluded. Estimates based on 2019 benchmark.
Source: Georgia Department of Labor, Workforce Statistics & Economic Research
8
Georgia Nonfarm Employment
(Not Seasonally Adjusted)
(In thousands)
2018 Final Series
Industry
Annual Jan Feb Mar Apr M ay Jun Jul Aug Sep Oct Nov Dec Average
Total Nonfarm Total Private Goods Producing Service-Providing Private Service-Providing Mining and Logging Mining, Logging and Construction Construction
Construction of Buildings Heavy and Civil Engineering Construction Specialty Trade Contractors Manufacturing Durable Goods Transportation Equipment Manufacturing Non-Durable Goods Food Manufacturing Textile Mills Textile Product Mills Trade, Transportation, and Utilities Wholesale Trade Merchant Wholesalers, Durable Goods Merchant Wholesalers, Nondurable Goods Wholesale Electronic Markets and Agents and Brokers Retail Trade Food and Beverage Stores General Merchandise Stores Miscellaneous Store Retailers Transportation, Warehousing, and Utilities Utilities Transportation and Warehousing Air Transportation Truck Transportation Couriers and Messengers Warehousing and Storage Information Telecommunications Wired and Wireless Telecommunications Carriers Data Processing, Hosting, and Related Services Financial Activities Finance and Insurance Insurance Carriers and Related Activities Real Estate and Rental and Leasing Professional and Business Services Professional, Scientific, and Technical Services Accounting, Tax Prep, and Bookkeeping Services Architectural, Engineering, and Related Services Computer Systems Design and Related Services Management and Technical Consulting Services Management of Companies and Enterprises Admin and Support, Waste Mngmnt and Remediation Employment Services Education and Health Services Educational Services Colleges, Universities, and Professional Schools Health Care and Social Assistance Ambulatory Health Care Services Hospitals Nursing and Residential Care Facilities Social Assistance Leisure and Hospitality Arts, Entertainment, and Recreation Amusement, Gambling, and Recreation Industries Accommodation and Food Services Accommodation Food Services and Drinking Places Other Services Repair and Maintenance Personal and Laundry Services Religious, Grantmaking, Civic, Professional, and Similar Government Federal Government Department of Defense State Government State Government Educational Services State Government excluding Educational Services Local Government Local Government Educational Services Local Government excluding Educational Services
4,442.2 3,755.9
595.1 3,847.1 3,160.8
9.6 195.5 185.9
40.2 31.1 114.6 399.6 198.1 54.4 201.5 64.0 20.3 28.7 916.7 210.0 110.8 63.0 36.2 492.1 91.6 108.3 21.4 214.6 19.1 195.5 28.2 52.6 23.3 50.8 114.0 41.9 36.3 12.2 241.1 174.8 82.7 66.3 689.4 272.0 37.9 40.9 70.0 43.9 88.7 328.7 160.2 577.1 87.0 44.2 490.1 198.0 164.3 59.0 68.8 467.2 46.4 33.2 420.8 44.7 376.1 155.3 38.8 38.0 78.5 686.3 101.0 41.2 169.8 96.8 73.0 415.5 247.1 168.4
4,474.7 3,783.6
602.2 3,872.5 3,181.4
9.6 199.8 190.2
41.0 32.4 116.8 402.4 199.7 55.0 202.7 64.3 20.4 28.9 916.0 211.3 111.5 63.4 36.4 489.6 92.2 106.3 21.5 215.1 18.9 196.2 29.4 52.8 21.8 50.9 115.0 41.6 36.1 12.4 242.9 175.7 83.1 67.2 695.8 275.1 39.1 41.2 70.6 44.2 89.0 331.7 163.3 582.6 89.5 45.3 493.1 199.6 164.3 59.0 70.2 472.5 47.6 33.9 424.9 45.6 379.3 156.6 39.5 38.4 78.7 691.1 100.6 41.2 172.1 99.2 72.9 418.4 249.7 168.7
4,501.9 3,809.5
605.0 3,896.9 3,204.5
9.6 202.1 192.5
41.2 32.5 118.8 402.9 200.2 54.8 202.7 64.0 20.4 28.9 919.5 212.0 111.9 63.5 36.6 491.6 92.1 105.6 21.4 215.9 18.9 197.0 29.9 53.1 21.9 50.6 115.4 41.2 35.8 12.5 243.5 175.9 83.3 67.6 701.4 275.1 38.9 41.4 70.0 44.4 89.1 337.2 166.3 583.5 89.6 45.4 493.9 200.1 164.6 58.9 70.3 483.5 50.4 36.3 433.1 46.6 386.5 157.7 40.0 38.9 78.8 692.4 100.5 41.2 172.5 99.5 73.0 419.4 250.1 169.3
4,513.3 3,821.4
604.5 3,908.8 3,216.9
9.5 203.0 193.5
41.6 32.7 119.2 401.5 200.7 54.9 200.8 63.3 19.9 28.6 922.0 212.1 111.8 63.8 36.5 492.3 91.7 106.2 21.5 217.6 19.2 198.4 30.9 53.4 21.8 50.4 113.4 40.9 35.6 12.7 243.9 175.8 83.4 68.1 701.0 276.4 38.7 41.2 71.2 44.8 89.5 335.1 162.7 584.9 90.5 45.5 494.4 200.9 163.3 59.2 71.0 492.9 56.6 41.2 436.3 47.2 389.1 158.8 40.0 38.8 80.0 691.9 100.7 41.4 172.4 99.8 72.6 418.8 249.4 169.4
4,532.1 4,535.1 4,515.9 4,558.5 4,556.1
3,837.2 3,851.3 3,852.1 3,870.4 3,863.1
607.9 612.7 612.1 613.9 615.3
3,924.2 3,922.4 3,903.8 3,944.6 3,940.8
3,229.3 3,238.6 3,240.0 3,256.5 3,247.8
9.6
9.6
9.6
9.5
9.6
204.9 207.3 207.6 207.9 208.5
195.3 197.7 198.0 198.4 198.9
42.0 42.9 42.8 42.9 42.8
33.1 33.4 33.2 33.2 33.2
120.2 121.4 122.0 122.3 122.9
403.0 405.4 404.5 406.0 406.8
201.4 202.9 202.1 203.2 203.2
54.9 55.6 55.2 55.5 55.4
201.6 202.5 202.4 202.8 203.6
63.5 63.6 63.6 64.1 64.6
19.8 20.0 20.2 20.2 20.2
28.8 29.2 29.0 29.0 29.0
925.7 926.1 927.8 928.6 928.6
212.8 214.3 215.4 214.9 214.9
112.2 113.2 114.0 113.9 113.9
64.1 64.2 64.5 64.6 64.6
36.5 36.9 36.9 36.4 36.4
494.1 491.8 492.8 491.7 490.5
91.9 91.0 91.9 91.3 91.1
107.3 106.7 107.7 108.4 108.4
21.6 21.8 22.0 21.9 21.8
218.8 220.0 219.6 222.0 223.2
19.3 19.3 19.3 19.3 19.3
199.5 200.7 200.3 202.7 203.9
30.5 30.7 29.6 30.3 28.5
54.1 54.7 54.5 54.8 54.7
22.2 22.8 22.9 23.4 24.9
50.7 50.5 51.2 52.5 54.0
113.4 113.6 113.3 114.9 115.3
40.7 40.7 40.4 40.0 39.9
35.4 35.4 35.2 34.8 34.7
12.6 12.4 12.5 12.5 12.9
244.7 246.2 246.7 247.0 246.9
175.9 176.9 177.1 177.1 176.8
83.4 83.9 84.3 84.4 84.4
68.8 69.3 69.6 69.9 70.1
699.9 704.5 705.0 712.2 709.6
274.3 276.3 277.0 277.0 275.3
35.0 34.9 34.7 34.5 34.2
41.4 42.3 42.5 42.4 42.3
71.5 70.9 71.9 72.3 71.5
45.5 46.2 45.7 45.7 45.6
89.5 90.1 90.4 89.7 89.9
336.1 338.1 337.6 345.5 344.4
162.9 164.6 164.2 170.5 170.9
586.4 581.5 582.5 591.5 593.5
89.8 86.1 85.2 88.4 90.9
44.4 43.5 43.9 44.4 45.4
496.6 495.4 497.3 503.1 502.6
202.9 204.4 206.2 208.2 210.0
163.4 163.3 164.4 165.1 162.9
59.3 59.4 59.7 59.7 59.8
71.0 68.3 67.0 70.1 69.9
498.3 503.5 501.4 499.9 491.9
56.9 61.0 59.8 57.0 53.6
40.9 44.5 44.0 41.0 38.1
441.4 442.5 441.6 442.9 438.3
48.2 49.1 48.6 48.2 47.8
393.2 393.4 393.0 394.7 390.5
160.9 163.2 163.3 162.4 162.0
40.4 40.5 40.6 40.4 40.6
39.3 39.4 39.4 39.4 39.2
81.2 83.3 83.3 82.6 82.2
694.9 683.8 663.8 688.1 693.0
100.6 101.0 101.0 101.3 101.7
41.5 41.8 41.9 42.0 42.3
172.4 166.1 163.6 170.0 173.0
99.7 93.1 90.8 97.5 100.9
72.7 73.0 72.8 72.5 72.1
421.9 416.7 399.2 416.8 418.3
249.3 242.6 224.5 245.0 247.3
172.6 174.1 174.7 171.8 171.0
4,579.6 3,882.3
615.2 3,964.4 3,267.1
9.5 208.7 199.2
42.9 33.0 123.3 406.5 202.8 55.1 203.7 64.9 19.5 29.4 936.3 216.7 114.5 65.2 37.0 492.9 91.8 108.4 22.4 226.7 19.1 207.6 29.5 55.0 25.7 55.0 117.7 39.4 34.3 12.8 247.9 177.3 84.6 70.6 716.7 279.9 34.7 42.3 73.1 46.8 89.7 347.1 172.0 597.2 91.7 45.7 505.5 212.1 161.4 59.7 72.3 488.9 54.0 37.5 434.9 47.5 387.4 162.4 40.4 39.2 82.8 697.3 101.9 42.5 174.7 102.2 72.5 420.7 249.1 171.6
4,613.4 3,912.0
613.7 3,999.7 3,298.3
9.3 206.5 197.2
42.7 32.5 122.0 407.2 203.2 55.3 204.0 65.5 19.5 29.0 962.2 217.3 114.8 65.5 37.0 510.7 94.2 116.1 22.3 234.2 19.1 215.1 29.8 54.9 30.1 57.7 117.7 39.3 34.2 12.5 250.3 179.2 86.6 71.1 721.3 281.8 35.3 42.1 73.5 47.7 89.3 350.2 175.7 599.2 91.9 45.8 507.3 213.5 161.2 59.5 73.1 486.4 51.8 36.1 434.6 47.3 387.3 161.2 40.2 39.1 81.9 701.4 103.0 42.8 174.2 102.5 71.7 424.2 249.9 174.3
4,608.5 3,909.8
616.7 3,991.8 3,293.1
9.4 208.1 198.7
43.0 33.0 122.7 408.6 204.2 55.5 204.4 65.4 19.5 29.1 966.6 217.9 115.5 65.3 37.1 510.4 94.5 114.9 22.2 238.3 19.2 219.1 29.9 55.0 35.3 56.3 114.2 39.3 34.2 12.8 248.9 177.3 84.6 71.6 717.8 282.3 36.6 42.1 72.5 47.7 89.6 345.9 173.9 598.6 91.0 45.4 507.6 215.1 160.3 59.3 72.9 485.7 51.3 35.9 434.4 47.0 387.4 161.3 40.2 39.1 82.0 698.7 103.4 42.9 172.9 101.4 71.5 422.4 249.5 172.9
4,535.9 3,845.7
609.5 3,926.4 3,236.2
9.5 205.0 195.5
42.2 32.8 120.5 404.5 201.8 55.1 202.7 64.2 20.0 29.0 931.3 214.1 113.2 64.3 36.7 495.0 92.1 108.7 21.8 222.2 19.2 203.0 29.8 54.1 24.7 52.6 114.8 40.4 35.2 12.6 245.8 176.7 84.1 69.2 706.2 276.9 36.2 41.8 71.6 45.7 89.5 339.8 167.3 588.2 89.3 44.9 498.9 205.9 163.2 59.4 70.4 489.3 53.9 38.6 435.5 47.3 388.2 160.4 40.1 39.0 81.3 690.2 101.4 41.9 171.1 98.6 72.5 417.7 246.1 171.6
Note: These not seasonally adjusted estimates were prepared in cooperation with the U.S. Department of Labor, Bureau of Labor Statistics, based upon monthly reports submit-
ted by selected employers throughout Georgia. The estimates include all full- and part-time wage and salary workers who were employed during or received pay for any part of the pay period that includes the twelfth of the month. Proprietors, domestic workers, self-employed persons, unpaid family workers and personnel of the armed forces are excluded. Estimates based on 2019 benchmark.
Source: Georgia Department of Labor, Workforce Statistics & Economic Research
9
(In thousands)
Industry Total Nonfarm Total Private Goods Producing Service-Providing Private Service-Providing Trade, Transportation, and Utilities
Retail Trade Government
Federal Government State Government Local Government
albany msa Nonfarm Employment
(Not Seasonally Adjusted)
2019 Preliminary Series
Annual Jan Feb Mar Apr M ay Jun Jul Aug Sep Oct Nov Dec Average
61.9 62.2 62.6 62.8 62.9 62.9 62.4 62.9 63.4 63.1 63.6 63.7 62.9
49.7 49.8 50.1 50.4 50.6 50.6 50.6 50.7 51.0 50.8 51.2 51.4 50.6
6.9
7.0
6.9
6.8
6.9
6.8 6.8
6.8
6.8
6.8
6.8
6.9
6.9
55.0 55.2 55.7 56.0 56.0 56.1 55.6 56.1 56.6 56.3 56.8 56.8 56.0
42.8 42.8 43.2 43.6 43.7 43.8 43.8 43.9 44.2 44.0 44.4 44.5 43.7
12.5 12.5 12.6 12.6 12.6 12.6 12.8 12.7 12.6 12.8 13.1 13.2 12.7
7.7
7.7
7.7
7.7
7.7
7.7 7.9
7.8
7.8
7.9
8.1
8.3
7.8
12.2 12.4 12.5 12.4 12.3 12.3 11.8 12.2 12.4 12.3 12.4 12.3 12.3
2.6
2.7
2.7
2.7
2.7
2.7 2.7
2.7
2.7
2.7
2.7
2.7
2.7
2.4
2.5
2.5
2.5
2.5
2.4 2.3
2.3
2.5
2.4
2.5
2.4
2.4
7.2
7.2
7.3
7.2
7.1
7.2 6.8
7.2
7.2
7.2
7.2
7.2
7.2
(In thousands)
2018 Final Series
Industry Total Nonfarm Total Private Goods Producing Service-Providing Private Service-Providing Trade, Transportation, and Utilities
Retail Trade Government
Federal Government State Government Local Government
Annual Jan Feb Mar Apr M ay Jun Jul Aug Sep Oct Nov Dec Average
61.9 62.3 62.7 62.3 62.1 61.7 61.3 61.9 61.7 62.1 63.4 63.4 62.2
49.5 49.8 50.3 49.9 49.8 49.5 49.4 49.6 49.5 49.7 51.0 51.0 49.9
7.0
7.1
7.2
7.1
7.1
6.8 6.8
6.9
6.8
6.9
6.7
6.7
6.9
54.9 55.2 55.5 55.2 55.0 54.9 54.5 55.0 54.9 55.2 56.7 56.7 55.3
42.5 42.7 43.1 42.8 42.7 42.7 42.6 42.7 42.7 42.8 44.3 44.3 43.0
12.4 12.4 12.5 12.4 12.4 12.2 12.4 12.5 12.3 12.4 12.7 12.7 12.4
7.7
7.6
7.7
7.6
7.6
7.4 7.5
7.6
7.6
7.6
7.9
7.9
7.6
12.4 12.5 12.4 12.4 12.3 12.2 11.9 12.3 12.2 12.4 12.4 12.4 12.3
2.6
2.6
2.5
2.5
2.5
2.6 2.6
2.6
2.5
2.6
2.6
2.6
2.6
2.5
2.6
2.6
2.6
2.5
2.4 2.4
2.4
2.5
2.5
2.5
2.5
2.5
7.3
7.3
7.3
7.3
7.3
7.2 6.9
7.3
7.2
7.3
7.3
7.3
7.3
Note: These not seasonally adjusted estimates were prepared in cooperation with the U.S. Department of Labor, Bureau of Labor Statistics, based upon monthly reports submitted by selected
employers in the Albany Metropolitan Statistical Area, which includes Baker, Dougherty, Lee, Terrell and Worth counties. The estimates include all full- and part-time wage and salary workers who were employed during or received pay for any part of the pay period that includes the twelfth of the month. Proprietors, domestic workers, self-employed persons, unpaid family workers and personnel of the armed forces are excluded. Estimates based on 2019 benchmark.
Source: Georgia Department of Labor, Workforce Statistics & Economic Research
10
athens-clarke county msa Nonfarm Employment
(In thousands)
Industry Total Nonfarm Total Private Goods Producing Service-Providing Private Service-Providing Trade, Transportation, and Utilities
Retail Trade Professional and Business Services Leisure and Hospitality Government
Federal Government State Government Local Government
(Not Seasonally Adjusted)
2019 Preliminary Series
Annual Jan Feb Mar Apr M ay Jun Jul Aug Sep Oct Nov Dec Average
96.0 96.9 96.4 97.5 96.8 95.5 95.0 95.9 96.6 98.0 98.3 97.8 96.7
67.7 68.5 68.2 69.2 68.7 68.5 68.6 69.0 69.4 70.2 70.4 70.4 69.1
10.0 10.1 10.1 10.2 10.1 10.1 10.1 10.1 10.0 10.0 10.0 10.0 10.1
86.0 86.8 86.3 87.3 86.7 85.4 84.9 85.8 86.6 88.0 88.3 87.8 86.7
57.7 58.4 58.1 59.0 58.6 58.4 58.5 58.9 59.4 60.2 60.4 60.4 59.0
16.2 16.2 16.2 16.3 16.2 16.1 16.3 16.0 16.1 16.2 16.6 16.9 16.3
10.5 10.6 10.5 10.7 10.5 10.4 10.5 10.5 10.6 10.5 10.8 11.0 10.6
8.0
8.1
8.1
8.4
8.2
8.4 8.4
8.4
8.4
8.5
8.5
8.5
8.3
11.3 11.6 11.4 11.7 11.5 11.2 11.1 11.2 11.2 11.3 11.3 11.2 11.3
28.3 28.4 28.2 28.3 28.1 27.0 26.4 26.9 27.2 27.8 27.9 27.4 27.7
1.1
1.1
1.0
1.0
1.0
1.0 1.0
1.0
1.0
1.1
1.2
1.2
1.1
19.2 19.3 19.2 19.2 19.0 18.2 17.9 17.9 18.4 18.7 18.6 18.4 18.7
8.0
8.0
8.0
8.1
8.1
7.8 7.5
8.0
7.8
8.0
8.1
7.8
7.9
(In thousands)
2018 Final Series
Industry
Annual Jan Feb Mar Apr M ay Jun Jul Aug Sep Oct Nov Dec Average
Total Nonfarm Total Private
96.6 97.8 97.9 97.8 97.8 98.1 97.5 98.7 99.6 99.3 99.8 99.1 98.3 67.7 68.8 69.0 68.8 68.3 68.0 68.0 68.7 69.2 69.3 69.8 69.4 68.8
Goods Producing Service-Providing Private Service-Providing
10.1 10.3 10.3 10.3 10.4 10.4 10.2 10.2 10.1 10.0 10.0 10.0 10.2 86.5 87.5 87.6 87.5 87.4 87.7 87.3 88.5 89.5 89.3 89.8 89.1 88.1 57.6 58.5 58.7 58.5 57.9 57.6 57.8 58.5 59.1 59.3 59.8 59.4 58.6
Trade, Transportation, and Utilities Retail Trade
Professional and Business Services
16.6 16.6 16.5 16.5 16.4 16.2 16.3 16.5 16.4 16.5 16.8 16.9 16.5
10.8 11.0 10.9 10.8 10.7 10.5 10.6 10.8 10.8 10.8 11.0 11.0 10.8
8.6
8.7
8.8
8.8
8.5
8.6 8.8
8.8
8.9
8.8
8.8
8.6
8.7
Leisure and Hospitality Government
Federal Government
10.8 11.2 11.1 11.4 11.1 11.0 10.8 11.1 11.3 11.3 11.4 11.0 11.1
28.9 29.0 28.9 29.0 29.5 30.1 29.5 30.0 30.4 30.0 30.0 29.7 29.6
1.2
1.1
1.0
1.0
1.0
1.0 1.0
1.0
1.0
1.1
1.1
1.2
1.1
State Government Local Government
19.8 20.0 20.0 20.0 20.4 21.3 21.0 21.1 21.6 20.8 20.8 20.4 20.6
7.9
7.9
7.9
8.0
8.1
7.8 7.5
7.9
7.8
8.1
8.1
8.1
7.9
Note: These not seasonally adjusted estimates were prepared in cooperation with the U.S. Department of Labor, Bureau of Labor Statistics, based upon monthly reports submitted by selected
employers in the Athens-Clarke County Metropolitan Statistical Area, which includes Clarke, Madison, Oconee and Oglethorpe counties. The estimates include all full- and part-time wage and salary workers who were employed during or received pay for any part of the pay period that includes the twelfth of the month. Proprietors, domestic workers, self-employed persons, unpaid family workers and personnel of the armed forces are excluded. Estimates based on 2019 benchmark.
Source: Georgia Department of Labor, Workforce Statistics & Economic Research
11
atlanta msa Nonfarm Employment
(Not Seasonally Adjusted)
(In thousands)
2019 Preliminary Series
Industry
Annual Jan Feb Mar Apr M ay Jun Jul Aug Sep Oct Nov Dec Average
Total Nonfarm
2804.3 2819.3 2828.3 2828.8 2843.4 2845.4 2838.2 2852.7 2856.0 2878.5 2894.2 2904.0 2849.4
Total Private
2471.8 2484.0 2491.8 2492.3 2506.8 2514.9 2516.6 2519.1 2519.3 2540.4 2555.2 2564.9 2514.8
Goods Producing
297.9 299.8 301.2 302.4 304.2 304.8 305.3 305.0 305.6 305.0 304.8 304.3 303.4
Service-Providing
2506.4 2519.5 2527.1 2526.4 2539.2 2540.6 2532.9 2547.7 2550.4 2573.5 2589.4 2599.7 2546.1
Private Service-Providing
2173.9 2184.2 2190.6 2189.9 2202.6 2210.1 2211.3 2214.1 2213.7 2235.4 2250.4 2260.6 2211.4
Mining and Logging
1.5
1.5
1.5
1.6
1.6
1.6 1.6
1.6
1.6
1.5
1.5
1.5
1.6
Mining, Logging and Construction
128.3 129.5 130.5 130.7 132.3 133.0 132.5 132.0 132.1 132.2 132.1 132.2 131.5
Construction
126.8 128.0 129.0 129.1 130.7 131.4 130.9 130.4 130.5 130.7 130.6 130.7 129.9
Construction of Buildings
28.5 28.6 28.5 28.6 29.1 29.5 29.4 30.2 29.7 30.1 30.1 30.7 29.4
Specialty Trade Contractors
81.3 82.2 83.0 83.0 83.9 84.1 83.7 83.0 83.1 83.2 83.5 83.0 83.1
Manufacturing
169.6 170.3 170.7 171.7 171.9 171.8 172.8 173.0 173.5 172.8 172.7 172.1 171.9
Durable Goods
89.4 89.5 89.8 90.2 90.2 90.1 91.0 91.3 91.9 91.3 91.4 91.7 90.7
Transportation Equipment Manufacturing
15.6 15.7 15.8 15.8 15.7 15.6 15.6 15.7 15.7 15.6 15.6 15.7 15.7
Non-Durable Goods
80.2 80.8 80.9 81.5 81.7 81.7 81.8 81.7 81.6 81.5 81.3 80.4 81.3
Food Manufacturing
22.4 22.6 22.5 23.0 23.0 23.0 23.1 23.2 23.0 23.3 23.4 23.2 23.0
Trade, Transportation, and Utilities
598.7 594.8 596.9 595.9 598.2 600.2 599.7 598.0 599.9 604.6 617.7 623.6 602.4
Wholesale Trade
153.5 154.3 154.3 154.1 154.7 155.5 154.9 155.2 154.8 156.5 156.6 157.1 155.1
Merchant Wholesalers, Durable Goods
83.4 83.9 83.7 83.7 83.9 84.4 83.9 84.7 84.5 85.3 84.7 84.6 84.2
Merchant Wholesalers, Nondurable Goods
41.3 41.6 41.9 41.7 41.9 42.0 42.1 41.5 41.8 41.9 42.7 43.5 42.0
Wholesale Electronic Markets and Agents and Brokers
28.8 28.8 28.7 28.7 28.9 29.1 28.9 29.0 28.5 29.3 29.2 29.0 28.9
Retail Trade
290.4 286.6 287.6 287.9 289.3 289.1 288.1 287.1 286.9 288.6 299.8 303.2 290.4
Food and Beverage Stores
58.0 58.0 57.9 57.2 57.5 57.3 57.3 57.2 57.1 57.6 59.2 59.2 57.8
General Merchandise Stores
59.4 56.6 56.3 56.0 56.9 56.9 57.2 57.1 57.7 58.7 63.2 63.8 58.3
Miscellaneous Store Retailers
14.3 14.5 14.4 14.5 14.7 14.7 14.8 14.7 14.6 15.0 15.0 15.0 14.7
Transportation, Warehousing, and Utilities
154.8 153.9 155.0 153.9 154.2 155.6 156.7 155.7 158.2 159.5 161.3 163.3 156.8
Utilities
10.0 10.0 10.1 10.0 10.1 10.1 10.2 10.1 10.1 10.0 10.1 10.1 10.1
Transportation and Warehousing
144.8 143.9 144.9 143.9 144.1 145.5 146.5 145.6 148.1 149.5 151.2 153.2 146.8
Air Transportation
29.2 29.8 30.1 30.1 29.8 30.2 30.8 29.6 30.2 30.4 30.4 30.2 30.1
Truck Transportation
34.2 34.3 34.4 34.6 35.1 35.5 35.2 35.6 35.4 35.2 35.2 35.2 35.0
Couriers and Messengers
22.5 20.4 20.5 19.1 19.3 19.8 19.8 19.4 21.6 22.0 24.0 25.9 21.2
Information
99.0 101.9 101.8 100.0 99.6 101.5 101.2 101.0 100.0 101.6 103.6 102.0 101.1
Telecommunications
32.9 32.8 32.7 32.1 32.1 32.4 31.6 31.4 31.1 31.8 31.8 31.7 32.0
Wired and Wireless Telecommunications Carriers
28.7 28.6 28.6 28.1 28.1 28.2 27.7 27.5 27.3 27.9 27.7 27.6 28.0
Data Processing, Hosting, and Related Services
12.2 12.4 12.4 12.7 12.7 12.8 12.8 12.8 12.9 13.0 13.1 13.2 12.8
Financial Activities
173.9 174.8 175.3 175.7 176.7 177.3 179.1 179.8 179.1 179.0 178.7 179.2 177.4
Finance and Insurance
121.6 122.1 122.2 122.6 123.0 123.4 125.5 125.8 125.9 126.5 125.6 125.6 124.2
Insurance Carriers and Related Activities
58.9 59.1 59.7 59.9 60.0 60.2 61.3 61.8 61.6 61.9 61.5 61.5 60.6
Real Estate and Rental and Leasing
52.3 52.7 53.1 53.1 53.7 53.9 53.6 54.0 53.2 52.5 53.1 53.6 53.2
Professional and Business Services
542.1 544.9 543.9 543.5 545.5 549.4 548.9 548.1 549.3 555.6 557.6 562.6 549.3
Professional, Scientific, and Technical Services
228.0 229.4 227.8 229.0 227.5 228.3 230.5 229.0 227.5 231.3 234.1 236.5 229.9
Accounting, Tax Prep, and Bookkeeping Services
26.6 27.8 26.8 26.7 24.7 25.4 25.8 26.3 26.0 26.6 25.9 26.9 26.3
Architectural, Engineering, and Related Services
32.5 32.7 32.8 32.7 33.1 33.4 33.9 33.4 33.8 34.2 34.2 34.0 33.4
Computer Systems Design and Related Services
61.9 62.1 61.3 62.3 62.3 61.6 62.9 63.6 61.9 62.8 64.7 65.0 62.7
Management and Technical Consulting Services
41.5 41.0 41.0 41.2 41.3 41.5 41.8 41.0 40.5 41.3 42.5 43.3 41.5
Management of Companies and Enterprises
78.3 78.9 79.3 78.6 78.7 79.4 78.7 78.3 79.1 78.5 78.1 79.3 78.8
Admin and Support, Waste Mngmnt and Remediation
235.8 236.6 236.8 235.9 239.3 241.7 239.7 240.8 242.7 245.8 245.4 246.8 240.6
Employment Services
117.4 117.2 117.3 117.0 118.8 120.6 118.1 120.0 123.5 127.1 128.5 128.1 121.1
Education and Health Services
365.6 368.9 369.1 367.9 368.9 364.7 365.2 370.7 374.4 379.3 381.6 384.1 371.7
Educational Services
64.9 66.1 66.6 66.6 66.2 64.6 64.1 65.3 67.9 69.6 70.2 69.2 66.8
Health Care and Social Assistance
300.7 302.8 302.5 301.3 302.7 300.1 301.1 305.4 306.5 309.7 311.4 314.9 304.9
Ambulatory Health Care Services
132.8 134.5 134.7 135.0 135.6 135.3 136.8 137.3 136.8 138.1 137.5 140.2 136.2
Hospitals
92.0 91.2 90.8 89.6 90.1 90.5 90.6 92.1 91.6 93.3 93.9 93.6 91.6
Social Assistance
46.8 47.7 47.6 47.1 47.4 45.0 44.6 46.2 46.9 47.9 48.9 49.2 47.1
Leisure and Hospitality
292.9 296.5 300.7 302.8 309.9 312.2 311.9 311.1 306.3 310.8 306.4 303.5 305.4
Arts, Entertainment, and Recreation
35.5 36.4 37.7 40.1 42.9 45.2 45.2 43.0 42.0 42.6 38.9 36.8 40.5
Accommodation and Food Services
257.4 260.1 263.0 262.7 267.0 267.0 266.7 268.1 264.3 268.2 267.5 266.7 264.9
Accommodation
25.8 26.1 26.5 26.6 27.0 27.1 26.7 26.9 26.8 26.8 26.7 27.0 26.7
Food Services and Drinking Places
231.6 234.0 236.5 236.1 240.0 239.9 240.0 241.2 237.5 241.4 240.8 239.7 238.2
Other Services
101.7 102.4 102.9 104.1 103.8 104.8 105.3 105.4 104.7 104.5 104.8 105.6 104.2
Repair and Maintenance
24.3 24.6 24.6 24.6 24.6 24.8 25.4 25.1 25.1 25.6 25.3 25.0 24.9
Personal and Laundry Services
27.7 27.9 28.2 29.0 28.6 28.7 28.7 28.7 28.1 28.1 28.8 29.0 28.5
Government
332.5 335.3 336.5 336.5 336.6 330.5 321.6 333.6 336.7 338.1 339.0 339.1 334.7
Federal Government
46.4 46.9 46.8 47.1 46.9 47.0 47.2 47.9 47.9 47.7 48.0 48.5 47.4
State Government
73.1 74.0 74.5 74.7 74.4 70.5 69.6 71.8 73.6 74.4 74.5 74.2 73.3
Local Government
213.0 214.4 215.2 214.7 215.3 213.0 204.8 213.9 215.2 216.0 216.5 216.4 214.0
Note: These not seasonally adjusted estimates were prepared in cooperation with the U.S. Department of Labor, Bureau of Labor Statistics, based upon monthly reports submitted
by selected employers in the Atlanta Metropolitan Statistical Area, which includes Barrow, Bartow, Butts, Carroll, Cherokee, Clayton, Cobb, Coweta, Dawson, DeKalb, Douglas, Fayette, Forsyth, Fulton, Gwinnett, Haralson, Heard, Henry, Jasper, Lamer, Meriwether, Morgan, Newton, Paulding, Pickens, Pike, Rockdale, Spalding and Walton counties. The estimates include all full- and part-time wage and salary workers who were employed during or received pay for any part of the pay period that includes the twelfth of the month. Proprietors, domestic workers, self-employed persons, unpaid family workers and personnel of the armed forces are excluded. Estimates based on 2019 benchmark.
Source: Georgia Department of Labor, Workforce Statistics & Economic Research
12
atlanta msa Nonfarm Employment
(Not Seasonally Adjusted)
(In thousands)
2018 Final Series
Industry
Annual Jan Feb Mar Apr M ay Jun Jul Aug Sep Oct Nov Dec Average
Total Nonfarm
2725.2 2742.8 2758.9 2764.1 2779.8 2785.1 2780.2 2803.7 2797.2 2817.4 2837.8 2834.9 2785.6
Total Private
2393.2 2408.3 2423.7 2429.1 2443.2 2454.2 2459.2 2470.9 2462.1 2480.8 2499.0 2496.9 2451.7
Goods Producing
287.2 290.3 292.5 292.3 294.1 296.5 297.1 298.1 298.7 300.3 299.1 300.8 295.6
Service-Providing
2438.0 2452.5 2466.4 2471.8 2485.7 2488.6 2483.1 2505.6 2498.5 2517.1 2538.7 2534.1 2490.0
Private Service-Providing
2106.0 2118.0 2131.2 2136.8 2149.1 2157.7 2162.1 2172.8 2163.4 2180.5 2199.9 2196.1 2156.1
Mining and Logging
1.7
1.7
1.7
1.6
1.7
1.7 1.6
1.6
1.6
1.5
1.5
1.5
1.6
Mining, Logging and Construction
120.8 122.9 124.7 125.4 126.6 128.1 128.5 129.0 129.4 129.9 128.4 129.3 126.9
Construction
119.1 121.2 123.0 123.8 124.9 126.4 126.9 127.4 127.8 128.4 126.9 127.8 125.3
Construction of Buildings
26.8 27.3 27.3 27.7 27.8 28.5 28.5 28.6 28.5 28.6 28.5 28.6 28.1
Specialty Trade Contractors
76.3 77.4 79.2 79.3 80.1 80.7 81.4 81.6 81.8 82.4 81.5 82.1 80.3
Manufacturing
166.4 167.4 167.8 166.9 167.5 168.4 168.6 169.1 169.3 170.4 170.7 171.5 168.7
Durable Goods
87.2 87.7 88.1 88.0 88.3 88.9 89.0 89.4 89.4 89.3 89.3 90.0 88.7
Transportation Equipment Manufacturing
15.5 15.6 15.6 15.6 15.5 15.7 15.6 15.8 15.8 15.7 15.8 16.0 15.7
Non-Durable Goods
79.2 79.7 79.7 78.9 79.2 79.5 79.6 79.7 79.9 81.1 81.4 81.5 80.0
Food Manufacturing
22.8 22.8 22.6 22.2 22.2 22.2 22.4 22.5 22.6 22.7 23.0 22.9 22.6
Trade, Transportation, and Utilities
581.9 581.4 583.4 585.0 587.3 588.8 590.1 589.9 589.4 595.1 612.4 616.3 591.8
Wholesale Trade
149.8 150.7 150.8 151.0 151.5 152.5 153.2 152.5 152.5 153.7 154.4 154.9 152.3
Merchant Wholesalers, Durable Goods
81.0 81.5 81.6 81.6 81.7 82.4 83.0 82.8 82.8 83.4 83.6 84.0 82.5
Merchant Wholesalers, Nondurable Goods
40.1 40.3 40.4 40.8 41.1 41.2 41.5 41.5 41.7 41.9 42.3 42.3 41.3
Wholesale Electronic Markets and Agents and Brokers
28.7 28.9 28.8 28.6 28.7 28.9 28.7 28.2 28.0 28.4 28.5 28.6 28.6
Retail Trade
289.8 287.9 288.9 289.0 290.1 289.3 290.3 289.1 288.2 290.2 301.6 302.2 291.4
Food and Beverage Stores
56.8 57.1 57.1 56.6 56.7 56.6 57.0 56.8 56.5 57.0 58.7 59.0 57.2
General Merchandise Stores
59.1 57.8 57.2 57.4 58.1 58.1 58.8 59.2 59.0 59.0 64.0 63.5 59.3
Miscellaneous Store Retailers
14.3 14.4 14.2 14.3 14.3 14.5 14.6 14.6 14.4 14.8 14.7 14.6 14.5
Transportation, Warehousing, and Utilities
142.3 142.8 143.7 145.0 145.7 147.0 146.6 148.3 148.7 151.2 156.4 159.2 148.1
Utilities
10.0
9.9
9.9 10.0 10.1 10.0 10.0 10.0 10.0
9.8
9.9
9.9 10.0
Transportation and Warehousing
132.3 132.9 133.8 135.0 135.6 137.0 136.6 138.3 138.7 141.4 146.5 149.3 138.1
Air Transportation
27.8 29.0 29.4 30.4 30.0 30.2 29.1 29.8 28.0 29.0 29.3 29.3 29.3
Truck Transportation
32.8 32.9 33.2 33.3 33.8 34.4 34.3 34.3 34.2 34.4 34.3 34.4 33.9
Couriers and Messengers
17.9 16.9 17.0 16.7 17.0 17.5 17.5 17.5 19.0 19.6 22.9 26.3 18.8
Information
98.8 99.7 97.6 98.0 97.8 97.9 97.8 99.6 99.8 102.2 102.3 98.6 99.2
Telecommunications
35.5 35.2 34.9 34.5 34.2 34.2 33.9 33.5 33.4 33.0 32.8 32.8 34.0
Wired and Wireless Telecommunications Carriers
31.1 30.9 30.6 30.4 30.2 30.1 29.9 29.6 29.4 29.1 29.0 28.9 29.9
Data Processing, Hosting, and Related Services
11.7 11.9 12.0 12.2 12.2 12.0 12.0 12.0 12.4 12.2 12.0 12.2 12.1
Financial Activities
169.7 171.2 171.4 171.8 172.2 173.3 173.9 173.8 173.5 174.6 176.7 175.0 173.1
Finance and Insurance
121.0 121.6 121.6 121.6 121.4 122.2 122.6 122.3 121.8 122.5 124.4 122.3 122.1
Insurance Carriers and Related Activities
58.0 58.1 58.3 58.3 58.1 58.5 59.0 59.0 59.0 59.2 61.2 59.1 58.8
Real Estate and Rental and Leasing
48.7 49.6 49.8 50.2 50.8 51.1 51.3 51.5 51.7 52.1 52.3 52.7 51.0
Professional and Business Services
524.9 528.6 533.0 532.4 532.6 535.6 537.4 542.4 540.1 545.6 548.1 545.5 537.2
Professional, Scientific, and Technical Services
220.9 223.1 223.1 224.0 223.1 224.7 226.1 226.0 224.1 228.6 229.8 229.6 225.3
Accounting, Tax Prep, and Bookkeeping Services
27.8 28.6 28.5 28.2 25.9 25.9 26.0 25.7 25.2 25.7 25.8 26.4 26.6
Architectural, Engineering, and Related Services
31.4 31.6 31.7 31.6 32.0 32.6 32.9 32.8 32.8 32.8 32.8 32.8 32.3
Computer Systems Design and Related Services
60.0 60.4 59.9 60.9 61.1 60.5 61.6 61.9 60.9 62.6 62.8 61.8 61.2
Management and Technical Consulting Services
39.1 39.3 39.5 39.8 40.2 41.0 40.6 40.6 40.5 41.7 42.5 42.6 40.6
Management of Companies and Enterprises
76.5 76.8 76.9 77.4 77.4 78.0 78.3 77.7 78.1 77.9 77.5 77.7 77.5
Admin and Support, Waste Mngmnt and Remediation
227.5 228.7 233.0 231.0 232.1 232.9 233.0 238.7 237.9 239.1 240.8 238.2 234.4
Employment Services
112.1 113.5 115.6 112.2 112.6 113.3 114.1 118.3 119.0 119.6 122.8 122.2 116.3
Education and Health Services
349.5 352.2 353.6 353.8 355.2 351.7 353.1 359.6 359.5 362.7 363.8 363.6 356.5
Educational Services
62.4 64.0 64.2 64.4 64.3 62.0 61.4 63.1 64.1 65.4 65.5 64.9 63.8
Health Care and Social Assistance
287.1 288.2 289.4 289.4 290.9 289.7 291.7 296.5 295.4 297.3 298.3 298.7 292.7
Ambulatory Health Care Services
122.5 124.0 124.7 125.6 126.8 127.7 129.0 130.3 131.5 132.6 133.3 134.4 128.5
Hospitals
91.2 90.1 90.3 89.2 89.1 89.1 90.9 92.1 90.0 89.2 89.4 88.9 90.0
Social Assistance
44.1 44.9 45.0 45.5 45.6 43.4 42.4 44.8 44.5 46.2 46.7 46.5 45.0
Leisure and Hospitality
284.0 286.9 293.5 296.1 302.9 307.8 306.8 305.0 299.1 297.8 295.5 296.2 297.6
Arts, Entertainment, and Recreation
32.8 33.9 35.6 37.4 40.8 44.0 43.0 41.0 38.6 38.8 36.8 36.7 38.3
Accommodation and Food Services
251.2 253.0 257.9 258.7 262.1 263.8 263.8 264.0 260.5 259.0 258.7 259.5 259.4
Accommodation
25.1 25.6 25.9 26.0 26.3 26.6 26.3 26.3 26.2 25.9 25.7 25.8 26.0
Food Services and Drinking Places
226.1 227.4 232.0 232.7 235.8 237.2 237.5 237.7 234.3 233.1 233.0 233.7 233.4
Other Services
97.2 98.0 98.7 99.7 101.1 102.6 103.0 102.5 102.0 102.5 101.1 100.9 100.8
Repair and Maintenance
23.3 23.8 24.0 23.8 24.2 24.1 24.2 24.1 24.2 24.0 23.7 23.7 23.9
Personal and Laundry Services
26.8 27.0 27.4 27.6 27.9 27.9 28.0 27.9 27.8 28.0 27.7 27.7 27.6
Government
332.0 334.5 335.2 335.0 336.6 330.9 321.0 332.8 335.1 336.6 338.8 338.0 333.9
Federal Government
46.9 46.7 46.5 46.5 46.4 46.5 46.6 46.6 46.8 46.8 47.3 47.7 46.8
State Government
73.7 74.2 74.6 74.9 74.7 71.1 70.5 73.8 74.4 75.1 75.0 74.7 73.9
Local Government
211.4 213.6 214.1 213.6 215.5 213.3 203.9 212.4 213.9 214.7 216.5 215.6 213.2
Note: These not seasonally adjusted estimates were prepared in cooperation with the U.S. Department of Labor, Bureau of Labor Statistics, based upon monthly reports submitted
by selected employers in the Atlanta Metropolitan Statistical Area, which includes Barrow, Bartow, Butts, Carroll, Cherokee, Clayton, Cobb, Coweta, Dawson, DeKalb, Douglas, Fayette, Forsyth, Fulton, Gwinnett, Haralson, Heard, Henry, Jasper, Lamer, Meriwether, Morgan, Newton, Paulding, Pickens, Pike, Rockdale, Spalding and Walton counties. The estimates include all full- and part-time wage and salary workers who were employed during or received pay for any part of the pay period that includes the twelfth of the month. Proprietors, domestic workers, self-employed persons, unpaid family workers and personnel of the armed forces are excluded. Estimates based on 2019 benchmark.
Source: Georgia Department of Labor, Workforce Statistics & Economic Research
13
augusta-richmond county msa Nonfarm Employment
(In thousands)
Industry Total Nonfarm Total Private Goods Producing Service-Providing Private Service-Providing Mining, Logging and Construction Manufacturing Trade, Transportation, and Utilities
Wholesale Trade Retail Trade Transportation, Warehousing, and Utilities Information Financial Activities Professional and Business Services Education and Health Services Leisure and Hospitality Other Services Government Federal Government State Government Local Government
(Not Seasonally Adjusted)
2019 Preliminary Series
J an
240.3 193.5
42.2 198.1 151.3
19.8 22.4 40.1
5.8 26.5
7.8 2.4 6.6 33.2 34.8 25.9 8.3 46.8 9.7 15.7 21.4
Feb
241.0 194.0
42.0 199.0 152.0
19.4 22.6 39.8
5.8 26.3
7.7 2.5 6.7 33.2 35.1 26.3 8.4 47.0 9.7 15.8 21.5
M ar
242.8 195.9
42.1 200.7 153.8
19.4 22.7 40.0
5.8 26.5
7.7 2.4 6.7 33.3 35.0 27.9 8.5 46.9 9.7 15.7 21.5
Apr
246.0 199.5
41.8 204.2 157.7
19.1 22.7 39.7
5.7 26.3
7.7 2.5 6.6 33.7 35.1 31.6 8.5 46.5 9.7 15.4 21.4
M ay
243.4 196.9
42.1 201.3 154.8
19.2 22.9 40.1
5.8 26.5
7.8 2.4 6.6 33.5 35.3 28.4 8.5 46.5 9.8 15.3 21.4
Jun
242.6 197.0
43.2 199.4 153.8
20.1 23.1 39.9
5.7 26.4
7.8 2.4 6.6 33.4 35.0 27.8 8.7 45.6 9.7 14.7 21.2
Jul
240.3 196.3
43.0 197.3 153.3
20.0 23.0 40.2
5.7 26.6
7.9 2.4 6.7 33.2 34.8 27.3 8.7 44.0 9.8 14.5 19.7
Aug
242.2 197.1
43.5 198.7 153.6
20.4 23.1 39.8
5.7 26.2
7.9 2.4 6.7 33.3 35.0 27.7 8.7 45.1 9.9 14.8 20.4
Sep
241.4 195.5
43.6 197.8 151.9
20.4 23.2 39.7
5.7 26.2
7.8 2.4 6.6 33.0 35.1 26.5 8.6 45.9 9.8 15.2 20.9
Oct
243.4 197.2
43.4 200.0 153.8
20.4 23.0 39.9
5.8 26.2
7.9 2.4 6.6 33.2 35.7 27.4 8.6 46.2 9.8 15.2 21.2
Nov
244.2 197.9
43.7 200.5 154.2
20.5 23.2 40.5
5.8 26.6
8.1 2.4 6.6 32.8 36.1 27.2 8.6 46.3 9.9 15.3 21.1
Annual Dec Average
244.2 197.9
43.9 200.3 154.0
20.8 23.1 40.7
5.8 26.8
8.1 2.4 6.7 32.7 36.1 26.8 8.6 46.3 9.9 15.1 21.3
242.7 196.6
42.9 199.8 153.7
20.0 22.9 40.0
5.8 26.4
7.9 2.4 6.6 33.2 35.3 27.6 8.6 46.1 9.8 15.2 21.1
(In thousands)
2018 Final Series
Industry
Total Nonfarm Total Private Goods Producing Service-Providing Private Service-Providing Mining, Logging and Construction Manufacturing Trade, Transportation, and Utilities
Wholesale Trade Retail Trade Transportation, Warehousing, and Utilities Information Financial Activities Professional and Business Services Education and Health Services Leisure and Hospitality Other Services Government Federal Government State Government Local Government
J an
238.2 190.9
39.2 199.0 151.7
17.7 21.5 39.8
5.6 26.7
7.5 2.5 6.3 36.0 33.5 25.4 8.2 47.3 9.4 15.9 22.0
Feb
239.5 192.0
39.9 199.6 152.1
18.3 21.6 39.7
5.6 26.6
7.5 2.5 6.3 35.7 33.8 25.9 8.2 47.5 9.4 16.0 22.1
M ar
241.0 193.4
40.4 200.6 153.0
18.7 21.7 39.9
5.6 26.8
7.5 2.5 6.4 35.7 33.7 26.5 8.3 47.6 9.4 16.0 22.2
Apr
245.3 197.7
40.1 205.2 157.6
18.3 21.8 39.8
5.6 26.7
7.5 2.5 6.5 35.7 33.8 30.9 8.4 47.6 9.5 16.0 22.1
M ay
241.0 193.5
40.3 200.7 153.2
18.4 21.9 40.0
5.6 26.9
7.5 2.5 6.5 34.8 33.7 27.3 8.4 47.5 9.5 15.8 22.2
Jun
240.8 193.9
41.0 199.8 152.9
18.8 22.2 40.1
5.6 26.8
7.7 2.5 6.5 34.6 33.8 26.9 8.5 46.9 9.6 15.5 21.8
Jul
238.0 192.9
40.9 197.1 152.0
19.0 21.9 40.0
5.5 26.7
7.8 2.5 6.6 34.2 33.6 26.7 8.4 45.1 9.5 15.1 20.5
Aug
239.6 193.3
41.1 198.5 152.2
19.0 22.1 39.7
5.5 26.5
7.7 2.6 6.6 34.2 34.2 26.5 8.4 46.3 9.6 15.7 21.0
Sep
239.4 192.4
40.8 198.6 151.6
18.6 22.2 39.5
5.5 26.3
7.7 2.5 6.6 34.1 34.4 26.2 8.3 47.0 9.6 16.1 21.3
Oct
240.9 193.6
41.1 199.8 152.5
18.9 22.2 39.8
5.6 26.4
7.8 2.5 6.6 34.6 34.5 26.2 8.3 47.3 9.7 16.1 21.5
Nov
242.0 194.9
41.3 200.7 153.6
19.0 22.3 40.9
5.5 27.5
7.9 2.5 6.7 34.2 34.7 26.3 8.3 47.1 9.7 15.9 21.5
Annual Dec Average
243.2 196.0
42.0 201.2 154.0
19.7 22.3 41.1
5.4 27.4
8.3 2.5 6.8 34.4 34.7 26.2 8.3 47.2 9.7 15.8 21.7
240.7 193.7
40.7 200.1 153.0
18.7 22.0 40.0
5.6 26.8
7.7 2.5 6.5 34.9 34.0 26.8 8.3 47.0 9.6 15.8 21.7
Note: These not seasonally adjusted estimates were prepared in cooperation with the U.S. Department of Labor, Bureau of Labor Statistics, based upon monthly reports submitted
by selected employers in the Augusta-Richmond County Metropolitan Statistical Area, which includes Burke, Columbia, Lincoln, McDuffie and Richmond counties in Georgia and Aiken and Edgefield counties in South Carolina. The estimates include all full- and part-time wage and salary workers who were employed during or received pay for any part of the pay period that includes the twelfth of the month. Proprietors, domestic workers, self-employed persons, unpaid family workers and personnel of the armed forces are excluded. Estimates based on 2019 benchmark.
Source: Georgia Department of Labor, Workforce Statistics & Economic Research
14
(In thousands)
Industry Total Nonfarm Total Private Goods Producing Service-Providing Private Service-Providing Trade, Transportation, and Utilities
Retail Trade Government
Federal Government State Government Local Government
brunswick msa Nonfarm Employment
(Not Seasonally Adjusted)
2019 Preliminary Series
Annual Jan Feb Mar Apr M ay Jun Jul Aug Sep Oct Nov Dec Average
43.7 44.0 44.1 44.8 45.2 45.4 45.2 45.5 44.7 44.7 44.9 44.7 44.7
35.2 35.3 35.5 36.0 36.3 36.6 36.6 36.6 35.7 35.6 35.8 35.7 35.9
4.1
4.2
4.1
4.1
4.1
4.1 4.0
4.1
4.0
4.0
4.0
4.1
4.1
39.6 39.8 40.0 40.7 41.1 41.3 41.2 41.4 40.7 40.7 40.9 40.6 40.7
31.1 31.1 31.4 31.9 32.2 32.5 32.6 32.5 31.7 31.6 31.8 31.6 31.8
9.2
9.1
9.1
9.2
9.3
9.3 9.3
9.4
9.4
9.2
9.4
9.7
9.3
5.5
5.6
5.6
5.6
5.6
5.6 5.6
5.6
5.6
5.6
5.8
5.8
5.6
8.5
8.7
8.6
8.8
8.9
8.8 8.6
8.9
9.0
9.1
9.1
9.0
8.8
2.0
2.0
2.0
2.0
2.0
2.0 2.0
2.0
2.0
2.1
2.1
2.0
2.0
1.7
1.8
1.8
1.8
1.8
1.8 1.8
1.8
1.8
1.8
1.8
1.8
1.8
4.8
4.9
4.8
5.0
5.1
5.0 4.8
5.1
5.2
5.2
5.2
5.2
5.0
(In thousands)
2018 Final Series
Industry
Annual Jan Feb Mar Apr M ay Jun Jul Aug Sep Oct Nov Dec Average
Total Nonfarm
43.5 44.0 44.5 44.9 45.2 45.7 45.2 45.2 44.9 44.7 44.9 44.6 44.8
Total Private
35.1 35.5 36.0 36.4 36.6 36.9 36.8 36.6 36.3 36.1 36.2 35.9 36.2
Goods Producing
4.1
4.1
4.1
4.2
4.2
4.2 4.2
4.1
4.1
4.2
4.2
4.2
4.2
Service-Providing
39.4 39.9 40.4 40.7 41.0 41.5 41.0 41.1 40.8 40.5 40.7 40.4 40.6
Private Service-Providing
31.0 31.4 31.9 32.2 32.4 32.7 32.6 32.5 32.2 31.9 32.0 31.7 32.0
Trade, Transportation, and Utilities
9.0
9.2
9.3
9.4
9.4
9.5 9.6
9.6
9.5
9.5
9.7
9.7
9.5
Retail Trade
5.7
5.7
5.7
5.7
5.8
5.8 5.8
5.7
5.7
5.7
5.8
5.8
5.7
Government
8.4
8.5
8.5
8.5
8.6
8.8 8.4
8.6
8.6
8.6
8.7
8.7
8.6
Federal Government
1.9
1.9
1.9
1.9
1.9
2.0 2.0
2.0
1.9
2.0
2.0
2.0
2.0
State Government
1.7
1.8
1.8
1.8
1.9
1.9 1.8
1.8
1.9
1.8
1.8
1.8
1.8
Local Government
4.8
4.8
4.8
4.8
4.8
4.9 4.6
4.8
4.8
4.8
4.9
4.9
4.8
Note: These not seasonally adjusted estimates were prepared in cooperation with the U.S. Department of Labor, Bureau of Labor Statistics, based upon monthly reports submitted by selected
employers in the Brunswick Metropolitan Statistical Area, which includes Brantley, Glynn and McIntosh counties. The estimates include all full- and part-time wage and salary workers who were employed during or received pay for any part of the pay period that includes the twelfth of the month. Proprietors, domestic workers, self-employed persons, unpaid family workers and personnel of the armed forces are excluded. Estimates based on 2019 benchmark.
Source: Georgia Department of Labor, Workforce Statistics & Economic Research
15
(In thousands)
Industry Total Nonfarm Total Private Goods Producing Service-Providing Private Service-Providing Mining, Logging and Construction Manufacturing Trade, Transportation, and Utilities
Wholesale Trade Retail Trade Transportation, Warehousing, and Utilities Information Financial Activities Finance and Insurance
Insurance Carriers and Related Activities Professional and Business Services Education and Health Services Leisure and Hospitality Other Services Government
Federal Government State Government Local Government
columbus msa Nonfarm Employment
(Not Seasonally Adjusted)
2019 Preliminary Series
J an 121.9
97.6 15.9 106.0 81.7
4.7 11.2 18.1 2.6 12.8 2.7 1.3 13.0 11.0 3.9 14.8 15.8 14.4 4.3 24.3 6.7 4.2 13.4
Feb 122.6
98.0 15.9 106.7 82.1
4.8 11.1 18.1 2.7 12.7 2.7 1.3 13.0 11.1 3.9 14.8 15.9 14.7 4.3 24.6 6.7 4.5 13.4
M ar 123.2
98.6 16.1 107.1 82.5
5.0 11.1 18.0 2.6 12.7 2.7 1.3 13.0 11.0 3.9 15.1 15.9 14.9 4.3 24.6 6.7 4.5 13.4
Apr 122.9
98.4 15.5 107.4 82.9
4.6 10.9 18.1
2.6 12.7
2.8 1.3 12.8 10.8 3.9 15.2 16.1 15.1 4.3 24.5 6.7 4.4 13.4
M ay 123.5
98.9 15.7 107.8 83.2
4.8 10.9 18.0
2.6 12.6
2.8 1.3 12.9 10.9 3.9 15.1 16.2 15.3 4.4 24.6 6.7 4.5 13.4
Jun 122.4
98.8 15.7 106.7 83.1
4.8 10.9 18.0
2.6 12.6
2.8 1.3 12.9 10.9 3.9 14.9 16.1 15.4 4.5 23.6 6.6 4.1 12.9
Jul 121.0
98.3 15.6 105.4 82.7
4.8 10.8 18.1
2.6 12.7
2.8 1.3 13.0 11.0 3.9 14.5 16.0 15.3 4.5 22.7 6.6 4.0 12.1
Aug 121.6
98.7 15.7 105.9 83.0
4.9 10.8 18.1
2.6 12.7
2.8 1.3 13.0 11.0 3.9 14.6 16.2 15.3 4.5 22.9 6.7 4.1 12.1
Sep 121.4
98.2 15.7 105.7 82.5
4.9 10.8 17.9
2.6 12.5
2.8 1.3 12.9 11.0 3.9 14.6 16.3 15.1 4.4 23.2 6.6 4.4 12.2
Oct 122.5
99.2 15.7 106.8 83.5
5.0 10.7 18.3
2.7 12.7
2.9 1.3 12.9 11.0 4.0 15.0 16.4 15.2 4.4 23.3 6.5 4.4 12.4
Nov 123.2
99.7 15.5 107.7 84.2
4.8 10.7 18.5
2.7 12.9
2.9 1.3 12.9 11.0 4.0 15.3 16.5 15.3 4.4 23.5 6.6 4.4 12.5
Annual Dec Average
122.8 122.4
99.4 98.7
15.6 15.7
107.2 106.7
83.8 82.9
4.9
4.8
10.7 10.9
18.5 18.1
2.7
2.6
12.9 12.7
2.9
2.8
1.3
1.3
12.9 12.9
11.0 11.0
4.0
3.9
15.0 14.9
16.5 16.2
15.2 15.1
4.4
4.4
23.4 23.8
6.5
6.6
4.4
4.3
12.5 12.8
(In thousands)
2018 Final Series
Industry Total Nonfarm Total Private Goods Producing Service-Providing Private Service-Providing Mining, Logging and Construction Manufacturing Trade, Transportation, and Utilities
Wholesale Trade Retail Trade Transportation, Warehousing, and Utilities Information Financial Activities Finance and Insurance
Insurance Carriers and Related Activities Professional and Business Services Education and Health Services Leisure and Hospitality Other Services Government
Federal Government State Government Local Government
J an 120.7
96.4 15.4 105.3 81.0
4.6 10.8 18.1 2.8 13.0
2.3 1.3 13.0 11.0 4.3 14.3 15.6 14.4 4.3 24.3 6.6 4.4 13.3
Feb 121.3
96.8 15.5 105.8 81.3
4.6 10.9 18.1 2.8 13.0
2.3 1.3 13.1 11.1 4.3 14.4 15.7 14.4 4.3 24.5 6.6 4.6 13.3
M ar 122.4
97.7 15.7 106.7 82.0
4.7 11.0 18.0 2.7 13.0 2.3 1.3 13.2 11.2 4.3 14.6 15.7 14.8 4.4 24.7 6.6 4.7 13.4
Apr 122.0
97.3 15.6 106.4 81.7
4.7 10.9 18.1
2.7 13.0
2.4 1.3 13.2 11.1 4.3 14.3 15.7 14.8 4.3 24.7 6.6 4.6 13.5
M ay 122.7
97.9 15.6 107.1 82.3
4.7 10.9 18.4
2.7 13.2
2.5 1.3 13.2 11.2 4.3 14.3 15.6 15.1 4.4 24.8 6.7 4.6 13.5
Jun 123.1
98.9 15.9 107.2 83.0
4.8 11.1 18.3 2.7 13.1 2.5 1.3 13.3 11.3 4.3 14.6 15.6 15.4 4.5 24.2 6.6 4.3 13.3
Jul 121.7
98.3 15.9 105.8 82.4
4.8 11.1 18.4 2.8 13.0 2.6 1.3 13.2 11.3 4.3 14.4 15.7 15.0 4.4 23.4 6.6 4.2 12.6
Aug 122.5
98.3 15.9 106.6 82.4
4.8 11.1 18.3 2.7 13.0 2.6 1.3 13.3 11.3 4.3 14.5 15.7 15.0 4.3 24.2 6.7 4.4 13.1
Sep 122.6
98.1 16.0 106.6 82.1
4.9 11.1 18.2 2.7 12.9 2.6 1.3 13.3 11.4 4.3 14.6 15.7 14.7 4.3 24.5 6.7 4.6 13.2
Oct 122.9
98.2 16.0 106.9 82.2
4.8 11.2 18.2 2.6 12.9 2.7 1.4 13.2 11.4 4.3 14.8 15.6 14.7 4.3 24.7 6.7 4.5 13.5
Nov 123.9
98.9 15.9 108.0 83.0
4.7 11.2 18.8 2.6 13.5 2.7 1.3 13.2 11.4 4.3 15.0 15.7 14.7 4.3 25.0 6.8 4.4 13.8
Annual Dec Average
123.9 122.5
99.1 98.0
16.1 15.8
107.8 106.7
83.0 82.2
4.7
4.7
11.4 11.1
18.8 18.3
2.6
2.7
13.4 13.1
2.8
2.5
1.3
1.3
13.2 13.2
11.4 11.3
4.3
4.3
15.0 14.6
15.6 15.7
14.8 14.8
4.3
4.3
24.8 24.5
6.7
6.7
4.4
4.5
13.7 13.4
Note: These not seasonally adjusted estimates were prepared in cooperation with the U.S. Department of Labor, Bureau of Labor Statistics, based upon monthly reports submitted by selected
employers in the Columbus Metropolitan Statistical Area, which includes Chattahoochee, Harris, Marion and Muscogee counties in Georgia and Russell County in Alabama. The estimates include all full- and part-time wage and salary workers who were employed during or received pay for any part of the pay period that includes the twelfth of the month. Proprietors, domestic workers, selfemployed persons, unpaid family workers and personnel of the armed forces are excluded. Estimates based on 2019 benchmark.
16
Source: Georgia Department of Labor, Workforce Statistics & Economic Research
(In thousands)
Industry Total Nonfarm Total Private Goods Producing Service-Providing Private Service-Providing Manufacturing
Textile Mills Textile Product Mills Trade, Transportation, and Utilities Retail Trade Transportation, Warehousing, and Utilities Professional and Business Services Government Federal Government State Government Local Government
dalton msa Nonfarm Employment
(Not Seasonally Adjusted)
2019 Preliminary Series
Annual Jan Feb Mar Apr M ay Jun Jul Aug Sep Oct Nov Dec Average
66.2 66.2 66.6 66.8 66.5 66.4 66.2 66.4 66.3 66.2 66.1 66.3 66.4
59.4 59.3 59.7 59.6 59.4 59.6 59.4 59.5 59.3 59.2 59.1 59.3 59.4
25.7 25.5 25.7 25.6 25.6 25.6 25.5 25.4 25.4 25.2 25.1 25.1 25.5
40.5 40.7 40.9 41.2 40.9 40.8 40.7 41.0 40.9 41.0 41.0 41.2 40.9
33.7 33.8 34.0 34.0 33.8 34.0 33.9 34.1 33.9 34.0 34.0 34.2 34.0
24.3 24.1 24.2 24.1 24.1 24.0 24.0 24.0 24.0 23.8 23.7 23.7 24.0
4.4
4.3
4.3
4.3
4.1
3.9 3.9
3.9
3.9
3.9
3.8
3.8
4.0
14.1 14.0 14.0 14.1 14.2 14.3 14.2 14.1 14.1 13.9 13.9 13.8 14.1
13.5 13.4 13.4 13.4 13.3 13.2 13.1 13.1 13.1 13.1 13.1 13.2 13.2
6.0
6.0
6.1
6.0
6.0
6.0 6.0
6.0
6.0
6.0
6.1
6.1
6.0
3.3
3.2
3.2
3.2
3.2
3.1 3.1
3.1
3.1
3.1
3.2
3.2
3.2
6.4
6.6
6.7
6.6
6.5
6.7 6.7
6.7
6.7
6.7
6.7
6.7
6.6
6.8
6.9
6.9
7.2
7.1
6.8 6.8
6.9
7.0
7.0
7.0
7.0
7.0
0.2
0.2
0.2
0.3
0.3
0.2 0.2
0.3
0.3
0.3
0.3
0.3
0.3
1.0
1.1
1.1
1.1
1.1
1.0 1.0
1.0
1.1
1.1
1.1
1.1
1.1
5.6
5.6
5.6
5.8
5.7
5.6 5.6
5.6
5.6
5.6
5.6
5.6
5.6
(In thousands)
2018 Final Series
Industry Total Nonfarm Total Private Goods Producing Service-Providing Private Service-Providing Manufacturing
Textile Mills Textile Product Mills Trade, Transportation, and Utilities Retail Trade Transportation, Warehousing, and Utilities Professional and Business Services Government Federal Government State Government Local Government
Annual Jan Feb Mar Apr M ay Jun Jul Aug Sep Oct Nov Dec Average 66.4 66.7 66.8 67.3 67.6 67.9 68.1 68.6 68.4 68.0 68.0 68.3 67.7
59.6 59.9 60.0 60.4 60.7 61.1 61.4 61.9 61.5 61.0 60.9 61.2 60.8
25.9 26.2 26.2 26.3 26.5 26.9 26.7 26.8 26.7 26.1 25.9 26.2 26.4
40.5 40.5 40.6 41.0 41.1 41.0 41.4 41.8 41.7 41.9 42.1 42.1 41.3
33.7 33.7 33.8 34.1 34.2 34.2 34.7 35.1 34.8 34.9 35.0 35.0 34.4
24.5 24.8 24.8 24.9 25.1 25.3 25.2 25.2 25.2 24.6 24.5 24.7 24.9
4.7
4.8
4.7
4.6
4.6
4.6 4.7
4.6
4.6
4.4
4.4
4.4
4.6
14.3 14.4 14.5 14.6 14.8 14.9 14.9 14.9 14.9 14.4 14.4 14.5 14.6
13.5 13.3 13.3 13.5 13.6 13.7 13.8 13.9 13.9 14.0 14.4 14.6 13.8
6.1
6.0
6.0
6.0
6.0
6.0 6.0
6.0
6.0
6.0
6.1
6.2
6.0
3.3
3.3
3.3
3.3
3.3
3.2 3.3
3.3
3.3
3.3
3.4
3.4
3.3
6.3
6.4
6.5
6.8
6.7
6.7 6.9
7.0
6.9
7.0
7.0
7.0
6.8
6.8
6.8
6.8
6.9
6.9
6.8 6.7
6.7
6.9
7.0
7.1
7.1
6.9
0.2
0.2
0.2
0.2
0.2
0.2 0.2
0.2
0.2
0.2
0.2
0.3
0.2
1.1
1.1
1.1
1.1
1.1
1.0 1.0
1.0
1.1
1.1
1.1
1.1
1.1
5.5
5.5
5.5
5.6
5.6
5.6 5.5
5.5
5.6
5.7
5.8
5.7
5.6
Note: These not seasonally adjusted estimates were prepared in cooperation with the U.S. Department of Labor, Bureau of Labor Statistics, based upon monthly reports submitted by selected
employers in the Dalton Metropolitan Statistical Area, which includes Murray and Whitfield counties. The estimates include all full- and part-time wage and salary workers who were employed during or received pay for any part of the pay period that includes the twelfth of the month. Proprietors, domestic workers, self-employed persons, unpaid family workers and personnel of the armed forces are excluded. Estimates based on 2019 benchmark.
Source: Georgia Department of Labor, Workforce Statistics & Economic Research
17
(In thousands)
Industry Total Nonfarm Total Private Goods Producing Service-Providing Private Service-Providing Trade, Transportation, and Utilities
Retail Trade Government
Federal Government State Government Local Government
gainesville msa Nonfarm Employment
(Not Seasonally Adjusted)
2019 Preliminary Series
Annual Jan Feb Mar Apr M ay Jun Jul Aug Sep Oct Nov Dec Average
92.2 92.7 93.0 92.8 93.3 93.3 92.8 93.8 93.9 94.5 94.9 94.7 93.5
81.6 82.0 82.2 81.9 82.3 82.5 82.8 83.2 83.1 83.6 84.0 83.8 82.8
25.3 25.5 25.5 25.4 25.4 25.6 25.7 25.7 25.6 25.6 25.7 25.7 25.6
66.9 67.2 67.5 67.4 67.9 67.7 67.1 68.1 68.3 68.9 69.2 69.0 67.9
56.3 56.5 56.7 56.5 56.9 56.9 57.1 57.5 57.5 58.0 58.3 58.1 57.2
17.3 17.3 17.3 17.2 17.2 17.2 17.2 17.1 17.1 17.2 17.6 17.8 17.3
8.9
8.9
8.9
8.9
9.0
8.9 8.9
8.9
8.8
8.9
9.1
9.1
8.9
10.6 10.7 10.8 10.9 11.0 10.8 10.0 10.6 10.8 10.9 10.9 10.9 10.7
0.4
0.4
0.4
0.4
0.5
0.5 0.5
0.5
0.5
0.5
0.5
0.5
0.5
2.5
2.6
2.7
2.8
2.8
2.6 2.5
2.7
2.8
2.8
2.8
2.8
2.7
7.7
7.7
7.7
7.7
7.7
7.7 7.0
7.4
7.5
7.6
7.6
7.6
7.6
(In thousands)
2018 Final Series
Industry
Annual Jan Feb Mar Apr M ay Jun Jul Aug Sep Oct Nov Dec Average
Total Nonfarm
90.0 90.9 91.4 90.9 91.4 91.8 92.1 93.1 93.7 94.2 94.4 94.0 92.3
Total Private
79.1 79.9 80.5 80.2 80.8 81.3 82.0 82.5 83.1 83.5 83.7 83.3 81.7
Goods Producing
24.9 25.1 25.1 24.7 24.9 25.2 25.3 25.4 25.5 25.5 25.5 25.5 25.2
Service-Providing
65.1 65.8 66.3 66.2 66.5 66.6 66.8 67.7 68.2 68.7 68.9 68.5 67.1
Private Service-Providing
54.2 54.8 55.4 55.5 55.9 56.1 56.7 57.1 57.6 58.0 58.2 57.8 56.4
Trade, Transportation, and Utilities
16.8 16.8 16.8 16.8 16.9 17.0 17.1 17.3 17.5 17.8 17.9 17.9 17.2
Retail Trade
8.8
8.8
8.9
8.9
9.0
9.0 9.0
9.2
9.3
9.6
9.5
9.2
9.1
Government
10.9 11.0 10.9 10.7 10.6 10.5 10.1 10.6 10.6 10.7 10.7 10.7 10.7
Federal Government
0.5
0.5
0.5
0.5
0.4
0.5 0.4
0.4
0.4
0.4
0.4
0.4
0.4
State Government
2.9
3.0
2.9
2.7
2.6
2.5 2.5
2.7
2.7
2.7
2.7
2.7
2.7
Local Government
7.5
7.5
7.5
7.5
7.6
7.5 7.2
7.5
7.5
7.6
7.6
7.6
7.5
Note: These not seasonally adjusted estimates were prepared in cooperation with the U.S. Department of Labor, Bureau of Labor Statistics, based upon monthly reports submitted by selected
employers in the Gainesville Metropolitan Statistical Area, which comprises Hall county. The estimates include all full- and part-time wage and salary workers who were employed during or received pay for any part of the pay period that includes the twelfth of the month. Proprietors, domestic workers, self-employed persons, unpaid family workers and personnel of the armed forces are excluded. Estimates based on 2019 benchmark.
Source: Georgia Department of Labor, Workforce Statistics & Economic Research
18
(In thousands)
Industry Total Nonfarm Total Private Goods Producing Service-Providing Private Service-Providing Government
Federal Government State Government Local Government
hinesville msa Nonfarm Employment
(Not Seasonally Adjusted)
2019 Preliminary Series
Annual Jan Feb Mar Apr M ay Jun Jul Aug Sep Oct Nov Dec Average
21.0 21.2 21.3 21.3 21.3 21.0 21.1 21.5 21.4 21.5 21.7 21.6 21.3
13.1 13.3 13.3 13.4 13.4 13.2 13.2 13.3 13.4 13.5 13.6 13.5 13.4
2.9
2.9
2.8
2.9
2.8
2.9 2.9
2.9
3.0
3.0
3.0
2.9
2.9
18.1 18.3 18.5 18.4 18.5 18.1 18.2 18.6 18.4 18.5 18.7 18.7 18.4
10.2 10.4 10.5 10.5 10.6 10.3 10.3 10.4 10.4 10.5 10.6 10.6 10.4
7.9
7.9
8.0
7.9
7.9
7.8 7.9
8.2
8.0
8.0
8.1
8.1
8.0
3.9
3.8
3.8
3.8
3.8
3.8 3.8
3.8
3.8
3.8
3.9
3.9
3.8
0.4
0.4
0.4
0.4
0.4
0.4 0.4
0.4
0.4
0.4
0.4
0.4
0.4
3.6
3.7
3.8
3.7
3.7
3.6 3.7
4.0
3.8
3.8
3.8
3.8
3.8
(In thousands)
2018 Final Series
Industry
Annual Jan Feb Mar Apr M ay Jun Jul Aug Sep Oct Nov Dec Average
Total Nonfarm
20.4 20.6 20.6 20.6 20.6 20.4 20.4 21.0 20.8 20.9 21.2 21.3 20.7
Total Private
12.7 12.8 12.8 12.8 12.8 12.7 12.7 13.0 12.9 12.9 13.2 13.3 12.9
Goods Producing
2.8
2.8
2.8
2.8
2.8
2.8 2.8
2.9
2.9
2.9
3.0
2.9
2.9
Service-Providing
17.6 17.8 17.8 17.8 17.8 17.6 17.6 18.1 17.9 18.0 18.2 18.4 17.9
Private Service-Providing
9.9 10.0 10.0 10.0 10.0
9.9
9.9 10.1 10.0 10.0 10.2 10.4 10.0
Government
7.7
7.8
7.8
7.8
7.8
7.7 7.7
8.0
7.9
8.0
8.0
8.0
7.9
Federal Government
3.8
3.8
3.8
3.8
3.8
3.8 3.8
3.9
3.9
3.9
3.9
3.9
3.8
State Government
0.4
0.4
0.4
0.4
0.4
0.4 0.4
0.4
0.4
0.5
0.4
0.4
0.4
Local Government
3.5
3.6
3.6
3.6
3.6
3.5 3.5
3.7
3.6
3.6
3.7
3.7
3.6
Note: These not seasonally adjusted estimates were prepared in cooperation with the U.S. Department of Labor, Bureau of Labor Statistics, based upon monthly reports submitted by se-
lected employers in the Hinesville Metropolitan Statistical Area, which includes Liberty and Long counties. The estimates include all full- and part-time wage and salary workers who were employed during or received pay for any part of the pay period that includes the twelfth of the month. Proprietors, domestic workers, self-employed persons, unpaid family workers and personnel of the armed forces are excluded. Estimates based on 2019 benchmark.
Source: Georgia Department of Labor, Workforce Statistics & Economic Research
19
macon-BIBB County msa Nonfarm Employment
(In thousands)
Industry Total Nonfarm Total Private Goods Producing Service-Providing Private Service-Providing Trade, Transportation, and Utilities
Retail Trade Transportation, Warehousing, and Utilities Financial Activities Professional and Business Services Education and Health Services Leisure and Hospitality Government Federal Government State Government Local Government
(Not Seasonally Adjusted)
2019 Preliminary Series
J an 102.8
88.2 10.3 92.5 77.9 20.4 11.9
5.8 9.7 11.6 21.6 10.2 14.6 1.1 4.1 9.4
Feb 103.5
88.8 10.4 93.1 78.4 20.3 11.7
5.7 9.7 11.9 21.8 10.3 14.7 1.1 4.2 9.4
M ar 103.6
88.8 10.4 93.2 78.4 20.2 11.6
5.7 9.8 12.0 21.6 10.5 14.8 1.1 4.2 9.5
Apr 102.9
88.2 10.2 92.7 78.0 20.0 11.6
5.7 9.7 11.8 21.6 10.6 14.7 1.1 4.2 9.4
M AY 103.1
88.6 10.3 92.8 78.3 20.0 11.5
5.7 9.7 12.0 21.7 10.6 14.5 1.1 4.0 9.4
Jun 103.0
88.8 10.4 92.6 78.4 20.0 11.5
5.8 9.7 12.1 21.5 10.8 14.2 1.1 4.0 9.1
Jul 102.4
88.7 10.4 92.0 78.3 20.1 11.5
5.8 9.7 12.1 21.4 10.7 13.7 1.1 4.0 8.6
Aug 103.0
88.7 10.4 92.6 78.3 20.2 11.5
5.8 9.8 12.1 21.6 10.8 14.3 1.1 3.9 9.3
Sep 102.7
88.4 10.4 92.3 78.0 20.4 11.6
5.8 9.7 12.1 21.8 10.7 14.3 1.1 4.1 9.1
Oct 102.9
88.6 10.3 92.6 78.3 20.4 11.6
5.8 9.7 12.2 22.0 10.8 14.3 1.1 4.2 9.0
Nov 103.9
89.5 10.4 93.5 79.1 20.9 11.9
6.0 9.7 12.1 22.1 10.7 14.4 1.1 4.2 9.1
Annual Dec Average
104.1 103.2
89.7 88.8
10.4 10.4
93.7 92.8
79.3 78.4
21.0 20.3
11.9 11.7
6.0
5.8
9.7
9.7
12.1 12.0
22.1 21.7
10.6 10.6
14.4 14.4
1.1
1.1
4.2
4.1
9.1
9.2
(In thousands)
2018 Final Series
Industry
Annual Jan Feb Mar Apr M AY Jun Jul Aug Sep Oct Nov Dec Average
Total Nonfarm Total Private
102.0 102.5 102.9 103.2 103.5 103.6 102.8 103.3 103.5 103.2 87.6 87.9 88.3 88.5 88.9 89.0 88.9 88.7 88.9 88.6
104.3 104.4 89.5 89.7
103.3 88.7
Goods Producing
10.0 10.1 10.2 10.2 10.3 10.4 10.3 10.3 10.4 10.3 10.4 10.4 10.3
Service-Providing Private Service-Providing
92.0 92.4 92.7 93.0 93.2 93.2 92.5 93.0 93.1 92.9 93.9 94.0 93.0 77.6 77.8 78.1 78.3 78.6 78.6 78.6 78.4 78.5 78.3 79.1 79.3 78.4
Trade, Transportation, and Utilities
20.4 20.2 20.4 20.2 20.3 20.0 20.2 20.1 20.2 20.3 21.0 21.1 20.4
Retail Trade
12.4 12.3 12.3 12.2 12.2 12.1 12.0 11.9 12.0 12.1 12.4 12.3 12.2
Transportation, Warehousing, and Utilities
5.5
5.4
5.4
5.2
5.2
5.1 5.4
5.4
5.4
5.4
5.8
5.9
5.4
Financial Activities
10.1 10.2 10.2 10.1 10.1 10.2 10.1 10.1 10.0
9.9
9.9 10.0 10.1
Professional and Business Services
11.5 11.8 11.9 11.9 11.9 12.1 12.0 11.8 11.9 11.7 11.9 11.9 11.9
Education and Health Services
21.3 21.4 21.3 21.3 21.3 21.4 21.2 21.4 21.5 21.9 21.8 21.8 21.5
Leisure and Hospitality
10.0 10.1 10.2 10.4 10.5 10.4 10.5 10.6 10.3 10.0
9.9 10.1 10.3
Government
14.4 14.6 14.6 14.7 14.6 14.6 13.9 14.6 14.6 14.6 14.8 14.7 14.6
Federal Government
1.1
1.1
1.1
1.1
1.1
1.1 1.1
1.1
1.1
1.1
1.1
1.1
1.1
State Government
3.8
4.0
4.0
4.1
4.0
4.0 3.9
3.9
4.1
4.2
4.2
4.2
4.0
Local Government
9.5
9.5
9.5
9.5
9.5
9.5 8.9
9.6
9.4
9.3
9.5
9.4
9.4
Note: These not seasonally adjusted estimates were prepared in cooperation with the U.S. Department of Labor, Bureau of Labor Statistics, based upon monthly reports submitted by se-
lected employers in the Macon-Bibb County Metropolitan Statistical Area, which includes Bibb, Crawford, Jones, Monroe and Twiggs counties. The estimates include all full- and part-time wage and salary workers who were employed during or received pay for any part of the pay period that includes the twelfth of the month. Proprietors, domestic workers, self-employed persons, unpaid family workers and personnel of the armed forces are excluded. Estimates based on 2019 benchmark.
Source: Georgia Department of Labor, Workforce Statistics & Economic Research
20
(In thousands)
Industry Total Nonfarm Total Private Goods Producing Service-Providing Private Service-Providing Manufacturing Trade, Transportation, and Utilities
Retail Trade Education and Health Services Government
Federal Government State Government Local Government
rome msa Nonfarm Employment
(Not Seasonally Adjusted)
2019 Preliminary Series
Annual Jan Feb Mar Apr M ay Jun Jul Aug Sep Oct Nov Dec Average
41.6 41.8 42.1 41.8 41.8 41.8 41.8 41.8 41.9 42.5 42.7 42.6 42.0
36.0 36.1 36.4 36.1 36.1 36.2 36.2 36.1 36.3 36.7 36.9 36.8 36.3
7.3
7.2
7.3
7.2
7.3
7.2 7.2
7.1
7.2
7.3
7.3
7.3
7.2
34.3 34.6 34.8 34.6 34.5 34.6 34.6 34.7 34.7 35.2 35.4 35.3 34.8
28.7 28.9 29.1 28.9 28.8 29.0 29.0 29.0 29.1 29.4 29.6 29.5 29.1
6.3
6.2
6.3
6.2
6.2
6.2 6.2
6.2
6.2
6.1
6.1
6.1
6.2
7.8
7.7
7.7
7.7
7.7
7.6 7.5
7.5
7.5
7.8
8.0
7.8
7.7
4.5
4.4
4.5
4.4
4.4
4.4 4.4
4.4
4.5
4.5
4.6
4.6
4.5
10.7 10.7 10.7 10.8 10.6 10.5 10.5 10.7 10.8 10.9 10.9 10.9 10.7
5.6
5.7
5.7
5.7
5.7
5.6 5.6
5.7
5.6
5.8
5.8
5.8
5.7
0.2
0.2
0.2
0.2
0.2
0.2 0.2
0.2
0.2
0.2
0.2
0.2
0.2
1.5
1.6
1.6
1.6
1.6
1.5 1.5
1.5
1.5
1.6
1.6
1.6
1.6
3.9
3.9
3.9
3.9
3.9
3.9 3.9
4.0
3.9
4.0
4.0
4.0
3.9
(In thousands)
2018 Final Series
Industry
Annual Jan Feb Mar Apr M ay Jun Jul Aug Sep Oct Nov Dec Average
Total Nonfarm
41.1 41.4 41.6 41.6 41.6 41.6 41.4 41.5 41.6 41.8 42.1 42.3 41.6
Total Private
35.3 35.6 35.7 35.8 35.7 35.8 35.7 35.8 35.9 36.1 36.4 36.6 35.9
Goods Producing
7.5
7.6
7.6
7.4
7.4
7.5 7.4
7.5
7.4
7.3
7.4
7.4
7.5
Service-Providing
33.6 33.8 34.0 34.2 34.2 34.1 34.0 34.0 34.2 34.5 34.7 34.9 34.2
Private Service-Providing
27.8 28.0 28.1 28.4 28.3 28.3 28.3 28.3 28.5 28.8 29.0 29.2 28.4
Manufacturing
6.5
6.5
6.6
6.5
6.4
6.5 6.5
6.5
6.4
6.3
6.4
6.4
6.5
Trade, Transportation, and Utilities
7.8
7.7
7.7
7.7
7.7
7.7 7.7
7.7
7.6
7.6
7.9
7.9
7.7
Retail Trade
4.5
4.5
4.5
4.5
4.5
4.5 4.5
4.5
4.5
4.5
4.7
4.6
4.5
Education and Health Services
10.3 10.4 10.3 10.6 10.4 10.4 10.5 10.5 10.7 10.7 10.8 10.8 10.5
Government
5.8
5.8
5.9
5.8
5.9
5.8 5.7
5.7
5.7
5.7
5.7
5.7
5.8
Federal Government
0.2
0.2
0.2
0.2
0.2
0.2 0.2
0.2
0.2
0.2
0.2
0.2
0.2
State Government
1.6
1.6
1.7
1.6
1.7
1.6 1.6
1.6
1.6
1.6
1.6
1.6
1.6
Local Government
4.0
4.0
4.0
4.0
4.0
4.0 3.9
3.9
3.9
3.9
3.9
3.9
4.0
Note: These not seasonally adjusted estimates were prepared in cooperation with the U.S. Department of Labor, Bureau of Labor Statistics, based upon monthly reports submitted by selected
employers in the Rome Metropolitan Statistical Area, which comprises Floyd county. The estimates include all full- and part-time wage and salary workers who were employed during or received pay for any part of the pay period that includes the twelfth of the month. Proprietors, domestic workers, self-employed persons, unpaid family workers and personnel of the armed forces are excluded. Estimates based on 2019 benchmark.
Source: Georgia Department of Labor, Workforce Statistics & Economic Research
21
(In thousands)
Industry Total Nonfarm Total Private Goods Producing Service-Providing Private Service-Providing Mining, Logging and Construction Manufacturing Trade, Transportation, and Utilities
Wholesale Trade Retail Trade Transportation, Warehousing, and Utilities Information Financial Activities Professional and Business Services Education and Health Services Leisure and Hospitality Other Services Government Federal Government State Government Local Government
savannah msa Nonfarm Employment
(Not Seasonally Adjusted)
2019 Preliminary Series
J an 184.7 160.3
26.8 157.9 133.5
8.2 18.6 43.7
6.6 22.1 15.0
2.5 6.3 21.9 25.8 25.9 7.4 24.4 2.9 5.6 15.9
Feb 186.7 162.1
27.1 159.6 135.0
8.4 18.7 43.2
6.6 21.9 14.7
3.3 6.3 22.0 26.2 26.5 7.5 24.6 2.9 5.7 16.0
M ar 187.5 162.8
27.0 160.5 135.8
8.4 18.6 43.3
6.6 22.0 14.7
3.2 6.3 22.1 26.2 27.1 7.6 24.7 2.9 5.7 16.1
Apr 187.1 162.4
26.9 160.2 135.5
8.2 18.7 43.0
6.5 21.9 14.6
2.5 6.4 22.1 26.4 27.5 7.6 24.7 2.9 5.7 16.1
M ay 187.9 163.2
27.1 160.8 136.1
8.3 18.8 43.3
6.6 22.0 14.7
2.4 6.4 22.1 26.3 27.9 7.7 24.7 2.9 5.7 16.1
Jun 187.8 163.2
26.9 160.9 136.3
8.0 18.9 42.9
6.5 21.7 14.7
2.8 6.4 22.3 26.6 27.7 7.6 24.6 2.9 5.5 16.2
Jul 186.3 162.5
27.0 159.3 135.5
8.0 19.0 42.9
6.5 21.6 14.8
2.8 6.4 21.9 26.4 27.5 7.6 23.8 2.9 5.4 15.5
Aug 186.6 162.3
27.0 159.6 135.3
8.0 19.0 42.9
6.5 21.7 14.7
3.0 6.4 21.3 26.7 27.4 7.6 24.3 2.9 5.5 15.9
Sep 184.1 160.3
26.9 157.2 133.4
7.9 19.0 42.5
6.5 21.3 14.7
2.7 6.4 20.7 26.9 26.6 7.6 23.8 2.9 5.7 15.2
Oct 186.2 162.3
27.5 158.7 134.8
8.2 19.3 42.9
6.6 21.4 14.9
2.8 6.4 20.9 27.2 27.0 7.6 23.9 2.9 5.7 15.3
Nov 187.8 163.8
27.5 160.3 136.3
8.2 19.3 43.8
6.6 22.1 15.1
2.8 6.4 20.6 27.4 27.6 7.7 24.0 2.9 5.7 15.4
Annual Dec Average
186.4 186.6
162.4 162.3
27.6 27.1
158.8 159.5
134.8 135.2
8.3
8.2
19.3 18.9
43.5 43.2
6.6
6.6
21.7 21.8
15.2 14.8
2.7
2.8
6.4
6.4
20.2 21.5
27.2 26.6
27.1 27.2
7.7
7.6
24.0 24.3
2.9
2.9
5.7
5.6
15.4 15.8
(In thousands)
2018 Final Series
Industry
Annual Jan Feb Mar Apr M ay Jun Jul Aug Sep Oct Nov Dec Average
Total Nonfarm
178.7 182.0 184.8 183.0 184.9 184.7 184.5 185.3 184.6 185.2 186.7 186.1 184.2
Total Private
154.6 157.5 160.2 158.4 160.2 160.4 160.3 160.1 160.0 160.7 162.0 161.4 159.7
Goods Producing
25.8 26.5 26.3 26.6 26.8 27.0 26.8 26.8 27.0 26.9 26.7 26.8 26.7
Service-Providing
152.9 155.5 158.5 156.4 158.1 157.7 157.7 158.5 157.6 158.3 160.0 159.3 157.5
Private Service-Providing
128.8 131.0 133.9 131.8 133.4 133.4 133.5 133.3 133.0 133.8 135.3 134.6 133.0
Mining, Logging and Construction
8.1
8.6
8.5
8.7
8.7
8.5 8.4
8.4
8.5
8.3
8.2
8.1
8.4
Manufacturing
17.7 17.9 17.8 17.9 18.1 18.5 18.4 18.4 18.5 18.6 18.5 18.7 18.3
Trade, Transportation, and Utilities
41.8 41.8 42.2 42.3 42.5 42.5 42.8 42.3 42.4 43.2 44.4 44.6 42.7
Wholesale Trade
6.1
6.1
6.4
6.4
6.4
6.5 6.6
6.6
6.6
6.6
6.7
6.7
6.5
Retail Trade
22.3 22.0 22.2 22.0 22.1 22.0 22.2 22.1 22.0 22.1 23.0 22.8 22.2
Transportation, Warehousing, and Utilities
13.4 13.7 13.6 13.9 14.0 14.0 14.0 13.6 13.8 14.5 14.7 15.1 14.0
Information
1.5
1.5
3.9
1.5
1.5
1.6 1.5
1.5
1.8
1.9
1.8
1.8
1.8
Financial Activities
6.1
6.2
6.2
6.1
6.2
6.2 6.2
6.3
6.3
6.3
6.3
6.3
6.2
Professional and Business Services
21.2 21.8 21.6 21.4 21.7 21.4 21.7 21.8 21.6 22.4 22.9 22.4 21.8
Education and Health Services
25.9 26.8 26.3 26.2 26.8 26.8 26.5 26.9 27.0 26.0 26.1 26.3 26.5
Leisure and Hospitality
25.1 25.6 26.3 27.0 27.3 27.5 27.4 27.2 26.6 26.6 26.4 25.8 26.6
Other Services
7.2
7.3
7.4
7.3
7.4
7.4 7.4
7.3
7.3
7.4
7.4
7.4
7.4
Government
24.1 24.5 24.6 24.6 24.7 24.3 24.2 25.2 24.6 24.5 24.7 24.7 24.6
Federal Government
2.9
2.9
2.9
2.9
2.9
2.9 2.8
2.8
2.8
2.8
2.9
2.9
2.9
State Government
5.6
5.9
5.9
5.9
5.9
5.6 5.8
5.9
5.9
5.8
5.8
5.8
5.8
Local Government
15.6 15.7 15.8 15.8 15.9 15.8 15.6 16.5 15.9 15.9 16.0 16.0 15.9
Note: These not seasonally adjusted estimates were prepared in cooperation with the U.S. Department of Labor, Bureau of Labor Statistics, based upon monthly reports submitted by
selected employers in the Savannah Metropolitan Statistical Area, which includes Bryan, Chatham and Effingham counties. The estimates include all full- and part-time wage and salary workers who were employed during or received pay for any part of the pay period that includes the twelfth of the month. Proprietors, domestic workers, self-employed persons, unpaid family workers and personnel of the armed forces are excluded. Estimates based on 2019 benchmark.
Source: Georgia Department of Labor, Workforce Statistics & Economic Research
22
(In thousands)
Industry Total Nonfarm Total Private Goods Producing Service-Providing Private Service-Providing Trade, Transportation, and Utilities
Retail Trade Government
Federal Government State Government Local Government
valdosta msa Nonfarm Employment
(Not Seasonally Adjusted)
2019 Preliminary Series
Annual Jan Feb Mar Apr M AY Jun Jul Aug Sep Oct Nov Dec Average
55.9 56.0 56.3 56.4 56.4 56.2 55.8 56.3 56.3 56.6 57.1 56.8 56.3
42.6 42.8 43.1 43.1 43.2 43.2 43.3 43.2 43.1 43.3 43.6 43.5 43.2
7.5
7.6
7.5
7.4
7.4
7.6 7.6
7.6
7.7
7.6
7.6
7.6
7.6
48.4 48.4 48.8 49.0 49.0 48.6 48.2 48.7 48.6 49.0 49.5 49.2 48.8
35.1 35.2 35.6 35.7 35.8 35.6 35.7 35.6 35.4 35.7 36.0 35.9 35.6
12.6 12.6 12.6 12.6 12.7 12.7 12.6 12.6 12.6 12.6 12.8 12.9 12.7
7.0
7.0
7.0
6.9
7.0
7.0 7.0
7.0
7.0
7.0
7.1
7.1
7.0
13.3 13.2 13.2 13.3 13.2 13.0 12.5 13.1 13.2 13.3 13.5 13.3 13.2
1.2
1.2
1.2
1.2
1.2
1.2 1.2
1.2
1.2
1.2
1.2
1.2
1.2
3.7
3.7
3.7
3.7
3.7
3.5 3.4
3.7
3.8
3.8
3.8
3.8
3.7
8.4
8.3
8.3
8.4
8.3
8.3 7.9
8.2
8.2
8.3
8.5
8.3
8.3
(In thousands)
2018 Final Series
Industry Total Nonfarm Total Private Goods Producing Service-Providing Private Service-Providing Trade, Transportation, and Utilities
Retail Trade Government
Federal Government State Government Local Government
Annual Jan Feb Mar Apr M AY Jun Jul Aug Sep Oct Nov Dec Average
55.5 55.5 56.1 56.2 56.3 55.8 55.3 56.1 56.6 56.3 56.9 56.8 56.1
42.3 42.3 43.0 43.1 43.1 42.8 42.7 43.0 43.2 42.9 43.5 43.5 43.0
7.3
7.3
7.4
7.4
7.4
7.4 7.5
7.5
7.7
7.6
7.6
7.6
7.5
48.2 48.2 48.7 48.8 48.9 48.4 47.8 48.6 48.9 48.7 49.3 49.2 48.6
35.0 35.0 35.6 35.7 35.7 35.4 35.2 35.5 35.5 35.3 35.9 35.9 35.5
12.3 12.3 12.3 12.3 12.3 12.2 12.2 12.3 12.3 12.3 12.8 12.9 12.4
7.0
7.0
6.9
7.0
7.0
7.0 6.9
6.9
7.0
7.0
7.4
7.3
7.0
13.2 13.2 13.1 13.1 13.2 13.0 12.6 13.1 13.4 13.4 13.4 13.3 13.2
1.2
1.2
1.2
1.2
1.2
1.2 1.2
1.2
1.2
1.2
1.2
1.2
1.2
3.9
3.9
3.8
3.8
3.8
3.6 3.5
3.8
3.9
3.8
3.8
3.8
3.8
8.1
8.1
8.1
8.1
8.2
8.2 7.9
8.1
8.3
8.4
8.4
8.3
8.2
Note: These not seasonally adjusted estimates were prepared in cooperation with the U.S. Department of Labor, Bureau of Labor Statistics, based upon monthly reports submitted by selected
employers in the Valdosta Metropolitan Statistical Area, which includes Brooks, Echols, Lanier and Lowndes counties. The estimates include all full- and part-time wage and salary workers who were employed during or received pay for any part of the pay period that includes the twelfth of the month. Proprietors, domestic workers, self-employed persons, unpaid family workers and personnel of the armed forces are excluded. Estimates based on 2019 benchmark.
Source: Georgia Department of Labor, Workforce Statistics & Economic Research
23
(In thousands)
Industry Total Nonfarm Total Private Goods Producing Service-Providing Private Service-Providing Trade, Transportation, and Utilities
Retail Trade Government
Federal Government State Government Local Government
warner robins msa Nonfarm Employment
(Not Seasonally Adjusted)
2019 Preliminary Series
Annual Jan Feb Mar Apr M ay Jun Jul Aug Sep Oct Nov Dec Average
76.3 77.0 77.5 77.2 77.8 77.9 77.1 77.5 77.5 77.4 78.0 77.9 77.4
48.5 48.9 49.4 49.2 49.8 50.0 49.7 49.9 49.5 49.1 49.8 49.7 49.5
10.2 10.3 10.5 10.3 10.4 10.6 10.7 10.6 10.5
9.8 10.1 10.2 10.4
66.1 66.7 67.0 66.9 67.4 67.3 66.4 66.9 67.0 67.6 67.9 67.7 67.1
38.3 38.6 38.9 38.9 39.4 39.4 39.0 39.3 39.0 39.3 39.7 39.5 39.1
11.1 11.0 11.0 11.1 11.2 11.2 11.1 11.1 11.1 11.3 11.5 11.5 11.2
8.5
8.4
8.5
8.5
8.6
8.6 8.6
8.6
8.6
8.7
8.9
8.9
8.6
27.8 28.1 28.1 28.0 28.0 27.9 27.4 27.6 28.0 28.3 28.2 28.2 28.0
15.4 15.6 15.6 15.6 15.7 15.7 15.8 15.8 15.9 15.9 16.0 16.1 15.8
2.3
2.4
2.4
2.4
2.3
2.3 2.3
2.2
2.4
2.5
2.3
2.3
2.3
10.1 10.1 10.1 10.0 10.0
9.9
9.3
9.6
9.7
9.9
9.9
9.8
9.9
(In thousands)
2018 Final Series
Industry
Jan Feb Mar Apr M ay Jun
Jul Aug Sep
Annual Oct Nov Dec Average
Total Nonfarm Total Private Goods Producing Service-Providing Private Service-Providing Trade, Transportation, and Utilities
Retail Trade Government
Federal Government State Government Local Government
74.4 75.2 75.4 75.8 75.9 75.7 75.4 76.1 76.1 75.8 76.0 75.9 75.6
46.9 47.6 47.9 48.2 48.4 48.6 48.3 48.6 48.4 47.6 48.0 47.8 48.0
10.0 10.2 10.2 10.3 10.4 10.6 10.5 10.5 10.4 10.3 10.1 10.0 10.3
64.4 65.0 65.2 65.5 65.5 65.1 64.9 65.6 65.7 65.5 65.9 65.9 65.4
36.9 37.4 37.7 37.9 38.0 38.0 37.8 38.1 38.0 37.3 37.9 37.8 37.7
10.8 10.8 10.9 11.2 11.1 11.1 10.9 11.0 11.0 10.9 11.3 11.4 11.0
8.4
8.4
8.5
8.7
8.7
8.6 8.5
8.5
8.6
8.5
8.8
8.9
8.6
27.5 27.6 27.5 27.6 27.5 27.1 27.1 27.5 27.7 28.2 28.0 28.1 27.6
14.9 14.9 14.9 14.8 14.9 15.1 15.1 15.1 15.3 15.4 15.5 15.6 15.1
2.4
2.5
2.5
2.5
2.4
2.4 2.4
2.4
2.5
2.7
2.4
2.4
2.5
10.2 10.2 10.1 10.3 10.2
9.6
9.6 10.0
9.9 10.1 10.1 10.1 10.0
Note: These not seasonally adjusted estimates were prepared in cooperation with the U.S. Department of Labor, Bureau of Labor Statistics, based upon monthly reports submitted by selected
employers in the Warner Robins Metropolitan Statistical Area, which comprises Houston, Peach and Pulaski counties. The estimates include all full- and part-time wage and salary workers who were employed during or received pay for any part of the pay period that includes the twelfth of the month. Proprietors, domestic workers, self-employed persons, unpaid family workers and personnel of the armed forces are excluded. Estimates based on 2019 benchmark.
Source: Georgia Department of Labor, Workforce Statistics & Economic Research
24
total Nonfarm Employment by Metro Statistical Area
(Seasonally Adjusted)
(In thousands)
2019 Preliminary Series
Industry Jan Feb Mar Apr M ay Jun Jul Aug Sep Oct Nov Dec
Albany MSA Athens-Clarke County MSA Atlanta MSA Augusta-Richmond MSA Brunswick MSA Columbus MSA Dalton MSA Gainesville MSA Hinesville MSA Macon-Bibb County MSA Rome MSA Savannah MSA Valdosta MSA Warner Robins MSA
62.2 62.4 62.7 62.8 62.9 63.2 63.1 63.3 63.5 97.5 97.5 97.0 97.2 97.0 96.1 95.9 96.3 96.1 2,831.9 2,835.0 2,836.2 2,836.5 2,840.8 2,844.3 2,845.5 2,852.5 2,860.0 242.2 241.8 242.3 242.2 242.6 242.7 241.8 243.1 243.0 44.7 44.7 44.5 44.6 44.7 44.7 44.7 44.9 44.8 122.9 123.1 122.9 122.7 123.0 122.4 121.5 122.0 121.9 66.9 66.5 66.7 66.9 66.4 66.1 66.2 66.2 66.1 93.2 93.3 93.4 93.5 93.7 93.8 93.2 93.5 94.0 21.1 21.2 21.2 21.2 21.2 21.2 21.3 21.4 21.4 103.5 103.9 103.6 102.9 103.0 103.1 102.8 102.9 102.8 41.9 41.9 42.1 41.7 41.8 41.8 42.1 41.9 42.0 188.0 188.0 187.6 187.1 186.9 186.9 186.0 186.1 185.0 56.4 56.5 56.3 56.2 56.4 56.6 56.1 56.5 56.5 77.1 77.4 77.6 76.9 77.3 77.5 77.5 77.6 77.6
62.7 62.9 96.7 96.6 2,866.9 2,871.7 243.7 243.3 44.8 44.9 122.0 121.8 66.2 66.1 94.1 94.2 21.5 21.6 102.8 102.9 42.3 42.3 185.8 187.1 56.3 56.5 77.5 77.8
62.9 97.2 2,880.0 242.9 44.7 121.6 66.3 94.2 21.6 103.2 42.3 186.1 56.7 77.9
(In thousands)
2018 Final Series
Industry Jan Feb Mar Apr M ay Jun Jul Aug Sep Oct Nov Dec
Albany MSA
62.2 62.5 62.8 62.3 62.2 62.1 62.3 62.2 61.8 61.8 62.5 62.5
Athens-Clarke County MSA
98.1 98.4 98.5 97.5 98.1 98.7 98.8 99.1 99.0 97.8 98.0 98.0
Atlanta MSA
2,753.5 2,759.8 2,767.0 2,771.1 2,777.2 2,783.1 2,790.9 2,796.2 2,800.7 2,805.2 2,809.4 2,808.9
Augusta-Richmond MSA
240.2 240.3 240.5 241.6 240.6 241.0 241.0 240.8 240.5 240.9 240.8 241.4
Brunswick MSA
44.5 44.7 44.9 44.7 44.7 44.9 44.8 44.8 44.8 44.9 44.9 44.8
Columbus MSA
121.7 121.8 122.1 121.8 122.2 122.9 122.7 122.9 123.0 122.7 122.6 122.7
Dalton MSA
67.1 67.0 66.9 67.4 67.5 67.8 68.1 68.0 68.1 68.0 67.9 67.9
Gainesville MSA
91.0 91.4 91.9 91.4 91.6 92.0 92.4 92.7 93.2 93.1 93.1 93.1
Hinesville MSA
20.6 20.6 20.5 20.5 20.5 20.6 20.7 20.8 20.7 20.9 21.1 21.1
Macon-Bibb County MSA
102.7 102.9 102.9 103.2 103.5 103.4 103.5 103.3 103.4 103.2 103.4 103.2
Rome MSA
41.4 41.5 41.6 41.5 41.6 41.6 41.8 41.6 41.6 41.6 41.7 42.0
Savannah MSA
182.0 183.4 185.1 182.9 183.7 183.7 184.4 184.7 185.1 184.9 185.1 186.0
Valdosta MSA
56.0 56.0 56.0 56.0 55.9 55.8 56.0 56.2 56.7 56.1 56.2 56.4
Warner Robins MSA
75.2 75.6 75.6 75.5 75.5 75.6 75.9 76.2 76.2 75.6 75.6 75.6
Note: These seasonally adjusted estimates were prepared in cooperation with the U.S. Department of Labor, Bureau of Labor Statistics, based upon monthly reports submitted by selected
employers throughout Georgia. The estimates include all full- and part-time wage and salary workers who were employed during or received pay for any part of the pay period that includes the twelfth of the month. Proprietors, domestic workers, self-employed persons, unpaid family workers and personnel of the armed forces are excluded. Estimates based on 2019 benchmark.
Source: Georgia Department of Labor, Workforce Statistics & Economic Research
25
msa Nonfarm Employment
2012 2019 Annual Average Employment
4,800,000
Georgia
4,600,000 4,400,000 4,200,000 4,000,000
4,452,600 4,371,400
4,261,400
4,144,800
4,032,400 3,953,900
4,613,800 4,535,900
3,800,000
3,600,000
2012
2013
2014
2015
2016
2017
2018
2019
Albany MSA
65,000
64,000 63,000 62,000 61,000
61,000
61,000
61,100
61,100
62,000
62,900
62,200
62,900
60,000
59,000
2012
2013
2014
2015
2016
2017
2018
2019
101,000 98,000 95,000 92,000 89,000 86,000
Athens-Clarke County MSA
87,200
88,200
89,200
91,300
94,000
96,800
98,300
96,700
83,000
2012
2013
2014
2015
2016
2017
2018
2019
2,950,000 2,850,000 2,750,000 2,650,000 2,550,000 2,450,000 2,350,000
Atlanta MSA
2,849,400 2,785,600 2,727,800 2,665,300 2,582,700 2,503,900
2,415,100 2,354,900
2,250,000
2012
2013
2014
2015
2016
2017
2018
2019
249,000 244,000 239,000 234,000 229,000 224,000 219,000 214,000
Augusta-Richmond County MSA
229,200
233,300
237,000
240,700
217,200
219,500
223,600
2012
2013
2014
2015
2016
2017
2018
242,700 2019
46,000 44,000 42,000 40,000 38,000 36,000 34,000
40,600 2012
40,800 2013
Brunswick MSA
40,800
42,100
43,600
44,000
2014
2015
2016
2017
44,800 2018
44,700 2019
Columbus MSA
124,000
123,000 122,000 121,000 120,000
122,500 122,400
120,100
121,200
121,600
120,700
120,200
120,800
119,000
118,000
2012
2013
2014
2015
2016
2017
2018
2019
70,000 68,000 66,000 64,000 62,000
62,500
62,500
Dalton MSA
64,800
66,400
66,900
66,800
67,700
66,400
60,000
58,000
2012
2013
2014
2015
2016
2017
2018
2019
Source: Georgia Department of Labor, Workforce Statistics & Economic Research
26
msa Nonfarm Employment
2012 2019 Annual Average Employment
98,000 94,000 90,000 86,000 82,000 78,000 74,000 70,000
75,000 2012
Gainesville MSA
77,300
79,800
84,000
86,700
89,900
2013
2014
2015
2016
2017
92,300 2018
93,500 2019
Hinesville MSA
22,000
21,500 21,000 20,500 20,000 19,500
20,000
19,600
19,600
19,700
19,800
20,300
20,700
21,300
19,000
2012
2013
2014
2015
2016
2017
2018
2019
Macon-Bibb County MSA
106,000
104,000 102,000 100,000
98,000
97,900
100,200
101,000
102,400
102,800
103,300
103,200
98,200
96,000
94,000
2012
2013
2014
2015
2016
2017
2018
2019
43,000 42,000 41,000 40,000 39,000 38,000
38,600
38,800
Rome MSA
39,700
40,200
40,600
41,000
41,600
42,000
37,000
2012
2013
2014
2015
2016
2017
2018
2019
194,000 188,000 182,000 176,000 170,000 164,000 158,000 152,000
Savannah MSA
171,800
176,100
179,300
184,200
186,600
156,200
160,300
165,600
2012
2013
2014
2015
2016
2017
2018
2019
57,000 56,000 55,000 54,000 53,000 52,000 51,000
53,500 2012
53,500 2013
Valdosta MSA
54,200
55,200
56,000
55,800
2014
2015
2016
2017
56,100 2018
56,300 2019
80,000
78,000
76,000
74,000
72,000 71,200 70,000
68,000
2012
Warner Robins MSA
70,600
70,200
70,800
72,600
73,800
2013
2014
2015
2016
2017
75,600 2018
77,400 2019
Source: Georgia Department of Labor, Workforce Statistics & Economic Research
27
Georgia Hours and Earnings
Industry
Total Private Goods Producing Private Service Providing Construction Manufacturing Trade, Transportation, and Utilities Financial Activities Professional and Business Services Educational and Health Services Leisure and Hospitality Other Services
Jan
26.89 25.21 27.29 26.29 24.00 23.94 36.16 32.17 30.20 13.65 25.24
2019 All Employee
Average Hourly Earnings (AHE)
Feb Mar Apr May Jun Jul Aug Sep Oct Nov Dec Average
26.75 25.47 27.05 26.81 24.15 23.77 35.82 32.19 29.86 13.65 24.61
26.56 25.36 26.84 26.54 24.17 23.48 35.55 32.14 30.17 13.53 24.32
26.50 25.48 26.74 26.54 24.40 23.46 35.33 32.40 30.00 13.81 24.10
26.37 25.35 26.61 26.81 24.11 23.37 34.33 32.23 29.56 13.70 23.98
26.55 25.41 26.81 26.79 24.26 23.51 35.43 32.26 29.68 13.54 24.12
26.28 25.36 26.49 26.94 24.10 23.35 34.77 31.56 29.44 13.62 24.13
26.47 25.34 26.73 26.74 24.16 23.45 34.90 32.03 29.72 13.61 23.59
26.67 25.82 26.87 27.14 24.71 23.67 35.10 32.26 29.27 13.70 23.73
26.80 26.08 26.96 27.06 25.12 23.68 34.46 32.07 30.49 13.85 23.54
26.56 25.82 26.73 27.39 24.69 23.63 34.37 32.04 29.06 13.75 23.91
26.98 26.22 27.15 27.82 25.10 23.76 35.58 33.11 29.11 13.82 24.02
26.62 25.57 26.86 26.90 24.41 23.59 35.15 32.21 29.71 13.69 24.10
Industry
Total Private Goods Producing Private Service Providing Construction Manufacturing Trade, Transportation, and Utilities Financial Activities Professional and Business Services Educational and Health Services Leisure and Hospitality Other Services
Jan
34.5 42.1 33.1 42.1 42.4 33.8 36.9 35.4 34.0 26.0 30.0
Average Weekly Hours (AWH)
Feb
34.6 41.7 33.2 41.6 42.0 33.7 36.9 35.6 34.1 26.4 30.3
Mar
34.8 41.9 33.5 42.0 42.0 33.8 36.7 35.5 34.5 26.4 30.6
Apr
34.5 41.6 33.2 41.9 41.5 33.8 36.2 35.2 33.7 27.5 30.4
May
34.6 41.8 33.3 41.6 41.9 33.9 36.4 35.3 34.3 27.3 30.6
Jun
35.3 42.2 34.0 41.9 42.4 34.6 37.7 36.1 34.9 27.9 31.3
Jul
34.8 41.5 33.5 41.8 41.4 34.6 36.6 35.3 34.6 27.2 29.9
Aug
34.9 41.9 33.6 42.0 41.9 34.5 36.7 35.6 34.7 27.1 31.1
Sep
35.1 41.6 33.9 41.5 41.6 34.6 37.9 36.1 35.0 26.8 31.1
Oct
34.7 41.4 33.5 41.4 41.5 34.4 36.9 35.3 34.5 26.9 30.7
Nov
34.8 40.9 33.7 39.8 41.7 34.5 37.5 35.4 34.8 26.7 30.7
Dec
35.2 41.1 34.1 39.7 42.2 34.8 38.4 36.1 34.9 26.9 30.3
Average
34.8 41.6 33.6 41.4 41.9 34.3 37.1 35.6 34.5 26.9 30.6
Industry
Total Private Goods Producing Private Service Providing Construction Manufacturing Trade, Transportation, and Utilities Financial Activities Professional and Business Services Educational and Health Services Leisure and Hospitality Other Services
Average Weekly Earnings (AWE)
Jan
Feb Mar Apr May Jun Jul Aug Sep Oct Nov Dec Average
927.71 922.88 924.29 914.25 912.40 937.22 914.54 923.80 936.12 929.96 924.29 949.70 926.38 1,061.341,062.101,062.581,059.971,059.631,072.301,052.441,061.75 1,074.11 1,079.71 1,056.04 1,077.64 1,063.71 903.30 898.06 899.14 887.77 886.11 911.88 887.75 898.46 910.89 903.16 900.80 925.82 902.50 1,106.811,115.30 1,114.68 1,112.03 1,115.30 1,122.50 1,126.09 1,123.08 1,126.31 1,120.281,090.12 1,104.45 1,113.66 1,017.601,014.301,015.14 1,012.60 1,010.211,028.62 997.74 1,012.30 1,027.941,042.481,029.571,059.22 1,022.78 809.17 801.05 793.62 792.95 792.24 813.45 807.91 809.03 818.98 814.59 815.24 826.85 809.14 1,334.301,321.761,304.691,278.951,249.611,335.711,272.581,280.831,330.29 1,271.571,288.881,366.27 1,304.07 1,138.821,145.961,140.97 1,140.48 1,137.72 1,164.59 1,114.07 1,140.27 1,164.59 1,132.07 1,134.22 1,195.27 1,146.68 1,026.801,018.231,040.871,011.001,013.911,035.83 1,018.62 1,031.281,024.45 1,051.91 1,011.29 1,015.94 1,025.00 354.90 360.36 357.19 379.78 374.01 377.77 370.46 368.83 367.16 372.57 367.13 371.76 368.26 757.20 745.68 744.19 732.64 733.79 754.96 721.49 733.65 738.00 722.68 734.04 727.81 737.46
28
Source: Georgia Department of Labor, Workforce Statistics & Economic Research
Georgia Hours and Earnings
Industry
Total Private Goods Producing Private Service Providing Construction Manufacturing Trade, Transportation, and Utilities Financial Activities Professional and Business Services Educational and Health Services Leisure and Hospitality Other Services
Jan
26.08 24.16 26.52 25.09 23.46 23.37 33.95 31.35 28.85 13.22 21.99
2018 All Employee
Average Hourly Earnings (AHE)
Feb Mar Apr May Jun Jul Aug Sep Oct Nov Dec Average
26.22 24.27 26.67 25.40 23.48 23.32 33.90 32.09 29.08 13.22 22.50
26.02 24.39 26.40 25.28 23.77 23.22 34.12 31.60 28.86 13.21 23.02
26.48 24.76 26.88 25.68 24.12 23.89 33.91 32.16 29.20 13.38 23.89
26.06 24.61 26.40 25.24 23.76 23.60 33.12 31.63 28.74 13.45 23.48
25.96 24.46 26.31 25.28 23.54 23.59 32.84 31.47 28.62 13.29 23.38
26.32 24.72 26.69 25.61 23.91 23.94 34.19 31.99 29.00 13.31 23.01
26.23 24.56 26.63 25.52 23.66 23.71 34.21 31.46 29.73 13.28 23.91
26.86 25.33 27.22 26.30 24.28 24.03 34.85 32.42 29.57 13.38 24.59
26.73 25.41 27.04 26.67 24.20 23.71 34.58 32.27 30.15 13.51 24.66
26.57 25.30 26.86 26.61 23.97 23.22 34.69 32.30 29.95 13.51 24.84
26.85 25.07 27.27 26.59 23.55 23.76 35.82 32.67 30.06 13.70 24.41
26.37 24.76 26.74 25.78 23.81 23.62 34.19 31.96 29.32 13.37 23.64
Industry
Total Private Goods Producing Private Service Providing Construction Manufacturing Trade, Transportation, and Utilities Financial Activities Professional and Business Services Educational and Health Services Leisure and Hospitality Other Services
Jan
34.2 39.9 33.1 37.7 41.3 34.2 36.8 34.8 34.6 25.8 30.7
Average Weekly Hours (AWH)
Feb
34.6 41.1 33.4 39.9 41.8 34.3 37.1 35.3 34.6 26.6 31.8
Mar
34.8 41.4 33.6 41.0 41.7 34.4 36.7 35.7 34.4 27.1 32.3
Apr
35.2 41.9 33.9 42.2 41.8 34.5 38.0 36.6 34.6 27.1 32.0
May
34.8 41.5 33.5 41.5 41.5 34.5 36.7 36.2 34.4 26.8 30.5
Jun
35.0 41.5 33.8 41.0 41.8 35.2 37.0 36.1 34.4 27.1 31.2
Jul
35.2 41.8 33.9 41.1 42.3 35.3 38.0 36.2 34.4 27.1 31.1
Aug
34.8 42.0 33.4 41.3 42.4 34.8 37.1 35.7 34.1 26.5 30.3
Sep
35.2 41.9 33.9 41.1 42.5 35.1 38.4 36.4 34.4 26.4 30.8
Oct
34.6 41.2 33.3 40.7 41.5 34.4 36.8 35.6 33.9 26.5 31.5
Nov
34.7 41.4 33.4 40.1 42.6 34.5 37.5 35.5 34.2 26.5 29.6
Dec
35.3 42.9 33.9 41.8 43.9 34.7 38.3 36.3 34.6 26.8 30.1
Average
34.9 41.6 33.6 40.8 42.1 34.7 37.4 35.9 34.4 26.7 31.0
Industry
Total Private Goods Producing Private Service Providing Construction Manufacturing Trade, Transportation, and Utilities Financial Activities Professional and Business Services Educational and Health Services Leisure and Hospitality Other Services
Average Weekly Earnings (AWE)
Jan
Feb Mar Apr May Jun Jul Aug Sep Oct Nov Dec Average
891.94 907.21 905.50 932.10 906.89 908.60 926.46 912.80 945.47 924.86 921.98 947.81 920.31 963.98 997.501,009.75 1,037.44 1,021.32 1,015.091,033.30 1,031.52 1,061.331,046.89 1,047.42 1,075.50 1,030.02 877.81 890.78 887.04 911.23 884.40 889.28 904.79 889.44 922.76 900.43 897.12 924.45 898.46 945.89 1,013.461,036.481,083.70 1,047.461,036.481,052.571,053.981,080.931,085.47 1,067.06 1,111.46 1,051.82 968.90 981.46 991.211,008.22 986.04 983.97 1,011.391,003.18 1,031.901,004.30 1,021.12 1,033.85 1,002.40 799.25 799.88 798.77 824.21 814.20 830.37 845.08 825.11 843.45 815.62 801.09 824.47 819.61 1,249.361,257.691,252.201,288.581,215.501,215.081,299.221,269.191,338.241,272.541,300.88 1,371.91 1,278.71 1,090.981,132.781,128.12 1,177.06 1,145.01 1,136.07 1,158.04 1,123.12 1,180.09 1,148.81 1,146.65 1,185.92 1,147.36 998.21 1,006.17 992.78 1,010.32 988.66 984.53 997.60 1,013.79 1,017.211,022.091,024.291,040.08 1,008.61 341.08 351.65 357.99 362.60 360.46 360.16 360.70 351.92 353.23 358.02 358.02 367.16 356.98 675.09 715.50 743.55 764.48 716.14 729.46 715.61 724.47 757.37 776.79 735.26 734.74 732.84
Source: Georgia Department of Labor, Workforce Statistics & Economic Research
29
Metro Statistical Area Albany MSA Athens-Clarke County MSA Atlanta MSA Augusta-Richmond County MSA Brunswick MSA Columbus MSA Dalton MSA Gainesville MSA Hinesville MSA Macon-Bibb County MSA Rome MSA Savannah MSA Valdosta MSA Warner Robins MSA
Metro Statistical Area Albany MSA Athens-Clarke County MSA Atlanta MSA Augusta-Richmond County MSA Brunswick MSA Columbus MSA Dalton MSA Gainesville MSA Hinesville MSA Macon-Bibb County MSA Rome MSA Savannah MSA Valdosta MSA Warner Robins MSA
Metro Statistical Area Albany MSA Athens-Clarke County MSA Atlanta MSA Augusta-Richmond County MSA Brunswick MSA Columbus MSA Dalton MSA Gainesville MSA Hinesville MSA Macon-Bibb County MSA Rome MSA Savannah MSA Valdosta MSA Warner Robins MSA
30
msa Hours and Earnings
Jan 20.44 25.22 29.43 23.78 20.54 22.57 20.86 25.02 21.61 23.74 20.24 22.96 21.05 21.03
2019 All Employee
Average Hourly Earnings (AHE)
Feb 20.62 24.89 29.18 24.52 20.24 22.52 20.90 24.98 21.42 24.15 19.64 23.04 21.73 21.06
Mar 21.17 25.22 29.06 24.67 19.60 23.13 21.13 24.98 20.87 24.02 20.47 22.40 21.51 20.90
Apr 21.14 24.81 29.04 23.56 19.78 23.46 20.72 24.91 21.51 24.65 20.71 22.80 21.71 20.97
May 21.43 24.61 28.88 24.04 19.75 23.33 21.27 25.44 22.60 24.48 20.74 22.44 21.60 20.84
Jun 21.58 24.65 29.17 24.75 20.06 23.05 20.92 25.51 22.10 24.19 20.69 22.54 21.81 20.88
Jul 21.17 24.60 28.81 23.84 19.69 22.84 20.34 25.29 21.82 23.71 20.87 22.39 21.15 20.78
Aug 21.93 24.76 28.95 24.09 19.88 23.16 20.36 26.53 22.23 23.90 22.44 22.45 21.43 20.57
Sep 22.13 24.39 29.23 24.62 20.06 23.60 20.71 25.90 21.97 23.40 21.09 23.15 21.50 20.50
Oct 21.56 24.93 29.37 24.18 20.15 23.15 20.82 25.85 24.04 23.19 20.95 23.38 21.96 20.76
Nov 21.55 24.55 29.04 24.28 19.77 23.73 20.58 26.80 22.99 23.21 20.79 22.79 21.29 20.85
Dec 21.59 25.76 29.45 24.65 19.97 23.86 20.70 27.07 22.88 23.02 21.34 23.24 21.91 21.29
Average 21.36 24.87 29.13 24.25 19.95 23.20 20.78 25.69 22.17 23.80 20.83 22.80 21.56 20.87
Average Weekly Hours (AWH)
Jan 35.4 31.7 34.4 34.4 30.5 34.8 34.3 39.9 33.9 36.4 36.0 32.8 34.7 36.8
Feb 34.2 31.0 34.4 34.6 30.8 35.0 34.5 39.1 34.5 36.6 35.2 33.3 36.8 37.0
Mar 34.5 31.1 34.8 34.9 32.0 35.3 33.9 38.6 34.1 36.5 35.0 33.3 36.7 38.1
Apr 35.4 31.6 34.3 35.8 32.1 34.8 33.9 38.9 34.4 36.5 34.6 33.1 36.7 37.4
May 35.0 31.5 34.6 34.9 32.3 34.7 34.2 38.7 33.5 36.7 35.1 33.3 37.3 38.3
Jun 35.3 32.3 35.3 35.4 31.9 35.9 34.8 39.6 34.5 37.1 35.4 33.1 37.8 39.6
Jul 35.2 31.7 34.7 35.0 32.0 35.1 34.3 39.7 34.3 36.8 34.8 33.5 36.4 38.7
Aug 35.0 30.0 34.9 35.0 31.7 34.7 34.7 38.7 35.0 36.7 34.1 33.3 36.3 39.8
Sep 35.1 30.7 35.2 35.2 30.0 34.8 34.8 39.2 34.1 37.4 35.3 32.8 35.9 40.4
Oct 35.2 30.6 34.7 35.2 31.2 34.8 34.5 39.0 34.2 36.9 35.3 33.4 35.1 37.9
Nov 35.4 30.8 34.6 35.1 31.2 34.2 33.9 38.7 32.3 37.3 35.3 33.6 35.6 38.7
Dec 34.9 31.7 35.1 35.0 30.4 34.4 34.2 39.4 32.7 37.4 35.3 33.5 37.3 39.1
Average 35.1 31.2 34.8 35.0 31.4 34.9 34.3 39.1 34.0 36.9 35.1 33.3 36.4 38.5
Average Weekly Earnings (AWE)
Jan
Feb Mar Apr May Jun Jul Aug Sep Oct Nov Dec Average
723.58 705.20 730.37 748.36 750.05 761.77 745.18 767.55 776.76 758.91 762.87 753.49 749.74
799.47 771.59 784.34 784.00 775.22 796.20 779.82 742.80 748.77 762.86 756.14 816.59 775.94
1,012.391,003.79 1,011.29 996.07 999.25 1,029.70 999.71 1,010.36 1,028.90 1,019.14 1,004.78 1,033.70 1,013.72
818.03 848.39 860.98 843.45 839.00 876.15 834.40 843.15 866.62 851.14 852.23 862.75 848.75
626.47 623.39 627.20 634.94 637.93 639.91 630.08 630.20 601.80 628.68 616.82 607.09 626.43
785.44 788.20 816.49 816.41 809.55 827.50 801.68 803.65 821.28 805.62 811.57 820.78 809.68
715.50 721.05 716.31 702.41 727.43 728.02 697.66 706.49 721.06 718.29 697.66 707.94 712.75
998.30 976.72 964.23 969.00 984.53 1,010.20 1,004.01 1,026.71 1,015.28 1,008.15 1,037.16 1,066.56 1,004.48
732.58 738.99 711.67 739.94 757.10 762.45 748.43 778.05 749.18 822.17 742.58 748.18 753.78
864.14 883.89 876.73 899.73 898.42 897.45 872.53 877.13 875.16 855.71 865.73 860.95 878.22
728.64 691.33 716.45 716.57 727.97 732.43 726.28 765.20 744.48 739.54 733.89 753.30 731.13
753.09 767.23 745.92 754.68 747.25 746.07 750.07 747.59 759.32 780.89 765.74 778.54 759.24
730.44 799.66 789.42 796.76 805.68 824.42 769.86 777.91 771.85 770.80 757.92 817.24 784.78
773.90 779.22 796.29 784.28 798.17 826.85 804.19 818.69 828.20 786.80 806.90 832.44 803.50
Source: Georgia Department of Labor, Workforce Statistics & Economic Research
Metro Statistical Area Albany MSA Athens-Clarke County MSA Atlanta MSA Augusta-Richmond County MSA Brunswick MSA Columbus MSA Dalton MSA Gainesville MSA Hinesville MSA Macon-Bibb County MSA Rome MSA Savannah MSA Valdosta MSA Warner Robins MSA
Metro Statistical Area Albany MSA Athens-Clarke County MSA Atlanta MSA Augusta-Richmond County MSA Brunswick MSA Columbus MSA Dalton MSA Gainesville MSA Hinesville MSA Macon-Bibb County MSA Rome MSA Savannah MSA Valdosta MSA Warner Robins MSA
Metro Statistical Area Albany MSA Athens-Clarke County MSA Atlanta MSA Augusta-Richmond County MSA Brunswick MSA Columbus MSA Dalton MSA Gainesville MSA Hinesville MSA Macon-Bibb County MSA Rome MSA Savannah MSA Valdosta MSA Warner Robins MSA
msa Hours and Earnings
Jan 22.49 22.47 28.84 23.05 19.75 20.81 19.48 24.37 21.80 23.34 19.31 22.67 19.45 20.65
2018 All Employee
Average Hourly Earnings (AHE)
Feb 22.32 22.85 28.98 23.84 20.25 20.86 19.72 24.93 21.48 23.78 19.77 23.02 20.13 20.64
Mar 22.10 22.87 28.70 22.76 20.37 20.66 19.43 24.83 21.15 24.14 19.25 22.93 20.59 20.23
Apr 22.46 22.83 29.28 22.80 20.43 21.65 19.17 24.69 21.75 24.35 19.20 23.17 21.06 20.90
May 21.56 22.73 28.76 22.85 19.94 21.02 19.46 24.70 21.48 24.11 19.02 22.67 20.39 20.67
Jun 21.55 22.82 28.75 22.91 20.51 20.74 20.13 24.65 20.80 23.45 19.00 22.68 20.30 20.54
Jul 21.35 23.67 29.13 23.56 20.50 21.35 19.99 24.89 21.34 24.40 18.95 22.49 20.84 20.61
Aug 21.48 23.73 28.92 23.29 20.38 22.06 19.74 24.56 21.47 24.42 19.60 22.35 21.75 20.97
Sep 21.92 23.58 29.76 23.78 20.94 22.28 20.78 24.84 21.36 24.45 18.66 22.09 21.90 21.04
Oct 22.17 24.05 29.43 23.49 20.96 22.07 20.51 24.85 21.68 24.55 19.28 22.74 22.05 21.56
Nov 20.81 23.59 28.77 23.65 20.39 21.98 20.67 25.50 21.13 24.78 18.95 22.39 21.32 21.07
Dec 20.78 25.15 29.12 24.14 20.24 22.02 20.62 24.75 21.03 24.56 19.78 22.79 21.20 21.33
Average 21.74 23.37 29.04 23.34 20.39 21.47 19.98 24.80 21.37 24.20 19.23 22.67 20.93 20.85
Jan 32.1 31.1 34.4 34.2 32.7 34.0 33.1 38.0 36.4 34.4 37.0 32.9 33.1 37.6
Average Weekly Hours (AWH)
Feb 32.7 31.3 34.8 34.7 33.7 35.1 33.2 38.1 34.7 34.6 37.3 33.5 34.7 37.6
Mar 33.5 30.5 34.9 35.1 32.8 35.2 34.4 37.5 36.1 34.6 37.4 33.5 35.5 39.0
Apr 33.7 31.5 35.4 35.0 32.2 35.4 34.1 38.2 34.2 35.0 37.0 34.0 36.8 38.6
May 34.2 30.7 35.0 34.5 33.0 34.2 34.3 38.3 34.2 34.5 36.6 32.8 34.4 37.7
Jun 34.6 32.3 35.2 33.4 33.4 34.5 33.9 38.6 35.5 35.0 36.1 33.6 34.8 38.7
Jul 34.9 32.2 35.4 33.4 33.6 35.1 34.4 38.9 36.1 35.2 37.1 33.7 35.2 39.4
Aug 34.8 32.2 34.9 34.2 32.7 34.8 35.6 39.2 35.4 35.1 36.3 33.1 34.4 37.4
Sep 35.9 32.6 35.3 34.1 32.3 35.4 33.8 39.8 35.6 36.7 37.5 32.6 35.4 38.1
Oct 34.1 31.5 34.8 34.1 31.6 34.6 34.7 39.3 33.7 35.5 36.7 32.6 34.7 37.2
Nov 34.0 31.7 34.6 35.0 32.2 35.1 35.9 39.6 35.0 36.6 36.4 33.0 35.1 36.5
Dec 34.6 31.9 35.4 34.8 31.3 36.0 34.6 40.6 35.4 36.1 36.8 32.5 35.1 37.0
Average 34.1 31.6 35.0 34.4 32.6 35.0 34.3 38.9 35.2 35.3 36.9 33.2 34.9 37.9
Average Weekly Earnings (AWE)
Jan
Feb Mar Apr May Jun Jul Aug Sep Oct Nov Dec Average
721.93 729.86 740.35 756.90 737.35 745.63 745.12 747.50 786.93 756.00 707.54 718.99 741.33
698.82 715.21 697.54 719.15 697.81 737.09 762.17 764.11 768.71 757.58 747.80 802.29 738.49
992.10 1,008.50 1,001.63 1,036.51 1,006.60 1,012.00 1,031.20 1,009.31 1,050.53 1,024.16 995.44 1,030.85 1,016.40
788.31 827.25 798.88 798.00 788.33 765.19 786.90 796.52 810.90 801.01 827.75 840.07 802.90
645.83 682.43 668.14 657.85 658.02 685.03 688.80 666.43 676.36 662.34 656.56 633.51 664.71
707.54 732.19 727.23 766.41 718.88 715.53 749.39 767.69 788.71 763.97 771.50 792.72 751.45
644.79 654.70 668.39 653.70 667.48 682.41 687.66 702.74 702.36 711.70 742.05 713.45 685.31
926.06 949.83 931.13 943.16 946.01 951.49 968.22 962.75 988.63 976.61 1,009.80 1,004.85 964.72
793.52 745.36 763.88 743.85 734.62 738.40 770.37 760.04 760.42 730.62 739.55 744.46 752.22
802.90 822.79 835.24 852.25 831.80 820.75 858.88 857.14 897.32 871.53 906.95 886.62 854.26
714.47 737.42 719.95 710.40 696.13 685.90 703.05 711.48 699.75 707.58 689.78 727.90 709.59
745.84 771.17 768.16 787.78 743.58 762.05 757.91 739.79 720.13 741.32 738.87 740.68 752.64
643.80 698.51 730.95 775.01 701.42 706.44 733.57 748.20 775.26 765.14 748.33 744.12 730.46
776.44 776.06 788.97 806.74 779.26 794.90 812.03 784.28 801.62 802.03 769.06 789.21 790.22
Source: Georgia Department of Labor, Workforce Statistics & Economic Research
31
Industry Manufacturing
Durable Goods Non-Durable Goods
Industry Manufacturing
Durable Goods Non-Durable Goods
Industry Manufacturing
Durable Goods Non-Durable Goods
Industry Manufacturing
Durable Goods Non-Durable Goods
Industry Manufacturing
Durable Goods Non-Durable Goods
Industry Manufacturing
Durable Goods Non-Durable Goods
32
Georgia Production Worker Hours and Earnings
Jan 19.29 21.24 17.38
2019
Average Hourly Earnings (AHE)
Feb Mar Apr May Jun Jul
19.42 19.50 19.71 19.25 19.49 19.65
21.53 17.32
21.52 17.47
21.98 17.48
21.57 16.91
21.63 17.35
22.09 17.22
Aug 19.46 21.66 17.23
Sep 19.70 21.79 17.60
Oct 19.85 22.13 17.62
Nov 19.70 22.01 17.44
Dec 20.06 22.53 17.61
Average 19.59 21.80 17.39
Average Weekly Hours (AWH)
Jan
Feb Mar Apr May Jun Jul Aug Sep Oct Nov Dec Average
43.1
42.5 43.0 42.5 42.4 43.1 42.4 43.1 43.3 42.2 42.5 43.2 42.8
43.0
42.7 43.5 42.6 43.1 43.9 42.9 43.6 43.8 42.8 42.9 43.8 43.2
43.1
42.2 42.4 42.4 41.7 42.4 42.0 42.6 42.8 41.7 42.1 42.7 42.3
Average Weekly Earnings (AWE)
Jan
Feb Mar Apr May Jun Jul Aug Sep Oct Nov Dec Average
831.40 825.35 838.50 837.68 816.20 840.02 833.16 838.73 853.01 837.67 837.25 866.59 838.45
913.32 919.33 936.12 936.35 929.67 949.56 947.66 944.38 954.40 947.16 944.23 986.81 941.76
749.08 730.90 740.73 741.15 705.15 735.64 723.24 734.00 753.28 734.75 734.22 751.95 735.60
Jan 18.50 20.49 16.53
2018
Average Hourly Earnings (AHE)
Feb Mar Apr May Jun Jul Aug Sep Oct Nov Dec 18.67 18.86 18.89 18.78 18.76 18.85 18.92 19.07 19.22 19.20 19.32 20.82 20.75 20.90 20.62 20.57 20.77 20.76 21.07 21.45 21.45 21.09 16.51 16.90 16.88 16.90 16.89 16.88 17.04 17.00 16.98 17.01 17.55
Average 18.92 20.89 16.92
Average Weekly Hours (AWH)
Jan
Feb Mar Apr May Jun Jul Aug Sep Oct Nov Dec Average
43.2
43.5 42.7 43.2 42.6 43.0 43.5 43.7 43.0 42.1 43.3 44.6 43.2
43.7
44.3 44.1 43.6 43.3 43.8 44.2 44.2 44.0 42.6 43.0 44.9 43.8
42.7
42.7 41.4 42.8 41.9 42.1 42.9 43.1 42.0 41.7 43.6 44.2 42.6
Average Weekly Earnings (AWE)
Jan
Feb Mar Apr May Jun Jul Aug Sep Oct Nov Dec Average
799.20 812.15 805.32 816.05 800.03 806.68 819.98 826.80 820.01 809.16 831.36 861.67 817.34
895.41 922.33 915.08 911.24 892.85 900.97 918.03 917.59 927.08 913.77 922.35 946.94 914.98
705.83 704.98 699.66 722.46 708.11 711.07 724.15 734.42 714.00 708.07 741.64 775.71 720.79
Note: These average hours and earnings data are of production employees on manufacturing payrolls
Source: Georgia Department of Labor, Workforce Statistics & Economic Research
Georgia Labor Force Estimates
Place of Residence - Persons 16 Years and Older
Area
Employment Status
2019
2018
2017
Change From
2018-2019
2017-2018
Georgia
(Not seasonally adjusted)
Albany MSA Athens-Clarke County MSA
Atlanta MSA Augusta-Richmond
County MSA
Brunswick MSA
Columbus MSA
Dalton MSA
Gainesville MSA
Hinesville MSA
Civilian labor force Employed Unemployed Rate
Civilian labor force Employed Unemployed Rate
Civilian labor force Employed Unemployed Rate
Civilian labor force Employed Unemployed Rate
Civilian labor force Employed Unemployed Rate
Civilian labor force Employed Unemployed Rate
Civilian labor force Employed Unemployed Rate
Civilian labor force Employed Unemployed Rate
Civilian labor force Employed Unemployed Rate
Civilian labor force Employed Unemployed Rate
5,110,318
5,080,472
5,048,651
29,846
31,821
4,935,310
4,880,038
4,812,097
55,272
67,941
175,008
200,434
236,554
-25,426
-36,120
3.4
3.9
4.7
66,614
66,727
67,985
-113
-1,258
63,770
63,452
64,302
318
-850
2,844
3,275
3,683
-431
-408
4.3
4.9
5.4
98,817
101,207
100,799
-2,390
408
95,594
97,475
96,377
-1,881
1,098
3,223
3,732
4,422
-509
-690
3.3
3.7
4.4
3,090,100
3,056,740
3,029,401
33,360
27,339
2,989,672
2,941,061
2,892,848
48,611
48,213
100,428
115,679
136,553
-15,251
-20,874
3.2
3.8
4.5
267,637
267,389
266,333
248
1,056
257,992
256,252
253,300
1,740
2,952
9,645
11,137
13,033
-1,492
-1,896
3.6
4.2
4.9
52,770
53,289
53,145
-519
144
50,951
51,251
50,560
-300
691
1,819
2,038
2,585
-219
-547
3.4
3.8
4.9
123,338
124,532
124,344
-1,194
188
118,385
118,743
117,659
-358
1,084
4,953
5,789
6,685
-836
-896
4.0
4.6
5.4
59,069
60,658
60,669
-1,589
-11
56,362
57,692
57,275
-1,330
417
2,707
2,966
3,394
-259
-428
4.6
4.9
5.6
102,061
101,542
100,178
519
1,364
99,222
98,304
96,297
918
2,007
2,839
3,238
3,881
-399
-643
2.8
3.2
3.9
34,233
33,724
33,409
509
315
32,960
32,312
31,725
648
587
1,273
1,412
1,684
-139
-272
3.7
4.2
5.0
Note: Georgia and Metropolitan Statistical Area data have not been seasonally adjusted. Employment includes Nonfarm wage and salary employment, self-
employment, unpaid family and private household workers and agricultural workers. Persons in labor disputes are counted as employed. The use of unrounded data does not imply that the numbers are exact.
Albany MSA: Baker, Dougherty, Lee, Terrell, and Worth counties. Athens-Clarke County MSA: Clarke, Madison, Oconee, and Oglethorpe counties. Atlanta MSA: Barrow, Bartow, Butts, Carroll, Cherokee, Clayton, Cobb, Coweta, Dawson, DeKalb, Douglas, Fayette, Forsyth, Fulton, Gwinnett, Haralson, Heard, Henry, Jasper, Lamar, Meriwether, Morgan, Newton, Paulding, Pickens, Pike, Rockdale, Spalding, and Walton counties. Augusta-Richmond County MSA: Burke, Columbia, Lincoln, McDuffie, and Richmond counties in Georgia and Aiken and Edgefield counties in South Carolina. Brunswick MSA: Brantley, Glynn, and McIntosh counties. Columbus MSA: Chattahoochee, Harris, Marion, and Muscogee counties in Georgia and Russell County in Alabama. Dalton MSA: Murray and Whitfield counties. Gainesville MSA: Hall County. Hinesville MSA: Liberty and Long counties. Macon-Bibb County MSA: Bibb, Crawford, Jones, Monroe, and Twiggs counties. Rome MSA: Floyd County. Savannah MSA: Bryan, Chatham, and Effingham counties. Valdosta MSA: Brooks, Echols, Lanier, and Lowndes counties. Warner Robins MSA: Houston, Peach and Pulaski counties.
Source: Georgia Department of Labor, Workforce Statistics & Economic Research
Georgia Department of Labor Mark Butler, Commissioner
33
Equal Opportunity Employer/Program Auxiliary Aids and Services Available Upon Request to Individuals With Disabilities
Georgia Labor Force Estimates Place of Residence - Persons 16 Years and Older
Area
Employment Status
2019
2018
2017
Change From
2018-2019
2017-2018
Macon-Bibb County MSA Rome MSA
Savannah MSA
Valdosta MSA
Warner Robins MSA
Civilian labor force Employed Unemployed Rate
Civilian labor force Employed Unemployed Rate
Civilian labor force Employed Unemployed Rate
Civilian labor force Employed Unemployed Rate
Civilian labor force Employed Unemployed Rate
103,070
104,258
105,082
-1,188
-824
99,210
99,771
99,745
-561
26
3,860
4,487
5,337
-627
-850
3.7
4.3
5.1
44,144
44,146
44,121
-2
25
42,455
42,261
41,842
194
419
1,689
1,885
2,279
-196
-394
3.8
4.3
5.2
188,832
188,331
185,545
501
2,786
182,790
181,532
177,456
1,258
4,076
6,042
6,799
8,089
-757
-1,290
3.2
3.6
4.4
63,738
64,108
64,358
-370
-250
61,501
61,516
61,393
-15
123
2,237
2,592
2,965
-355
-373
3.5
4.0
4.6
86,223
85,640
84,863
583
777
83,245
82,056
80,727
1,189
1,329
2,978
3,584
4,136
-606
-552
3.5
4.2
4.9
Area
United States
(Not Seasonally adjusted)
United States Labor Force Estimates Place of Residence - Persons 16 Years and Older
Employment Status
2019
2018
2017
Change From
2018-2019
2017-2018
Civilian labor force Employed Unemployed
Rate
163,539,000 157,538,000
6,001,000 3.7
162,075,000 155,761,000
6,314,000 3.9
160,320,000
1,464,000
1,755,000
153,337,000
1,777,000
2,424,000
6,982,000
-313,000
-668,000
4.4
Note: Georgia and Metropolitan Statistical Area data have not been seasonally adjusted. Employment includes Nonfarm wage and salary employment, self-
employment, unpaid family and private household workers and agricultural workers. Persons in labor disputes are counted as employed. The use of unrounded data does not imply that the numbers are exact.
Albany MSA: Baker, Dougherty, Lee, Terrell, and Worth counties. Athens-Clarke County MSA: Clarke, Madison, Oconee, and Oglethorpe counties. Atlanta MSA: Barrow, Bartow, Butts, Carroll, Cherokee, Clayton, Cobb, Coweta, Dawson, DeKalb, Douglas, Fayette, Forsyth, Fulton, Gwinnett, Haralson, Heard, Henry, Jasper, Lamar, Meriwether, Morgan, Newton, Paulding, Pickens, Pike, Rockdale, Spalding, and Walton counties. Augusta-Richmond County MSA: Burke, Columbia, Lincoln, McDuffie, and Richmond counties in Georgia and Aiken and Edgefield counties in South Carolina. Brunswick MSA: Brantley, Glynn, and McIntosh counties. Columbus MSA: Chattahoochee, Harris, Marion, and Muscogee counties in Georgia and Russell County in Alabama. Dalton MSA: Murray and Whitfield counties. Gainesville MSA: Hall County. Hinesville MSA: Liberty and Long counties. Macon-Bibb County MSA: Bibb, Crawford, Jones, Monroe, and Twiggs counties. Rome MSA: Floyd County. Savannah MSA: Bryan, Chatham, and Effingham counties. Valdosta MSA: Brooks, Echols, Lanier, and Lowndes counties. Warner Robins MSA: Houston, Peach and Pulaski counties.
Source: Georgia Department of Labor, Workforce Statistics & Economic Research
34
City Labor Force Estimates
Place of Residence - Persons 16 Years and Older
2019 Annual Averages
Labor Force
Employment
Unemployment Number Rate
*Albany 31,244 29,727 1,517 4.9
*Alpharetta 36,692 35,697
995 2.7
*Athens 59,096 56,997 2,099 3.6
*Atlanta 261,769 252,208 9,561 3.7
Fulton part
237,730 228,803 8,927 3.8
DeKalb part
24,041 23,406
635 2.6
*Augusta 85,085 81,242 3,843 4.5
*Brookhaven
34,343 33,605
738 2.1
*Canton 15,500 15,110
390 2.5
Carrollton 11,408 10,927
481 4.2
*Chamblee 20,413 19,961
452 2.2
*Columbus 77,490 73,977 3,513 4.5
Dalton 13,721 13,092
629 4.6
Decatur 14,442 14,063
379 2.6
Douglasville
17,312 16,679
633 3.7
Duluth 16,086 15,622
464 2.9
*Dunwoody 27,489 26,797
692 2.5
East Point
16,697 15,901
796 4.8
Gainesville 19,714 19,126
588 3.0
Hinesville 15,218 14,679
539 3.5
*Johns Creek
45,009 43,752 1,257 2.8
Kennesaw 20,074 19,495
579 2.9
LaGrange 15,219 14,664
555 3.6
Lawrenceville
14,409 13,915
494 3.4
McDonough
11,903 11,351
552 4.6
*Macon-Bibb
67,896 65,249 2,647 3.9
*Marietta 35,606 34,528 1,078 3.0
Milton 20,181 19,625
556 2.8
Newnan 18,431 17,819
612 3.3
Peachtree City 18,567 18,079
488 2.6
P'tree Corners 24,956 24,262
694 2.8
Rome 15,424 14,798
626 4.1
*Roswell 53,780 52,389 1,391 2.6
*Sandy Springs 65,658 63,931 1,727 2.6
*Savannah 67,342 64,870 2,472 3.7
*Smyrna 35,191 34,186 1,005 2.9
Statesboro 13,750 13,058
692 5.0
Stockbridge
14,465 13,888
577 4.0
Tucker 19,852 19,261
591 3.0
*Valdosta 25,057 24,081
976 3.9
*Warner Robins 33,276 32,109 1,167 3.5
Woodstock 17,372 16,901
471 2.7
2018 Annual Averages
Labor Force
Employment
Unemployment Number Rate
31,310 29,587 1,723 5.5
36,238 35,115 1,123 3.1
60,536 58,133 2,403 4.0
259,111 248,094 11,017 4.3
235,332 225,070 10,262 4.4
23,779 23,024
755 3.2
85,448 81,021 4,427 5.2
33,929 33,057
872 2.6
15,292 14,870
422 2.8
11,309 10,752
557 4.9
20,160 19,636
524 2.6
78,351 74,367 3,984 5.1
14,105 13,403
702 5.0
13,446 13,016
430 3.2
17,144 16,408
736 4.3
15,906 15,373
533 3.4
27,186 26,359
827 3.0
16,555 15,642
913 5.5
19,620 18,949
671 3.4
14,987 14,389
598 4.0
44,465 43,038 1,427 3.2
19,824 19,181
643 3.2
14,884 14,261
623 4.2
14,273 13,694
579 4.1
11,510 10,884
626 5.4
68,732 65,631 3,101 4.5
35,158 33,972 1,186 3.4
19,941 19,304
637 3.2
18,226 17,526
700 3.8
18,343 17,780
563 3.1
24,709 23,876
833 3.4
15,441 14,731
710 4.6
53,159 51,535 1,624 3.1
64,879 62,888 1,991 3.1
67,199 64,427 2,772 4.1
34,810 33,636 1,174 3.4
13,899 13,110
789 5.7
14,333 13,651
682 4.8
19,642 18,947
695 3.5
25,235 24,098 1,137 4.5
33,020 31,649 1,371 4.2
17,151 16,631
520 3.0
2017 Annual Averages
Labor Force
Employment
Unemployment Number Rate
31,392 29,467 1,925 6.1
36,023 34,677 1,346 3.7
60,792 57,928 2,864 4.7
253,405 240,439 12,966 5.1
233,280 221,120 12,160 5.2
20,125 19,319
806 4.0
85,796 80,713 5,083 5.9
33,521 32,487 1,034 3.1
14,600 14,095
505 3.5
11,566 10,844
722 6.2
19,956 19,351
605 3.0
78,847 74,199 4,648 5.9
14,153 13,359
794 5.6
13,270 12,766
504 3.8
16,939 16,069
870 5.1
15,904 15,253
651 4.1
27,283 26,288
995 3.6
16,848 15,746 1,102 6.5
19,113 18,323
790 4.1
14,947 14,252
695 4.6
44,550 42,815 1,735 3.9
19,952 19,170
782 3.9
15,383 14,618
765 5.0
14,357 13,653
704 4.9
11,388 10,673
715 6.3
69,412 65,754 3,658 5.3
35,358 33,915 1,443 4.1
19,808 19,051
757 3.8
17,892 17,044
848 4.7
18,082 17,430
652 3.6
24,552 23,610
942 3.8
15,381 14,529
852 5.5
53,255 51,318 1,937 3.6
63,644 61,350 2,294 3.6
66,886 63,558 3,328 5.0
34,787 33,435 1,352 3.9
13,885 12,982
903 6.5
14,123 13,331
792 5.6
19,596 18,799
797 4.1
25,304 24,026 1,278 5.1
32,683 31,080 1,603 4.9
16,802 16,195
607 3.6
Note: City estimates were prepared in cooperation with the U.S. Department of Labor, Bureau of Labor Statistics. All cities listed have total population of 25,000 or more and an asterisks (*) designates cities with population of 50,000 or more.
Source: Georgia Department of Labor, Workforce Statistics & Economic Research
35
County Labor Force Estimates (not seasonally adjusted) Place of Residence - Persons 16 Years and Older
2019 Annual Averages
Labor Force
Employment
Unemployment Number Rate
2018 Annual Averages
Labor Force
Employment
Unemployment Number Rate
2017 Annual Averages
Labor Force
Employment
Unemployment Number Rate
Georgia
5,110,318 4,935,310 175,008 3.4
5,080,472 4,880,038 200,434 3.9
5,048,651 4,812,097 236,554 4.7
Appling
9,306 8,945
361 3.9
9,003
8,616
387 4.3
9,245
8,741
504 5.5
Atkinson
4,695
4,552
143 3.0
4,334
4,182
152 3.5
4,158 3,973
185 4.4
Bacon
4,966
4,790
176 3.5
5,007
4,818
189 3.8
5,044 4,821
223 4.4
Baker
1,163
1,108
55 4.7
1,157
1,096
61 5.3
1,234
1,158
76 6.2
Baldwin
17,409 16,671
738 4.2
17,583 16,715
868 4.9
17,561 16,538 1,023 5.8
Banks
9,616
9,352
264 2.7
9,492
9,194
298 3.1
9,256 8,898
358 3.9
Barrow
40,385 39,247 1,138 2.8
39,906 38,596 1,310 3.3
39,123 37,548 1,575 4.0
Bartow
50,539 48,885 1,654 3.3
49,962 48,075 1,887 3.8
49,463 47,201 2,262 4.6
Ben Hill
5,348 5,053
295 5.5
5,453
5,133
320 5.9
5,457 5,036
421 7.7
Berrien
7,474
7,176
298 4.0
7,431
7,122
309 4.2
7,375 7,000
375 5.1
Bibb
67,896 65,249 2,647 3.9
68,732 65,631 3,101 4.5
69,412 65,754 3,658 5.3
Bleckley
4,531 4,303
228 5.0
4,587
4,323
264 5.8
4,572 4,267
305 6.7
Brantley
7,258 6,964
294 4.1
7,329
7,002
327 4.5
7,289 6,876
413 5.7
Brooks
6,901 6,668
233 3.4
6,929
6,656
273 3.9
7,030 6,715
315 4.5
Bryan
18,286 17,738
548 3.0
18,232 17,618
614 3.4
17,573 16,841
732 4.2
Bulloch
36,540 35,170 1,370 3.7
36,878 35,309 1,569 4.3
36,595 34,764 1,831 5.0
Burke
9,154 8,689
465 5.1
9,215
8,656
559 6.1
9,316 8,657
659 7.1
Butts
10,737 10,377
360 3.4
10,636 10,204
432 4.1
10,597 10,092
505 4.8
Calhoun
2,233
2,152
81 3.6
2,233
2,139
94 4.2
2,243 2,126
117 5.2
Camden
20,869 20,113
756 3.6
20,799 19,929
870 4.2
20,810 19,762 1,048 5.0
Candler
5,548 5,383
165 3.0
5,320
5,139
181 3.4
5,218 5,006
212 4.1
Carroll
55,210 53,325 1,885 3.4
54,655 52,470 2,185 4.0
54,782 52,048 2,734 5.0
Catoosa
33,517 32,518
999 3.0
33,304 32,173 1,131 3.4
32,789 31,445 1,344 4.1
Charlton
4,785 4,604
181 3.8
4,782
4,576
206 4.3
4,850 4,608
242 5.0
Chatham
139,657 135,052 4,605 3.3
139,311 134,128 5,183 3.7
138,565 132,390 6,175 4.5
Chattahoochee 1,997 1,906
91 4.6
2,024
1,913
111 5.5
1,984 1,850
134 6.8
Chattooga
10,307
9,795
512 5.0
10,441 10,016
425 4.1
10,535 10,042
493 4.7
Cherokee
135,814 132,118 3,696 2.7
134,188 130,011 4,177 3.1
130,797 125,939 4,858 3.7
Clarke
59,096 56,997 2,099 3.6
60,536 58,133 2,403 4.0
60,792 57,928 2,864 4.7
Clay
880
819
61 6.9
844
781
63 7.5
866
788
78 9.0
Clayton
137,796 131,980 5,816 4.2
136,452 129,776 6,676 4.9
134,864 127,048 7,816 5.8
Clinch
2,654 2,550
104 3.9
2,747
2,623
124 4.5
2,769 2,618
151 5.5
Cobb
425,167 412,592 12,575 3.0
420,300 405,949 14,351 3.4
420,122 403,070 17,052 4.1
Coffee
18,869 18,138
731 3.9
18,725 17,886
839 4.5
18,415 17,484
931 5.1
Colquitt
21,377 20,702
675 3.2
21,425 20,623
802 3.7
22,032 21,046
986 4.5
Columbia
75,134 72,860 2,274 3.0
75,301 72,695 2,606 3.5
74,104 71,074 3,030 4.1
Cook
7,988
7,718
270 3.4
7,807
7,513
294 3.8
7,699 7,353
346 4.5
Coweta
74,594 72,410 2,184 2.9
73,745 71,217 2,528 3.4
72,498 69,481 3,017 4.2
Crawford
5,605 5,404
201 3.6
5,664
5,429
235 4.1
5,720 5,440
280 4.9
Crisp
9,433 9,065
368 3.9
9,349
8,898
451 4.8
9,382 8,898
484 5.2
Dade
8,209
7,941
268 3.3
8,174
7,876
298 3.6
8,190 7,835
355 4.3
Dawson
12,320 11,971
349 2.8
12,194 11,789
405 3.3
11,855 11,399
456 3.8
Decatur
11,540 11,101
439 3.8
11,434 10,902
532 4.7
11,635 10,994
641 5.5
DeKalb
399,354 385,700 13,654 3.4
395,355 379,404 15,951 4.0
394,399 375,592 18,807 4.8
Dodge
7,081
6,700
381 5.4
7,126
6,758
368 5.2
7,117 6,675
442 6.2
Dooly
5,071 4,880
191 3.8
5,095
4,858
237 4.7
5,076 4,821
255 5.0
Dougherty
38,327 36,509 1,818 4.7
38,394 36,337 2,057 5.4
38,827 36,503 2,324 6.0
Douglas
73,217 70,640 2,577 3.5
72,492 69,493 2,999 4.1
71,904 68,410 3,494 4.9
Early
4,372
4,201
171 3.9
4,510
4,303
207 4.6
4,523 4,279
244 5.4
Echols
1,909
1,856
53 2.8
1,908
1,847
61 3.2
1,901 1,827
74 3.9
Source: Georgia Department of Labor, Workforce Statistics & Economic Research
36
County Labor Force Estimates (not seasonally adjusted) Place of Residence - Persons 16 Years and Older
2019 Annual Averages
Labor Force
Employment
Unemployment Number Rate
2018 Annual Averages
Labor Force
Employment
Unemployment Number Rate
2017 Annual Averages
Labor Force
Employment
Unemployment Number Rate
Effingham
30,889 30,000
889 2.9
30,787 29,785 1,002 3.3
29,406 28,225 1,181 4.0
Elbert
7,658
7,352
306 4.0
7,790
7,417
373 4.8
7,844 7,435
409 5.2
Emanuel
8,287
7,847
440 5.3
8,284
7,795
489 5.9
8,576 8,006
570 6.6
Evans
4,862 4,698
164 3.4
4,881
4,701
180 3.7
4,881 4,669
212 4.3
Fannin
11,512 11,132
380 3.3
11,230 10,786
444 4.0
10,960 10,439
521 4.8
Fayette
57,985 56,256 1,729 3.0
57,325 55,327 1,998 3.5
56,870 54,570 2,300 4.0
Floyd
44,144 42,455 1,689 3.8
44,146 42,261 1,885 4.3
44,121 41,842 2,279 5.2
Forsyth
122,076 118,737 3,339 2.7
120,607 116,807 3,800 3.2
116,234 111,910 4,324 3.7
Franklin
9,942 9,592
350 3.5
9,973
9,592
381 3.8
10,058 9,582
476 4.7
Fulton
556,954 537,605 19,349 3.5
551,054 528,836 22,218 4.0
547,741 521,497 26,244 4.8
Gilmer
11,861 11,444
417 3.5
11,927 11,428
499 4.2
11,984 11,384
600 5.0
Glascock
1,272 1,225
47 3.7
1,281
1,228
53 4.1
1,297 1,233
64 4.9
Glynn
39,345 38,039 1,306 3.3
39,741 38,277 1,464 3.7
39,732 37,868 1,864 4.7
Gordon
27,976 27,025
951 3.4
27,362 26,310 1,052 3.8
26,616 25,396 1,220 4.6
Grady
10,449 10,093
356 3.4
10,591 10,184
407 3.8
10,726 10,207
519 4.8
Greene
7,010
6,740
270 3.9
7,001
6,703
298 4.3
6,816 6,467
349 5.1
Gwinnett
489,610 474,882 14,728 3.0
484,335 467,318 17,017 3.5
481,154 460,937 20,217 4.2
Habersham 19,069 18,411
658 3.5
19,318 18,598
720 3.7
19,265 18,393
872 4.5
Hall
102,061 99,222 2,839 2.8
101,542 98,304 3,238 3.2
100,178 96,297 3,881 3.9
Hancock
2,447
2,312
135 5.5
2,455
2,309
146 5.9
2,524 2,346
178 7.1
Haralson
12,557 12,141
416 3.3
12,428 11,950
478 3.8
12,360 11,772
588 4.8
Harris
16,649 16,139
510 3.1
16,785 16,216
569 3.4
16,614 15,928
686 4.1
Hart
11,303 10,903
400 3.5
11,661 11,238
423 3.6
11,228 10,733
495 4.4
Heard
5,248
5,073
175 3.3
5,191
4,990
201 3.9
5,157 4,902
255 4.9
Henry
115,495 111,409 4,086 3.5
114,216 109,509 4,707 4.1
112,194 106,788 5,406 4.8
Houston
70,345 68,005 2,340 3.3
69,830 67,030 2,800 4.0
69,043 65,803 3,240 4.7
Irwin
3,328
3,172
156 4.7
3,304
3,118
186 5.6
3,274 3,047
227 6.9
Jackson
36,518 35,550
968 2.7
36,179 35,069 1,110 3.1
35,227 33,943 1,284 3.6
Jasper
6,939
6,726
213 3.1
6,858
6,618
240 3.5
6,842 6,549
293 4.3
Jeff Davis
6,051
5,772
279 4.6
6,047
5,754
293 4.8
6,117 5,750
367 6.0
Jefferson
6,572 6,260
312 4.7
6,674
6,321
353 5.3
6,732 6,319
413 6.1
Jenkins
3,143 2,983
160 5.1
3,164
2,995
169 5.3
3,159 2,947
212 6.7
Johnson
4,036 3,889
147 3.6
4,076
3,916
160 3.9
4,092 3,886
206 5.0
Jones
13,696 13,262
434 3.2
13,836 13,333
503 3.6
13,909 13,311
598 4.3
Lamar
8,232
7,914
318 3.9
8,168
7,791
377 4.6
8,031 7,585
446 5.6
Lanier
3,748 3,601
147 3.9
3,771
3,603
168 4.5
3,838 3,644
194 5.1
Laurens
19,142 18,269
873 4.6
19,344 18,417
927 4.8
19,240 18,116 1,124 5.8
Lee
14,717 14,268
449 3.1
14,725 14,200
525 3.6
15,016 14,397
619 4.1
Liberty
26,096 25,119
977 3.7
25,717 24,622 1,095 4.3
25,450 24,148 1,302 5.1
Lincoln
3,554
3,417
137 3.9
3,579
3,404
175 4.9
3,562 3,377
185 5.2
Long
8,137
7,841
296 3.6
8,006
7,690
316 3.9
7,959 7,577
382 4.8
Lowndes
51,180 49,376 1,804 3.5
51,501 49,411 2,090 4.1
51,590 49,208 2,382 4.6
Lumpkin
16,719 16,200
519 3.1
16,628 16,037
591 3.6
16,701 16,015
686 4.1
McDuffie
8,852 8,402
450 5.1
8,873
8,379
494 5.6
8,877 8,326
551 6.2
McIntosh
6,167 5,948
219 3.6
6,220
5,973
247 4.0
6,125 5,817
308 5.0
Macon
4,693
4,476
217 4.6
4,673
4,384
289 6.2
4,708 4,383
325 6.9
Madison
13,282 12,877
405 3.0
13,610 13,131
479 3.5
13,535 12,960
575 4.2
Marion
3,305
3,165
140 4.2
3,353
3,180
173 5.2
3,418 3,214
204 6.0
Meriwether
8,911
8,510
401 4.5
8,817
8,376
441 5.0
8,845 8,326
519 5.9
Miller
2,749 2,659
90 3.3
2,755
2,654
101 3.7
2,815 2,691
124 4.4
Mitchell
8,445 8,060
385 4.6
8,324
7,876
448 5.4
8,478 7,952
526 6.2
Monroe
12,995 12,574
421 3.2
13,121 12,644
477 3.6
13,081 12,501
580 4.4
Montgomery
3,807 3,607
200 5.3
3,837
3,617
220 5.7
3,756 3,510
246 6.5
Morgan
9,240 8,953
287 3.1
9,142
8,816
326 3.6
8,971 8,571
400 4.5
Murray
15,505 14,725
780 5.0
15,904 15,064
840 5.3
15,827 14,858
969 6.1
Source: Georgia Department of Labor, Workforce Statistics & Economic Research
37
County Labor Force Estimates (not seasonally adjusted) Place of Residence - Persons 16 Years and Older
2019 Annual Averages
Labor Force
Employment
Unemployment Number Rate
2018 Annual Averages
Labor Force
Employment
Unemployment Number Rate
2017 Annual Averages
Labor Force
Employment
Unemployment Number Rate
Muscogee
77,490 73,977 3,513 4.5
78,351 74,367 3,984 5.1
78,847 74,199 4,648 5.9
Newton
52,197 50,187 2,010 3.9
51,666 49,358 2,308 4.5
51,125 48,427 2,698 5.3
Oconee
19,510 19,014
496 2.5
19,976 19,387
589 2.9
19,432 18,750
682 3.5
Oglethorpe
6,929
6,706
223 3.2
7,086
6,825
261 3.7
7,041 6,739
302 4.3
Paulding
85,916 83,397 2,519 2.9
84,923 82,010 2,913 3.4
82,651 79,259 3,392 4.1
Peach
11,826 11,343
483 4.1
11,793 11,184
609 5.2
11,736 11,053
683 5.8
Pickens
15,271 14,816
455 3.0
15,108 14,574
534 3.5
14,948 14,314
634 4.2
Pierce
8,698 8,404
294 3.4
8,675
8,348
327 3.8
8,774 8,379
395 4.5
Pike
8,899
8,631
268 3.0
8,811
8,495
316 3.6
8,644 8,261
383 4.4
Polk
18,429 17,761
668 3.6
18,444 17,671
773 4.2
18,445 17,487
958 5.2
Pulaski
4,052 3,896
156 3.8
4,017
3,842
175 4.4
4,084 3,871
213 5.2
Putnam
8,185
7,831
354 4.3
8,211
7,804
407 5.0
8,156 7,688
468 5.7
Quitman
800
760
40 5.0
821
775
46 5.6
832
783
49 5.9
Rabun
7,152 6,900
252 3.5
7,080
6,798
282 4.0
6,892 6,555
337 4.9
Randolph
2,527 2,405
122 4.8
2,468
2,331
137 5.6
2,510 2,348
162 6.5
Richmond
85,085 81,242 3,843 4.5
85,448 81,021 4,427 5.2
85,796 80,713 5,083 5.9
Rockdale
44,751 43,061 1,690 3.8
44,312 42,360 1,952 4.4
44,319 41,991 2,328 5.3
Schley
2,200
2,115
85 3.9
2,183
2,083
100 4.6
2,207 2,087
120 5.4
Screven
5,088
4,813
275 5.4
5,255
4,972
283 5.4
5,258 4,931
327 6.2
Seminole
3,037 2,903
134 4.4
3,026
2,865
161 5.3
3,079 2,883
196 6.4
Spalding
28,675 27,530 1,145 4.0
28,417 27,079 1,338 4.7
28,269 26,635 1,634 5.8
Stephens
10,685 10,273
412 3.9
10,892 10,395
497 4.6
11,008 10,438
570 5.2
Stewart
2,396 2,296
100 4.2
2,353
2,240
113 4.8
2,277 2,142
135 5.9
Sumter
12,686 12,077
609 4.8
12,629 11,880
749 5.9
12,874 12,006
868 6.7
Talbot
2,819 2,693
126 4.5
2,817
2,676
141 5.0
2,789 2,619
170 6.1
Taliaferro
567
539
28 4.9
565
535
30 5.3
574
536
38 6.6
Tattnall
9,560
9,194
366 3.8
9,630
9,226
404 4.2
9,575 9,105
470 4.9
Taylor
3,074 2,950
124 4.0
2,768
2,589
179 6.5
2,813 2,570
243 8.6
Telfair
4,107
3,716
391 9.5
4,333
4,043
290 6.7
4,774 4,403
371 7.8
Terrell
3,510 3,333
177 5.0
3,553
3,316
237 6.7
3,659 3,441
218 6.0
Thomas
16,470 15,807
663 4.0
16,783 15,999
784 4.7
17,178 16,188
990 5.8
Tift
19,751 19,088
663 3.4
19,241 18,474
767 4.0
19,092 18,208
884 4.6
Toombs
11,655 11,079
576 4.9
11,799 11,115
684 5.8
11,792 11,027
765 6.5
Towns
3,893
3,705
188 4.8
3,890
3,672
218 5.6
3,756 3,511
245 6.5
Treutlen
2,642 2,503
139 5.3
2,692
2,536
156 5.8
2,728 2,546
182 6.7
Troup
37,304 36,117 1,187 3.2
36,464 35,125 1,339 3.7
37,293 35,663 1,630 4.4
Turner
3,139
3,019
120 3.8
3,156
2,997
159 5.0
3,268 3,086
182 5.6
Twiggs
2,878
2,722
156 5.4
2,906
2,735
171 5.9
2,962 2,740
222 7.5
Union
10,274 9,953
321 3.1
10,272
9,896
376 3.7
10,134 9,680
454 4.5
Upson
11,320 10,916
404 3.6
11,308 10,813
495 4.4
11,253 10,642
611 5.4
Walker
31,358 30,242 1,116 3.6
31,113 29,917 1,196 3.8
30,808 29,427 1,381 4.5
Walton
46,011 44,601 1,410 3.1
45,479 43,862 1,617 3.6
44,646 42,728 1,918 4.3
Ware
15,555 14,986
569 3.7
15,489 14,883
606 3.9
15,794 15,083
711 4.5
Warren
2,821 2,693
128 4.5
2,738
2,603
135 4.9
2,718 2,560
158 5.8
Washington
7,013
6,722
291 4.1
7,107
6,752
355 5.0
7,352 6,922
430 5.8
Wayne
11,403 10,947
456 4.0
11,334 10,807
527 4.6
11,333 10,691
642 5.7
Webster
1,007
957
50 5.0
993
931
62 6.2
991
917
74 7.5
Wheeler
1,610 1,490
120 7.5
1,657
1,536
121 7.3
1,735 1,581
154 8.9
White
16,266 15,836
430 2.6
16,072 15,585
487 3.0
15,672 15,072
600 3.8
Whitfield
43,564 41,637 1,927 4.4
44,754 42,628 2,126 4.8
44,842 42,417 2,425 5.4
Wilcox
2,695
2,575
120 4.5
2,665
2,526
139 5.2
2,760 2,601
159 5.8
Wilkes
3,823 3,650
173 4.5
3,802
3,626
176 4.6
3,807 3,594
213 5.6
Wilkinson
3,959 3,808
151 3.8
3,822
3,653
169 4.4
3,802 3,589
213 5.6
Worth
8,897 8,552
345 3.9
8,898
8,503
395 4.4
9,249 8,803
446 4.8
38
Source: Georgia Department of Labor, Workforce Statistics & Economic Research
Mark Butler, Commissioner 148 Andrew Young International Boulevard, N.E. Atlanta, Georgia 30303-1751 Return Service Requested
39