- Collection:
- Georgia Government Publications
- Title:
- Dimensions: measuring Georgia's workforce, 2018 August
- Creator:
- Georgia. Department of Labor
- Contributor to Resource:
- Georgia. Department of Labor
- Publisher:
- Atlanta, Ga. : Georgia. Department of Labor
- Date of Original:
- 2018-08
- Subject:
- Labor market--Georgia--Statistics--Periodicals
Wages--Georgia--Statistics--Periodicals
Hours of labor--Georgia--Statistics--Periodicals - Location:
- United States, Georgia, 32.75042, -83.50018
- Medium:
- serials (publications)
- Type:
- Text
- Format:
- application/pdf
- Description:
- Monthly employment statistics for Georgia
- External Identifiers:
- Call Number GA L200.E46 P1 T7 44/8
- Metadata URL:
- https://dlg.galileo.usg.edu/id:dlg_ggpd_i-ga-bl200-pe46-bp1-bt7-b44-s8-belec-p-btext
- Digital Object URL:
- https://dlg.galileo.usg.edu/do:dlg_ggpd_i-ga-bl200-pe46-bp1-bt7-b44-s8-belec-p-btext
- Language:
- eng
- Holding Institution:
- University of Georgia. Map and Government Information Library
- Rights:
-

Jackson Madison Elbert
Polk
Cobb
Gwinnett Barrow Clarke
D I M E N S I O Paulding
Haralson Douglas
DeKalb Rock-
Walton
Oconee Oglethorpe
Wilkes
Lincoln
EdgefieSlCd,
Carroll
Fulton Clayton
dale Newton
Morgan Greene Taliaferro
Columbia
Fayette Henry
McDuffie Warren
Heard
Coweta
Spalding Butts Jasper Putnam Hancock
Glascock
Richmond
AikenSC,
N
S
Russell, AL
Measuring Georgia's Workforce Troup Meriwether Pike Lamar Monroe Upson
Jones
Baldwin
Jefferson Washington
Burke
Harris
Talbot
August 2018 Data
Muscogee
Bibb Crawford
Taylor
Peach
Wilkinson Twiggs
Johnson
Jenkins Emanuel
Screven
Volume XLIV, Number 8
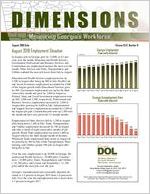
August 2018 Employment Situation Marion Chattahoo-
Houston Bleckley Macon
Laurens
Treutlen
chee
In millions
CandlGereorgBuialloEcmh ploEyfmfinegnhatm
(Seasonally Adjusted)
In August, jobs inScGhleeyorgia grewDbooyly12,0Pu0l0as,koi r 0D.3odpgeercenStte, woavret r tWheebmsteornth.SuEmdtuercation and Health Services;
Montgomery
Wheeler
Toombs
Evans
Bryan
Government; QuCitmonanstruction
monRtahn.dOolpthher
Professional and BCursisipness SWeilrcvoxices, andTelfair sSTaeewrrrevlelimcepslaoLenyedmTenratdien,cTreTruaarsneesrpthoertmatioosBnte,noaHvnielldr the
Jef4f.46 Davis
Tattnall
4.48 4.48 4.49 4.46
Appling
4.50 4.51 4.50 Liberty
Long
Chatham 4.51 4.52
4.53
4.54
4.55
Utilities
Clay
endured
Calhoun
the most job losses
Dougherty Worth
from
JulyIrwtoin
August.
Coffee
Education and Health Services employmTifet nt rose by
5,3Ea0rl0y in AuguBsatkearfter being up 800 in July. HeBaelrtrhienCareAtkinson
aonf dthSeoMAciilulaegrluAstssgirsotawntcMheitwcehmheilplleloEydmuCeconlaqttuiaiotctncaoluCSnoeotrekvdicfeosr
4,800 gLraenwier
Bacon
Wayne
Pierce
Ware
Brantley
McIntosh Glynn
byS5em00in.oGle overnment employment was up for the third consecutiDveecamtuor nth GanraddygrewThobmyas2,60B0rooinksAugLuoswtnadses
ClincAhug-17 Sep-17
Oct-17
Nov-17 Dec-17
Jan-18 Feb-18 Camden
Mar-18
Apr-18
May-18 Jun-18
Jul-18
Aug-18
Charlton
Federal, State, and Local Government employment wEcehroels up 100, 1,000 and 1,500, respectively. Professional and Business Services employment increased by 2,500 in
Georgia Unemployment Rate
(Seasonally Adjusted)
August after growing by 6,600 in July. Administrative
and Support Services employment accounted for 2,100 of
the August job gain. Construction jobs were up 1,500 over the month and have now grown for 13 straight months.
4.5% 4.5% 4.5% 4.5% 4.5% 4.5% 4.4% 4.4%
4.3%
Employment in Other Services fell by 1,200 in August after being down 1,500 in July. Trade, Transportation,
4.2% 4.1%
and Utilities employment decreased by 700 in August
3.9%
and ends a streak of eight consecutive months of job
3.8%
growth. Retail Trade employment was down 1,000 in
August which is the third straight month of declines, Wholesale Trade employment held steady in August af-
Aug-17 Sep-17 Oct-17 Nov-17 Dec-17 Jan-18 Feb-18 Mar-18 Apr-18 May-18 Jun-18 Jul-18 Aug-18
ter growing by 400 in July, while Transportation, Ware-
housing, and Utilities gained 300 jobs in August after
being flat in July.
Over the year, employment is up 88,900 in Georgia. Education and Health Services (+19,900 jobs); Construction (+18,900 jobs); Trade, Transportation, and Utilities (+16,700 jobs); and Leisure and Hospitality (+11,700 jobs) added the most jobs over the year.
Georgia's unemployment rate (seasonally adjusted) declined to 3.8 percent in August 2018 from 3.9 percent in July. Over the year, the unemployment rate is down from 4.5 percent in August 2017.
Workforce Statistics & Economic Research Mark Butler, Commissioner
For more information, contact Corey Smith or Evan Cross at (404) 232-3875
corey.smith@gdol.ga.gov evan.cross@gdol.ga.gov
Equal Opportunity Employer/ProgramAuxiliary Aids and Services Available upon Request to Individuals with Disabilities
GEORGIA Nonfarm Employment
(In thousands)
(Seasonally Adjusted)
Preliminary
Revised Revised
AUG 2018 JUL 2018 AUG 2017
Change in Jobs from JUL 2018
Net %
Change in Jobs from AUG 2017
Net %
Total Nonfarm
4,553.2
4,541.2
4,464.3
12.0 0.3
88.9 2.0
Total Private
3,857.7
3,848.3
3,774.8
9.4 0.2
82.9 2.2
Goods Producing
615.2
613.0
589.8
2.2 0.4
25.4 4.3
Service-Providing
3,938.0
3,928.2
3,874.5
9.8 0.2
63.5 1.6
Private Service-Providing
3,242.5
3,235.3
3,185.0
7.2 0.2
57.5 1.8
Mining and Logging
9.4
9.5
9.3
-0.1 -1.1
0.1 1.1
Mining, Logging and Construction
210.5
209.1
191.5
1.4 0.7
19.0 9.9
Construction
201.1
199.6
182.2
1.5 0.8
18.9 10.4
Manufacturing
404.7
403.9
398.3
0.8 0.2
6.4 1.6
Durable Goods
200.7
199.7
194.1
1.0 0.5
6.6 3.4
Non-Durable Goods
204.0
204.2
204.2
-0.2 -0.1
-0.2 -0.1
Trade, Transportation, and Utilities
961.2
961.9
944.5
-0.7 -0.1
16.7 1.8
Wholesale Trade
227.9
227.9
222.0
0.0 0.0
5.9 2.7
Retail Trade
501.4
502.4
497.7
-1.0 -0.2
3.7 0.7
Transportation, Warehousing, and Utilities
231.9
231.6
224.8
0.3 0.1
7.1 3.2
Information
116.5
116.3
118.8
0.2 0.2
-2.3 -1.9
Financial Activities
241.9
241.3
243.1
0.6 0.2
-1.2 -0.5
Finance and Insurance
175.7
175.0
176.9
0.7 0.4
-1.2 -0.7
Real Estate and Rental and Leasing
66.2
66.3
66.2
-0.1 -0.2
0.0 0.0
Professional and Business Services
680.1
677.6
669.5
2.5 0.4
10.6 1.6
Professional, Scientific, and Technical Services
270.0
270.4
271.1
-0.4 -0.1
-1.1 -0.4
Management of Companies and Enterprises
70.1
69.3
67.9
0.8 1.2
2.2 3.2
Admin and Support, Waste Mngmnt and Remediation
340.0
337.9
330.5
2.1 0.6
9.5 2.9
Education and Health Services
591.1
585.8
571.2
5.3 0.9
19.9 3.5
Educational Services
76.5
76.0
74.4
0.5 0.7
2.1 2.8
Health Care and Social Assistance
514.6
509.8
496.8
4.8 0.9
17.8 3.6
Leisure and Hospitality
490.9
490.4
479.2
0.5 0.1
11.7 2.4
Arts, Entertainment, and Recreation
49.9
50.3
51.3
-0.4 -0.8
-1.4 -2.7
Accommodation and Food Services
441.0
440.1
427.9
0.9 0.2
13.1 3.1
Other Services
160.8
162.0
158.7
-1.2 -0.7
2.1 1.3
Government
695.5
692.9
689.5
2.6 0.4
6.0 0.9
Federal Government
100.2
100.1
101.0
0.1 0.1
-0.8 -0.8
State Government
173.6
172.6
172.5
1.0 0.6
1.1 0.6
Local Government
421.7
420.2
416.0
1.5 0.4
5.7 1.4
Note: These seasonally adjusted estimates were prepared in cooperation with the U.S. Department of Labor, Bureau of Labor Statistics, based upon monthly reports submitted by selected
employers throughout Georgia. The estimates include all full- and part-time wage and salary workers who were employed during or received pay for any part of the pay period that includes the twelfth of the month. Proprietors, domestic workers, self-employed persons, unpaid family workers and personnel of the armed forces are excluded. Estimates based on 2017 benchmark.
Source: Georgia Department of Labor, Workforce Statistics & Economic Research
Georgia Department of Labor, Mark Butler, Commissioner Equal Opportunity Employer/Program Auxiliary Aids and Services Available Upon Request to Individuals With Disabilities
2
GEORGIA Nonfarm Employment
(In thousands)
(Not Seasonally Adjusted)
Preliminary
Revised Revised
AUG 2018 JUL 2018 AUG 2017
Change in Jobs from JUL 2018
Net %
Change in Jobs from AUG 2017
Net %
Total Nonfarm
4,554.1
4,527.3
4,467.1
26.8 0.6
87.0 2.0
Total Private
3,863.1
3,859.1
3,784.3
4.0 0.1
78.8 2.1
Goods Producing
616.7
614.4
592.0
2.3 0.4
24.7 4.2
Service-Providing
3,937.4
3,912.9
3,875.1
24.5 0.6
62.3 1.6
Private Service-Providing
3,246.4
3,244.7
3,192.3
1.7 0.1
54.1 1.7
Mining and Logging
9.5
9.5
9.4
0.0 0.0
0.1 1.1
Mining, Logging and Construction
213.2
209.8
193.0
3.4 1.6
20.2 10.5
Construction
203.7
200.3
183.6
3.4 1.7
20.1 11.0
Construction of Buildings
43.8
43.1
40.2
0.7 1.6
3.6 9.0
Heavy and Civil Engineering Construction
30.0
29.6
27.4
0.4 1.4
2.6 9.5
Specialty Trade Contractors
129.9
127.6
116.0
2.3 1.8
13.9 12.0
Manufacturing
403.5
404.6
399.0
-1.1 -0.3
4.5 1.1
Durable Goods
199.4
200.0
194.4
-0.6 -0.3
5.0 2.6
Transportation Equipment Manufacturing
54.2
54.2
53.7
0.0 0.0
0.5 0.9
Non-Durable Goods
204.1
204.6
204.6
-0.5 -0.2
-0.5 -0.2
Food Manufacturing
67.3
67.6
68.0
-0.3 -0.4
-0.7 -1.0
Textile Mills
20.5
20.5
20.0
0.0 0.0
0.5 2.5
Textile Product Mills
29.5
29.5
29.2
0.0 0.0
0.3 1.0
Trade, Transportation, and Utilities
957.5
960.8
939.5
-3.3 -0.3
18.0 1.9
Wholesale Trade
228.7
228.3
222.6
0.4 0.2
6.1 2.7
Merchant Wholesalers, Durable Goods
111.7
110.1
108.8
1.6 1.5
2.9 2.7
Merchant Wholesalers, Nondurable Goods
64.2
64.6
62.3
-0.4 -0.6
1.9 3.1
Wholesale Electronic Markets and Agents and Brokers 52.8
53.6
51.5
-0.8 -1.5
1.3 2.5
Retail Trade
497.1
501.0
494.0
-3.9 -0.8
3.1 0.6
Food and Beverage Stores
93.5
93.8
92.7
-0.3 -0.3
0.8 0.9
General Merchandise Stores
110.3
109.9
107.0
0.4 0.4
3.3 3.1
Miscellaneous Store Retailers
22.5
22.4
22.0
0.1 0.5
0.5 2.3
Transportation, Warehousing, and Utilities
231.7
231.5
222.9
0.2 0.1
8.8 4.0
Utilities
19.3
19.3
19.4
0.0 0.0
-0.1 -0.5
Transportation and Warehousing
212.4
212.2
203.5
0.2 0.1
8.9 4.4
Air Transportation
41.7
41.8
40.7
-0.1 -0.2
1.0 2.5
Truck Transportation
55.1
55.0
52.9
0.1 0.2
2.2 4.2
Couriers and Messengers
25.0
25.3
23.2
-0.3 -1.2
1.8 7.8
Warehousing and Storage
47.2
46.8
45.1
0.4 0.9
2.1 4.7
Information
116.5
117.5
117.8
-1.0 -0.9
-1.3 -1.1
Telecommunications
41.2
41.3
43.2
-0.1 -0.2
-2.0 -4.6
Wired and Wireless Telecommunications Carriers
37.5
37.6
37.7
-0.1 -0.3
-0.2 -0.5
Wired Telecommunications Carriers
31.6
31.7
31.6
-0.1 -0.3
0.0 0.0
Wireless Telecommunications Carriers (except Satellite) 5.9
5.9
6.1
0.0 0.0
-0.2 -3.3
Data Processing, Hosting, and Related Services
11.9
11.7
11.1
0.2 1.7
0.8 7.2
Financial Activities
241.6
241.1
243.6
0.5 0.2
-2.0 -0.8
Finance and Insurance
175.2
174.9
177.2
0.3 0.2
-2.0 -1.1
Insurance Carriers and Related Activities
83.2
83.6
84.7
-0.4 -0.5
-1.5 -1.8
Real Estate and Rental and Leasing
66.4
66.2
66.4
0.2 0.3
0.0 0.0
Professional and Business Services
680.2
680.7
674.2
-0.5 -0.1
6.0 0.9
Professional, Scientific, and Technical Services
269.6
271.2
270.5
-1.6 -0.6
-0.9 -0.3
Accounting, Tax Prep, and Bookkeeping Services
34.0
34.1
33.8
-0.1 -0.3
0.2 0.6
Architectural, Engineering, and Related Services
45.3
45.6
44.9
-0.3 -0.7
0.4 0.9
Computer Systems Design and Related Services
67.4
68.0
68.7
-0.6 -0.9
-1.3 -1.9
Management and Technical Consulting Services
42.4
42.6
43.1
-0.2 -0.5
-0.7 -1.6
Management of Companies and Enterprises
70.4
69.7
67.9
0.7 1.0
2.5 3.7
Admin and Support, Waste Mngmnt and Remediation
340.2
339.8
335.8
0.4 0.1
4.4 1.3
Employment Services
167.0
167.7
162.9
-0.7 -0.4
4.1 2.5
Education and Health Services
591.9
578.8
570.1
13.1 2.3
21.8 3.8
Educational Services
74.1
71.0
72.7
3.1 4.4
1.4 1.9
Colleges, Universities, and Professional Schools
32.9
32.3
31.7
0.6 1.9
1.2 3.8
Health Care and Social Assistance
517.8
507.8
497.4
10.0 2.0
20.4 4.1
Ambulatory Health Care Services
209.3
205.9
197.0
3.4 1.7
12.3 6.2
Hospitals
181.5
179.8
172.3
1.7 1.0
9.2 5.3
Nursing and Residential Care Facilities
59.3
59.2
59.8
0.1 0.2
-0.5 -0.8
Social Assistance
67.7
62.9
68.3
4.8 7.6
-0.6 -0.9
Leisure and Hospitality
497.7
501.6
487.5
-3.9 -0.8
10.2 2.1
Arts, Entertainment, and Recreation
51.9
56.4
54.7
-4.5 -8.0
-2.8 -5.1
Amusement, Gambling, and Recreation Industries
37.6
41.4
39.5
-3.8 -9.2
-1.9 -4.8
Accommodation and Food Services
445.8
445.2
432.8
0.6 0.1
13.0 3.0
Accommodation
45.1
45.5
46.8
-0.4 -0.9
-1.7 -3.6
Food Services and Drinking Places
400.7
399.7
386.0
1.0 0.3
14.7 3.8
Other Services
161.0
164.2
159.6
-3.2 -2.0
1.4 0.9
Repair and Maintenance
38.7
39.1
39.3
-0.4 -1.0
-0.6 -1.5
Personal and Laundry Services
40.6
41.8
38.7
-1.2 -2.9
1.9 4.9
Religious, Grantmaking, Civic, Professional, and Similar
81.7
83.3
81.6
-1.6 -1.9
0.1 0.1
Government
691.0
668.2
682.8
22.8 3.4
8.2 1.2
Federal Government
100.1
99.9
100.6
0.2 0.2
-0.5 -0.5
Department of Defense
41.2
41.3
41.1
-0.1 -0.2
0.1 0.2
State Government
168.7
165.3
167.9
3.4 2.1
0.8 0.5
State Government Educational Services
96.4
92.6
95.9
3.8 4.1
0.5 0.5
State Government excluding Educational Services
72.3
72.7
72.0
-0.4 -0.6
0.3 0.4
Local Government
422.2
403.0
414.3
19.2 4.8
7.9 1.9
Local Government Educational Services
249.1
228.4
243.8
20.7 9.1
5.3 2.2
Local Government excluding Educational Services
173.1
174.6
170.5
-1.5 -0.9
2.6 1.5
Note: These not seasonally adjusted estimates were prepared in cooperation with the U.S. Department of Labor, Bureau of Labor Statistics, based upon monthly reports submitted by selected
employers throughout Georgia. The estimates include all full- and part-time wage and salary workers who were employed during or received pay for any part of the pay period that includes the
twelfth of the month. Proprietors, domestic workers, self-employed persons, unpaid family workers and personnel of the armed forces are excluded. Estimates based on 2017 benchmark.
Source: Georgia Department of Labor, Workforce Statistics & Economic Research
3
ALBANY MSA Nonfarm Employment
(In thousands)
(Not Seasonally Adjusted)
Preliminary
Revised
Revised
AUG 2018 JUL 2018 AUG 2017
Change in Jobs from JUL 2018
Net %
Change in Jobs from AUG 2017
Net %
Total Nonfarm Total Private Goods Producing Service-Providing Private Service-Providing Manufacturing Trade, Transportation, and Utilities
Retail Trade Government
Federal Government State Government Local Government
63.0
62.8
62.4
50.4
50.3
49.8
7.3
7.3
7.1
55.7
55.5
55.3
43.1
43.0
42.7
4.3
4.3
4.3
12.3
12.2
12.7
7.7
7.7
7.8
12.6
12.5
12.6
2.5
2.5
2.6
2.8
2.8
2.7
7.3
7.2
7.3
0.2 0.3 0.1 0.2 0.0 0.0 0.2 0.4 0.1 0.2 0.0 0.0 0.1 0.8 0.0 0.0 0.1 0.8 0.0 0.0 0.0 0.0 0.1 1.4
0.6 1.0 0.6 1.2 0.2 2.8 0.4 0.7 0.4 0.9 0.0 0.0 -0.4 -3.2 -0.1 -1.3 0.0 0.0 -0.1 -3.9 0.1 3.7 0.0 0.0
Note: These not seasonally adjusted estimates were prepared in cooperation with the U.S. Department of Labor, Bureau of Labor Statistics, based upon monthly reports submitted by
selected employers in the Albany Metropolitan Statistical Area, which includes Baker, Dougherty, Lee, Terrell and Worth counties. The estimates include all full- and part-time wage and salary workers who were employed during or received pay for any part of the pay period that includes the twelfth of the month. Proprietors, domestic workers, self-employed persons, unpaid familyworkers and personnel of the armed forces are excluded. Estimates based on 2017 benchmark.
ATHENS-CLARKE COUNTY MSA Nonfarm Employment
(In thousands)
(Not Seasonally Adjusted)
Preliminary
Revised
Revised
AUG 2018 JUL 2018 AUG 2017
Change in Jobs from JUL 2018
Net %
Change in Jobs from AUG 2017
Net %
Total Nonfarm Total Private Goods Producing Service-Providing Private Service-Providing Trade, Transportation, and Utilities
Retail Trade Professional and Business Services Leisure and Hospitality Government
Federal Government State Government Local Government
99.6
99.0
96.8
0.6 0.6
69.3
69.1
67.2
0.2 0.3
10.3
10.3
9.9
0.0 0.0
89.3
88.7
86.9
0.6 0.7
59.0
58.8
57.3
0.2 0.3
16.4
16.4
16.3
0.0 0.0
10.7
10.9
10.6
-0.2 -1.8
8.9
8.9
8.6
0.0 0.0
11.2
11.2
10.5
0.0 0.0
30.3
29.9
29.6
0.4 1.3
1.0
1.0
1.0
0.0 0.0
21.4
21.4
20.7
0.0 0.0
7.9
7.5
7.9
0.4 5.3
2.8 2.9 2.1 3.1 0.4 4.0 2.4 2.8 1.7 3.0 0.1 0.6 0.1 0.9 0.3 3.5 0.7 6.7 0.7 2.4 0.0 0.0 0.7 3.4 0.0 0.0
Note: These not seasonally adjusted estimates were prepared in cooperation with the U.S. Department of Labor, Bureau of Labor Statistics, based upon monthly reports submitted by selected
employers in the Athens-Clarke County Metropolitan Statistical Area, which includes Clarke, Madison, Oconee and Oglethorpe counties. The estimates include all full- and part-time wage and salary workers who were employed during or received pay for any part of the pay period that includes the twelfth of the month. Proprietors, domestic workers, self-employed persons, unpaid family workers and personnel of the armed forces are excluded. Estimates based on 2017 benchmark.
Source: Georgia Department of Labor, Workforce Statistics & Economic Research
4
ATLANTA MSA Nonfarm Employment
(In thousands)
(Not Seasonally Adjusted)
Preliminary AUG 2018
Revised JUL 2018
Revised AUG 2017
Change in Jobs from JUL 2018
Net %
Change in Jobs from AUG 2017
Net %
Total Nonfarm
2,791.4
2,776.5
2,737.7
14.9 0.5
53.7 2.0
Total Private
2,458.1
2,452.1
2,409.0
6.0 0.2
49.1 2.0
Goods Producing
302.9
301.4
290.2
1.5 0.5
12.7 4.4
Service-Providing
2,488.5
2,475.1
2,447.5
13.4 0.5
41.0 1.7
Private Service-Providing
2,155.2
2,150.7
2,118.8
4.5 0.2
36.4 1.7
Mining and Logging
1.6
1.6
1.6
0.0 0.0
0.0 0.0
Mining, Logging and Construction
134.0
131.5
122.6
2.5 1.9
11.4 9.3
Construction
132.4
129.9
121.0
2.5 1.9
11.4 9.4
Construction of Buildings
28.3
28.2
26.6
0.1 0.4
1.7 6.4
Specialty Trade Contractors
85.2
83.4
77.6
1.8 2.2
7.6 9.8
Manufacturing
168.9
169.9
167.6
-1.0 -0.6
1.3 0.8
Durable Goods
86.9
87.5
85.2
-0.6 -0.7
1.7 2.0
Transportation Equipment Manufacturing
14.6
14.5
15.2
0.1 0.7
-0.6 -4.0
Non-Durable Goods
82.0
82.4
82.4
-0.4 -0.5
-0.4 -0.5
Food Manufacturing
26.7
26.8
26.9
-0.1 -0.4
-0.2 -0.7
Trade, Transportation, and Utilities
616.2
620.3
603.5
-4.1 -0.7
12.7 2.1
Wholesale Trade
163.9
164.7
160.4
-0.8 -0.5
3.5 2.2
Merchant Wholesalers, Durable Goods
83.2
81.9
79.6
1.3 1.6
3.6 4.5
Merchant Wholesalers, Nondurable Goods
39.2
40.7
38.9
-1.5 -3.7
0.3 0.8
Wholesale Electronic Markets and Agents and Brokers
41.5
42.1
41.9
-0.6 -1.4
-0.4 -1.0
Retail Trade
291.6
293.5
289.6
-1.9 -0.7
2.0 0.7
Food and Beverage Stores
58.6
58.5
57.7
0.1 0.2
0.9 1.6
General Merchandise Stores
60.4
60.1
57.3
0.3 0.5
3.1 5.4
Miscellaneous Store Retailers
15.0
14.9
14.7
0.1 0.7
0.3 2.0
Transportation, Warehousing, and Utilities
160.7
162.1
153.5
-1.4 -0.9
7.2 4.7
Utilities
9.9
9.9
9.9
0.0 0.0
0.0 0.0
Transportation and Warehousing
150.8
152.2
143.6
-1.4 -0.9
7.2 5.0
Air Transportation
41.5
41.5
40.1
0.0 0.0
1.4 3.5
Truck Transportation
34.3
34.6
33.1
-0.3 -0.9
1.2 3.6
Couriers and Messengers
19.5
19.9
18.4
-0.4 -2.0
1.1 6.0
Information
96.7
95.3
100.5
1.4 1.5
-3.8 -3.8
Telecommunications
34.2
34.4
36.3
-0.2 -0.6
-2.1 -5.8
Wired and Wireless Telecommunications Carriers
30.9
31.1
31.8
-0.2 -0.6
-0.9 -2.8
Wired Telecommunications Carriers
25.5
25.7
26.4
-0.2 -0.8
-0.9 -3.4
Wireless Telecommunications Carriers (except Satellite) 5.4
5.4
5.4
0.0 0.0
0.0 0.0
Data Processing, Hosting, and Related Services
11.5
11.3
10.7
0.2 1.8
0.8 7.5
Financial Activities
170.9
169.8
171.4
1.1 0.7
-0.5 -0.3
Finance and Insurance
118.7
118.3
122.6
0.4 0.3
-3.9 -3.2
Insurance Carriers and Related Activities
58.8
59.1
59.2
-0.3 -0.5
-0.4 -0.7
Real Estate and Rental and Leasing
52.2
51.5
48.8
0.7 1.4
3.4 7.0
Professional and Business Services
506.7
507.2
503.6
-0.5 -0.1
3.1 0.6
Professional, Scientific, and Technical Services
216.6
217.9
217.2
-1.3 -0.6
-0.6 -0.3
Accounting, Tax Prep, and Bookkeeping Services
25.4
25.2
25.4
0.2 0.8
0.0 0.0
Architectural, Engineering, and Related Services
30.8
31.3
31.2
-0.5 -1.6
-0.4 -1.3
Computer Systems Design and Related Services
59.7
59.8
59.1
-0.1 -0.2
0.6 1.0
Management and Technical Consulting Services
36.8
37.2
38.3
-0.4 -1.1
-1.5 -3.9
Management of Companies and Enterprises
58.1
57.4
55.6
0.7 1.2
2.5 4.5
Admin and Support, Waste Mngmnt and Remediation
232.0
231.9
230.8
0.1 0.0
1.2 0.5
Employment Services
116.0
116.2
111.9
-0.2 -0.2
4.1 3.7
Education and Health Services
358.6
347.5
341.8
11.1 3.2
16.8 4.9
Educational Services
54.3
52.1
52.8
2.2 4.2
1.5 2.8
Health Care and Social Assistance
304.3
295.4
289.0
8.9 3.0
15.3 5.3
Ambulatory Health Care Services
125.2
123.1
118.1
2.1 1.7
7.1 6.0
Hospitals
107.0
105.8
98.9
1.2 1.1
8.1 8.2
Social Assistance
41.6
37.9
43.1
3.7 9.8
-1.5 -3.5
Leisure and Hospitality
307.6
309.3
297.8
-1.7 -0.6
9.8 3.3
Arts, Entertainment, and Recreation
36.1
39.4
38.8
-3.3 -8.4
-2.7 -7.0
Accommodation and Food Services
271.5
269.9
259.0
1.6 0.6
12.5 4.8
Accommodation
26.0
26.2
26.0
-0.2 -0.8
0.0 0.0
Food Services and Drinking Places
245.5
243.7
233.0
1.8 0.7
12.5 5.4
Other Services
98.5
101.3
100.2
-2.8 -2.8
-1.7 -1.7
Repair and Maintenance
24.2
24.2
24.0
0.0 0.0
0.2 0.8
Personal and Laundry Services
27.3
28.3
27.3
-1.0 -3.5
0.0 0.0
Government
333.3
324.4
328.7
8.9 2.7
4.6 1.4
Federal Government
46.3
46.3
46.8
0.0 0.0
-0.5 -1.1
State Government
73.5
72.5
71.4
1.0 1.4
2.1 2.9
Local Government
213.5
205.6
210.5
7.9 3.8
3.0 1.4
Note: These not seasonally adjusted estimates were prepared in cooperation with the U.S. Department of Labor, Bureau of Labor Statistics, based upon monthly reports submitted by
selected employers in the Atlanta Metropolitan Statistical Area, which includes Barrow, Bartow, Butts, Carroll, Cherokee, Clayton, Cobb, Coweta, Dawson, DeKalb, Douglas, Fayette, Forsyth,
Fulton, Gwinnett, Haralson, Heard, Henry, Jasper, Lamar, Meriwether, Morgan, Newton, Paulding, Pickens, Pike, Rockdale, Spalding and Walton counties. The estimates include all full- and
part-time wage and salary workers who were employed during or received pay for any part of the pay period that includes the twelfth of the month. Proprietors, domestic workers, self-employed
persons, unpaid family workers and personnel of the armed forces are excluded. Estimates based on 2017 benchmark.
Source: Georgia Department of Labor, Workforce Statistics & Economic Research
5
AUGUSTA-RICHMOND COUNTY MSA Nonfarm Employment
(In thousands)
(Not Seasonally Adjusted)
Preliminary
Revised
Revised
AUG 2018 JUL 2018 AUG 2017
Change in Jobs from JUL 2018
Net %
Change in Jobs from AUG 2017
Net %
Total Nonfarm Total Private Goods Producing Service-Providing Private Service-Providing Mining, Logging and Construction Manufacturing Trade, Transportation, and Utilities
Wholesale Trade Retail Trade Transportation, Warehousing, and Utilities Information Financial Activities Professional and Business Services Education and Health Services Leisure and Hospitality Other Services Government Federal Government State Government Local Government
240.9 193.4
35.0 205.9 158.4
12.5 22.5 41.7
5.9 28.0
7.8 2.5 6.4 39.8 33.6 26.2 8.2 47.5 9.4 15.7 22.4
240.7 194.5
34.7 206.0 159.8
12.2 22.5 42.0
5.9 28.3
7.8 2.5 6.4 40.6 33.3 26.7 8.3 46.2 9.4 15.3 21.5
235.5 188.7
33.8 201.7 154.9
12.1 21.7 40.0
5.8 26.4
7.8 2.6 6.5 38.5 33.7 25.4 8.2 46.8 9.5 15.9 21.4
0.2 0.1 -1.1 -0.6 0.3 0.9 -0.1 -0.1 -1.4 -0.9 0.3 2.5 0.0 0.0 -0.3 -0.7 0.0 0.0 -0.3 -1.1 0.0 0.0 0.0 0.0 0.0 0.0 -0.8 -2.0 0.3 0.9 -0.5 -1.9 -0.1 -1.2 1.3 2.8 0.0 0.0 0.4 2.6 0.9 4.2
5.4 2.3 4.7 2.5 1.2 3.6 4.2 2.1 3.5 2.3 0.4 3.3 0.8 3.7 1.7 4.3 0.1 1.7 1.6 6.1 0.0 0.0 -0.1 -3.9 -0.1 -1.5 1.3 3.4 -0.1 -0.3 0.8 3.2 0.0 0.0 0.7 1.5 -0.1 -1.1 -0.2 -1.3 1.0 4.7
Note: These not seasonally adjusted estimates were prepared in cooperation with the U.S. Department of Labor, Bureau of Labor Statistics, based upon monthly reports submitted by
selected employers in the Augusta-Richmond County Metropolitan Statistical Area, which includes Burke, Columbia, Lincoln, McDuffie and Richmond counties in Georgia and Aiken and Edgefield counties in South Carolina. The estimates include all full- and part-time wage and salary workers who were employed during or received pay for any part of the pay period that includes the twelfth of the month. Proprietors, domestic workers, self-employed persons, unpaid family workers and personnel of the armed forces are excluded. Estimates based on 2017 benchmark.
BRUNSWICK MSA Nonfarm Employment
(In thousands)
(Not Seasonally Adjusted)
Preliminary
Revised
Revised
AUG 2018 JUL 2018 AUG 2017
Change in Jobs from JUL 2018
Net %
Change in Jobs from AUG 2017
Net %
Total Nonfarm Total Private Goods Producing Service-Providing Private Service-Providing Trade, Transportation, and Utilities
Retail Trade Government
Federal Government State Government Local Government
44.7
44.9
44.4
-0.2 -0.5
36.0
36.5
35.9
-0.5 -1.4
3.9
3.9
4.0
0.0 0.0
40.8
41.0
40.4
-0.2 -0.5
32.1
32.6
31.9
-0.5 -1.5
9.6
9.4
9.3
0.2 2.1
5.7
5.7
5.7
0.0 0.0
8.7
8.4
8.5
0.3 3.6
2.0
1.9
1.9
0.1 5.3
1.9
1.9
1.8
0.0 0.0
4.8
4.6
4.8
0.2 4.4
0.3 0.7 0.1 0.3 -0.1 -2.5 0.4 1.0 0.2 0.6 0.3 3.2 0.0 0.0 0.2 2.4 0.1 5.3 0.1 5.6 0.0 0.0
Note: These not seasonally adjusted estimates were prepared in cooperation with the U.S. Department of Labor, Bureau of Labor Statistics, based upon monthly reports submitted by
selected employers in the Brunswick Metropolitan Statistical Area, which includes Brantley, Glynn and McIntosh counties. The estimates include all full- and part-time wage and salary workers who were employed during or received pay for any part of the pay period that includes the twelfth of the month. Proprietors, domestic workers, self-employed persons, unpaid family workers and personnel of the armed forces are excluded. Estimates based on 2017 benchmark.
Source: Georgia Department of Labor, Workforce Statistics & Economic Research
6
COLUMBUS MSA Nonfarm Employment
(In thousands)
(Not Seasonally Adjusted)
Preliminary
Revised
Revised
AUG 2018 JUL 2018 AUG 2017
Change in Jobs from JUL 2018
Net %
Change in Jobs from AUG 2017
Net %
Total Nonfarm Total Private Goods Producing Service-Providing Private Service-Providing Mining, Logging and Construction Manufacturing Trade, Transportation, and Utilities
Wholesale Trade Retail Trade Transportation, Warehousing, and Utilities Information Financial Activities Finance and Insurance
Insurance Carriers and Related Activities Professional and Business Services Education and Health Services Leisure and Hospitality Other Services Government
Federal Government State Government Local Government
123.0 98.6 16.0
107.0 82.6 4.7 11.3 18.3 2.9 12.8 2.6 1.3 13.1 11.3 4.3 14.3 16.1 15.1 4.4 24.4 6.5 4.4 13.5
122.6 98.9 16.0
106.6 82.9 4.6 11.4 18.3 2.8 12.9 2.6 1.3 13.1 11.2 4.3 14.5 15.9 15.3 4.5 23.7 6.5 4.3 12.9
120.9 96.8 15.2
105.7 81.6 4.5 10.7 18.5 2.8 13.2 2.5 1.3 13.3 11.2 4.4 13.6 15.7 14.8 4.4 24.1 6.7 4.5 12.9
0.4 0.3 -0.3 -0.3 0.0 0.0 0.4 0.4 -0.3 -0.4 0.1 2.2 -0.1 -0.9 0.0 0.0 0.1 3.6 -0.1 -0.8 0.0 0.0 0.0 0.0 0.0 0.0 0.1 0.9 0.0 0.0 -0.2 -1.4 0.2 1.3 -0.2 -1.3 -0.1 -2.2 0.7 3.0 0.0 0.0 0.1 2.3 0.6 4.7
2.1 1.7 1.8 1.9 0.8 5.3 1.3 1.2 1.0 1.2 0.2 4.4 0.6 5.6 -0.2 -1.1 0.1 3.6 -0.4 -3.0 0.1 4.0 0.0 0.0 -0.2 -1.5 0.1 0.9 -0.1 -2.3 0.7 5.2 0.4 2.6 0.3 2.0 0.0 0.0 0.3 1.2 -0.2 -3.0 -0.1 -2.2 0.6 4.7
Note: These not seasonally adjusted estimates were prepared in cooperation with the U.S. Department of Labor, Bureau of Labor Statistics, based upon monthly reports submitted by
selected employers in the Columbus Metropolitan Statistical Area, which includes Chattahoochee, Harris, Marion and Muscogee counties in Georgia and Russell County in Alabama. The estimates include all full- and part-time wage and salary workers who were employed during or received pay for any part of the pay period that includes the twelfth of the month. Proprietors, domestic workers, self-employed persons, unpaid family workers and personnel of the armed forces are excluded. Estimates based on 2017 benchmark.
DALTON MSA Nonfarm Employment
(In thousands)
(Not Seasonally Adjusted)
Preliminary AUG 2018
Revised Revised JUL 2018 AUG 2017
Change in Jobs from JUL 2018
Net %
Change in Jobs from AUG 2017
Net %
Total Nonfarm Total Private Goods Producing Service-Providing Private Service-Providing Manufacturing
Textile Mills Textile Product Mills Trade, Transportation, and Utilities Retail Trade Transportation, Warehousing, and Utilities Professional and Business Services Government Federal Government State Government Local Government
68.6
68.3
67.4
0.3 0.4
61.8
61.6
60.7
0.2 0.3
27.1
27.0
26.4
0.1 0.4
41.5
41.3
41.0
0.2 0.5
34.7
34.6
34.3
0.1 0.3
25.0
25.0
24.9
0.0 0.0
4.9
4.9
4.7
0.0 0.0
14.4
14.4
14.7
0.0 0.0
14.0
14.1
13.7
-0.1 -0.7
6.2
6.4
6.1
-0.2 -3.1
3.4
3.4
3.4
0.0 0.0
6.5
6.5
6.5
0.0 0.0
6.8
6.7
6.7
0.1 1.5
0.2
0.2
0.2
0.0 0.0
1.0
0.9
1.0
0.1 11.1
5.6
5.6
5.5
0.0 0.0
1.2 1.8 1.1 1.8 0.7 2.7 0.5 1.2 0.4 1.2 0.1 0.4 0.2 4.3 -0.3 -2.0 0.3 2.2 0.1 1.6 0.0 0.0 0.0 0.0 0.1 1.5 0.0 0.0 0.0 0.0 0.1 1.8
Note: These not seasonally adjusted estimates were prepared in cooperation with the U.S. Department of Labor, Bureau of Labor Statistics, based upon monthly reports submitted by
selected employers in the Dalton Metropolitan Statistical Area, which includes Murray and Whitfield counties. The estimates include all full- and part-time wage and salary workers who were employed during or received pay for any part of the pay period that includes the twelfth of the month. Proprietors, domestic workers, self-employed persons, unpaid family workers and personnel of the armed forces are excluded. Estimates based on 2017 benchmark.
Source: Georgia Department of Labor, Workforce Statistics & Economic Research
7
GAINESVILLE MSA Nonfarm Employment
(In thousands)
(Not Seasonally Adjusted)
Preliminary
Revised
Revised
AUG 2018 JUL 2018 AUG 2017
Change in Jobs from JUL 2018
Net %
Change in Jobs from AUG 2017
Net %
Total Nonfarm Total Private Goods Producing Service-Providing Private Service-Providing Trade, Transportation, and Utilities
Retail Trade Government
Federal Government State Government Local Government
94.5
93.4
90.3
83.8
83.4
79.7
26.0
25.9
24.5
68.5
67.5
65.8
57.8
57.5
55.2
17.7
17.6
16.6
9.4
9.3
8.6
10.7
10.0
10.6
0.4
0.4
0.5
2.9
2.7
2.7
7.4
6.9
7.4
1.1 1.2 0.4 0.5 0.1 0.4 1.0 1.5 0.3 0.5 0.1 0.6 0.1 1.1 0.7 7.0 0.0 0.0 0.2 7.4 0.5 7.3
4.2 4.7 4.1 5.1 1.5 6.1 2.7 4.1 2.6 4.7 1.1 6.6 0.8 9.3 0.1 0.9 -0.1 -20.0 0.2 7.4 0.0 0.0
Note: These not seasonally adjusted estimates were prepared in cooperation with the U.S. Department of Labor, Bureau of Labor Statistics, based upon monthly reports submitted by
selected employers in the Gainesville Metropolitan Statistical Area, which comprises Hall county. The estimates include all full- and part-time wage and salary workers who were employed during or received pay for any part of the pay period that includes the twelfth of the month. Proprietors, domestic workers, self-employed persons, unpaid family workers and personnel of the armed forces are excluded. Estimates based on 2017 benchmark.
HINESVILLE MSA Nonfarm Employment
(In thousands)
(Not Seasonally Adjusted)
Preliminary Revised Revised AUG 2018 JUL 2018 AUG 2017
Change in Jobs from JUL 2018
Net %
Change in Jobs from AUG 2017
Net %
Total Nonfarm Total Private Goods Producing Service-Providing Private Service-Providing Government
Federal Government State Government Local Government
20.8
20.5
20.5
12.9
12.8
12.6
2.8
2.8
2.7
18.0
17.7
17.8
10.1
10.0
9.9
7.9
7.7
7.9
3.8
3.8
3.8
0.4
0.4
0.4
3.7
3.5
3.7
0.3 1.5 0.1 0.8 0.0 0.0 0.3 1.7 0.1 1.0 0.2 2.6 0.0 0.0 0.0 0.0 0.2 5.7
0.3 1.5 0.3 2.4 0.1 3.7 0.2 1.1 0.2 2.0 0.0 0.0 0.0 0.0 0.0 0.0 0.0 0.0
Note: These not seasonally adjusted estimates were prepared in cooperation with the U.S. Department of Labor, Bureau of Labor Statistics, based upon monthly reports submitted by
selected employers in the Hinesville Metropolitan Statistical Area, which includes Liberty and Long counties. The estimates include all full- and part-time wage and salary workers who were employed during or received pay for any part of the pay period that includes the twelfth of the month. Proprietors, domestic workers, self-employed persons, unpaid family workers and personnel of the armed forces are excluded. Estimates based on 2017 benchmark.
Source: Georgia Department of Labor, Workforce Statistics & Economic Research
8
MACON-BIBB COUNTY MSA Nonfarm Employment
(In thousands)
(Not Seasonally Adjusted)
Preliminary AUG 2018
Revised Revised JUL 2018 AUG 2017
Change in Jobs from JUL 2018
Net %
Change in Jobs from AUG 2017
Net %
Total Nonfarm Total Private Goods Producing Service-Providing Private Service-Providing Trade, Transportation, and Utilities
Retail Trade Transportation, Warehousing, and Utilities Financial Activities Professional and Business Services Education and Health Services Leisure and Hospitality Government Federal Government State Government Local Government
103.7 89.4 10.1 93.6 79.3 20.4 13.7 3.9 10.1 12.1 21.1 10.7 14.3 1.1 3.7 9.5
103.1 89.4 10.0 93.1 79.4 20.4 13.8 3.9 10.1 12.0 20.8 10.8 13.7 1.1 3.8 8.8
103.2 88.7 10.0 93.2 78.7 20.7 13.8 3.9 10.1 11.9 20.9 10.3 14.5 1.1 3.7 9.7
0.6 0.6 0.0 0.0 0.1 1.0 0.5 0.5 -0.1 -0.1 0.0 0.0 -0.1 -0.7 0.0 0.0 0.0 0.0 0.1 0.8 0.3 1.4 -0.1 -0.9 0.6 4.4 0.0 0.0 -0.1 -2.6 0.7 8.0
0.5 0.5 0.7 0.8 0.1 1.0 0.4 0.4 0.6 0.8 -0.3 -1.5 -0.1 -0.7 0.0 0.0 0.0 0.0 0.2 1.7 0.2 1.0 0.4 3.9 -0.2 -1.4 0.0 0.0 0.0 0.0 -0.2 -2.1
Note: These not seasonally adjusted estimates were prepared in cooperation with the U.S. Department of Labor, Bureau of Labor Statistics, based upon monthly reports submitted by
selected employers in the Macon-Bibb County Metropolitan Statistical Area, which includes Bibb, Crawford, Jones, Monroe and Twiggs counties. The estimates include all full- and part-time wage and salary workers who were employed during or received pay for any part of the pay period that includes the twelfth of the month. Proprietors, domestic workers, self-employed persons, unpaid family workers and personnel of the armed forces are excluded. Estimates based on 2017 benchmark.
ROME MSA Nonfarm Employment
(In thousands)
(Not Seasonally Adjusted)
Preliminary
Revised
Revised
AUG 2018 JUL 2018 AUG 2017
Change in Jobs from JUL 2018
Net %
Change in Jobs from AUG 2017
Net %
Total Nonfarm Total Private Goods Producing Service-Providing Private Service-Providing Manufacturing Trade, Transportation, and Utilities
Retail Trade Education and Health Services Government
Federal Government State Government Local Government
41.6
41.4
41.1
35.9
35.8
35.4
7.7
7.6
7.4
33.9
33.8
33.7
28.2
28.2
28.0
6.5
6.5
6.5
8.0
8.0
7.9
5.3
5.3
5.2
10.4
10.3
10.1
5.7
5.6
5.7
0.2
0.2
0.2
1.4
1.4
1.5
4.1
4.0
4.0
0.2 0.5 0.1 0.3 0.1 1.3 0.1 0.3 0.0 0.0 0.0 0.0 0.0 0.0 0.0 0.0 0.1 1.0 0.1 1.8 0.0 0.0 0.0 0.0 0.1 2.5
0.5 1.2 0.5 1.4 0.3 4.1 0.2 0.6 0.2 0.7 0.0 0.0 0.1 1.3 0.1 1.9 0.3 3.0 0.0 0.0 0.0 0.0 -0.1 -6.7 0.1 2.5
Note: These not seasonally adjusted estimates were prepared in cooperation with the U.S. Department of Labor, Bureau of Labor Statistics, based upon monthly reports submitted by
selected employers in the Rome Metropolitan Statistical Area, which comprises Floyd county. The estimates include all full- and part-time wage and salary workers who were employed during or received pay for any part of the pay period that includes the twelfth of the month. Proprietors, domestic workers, self-employed persons, unpaid family workers and personnel of the armed forces are excluded. Estimates based on 2017 benchmark.
Source: Georgia Department of Labor, Workforce Statistics & Economic Research
9
SAVANNAH MSA Nonfarm Employment
(In thousands)
(Not Seasonally Adjusted)
Preliminary Revised
Revised
AUG 2018 JUL 2018 AUG 2017
Change in Jobs from JUL 2018
Net %
Change in Jobs from AUG 2017
Net %
Total Nonfarm Total Private Goods Producing Service-Providing Private Service-Providing Mining, Logging and Construction Manufacturing Trade, Transportation, and Utilities
Wholesale Trade Retail Trade Transportation, Warehousing, and Utilities Information Financial Activities Professional and Business Services Education and Health Services Leisure and Hospitality Other Services Government Federal Government State Government Local Government
178.9 155.1
25.3 153.6 129.8
7.6 17.7 41.3
7.4 21.2 12.7
2.0 6.1 20.3 26.8 26.1 7.2 23.8 2.8 5.7 15.3
178.9 155.5
25.3 153.6 130.2
7.6 17.7 41.4
7.4 21.4 12.6
2.1 6.1 20.9 26.4 26.1 7.2 23.4 2.9 5.5 15.0
179.7 155.4
24.5 155.2 130.9
7.3 17.2 41.3
7.3 21.7 12.3
2.2 6.2 20.7 26.5 26.7 7.3 24.3 2.9 5.7 15.7
0.0 0.0 -0.4 -0.3 0.0 0.0 0.0 0.0 -0.4 -0.3 0.0 0.0 0.0 0.0 -0.1 -0.2 0.0 0.0 -0.2 -0.9 0.1 0.8 -0.1 -4.8 0.0 0.0 -0.6 -2.9 0.4 1.5 0.0 0.0 0.0 0.0 0.4 1.7 -0.1 -3.5 0.2 3.6 0.3 2.0
-0.8 -0.5 -0.3 -0.2 0.8 3.3 -1.6 -1.0 -1.1 -0.8 0.3 4.1 0.5 2.9 0.0 0.0 0.1 1.4 -0.5 -2.3 0.4 3.3 -0.2 -9.1 -0.1 -1.6 -0.4 -1.9 0.3 1.1 -0.6 -2.3 -0.1 -1.4 -0.5 -2.1 -0.1 -3.5 0.0 0.0 -0.4 -2.6
Note: These not seasonally adjusted estimates were prepared in cooperation with the U.S. Department of Labor, Bureau of Labor Statistics, based upon monthly reports submitted by
selected employers in the Savannah Metropolitan Statistical Area, which includes Bryan, Chatham and Effingham counties. The estimates include all full- and part-time wage and salary workers who were employed during or received pay for any part of the pay period that includes the twelfth of the month. Proprietors, domestic workers, self-employed persons, unpaid family workers and personnel of the armed forces are excluded. Estimates based on 2017 benchmark.
VALDOSTA MSA Nonfarm Employment
(In thousands)
(Not Seasonally Adjusted)
Preliminary Revised
Revised
AUG 2018 JUL 2018 AUG 2017
Change in Jobs from JUL 2018
Net %
Change in Jobs from AUG 2017
Net %
Total Nonfarm Total Private Goods Producing Service-Providing Private Service-Providing Trade, Transportation, and Utilities
Retail Trade Government
Federal Government State Government Local Government
57.2
56.8
55.7
0.4 0.7
43.9
43.9
42.7
0.0 0.0
8.0
7.9
7.4
0.1 1.3
49.2
48.9
48.3
0.3 0.6
35.9
36.0
35.3
-0.1 -0.3
12.5
12.4
12.1
0.1 0.8
7.3
7.2
7.1
0.1 1.4
13.3
12.9
13.0
0.4 3.1
1.2
1.2
1.2
0.0 0.0
4.0
3.7
3.9
0.3 8.1
8.1
8.0
7.9
0.1 1.3
1.5 2.7 1.2 2.8 0.6 8.1 0.9 1.9 0.6 1.7 0.4 3.3 0.2 2.8 0.3 2.3 0.0 0.0 0.1 2.6 0.2 2.5
Note: These not seasonally adjusted estimates were prepared in cooperation with the U.S. Department of Labor, Bureau of Labor Statistics, based upon monthly reports submitted by
selected employers in the Valdosta Metropolitan Statistical Area, which includes Brooks, Echols, Lanier and Lowndes counties. The estimates include all full- and part-time wage and salary workers who were employed during or received pay for any part of the pay period that includes the twelfth of the month. Proprietors, domestic workers, self-employed persons, unpaid family workers and personnel of the armed forces are excluded. Estimates based on 2017 benchmark.
Source: Georgia Department of Labor, Workforce Statistics & Economic Research
10
WARNER ROBINS MSA Nonfarm Employment
(In thousands)
(Not Seasonally Adjusted)
Preliminary Revised
Revised
AUG 2018 JUL 2018 AUG 2017
Change in Jobs from JUL 2018
Net %
Change in Jobs from AUG 2017
Net %
Total Nonfarm Total Private Goods Producing Service-Providing Private Service-Providing Trade, Transportation, and Utilities
Retail Trade Government
Federal Government State Government Local Government
74.8
74.1
74.2
0.7 0.9
47.7
47.3
47.0
0.4 0.9
11.2
11.2
10.5
0.0 0.0
63.6
62.9
63.7
0.7 1.1
36.5
36.1
36.5
0.4 1.1
10.7
10.8
10.7
-0.1 -0.9
8.4
8.5
8.3
-0.1 -1.2
27.1
26.8
27.2
0.3 1.1
14.9
14.9
14.7
0.0 0.0
2.4
2.4
2.3
0.0 0.0
9.8
9.5
10.2
0.3 3.2
0.6 0.8 0.7 1.5 0.7 6.7 -0.1 -0.2 0.0 0.0 0.0 0.0 0.1 1.2 -0.1 -0.4 0.2 1.4 0.1 4.4 -0.4 -3.9
Note: These not seasonally adjusted estimates were prepared in cooperation with the U.S. Department of Labor, Bureau of Labor Statistics, based upon monthly reports submitted by
selected employers in the Warner Robins Metropolitan Statistical Area, which includes Houston, Peach and Pulaski counties. The estimates include all full- and part-time wage and salary workers who were employed during or received pay for any part of the pay period that includes the twelfth of the month. Proprietors, domestic workers, self-employed persons, unpaid family workers and personnel of the armed forces are excluded. Estimates based on 2017 benchmark.
Total Nonfarm Employment by Metro Statistical Area
(In thousands)
(Seasonally Adjusted)
Preliminary
Revised
Revised
AUG 2018 JUL 2018 AUG 2017
Change in Jobs from JUL 2018
Net %
Change in Jobs from AUG 2017
Net %
Albany MSA
63.6
63.5
63.0
0.1 0.2
0.6 1.0
Athens-Clarke County MSA
100.1
99.9
97.4
0.2 0.2
2.7 2.8
Atlanta MSA
2,788.1
2,782.6
2,734.4
5.5 0.2
53.7 2.0
Augusta-Richmond County MSA
241.9
242.0
236.5
-0.1 0.0
5.4 2.3
Brunswick MSA
44.2
44.4
44.2
-0.2 -0.5
0.0 0.0
Columbus MSA
123.1
122.8
121.0
0.3 0.2
2.1 1.7
Dalton MSA
68.5
68.3
67.2
0.2 0.3
1.3 1.9
Gainesville MSA
94.2
93.8
90.2
0.4 0.4
4.0 4.4
Hinesville MSA
20.7
20.7
20.3
0.0 0.0
0.4 2.0
Macon-Bibb County MSA
103.7
103.6
103.2
0.1 0.1
0.5 0.5
Rome MSA
41.7
41.8
41.2
-0.1 -0.2
0.5 1.2
Savannah MSA
178.4
178.9
179.2
-0.5 -0.3
-0.8 -0.4
Valdosta MSA
57.3
57.1
56.0
0.2 0.4
1.3 2.3
Warner Robins MSA
75.0
74.5
74.2
0.5 0.7
0.8 1.1
Note: These seasonally adjusted estimates were prepared in cooperation with the U.S. Department of Labor, Bureau of Labor Statistics, based upon monthly reports submitted by selected
employers throughout Georgia. The estimates include all full- and part-time wage and salary workers who were employed during or received pay for any part of the pay period that includes the twelfth of the month. Proprietors, domestic workers, self-employed persons, unpaid family workers and personnel of the armed forces are excluded. Estimates based on 2017 benchmark.
Source: Georgia Department of Labor, Workforce Statistics & Economic Research
11
Georgia Statewide Hours and Earnings
All Employee
Average Weekly Earnings (AWE)
Preliminary AUG 2018
Revised JUL 2018
Revised AUG 2017
Total Private.....................................................................................................$918.37............................ $936.32.......................$910.33 Goods Producing.......................................................................................$1,032.36.......................... $1,034.13.......................$993.02 Private Service Providing..............................................................................$895.79.............................$916.66.......................$894.79 Construction............................................................................................$1,054.87..........................$1,052.57....................... $997.29 Manufacturing......................................................................................... $1,020.14.......................... $1,028.74....................... $997.25 Trade, Transportation, and Utilities........................................................... $825.46............................ $845.08.......................$795.67 Financial Activities..................................................................................$1,263.63......................... $1,299.22.................... $1,201.94 Professional and Business Services...................................................... $1,143.21........................... $1,167.14.....................$1,147.85 Educational and Health Services.............................................................. $993.67.............................$997.60.................... $1,015.63 Leisure and Hospitality.............................................................................. $350.86.............................$360.70.......................$339.56 Other Services........................................................................................... $718.76.............................$708.71.......................$680.52
Average Weekly Hours (AWH)
Preliminary AUG 2018
Revised JUL 2018
Revised AUG 2017
Total Private...........................................................................................................34.8.................................. 35.2.............................34.6 Goods Producing................................................................................................42.0................................... 41.8............................. 41.0 Private Service Providing....................................................................................33.4...................................33.9.............................33.4 Construction..................................................................................................... 41.4................................... 41.1............................. 40.1 Manufacturing..................................................................................................42.4...................................42.3............................. 41.5 Trade, Transportation, and Utilities..................................................................34.8.................................. 35.3.............................34.4 Financial Activities........................................................................................... 37.1...................................38.0.............................36.6 Professional and Business Services...............................................................35.1...................................35.4.............................33.9 Educational and Health Services.....................................................................34.1.................................. 34.4.............................35.4 Leisure and Hospitality.....................................................................................26.5................................... 27.1.............................26.0 Other Services.................................................................................................30.2...................................30.8............................. 31.8
Average Hourly Earnings (AHE)
Preliminary AUG 2018
Revised JUL 2018
Revised AUG 2017
Total Private.......................................................................................................$26.39.............................. $26.60.........................$26.31 Goods Producing............................................................................................$24.58............................... $24.74.........................$24.22 Private Service Providing................................................................................$26.82...............................$27.04.........................$26.79 Construction.................................................................................................$25.48...............................$25.61......................... $24.87 Manufacturing..............................................................................................$24.06...............................$24.32.........................$24.03 Trade, Transportation, and Utilities..............................................................$23.72.............................. $23.94......................... $23.13 Financial Activities...................................................................................... $34.06...............................$34.19.........................$32.84 Professional and Business Services...........................................................$32.57...............................$32.97.........................$33.86 Educational and Health Services................................................................. $29.14.............................. $29.00.........................$28.69 Leisure and Hospitality.................................................................................$13.24...............................$13.31.........................$13.06 Other Services............................................................................................ $23.80...............................$23.01......................... $21.40
Read more about the hours and earnings series at http://www.bls.gov/sae/home.htm
Note: These not seasonally adjusted estimates were prepared in cooperation with the U.S. Department of Labor, Bureau of Labor Statistics, based upon monthly reports submitted by
selected employers throughout Georgia. The estimates include all full- and part-time wage and salary workers who were employed during or received pay for any part of the pay period that includes the twelfth of the month. Proprietors, domestic workers, self-employed persons, unpaid family workers and personnel of the armed forces are excluded. Estimates based on 2017 benchmark.
Source: Georgia Department of Labor, Workforce Statistics & Economic Research
12
Georgia MSA Hours and Earnings
All Employee Total Private
Average Weekly Earnings (AWE)
Preliminary AUG 2018
Revised JUL 2018
Revised AUG 2017
Albany MSA .................................................................................................... $737.72............................. $745.12.......................$706.02 Athens-Clarke County MSA ...........................................................................$765.91............................. $762.17.......................$720.53 Atlanta MSA ...............................................................................................$1,004.07..........................$1,031.20....................... $967.78 Augusta-Richmond County MSA ...................................................................$793.51............................ $786.90...................... $806.53 Brunswick MSA ............................................................................................ $668.79............................ $688.80...................... $640.64 Columbus MSA ..............................................................................................$762.58.............................$749.39...................... $698.25 Dalton MSA ...................................................................................................$750.83............................. $742.70....................... $707.70 Gainesville MSA ............................................................................................ $992.99............................ $998.09..................... $1,017.14 Hinesville MSA ...............................................................................................$772.41.............................$806.12.......................$850.32 Macon-Bibb County MSA ............................................................................. $853.98............................ $858.88....................... $800.10 Rome MSA ..................................................................................................... $719.07.............................$712.52.......................$804.57 Savannah MSA .............................................................................................. $740.12............................. $757.91....................... $807.83 Valdosta MSA ................................................................................................. $726.18............................. $717.73...................... $668.35 Warner Robins MSA ....................................................................................... $787.72.............................$812.03....................... $771.64
Average Weekly Hours (AWH)
Preliminary AUG 2018
Revised JUL 2018
Revised AUG 2017
Albany MSA ..........................................................................................................34.7.................................. 34.9............................. 33.1 Athens-Clarke County MSA ................................................................................. 32.1.................................. 32.2.............................32.5 Atlanta MSA ........................................................................................................34.9...................................35.4.............................34.7 Augusta-Richmond County MSA .........................................................................34.1...................................33.4.............................34.6 Brunswick MSA ...................................................................................................32.8...................................33.6.............................30.8 Columbus MSA ....................................................................................................34.6...................................35.1.............................35.0 Dalton MSA .........................................................................................................35.3.................................. 34.4.............................35.0 Gainesville MSA ...................................................................................................40.3...................................40.1.............................40.8 Hinesville MSA .....................................................................................................36.4...................................37.2.............................36.0 Macon-Bibb County MSA ....................................................................................35.1.................................. 35.2.............................35.2 Rome MSA ...........................................................................................................36.8................................... 37.6.............................39.0 Savannah MSA ....................................................................................................33.1...................................33.7............................. 34.1 Valdosta MSA .......................................................................................................34.4.................................. 35.2.............................35.4 Warner Robins MSA ............................................................................................. 37.6...................................39.4............................. 37.9
Average Hourly Earnings (AHE)
Preliminary AUG 2018
Revised JUL 2018
Revised AUG 2017
Albany MSA ......................................................................................................$21.26...............................$21.35.........................$21.33 Athens-Clarke County MSA ............................................................................ $23.86...............................$23.67......................... $22.17 Atlanta MSA ....................................................................................................$28.77............................... $29.13......................... $27.89 Augusta-Richmond County MSA .....................................................................$23.27.............................. $23.56.........................$23.31 Brunswick MSA ...............................................................................................$20.39.............................. $20.50.........................$20.80 Columbus MSA ............................................................................................... $22.04...............................$21.35......................... $19.95 Dalton MSA .....................................................................................................$21.27...............................$21.59.........................$20.22 Gainesville MSA ...............................................................................................$24.64...............................$24.89.........................$24.93 Hinesville MSA .................................................................................................$21.22...............................$21.67.........................$23.62 Macon-Bibb County MSA ................................................................................$24.33...............................$24.40.........................$22.73 Rome MSA .......................................................................................................$19.54...............................$18.95.........................$20.63 Savannah MSA ............................................................................................... $22.36.............................. $22.49.........................$23.69 Valdosta MSA ................................................................................................... $21.11.............................. $20.39.........................$18.88 Warner Robins MSA .........................................................................................$20.95...............................$20.61.........................$20.36
Read more about the hours and earnings series at http://www.bls.gov/sae/home.htm
Note: These not seasonally adjusted estimates were prepared in cooperation with the U.S. Department of Labor, Bureau of Labor Statistics, based upon monthly reports submitted by
selected employers throughout Georgia. The estimates include all full- and part-time wage and salary workers who were employed during or received pay for any part of the pay period that includes the twelfth of the month. Proprietors, domestic workers, self-employed persons, unpaid family workers and personnel of the armed forces are excluded. Estimates based on 2017 benchmark.
Source: Georgia Department of Labor, Workforce Statistics & Economic Research
13
Dimensions - Measuring Georgia's Labor Force
Unemployment rates -- Georgia and U.S.
6%
5%
4%
3% Aug Sep Oct Nov Dec Jan Feb Mar Apr May June July Aug
Georgia
U.S.
WA 4.5 OR 3.8 NV 4.5 CA 4.2
AK 6.7
ID 2.8
UT 3.1 AZ 4.6
StaStteatuenUenmepmlopylomymenetnrt aRtaetses
August 2018
National Unemployment Rate: 3.9% Rates are seasonally adjusted
MT 3.6
WY 3.9
CO 2.9 NM 4.6
ND 2.6 SD 3.0
NE 2.8
KS 3.3
MN 2.9
WI 3.0
IA 2.5
IL 4.1 MO 3.3
OK 3.7 TX 3.9
AR 3.6
MS 4.8 LA 5.0
MI 4.1
OH
IN
4.6
3.5
KY 4.4 TN 3.6
PA 4.1
WV
5.3
VA
3.0
NC 3.9
SC 3.4
AL
GA
4.1
3.8
FL 3.7
NH
2.7 ME
VT
3.2
2.8
MA 3.6
NY 4.2
RI 4.0
CT
NJ 4.2
4.3
DE
3.9
DC 5.6
MD 4.2
Unemployment rate
6.0% or greater 5.0% to 5.9% 4.0% to 4.9% 3.0% to 3.9% Less than 3.0%
HI 2.1 Source: Georgia Department of Labor, Workforce Statistics & Economic Research
14
Georgia Labor Force Estimates
Place of Residence - Persons 16 Years and Older
Georgia
(Seasonally adjusted)
Georgia
(Not Seasonally adjusted)
Albany MSA Athens-Clarke County MSA
Atlanta MSA
Augusta-Richmond County MSA
Brunswick MSA
Columbus MSA
Dalton MSA
Gainesville MSA
Employment Status
Civilian labor force Employed Unemployed Rate
Civilian labor force Employed Unemployed Rate
Civilian labor force Employed Unemployed Rate
Civilian labor force Employed Unemployed Rate
Civilian labor force Employed Unemployed Rate
Civilian labor force Employed Unemployed Rate
Civilian labor force Employed Unemployed Rate
Civilian labor force Employed Unemployed Rate
Civilian labor force Employed Unemployed Rate
Civilian labor force Employed Unemployed Rate
Preliminary AUG 2018
5,161,920 4,964,915
197,005 3.8
5,124,948 4,932,333
192,615 3.8
67,881 64,706
3,175 4.7
103,008 99,427 3,581 3.5
3,085,957 2,975,023
110,934 3.6
269,090 257,696
11,394 4.2
53,649 51,675
1,974 3.7
125,887 120,124
5,763 4.6
61,523 58,941
2,582 4.2
103,888 100,818
3,070 3.0
Revised JUL 2018
5,162,235 4,958,420
203,815 3.9
5,196,412 4,987,114 209,298
4.0
69,125 65,677
3,448 5.0
104,354 100,450
3,904 3.7
3,127,974 3,009,160
118,814 3.8
273,482 261,544
11,938 4.4
54,855 52,798
2,057 3.7
127,711 121,548
6,163 4.8
62,867 59,719
3,148 5.0
104,822 101,485
3,337 3.2
Revised AUG 2017
5,079,464 4,849,918
229,546 4.5
5,060,417 4,812,312
248,105 4.9
67,629 63,694
3,935 5.8
100,737 96,045
4,692 4.7
3,038,498 2,895,101
143,397 4.7
265,932 251,937 13,995
5.3
53,597 50,953
2,644 4.9
124,078 116,988
7,090 5.7
60,889 57,527 3,362
5.5
100,441 96,320
4,121 4.1
Change From
JUL 2018
AUG 2017
-315 6,495 -6,810
82,456 114,997 -32,541
-71,464 -54,781 -16,683
64,531 120,021 -55,490
-1,244 -971 -273
252 1,012 -760
-1,346 -1,023
-323
2,271 3,382 -1,111
-42,017 -34,137
-7,880
47,459 79,922 -32,463
-4,392 -3,848
-544
3,158 5,759 -2,601
-1,206 -1,123
-83
52 722 -670
-1,824 -1,424
-400
1,809 3,136 -1,327
-1,344 -778 -566
634 1,414 -780
-934 -667 -267
3,447 4,498 -1,051
Note: MSA data are not seasonally adjusted. Employment includes nonagricultural wage and salary employment, self-employment, unpaid family and private
household workers and agricultural workers. Persons in labor disputes are counted as employed. The use of unrounded data does not imply that the numbers are exact.
Albany MSA: Baker, Dougherty, Lee, Terrell, and Worth counties. Athens-Clarke County MSA: Clarke, Madison, Oconee, and Oglethorpe counties. Atlanta MSA: Barrow, Bartow, Butts, Carroll, Cherokee, Clayton, Cobb, Coweta, Dawson, DeKalb, Douglas, Fayette, Forsyth, Fulton, Gwinnett, Haralson, Heard, Henry, Jasper, Lamar, Meriwether, Morgan, Newton, Paulding, Pickens, Pike, Rockdale, Spalding, and Walton counties. Augusta-Richmond County MSA: Burke, Columbia, Lincoln, McDuffie, and Richmond counties in Georgia and Aiken and Edgefield counties in South Carolina. Brunswick MSA: Brantley, Glynn, and McIntosh counties. Columbus MSA: Chattahoochee, Harris, Marion, and Muscogee counties in Georgia and Russell County in Alabama. Dalton MSA: Murray and Whitfield counties. Gainesville MSA: Hall County. Hinesville MSA: Liberty and Long counties. Macon-Bibb County MSA: Bibb, Crawford, Jones, Monroe, and Twiggs counties. Rome MSA: Floyd County. Savannah MSA: Bryan, Chatham, and Effingham counties. Valdosta MSA: Brooks, Echols, Lanier, and Lowndes counties. Warner Robins MSA: Houston, Peach and Pulaski counties.
Source: Georgia Department of Labor, Workforce Statistics & Economic Research
15
Hinesville MSA
Macon-Bibb County MSA Rome MSA Savannah MSA
Valdosta MSA Warner Robins MSA
Georgia Labor Force Estimates
Place of Residence - Persons 16 Years and Older
Employment Status
Civilian labor force Employed Unemployed Rate
Civilian labor force Employed Unemployed Rate
Preliminary AUG 2018
33,910 32,535
1,375 4.1
105,597 101,293
4,304 4.1
Revised JUL 2018
34,175 32,711 1,464
4.3
106,947 102,356
4,591 4.3
Revised AUG 2017
33,770 32,003
1,767 5.2
105,593 99,893 5,700 5.4
Civilian labor force Employed Unemployed Rate
Civilian labor force Employed Unemployed Rate
44,479 42,610 1,869
4.2
185,202 178,560
6,642 3.6
45,264 43,151
2,113 4.7
188,672 181,673
6,999 3.7
44,203 41,831 2,372
5.4
186,191 177,687
8,504 4.6
Civilian labor force Employed Unemployed Rate
Civilian labor force Employed Unemployed Rate
65,599 63,036
2,563 3.9
85,378 82,064
3,314 3.9
66,609 63,841
2,768 4.2
86,358 82,856
3,502 4.1
64,318 61,127
3,191 5.0
85,132 80,855
4,277 5.0
Change From
JUL 2018
AUG 2017
-265 -176 -89
140 532 -392
-1,350 -1,063
-287
4 1,400 -1,396
-785 -541 -244
276 779 -503
-3,470 -3,113
-357
-989 873 -1,862
-1,010 -805 -205
1,281 1,909 -628
-980 -792 -188
246 1,209 -963
Area United States
(Seasonally adjusted)
United States
(Not Seasonally adjusted)
United States Labor Force Estimates
Place of Residence - Persons 16 Years and Older
Employment Status
Civilian labor force Employed Unemployed Rate
Civilian labor force Employed Unemployed Rate
AUG 2018
161,776,000 155,542,000
6,234,000 3.9
161,909,000 155,539,000
6,370,000 3.9
JUL 2018
162,245,000 155,965,000
6,280,000 3.9
163,734,000 157,004,000
6,730,000 4.1
AUG 2017
160,598,000 153,471,000
7,127,000 4.4
160,863,000 153,576,000
7,287,000 4.5
Change From
JUL 2018
AUG 2017
-469,000 -423,000
-46,000
1,178,000 2,071,000 -893,000
-1,825,000 -1,465,000
-360,000
1,046,000 1,963,000
-917,000
Note: MSA data are not seasonally adjusted. Employment includes nonagricultural wage and salary employment, self-employment, unpaid family and private
household workers and agricultural workers. Persons in labor disputes are counted as employed. The use of unrounded data does not imply that the numbers are exact.
Albany MSA: Baker, Dougherty, Lee, Terrell, and Worth counties. Athens-Clarke County MSA: Clarke, Madison, Oconee, and Oglethorpe counties. Atlanta MSA: Barrow, Bartow, Butts, Carroll, Cherokee, Clayton, Cobb, Coweta, Dawson, DeKalb, Douglas, Fayette, Forsyth, Fulton, Gwinnett, Haralson, Heard, Henry, Jasper, Lamar, Meriwether, Morgan, Newton, Paulding, Pickens, Pike, Rockdale, Spalding, and Walton counties. Augusta-Richmond County MSA: Burke, Columbia, Lincoln, McDuffie, and Richmond counties in Georgia and Aiken and Edgefield counties in South Carolina. Brunswick MSA: Brantley, Glynn, and McIntosh counties. Columbus MSA: Chattahoochee, Harris, Marion, and Muscogee counties in Georgia and Russell County in Alabama. Dalton MSA: Murray and Whitfield counties. Gainesville MSA: Hall County. Hinesville MSA: Liberty and Long counties. Macon-Bibb County MSA: Bibb, Crawford, Jones, Monroe, and Twiggs counties. Rome MSA: Floyd County. Savannah MSA: Bryan, Chatham, and Effingham counties. Valdosta MSA: Brooks, Echols, Lanier, and Lowndes counties. Warner Robins MSA: Houston, Peach and Pulaski counties.
Source: Georgia Department of Labor, Workforce Statistics & Economic Research
16
Georgia Labor Force Estimates by County (not seasonally adjusted)
Place of Residence - Persons 16 Years and Older
Georgia
Preliminary August 2018
Labor Force
Employment
Unemployment Number Rate
5,124,948 4,932,333 192,615 3.8
Appling Atkinson Bacon Baker Baldwin
9,066 4,388 5,051 1,199 17,143
8,668 4,258 4,853 1,138 16,304
398 4.4 130 3.0 198 3.9
61 5.1 839 4.9
Banks Barrow Bartow Ben Hill Berrien
9,528 9,250
278 2.9
39,497 38,263 1,234 3.1
50,516 48,715 1,801 3.6
5,277 4,964
313 5.9
7,290 6,991
299 4.1
Bibb Bleckley Brantley Brooks Bryan
69,622 66,637 2,985 4.3
4,549 4,293
256 5.6
7,305 6,982
323 4.4
7,220 6,964
256 3.5
17,311 16,730
581 3.4
Bulloch Burke Butts Calhoun Camden
36,978 35,469 1,509 4.1
9,504 8,977
527 5.5
10,863 10,431
432 4.0
2,270 2,179
91 4.0
20,952 20,081
871 4.2
Candler Carroll Catoosa Charlton Chatham
5,252 5,069
183 3.5
55,793 53,692 2,101 3.8
33,954 32,847 1,107 3.3
4,909 4,719
190 3.9
138,929 133,799 5,130 3.7
Chattahoochee 2,086 1,964
122 5.8
Chattooga
10,547 10,162
385 3.7
Cherokee 132,504 128,585 3,919 3.0
Clarke
62,108 59,793 2,315 3.7
Clay
854
793
61 7.1
Clayton Clinch Cobb Coffee Colquitt
136,421 130,051 6,370 4.7
2,651 2,531
120 4.5
431,058 417,220 13,838 3.2
19,164 18,390
774 4.0
22,207 21,432
775 3.5
Columbia Cook Coweta Crawford Crisp
74,015 71,422 2,593 3.5
7,814 7,531
283 3.6
73,624 71,279 2,345 3.2
5,738 5,524
214 3.7
9,258 8,853
405 4.4
Revised July 2018
Labor Force
Employment
Unemployment Number Rate
5,196,412 4,987,114 209,298 4.0
9,161 4,443 5,093 1,215 17,097
8,727 4,294 4,896 1,155 16,171
434 4.7 149 3.4 197 3.9
60 4.9 926 5.4
9,610 9,294
316 3.3
40,021 38,700 1,321 3.3
51,221 49,272 1,949 3.8
5,396 5,030 366 6.8
7,370 7,061 309 4.2
70,520 67,333 3,187 4.5
4,600 4,290
310 6.7
7,473
7,131
342 4.6
7,332
7,056
276 3.8
17,649 17,023
626 3.5
36,910 35,129 1,781 4.8
9,793
9,119
674 6.9
11,007 10,550
457 4.2
2,282
2,179
103 4.5
21,148 20,240 908 4.3
5,280 5,086
194 3.7
56,630 54,313 2,317 4.1
34,383 33,189 1,194 3.5
4,974 4,766
208 4.2
141,490 136,131 5,359 3.8
2,116 1,990
126 6.0
10,632 10,200
432 4.1
134,264 130,068 4,196 3.1
62,956 60,402 2,554 4.1
870
804
66 7.6
138,494 131,532 6,962 5.0
2,688 2,553
135 5.0
436,842 422,020 14,822 3.4
19,394 18,514 880 4.5
22,432 21,623 809 3.6
75,230 72,564 2,666 3.5
7,897
7,578
319 4.0
74,771 72,095 2,676 3.6
5,805 5,582
223 3.8
9,402 8,977
425 4.5
Revised August 2017
Labor Force
Employment
Unemployment Number Rate
5,060,417 4,812,312 248,105 4.9
9,276 8,698
578 6.2
4,151 3,985
166 4.0
5,041 4,801
240 4.8
1,207 1,125
82 6.8
17,696 16,620 1,076 6.1
9,197 8,823
374 4.1
38,900 37,259 1,641 4.2
49,798 47,435 2,363 4.7
5,454 5,034
420 7.7
7,349 6,961
388 5.3
69,618 65,729 3,889 5.6
4,515 4,207 308 6.8
7,298 6,851
447 6.1
7,099 6,753
346 4.9
17,398 16,634 764 4.4
37,209 9,413
10,685 2,216
20,928
35,295 8,731 10,161 2,101
19,825
1,914 5.1 682 7.2 524 4.9 115 5.2
1,103 5.3
5,249 5,025
224 4.3
55,071 52,227 2,844 5.2
32,943 31,554 1,389 4.2
4,820 4,549
271 5.6
139,637 133,133 6,504 4.7
2,074 1,918
156 7.5
10,649 10,119 530 5.0
130,134 125,051 5,083 3.9
60,810 57,785 3,025 5.0
870
790
80 9.2
134,761 126,671 8,090 6.0
2,764 2,622
142 5.1
423,805 405,877 17,928 4.2
18,377 17,481 896 4.9
22,100 21,074 1,026 4.6
72,498 69,267 3,231 4.5
7,697 7,328
369 4.8
72,553 69,397 3,156 4.3
5,739 5,449
290 5.1
9,455 8,948
507 5.4
Source: Georgia Department of Labor, Workforce Statistics & Economic Research
17
Georgia Labor Force Estimates by County (not seasonally adjusted)
Place of Residence - Persons 16 Years and Older
Dade Dawson Decatur DeKalb Dodge
Preliminary August 2018
Labor Force
Employment
Unemployment Number Rate
8,509 8,224
285 3.3
11,928 11,551
377 3.2
11,644 11,121
523 4.5
401,324 385,863 15,461 3.9
7,062 6,713 349 4.9
Dooly Dougherty Douglas Early Echols
5,089 4,888
201 3.9
38,686 36,766 1,920 5.0
73,588 70,692 2,896 3.9
4,509
4,311
198 4.4
1,945 1,883
62 3.2
Effingham Elbert Emanuel Evans Fannin
28,962 7,796 8,388 4,874
11,350
28,031 7,470 7,896 4,703
10,939
931 3.2 326 4.2 492 5.9 171 3.5 411 3.6
Fayette Floyd Forsyth Franklin Fulton
58,495 56,552 1,943 3.3 44,479 42,610 1,869 4.2 116,910 113,398 3,512 3.0 10,157 9,814 343 3.4 556,910 535,600 21,310 3.8
Gilmer Glascock Glynn Gordon Grady
12,064 11,574 490 4.1
1,296 1,245
51 3.9
40,196 38,775 1,421 3.5
26,943 25,977 966 3.6
10,691 10,291 400 3.7
Greene
6,895 6,619
276 4.0
Gwinnett
491,603 475,226 16,377 3.3
Habersham 19,370 18,697
673 3.5
Hall
103,888 100,818 3,070 3.0
Hancock
2,472 2,323
149 6.0
Haralson Harris Hart Heard Henry
12,681 12,226 455 3.6
16,490 15,935 555 3.4
11,430 11,043
387 3.4
5,202 5,015
187 3.6
114,022 109,481 4,541 4.0
Houston Irwin Jackson Jasper Jeff Davis
69,532 66,915 2,617 3.8
3,185 3,011
174 5.5
36,850 35,831 1,019 2.8
6,916 6,689
227 3.3
6,069 5,783 286 4.7
Revised July 2018
Labor Force
Employment
Unemployment Number Rate
8,620 8,317 303 3.5
12,098 11,686
412 3.4
11,778 11,242 536 4.6
406,583 390,280 16,303 4.0
7,337 6,761
576 7.9
5,154 4,940
214 4.2
39,423 37,317 2,106 5.3
74,639 71,503 3,136 4.2
4,564 4,346
218 4.8
1,968 1,906
62 3.2
29,533 28,519 1,014 3.4
7,944
7,520
424 5.3
8,539 7,923
616 7.2
4,891 4,706
185 3.8
11,518 11,061
457 4.0
59,273 57,197 2,076 3.5
45,264 43,151 2,113 4.7
118,411 114,699 3,712 3.1
10,364 9,936
428 4.1
564,333 541,739 22,594 4.0
12,178 11,691
487 4.0
1,306 1,249
57 4.4
41,086 39,622 1,464 3.6
27,383 26,218 1,165 4.3
10,768 10,337
431 4.0
6,990 6,704 286 4.1
498,269 480,711 17,558 3.5
19,617 18,836
781 4.0
104,822 101,485 3,337 3.2
2,457 2,309
148 6.0
12,873 12,369 504 3.9
16,731 16,149 582 3.5
11,679 11,143 536 4.6
5,281 5,070
211 4.0
115,623 110,719 4,904 4.2
70,316 67,555 2,761 3.9
3,250 3,033
217 6.7
37,126 36,054 1,072 2.9
7,007 6,767
240 3.4
6,176 5,811 365 5.9
Revised August 2017
Labor Force
Employment
Unemployment Number Rate
8,226 7,863
363 4.4
11,689 11,216
473 4.0
11,583 10,895 688 5.9
395,383 375,543 19,840 5.0
7,047 6,613 434 6.2
5,078 4,805
273 5.4
38,689 36,189 2,500 6.5
72,441 68,791 3,650 5.0
4,522 4,266
256 5.7
1,907 1,836
71 3.7
29,156 27,920 1,236 4.2
7,802 7,379
423 5.4
8,594 7,961
633 7.4
4,919 4,693
226 4.6
11,002 10,476
526 4.8
57,492 55,062 2,430 4.2
44,203 41,831 2,372 5.4
114,877 110,352 4,525 3.9
9,934 9,446
488 4.9
548,932 521,268 27,664 5.0
11,975 11,358
617 5.2
1,293 1,230
63 4.9
40,136 38,258 1,878 4.7
26,708 25,452 1,256 4.7
10,597 10,064
533 5.0
6,870 6,496
374 5.4
483,434 462,142 21,292 4.4
19,246 18,369
877 4.6
100,441 96,320 4,121 4.1
2,537 2,362
175 6.9
12,507 16,229 11,178
5,153 112,434
11,885 15,516 10,668 4,880 106,715
622 5.0 713 4.4 510 4.6 273 5.3 5,719 5.1
69,325 65,951 3,374 4.9
3,254 3,039
215 6.6
34,783 33,459 1,324 3.8
6,813 6,507 306 4.5
6,184 5,799
385 6.2
Source: Georgia Department of Labor, Workforce Statistics & Economic Research
18
Georgia Labor Force Estimates by County (not seasonally adjusted)
Place of Residence - Persons 16 Years and Older
Jefferson Jenkins Johnson Jones Lamar
Preliminary August 2018
Labor Force
6,626 3,206 3,939 14,064 8,254
Employment
6,269 3,047 3,793 13,577 7,883
Unemployment Number Rate
357 5.4 159 5.0 146 3.7 487 3.5 371 4.5
Lanier Laurens Lee Liberty Lincoln
3,924 3,758
166 4.2
19,211 18,297
914 4.8
14,877 14,358
519 3.5
26,125 25,052 1,073 4.1
3,626 3,455
171 4.7
Long Lowndes Lumpkin McDuffie McIntosh
7,785 7,483 302 3.9
52,510 50,431 2,079 4.0
17,075 16,501
574 3.4
9,152 8,584 568 6.2
6,148 5,918 230 3.7
Macon Madison Marion Meriwether Miller
4,684 13,872 3,453
9,178 2,820
4,439 13,421
3,274 8,712 2,728
245 5.2 451 3.3 179 5.2 466 5.1
92 3.3
Mitchell Monroe Montgomery Morgan Murray
8,302 13,247
3,742 9,140 15,893
7,843 12,789 3,534 8,840 15,159
459 5.5 458 3.5 208 5.6 300 3.3 734 4.6
Muscogee Newton Oconee Oglethorpe Paulding
79,974 76,097 3,877 4.8
52,297 50,084 2,213 4.2
19,685 19,121 564 2.9
7,343 7,092
251 3.4
83,650 80,908 2,742 3.3
Peach Pickens Pierce Pike Polk
11,696 15,099
8,772 8,797 18,694
11,158 14,603
8,455 8,507 17,949
538 4.6 496 3.3 317 3.6 290 3.3 745 4.0
Pulaski Putnam Quitman Rabun Randolph
4,150 8,224
844 7,184 2,504
3,991 7,851
800 6,925 2,340
159 3.8 373 4.5
44 5.2 259 3.6 164 6.5
Revised July 2018
Labor Force
6,737 3,258 4,025 14,233 8,378
Employment
6,322 3,044 3,827 13,720 7,974
Unemployment Number Rate
415 6.2 214 6.6 198 4.9 513 3.6 404 4.8
3,984 3,806
178 4.5
19,573 18,456 1,117 5.7
15,126 14,573 553 3.7
26,334 25,183 1,151 4.4
3,685 3,508
177 4.8
7,841 7,528
313 4.0
53,325 51,073 2,252 4.2
16,863 16,255 608 3.6
9,300 8,721
579 6.2
6,296 6,045
251 4.0
4,745 14,060
3,513 9,298 2,845
4,491 13,562
3,316 8,814 2,747
254 5.4 498 3.5 197 5.6 484 5.2
98 3.4
8,418 13,426
3,873 9,268 16,289
7,922 12,926
3,574 8,945 15,360
496 5.9 500 3.7 299 7.7 323 3.5 929 5.7
81,293 77,116 4,177 5.1
53,080 50,658 2,422 4.6
19,902 19,320 582 2.9
7,436
7,166
270 3.6
84,771 81,831 2,940 3.5
11,842 15,314 8,866 8,929 18,943
11,270 14,768 8,523 8,606 18,143
572 4.8 546 3.6 343 3.9 323 3.6 800 4.2
4,200 8,358
849 7,410 2,515
4,031 7,959
802 7,128 2,350
169 4.0 399 4.8
47 5.5 282 3.8 165 6.6
Revised August 2017
Labor Force
6,741 3,197 3,964 14,027 8,127
Employment
6,296 2,981 3,768 13,385 7,660
Unemployment Number Rate
445 6.6 216 6.8 196 4.9 642 4.6 467 5.7
3,849 19,314 14,788 26,021 3,557
3,638 18,167 14,128 24,650 3,357
211 5.5 1,147 5.9
660 4.5 1,371 5.3
200 5.6
7,749 7,353 396 5.1
51,463 48,900 2,563 5.0
16,797 16,095
702 4.2
8,905 8,337
568 6.4
6,163 5,844
319 5.2
4,773 13,561
3,391 8,989 2,825
4,435 12,950
3,184 8,470 2,689
338 7.1 611 4.5 207 6.1 519 5.8 136 4.8
8,512 13,243 3,834
9,007 15,725
7,928 12,590
3,569 8,586 14,797
584 6.9 653 4.9 265 6.9 421 4.7 928 5.9
79,128 74,114 5,014 6.3
51,567 48,763 2,804 5.4
19,173 18,450
723 3.8
7,193 6,860
333 4.6
82,364 78,797 3,567 4.3
11,664 14,865
8,784 8,660 18,405
10,979 14,212 8,377 8,269 17,442
685 5.9 653 4.4 407 4.6 391 4.5 963 5.2
4,143 8,102
827 7,073 2,479
3,925 7,613
772 6,738 2,304
218 5.3 489 6.0
55 6.7 335 4.7 175 7.1
Source: Georgia Department of Labor, Workforce Statistics & Economic Research
19
Georgia Labor Force Estimates by County (not seasonally adjusted) Place of Residence - Persons 16 Years and Older
Richmond Rockdale Schley Screven Seminole
Preliminary August 2018
Labor Force
Employment
Unemployment Number Rate
87,680 83,186 4,494 5.1
45,334 43,428 1,906 4.2
2,125 2,030
95 4.5
5,282 5,011
271 5.1
3,096 2,930
166 5.4
Spalding Stephens Stewart Sumter Talbot
28,885 27,586 1,299 4.5
10,928 10,466
462 4.2
2,306 2,203
103 4.5
12,844 12,131
713 5.6
2,840 2,701
139 4.9
Taliaferro Tattnall Taylor Telfair Terrell
573 9,637 2,761 4,551 3,817
545 9,252 2,612 4,263 3,542
28 4.9 385 4.0 149 5.4 288 6.3 275 7.2
Thomas Tift Toombs Towns Treutlen
16,859 19,314 11,834 3,891 2,635
16,109 18,540 11,168
3,687 2,488
750 4.4 774 4.0 666 5.6 204 5.2 147 5.6
Troup Turner Twiggs Union Upson
37,117 35,819 1,298 3.5
3,188 3,024
164 5.1
2,926 2,766
160 5.5
10,104 9,751
353 3.5
11,268 10,781
487 4.3
Walker
31,467 30,326 1,141 3.6
Walton
45,468 43,943 1,525 3.4
Ware
15,856 15,255
601 3.8
Warren
2,741 2,589
152 5.5
Washington
7,221 6,892
329 4.6
Wayne Webster Wheeler White Whitfield
11,398 10,882
516 4.5
979
924
55 5.6
1,692 1,584
108 6.4
16,441 15,985
456 2.8
45,630 43,782 1,848 4.0
Wilcox Wilkes Wilkinson Worth
2,696 3,862 3,824 9,302
2,567 3,695 3,662 8,902
129 4.8 167 4.3 162 4.2 400 4.3
Revised July 2018
Labor Force
Employment
Unemployment Number Rate
89,380 84,512 4,868 5.4
45,933 43,926 2,007 4.4
2,152 2,041
111 5.2
5,351 5,003 348 6.5
3,114 2,945
169 5.4
29,295 27,903 1,392 4.8
11,209 10,617
592 5.3
2,326 2,215
111 4.8
12,990 12,191
799 6.2
2,883 2,732
151 5.2
584 9,770 2,797 4,816 3,902
552 9,330 2,630 4,220 3,595
32 5.5 440 4.5 167 6.0 596 12.4 307 7.9
16,988 16,174
814 4.8
19,482 18,662
820 4.2
12,304 11,299 1,005 8.2
3,763 3,545
218 5.8
2,742 2,527
215 7.8
37,700 36,177 1,523 4.0
3,227 3,070
157 4.9
2,963 2,795
168 5.7
10,214 9,848 366 3.6
11,409 10,890
519 4.5
31,924 30,643 1,281 4.0
46,068 44,445 1,623 3.5
15,975 15,375 600 3.8
2,789 2,624
165 5.9
7,289 6,928
361 5.0
11,487 999
1,796 16,767 46,578
10,938 934
1,589 16,251 44,359
549 4.8 65 6.5
207 11.5 516 3.1 2,219 4.8
2,738 3,922 3,869 9,459
2,579 3,742 3,689 9,037
159 5.8 180 4.6 180 4.7 422 4.5
Revised August 2017
Labor Force
Employment
Unemployment Number Rate
86,138 80,802 5,336 6.2
44,727 42,263 2,464 5.5
2,102 1,980
122 5.8
5,252 4,922
330 6.3
3,098 2,896
202 6.5
28,564 10,930
2,276 12,765 2,806
26,852 10,307
2,147 11,856 2,637
1,712 6.0 623 5.7 129 5.7 909 7.1 169 6.0
570 9,602 2,821 4,710 3,709
535 9,103 2,594 4,358 3,485
35 6.1 499 5.2 227 8.0 352 7.5 224 6.0
17,093 16,031 1,062 6.2
19,215 18,243
972 5.1
12,052 11,253
799 6.6
4,039 3,782
257 6.4
2,712 2,535
177 6.5
37,731 3,263 2,966 10,154 11,210
36,006 3,074 2,740 9,687
10,583
1,725 4.6 189 5.8 226 7.6 467 4.6 627 5.6
30,594 29,144 1,450 4.7
44,766 42,790 1,976 4.4
15,906 15,136
770 4.8
2,697 2,539
158 5.9
7,333 6,885
448 6.1
11,318 10,657
661 5.8
980
903
77 7.9
1,754 1,593
161 9.2
15,793 15,165
628 4.0
45,164 42,730 2,434 5.4
2,668 3,852 3,871 9,236
2,505 3,629 3,658 8,767
163 6.1 223 5.8 213 5.5 469 5.1
Source: Georgia Department of Labor, Workforce Statistics & Economic Research
20
City Labor Force Estimates
Place of Residence - Persons 16 Years and Older
Preliminary August 2018
Labor Force
Employment
Unemployment Number Rate
*Albany 31,377 29,761 1,616 5.2
*Alpharetta 37,111 35,989 1,122 3.0
*Athens 62,108 59,793 2,315 3.7
*Atlanta 254,495 244,169 10,326 4.1
Fulton Part 234,384 224,716 9,668 4.1
Dekalb Part
20,111 19,453
658 3.3
*Augusta 87,680 83,186 4,494 5.1
*Brookhaven
34,116 33,277
839 2.5
*Canton 14,287 13,899
388 2.7
Carrollton 11,771 11,229
542 4.6
*Chamblee 19,954 19,456
498 2.5
*Columbus 79,974 76,097 3,877 4.8
Dalton 14,507 13,933
574 4.0
Douglasville
17,288 16,587
701 4.1
Duluth 16,371 15,883
488 3.0
*Dunwoody 27,870 27,077
793 2.8
East Point
17,423 16,547
876 5.0
Gainesville 19,902 19,273
629 3.2
Hinesville 15,302 14,698
604 3.9
*Johns Creek
45,934 44,497 1,437 3.1
Kennesaw 20,214 19,626
588 2.9
LaGrange 15,379 14,779
600 3.9
Lawrenceville
15,305 14,714
591 3.9
*Macon-Bibb
69,622 66,637 2,985 4.3
*Marietta 36,539 35,400 1,139 3.1
Milton 20,304 19,651
653 3.2
Newnan 18,018 17,351
667 3.7
Peachtree City 18,704 18,173
531 2.8
P'tree Corners 25,205 24,412
793 3.1
Rome 15,668 14,969
699 4.5
*Roswell 55,118 53,531 1,587 2.9
*Sandy Springs 65,432 63,500 1,932 3.0
*Savannah 67,429 64,691 2,738 4.1
*Smyrna 36,094 34,947 1,147 3.2
Statesboro 14,291 13,516
775 5.4
Stockbridge
14,368 13,708
660 4.6
*Tucker 19,864 19,211
653 3.3
*Valdosta 26,094 24,981 1,113 4.3
*Warner Robins 33,017 31,685 1,332 4.0
Woodstock 17,092 16,597
495 2.9
Revised July 2018
Labor Force
Employment
Unemployment Number Rate
31,963 30,207 1,756 5.5
37,517 36,402 1,115 3.0
62,956 60,402 2,554 4.1
257,971 246,966 11,005 4.3
237,605 227,291 10,314 4.3
20,366 19,675
691 3.4
89,380 84,512 4,868 5.4
34,506 33,658
848 2.5
14,470 14,059
411 2.8
11,987 11,359
628 5.2
20,212 19,679
533 2.6
81,293 77,116 4,177 5.1
14,863 14,117
746 5.0
17,586 16,777
809 4.6
16,603 16,066
537 3.2
28,168 27,387
781 2.8
17,700 16,736
964 5.4
20,087 19,400
687 3.4
15,412 14,775
637 4.1
46,503 45,007 1,496 3.2
20,516 19,851
665 3.2
15,650 14,927
723 4.6
15,492 14,884
608 3.9
70,520 67,333 3,187 4.5
37,033 35,807 1,226 3.3
20,539 19,876
663 3.2
18,294 17,549
745 4.1
18,953 18,380
573 3.0
25,545 24,693
852 3.3
15,977 15,160
817 5.1
55,828 54,144 1,684 3.0
66,167 64,228 1,939 2.9
68,736 65,819 2,917 4.2
36,537 35,349 1,188 3.3
14,296 13,386
910 6.4
14,562 13,863
699 4.8
20,136 19,431
705 3.5
26,559 25,299 1,260 4.7
33,370 31,988 1,382 4.1
17,312 16,788
524 3.0
Revised August 2017
Labor Force
Employment
Unemployment Number Rate
31,368 29,294 2,074 6.6
36,431 35,026 1,405 3.9
60,810 57,785 3,025 5.0
251,206 237,635 13,571 5.4
231,440 218,703 12,737 5.5
19,766 18,932
834 4.2
86,138 80,802 5,336 6.2
33,511 32,387 1,124 3.4
14,044 13,517
527 3.8
11,658 10,922
736 6.3
19,580 18,936
644 3.3
79,128 74,114 5,014 6.3
14,416 13,598
818 5.7
17,053 16,141
912 5.3
16,143 15,446
697 4.3
27,437 26,353 1,084 4.0
17,288 16,104 1,184 6.8
19,260 18,413
847 4.4
15,200 14,462
738 4.9
45,172 43,307 1,865 4.1
19,892 19,092
800 4.0
15,689 14,856
833 5.3
15,041 14,309
732 4.9
69,618 65,729 3,889 5.6
35,946 34,438 1,508 4.2
19,900 19,125
775 3.9
17,749 16,892
857 4.8
18,363 17,694
669 3.6
24,751 23,739 1,012 4.1
15,579 14,696
883 5.7
54,203 52,098 2,105 3.9
64,190 61,801 2,389 3.7
67,913 64,369 3,544 5.2
35,438 33,997 1,441 4.1
14,392 13,449
943 6.6
14,271 13,362
909 6.4
19,514 18,697
817 4.2
25,639 24,222 1,417 5.5
32,914 31,228 1,686 5.1
16,768 16,141
627 3.7
Note: City estimates were prepared in cooperation with the U.S. Department of Labor, Bureau of Labor Statistics. All cities listed have total population of 25,000 or more and an asterisks (*) designates cities with population of 50,000 or more.
Source: Georgia Department of Labor, Workforce Statistics & Economic Research
21
UNEMGPeoLrOgiaYUMneEmNploTymReAntTREateBs Yby CCoOunUtyNTIES AUGUST 2018 August 2018
Dade 3.3
Catoosa 3.3
Walker
Whitfield
Murray 4.6
Fannin 3.6
Union 3.5
Towns 5.2
Rabun 3.6
3.6
4.0
Chattooga 3.7
Gordon 3.6
Floyd 4.2
Bartow 3.6
Gilmer 4.1
Pickens 3.3
Cherokee 3.0
Lumpkin 3.4
Dawson 3.2
Forsyth 3.0
White Habersham
2.8
3.5
Stephens
4.2
Banks Franklin
Hall
2.9
3.4
3.0
Jackson 2.8
Madison 3.3
Hart 3.4
Elbert 4.2
6.0% or greater 7 counties (4%)
5.0% to 5.9% 28 counties (18%)
4.0% to 4.9% 52 counties (33%)
Polk 4.0
Paulding
Cobb 3.2
Gwinnett 3.3
Barrow 3.1
Clarke 3.7
Oglethorpe 3.4
Less than 4.0% 72 counties (45%)
Haralson 3.6
Carroll 3.8
Heard 3.6
3.3 Douglas 3.9
Coweta 3.2
Fulton 3.8
DeKalb 3.9 Rockdale
Walton 3.4
Oconee 2.9
Clayton
4.2 Newton
4.7
Fayette 3.3
Henry 4.0
4.2
Morgan 3.3
Spalding 4.5
Butts 4.0
Jasper 3.3
Putnam 4.5
Wilkes 4.3
Lincoln 4.7
Percentages of number of counties may not total 100 due to rounding
Greene 4.0
Taliaferro
4.9
McDuffie
Warren 6.2
Columbia 3.5
5.5
Richmond
Hancock
5.1
6.0
Glascock
3.9
Troup 3.5
Meriwether 5.1
Pike 3.3
Lamar 4.5 Monroe 3.5
Jones 3.5
Baldwin 4.9
Washington
Jefferson 5.4
Burke 5.5
Upson
4.6
Harris 3.4
Talbot 4.9
Muscogee 4.8
Marion Chattahoochee 5.2
4.3
Taylor 5.4
Crawford 3.7
Bibb 4.3
Twiggs 5.5
Wilkinson 4.2
Peach
4.6
Houston
Macon
3.8
5.2
Bleckley 5.6
Laurens 4.8
Johnson 3.7
Emanuel 5.9
Jenkins 5.0
Screven 5.1
Treutlen 5.6
Candler 3.5
Bulloch 4.1
Effingham 3.2
5.8
Stewart 4.5
Schley 4.5
Webster 5.6
Sumter 5.6
Quitman
5.2 Randolph Terrell
Lee
6.5
7.2
3.5
Clay 7.1
Calhoun 4.0
Dougherty 5.0
Early 4.4
Miller 3.3
Baker 5.1
Mitchell 5.5
Dooly 3.9
Pulaski 3.8
Dodge 4.9
Crisp 4.4
Wilcox 4.8
Turner 5.1
Ben Hill 5.9
Montgomery
Wheeler 6.4
5.6
Toombs 5.6
Evans 3.5
Tattnall
Telfair
4.0
6.3
Jeff Davis 4.7
Appling 4.4
Long 3.9
Bryan 3.4
Liberty 4.1
Worth 4.3
Colquitt 3.5
Irwin 5.5 Tift 4.0
Coffee 4.0
Berrien
Atkinson
4.1
3.0
Cook
3.6 Lanier
Bacon 3.9
Wayne 4.5
Pierce 3.6
Ware 3.8
Brantley 4.4
McIntosh 3.7
Glynn 3.5
Chatham 3.7
Seminole 5.4
Decatur 4.5
Grady 3.7
Thomas 4.4
Brooks 3.5
4.2
Lowndes 4.0
Clinch 4.5
Charlton 3.9
Camden 4.2
Echols
3.2
Georgia's Unemployment Rate: 3.8%
Georgia's U(nNoet SmeasponlaollyyAmdjusetend)t Rate: 3.8% (not seasonally adjusted) Source: Georgia Department of Labor, Workforce Statistics and Economic Research
22
Georgia Unemployment Insurance Claims by County
County
August 2018 Average Average Initial Weekly Duration
Claims Benefit Weeks
County
August 2018 Average Average Initial Weekly Duration
Claims Benefit Weeks
County
August 2018 Average Average Initial Weekly Duration
Claims Benefit Weeks
Georgia
21,182........ $285.........8.2
Appling
86........ $261.........6.7
Atkinson
26........ $227.........5.8
Bacon
17........ $182.......10.4
Baker
6........ $187.......12.3
Baldwin
76........ $210.........8.7
Banks
19........ $213.........7.4
Barrow
93........ $260.........8.3
Bartow
236........ $261.........6.7
Ben Hill
42........ $223.........5.7
Berrien
27........ $236.........7.3
Bibb
321........ $221.......10.2
Bleckley
23........ $201.........8.3
Brantley
29........ $255.........6.3
Brooks
20........ $239.......10.5
Bryan
50........ $248.........8.1
Bulloch
121........ $236.........6.5
Burke
104........ $249.........8.4
Butts
35........ $238.........9.2
Calhoun
10........ $269.........7.7
Camden
45........ $223.........6.7
Candler
25........ $247.........7.2
Carroll
154........ $257.........7.5
Catoosa
90........ $286.........5.1
Charlton
11........ $237.......12.8
Chatham
488........ $242.........8.5
Chattahoochee
5........ $258.........8.3
Chattooga
36........ $254.........2.7
Cherokee
255........ $280.........9.4
Clarke
184........ $242.........8.7
Clay
6........ $238.........6.4
Clayton
849........ $244.......10.0
Clinch
11........ $206.......10.0
Cobb
1,122........ $270.......10.3
Coffee
99........ $241.........6.5
Colquitt
79........ $212.........8.4
Columbia
285........ $257.........9.1
Cook
40........ $195.........7.4
Coweta
181........ $259.........7.6
Crawford
16........ $240.........7.9
Crisp
64........ $216.........8.7
Dade
41........ $257.........5.6
Dawson
27........ $267.........9.2
Decatur
56........$221....... 11.0
DeKalb
1,607........ $252.......10.7
Dodge
47........ $194.........8.6
Dooly
17........ $216.........7.8
Dougherty
247........ $215.........9.4
Douglas
302........ $265.......10.1
Early
19........ $227.......12.8
Echols
6........ $261.........9.3
Effingham
74........ $263.........8.4
Elbert Emanuel Evans Fannin Fayette Floyd Forsyth Franklin Fulton Gilmer Glascock Glynn Gordon Grady Greene Gwinnett Habersham Hall Hancock Haralson Harris Hart Heard Henry Houston Irwin Jackson Jasper Jeff Davis Jefferson Jenkins Johnson Jones Lamar Lanier Laurens Lee Liberty Lincoln Long Lowndes Lumpkin Macon Madison Marion McDuffie McIntosh Meriwether Miller Mitchell Monroe Montgomery Morgan Murray
34........ $235.........5.0 85........ $220.........6.9 14........ $248.........7.9 108........ $260.........6.8 138........ $266.........9.5 246........ $249.........6.2 220........ $276.......10.1 32........ $254.........5.2 2,180........ $256.......10.6 466........ $273.........3.2
3........ $260.........7.4 133........ $218.........4.7 150........ $265.........5.5
25........ $197.........7.9 37........ $236.........9.0 1,361........ $264.......10.3 74........ $249.........5.6 266........ $264.........7.9 21........ $190.........7.9 25........ $248.........8.0 50........ $242.........6.6 77........ $249.........4.3 10........ $214.........5.1 486........ $258.......10.0 228........ $225.........8.6 18........ $234.........7.2 90........ $251.........8.4 21........ $213.........9.5 36........ $250.........6.2 48........ $223.........8.7 19........ $217.........5.5 14........ $246.........8.2 27........ $246.........9.1 38........ $234.........6.5
9........ $217.........8.7 143........ $222.........8.8
47........ $237.........7.0 94........ $211.........9.4 21........ $251.........9.1 28........ $229.........9.8 184........ $223.........9.2 47........ $257.........6.8 31........ $203.........7.8 34........ $257.........7.6 21........ $180.........9.2 127........ $231.........7.4 16........ $251.........6.6 104........ $203.........5.4
8........ $165.......10.4 39........ $197.........9.7 29........ $218.........9.2 41........ $219.........5.8 34........ $261.........9.1 170........ $254.........5.0
Muscogee Newton Oconee Oglethorpe Paulding Peach Pickens Pierce Pike Polk Pulaski Putnam Quitman Rabun Randolph Richmond Rockdale Schley Screven Seminole Spalding Stephens Stewart Sumter Talbot Taliaferro Tattnall Taylor Telfair Terrell Thomas Tift Toombs Towns Treutlen Troup Turner Twiggs Union Upson Walker Walton Ware Warren Washington Wayne Webster Wheeler White Whitfield Wilcox Wilkes Wilkinson Worth
441........ $218.........8.8 233........ $244.......10.2
31........ $261.........8.7 17........ $253.........8.2 228........ $268.........9.3 52........ $201.........7.1 69........ $258.........7.3 36........ $257.........9.8 19........ $265.........6.8 92........ $250.........6.0 12........ $233.........7.6 38........ $249.........9.4
2........ $319.........8.9 4........ $305.........6.8 14........ $262.........7.5 769........ $235.........8.6 235........ $243.......10.2 6........ $215.......10.2 34........ $217.........4.4 12........ $245.......10.5 231........ $230.........7.4 45........ $226.........5.9 21........ $213.........8.3 95........ $194.........9.1 12........ $250.........7.5 2........ $239.........9.0 36........ $240.........8.3 15........ $197.........6.6 67........ $185.........7.7 30........ $261.........9.3 58........ $217.........9.8 105........ $225.........7.9 77........ $224.........6.2 11........ $168.........8.6 22........ $240.........8.1 181........ $233.........5.6 18........ $179.........7.2 15........ $232.........9.4 31........ $252.........8.0 70........ $198.........5.9 125........ $276.........3.3 109........ $255.........9.4 78........ $218.........9.1 42........ $226.........7.8 25........ $222.........9.7 51........ $230.........8.9 8........ $203.........9.0 24........ $230.........6.6 34........ $243.........7.3 363........ $256.........4.0 17........ $175.........9.1 26........ $141.........6.5 10........ $211.........9.7 90........ $246.........7.7
Note: Initial claims include intrastate initial and additional claims, as well as agent state initial and additional claims for regular UI only. Average duration of benefits is represented in weeks.
Data does not include state or federal extended benefits.
Source: Georgia Department of Labor, Workforce Statistics and Economic Research
23
Mark Butler, Commissioner 148 Andrew Young International Boulevard, N.E. Atlanta, Georgia 30303-1751
Return Service Requested