- Collection:
- Georgia Government Publications
- Title:
- Dimensions: measuring Georgia's workforce [Vol. 43, no. 3 (Mar. 2017)]
- Creator:
- Georgia. Department of Labor. Workforce Statistics and Economic Research Division
- Contributor to Resource:
- Georgia. Department of Labor. Workforce Statistics and Economic Research Division
- Publisher:
- Atlanta, Ga. : Georgia. Department of Labor. Workforce Statistics and Economic Research Division
- Date of Original:
- 2017-03
- Subject:
- Georgia
- Location:
- United States, Georgia, 32.75042, -83.50018
- Medium:
- publications (documents)
- Type:
- Text
- Format:
- application/pdf
- External Identifiers:
- Call Number GA L200.E46 P1 T7 43/3
- Metadata URL:
- https://dlg.galileo.usg.edu/id:dlg_ggpd_i-ga-bl200-pe46-bp1-bt7-b43-s3-belec-p-btext
- Digital Object URL:
- https://dlg.galileo.usg.edu/do:dlg_ggpd_i-ga-bl200-pe46-bp1-bt7-b43-s3-belec-p-btext
- Language:
- eng
- Holding Institution:
- University of Georgia. Map and Government Information Library
- Rights:
-

Jackson Madison Elbert
Polk
Cobb
Gwinnett Barrow Clarke
D I M E N S I O Paulding
Haralson Douglas
DeKalb Rock-
Walton
Oconee Oglethorpe
Wilkes
Lincoln
EdgefieSlCd,
Carroll
Fulton Clayton
dale Newton
Morgan Greene Taliaferro
Columbia
Fayette Henry
McDuffie Warren
Heard
Coweta
Spalding Butts Jasper Putnam Hancock
Glascock
Richmond
AikenSC,
N
S
Russell, AL
Measuring Georgia's Workforce Troup Meriwether Pike Lamar Monroe Upson
Jones
Baldwin
Jefferson Washington
Burke
Harris
Talbot
March 2017 Data
Muscogee
Bibb Crawford
Taylor
Peach
Wilkinson Twiggs
Johnson
Jenkins Emanuel
Screven
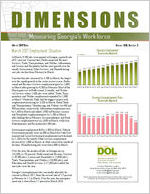
Volume XLIII, Number 3
March 2017 Employment Situation Marion Chattahoo-
Houston Bleckley Macon
Laurens
Treutlen
chee
In millions
CandlGereorgBuialloEcmh ploEyfmfinegnhatm
(Seasonally Adjusted)
In March, 9,500 joScbhslewy ere gainedDoinolyGeoPrugliaask,ia grDoowdtghe rate of 0St.e2wparetrceWnte.bCsteornstrSuucmtitoenr , Professional and Business
Montgomery
Wheeler
Toombs
Evans
Bryan
QuSamitnemodrnavRLntihacene.idssGo,uloTprevhraeadrnnedTm,erTHreernolaltsn,psOiptatohLlreiettearytSihoeanrdv, iatchnCeedrsism,UpTuaortnnisldetirtgMiWersoial,cwnoIuxnthffaBoocervtnmueHrariiltnltihogTenel,fair
Jeff Davis
4.34
Tattnall 4.3A5 pp4l.i3n6g 4.37 4.38
4.41 4.42 4.39 Liberty Long
Chatham 4.43 4.44 4.44
4.46
4.47
saw jobs decline from February to March.
Clay
Calhoun
Dougherty Worth
Irwin
Coffee
Construction jobs increased by 4,700 in MTifatrch, the largest
Bacon
Wayne
McIntosh
ovEearrlythe monthBagkreorwth in the sector in over a yeaBer.rrPiernofesA-tkinson
sinioMnaalrMacnhilldearBfteursignreosws iSnMegitrcvbhiyeclle9s,3e0m0pCiolnolqyFumeitbternutaCgroyro.ekwMobsyt
2,600 oLfatnhieer
Mar-16
Ware Apr-16
Pierce
Brantley May-16 Jun-16 Jul-16 Aug-16
Glynn Sep-16 Oct-16
Nov-16
Dec-16
Jan-17
Feb-17
Mar-17
MaSrecmhingoalein was in Professional, Scientific, and Techni-
Clinch
cal ServicDesecwathurere 2G,4ra0d0y jobTshwomearse adBdroeodk.sTradLeo,wTnrdaenssportation, and Utilities employment expanded by 1,800Echols in March. Wholesale Trade had the biggest impact with
employment increasing by 3,100 in March. Retail Trade
Charlton
Camden
Georgia Unemployment Rate
(Seasonally Adjusted)
and Transportation, Warehousing, and Utilities cut 400 and
900 positions, respectively. Information employment rose
by 1,400 in March and added 2,900 in February. Leisure and Hospitality employment grew by 1,200 in March after holding flat in February. Accommodations and Food
5.5%
5.5% 5.5% 5.5%
5.4%
5.4% 5.4%
5.3% 5.3% 5.3% 5.3%
5.3%
Services employment was up 1,600 in March, while Arts,
5.1%
Entertainment, and Recreation lost 400 jobs.
Government employment fell by 1,800 in March. Federal Government payrolls were up 600 in March but State Government and Local Government employment each declined by 1,200 over the month. Other Services employment decreased by 1,000 in March, its third consecutive month of declines. Manufacturing jobs were down 800 in March.
Mar-16 Apr-16 May-16 Jun-16 Jul-16 Aug-16 Sep-16 Oct-16 Nov-16 Dec-16 Jan-17 Feb-17 Mar-17
Over the year, the number of jobs in Georgia are up 131,000, or 3.0 percent. Professional and Business Services (+29,300 jobs); Leisure and Hospitality (+25,800 jobs); Trade, Transportation, and Utilities (+18,900 jobs); and Education and Health Services (+17,300 jobs) added the most jobs over the year.
Georgia's unemployment rate (seasonally adjusted) decreased in March 2017, from the revised rate of 5.3 percent in February to 5.1 in March. Over the year, the unemployment rate is down from 5.5 percent in March 2016.
Workforce Statistics & Economic Research Mark Butler, Commissioner
For more information, contact Corey Smith or Evan Cross at (404) 232-3875
corey.smith@gdol.ga.gov evan.cross@gdol.ga.gov
Equal Opportunity Employer/ProgramAuxiliary Aids and Services Available upon Request to Individuals with Disabilities
GEORGIA Nonfarm Employment
(In thousands)
(Seasonally Adjusted)
Preliminary
Revised Revised
MAR 2017 FEB 2017 MAR 2016
Change in Jobs from FEB 2017
Net %
Change in Jobs from MAR 2016
Net %
Total Nonfarm
4,466.1
4,456.6
4,335.1
9.5 0.2
131.0 3.0
Total Private
3,774.4
3,763.1
3,658.3
11.3 0.3
116.1 3.2
Goods Producing
582.5
578.7
569.0
3.8 0.7
13.5 2.4
Service-Providing
3,883.6
3,877.9
3,766.1
5.7 0.1
117.5 3.1
Private Service-Providing
3,191.9
3,184.4
3,089.3
7.5 0.2
102.6 3.3
Mining and Logging
10.1
10.2
9.4
-0.1 -1.0
0.7 7.4
Mining, Logging and Construction
194.5
189.9
182.6
4.6 2.4
11.9 6.5
Construction
184.4
179.7
173.2
4.7 2.6
11.2 6.5
Manufacturing
388.0
388.8
386.4
-0.8 -0.2
1.6 0.4
Durable Goods
186.5
188.3
186.9
-1.8 -1.0
-0.4 -0.2
Non-Durable Goods
201.5
200.5
199.5
1.0 0.5
2.0 1.0
Trade, Transportation, and Utilities
941.6
939.8
922.7
1.8 0.2
18.9 2.0
Wholesale Trade
226.3
223.2
219.0
3.1 1.4
7.3 3.3
Retail Trade
499.4
499.8
491.3
-0.4 -0.1
8.1 1.6
Transportation, Warehousing, and Utilities
215.9
216.8
212.4
-0.9 -0.4
3.5 1.6
Information
113.7
112.3
110.8
1.4 1.2
2.9 2.6
Financial Activities
246.3
245.4
236.6
0.9 0.4
9.7 4.1
Finance and Insurance
182.1
182.0
173.1
0.1 0.1
9.0 5.2
Real Estate and Rental and Leasing
64.2
63.4
63.5
0.8 1.3
0.7 1.1
Professional and Business Services
674.3
671.7
645.0
2.6 0.4
29.3 4.5
Professional, Scientific, and Technical Services
271.4
269.0
259.7
2.4 0.9
11.7 4.5
Management of Companies and Enterprises
67.5
67.4
67.4
0.1 0.1
0.1 0.1
Admin and Support, Waste Mngmnt and Remediation
335.4
335.3
317.9
0.1 0.0
17.5 5.5
Education and Health Services
573.7
573.1
556.4
0.6 0.1
17.3 3.1
Educational Services
76.8
75.9
71.4
0.9 1.2
5.4 7.6
Health Care and Social Assistance
496.9
497.2
485.0
-0.3 -0.1
11.9 2.5
Leisure and Hospitality
486.6
485.4
460.8
1.2 0.2
25.8 5.6
Arts, Entertainment, and Recreation
48.4
48.8
48.8
-0.4 -0.8
-0.4 -0.8
Accommodation and Food Services
438.2
436.6
412.0
1.6 0.4
26.2 6.4
Other Services
155.7
156.7
157.0
-1.0 -0.6
-1.3 -0.8
Government
691.7
693.5
676.8
-1.8 -0.3
14.9 2.2
Federal Government
101.4
100.8
99.7
0.6 0.6
1.7 1.7
State Government
176.0
177.2
165.3
-1.2 -0.7
10.7 6.5
Local Government
414.3
415.5
411.8
-1.2 -0.3
2.5 0.6
Note: These seasonally adjusted estimates were prepared in cooperation with the U.S. Department of Labor, Bureau of Labor Statistics, based upon monthly reports submitted by selected
employers throughout Georgia. The estimates include all full- and part-time wage and salary workers who were employed during or received pay for any part of the pay period that includes the twelfth of the month. Proprietors, domestic workers, self-employed persons, unpaid family workers and personnel of the armed forces are excluded. Estimates based on 2016 benchmark.
Source: Georgia Department of Labor, Workforce Statistics & Economic Research
Georgia Department of Labor, Mark Butler, Commissioner Equal Opportunity Employer/Program Auxiliary Aids and Services Available Upon Request to Individuals With Disabilities
2
GEORGIA Nonfarm Employment
(In thousands)
(Not Seasonally Adjusted)
Preliminary
Revised
Revised
MAR 2017 FEB 2017 MAR 2016
Change in Jobs from FEB 2017
Net %
Change in Jobs from MAR 2016
Net %
Total Nonfarm
4,449.7
4,423.2
4,314.7
26.5 0.6
135.0 3.1
Total Private
3,750.7
3,724.7
3,633.1
26.0 0.7
117.6 3.2
Goods Producing
580.7
574.9
566.9
5.8 1.0
13.8 2.4
Service-Providing
3,869.0
3,848.3
3,747.8
20.7 0.5
121.2 3.2
Private Service-Providing
3,170.0
3,149.8
3,066.2
20.2 0.6
103.8 3.4
Mining and Logging
10.0
10.1
9.4
-0.1 -1.0
0.6 6.4
Mining, Logging and Construction
191.7
185.8
180.5
5.9 3.2
11.2 6.2
Construction
181.7
175.7
171.1
6.0 3.4
10.6 6.2
Construction of Buildings
41.8
40.7
37.6
1.1 2.7
4.2 11.2
Heavy and Civil Engineering Construction
27.3
27.1
24.3
0.2 0.7
3.0 12.4
Specialty Trade Contractors
112.6
107.9
109.2
4.7 4.4
3.4 3.1
Manufacturing
389.0
389.1
386.4
-0.1 0.0
2.6 0.7
Durable Goods
187.3
188.5
187.2
-1.2 -0.6
0.1 0.1
Transportation Equipment Manufacturing
51.8
51.6
51.1
0.2 0.4
0.7 1.4
Non-Durable Goods
201.7
200.6
199.2
1.1 0.6
2.5 1.3
Food Manufacturing
67.1
67.0
65.7
0.1 0.2
1.4 2.1
Textile Mills
19.7
19.7
19.4
0.0 0.0
0.3 1.6
Textile Product Mills
28.0
27.7
28.7
0.3 1.1
-0.7 -2.4
Trade, Transportation, and Utilities
935.3
931.1
914.1
4.2 0.5
21.2 2.3
Wholesale Trade
225.8
223.0
217.9
2.8 1.3
7.9 3.6
Merchant Wholesalers, Durable Goods
110.8
109.2
106.6
1.6 1.5
4.2 3.9
Merchant Wholesalers, Nondurable Goods
61.5
61.3
60.9
0.2 0.3
0.6 1.0
Wholesale Electronic Markets and Agents and Brokers 53.5
52.5
50.4
1.0 1.9
3.1 6.2
Retail Trade
494.7
493.5
485.3
1.2 0.2
9.4 1.9
Food and Beverage Stores
90.8
91.6
91.5
-0.8 -0.9
-0.7 -0.8
General Merchandise Stores
107.9
108.5
105.6
-0.6 -0.6
2.3 2.2
Miscellaneous Store Retailers
21.5
21.6
20.9
-0.1 -0.5
0.6 2.9
Transportation, Warehousing, and Utilities
214.8
214.6
210.9
0.2 0.1
3.9 1.9
Utilities
19.9
19.9
20.4
0.0 0.0
-0.5 -2.5
Transportation and Warehousing
194.9
194.7
190.5
0.2 0.1
4.4 2.3
Air Transportation
39.2
38.6
40.3
0.6 1.6
-1.1 -2.7
Truck Transportation
50.9
51.5
49.9
-0.6 -1.2
1.0 2.0
Couriers and Messengers
22.7
22.7
21.8
0.0 0.0
0.9 4.1
Warehousing and Storage
40.7
40.8
38.1
-0.1 -0.3
2.6 6.8
Information
113.4
112.4
109.4
1.0 0.9
4.0 3.7
Telecommunications
45.6
45.6
45.2
0.0 0.0
0.4 0.9
Wired Telecommunications Carriers
31.6
31.7
31.7
-0.1 -0.3
-0.1 -0.3
Wireless Telecommunications Carriers
7.1
7.2
7.2
-0.1 -1.4
-0.1 -1.4
Internet Service Providers, Search Portals, and DP
9.6
9.6
9.3
0.0 0.0
0.3 3.2
Financial Activities
244.8
244.3
235.5
0.5 0.2
9.3 4.0
Finance and Insurance
181.8
181.8
172.6
0.0 0.0
9.2 5.3
Insurance Carriers and Related Activities
86.4
86.7
80.4
-0.3 -0.4
6.0 7.5
Real Estate and Rental and Leasing
63.0
62.5
62.9
0.5 0.8
0.1 0.2
Professional and Business Services
667.7
661.7
641.3
6.0 0.9
26.4 4.1
Professional, Scientific, and Technical Services
271.4
270.3
259.7
1.1 0.4
11.7 4.5
Accounting, Tax Prep, and Bookkeeping Services
38.3
39.2
36.9
-0.9 -2.3
1.4 3.8
Architectural, Engineering, and Related Services
42.6
42.4
41.8
0.2 0.5
0.8 1.9
Computer Systems Design and Related Services
68.3
68.3
65.5
0.0 0.0
2.8 4.3
Management and Technical Consulting Services
42.8
42.5
41.3
0.3 0.7
1.5 3.6
Management of Companies and Enterprises
67.0
67.0
67.2
0.0 0.0
-0.2 -0.3
Admin and Support, Waste Mngmnt and Remediation
329.3
324.4
314.4
4.9 1.5
14.9 4.7
Employment Services
168.2
166.1
154.3
2.1 1.3
13.9 9.0
Education and Health Services
574.3
574.2
556.6
0.1 0.0
17.7 3.2
Educational Services
78.8
77.4
72.4
1.4 1.8
6.4 8.8
Colleges, Universities, and Professional Schools
36.8
35.9
32.4
0.9 2.5
4.4 13.6
Health Care and Social Assistance
495.5
496.8
484.2
-1.3 -0.3
11.3 2.3
Ambulatory Health Care Services
194.3
196.0
187.4
-1.7 -0.9
6.9 3.7
Hospitals
172.4
171.8
169.9
0.6 0.4
2.5 1.5
Nursing and Residential Care Facilities
60.7
61.0
59.7
-0.3 -0.5
1.0 1.7
Social Assistance
68.1
68.0
67.2
0.1 0.2
0.9 1.3
Leisure and Hospitality
479.3
470.0
453.7
9.3 2.0
25.6 5.6
Arts, Entertainment, and Recreation
45.4
43.6
45.3
1.8 4.1
0.1 0.2
Amusement, Gambling, and Recreation Industries
34.3
33.1
34.0
1.2 3.6
0.3 0.9
Accommodation and Food Services
433.9
426.4
408.4
7.5 1.8
25.5 6.2
Accommodation
43.5
42.9
43.6
0.6 1.4
-0.1 -0.2
Food Services and Drinking Places
390.4
383.5
364.8
6.9 1.8
25.6 7.0
Other Services
155.2
156.1
155.6
-0.9 -0.6
-0.4 -0.3
Repair and Maintenance
37.6
37.4
38.3
0.2 0.5
-0.7 -1.8
Personal and Laundry Services
35.4
36.7
36.7
-1.3 -3.5
-1.3 -3.5
Religious, Grantmaking, Civic, Professional, and Similar
82.2
82.0
80.6
0.2 0.2
1.6 2.0
Government
699.0
698.5
681.6
0.5 0.1
17.4 2.6
Federal Government
101.3
101.2
99.7
0.1 0.1
1.6 1.6
Department of Defense
41.6
41.6
40.8
0.0 0.0
0.8 2.0
State Government
179.7
179.7
167.6
0.0 0.0
12.1 7.2
State Government Educational Services
107.4
107.5
96.2
-0.1 -0.1
11.2 11.6
Local Government
418.0
417.6
414.3
0.4 0.1
3.7 0.9
Local Government Educational Services
249.0
248.6
245.9
0.4 0.2
3.1 1.3
Note: These not seasonally adjusted estimates were prepared in cooperation with the U.S. Department of Labor, Bureau of Labor Statistics, based upon monthly reports submitted by selected
employers throughout Georgia. The estimates include all full- and part-time wage and salary workers who were employed during or received pay for any part of the pay period that includes the twelfth
of the month. Proprietors, domestic workers, self-employed persons, unpaid family workers and personnel of the armed forces are excluded. Estimates based on 2016 benchmark.
Source: Georgia Department of Labor, Workforce Statistics & Economic Research
3
ALBANY MSA Nonfarm Employment
(In thousands)
(Not Seasonally Adjusted)
Preliminary
Revised
Revised
MAR 2017 FEB 2017 MAR 2016
Change in Jobs from FEB 2017
Net %
Change in Jobs from MAR 2016
Net %
Total Nonfarm Total Private Goods Producing Service-Providing Private Service-Providing Manufacturing Trade, Transportation, and Utilities
Retail Trade Government
Federal Government State Government Local Government
62.5
62.8
60.8
-0.3 -0.5
49.6
50.0
48.2
-0.4 -0.8
6.9
7.0
6.9
-0.1 -1.4
55.6
55.8
53.9
-0.2 -0.4
42.7
43.0
41.3
-0.3 -0.7
4.2
4.2
4.2
0.0 0.0
11.4
11.5
11.9
-0.1 -0.9
7.5
7.5
7.3
0.0 0.0
12.9
12.8
12.6
0.1 0.8
2.7
2.7
2.7
0.0 0.0
2.8
2.8
2.5
0.0 0.0
7.4
7.3
7.4
0.1 1.4
1.7 2.8 1.4 2.9 0.0 0.0 1.7 3.2 1.4 3.4 0.0 0.0 -0.5 -4.2 0.2 2.7 0.3 2.4 0.0 0.0 0.3 12.0 0.0 0.0
Note: These not seasonally adjusted estimates were prepared in cooperation with the U.S. Department of Labor, Bureau of Labor Statistics, based upon monthly reports submitted by
selected employers in the Albany Metropolitan Statistical Area, which includes Baker, Dougherty, Lee, Terrell and Worth counties. The estimates include all full- and part-time wage and salary workers who were employed during or received pay for any part of the pay period that includes the twelfth of the month. Proprietors, domestic workers, self-employed persons, unpaid familyworkers and personnel of the armed forces are excluded. Estimates based on 2016 benchmark.
ATHENS-CLARKE COUNTY MSA Nonfarm Employment
(In thousands)
(Not Seasonally Adjusted)
Preliminary
Revised
Revised
MAR 2017 FEB 2017 MAR 2016
Change in Jobs from FEB 2017
Net %
Change in Jobs from MAR 2016
Net %
Total Nonfarm Total Private Goods Producing Service-Providing Private Service-Providing Trade, Transportation, and Utilities
Retail Trade Professional and Business Services Leisure and Hospitality Government
Federal Government State Government Local Government
95.5
95.0
92.9
0.5 0.5
65.2
64.5
64.1
0.7 1.1
9.7
9.6
9.5
0.1 1.0
85.8
85.4
83.4
0.4 0.5
55.5
54.9
54.6
0.6 1.1
16.0
15.9
15.5
0.1 0.6
10.6
10.6
9.9
0.0 0.0
8.0
7.9
7.7
0.1 1.3
10.8
10.6
10.5
0.2 1.9
30.3
30.5
28.8
-0.2 -0.7
0.9
1.0
1.1
-0.1 -10.0
21.4
21.5
19.7
-0.1 -0.5
8.0
8.0
8.0
0.0 0.0
2.6 2.8 1.1 1.7 0.2 2.1 2.4 2.9 0.9 1.7 0.5 3.2 0.7 7.1 0.3 3.9 0.3 2.9 1.5 5.2 -0.2 -18.2 1.7 8.6 0.0 0.0
Note: These not seasonally adjusted estimates were prepared in cooperation with the U.S. Department of Labor, Bureau of Labor Statistics, based upon monthly reports submitted by selected
employers in the Athens-Clarke County Metropolitan Statistical Area, which includes Clarke, Madison, Oconee and Oglethorpe counties. The estimates include all full- and part-time wage and salary workers who were employed during or received pay for any part of the pay period that includes the twelfth of the month. Proprietors, domestic workers, self-employed persons, unpaid family workers and personnel of the armed forces are excluded. Estimates based on 2016 benchmark.
Source: Georgia Department of Labor, Workforce Statistics & Economic Research
4
ATLANTA MSA Nonfarm Employment
(In thousands)
(Not Seasonally Adjusted)
Preliminary
Revised
MAR 2017 FEB 2017
Revised MAR 2016
Change in Jobs from FEB 2017
Net %
Change in Jobs from MAR 2016
Net %
Total Nonfarm
2,726.0
2,716.2
2,622.9
9.8 0.4
103.1 3.9
Total Private
2,390.8
2,381.8
2,295.4
9.0 0.4
95.4 4.2
Goods Producing
285.8
283.9
275.1
1.9 0.7
10.7 3.9
Service-Providing
2,440.2
2,432.3
2,347.8
7.9 0.3
92.4 3.9
Private Service-Providing
2,105.0
2,097.9
2,020.3
7.1 0.3
84.7 4.2
Mining and Logging
1.8
1.8
1.7
0.0 0.0
0.1 5.9
Mining, Logging and Construction
123.0
120.3
113.5
2.7 2.2
9.5 8.4
Construction
121.2
118.5
111.8
2.7 2.3
9.4 8.4
Construction of Buildings
27.9
27.0
24.3
0.9 3.3
3.6 14.8
Specialty Trade Contractors
77.3
75.7
72.2
1.6 2.1
5.1 7.1
Manufacturing
162.8
163.6
161.6
-0.8 -0.5
1.2 0.7
Durable Goods
82.0
82.9
82.2
-0.9 -1.1
-0.2 -0.2
Transportation Equipment Manufacturing
14.7
14.8
15.4
-0.1 -0.7
-0.7 -4.6
Non-Durable Goods
80.8
80.7
79.4
0.1 0.1
1.4 1.8
Food Manufacturing
26.5
26.5
25.6
0.0 0.0
0.9 3.5
Trade, Transportation, and Utilities
596.2
595.4
583.0
0.8 0.1
13.2 2.3
Wholesale Trade
164.5
163.6
157.5
0.9 0.6
7.0 4.4
Merchant Wholesalers, Durable Goods
81.8
81.4
78.1
0.4 0.5
3.7 4.7
Merchant Wholesalers, Nondurable Goods
40.1
40.2
39.1
-0.1 -0.3
1.0 2.6
Wholesale Electronic Markets and Agents and Brokers
42.6
42.0
40.3
0.6 1.4
2.3 5.7
Retail Trade
285.7
285.5
282.1
0.2 0.1
3.6 1.3
Food and Beverage Stores
56.4
56.7
56.0
-0.3 -0.5
0.4 0.7
General Merchandise Stores
58.8
59.4
56.7
-0.6 -1.0
2.1 3.7
Miscellaneous Store Retailers
14.3
14.4
13.8
-0.1 -0.7
0.5 3.6
Transportation, Warehousing, and Utilities
146.0
146.3
143.4
-0.3 -0.2
2.6 1.8
Utilities
10.1
10.1
10.6
0.0 0.0
-0.5 -4.7
Transportation and Warehousing
135.9
136.2
132.8
-0.3 -0.2
3.1 2.3
Air Transportation
38.6
38.1
40.0
0.5 1.3
-1.4 -3.5
Truck Transportation
31.2
31.7
30.6
-0.5 -1.6
0.6 2.0
Couriers and Messengers
18.0
17.9
17.3
0.1 0.6
0.7 4.1
Information
99.7
98.6
93.1
1.1 1.1
6.6 7.1
Telecommunications
38.9
39.0
38.9
-0.1 -0.3
0.0 0.0
Wired Telecommunications Carriers
27.8
27.9
27.3
-0.1 -0.4
0.5 1.8
Wireless Telecommunications Carriers
6.5
6.6
6.5
-0.1 -1.5
0.0 0.0
Internet Service Providers, Search Portals, and DP
9.3
9.2
8.8
0.1 1.1
0.5 5.7
Financial Activities
171.8
171.4
163.5
0.4 0.2
8.3 5.1
Finance and Insurance
124.7
125.5
117.6
-0.8 -0.6
7.1 6.0
Insurance Carriers and Related Activities
61.7
61.9
56.1
-0.2 -0.3
5.6 10.0
Real Estate and Rental and Leasing
47.1
45.9
45.9
1.2 2.6
1.2 2.6
Professional and Business Services
508.0
506.2
481.2
1.8 0.4
26.8 5.6
Professional, Scientific, and Technical Services
214.0
214.9
207.5
-0.9 -0.4
6.5 3.1
Accounting, Tax Prep, and Bookkeeping Services
28.2
28.9
26.3
-0.7 -2.4
1.9 7.2
Architectural, Engineering, and Related Services
29.8
29.8
29.5
0.0 0.0
0.3 1.0
Computer Systems Design and Related Services
57.8
57.9
56.9
-0.1 -0.2
0.9 1.6
Management and Technical Consulting Services
38.2
37.9
37.0
0.3 0.8
1.2 3.2
Management of Companies and Enterprises
55.3
55.2
54.8
0.1 0.2
0.5 0.9
Admin and Support, Waste Mngmnt and Remediation
238.7
236.1
218.9
2.6 1.1
19.8 9.1
Employment Services
121.8
120.8
108.5
1.0 0.8
13.3 12.3
Education and Health Services
342.1
342.6
330.2
-0.5 -0.2
11.9 3.6
Educational Services
56.0
55.0
51.8
1.0 1.8
4.2 8.1
Health Care and Social Assistance
286.1
287.6
278.4
-1.5 -0.5
7.7 2.8
Ambulatory Health Care Services
114.6
116.0
110.5
-1.4 -1.2
4.1 3.7
Hospitals
98.9
98.8
96.0
0.1 0.1
2.9 3.0
Social Assistance
43.5
43.3
43.1
0.2 0.5
0.4 0.9
Leisure and Hospitality
290.8
286.9
273.2
3.9 1.4
17.6 6.4
Arts, Entertainment, and Recreation
31.4
30.1
31.2
1.3 4.3
0.2 0.6
Accommodation and Food Services
259.4
256.8
242.0
2.6 1.0
17.4 7.2
Accommodation
24.2
24.0
24.2
0.2 0.8
0.0 0.0
Food Services and Drinking Places
235.2
232.8
217.8
2.4 1.0
17.4 8.0
Other Services
96.4
96.8
96.1
-0.4 -0.4
0.3 0.3
Repair and Maintenance
23.2
22.9
22.6
0.3 1.3
0.6 2.7
Personal and Laundry Services
24.9
25.6
25.9
-0.7 -2.7
-1.0 -3.9
Government
335.2
334.4
327.5
0.8 0.2
7.7 2.4
Federal Government
46.8
46.9
45.9
-0.1 -0.2
0.9 2.0
State Government
76.1
75.4
71.7
0.7 0.9
4.4 6.1
Local Government
212.3
212.1
209.9
0.2 0.1
2.4 1.1
Note: These not seasonally adjusted estimates were prepared in cooperation with the U.S. Department of Labor, Bureau of Labor Statistics, based upon monthly reports submitted by
selected employers in the Atlanta Metropolitan Statistical Area, which includes Barrow, Bartow, Butts, Carroll, Cherokee, Clayton, Cobb, Coweta, Dawson, DeKalb, Douglas, Fayette, Forsyth, Fulton, Gwinnett, Haralson, Heard, Henry, Jasper, Lamar, Meriwether, Morgan, Newton, Paulding, Pickens, Pike, Rockdale, Spalding and Walton counties. The estimates include all full- and
part-time wage and salary workers who were employed during or received pay for any part of the pay period that includes the twelfth of the month. Proprietors, domestic workers, self-employed
persons, unpaid family workers and personnel of the armed forces are excluded. Estimates based on 2016 benchmark.
Source: Georgia Department of Labor, Workforce Statistics & Economic Research
5
AUGUSTA-RICHMOND COUNTY MSA Nonfarm Employment
(In thousands)
(Not Seasonally Adjusted)
Preliminary
Revised
Revised
MAR 2017 FEB 2017 MAR 2016
Change in Jobs from FEB 2017
Net %
Change in Jobs from MAR 2016
Net %
Total Nonfarm Total Private Goods Producing Service-Providing Private Service-Providing Mining, Logging and Construction Manufacturing Trade, Transportation, and Utilities
Wholesale Trade Retail Trade Transportation, Warehousing, and Utilities Information Financial Activities Professional and Business Services Education and Health Services Leisure and Hospitality Other Services Government Federal Government State Government Local Government
236.0 187.8
33.3 202.7 154.5
12.0 21.3 40.4
5.8 27.0
7.6 2.7 7.5 36.6 34.1 25.0 8.2 48.2 9.4 16.5 22.3
235.4 187.3
33.0 202.4 154.3
11.7 21.3 40.1
5.7 26.8
7.6 2.7 7.5 36.9 33.8 25.1 8.2 48.1 9.4 16.5 22.2
232.1 184.4
32.9 199.2 151.5
11.9 21.0 39.5
5.7 26.4
7.4 2.7 7.5 36.6 32.6 24.5 8.1 47.7 9.3 16.2 22.2
0.6 0.3 0.5 0.3 0.3 0.9 0.3 0.2 0.2 0.1 0.3 2.6 0.0 0.0 0.3 0.8 0.1 1.8 0.2 0.8 0.0 0.0 0.0 0.0 0.0 0.0 -0.3 -0.8 0.3 0.9 -0.1 -0.4 0.0 0.0 0.1 0.2 0.0 0.0 0.0 0.0 0.1 0.5
3.9 1.7 3.4 1.8 0.4 1.2 3.5 1.8 3.0 2.0 0.1 0.8 0.3 1.4 0.9 2.3 0.1 1.8 0.6 2.3 0.2 2.7 0.0 0.0 0.0 0.0 0.0 0.0 1.5 4.6 0.5 2.0 0.1 1.2 0.5 1.1 0.1 1.1 0.3 1.9 0.1 0.5
Note: These not seasonally adjusted estimates were prepared in cooperation with the U.S. Department of Labor, Bureau of Labor Statistics, based upon monthly reports submitted by
selected employers in the Augusta-Richmond County Metropolitan Statistical Area, which includes Burke, Columbia, Lincoln, McDuffie and Richmond counties in Georgia and Aiken and Edgefield counties in South Carolina. The estimates include all full- and part-time wage and salary workers who were employed during or received pay for any part of the pay period that includes the twelfth of the month. Proprietors, domestic workers, self-employed persons, unpaid family workers and personnel of the armed forces are excluded. Estimates based on 2016 benchmark.
BRUNSWICK MSA Nonfarm Employment
(In thousands)
(Not Seasonally Adjusted)
Preliminary
Revised
Revised
MAR 2017 FEB 2017 MAR 2016
Change in Jobs from FEB 2017
Net %
Change in Jobs from MAR 2016
Net %
Total Nonfarm Total Private Goods Producing Service-Providing Private Service-Providing Trade, Transportation, and Utilities
Retail Trade Government
Federal Government State Government Local Government
43.3
42.8
42.5
34.7
34.2
34.2
3.9
3.9
3.8
39.4
38.9
38.7
30.8
30.3
30.4
8.9
8.7
8.9
5.7
5.7
5.6
8.6
8.6
8.3
1.9
1.9
1.8
1.9
1.9
1.7
4.8
4.8
4.8
0.5 1.2 0.5 1.5 0.0 0.0 0.5 1.3 0.5 1.7 0.2 2.3 0.0 0.0 0.0 0.0 0.0 0.0 0.0 0.0 0.0 0.0
0.8 1.9 0.5 1.5 0.1 2.6 0.7 1.8 0.4 1.3 0.0 0.0 0.1 1.8 0.3 3.6 0.1 5.6 0.2 11.8 0.0 0.0
Note: These not seasonally adjusted estimates were prepared in cooperation with the U.S. Department of Labor, Bureau of Labor Statistics, based upon monthly reports submitted by
selected employers in the Brunswick Metropolitan Statistical Area, which includes Brantley, Glynn and McIntosh counties. The estimates include all full- and part-time wage and salary workers who were employed during or received pay for any part of the pay period that includes the twelfth of the month. Proprietors, domestic workers, self-employed persons, unpaid family workers and personnel of the armed forces are excluded. Estimates based on 2016 benchmark.
Source: Georgia Department of Labor, Workforce Statistics & Economic Research
6
COLUMBUS MSA Nonfarm Employment
(In thousands)
(Not Seasonally Adjusted)
Preliminary
Revised
Revised
MAR 2017 FEB 2017 MAR 2016
Change in Jobs from FEB 2017
Net %
Change in Jobs from MAR 2016
Net %
Total Nonfarm Total Private Goods Producing Service-Providing Private Service-Providing Mining, Logging and Construction Manufacturing Trade, Transportation, and Utilities
Wholesale Trade Retail Trade Transportation, Warehousing, and Utilities Information Financial Activities Finance and Insurance
Insurance Carriers and Related Activities Professional and Business Services Education and Health Services Leisure and Hospitality Other Services Government
Federal Government State Government Local Government
120.9 95.9 14.5
106.4 81.4 4.3 10.2 19.2 3.2 13.8 2.2 1.3 13.3 11.7 4.5 12.5 16.3 14.3 4.5 25.0 6.9 4.9 13.2
120.4 95.4 14.3
106.1 81.1 4.3 10.0 19.1 3.1 13.8 2.2 1.3 13.3 11.7 4.5 12.6 16.3 14.0 4.5 25.0 6.9 4.9 13.2
120.3 95.3 14.2
106.1 81.1 4.3 9.9 18.8 3.0 13.7 2.1 1.4 13.2 11.3 4.3 12.8 16.5 13.9 4.5 25.0 6.9 4.8 13.3
0.5 0.4 0.5 0.5 0.2 1.4 0.3 0.3 0.3 0.4 0.0 0.0 0.2 2.0 0.1 0.5 0.1 3.2 0.0 0.0 0.0 0.0 0.0 0.0 0.0 0.0 0.0 0.0 0.0 0.0 -0.1 -0.8 0.0 0.0 0.3 2.1 0.0 0.0 0.0 0.0 0.0 0.0 0.0 0.0 0.0 0.0
0.6 0.5 0.6 0.6 0.3 2.1 0.3 0.3 0.3 0.4 0.0 0.0 0.3 3.0 0.4 2.1 0.2 6.7 0.1 0.7 0.1 4.8 -0.1 -7.1 0.1 0.8 0.4 3.5 0.2 4.7 -0.3 -2.3 -0.2 -1.2 0.4 2.9 0.0 0.0 0.0 0.0 0.0 0.0 0.1 2.1 -0.1 -0.8
Note: These not seasonally adjusted estimates were prepared in cooperation with the U.S. Department of Labor, Bureau of Labor Statistics, based upon monthly reports submitted by
selected employers in the Columbus Metropolitan Statistical Area, which includes Chattahoochee, Harris, Marion and Muscogee counties in Georgia and Russell County in Alabama. The estimates include all full- and part-time wage and salary workers who were employed during or received pay for any part of the pay period that includes the twelfth of the month. Proprietors, domestic workers, self-employed persons, unpaid family workers and personnel of the armed forces are excluded. Estimates based on 2016 benchmark.
DALTON MSA Nonfarm Employment
(In thousands)
(Not Seasonally Adjusted)
Preliminary
Revised Revised
MAR 2017 FEB 2017 MAR 2016
Change in Jobs from FEB 2017
Net %
Change in Jobs from MAR 2016
Net %
Total Nonfarm Total Private Goods Producing Service-Providing Private Service-Providing Manufacturing
Textile Mills Textile Product Mills Trade, Transportation, and Utilities Retail Trade Transportation, Warehousing, and Utilities Professional and Business Services Government Federal Government State Government Local Government
70.0
69.6
69.8
63.1
62.8
63.0
26.6
26.5
26.5
43.4
43.1
43.3
36.5
36.3
36.5
25.3
25.1
25.2
4.1
4.1
4.0
15.1
15.1
15.7
16.8
16.6
16.5
8.7
8.6
8.5
3.9
3.9
3.8
6.3
6.2
6.4
6.9
6.8
6.8
0.3
0.2
0.2
1.0
1.0
0.9
5.6
5.6
5.7
0.4 0.6 0.3 0.5 0.1 0.4 0.3 0.7 0.2 0.6 0.2 0.8 0.0 0.0 0.0 0.0 0.2 1.2 0.1 1.2 0.0 0.0 0.1 1.6 0.1 1.5 0.1 50.0 0.0 0.0 0.0 0.0
0.2 0.3 0.1 0.2 0.1 0.4 0.1 0.2 0.0 0.0 0.1 0.4 0.1 2.5 -0.6 -3.8 0.3 1.8 0.2 2.4 0.1 2.6 -0.1 -1.6 0.1 1.5 0.1 50.0 0.1 11.1 -0.1 -1.8
Note: These not seasonally adjusted estimates were prepared in cooperation with the U.S. Department of Labor, Bureau of Labor Statistics, based upon monthly reports submitted by
selected employers in the Dalton Metropolitan Statistical Area, which includes Murray and Whitfield counties. The estimates include all full- and part-time wage and salary workers who were employed during or received pay for any part of the pay period that includes the twelfth of the month. Proprietors, domestic workers, self-employed persons, unpaid family workers and personnel of the armed forces are excluded. Estimates based on 2016 benchmark.
Source: Georgia Department of Labor, Workforce Statistics & Economic Research
7
GAINESVILLE MSA Nonfarm Employment
(In thousands)
(Not Seasonally Adjusted)
Preliminary
Revised
Revised
MAR 2017 FEB 2017 MAR 2016
Change in Jobs from FEB 2017
Net %
Change in Jobs from MAR 2016
Net %
Total Nonfarm Total Private Goods Producing Service-Providing Private Service-Providing Trade, Transportation, and Utilities
Retail Trade Government
Federal Government State Government Local Government
88.4
88.2
85.3
0.2 0.2
77.8
77.6
75.1
0.2 0.3
24.2
24.3
23.1
-0.1 -0.4
64.2
63.9
62.2
0.3 0.5
53.6
53.3
52.0
0.3 0.6
16.3
16.2
16.0
0.1 0.6
8.9
8.8
8.5
0.1 1.1
10.6
10.6
10.2
0.0 0.0
0.5
0.5
0.5
0.0 0.0
2.5
2.5
2.2
0.0 0.0
7.6
7.6
7.5
0.0 0.0
3.1 3.6 2.7 3.6 1.1 4.8 2.0 3.2 1.6 3.1 0.3 1.9 0.4 4.7 0.4 3.9 0.0 0.0 0.3 13.6 0.1 1.3
Note: These not seasonally adjusted estimates were prepared in cooperation with the U.S. Department of Labor, Bureau of Labor Statistics, based upon monthly reports submitted by
selected employers in the Gainesville Metropolitan Statistical Area, which comprises Hall county. The estimates include all full- and part-time wage and salary workers who were employed during or received pay for any part of the pay period that includes the twelfth of the month. Proprietors, domestic workers, self-employed persons, unpaid family workers and personnel of the armed forces are excluded. Estimates based on 2016 benchmark.
HINESVILLE MSA Nonfarm Employment
(In thousands)
(Not Seasonally Adjusted)
Preliminary Revised Revised MAR 2017 FEB 2017 MAR 2016
Change in Jobs from FEB 2017
Net %
Change in Jobs from MAR 2016
Net %
Total Nonfarm Total Private Goods Producing Service-Providing Private Service-Providing Government
Federal Government State Government Local Government
20.1
20.2
19.5
-0.1 -0.5
12.2
12.1
11.7
0.1 0.8
2.3
2.3
2.3
0.0 0.0
17.8
17.9
17.2
-0.1 -0.6
9.9
9.8
9.4
0.1 1.0
7.9
8.1
7.8
-0.2 -2.5
3.7
3.9
3.9
-0.2 -5.1
0.5
0.5
0.4
0.0 0.0
3.7
3.7
3.5
0.0 0.0
0.6 3.1 0.5 4.3 0.0 0.0 0.6 3.5 0.5 5.3 0.1 1.3 -0.2 -5.1 0.1 25.0 0.2 5.7
Note: These not seasonally adjusted estimates were prepared in cooperation with the U.S. Department of Labor, Bureau of Labor Statistics, based upon monthly reports submitted by
selected employers in the Hinesville Metropolitan Statistical Area, which includes Liberty and Long counties. The estimates include all full- and part-time wage and salary workers who were employed during or received pay for any part of the pay period that includes the twelfth of the month. Proprietors, domestic workers, self-employed persons, unpaid family workers and personnel of the armed forces are excluded. Estimates based on 2016 benchmark.
Source: Georgia Department of Labor, Workforce Statistics & Economic Research
8
MACON-BIBB COUNTY MSA Nonfarm Employment
(In thousands)
(Not Seasonally Adjusted)
Preliminary
Revised
Revised
MAR 2017 FEB 2017 MAR 2016
Change in Jobs from FEB 2017
Net %
Change in Jobs from MAR 2016
Net %
Total Nonfarm Total Private Goods Producing Service-Providing Private Service-Providing Trade, Transportation, and Utilities
Retail Trade Transportation, Warehousing, and Utilities Financial Activities Professional and Business Services Education and Health Services Leisure and Hospitality Government Federal Government State Government Local Government
102.8 88.4 10.3 92.5 78.1 20.7 13.6 4.0 10.0 11.8 21.5 10.6 14.4 1.2 3.8 9.4
102.4 88.0 10.3 92.1 77.7 20.6 13.7 4.0 10.0 11.8 21.5 10.4 14.4 1.2 3.9 9.3
102.0 87.6 10.1 91.9 77.5 19.9 13.2 3.8 9.9 11.6 21.3 10.2 14.4 1.1 3.7 9.6
0.4 0.4 0.4 0.5 0.0 0.0 0.4 0.4 0.4 0.5 0.1 0.5 -0.1 -0.7 0.0 0.0 0.0 0.0 0.0 0.0 0.0 0.0 0.2 1.9 0.0 0.0 0.0 0.0 -0.1 -2.6 0.1 1.1
0.8 0.8 0.8 0.9 0.2 2.0 0.6 0.7 0.6 0.8 0.8 4.0 0.4 3.0 0.2 5.3 0.1 1.0 0.2 1.7 0.2 0.9 0.4 3.9 0.0 0.0 0.1 9.1 0.1 2.7 -0.2 -2.1
Note: These not seasonally adjusted estimates were prepared in cooperation with the U.S. Department of Labor, Bureau of Labor Statistics, based upon monthly reports submitted by
selected employers in the Macon-Bibb County Metropolitan Statistical Area, which includes Bibb, Crawford, Jones, Monroe and Twiggs counties. The estimates include all full- and part-time wage and salary workers who were employed during or received pay for any part of the pay period that includes the twelfth of the month. Proprietors, domestic workers, self-employed persons, unpaid family workers and personnel of the armed forces are excluded. Estimates based on 2016 benchmark.
ROME MSA Nonfarm Employment
(In thousands)
(Not Seasonally Adjusted)
Preliminary
Revised
Revised
MAR 2017 FEB 2017 MAR 2016
Change in Jobs from FEB 2017
Net %
Change in Jobs from MAR 2016
Net %
Total Nonfarm Total Private Goods Producing Service-Providing Private Service-Providing Manufacturing Trade, Transportation, and Utilities
Retail Trade Education and Health Services Government
Federal Government State Government Local Government
41.3
41.2
40.2
0.1 0.2
35.5
35.4
34.5
0.1 0.3
7.3
7.3
7.2
0.0 0.0
34.0
33.9
33.0
0.1 0.3
28.2
28.1
27.3
0.1 0.4
6.2
6.2
6.3
0.0 0.0
7.6
7.7
7.8
-0.1 -1.3
5.1
5.1
5.1
0.0 0.0
10.4
10.3
9.8
0.1 1.0
5.8
5.8
5.7
0.0 0.0
0.2
0.2
0.2
0.0 0.0
1.6
1.6
1.5
0.0 0.0
4.0
4.0
4.0
0.0 0.0
1.1 2.7 1.0 2.9 0.1 1.4 1.0 3.0 0.9 3.3 -0.1 -1.6 -0.2 -2.6 0.0 0.0 0.6 6.1 0.1 1.8 0.0 0.0 0.1 6.7 0.0 0.0
Note: These not seasonally adjusted estimates were prepared in cooperation with the U.S. Department of Labor, Bureau of Labor Statistics, based upon monthly reports submitted by
selected employers in the Rome Metropolitan Statistical Area, which comprises Floyd county. The estimates include all full- and part-time wage and salary workers who were employed during or received pay for any part of the pay period that includes the twelfth of the month. Proprietors, domestic workers, self-employed persons, unpaid family workers and personnel of the armed forces are excluded. Estimates based on 2016 benchmark.
Source: Georgia Department of Labor, Workforce Statistics & Economic Research
9
SAVANNAH MSA Nonfarm Employment
(In thousands)
(Not Seasonally Adjusted)
Preliminary Revised
Revised
MAR 2017 FEB 2017 MAR 2016
Change in Jobs from FEB 2017
Net %
Change in Jobs from MAR 2016
Net %
Total Nonfarm Total Private Goods Producing Service-Providing Private Service-Providing Mining, Logging and Construction Manufacturing Trade, Transportation, and Utilities
Wholesale Trade Retail Trade Transportation, Warehousing, and Utilities Information Financial Activities Professional and Business Services Education and Health Services Leisure and Hospitality Other Services Government Federal Government State Government Local Government
180.0 154.9
23.7 156.3 131.2
7.2 16.5 40.2
7.0 21.4 11.8
1.5 6.5 21.0 27.0 27.7 7.3 25.1 3.0 6.3 15.8
178.5 153.5
23.6 154.9 129.9
7.2 16.4 40.1
6.9 21.4 11.8
1.5 6.5 20.9 27.0 26.6 7.3 25.0 2.9 6.3 15.8
173.3 149.8
23.8 149.5 126.0
6.7 17.1 39.9
6.5 21.1 12.3
1.8 6.6 18.9 25.9 25.7 7.2 23.5 2.9 5.6 15.0
1.5 0.8 1.4 0.9 0.1 0.4 1.4 0.9 1.3 1.0 0.0 0.0 0.1 0.6 0.1 0.3 0.1 1.5 0.0 0.0 0.0 0.0 0.0 0.0 0.0 0.0 0.1 0.5 0.0 0.0 1.1 4.1 0.0 0.0 0.1 0.4 0.1 3.5 0.0 0.0 0.0 0.0
6.7 3.9 5.1 3.4 -0.1 -0.4 6.8 4.6 5.2 4.1 0.5 7.5 -0.6 -3.5 0.3 0.8 0.5 7.7 0.3 1.4 -0.5 -4.1 -0.3 -16.7 -0.1 -1.5 2.1 11.1 1.1 4.3 2.0 7.8 0.1 1.4 1.6 6.8 0.1 3.5 0.7 12.5 0.8 5.3
Note: These not seasonally adjusted estimates were prepared in cooperation with the U.S. Department of Labor, Bureau of Labor Statistics, based upon monthly reports submitted by
selected employers in the Savannah Metropolitan Statistical Area, which includes Bryan, Chatham and Effingham counties. The estimates include all full- and part-time wage and salary workers who were employed during or received pay for any part of the pay period that includes the twelfth of the month. Proprietors, domestic workers, self-employed persons, unpaid family workers and personnel of the armed forces are excluded. Estimates based on 2016 benchmark.
VALDOSTA MSA Nonfarm Employment
(In thousands)
(Not Seasonally Adjusted)
Preliminary Revised
Revised
MAR 2017 FEB 2017 MAR 2016
Change in Jobs from FEB 2017
Net %
Change in Jobs from MAR 2016
Net %
Total Nonfarm Total Private Goods Producing Service-Providing Private Service-Providing Trade, Transportation, and Utilities
Retail Trade Government
Federal Government State Government Local Government
56.5
56.2
55.1
0.3 0.5
43.5
43.2
42.5
0.3 0.7
7.2
7.2
7.1
0.0 0.0
49.3
49.0
48.0
0.3 0.6
36.3
36.0
35.4
0.3 0.8
12.7
12.8
12.1
-0.1 -0.8
7.5
7.6
7.2
-0.1 -1.3
13.0
13.0
12.6
0.0 0.0
1.2
1.2
1.2
0.0 0.0
3.8
3.8
3.6
0.0 0.0
8.0
8.0
7.8
0.0 0.0
1.4 2.5 1.0 2.4 0.1 1.4 1.3 2.7 0.9 2.5 0.6 5.0 0.3 4.2 0.4 3.2 0.0 0.0 0.2 5.6 0.2 2.6
Note: These not seasonally adjusted estimates were prepared in cooperation with the U.S. Department of Labor, Bureau of Labor Statistics, based upon monthly reports submitted by
selected employers in the Valdosta Metropolitan Statistical Area, which includes Brooks, Echols, Lanier and Lowndes counties. The estimates include all full- and part-time wage and salary workers who were employed during or received pay for any part of the pay period that includes the twelfth of the month. Proprietors, domestic workers, self-employed persons, unpaid family workers and personnel of the armed forces are excluded. Estimates based on 2016 benchmark.
Source: Georgia Department of Labor, Workforce Statistics & Economic Research
10
WARNER ROBINS MSA Nonfarm Employment
(In thousands)
(Not Seasonally Adjusted)
Preliminary Revised
Revised
MAR 2017 FEB 2017 MAR 2016
Change in Jobs from FEB 2017
Net %
Change in Jobs from MAR 2016
Net %
Total Nonfarm Total Private Goods Producing Service-Providing Private Service-Providing Trade, Transportation, and Utilities
Retail Trade Government
Federal Government State Government Local Government
73.6
73.4
71.5
0.2 0.3
46.6
46.3
45.1
0.3 0.7
10.7
10.6
10.1
0.1 0.9
62.9
62.8
61.4
0.1 0.2
35.9
35.7
35.0
0.2 0.6
10.5
10.6
10.4
-0.1 -0.9
8.5
8.5
8.1
0.0 0.0
27.0
27.1
26.4
-0.1 -0.4
14.8
14.7
14.6
0.1 0.7
2.2
2.3
2.1
-0.1 -4.4
10.0
10.1
9.7
-0.1 -1.0
2.1 2.9 1.5 3.3 0.6 5.9 1.5 2.4 0.9 2.6 0.1 1.0 0.4 4.9 0.6 2.3 0.2 1.4 0.1 4.8 0.3 3.1
Note: These not seasonally adjusted estimates were prepared in cooperation with the U.S. Department of Labor, Bureau of Labor Statistics, based upon monthly reports submitted by
selected employers in the Warner Robins Metropolitan Statistical Area, which includes Houston, Peach and Pulaski counties. The estimates include all full- and part-time wage and salary workers who were employed during or received pay for any part of the pay period that includes the twelfth of the month. Proprietors, domestic workers, self-employed persons, unpaid family workers and personnel of the armed forces are excluded. Estimates based on 2016 benchmark.
Total Nonfarm Employment by Metro Statistical Area
(In thousands)
(Seasonally Adjusted)
Preliminary
Revised
Revised
MAR 2017 FEB 2017 MAR 2016
Change in Jobs from FEB 2017
Net %
Change in Jobs from MAR 2016
Net %
Albany MSA
62.5
63.0
61.1
-0.5 -0.8
1.4 2.3
Athens-Clarke County MSA
95.9
95.3
93.7
0.6 0.6
2.2 2.3
Atlanta MSA
2,741.4
2,738.7
2,635.6
2.7 0.1
105.8 4.0
Augusta-Richmond County MSA
236.1
237.5
231.8
-1.4 -0.6
4.3 1.9
Brunswick MSA
43.5
43.1
42.9
0.4 0.9
0.6 1.4
Columbus MSA
121.2
120.7
120.6
0.5 0.4
0.6 0.5
Dalton MSA
69.9
70.0
69.8
-0.1 -0.1
0.1 0.1
Gainesville MSA
88.8
88.8
86.0
0.0 0.0
2.8 3.3
Hinesville MSA
20.0
20.2
19.5
-0.2 -1.0
0.5 2.6
Macon-Bibb County MSA
103.3
103.0
102.2
0.3 0.3
1.1 1.1
Rome MSA
41.5
41.4
40.4
0.1 0.2
1.1 2.7
Savannah MSA
180.3
179.6
174.3
0.7 0.4
6.0 3.4
Valdosta MSA
56.4
56.3
55.2
0.1 0.2
1.2 2.2
Warner Robins MSA
73.7
73.9
71.9
-0.2 -0.3
1.8 2.5
Note: These seasonally adjusted estimates were prepared in cooperation with the U.S. Department of Labor, Bureau of Labor Statistics, based upon monthly reports submitted by selected
employers throughout Georgia. The estimates include all full- and part-time wage and salary workers who were employed during or received pay for any part of the pay period that includes the twelfth of the month. Proprietors, domestic workers, self-employed persons, unpaid family workers and personnel of the armed forces are excluded. Estimates based on 2016 benchmark.
Source: Georgia Department of Labor, Workforce Statistics & Economic Research
11
Georgia Statewide Hours and Earnings
All Employee
Average Weekly Earnings (AWE)
Preliminary MAR 2017
Revised FEB 2017
Revised MAR 2016
Total Private.....................................................................................................$863.78.............................$867.22...................... $840.43 Goods Producing..........................................................................................$976.00............................. $981.14....................$1,026.64 Private Service Providing............................................................................. $844.02............................ $846.36...................... $805.34 Construction...............................................................................................$967.44.............................$978.70....................$1,008.50 Manufacturing............................................................................................$976.86.............................$976.40.................... $1,024.54 Trade, Transportation, and Utilities............................................................$765.00.............................$765.57.......................$739.97 Financial Activities..................................................................................$1,202.20..........................$1,210.39.................... $1,073.87 Professional and Business Services...................................................... $1,037.00..........................$1,060.21.................... $1,013.57 Educational and Health Services.............................................................. $962.53............................ $948.86....................... $887.09 Leisure and Hospitality.............................................................................. $343.94............................ $342.38.......................$341.43 Other Services...........................................................................................$670.86............................ $685.58.......................$724.54
Average Weekly Hours (AWH)
Preliminary MAR 2017
Revised FEB 2017
Revised MAR 2016
Total Private...........................................................................................................34.4.................................. 34.4.............................34.7 Goods Producing................................................................................................40.0...................................39.9............................. 41.0 Private Service Providing....................................................................................33.4...................................33.4.............................33.5 Construction.....................................................................................................38.9...................................39.4............................. 41.4 Manufacturing..................................................................................................40.5...................................40.0.............................40.4 Trade, Transportation, and Utilities..................................................................34.0.................................. 33.8............................. 34.1 Financial Activities...........................................................................................36.9................................... 37.3............................. 37.3 Professional and Business Services...............................................................33.9.................................. 34.4.............................34.3 Educational and Health Services.....................................................................35.4.................................. 35.3.............................35.3 Leisure and Hospitality.....................................................................................26.6...................................26.5.............................26.8 Other Services.................................................................................................31.9...................................32.4.............................34.0
Average Hourly Earnings (AHE)
Preliminary MAR 2017
Revised FEB 2017
Revised MAR 2016
Total Private....................................................................................................... $25.11...............................$25.21.........................$24.22 Goods Producing............................................................................................$24.40...............................$24.59.........................$25.04 Private Service Providing................................................................................$25.27.............................. $25.34.........................$24.04 Construction.................................................................................................$24.87.............................. $24.84.........................$24.36 Manufacturing.............................................................................................. $24.12...............................$24.41.........................$25.36 Trade, Transportation, and Utilities............................................................. $22.50.............................. $22.65......................... $21.70 Financial Activities...................................................................................... $32.58.............................. $32.45.........................$28.79 Professional and Business Services.......................................................... $30.59.............................. $30.82.........................$29.55 Educational and Health Services................................................................. $27.19.............................. $26.88......................... $25.13 Leisure and Hospitality.................................................................................$12.93...............................$12.92......................... $12.74 Other Services.............................................................................................$21.03............................... $21.16......................... $21.31
Read more about the hours and earnings series at http://www.bls.gov/sae/home.htm
Note: These not seasonally adjusted estimates were prepared in cooperation with the U.S. Department of Labor, Bureau of Labor Statistics, based upon monthly reports submitted by
selected employers throughout Georgia. The estimates include all full- and part-time wage and salary workers who were employed during or received pay for any part of the pay period that includes the twelfth of the month. Proprietors, domestic workers, self-employed persons, unpaid family workers and personnel of the armed forces are excluded. Estimates based on 2016 benchmark.
Source: Georgia Department of Labor, Workforce Statistics & Economic Research
12
Georgia MSA Hours and Earnings
All Employee Total Private
Average Weekly Earnings (AWE)
Preliminary MAR 2017
Revised FEB 2017
Revised MAR 2016
Albany MSA ................................................................................................... $664.95............................ $638.92....................... $597.78 Athens-Clarke County MSA .......................................................................... $684.83.............................$731.84.......................$692.41 Atlanta MSA ................................................................................................. $945.65............................ $950.08.......................$933.68 Augusta-Richmond County MSA .................................................................. $799.58.............................$833.41....................... $811.36 Brunswick MSA ............................................................................................ $660.21............................ $688.82.......................$584.87 Columbus MSA ..............................................................................................$715.80.............................$718.20........................$707.16 Dalton MSA .................................................................................................. $652.98.............................$674.78...................... $695.27 Gainesville MSA .............................................................................................$971.60............................ $893.20....................... $917.68 Hinesville MSA ...............................................................................................$761.94............................ $802.96.......................$730.09 Macon-Bibb County MSA ............................................................................. $798.00............................ $772.08.......................$736.67 Rome MSA .....................................................................................................$801.48............................. $820.13.......................$841.80 Savannah MSA ............................................................................................. $793.64............................. $811.23.......................$739.97 Valdosta MSA ................................................................................................ $605.50............................ $590.98....................... $597.38 Warner Robins MSA .......................................................................................$771.55............................. $757.19.......................$789.64
Average Weekly Hours (AWH)
Preliminary MAR 2017
Revised FEB 2017
Revised MAR 2016
Albany MSA ..........................................................................................................32.5...................................32.9.............................32.4 Athens-Clarke County MSA .................................................................................30.6...................................32.0.............................32.8 Atlanta MSA ........................................................................................................34.3.................................. 34.2.............................34.8 Augusta-Richmond County MSA .........................................................................35.1.................................. 34.9.............................35.2 Brunswick MSA ...................................................................................................32.3...................................32.4............................. 31.7 Columbus MSA ....................................................................................................34.9...................................35.0.............................35.5 Dalton MSA .........................................................................................................34.9.................................. 35.2............................. 37.4 Gainesville MSA ................................................................................................... 41.1...................................38.7............................. 39.1 Hinesville MSA .....................................................................................................32.8.................................. 34.3.............................34.7 Macon-Bibb County MSA ....................................................................................35.0...................................34.7.............................36.2 Rome MSA ........................................................................................................... 37.4................................... 37.5..............................37.1 Savannah MSA ....................................................................................................33.7...................................33.9.............................32.8 Valdosta MSA .......................................................................................................35.0.................................. 34.2.............................34.0 Warner Robins MSA ............................................................................................. 37.6................................... 37.3.............................38.5
Average Hourly Earnings (AHE)
Preliminary MAR 2017
Revised FEB 2017
Revised MAR 2016
Albany MSA ......................................................................................................$20.46...............................$19.42.........................$18.45 Athens-Clarke County MSA ............................................................................ $22.38.............................. $22.87..........................$21.11 Atlanta MSA .................................................................................................... $27.57............................... $27.78.........................$26.83 Augusta-Richmond County MSA .....................................................................$22.78.............................. $23.88.........................$23.05 Brunswick MSA ...............................................................................................$20.44...............................$21.26.........................$18.45 Columbus MSA ................................................................................................$20.51...............................$20.52......................... $19.92 Dalton MSA ..................................................................................................... $18.71............................... $19.17.........................$18.59 Gainesville MSA .............................................................................................. $23.64.............................. $23.08.........................$23.47 Hinesville MSA ................................................................................................ $23.23...............................$23.41.........................$21.04 Macon-Bibb County MSA ............................................................................... $22.80.............................. $22.25.........................$20.35 Rome MSA .......................................................................................................$21.43...............................$21.87.........................$22.69 Savannah MSA ................................................................................................$23.55.............................. $23.93.........................$22.56 Valdosta MSA ................................................................................................... $17.30............................... $17.28......................... $17.57 Warner Robins MSA .........................................................................................$20.52.............................. $20.30......................... $20.51
Read more about the hours and earnings series at http://www.bls.gov/sae/home.htm
Note: These not seasonally adjusted estimates were prepared in cooperation with the U.S. Department of Labor, Bureau of Labor Statistics, based upon monthly reports submitted by
selected employers throughout Georgia. The estimates include all full- and part-time wage and salary workers who were employed during or received pay for any part of the pay period that includes the twelfth of the month. Proprietors, domestic workers, self-employed persons, unpaid family workers and personnel of the armed forces are excluded. Estimates based on 2016 benchmark.
Source: Georgia Department of Labor, Workforce Statistics & Economic Research
13
Dimensions - Measuring Georgia's Labor Force
Unemployment rates -- Georgia and U.S.
7%
Georgia
U.S.
6%
5%
4% Mar Apr May Jun Jul Aug Sep Oct Nov Dec Jan Feb Mar
WA 4.7 OR 3.8 NV 4.8 CA 4.9
AK 6.4
ID 3.5
UT 3.1 AZ 5.0
StaStteatuenUenmepmlopylomymenetntrRataetess
March 2017
National Unemployment Rate: 4.5% Rates are seasonally adjusted
MT 3.8
WY 4.5
CO 2.6 NM 6.7
ND 2.8 SD 2.8
NE 3.1
KS 3.8
MN 3.8
WI 3.4
IA 3.1
IL 4.9 MO 3.9
OK 4.3 TX 5.0
AR 3.6
MS 5.0 LA 5.7
MI 5.1
OH
IN
5.1
3.9
KY 5.0 TN 5.1
PA 4.8
WV
4.9
VA
3.8
NC 4.9
SC 4.4
AL
GA
5.8
5.1
FL 4.8
NH
2.8 ME
VT
3.0
3.0
MA 3.6
NY 4.3
RI 4.3
NJ
CT 4.8
4.2
DE
4.5
DC 5.8
MD 4.3
Unemployment rate
6.0% to 6.9% 5.0% to 5.9% 4.0% to 4.9% 3.0% to 3.9% Less than 3.0%
HI 2.7 Source: Georgia Department of Labor, Workforce Statistics & Economic Research
14
Georgia Labor Force Estimates
Place of Residence - Persons 16 Years and Older
Georgia
(Seasonally adjusted)
Georgia
(Not Seasonally adjusted)
Albany MSA Athens-Clarke County MSA
Atlanta MSA
Augusta-Richmond County MSA
Brunswick MSA
Columbus MSA
Dalton MSA
Gainesville MSA
Employment Status
Civilian labor force Employed Unemployed Rate
Civilian labor force Employed Unemployed Rate
Civilian labor force Employed Unemployed Rate
Civilian labor force Employed Unemployed Rate
Civilian labor force Employed Unemployed Rate
Civilian labor force Employed Unemployed Rate
Civilian labor force Employed Unemployed Rate
Civilian labor force Employed Unemployed Rate
Civilian labor force Employed Unemployed Rate
Civilian labor force Employed Unemployed Rate
Preliminary MAR 2017
5,020,332 4,762,684
257,648 5.1
5,014,429 4,772,580
241,849 4.8
67,309 63,481
3,828 5.7
98,890 94,402
4,488 4.5
3,010,116 2,870,881
139,235 4.6
265,528 252,650
12,878 4.8
52,147 49,560
2,587 5.0
124,426 117,253
7,173 5.8
63,021 59,386
3,635 5.8
98,292 94,383
3,909 4.0
Revised FEB 2017
5,010,705 4,743,591
267,114 5.3
5,003,393 4,747,576
255,817 5.1
67,714 63,624
4,090 6.0
98,436 93,697
4,739 4.8
3,003,931 2,857,470
146,461 4.9
265,475 251,542
13,933 5.2
51,795 49,031
2,764 5.3
124,701 116,620
8,081 6.5
62,878 59,018 3,860
6.1
97,924 93,915 4,009
4.1
Revised MAR 2016
4,877,682 4,611,097
266,585 5.5
4,894,135 4,633,313
260,822 5.3
66,119 61,909
4,210 6.4
96,668 91,993
4,675 4.8
2,914,316 2,765,921
148,395 5.1
262,398 247,899 14,499
5.5
51,472 48,544
2,928 5.7
124,585 116,531
8,054 6.5
63,459 59,282
4,177 6.6
95,436 91,202 4,234
4.4
Change From
FEB 2017
MAR 2016
9,627 19,093 -9,466
142,650 151,587
-8,937
11,036 25,004 -13,968
120,294 139,267 -18,973
-405 -143 -262
1,190 1,572 -382
454
2,222
705
2,409
-251
-187
6,185 13,411 -7,226
95,800 104,960
-9,160
53 1,108 -1,055
3,130 4,751 -1,621
352
675
529
1,016
-177
-341
-275 633 -908
-159 722 -881
143 368 -225
-438 104 -542
368
2,856
468
3,181
-100
-325
Note: MSA data are not seasonally adjusted. Employment includes nonagricultural wage and salary employment, self-employment, unpaid family and private
household workers and agricultural workers. Persons in labor disputes are counted as employed. The use of unrounded data does not imply that the numbers are exact.
Albany MSA: Baker, Dougherty, Lee, Terrell, and Worth counties. Athens-Clarke County MSA: Clarke, Madison, Oconee, and Oglethorpe counties. Atlanta MSA: Barrow, Bartow, Butts, Carroll, Cherokee, Clayton, Cobb, Coweta, Dawson, DeKalb, Douglas, Fayette, Forsyth, Fulton, Gwinnett, Haralson, Heard, Henry, Jasper, Lamar, Meriwether, Morgan, Newton, Paulding, Pickens, Pike, Rockdale, Spalding, and Walton counties. Augusta-Richmond County MSA: Burke, Columbia, Lincoln, McDuffie, and Richmond counties in Georgia and Aiken and Edgefield counties in South Carolina. Brunswick MSA: Brantley, Glynn, and McIntosh counties. Columbus MSA: Chattahoochee, Harris, Marion, and Muscogee counties in Georgia and Russell County in Alabama. Dalton MSA: Murray and Whitfield counties. Gainesville MSA: Hall County. Hinesville MSA: Liberty and Long counties. Macon-Bibb County MSA: Bibb, Crawford, Jones, Monroe, and Twiggs counties. Rome MSA: Floyd County. Savannah MSA: Bryan, Chatham, and Effingham counties. Valdosta MSA: Brooks, Echols, Lanier, and Lowndes counties. Warner Robins MSA: Houston, Peach and Pulaski counties.
Source: Georgia Department of Labor, Workforce Statistics & Economic Research
15
Hinesville MSA
Macon-Bibb County MSA Rome MSA Savannah MSA
Valdosta MSA Warner Robins MSA
Georgia Labor Force Estimates
Place of Residence - Persons 16 Years and Older
Employment Status
Civilian labor force Employed Unemployed Rate
Civilian labor force Employed Unemployed Rate
Preliminary MAR 2017
33,003 31,235
1,768 5.4
104,712 99,227
5,485 5.2
Revised FEB 2017
33,127 31,256
1,871 5.6
104,444 98,682 5,762 5.5
Revised MAR 2016
32,309 30,475
1,834 5.7
104,560 98,440 6,120 5.9
Civilian labor force Employed Unemployed Rate
Civilian labor force Employed Unemployed Rate
44,174 41,843
2,331 5.3
185,269 176,980
8,289 4.5
44,193 41,679
2,514 5.7
184,177 175,468
8,709 4.7
43,335 40,759
2,576 5.9
179,877 170,776
9,101 5.1
Civilian labor force Employed Unemployed Rate
Civilian labor force Employed Unemployed Rate
64,674 61,747 2,927
4.5
84,107 79,922
4,185 5.0
64,375 61,234
3,141 4.9
83,903 79,491
4,412 5.3
63,346 60,092
3,254 5.1
82,637 78,021
4,616 5.6
Change From
FEB 2017
MAR 2016
-124
694
-21
760
-103
-66
268 545 -277
152 787 -635
-19
839
164
1,084
-183
-245
1,092 1,512 -420
5,392 6,204
-812
299
1,328
513
1,655
-214
-327
204 431 -227
1,470 1,901 -431
Area United States
(Seasonally adjusted)
United States
(Not Seasonally adjusted)
United States Labor Force Estimates
Place of Residence - Persons 16 Years and Older
Employment Status
Civilian labor force Employed Unemployed Rate
Civilian labor force Employed Unemployed Rate
MAR 2017
160,201,000 153,000,000
7,202,000 4.5
159,912,000 152,628,000
7,284,000 4.6
FEB 2017
160,056,000 152,528,000
7,528,000 4.7
159,482,000 151,594,000
7,887,000 4.9
MAR 2016
159,278,000 151,301,000
7,977,000 5.0
158,854,000 150,738,000
8,116,000 5.1
Change From
FEB 2017
MAR 2016
145,000 472,000 -326,000
923,000 1,699,000
-775,000
430,000 1,034,000 -603,000
1,058,000 1,890,000 -832,000
Note: MSA data are not seasonally adjusted. Employment includes nonagricultural wage and salary employment, self-employment, unpaid family and private
household workers and agricultural workers. Persons in labor disputes are counted as employed. The use of unrounded data does not imply that the numbers are exact.
Albany MSA: Baker, Dougherty, Lee, Terrell, and Worth counties. Athens-Clarke County MSA: Clarke, Madison, Oconee, and Oglethorpe counties. Atlanta MSA: Barrow, Bartow, Butts, Carroll, Cherokee, Clayton, Cobb, Coweta, Dawson, DeKalb, Douglas, Fayette, Forsyth, Fulton, Gwinnett, Haralson, Heard, Henry, Jasper, Lamar, Meriwether, Morgan, Newton, Paulding, Pickens, Pike, Rockdale, Spalding, and Walton counties. Februarya-Richmond County MSA: Burke, Columbia, Lincoln, McDuffie, and Richmond counties in Georgia and Aiken and Edgefield counties in South Carolina. Brunswick MSA: Brantley, Glynn, and McIntosh counties. Columbus MSA: Chattahoochee, Harris, Marion, and Muscogee counties in Georgia and Russell County in Alabama. Dalton MSA: Murray and Whitfield counties. Gainesville MSA: Hall County. Hinesville MSA: Liberty and Long counties. Macon-Bibb County MSA: Bibb, Crawford, Jones, Monroe, and Twiggs counties. Rome MSA: Floyd County. Savannah MSA: Bryan, Chatham, and Effingham counties. Valdosta MSA: Brooks, Echols, Lanier, and Lowndes counties. Warner Robins MSA: Houston, Peach and Pulaski counties.
Source: Georgia Department of Labor, Workforce Statistics & Economic Research
16
Georgia Labor Force Estimates by County (not seasonally adjusted)
Place of Residence - Persons 16 Years and Older
Georgia
Preliminary March 2017
Labor Force
Employment
Unemployment Number Rate
5,014,429 4,772,580 241,849 4.8
Appling Atkinson Bacon Baker Baldwin
9,505 9,008
497 5.2
4,063 3,870
193 4.8
5,021 4,790
231 4.6
1,190 1,117
73 6.1
18,138 17,072 1,066 5.9
Banks Barrow Bartow Ben Hill Berrien
8,902 8,523
379 4.3
38,217 36,603 1,614 4.2
49,519 47,190 2,329 4.7
5,841 5,400
441 7.6
7,274 6,881
393 5.4
Bibb Bleckley Brantley Brooks Bryan
69,236 65,473 3,763 5.4
4,474 4,202
272 6.1
7,162 6,751
411 5.7
7,175 6,848
327 4.6
16,999 16,269
730 4.3
Bulloch Burke Butts Calhoun Camden
36,405 34,596 1,809 5.0
9,464 8,802
662 7.0
10,651 10,116
535 5.0
2,139 2,014
125 5.8
20,258 19,144 1,114 5.5
Candler Carroll Catoosa Charlton Chatham
5,109 4,887
222 4.3
54,550 51,710 2,840 5.2
32,815 31,382 1,433 4.4
4,796 4,547
249 5.2
139,672 133,317 6,355 4.5
Chattahoochee 2,123 1,962
161 7.6
Chattooga
10,785 10,250
535 5.0
Cherokee 127,549 122,694 4,855 3.8
Clarke
59,951 57,034 2,917 4.9
Clay
881
795
86 9.8
Clayton Clinch Cobb Coffee Colquitt
132,774 124,846 7,928 6.0
2,794 2,655
139 5.0
421,874 404,313 17,561 4.2
18,503 17,487 1,016 5.5
21,304 20,264 1,040 4.9
Columbia Cook Coweta Crawford Crisp
71,120 68,136 2,984 4.2
7,616 7,250 366 4.8
71,787 68,722 3,065 4.3
5,700 5,420
280 4.9
9,282 8,776 506 5.5
Revised February 2017
Labor Force
Employment
Unemployment Number Rate
5,003,393 4,747,576 255,817 5.1
9,482 4,025 4,980 1,194 18,256
8,948 3,813 4,740 1,108 17,128
534 5.6 212 5.3 240 4.8 86 7.2 1,128 6.2
8,833 8,444
389 4.4
38,098 36,423 1,675 4.4
49,429 46,951 2,478 5.0
5,855 5,351 504 8.6
7,217 6,806
411 5.7
69,057 65,129 3,928 5.7
4,495 4,195 300 6.7
7,132 6,679
453 6.4
7,117 6,770
347 4.9
16,897 16,129
768 4.5
36,259 34,338 1,921 5.3
9,485 8,748
737 7.8
10,622 10,064
558 5.3
2,125 1,985
140 6.6
20,209 19,042 1,167 5.8
5,096 4,864
232 4.6
54,464 51,459 3,005 5.5
32,692 31,185 1,507 4.6
4,791 4,516
275 5.7
138,843 132,185 6,658 4.8
2,131 10,731 127,193 59,706
870
1,947 10,160 122,142 56,610
780
184 8.6 571 5.3 5,051 4.0 3,096 5.2 90 10.3
132,608 124,236 8,372 6.3
2,784 2,633
151 5.4
420,987 402,476 18,511 4.4
18,385 17,327 1,058 5.8
21,130 20,016 1,114 5.3
70,975 67,847 3,128 4.4
7,560 7,166 394 5.2
71,628 68,388 3,240 4.5
5,676 5,384
292 5.1
9,227 8,712
515 5.6
Revised March 2016
Labor Force
Employment
Unemployment Number Rate
4,894,135 4,633,313 260,822 5.3
9,248 4,057 4,965 1,180 17,668
8,695 3,830 4,696 1,094 16,540
553 6.0 227 5.6 269 5.4
86 7.3 1,128 6.4
8,793 8,379
414 4.7
36,981 35,277 1,704 4.6
47,930 45,484 2,446 5.1
5,667 5,233 434 7.7
7,224 6,780 444 6.1
69,125 4,440 7,067 7,049 16,493
64,966 4,126 6,596 6,666
15,696
4,159 6.0 314 7.1 471 6.7 383 5.4 797 4.8
35,954 34,092 1,862 5.2
9,333 8,668 665 7.1
10,340 9,752
588 5.7
2,200 2,077
123 5.6
20,377 19,245 1,132 5.6
4,982 4,745
237 4.8
52,906 49,817 3,089 5.8
32,197 30,625 1,572 4.9
4,755 4,494
261 5.5
135,634 128,635 6,999 5.2
2,129 10,709 123,372 58,630
907
1,954 10,083 118,173 55,596
811
175 8.2 626 5.8 5,199 4.2 3,034 5.2
96 10.6
128,967 120,332 8,635 6.7
2,852 2,672
180 6.3
408,145 389,460 18,685 4.6
17,851 16,770 1,081 6.1
21,096 19,978 1,118 5.3
70,109 66,982 3,127 4.5
7,572 7,169 403 5.3
69,535 66,226 3,309 4.8
5,701 5,378
323 5.7
9,179 8,618
561 6.1
Source: Georgia Department of Labor, Workforce Statistics & Economic Research
17
Georgia Labor Force Estimates by County (not seasonally adjusted)
Place of Residence - Persons 16 Years and Older
Dade Dawson Decatur DeKalb Dodge
Preliminary March 2017
Labor Force
Employment
Unemployment Number Rate
8,227 7,860
367 4.5
11,586 11,126 460 4.0
11,521 10,863 658 5.7
394,122 374,802 19,320 4.9
7,021 6,591 430 6.1
Dooly Dougherty Douglas Early Echols
5,038 4,763
275 5.5
38,737 36,311 2,426 6.3
71,994 68,435 3,559 4.9
4,429 4,178
251 5.7
1,969 1,897
72 3.7
Effingham Elbert Emanuel Evans Fannin
28,598 27,394 1,204 4.2
7,713 7,291
422 5.5
8,538 7,977
561 6.6
4,842 4,620 222 4.6
10,916 10,375
541 5.0
Fayette Floyd Forsyth Franklin Fulton
57,281 54,907 2,374 4.1 44,174 41,843 2,331 5.3 110,812 106,624 4,188 3.8 10,078 9,592 486 4.8 544,328 517,500 26,828 4.9
Gilmer Glascock Glynn Gordon Grady
11,716 11,086 630 5.4
1,279 1,218
61 4.8
38,920 37,071 1,849 4.8
25,441 24,175 1,266 5.0
10,319
9,742
577 5.6
Greene
6,946 6,590 356 5.1
Gwinnett
479,323 458,772 20,551 4.3
Habersham 19,081 18,151 930 4.9
Hall
98,292 94,383 3,909 4.0
Hancock
2,564 2,370
194 7.6
Haralson Harris Hart Heard Henry
12,494 11,867
627 5.0
15,840 15,138
702 4.4
11,177 10,662
515 4.6
5,176 4,924
252 4.9
110,769 105,361 5,408 4.9
Houston Irwin Jackson Jasper Jeff Davis
68,275 64,977 3,298 4.8
3,233 2,997 236 7.3
34,186 32,900 1,286 3.8
6,842 6,525
317 4.6
6,270 5,914 356 5.7
Revised February 2017
Labor Force
Employment
Unemployment Number Rate
8,231 7,819
412 5.0
11,568 11,075
493 4.3
11,505 10,799 706 6.1
393,459 373,080 20,379 5.2
7,008 6,568 440 6.3
5,017
4,740
277 5.5
39,016 36,415 2,601 6.7
71,921 68,121 3,800 5.3
4,418
4,140
278 6.3
1,955 1,869
86 4.4
28,437 27,154 1,283 4.5
7,658 7,227
431 5.6
8,561 7,953 608 7.1
4,831 4,598 233 4.8
10,880 10,304
576 5.3
57,147 54,646 2,501 4.4 44,193 41,679 2,514 5.7 110,499 106,118 4,381 4.0 10,022 9,513 509 5.1 543,093 515,074 28,019 5.2
11,687 11,040
647 5.5
1,272 1,202
70 5.5
38,644 36,685 1,959 5.1
25,332 23,991 1,341 5.3
10,202 9,614 588 5.8
6,909 6,528
381 5.5
478,225 456,717 21,508 4.5
19,040 18,055 985 5.2
97,924 93,915 4,009 4.1
2,564 2,365
199 7.8
12,473 11,815 658 5.3
15,855 15,048
807 5.1
11,103 10,559 544 4.9
5,181 4,898 283 5.5
110,573 104,836 5,737 5.2
68,110 64,644 3,466 5.1
3,199 2,952
247 7.7
34,116 32,755 1,361 4.0
6,821 6,490
331 4.9
6,273 5,886
387 6.2
Revised March 2016
Labor Force
Employment
Unemployment Number Rate
8,028 7,643
385 4.8
11,234 10,712
522 4.6
11,654 10,842
812 7.0
381,799 361,095 20,704 5.4
6,972 6,462
510 7.3
4,951 4,666
285 5.8
38,054 35,406 2,648 7.0
69,821 65,929 3,892 5.6
4,476 4,136 340 7.6
1,931 1,852
79 4.1
27,750 26,445 1,305 4.7
7,739 7,248
491 6.3
8,423 7,760
663 7.9
4,818 4,585
233 4.8
10,670 10,084 586 5.5
55,457 52,911 2,546 4.6
43,335 40,759 2,576 5.9
107,088 102,732 4,356 4.1
9,702 9,207
495 5.1
526,941 498,600 28,341 5.4
11,938 11,277
661 5.5
1,285 1,213
72 5.6
38,423 36,320 2,103 5.5
25,353 23,971 1,382 5.5
10,734 10,191 543 5.1
6,969 6,564
405 5.8
463,662 441,850 21,812 4.7
19,352 18,365
987 5.1
95,436 91,202 4,234 4.4
2,515 2,304
211 8.4
12,140 11,429
711 5.9
15,820 15,054
766 4.8
10,918 10,333
585 5.4
5,023 4,747
276 5.5
107,385 101,580 5,805 5.4
67,046 63,438 3,608 5.4
3,240 2,992
248 7.7
32,754 31,371 1,383 4.2
6,608 6,288
320 4.8
6,293 5,932
361 5.7
Source: Georgia Department of Labor, Workforce Statistics & Economic Research
18
Georgia Labor Force Estimates by County (not seasonally adjusted)
Place of Residence - Persons 16 Years and Older
Jefferson Jenkins Johnson Jones Lamar
Preliminary March 2017
Labor Force
6,597 3,177 3,965 13,794 8,059
Employment
6,164 2,954 3,739 13,184 7,585
Unemployment Number Rate
433 6.6 223 7.0 226 5.7 610 4.4 474 5.9
Lanier Laurens Lee Liberty Lincoln
3,866 3,687
179 4.6
18,964 17,823 1,141 6.0
14,530 13,907
623 4.3
25,647 24,266 1,381 5.4
3,478 3,305
173 5.0
Long Lowndes Lumpkin McDuffie McIntosh
7,356 6,969
387 5.3
51,664 49,315 2,349 4.5
16,480 15,799
681 4.1
8,969 8,415 554 6.2
6,065 5,738
327 5.4
Macon Madison Marion Meriwether Miller
4,685 13,276
3,447 9,086 2,752
4,368 12,692
3,219 8,552 2,620
317 6.8 584 4.4 228 6.6 534 5.9 132 4.8
Mitchell
8,534 7,991 543 6.4
Monroe
12,979 12,369
610 4.7
Montgomery 3,615 3,387
228 6.3
Morgan
8,974 8,555
419 4.7
Murray
16,415 15,376 1,039 6.3
Muscogee Newton Oconee Oglethorpe Paulding
78,914 74,041 4,873 6.2
51,055 48,316 2,739 5.4
18,554 17,890 664 3.6
7,109 6,786
323 4.5
80,790 77,393 3,397 4.2
Peach Pickens Pierce Pike Polk
11,629 14,696
8,467 8,706 18,292
10,979 14,046
8,071 8,308 17,318
650 5.6 650 4.4 396 4.7 398 4.6 974 5.3
Pulaski Putnam Quitman Rabun Randolph
4,203 8,049
791 6,523 2,464
3,966 7,558
748 6,151 2,290
237 5.6 491 6.1
43 5.4 372 5.7 174 7.1
Revised February 2017
Labor Force
6,588 3,183 3,937 13,754 8,042
Employment
6,128 2,947 3,710 13,108 7,554
Unemployment Number Rate
460 7.0 236 7.4 227 5.8 646 4.7 488 6.1
3,857 3,658
199 5.2
19,000 17,707 1,293 6.8
14,613 13,944 669 4.6
25,741 24,293 1,448 5.6
3,479 3,283
196 5.6
7,386 6,963
423 5.7
51,446 48,937 2,509 4.9
16,392 15,683
709 4.3
8,966 8,376 590 6.6
6,019 5,667
352 5.8
4,698 13,225
3,477 9,131 2,742
4,329 12,600
3,199 8,507 2,597
369 7.9 625 4.7 278 8.0 624 6.8 145 5.3
8,543 7,961 582 6.8
12,944 12,298 646 5.0
3,608 3,351
257 7.1
8,956 8,505
451 5.0
16,428 15,275 1,153 7.0
79,055 73,644 5,411 6.8
51,002 48,077 2,925 5.7
18,453 17,762
691 3.7
7,052 6,725
327 4.6
80,565 77,013 3,552 4.4
11,605 10,908
697 6.0
14,672 13,980 692 4.7
8,469 8,038
431 5.1
8,680 8,268
412 4.7
18,290 17,212 1,078 5.9
4,188 8,014
787 6,464 2,451
3,939 7,476
737 6,060 2,267
249 5.9 538 6.7
50 6.4 404 6.3 184 7.5
Revised March 2016
Labor Force
6,618 3,157 3,973 13,749 7,795
Employment
6,126 2,912 3,739 13,075 7,303
Unemployment Number Rate
492 7.4 245 7.8 234 5.9 674 4.9 492 6.3
3,807 3,586
221 5.8
19,093 17,828 1,265 6.6
14,239 13,558
681 4.8
25,130 23,677 1,453 5.8
3,462 3,251
211 6.1
7,179 6,798
381 5.3
50,559 47,988 2,571 5.1
15,580 14,836
744 4.8
8,897 8,282
615 6.9
5,982 5,628 354 5.9
4,707 12,963
3,474 8,814 2,791
4,322 12,358
3,198 8,240 2,626
385 8.2 605 4.7 276 7.9 574 6.5 165 5.9
8,805 12,928
3,756 8,676 16,497
8,221 12,254
3,481 8,242 15,347
584 6.6 674 5.2 275 7.3 434 5.0 1,150 7.0
79,146 73,679 5,467 6.9
49,438 46,565 2,873 5.8
18,124 17,422
702 3.9
6,951 6,617 334 4.8
78,167 74,593 3,574 4.6
11,482 14,228 8,296
8,416 18,166
10,714 13,534
7,867 8,002 17,038
768 6.7 694 4.9 429 5.2 414 4.9 1,128 6.2
4,109 7,955
816 6,438 2,501
3,869 7,387
757 6,036 2,294
240 5.8 568 7.1
59 7.2 402 6.2 207 8.3
Source: Georgia Department of Labor, Workforce Statistics & Economic Research
19
Georgia Labor Force Estimates by County (not seasonally adjusted) Place of Residence - Persons 16 Years and Older
Richmond Rockdale Schley Screven Seminole
Preliminary March 2017
Labor Force
Employment
Unemployment Number Rate
86,544 81,454 5,090 5.9
44,627 42,250 2,377 5.3
2,120 1,999
121 5.7
5,234 4,887
347 6.6
3,118 2,905
213 6.8
Spalding Stephens Stewart Sumter Talbot
28,364 26,674 1,690 6.0
11,229 10,654
575 5.1
2,149 2,011
138 6.4
12,884 11,954
930 7.2
2,795 2,621
174 6.2
Taliaferro Tattnall Taylor Telfair Terrell
612 9,445 3,418 5,161 3,741
568 8,949 3,166 4,818 3,502
44 7.2 496 5.3 252 7.4 343 6.6 239 6.4
Thomas Tift Toombs Towns Treutlen
17,571 16,543 1,028 5.9
18,440 17,530
910 4.9
11,602 10,836
766 6.6
4,212 3,966
246 5.8
2,694 2,507
187 6.9
Troup Turner Twiggs Union Upson
36,538 34,877 1,661 4.5
3,179 2,988
191 6.0
3,003 2,781
222 7.4
10,628 10,140
488 4.6
11,152 10,507 645 5.8
Walker
30,642 29,204 1,438 4.7
Walton
44,111 42,165 1,946 4.4
Ware
15,177 14,473
704 4.6
Warren
2,717 2,570
147 5.4
Washington
7,239 6,771
468 6.5
Wayne Webster Wheeler White Whitfield
11,447 10,777
670 5.9
970
895
75 7.7
1,763 1,622
141 8.0
14,555 13,928
627 4.3
46,606 44,010 2,596 5.6
Wilcox Wilkes Wilkinson Worth
2,658 3,986 3,686 9,111
2,490 3,757 3,461 8,644
168 6.3 229 5.7 225 6.1 467 5.1
Revised February 2017
Labor Force
Employment
Unemployment Number Rate
86,480 81,088 5,392 6.2
44,538 42,055 2,483 5.6
2,123 1,995
128 6.0
5,232 4,860
372 7.1
3,122 2,887
235 7.5
28,335 26,544 1,791 6.3
11,189 10,575
614 5.5
2,166 1,995
171 7.9
12,896 11,910 986 7.6
2,855 2,608
247 8.7
608 9,447 3,464 5,204 3,748
561 8,904 3,136 4,828 3,507
47 7.7 543 5.7 328 9.5 376 7.2 241 6.4
17,515 16,424 1,091 6.2
18,357 17,389 968 5.3
11,576 10,727 849 7.3
4,199 3,930
269 6.4
2,686 2,495
191 7.1
36,519 34,783 1,736 4.8
3,173 2,958
215 6.8
3,013 2,763
250 8.3
10,554 10,055
499 4.7
11,112 10,449 663 6.0
30,535 29,009 1,526 5.0
44,021 41,958 2,063 4.7
15,128 14,416
712 4.7
2,725 2,557
168 6.2
7,245 6,757
488 6.7
11,383 10,677
706 6.2
972
888
84 8.6
1,758
1,612
146 8.3
14,538 13,840 698 4.8
46,450 43,743 2,707 5.8
2,642 3,953 3,710 9,143
2,463 3,715 3,461 8,650
179 6.8 238 6.0 249 6.7 493 5.4
Revised March 2016
Labor Force
Employment
Unemployment Number Rate
85,700 80,169 5,531 6.5
43,165 40,706 2,459 5.7
2,109 1,981
128 6.1
5,358 4,938
420 7.8
3,175 2,921
254 8.0
27,592 25,704 1,888 6.8
11,133 10,518
615 5.5
2,142 1,990
152 7.1
12,817 11,851
966 7.5
2,758 2,575
183 6.6
603 9,344 3,283 5,030 3,673
564 8,853 3,048 4,669 3,415
39 6.5 491 5.3 235 7.2 361 7.2 258 7.0
17,659 16,569 1,090 6.2
18,521 17,534
987 5.3
12,038 11,115
923 7.7
4,241 3,975
266 6.3
2,763 2,530
233 8.4
36,364 34,541 1,823 5.0
3,207 3,003
204 6.4
3,057 2,767
290 9.5
10,260 9,767
493 4.8
11,263 10,557
706 6.3
30,147 28,503 1,644 5.5
42,691 40,638 2,053 4.8
14,945 14,116
829 5.5
2,712 2,539
173 6.4
7,177 6,732
445 6.2
11,752 10,986
766 6.5
963
883
80 8.3
1,759 1,611
148 8.4
14,349 13,655
694 4.8
46,962 43,935 3,027 6.4
2,832 3,981 3,711 8,973
2,640 3,740 3,476 8,436
192 6.8 241 6.1 235 6.3 537 6.0
Source: Georgia Department of Labor, Workforce Statistics & Economic Research
20
City Labor Force Estimates
Place of Residence - Persons 16 Years and Older
Preliminary March 2017
Labor Force
Employment
Unemployment Number Rate
Revised February 2017
Labor Force
Employment
Unemployment Number Rate
*Albany 31,395 29,379 2,016 6.4
*Alpharetta 35,717 34,326 1,391 3.9
*Athens 59,951 57,034 2,917 4.9
*Atlanta 247,422 234,484 12,938 5.2
Fulton Part 228,251 216,123 12,128 5.3
Dekalb Part
19,171 18,361
810 4.2
*Augusta 86,544 81,454 5,090 5.9
*Brookhaven
33,310 32,231 1,079 3.2
*Canton 13,652 13,138
514 3.8
Carrollton 11,573 10,827
746 6.4
*Chamblee 19,629 18,996
633 3.2
*Columbus 78,914 74,041 4,873 6.2
Dalton 14,822 13,963
859 5.8
Douglasville 16,948 16,054
894 5.3
Duluth 16,127 15,453
674 4.2
*Dunwoody 27,406 26,414
992 3.6
East Point 17,400 16,187 1,213 7.0
Gainesville 18,522 17,742
780 4.2
Hinesville 14,939 14,184
755 5.1
*Johns Creek
45,025 43,257 1,768 3.9
Kennesaw 20,006 19,169
837 4.2
LaGrange 15,186 14,404
782 5.1
Lawrenceville
14,992 14,250
742 4.9
*Macon-Bibb
69,236 65,473 3,763 5.4
*Marietta 35,014 33,556 1,458 4.2
Milton 19,572 18,794
778 4.0
Newnan 17,611 16,704
907 5.2
Peachtree City 18,479 17,817
662 3.6
P'tree Corners 23,768 22,863
905 3.8
Rome 15,544 14,674
870 5.6
*Roswell 54,405 52,321 2,084 3.8
*Sandy Springs 64,244 61,911 2,333 3.6
*Savannah 67,862 64,454 3,408 5.0
*Smyrna 35,261 33,864 1,397 4.0
Statesboro 14,183 13,258
925 6.5
Stockbridge
13,965 13,214
751 5.4
*Valdosta 25,731 24,479 1,252 4.9
*Warner Robins 32,471 30,820 1,651 5.1
Woodstock 16,312 15,685
627 3.8
31,586 29,463 2,123 6.7
35,552 34,165 1,387 3.9
59,706 56,610 3,096 5.2
247,147 233,387 13,760 5.6
228,008 215,110 12,898 5.7
19,139 18,277
862 4.5
86,480 81,088 5,392 6.2
33,188 32,082 1,106 3.3
13,582 13,079
503 3.7
11,592 10,775
817 7.0
19,529 18,909
620 3.2
79,055 73,644 5,411 6.8
14,750 13,879
871 5.9
16,917 15,981
936 5.5
16,096 15,384
712 4.4
27,342 26,292 1,050 3.8
17,319 16,112 1,207 7.0
18,423 17,654
769 4.2
14,973 14,199
774 5.2
44,902 43,055 1,847 4.1
19,936 19,082
854 4.3
15,140 14,365
775 5.1
14,969 14,186
783 5.2
69,057 65,129 3,928 5.7
34,942 33,403 1,539 4.4
19,509 18,706
803 4.1
17,561 16,623
938 5.3
18,433 17,732
701 3.8
23,697 22,761
936 3.9
15,554 14,617
937 6.0
54,167 52,076 2,091 3.9
64,122 61,621 2,501 3.9
67,528 63,906 3,622 5.4
35,150 33,711 1,439 4.1
14,101 13,159
942 6.7
13,955 13,148
807 5.8
25,671 24,292 1,379 5.4
32,373 30,661 1,712 5.3
16,202 15,614
588 3.6
Revised March 2016
Labor Force
Employment
Unemployment Number Rate
30,821 28,646 2,175 7.1
34,573 33,072 1,501 4.3
58,630 55,596 3,034 5.2
239,723 225,920 13,803 5.8
221,135 208,230 12,905 5.8
18,588 17,690
898 4.8
85,700 80,169 5,531 6.5
32,190 31,052 1,138 3.5
12,992 12,390
602 4.6
11,258 10,431
827 7.3
10,826 10,498
328 3.0
79,146 73,679 5,467 6.9
15,045 13,940 1,105 7.3
16,468 15,466 1,002 6.1
15,594 14,883
711 4.6
26,471 25,448 1,023 3.9
16,857 15,596 1,261 7.5
18,002 17,144
858 4.8
14,599 13,839
760 5.2
43,562 41,678 1,884 4.3
19,288 18,465
823 4.3
15,179 14,265
914 6.0
14,516 13,724
792 5.5
69,125 64,966 4,159 6.0
33,928 32,323 1,605 4.7
18,948 18,108
840 4.4
17,006 16,097
909 5.3
17,944 17,169
775 4.3
23,022 22,020 1,002 4.4
15,294 14,294 1,000 6.5
52,595 50,410 2,185 4.2
62,276 59,650 2,626 4.2
65,977 62,190 3,787 5.7
34,026 32,620 1,406 4.1
13,944 13,065
879 6.3
13,611 12,740
871 6.4
25,193 23,821 1,372 5.4
31,919 30,090 1,829 5.7
15,743 15,107
636 4.0
Note: City estimates were prepared in cooperation with the U.S. Department of Labor, Bureau of Labor Statistics. All cities listed have total population of 25,000 or more and an asterisks (*) designates cities with population of 50,000 or more.
Source: Georgia Department of Labor, Workforce Statistics & Economic Research
21
UNEMGPeoLrOgiaYUMneEmNploTymReAntTREateBs bYy CCoOunUtyNTIES MARCH 2017
March 2017
Dade 4.5
Catoosa 4.4
Walker
Whitfield
Murray 6.3
Fannin 5.0
Union 4.6
Towns 5.8
Rabun 5.7
4.7
5.6
Chattooga 5.0
Gordon 5.0
Floyd 5.3
Bartow 4.7
Gilmer 5.4
Pickens 4.4
Cherokee 3.8
Lumpkin 4.1
Dawson 4.0
Forsyth 3.8
White Habersham
4.3
4.9
Stephens
5.1
Hall 4.0
Banks Franklin
4.3
4.8
Jackson 3.8
Madison 4.4
Hart 4.6
Elbert 5.5
7.0% or greater 14 counties (9%)
6.0% to 6.9% 29 counties (18%)
5.0% to 5.9% 53 counties (33%)
Polk 5.3
Paulding
Cobb 4.2
Gwinnett 4.3
Barrow 4.2
Clarke 4.9
Oglethorpe 4.5
Less than 5.0% 63 counties (40%)
Haralson 5.0
Carroll 5.2
Heard 4.9
4.2 Douglas 4.9
Coweta 4.3
Fulton 4.9
DeKalb 4.9 Rockdale
Walton 4.4
Oconee 3.6
Wilkes 5.7
Lincoln 5.0
Percentages of number of counties may not total 100 due to rounding
Clayton
6.0
Fayette 4.1
Henry 4.9
Spalding 6.0
5.3 Newton 5.4
Morgan 4.7
Butts 5.0
Jasper 4.6
Putnam 6.1
Greene 5.1
Taliaferro
7.2
McDuffie
Warren 6.2
Columbia 4.2
5.4
Richmond
Hancock
5.9
7.6
Glascock
4.8
Troup 4.5
Meriwether 5.9
Pike 4.6
Lamar 5.9
Monroe 4.7
Jones 4.4
Baldwin 5.9
Washington
Jefferson 6.6
Burke 7.0
Upson
6.5
Harris 4.4
Talbot 6.2
Muscogee 6.2
Marion Chattahoochee 6.6
5.8
Taylor 7.4
Crawford 4.9
Bibb 5.4
Twiggs 7.4
Wilkinson 6.1
Macon 6.8
Peach 5.6
Houston 4.8
Bleckley 6.1
Laurens 6.0
Johnson 5.7
Emanuel 6.6
Jenkins 7.0
Screven 6.6
Treutlen 6.9
Candler 4.3
Bulloch 5.0
Effingham 4.2
7.6
Stewart 6.4
Schley 5.7
Webster 7.7
Sumter 7.2
Quitman
5.4 Randolph 7.1
Terrell 6.4
Lee 4.3
Clay 9.8
Calhoun 5.8
Dougherty 6.3
Early 5.7
Miller 4.8
Baker 6.1
Mitchell 6.4
Dooly 5.5
Pulaski 5.6
Dodge 6.1
Crisp 5.5
Wilcox 6.3
Turner 6.0
Ben Hill 7.6
Montgomery
Wheeler 8.0
6.3
Toombs 6.6
Evans 4.6
Tattnall
Telfair
5.3
6.6
Jeff Davis 5.7
Appling 5.2
Long 5.3
Bryan 4.3
Liberty 5.4
Worth 5.1
Colquitt 4.9
Irwin 7.3 Tift 4.9
Coffee 5.5
Berrien
Atkinson
5.4
4.8
Cook
4.8 Lanier
Bacon 4.6
Wayne 5.9
Pierce 4.7
Ware 4.6
Brantley 5.7
McIntosh 5.4
Glynn 4.8
Chatham 4.5
Seminole 6.8
Decatur 5.7
Grady 5.6
Thomas 5.9
Brooks 4.6
4.6
Lowndes 4.5
Clinch 5.0
Charlton 5.2
Camden 5.5
Echols
3.7
Georgia's Unemployment Rate: 4.8 %
Georgia's U(nNoet SmeasponlaollyyAmdjusetend)t Rate: 4.8% (not seasonally adjusted) Source: Georgia Department of Labor, Workforce Statistics and Economic Research
22
Georgia Unemployment Insurance Claims by County
County
March 2017 Average Average Initial Weekly Duration
Claims Benefit Weeks
County
March 2017 Average Average Initial Weekly Duration
Claims Benefit Weeks
County
March 2017 Average Average Initial Weekly Duration
Claims Benefit Weeks
Georgia
25,019........ $282.........8.4
Appling
81........ $259.........9.9
Atkinson
38........ $275.........6.0
Bacon
21........ $249.........7.3
Baker
7........ $303.........8.8
Baldwin
69........ $199.........9.6
Banks
33........ $253.........7.2
Barrow
166........ $253.........7.3
Bartow
235........ $250.........5.6
Ben Hill
42........ $247.........8.1
Berrien
28........ $251.........9.8
Bibb
330........ $211.......10.2
Bleckley
35........ $183.........8.5
Brantley
26........ $219.........9.3
Brooks
21........ $243.........9.7
Bryan
37........ $256.........9.8
Bulloch
128........ $226.........7.8
Burke
93........ $236.........8.4
Butts
44........ $243.........8.4
Calhoun
25........ $196.........7.9
Camden
54........ $212.........9.5
Candler
27........ $210.........6.8
Carroll
218........ $240.........8.4
Catoosa
145........ $260.........6.7
Charlton
6........ $228.......10.8
Chatham
427........ $233.........9.4
Chattahoochee 11........$172.......10.6
Chattooga
63........ $242.........8.4
Cherokee
341........ $277.........9.5
Clarke
236........ $218.........6.8
Clay
6........ $241.........7.3
Clayton
871........ $236.......10.3
Clinch
10........ $262.........7.5
Cobb
1,352........ $265.......10.3
Coffee
160........ $241.........7.0
Colquitt
153........ $218.........8.9
Columbia
183........ $257.........8.9
Cook
30........ $238.........8.1
Coweta
296........ $247.........8.9
Crawford
18........ $203.........8.7
Crisp
43........ $195.........8.9
Dade
20........ $242.........5.0
Dawson
21........ $269.........9.6
Decatur
57........ $232.......10.3
DeKalb
1,725........ $249.......10.4
Dodge
30........ $222.........9.0
Dooly
17........ $215.........6.9
Dougherty
345........ $199.........8.6
Douglas
321........ $255.........9.7
Early
9........$217....... 11.4
Echols
5........ $224.........7.2
Effingham
67........ $253.........9.1
Elbert Emanuel Evans Fannin Fayette Floyd Forsyth Franklin Fulton Gilmer Glascock Glynn Gordon Grady Greene Gwinnett Habersham Hall Hancock Haralson Harris Hart Heard Henry Houston Irwin Jackson Jasper Jeff Davis Jefferson Jenkins Johnson Jones Lamar Lanier Laurens Lee Liberty Lincoln Long Lowndes Lumpkin Macon Madison Marion McDuffie McIntosh Meriwether Miller Mitchell Monroe Montgomery Morgan Murray
36........ $202.........6.3 81........ $204.........7.0 15........ $213.........7.5 63........ $214.........8.8 162........ $265.........9.6 267........ $250.........6.5 206........ $278.........9.9 39........ $233.........5.6 2,468........ $243.......10.6 71........ $255.........8.1
6........ $199.........8.8 160........ $219.........6.6 255........ $254.........5.6
60........ $217.........8.2 62........ $221.........7.1 1,557........ $265.......10.2 192........ $236.........6.0 420........ $250.........7.5 21........ $195.........7.7 41........ $249.........7.3 63........ $254.........7.0 46........ $214.........6.3 29........ $229.........7.2 452........ $251.........9.9 214........ $231.........9.1 16........ $221.........9.7 77........ $259.........7.6 29........ $233.........8.9 27........ $235.........8.5 51........ $215.........8.4 22........ $233.........6.9 24........ $205.........9.4 39........ $251.........9.5 62........ $243.........8.0 11........ $169.........7.7 113........ $175.........8.9 55........ $234.........7.8 96........ $215.......10.7 19........ $269.........7.6 23........$238....... 11.2 184........ $223.........8.6 31........ $230.........8.9 32........ $233.........8.8 34........ $245.........6.1 28........ $237.........7.7 75........ $221.........7.3 33........ $238.........7.1 52........ $204.........7.1 14........ $179.........9.4 121........ $193.........7.0 46........ $233.........9.7 26........ $207.........7.2 23........ $219.........8.0 393........ $261.........5.8
Muscogee Newton Oconee Oglethorpe Paulding Peach Pickens Pierce Pike Polk Pulaski Putnam Quitman Rabun Randolph Richmond Rockdale Schley Screven Seminole Spalding Stephens Stewart Sumter Talbot Taliaferro Tattnall Taylor Telfair Terrell Thomas Tift Toombs Towns Treutlen Troup Turner Twiggs Union Upson Walker Walton Ware Warren Washington Wayne Webster Wheeler White Whitfield Wilcox Wilkes Wilkinson Worth
673........ $219.........8.3 283........ $242.........9.6
35........ $273.........6.4 17........ $266.........6.7 254........ $271.........9.3 26........ $225.........7.7 44........ $250.........8.6 29........ $254.........7.0 37........ $253.........7.6 157........ $277.........6.5 14........ $246.........8.4 34........ $237.........9.0
0............ $0.......15.0 15........ $241.........5.3 20........ $206.........8.8 566........ $217.........9.2 221........ $247.......10.0 11........ $283.........9.5 50........ $228.........6.7
9........ $197.......10.6 181........ $228.........8.6
51........ $235.........5.4 20........ $223.........8.7 110........ $211.........9.8 38........ $245.........6.2 12........ $199.........7.1 39........ $212.........8.8 22........ $229.........8.6 20........ $183.........8.3 38........ $196.........7.5 99........ $224.........8.9 73........ $221.........9.0 82........ $222.........6.9 16........ $226.........9.5 20........ $232.........9.1 197........ $227.........7.3 17........ $224.........9.7 20........$237....... 11.9 45........ $247.........8.8 83........ $236.........7.9 790........ $262.........4.3 154........ $250.........8.6 70........ $222.........9.0 24........ $245.........7.7 43........ $213.......10.1 51........ $252.......10.5
8........ $200.........9.8 10........ $229.........7.9 84........ $219.........8.3 871........ $264.........5.4 14........$243....... 11.3 55........ $213.........7.0 23........ $234.........9.1 38........ $214.........7.9
Note: Initial claims include intrastate initial and additional claims, as well as agent state initial and additional claims for regular UI only. Average duration of benefits is represented in weeks.
Data does not include state or federal extended benefits.
Source: Georgia Department of Labor, Workforce Statistics and Economic Research
23
Mark Butler, Commissioner 148 Andrew Young International Boulevard, N.E. Atlanta, Georgia 30303-1751
Return Service Requested