- Collection:
- Georgia Government Publications
- Title:
- Dimensions: measuring Georgia's workforce, Vol. 42, no. 7 (July 2016)
- Creator:
- Georgia. Department of Labor
- Contributor to Resource:
- Georgia. Workforce Information and Analysis
- Publisher:
- Atlanta, Ga. : Georgia Dept. of Labor, 2016-07
- Date of Original:
- 2016-07
- Subject:
- Labor market--Georgia--Statistics
Wages--Georgia--Statistics
Hours of labor--Georgia--Statistics - Location:
- United States, Georgia, 32.75042, -83.50018
- Medium:
- state government records
- Type:
- Text
- Format:
- application/pdf
- External Identifiers:
- Call Number GA L200.E46 P1 T7 42/7
- Metadata URL:
- https://dlg.galileo.usg.edu/id:dlg_ggpd_i-ga-bl200-pe46-bp1-bt7-b42-s7-belec-p-btext
- Digital Object URL:
- https://dlg.galileo.usg.edu/do:dlg_ggpd_i-ga-bl200-pe46-bp1-bt7-b42-s7-belec-p-btext
- Language:
- eng
- Holding Institution:
- University of Georgia. Map and Government Information Library
- Rights:
-

Jackson Madison Elbert
Polk
Cobb
Gwinnett Barrow Clarke
D I M E N S I O Paulding
Haralson Douglas
DeKalb Rock-
Walton
Oconee Oglethorpe
Wilkes
Lincoln
EdgefieSlCd,
Carroll
Fulton Clayton
dale Newton
Morgan Greene Taliaferro
Columbia
Fayette Henry
McDuffie Warren
Heard
Coweta
Spalding Butts Jasper Putnam Hancock
Glascock
Richmond
AikenSC,
N
S
Russell, AL
Measuring Georgia's Workforce Troup Meriwether Pike Lamar Monroe Upson
Jones
Baldwin
Jefferson Washington
Burke
Harris
Talbot
July 2016 Data
Muscogee
Bibb Crawford
Taylor
Peach
Wilkinson Twiggs
Johnson
Jenkins Emanuel
Screven
Volume XLII, Number 7
July 2016 Employment Situation Marion Chattahoo-
Houston Bleckley Macon
Laurens
Treutlen
chee
In millions
CandlGereorgBuialloEcmh ploEyfmfinegnhatm
(Seasonally Adjusted)
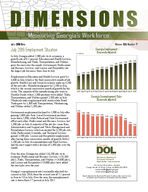
In July, Georgia aSdcdhleedy 2,300 jobDsotoolyits Peucloasnkoi myD,oadge groSwtewtharrtateWoefb0st.e1r perScuemntet.r Education and Health Services,
Montgomery
Wheeler
Toombs
Evans
Bryan
QuMgitrmeawannutfhaectmuroinstgo, vanerdtThreamdeo,nTthra.nGsCporovisreptrantimoneWn,italc,noPxdroUfteislistiioensTealflair and RBaundsoinlpehss STeerrrvelilces, aLened Leisure aTunrdneHr ospitaBlietnyHsilal w
Jeff Davis
the largest job decreases from June to July.
Tattnall
Libe4r.t3y5
Appling 4.31
4.32
4L.3o3ng 4.33
Chatham 4.36 4.37 4.38
4.38
4.39
Clay
Calhoun
Dougherty Worth
Irwin
Coffee 4.27 B4a.2c8on 4.28
Employment in Education and Health SeTirfvt ices grew by
Wayne
McIntosh
4,6Ea0r0ly in July, wBahkeicr h is the third growth. Health CareMaintcdheSllocial of the Mneillwer jobs. Manufacturing
CAcooslqnsusisietttcauntciveemmadoBenerturhiepno4f,j5o0Ab0tkinson grew by 2C,o5o0k0 in JuLlayn,ier
Pierce
Ware
Brantley
Glynn
which is the second consecutive month of growth for the sDeucSrteoambr.ilneTolhGeDeoemcoadtausjrowrihtyeGroeraf2dty,h3e0m0ThpaonomusaiftsaioctnuBsrriownoegksrjeoabdsdLwoewdenr.edTeirsnade, Transportation, and Utilities gained 2,500 jobs in July.Echols
ClincJhul-15 Aug-15 Sep-1C5hOacrtl-t1o5nNov-15 DeCc-a15mJdane-1n6 Feb-16 Mar-16 Apr-16 May-16 Jun-16
Georgia Unemployment Rate
Jul-16
Wholesale trade employment held steady while Retail
(Seasonally Adjusted)
Trade grew by 1,300 and Transportation, Warehousing,
and Utilities added 1,200 jobs.
Government employment declined by 1,900 in July after gaining 1,600 jobs June. Local Government positions were down 1,900, while Federal and State Government offset each other. Professional and Business Services lost 1,300 jobs in July. A majority of the job loss came from Administrative and Support and Waste Management and Remediation Services which accounted for 3,700 job cuts, while Professional, Scientific, and Technical Services gained 2,500 jobs. Leisure and Hospitality employment, after having three consecutive months of growth, fell by 1,200 jobs in July. Accommodation and Food Services had the most impact with a decline of 1,400 jobs over the month.
5.7%
5.6% 5.6%
5.5% 5.5% 5.5%
5.5% 5.5%
5.4% 5.4%
5.3%
5.1% 5.0%
Jul-15 Aug-15 Sep-15 Oct-15 Nov-15 Dec-15 Jan-16 Feb-16 Mar-16 Apr-16 May-16 Jun-16 Jul-16
Over the year, Georgia has added 116,200 jobs to its economy. Professional and Business Services (+32,200 jobs); Trade, Transportation, and Utilities (+24,800 jobs); and Leisure and Hospitality (+19,800 jobs) have added the most jobs over the year.
Georgia's unemployment rate (seasonally adjusted) decreased in July 2016, from the revised rate of 5.1 percent in June to 5.0 in July. Over the year, the unemployment rate is down from 5.7 percent in July 2015.
Workforce Statistics & Economic Research Mark Butler, Commissioner
For more information, contact Corey Smith or Evan Cross at (404) 232-3875
corey.smith@gdol.ga.gov evan.cross@gdol.ga.gov
Equal Opportunity Employer/ProgramAuxiliary Aids and Services Available upon Request to Individuals with Disabilities
GEORGIA Nonfarm Employment
(In thousands)
(Seasonally Adjusted)
Preliminary
Revised
JUL 2016 JUN 2016
Revised JUL 2015
Change in Jobs from JUN 2016
Net %
Change in Jobs from JUL 2015
Net %
Total Nonfarm
4,386.4
4,384.1
4,270.2
2.3 0.1
116.2 2.7
Total Private
3,701.6
3,697.4
3,590.1
4.2 0.1
111.5 3.1
Goods Producing
574.8
572.5
554.4
2.3 0.4
20.4 3.7
Service-Providing
3,811.6
3,811.6
3,715.8
0.0 0.0
95.8 2.6
Private Service-Providing
3,126.8
3,124.9
3,035.7
1.9 0.1
91.1 3.0
Mining and Logging
8.5
8.6
9.1
-0.1 -1.2
-0.6 -6.6
Mining, Logging and Construction
187.2
187.4
175.4
-0.2 -0.1
11.8 6.7
Construction
178.7
178.8
166.3
-0.1 -0.1
12.4 7.5
Manufacturing
387.6
385.1
379.0
2.5 0.6
8.6 2.3
Durable Goods
193.3
191.0
183.7
2.3 1.2
9.6 5.2
Non-Durable Goods
194.3
194.1
195.3
0.2 0.1
-1.0 -0.5
Trade, Transportation, and Utilities
930.4
927.9
905.6
2.5 0.3
24.8 2.7
Wholesale Trade
222.8
222.8
217.1
0.0 0.0
5.7 2.6
Retail Trade
503.0
501.7
484.9
1.3 0.3
18.1 3.7
Transportation, Warehousing, and Utilities
204.6
203.4
203.6
1.2 0.6
1.0 0.5
Information
105.2
106.1
111.1
-0.9 -0.8
-5.9 -5.3
Financial Activities
239.9
240.7
235.4
-0.8 -0.3
4.5 1.9
Finance and Insurance
178.2
179.9
172.5
-1.7 -0.9
5.7 3.3
Real Estate and Rental and Leasing
61.7
60.8
62.9
0.9 1.5
-1.2 -1.9
Professional and Business Services
670.0
671.3
637.8
-1.3 -0.2
32.2 5.0
Professional, Scientific, and Technical Services
271.8
269.3
261.9
2.5 0.9
9.9 3.8
Management of Companies and Enterprises
65.9
66.0
66.4
-0.1 -0.2
-0.5 -0.8
Admin and Support, Waste Mngmnt and Remediation
332.3
336.0
309.5
-3.7 -1.1
22.8 7.4
Education and Health Services
556.2
551.6
540.4
4.6 0.8
15.8 2.9
Educational Services
71.0
70.9
69.8
0.1 0.1
1.2 1.7
Health Care and Social Assistance
485.2
480.7
470.6
4.5 0.9
14.6 3.1
Leisure and Hospitality
468.9
470.1
449.1
-1.2 -0.3
19.8 4.4
Arts, Entertainment, and Recreation
54.5
54.3
46.6
0.2 0.4
7.9 17.0
Accommodation and Food Services
414.4
415.8
402.5
-1.4 -0.3
11.9 3.0
Other Services
156.2
157.2
156.3
-1.0 -0.6
-0.1 -0.1
Government
684.8
686.7
680.1
-1.9 -0.3
4.7 0.7
Federal Government
99.9
99.5
98.9
0.4 0.4
1.0 1.0
State Government
171.3
171.7
172.5
-0.4 -0.2
-1.2 -0.7
Local Government
413.6
415.5
408.7
-1.9 -0.5
4.9 1.2
Note: These seasonally adjusted estimates were prepared in cooperation with the U.S. Department of Labor, Bureau of Labor Statistics, based upon monthly reports submitted by selected
employers throughout Georgia. The estimates include all full- and part-time wage and salary workers who were employed during or received pay for any part of the pay period that includes the twelfth of the month. Proprietors, domestic workers, self-employed persons, unpaid family workers and personnel of the armed forces are excluded. Estimates based on 2015 benchmark.
Source: Georgia Department of Labor, Workforce Statistics & Economic Research
Georgia Department of Labor, Mark Butler, Commissioner Equal Opportunity Employer/Program Auxiliary Aids and Services Available Upon Request to Individuals With Disabilities
2
GEORGIA Nonfarm Employment
(In thousands)
(Not Seasonally Adjusted)
Preliminary
Revised
Revised
JUL 2016 JUN 2016 JUL 2015
Change in Jobs from JUN 2016
Net %
Change in Jobs from JUL 2015
Net %
Total Nonfarm
4,375.8
4,386.6
4,248.6
-10.8 -0.3
127.2 3.0
Total Private
3,714.4
3,707.4
3,597.1
7.0 0.2
117.3 3.3
Goods Producing
576.5
574.3
556.5
2.2 0.4
20.0 3.6
Service-Providing
3,799.3
3,812.3
3,692.1
-13.0 -0.3
107.2 2.9
Private Service-Providing
3,137.9
3,133.1
3,040.6
4.8 0.2
97.3 3.2
Mining and Logging
8.5
8.6
9.1
-0.1 -1.2
-0.6 -6.6
Mining, Logging and Construction
189.1
188.5
177.0
0.6 0.3
12.1 6.8
Construction
180.6
179.9
167.9
0.7 0.4
12.7 7.6
Construction of Buildings
39.8
39.4
36.9
0.4 1.0
2.9 7.9
Heavy and Civil Engineering Construction
28.1
27.8
23.4
0.3 1.1
4.7 20.1
Specialty Trade Contractors
112.7
112.7
107.6
0.0 0.0
5.1 4.7
Manufacturing
387.4
385.8
379.5
1.6 0.4
7.9 2.1
Durable Goods
193.1
191.8
184.0
1.3 0.7
9.1 5.0
Computer, Electrical Equip and Appliance Mfg
22.4
22.4
23.0
0.0 0.0
-0.6 -2.6
Transportation Equipment Manufacturing
52.2
51.9
50.4
0.3 0.6
1.8 3.6
Non-Durable Goods
194.3
194.0
195.5
0.3 0.2
-1.2 -0.6
Food Manufacturing
64.8
64.5
64.6
0.3 0.5
0.2 0.3
Textile Mills
19.6
19.9
19.7
-0.3 -1.5
-0.1 -0.5
Textile Product Mills
28.7
28.5
28.5
0.2 0.7
0.2 0.7
Trade, Transportation, and Utilities
928.5
926.7
903.2
1.8 0.2
25.3 2.8
Wholesale Trade
222.6
222.5
217.5
0.1 0.0
5.1 2.3
Merchant Wholesalers, Durable Goods
109.8
108.9
105.7
0.9 0.8
4.1 3.9
Merchant Wholesalers, Nondurable Goods
61.4
60.8
62.1
0.6 1.0
-0.7 -1.1
Wholesale Electronic Markets and Agents and Brokers 51.4
52.8
49.7
-1.4 -2.7
1.7 3.4
Retail Trade
501.1
499.7
481.8
1.4 0.3
19.3 4.0
Food and Beverage Stores
91.6
90.9
90.4
0.7 0.8
1.2 1.3
General Merchandise Stores
109.7
109.3
106.8
0.4 0.4
2.9 2.7
Miscellaneous Store Retailers
20.9
21.0
20.6
-0.1 -0.5
0.3 1.5
Transportation, Warehousing, and Utilities
204.8
204.5
203.9
0.3 0.2
0.9 0.4
Utilities
20.2
20.1
20.1
0.1 0.5
0.1 0.5
Transportation and Warehousing
184.6
184.4
183.8
0.2 0.1
0.8 0.4
Air Transportation
39.7
39.8
40.6
-0.1 -0.3
-0.9 -2.2
Truck Transportation
48.7
49.4
50.5
-0.7 -1.4
-1.8 -3.6
Couriers and Messengers
21.2
21.3
20.6
-0.1 -0.5
0.6 2.9
Warehousing and Storage
34.0
33.5
32.5
0.5 1.5
1.5 4.6
Information
105.5
105.7
111.6
-0.2 -0.2
-6.1 -5.5
Telecommunications
46.5
46.2
44.9
0.3 0.7
1.6 3.6
Wired Telecommunications Carriers
30.3
30.3
30.1
0.0 0.0
0.2 0.7
Wireless Telecommunications Carriers
7.5
7.5
7.3
0.0 0.0
0.2 2.7
Internet Service Providers, Search Portals, and DP
8.3
8.5
8.2
-0.2 -2.4
0.1 1.2
Financial Activities
240.6
240.2
236.0
0.4 0.2
4.6 2.0
Finance and Insurance
178.7
179.4
173.0
-0.7 -0.4
5.7 3.3
Insurance Carriers and Related Activities
84.2
84.3
80.8
-0.1 -0.1
3.4 4.2
Real Estate and Rental and Leasing
61.9
60.8
63.0
1.1 1.8
-1.1 -1.8
Professional and Business Services
675.3
673.0
640.7
2.3 0.3
34.6 5.4
Professional, Scientific, and Technical Services
272.7
268.7
261.4
4.0 1.5
11.3 4.3
Accounting, Tax Prep, and Bookkeeping Services
44.5
43.4
40.0
1.1 2.5
4.5 11.3
Architectural, Engineering, and Related Services
44.1
43.7
42.7
0.4 0.9
1.4 3.3
Computer Systems Design and Related Services
68.1
66.6
65.2
1.5 2.3
2.9 4.5
Management and Technical Consulting Services
39.5
39.4
39.6
0.1 0.3
-0.1 -0.3
Management of Companies and Enterprises
66.4
66.4
66.3
0.0 0.0
0.1 0.2
Admin and Support, Waste Mngmnt and Remediation
336.2
337.9
313.0
-1.7 -0.5
23.2 7.4
Employment Services
167.7
170.8
148.3
-3.1 -1.8
19.4 13.1
Education and Health Services
549.4
545.0
533.0
4.4 0.8
16.4 3.1
Educational Services
67.4
68.0
65.7
-0.6 -0.9
1.7 2.6
Colleges, Universities, and Professional Schools
30.3
30.8
29.8
-0.5 -1.6
0.5 1.7
Health Care and Social Assistance
482.0
477.0
467.3
5.0 1.1
14.7 3.2
Ambulatory Health Care Services
185.9
182.7
182.8
3.2 1.8
3.1 1.7
Hospitals
171.0
170.4
163.5
0.6 0.4
7.5 4.6
Nursing and Residential Care Facilities
60.8
60.5
59.6
0.3 0.5
1.2 2.0
Social Assistance
64.3
63.4
61.4
0.9 1.4
2.9 4.7
Leisure and Hospitality
480.7
483.4
457.4
-2.7 -0.6
23.3 5.1
Arts, Entertainment, and Recreation
60.5
60.6
51.6
-0.1 -0.2
8.9 17.3
Amusement, Gambling, and Recreation Industries
44.0
44.5
39.5
-0.5 -1.1
4.5 11.4
Accommodation and Food Services
420.2
422.8
405.8
-2.6 -0.6
14.4 3.6
Accommodation
44.8
44.9
45.6
-0.1 -0.2
-0.8 -1.8
Food Services and Drinking Places
375.4
377.9
360.2
-2.5 -0.7
15.2 4.2
Other Services
157.9
159.1
158.7
-1.2 -0.8
-0.8 -0.5
Repair and Maintenance
37.8
38.1
37.8
-0.3 -0.8
0.0 0.0
Personal and Laundry Services
37.0
37.3
36.6
-0.3 -0.8
0.4 1.1
Religious, Grantmaking, Civic, Professional, and Similar
83.1
83.7
84.3
-0.6 -0.7
-1.2 -1.4
Government
661.4
679.2
651.5
-17.8 -2.6
9.9 1.5
Federal Government
99.6
99.5
98.9
0.1 0.1
0.7 0.7
Department of Defense
41.4
41.4
40.6
0.0 0.0
0.8 2.0
State Government
165.0
167.3
164.3
-2.3 -1.4
0.7 0.4
State Government Educational Services
94.2
95.5
92.4
-1.3 -1.4
1.8 2.0
Local Government
396.8
412.4
388.3
-15.6 -3.8
8.5 2.2
Local Government Educational Services
223.0
240.1
217.1
-17.1 -7.1
5.9 2.7
Note: These not seasonally adjusted estimates were prepared in cooperation with the U.S. Department of Labor, Bureau of Labor Statistics, based upon monthly reports submitted by selected
employers throughout Georgia. The estimates include all full- and part-time wage and salary workers who were employed during or received pay for any part of the pay period that includes the twelfth
of the month. Proprietors, domestic workers, self-employed persons, unpaid family workers and personnel of the armed forces are excluded. Estimates based on 2015 benchmark.
Source: Georgia Department of Labor, Workforce Statistics & Economic Research
3
ALBANY MSA Nonfarm Employment
(In thousands)
(Not Seasonally Adjusted)
Preliminary
Revised
Revised
JUL 2016 JUN 2016 JUL 2015
Change in Jobs from JUN 2016
Net %
Change in Jobs from JUL 2015
Net %
Total Nonfarm Total Private Goods Producing Service-Providing Private Service-Providing Manufacturing Trade, Transportation, and Utilities
Retail Trade Government
Federal Government State Government Local Government
61.7
62.0
60.3
-0.3 -0.5
49.2
49.1
47.9
0.1 0.2
7.4
7.3
6.9
0.1 1.4
54.3
54.7
53.4
-0.4 -0.7
41.8
41.8
41.0
0.0 0.0
4.3
4.3
4.2
0.0 0.0
12.0
12.0
11.9
0.0 0.0
7.2
7.2
6.9
0.0 0.0
12.5
12.9
12.4
-0.4 -3.1
2.6
2.7
2.7
-0.1 -3.7
2.7
2.8
2.8
-0.1 -3.6
7.2
7.4
6.9
-0.2 -2.7
1.4 2.3 1.3 2.7 0.5 7.3 0.9 1.7 0.8 2.0 0.1 2.4 0.1 0.8 0.3 4.4 0.1 0.8 -0.1 -3.7 -0.1 -3.6 0.3 4.4
Note: These not seasonally adjusted estimates were prepared in cooperation with the U.S. Department of Labor, Bureau of Labor Statistics, based upon monthly reports submitted by
selected employers in the Albany Metropolitan Statistical Area, which includes Baker, Dougherty, Lee, Terrell and Worth counties. The estimates include all full- and part-time wage and salary workers who were employed during or received pay for any part of the pay period that includes the twelfth of the month. Proprietors, domestic workers, self-employed persons, unpaid familyworkers and personnel of the armed forces are excluded. Estimates based on 2015 benchmark.
ATHENS-CLARKE MSA Nonfarm Employment
(In thousands)
(Not Seasonally Adjusted)
Preliminary
Revised
Revised
JUL 2016 JUN 2016 JUL 2015
Change in Jobs from JUN 2016
Net %
Change in Jobs from JUL 2015
Net %
Total Nonfarm Total Private Goods Producing Service-Providing Private Service-Providing Trade, Transportation, and Utilities
Retail Trade Professional and Business Services Leisure and Hospitality Government
Federal Government State Government Local Government
93.6
94.1
90.3
-0.5 -0.5
64.7
64.3
62.1
0.4 0.6
9.2
9.2
9.2
0.0 0.0
84.4
84.9
81.1
-0.5 -0.6
55.5
55.1
52.9
0.4 0.7
16.2
16.1
15.2
0.1 0.6
10.3
10.2
9.7
0.1 1.0
8.0
8.0
7.4
0.0 0.0
10.8
10.9
9.7
-0.1 -0.9
28.9
29.8
28.2
-0.9 -3.0
1.1
1.1
1.1
0.0 0.0
20.8
21.0
19.9
-0.2 -1.0
7.0
7.7
7.2
-0.7 -9.1
3.3 3.7 2.6 4.2 0.0 0.0 3.3 4.1 2.6 4.9 1.0 6.6 0.6 6.2 0.6 8.1 1.1 11.3 0.7 2.5 0.0 0.0 0.9 4.5 -0.2 -2.8
Note: These not seasonally adjusted estimates were prepared in cooperation with the U.S. Department of Labor, Bureau of Labor Statistics, based upon monthly reports submitted by selected
employers in the Athens - Clarke County Metropolitan Statistical Area, which includes Clarke, Madison, Oconee and Oglethorpe counties. The estimates include all full- and part-time wage and salary workers who were employed during or received pay for any part of the pay period that includes the twelfth of the month. Proprietors, domestic workers, self-employed persons, unpaid family workers and personnel of the armed forces are excluded. Estimates based on 2015 benchmark.
Source: Georgia Department of Labor, Workforce Statistics & Economic Research
4
ATLANTA MSA Nonfarm Employment
(In thousands)
(Not Seasonally Adjusted)
Preliminary JUL 2016
Revised JUN 2016
Revised JUL 2015
Change in Jobs from JUN 2016
Net %
Change in Jobs from JUL 2015
Net %
Total Nonfarm
2,656.2
2,656.7
2,581.4
-0.5 0.0
74.8 2.9
Total Private
2,343.1
2,334.0
2,272.7
9.1 0.4
70.4 3.1
Goods Producing
281.5
279.9
268.1
1.6 0.6
13.4 5.0
Service-Providing
2,374.7
2,376.8
2,313.3
-2.1 -0.1
61.4 2.7
Private Service-Providing
2,061.6
2,054.1
2,004.6
7.5 0.4
57.0 2.8
Mining and Logging
1.4
1.4
1.4
0.0 0.0
0.0 0.0
Mining, Logging and Construction
118.2
117.5
110.4
0.7 0.6
7.8 7.1
Construction
116.8
116.1
109.0
0.7 0.6
7.8 7.2
Construction of Buildings
23.1
22.6
23.3
0.5 2.2
-0.2 -0.9
Specialty Trade Contractors
74.4
74.4
70.9
0.0 0.0
3.5 4.9
Manufacturing
163.3
162.4
157.7
0.9 0.6
5.6 3.6
Durable Goods
85.8
85.2
81.2
0.6 0.7
4.6 5.7
Transportation Equipment Manufacturing
14.4
14.4
14.8
0.0 0.0
-0.4 -2.7
Non-Durable Goods
77.5
77.2
76.5
0.3 0.4
1.0 1.3
Food Manufacturing
25.1
25.0
24.6
0.1 0.4
0.5 2.0
Trade, Transportation, and Utilities
595.5
593.7
577.8
1.8 0.3
17.7 3.1
Wholesale Trade
163.3
163.5
157.8
-0.2 -0.1
5.5 3.5
Merchant Wholesalers, Durable Goods
80.0
79.4
77.1
0.6 0.8
2.9 3.8
Merchant Wholesalers, Nondurable Goods
40.9
40.3
40.6
0.6 1.5
0.3 0.7
Wholesale Electronic Markets and Agents and Brokers
42.4
43.8
40.1
-1.4 -3.2
2.3 5.7
Retail Trade
292.3
290.2
280.3
2.1 0.7
12.0 4.3
Food and Beverage Stores
57.0
56.5
55.5
0.5 0.9
1.5 2.7
General Merchandise Stores
59.5
59.2
58.4
0.3 0.5
1.1 1.9
Miscellaneous Store Retailers
13.6
13.6
13.4
0.0 0.0
0.2 1.5
Transportation, Warehousing, and Utilities
139.9
140.0
139.7
-0.1 -0.1
0.2 0.1
Utilities
10.3
10.3
10.4
0.0 0.0
-0.1 -1.0
Transportation and Warehousing
129.6
129.7
129.3
-0.1 -0.1
0.3 0.2
Air Transportation
39.2
39.4
40.3
-0.2 -0.5
-1.1 -2.7
Truck Transportation
31.6
31.8
31.5
-0.2 -0.6
0.1 0.3
Couriers and Messengers
16.5
16.5
16.1
0.0 0.0
0.4 2.5
Information
88.8
88.3
94.5
0.5 0.6
-5.7 -6.0
Telecommunications
37.9
38.0
38.2
-0.1 -0.3
-0.3 -0.8
Wired Telecommunications Carriers
25.7
25.6
25.5
0.1 0.4
0.2 0.8
Wireless Telecommunications Carriers
6.6
6.6
6.4
0.0 0.0
0.2 3.1
Internet Service Providers, Search Portals, and DP
7.5
7.6
7.6
-0.1 -1.3
-0.1 -1.3
Financial Activities
166.3
165.0
163.0
1.3 0.8
3.3 2.0
Finance and Insurance
121.5
121.2
117.7
0.3 0.3
3.8 3.2
Insurance Carriers and Related Activities
59.3
59.0
56.4
0.3 0.5
2.9 5.1
Real Estate and Rental and Leasing
44.8
43.8
45.3
1.0 2.3
-0.5 -1.1
Professional and Business Services
497.5
495.5
480.3
2.0 0.4
17.2 3.6
Professional, Scientific, and Technical Services
212.3
209.0
208.4
3.3 1.6
3.9 1.9
Accounting, Tax Prep, and Bookkeeping Services
28.5
28.1
28.2
0.4 1.4
0.3 1.1
Architectural, Engineering, and Related Services
30.6
30.3
29.5
0.3 1.0
1.1 3.7
Computer Systems Design and Related Services
59.5
58.1
57.3
1.4 2.4
2.2 3.8
Management and Technical Consulting Services
34.6
34.4
35.5
0.2 0.6
-0.9 -2.5
Management of Companies and Enterprises
52.7
52.6
53.8
0.1 0.2
-1.1 -2.0
Admin and Support, Waste Mngmnt and Remediation
232.5
233.9
218.1
-1.4 -0.6
14.4 6.6
Employment Services
113.5
114.8
103.9
-1.3 -1.1
9.6 9.2
Education and Health Services
325.0
321.9
314.8
3.1 1.0
10.2 3.2
Educational Services
49.0
49.0
48.2
0.0 0.0
0.8 1.7
Health Care and Social Assistance
276.0
272.9
266.6
3.1 1.1
9.4 3.5
Ambulatory Health Care Services
109.9
108.0
107.4
1.9 1.8
2.5 2.3
Hospitals
98.0
97.8
92.2
0.2 0.2
5.8 6.3
Social Assistance
40.2
40.0
38.6
0.2 0.5
1.6 4.2
Leisure and Hospitality
291.5
292.6
276.0
-1.1 -0.4
15.5 5.6
Arts, Entertainment, and Recreation
42.1
42.1
36.1
0.0 0.0
6.0 16.6
Accommodation and Food Services
249.4
250.5
239.9
-1.1 -0.4
9.5 4.0
Accommodation
24.5
24.4
24.9
0.1 0.4
-0.4 -1.6
Food Services and Drinking Places
224.9
226.1
215.0
-1.2 -0.5
9.9 4.6
Other Services
97.0
97.1
98.2
-0.1 -0.1
-1.2 -1.2
Repair and Maintenance
20.9
21.4
22.3
-0.5 -2.3
-1.4 -6.3
Personal and Laundry Services
26.1
25.9
25.7
0.2 0.8
0.4 1.6
Government
313.1
322.7
308.7
-9.6 -3.0
4.4 1.4
Federal Government
46.1
46.0
45.4
0.1 0.2
0.7 1.5
State Government
68.6
69.6
69.0
-1.0 -1.4
-0.4 -0.6
Local Government
198.4
207.1
194.3
-8.7 -4.2
4.1 2.1
Note: These not seasonally adjusted estimates were prepared in cooperation with the U.S. Department of Labor, Bureau of Labor Statistics, based upon monthly reports submitted by
selected employers in the Atlanta Metropolitan Statistical Area, which includes Barrow, Bartow, Butts, Carroll, Cherokee, Clayton, Cobb, Coweta, Dawson, DeKalb, Douglas, Fayette, Forsyth,
Fulton, Gwinnett, Haralson, Heard, Henry, Jasper, Lamar, Meriwether, Morgan, Newton, Paulding, Pickens, Pike, Rockdale, Spalding and Walton counties. The estimates include all full- and
part-time wage and salary workers who were employed during or received pay for any part of the pay period that includes the twelfth of the month. Proprietors, domestic workers, self-employed
persons, unpaid family workers and personnel of the armed forces are excluded. Estimates based on 2015 benchmark.
Source: Georgia Department of Labor, Workforce Statistics & Economic Research
5
AUGUSTA-RICHMOND MSA Nonfarm Employment
(In thousands)
(Not Seasonally Adjusted)
Preliminary
Revised
Revised
JUL 2016 JUN 2016 JUL 2015
Change in Jobs from JUN 2016
Net %
Change in Jobs from JUL 2015
Net %
Total Nonfarm Total Private Goods Producing Service-Providing Private Service-Providing Mining, Logging and Construction Manufacturing Trade, Transportation, and Utilities
Wholesale Trade Retail Trade Transportation, Warehousing, and Utilities Information Financial Activities Professional and Business Services Education and Health Services Leisure and Hospitality Other Services Government Federal Government State Government Local Government
229.6 183.3
32.5 197.1 150.8
12.1 20.4 40.1
6.3 26.4
7.4 2.8 7.7 34.6 32.6 24.7 8.3 46.3 9.3 15.7 21.3
230.9 183.7
32.5 198.4 151.2
11.9 20.6 40.3
6.3 26.6
7.4 2.9 7.7 34.5 32.7 24.7 8.4 47.2 9.3 15.8 22.1
225.5 180.7
32.4 193.1 148.3
11.9 20.5 40.2
6.1 26.5
7.6 3.0 7.6 33.5 31.8 23.9 8.3 44.8 9.2 15.3 20.3
-1.3 -0.6 -0.4 -0.2 0.0 0.0 -1.3 -0.7 -0.4 -0.3 0.2 1.7 -0.2 -1.0 -0.2 -0.5 0.0 0.0 -0.2 -0.8 0.0 0.0 -0.1 -3.5 0.0 0.0 0.1 0.3 -0.1 -0.3 0.0 0.0 -0.1 -1.2 -0.9 -1.9 0.0 0.0 -0.1 -0.6 -0.8 -3.6
4.1 1.8 2.6 1.4 0.1 0.3 4.0 2.1 2.5 1.7 0.2 1.7 -0.1 -0.5 -0.1 -0.3 0.2 3.3 -0.1 -0.4 -0.2 -2.6 -0.2 -6.7 0.1 1.3 1.1 3.3 0.8 2.5 0.8 3.4 0.0 0.0 1.5 3.4 0.1 1.1 0.4 2.6 1.0 4.9
Note: These not seasonally adjusted estimates were prepared in cooperation with the U.S. Department of Labor, Bureau of Labor Statistics, based upon monthly reports submitted by
selected employers in the Augusta - Richmond County Metropolitan Statistical Area, which includes Burke, Columbia, Lincoln, McDuffie and Richmond counties in Georgia and Aiken and Edgefield counties in South Carolina. The estimates include all full- and part-time wage and salary workers who were employed during or received pay for any part of the pay period that includes the
twelfth of the month. Proprietors, domestic workers, self-employed persons, unpaid family workers and personnel of the armed forces are excluded. Estimates based on 2015 benchmark.
BRUNSWICK MSA Nonfarm Employment
(In thousands)
(Not Seasonally Adjusted)
Preliminary
Revised
JUL 2016 JUN 2016
Revised JUL 2015
Change in Jobs from JUN 2016
Net %
Change in Jobs from JUL 2015
Net %
Total Nonfarm Total Private Goods Producing Service-Providing Private Service-Providing Trade, Transportation, and Utilities
Retail Trade Government
Federal Government State Government Local Government
43.7
43.7
42.3
0.0 0.0
33.4
33.5
32.5
-0.1 -0.3
3.8
3.8
3.8
0.0 0.0
39.9
39.9
38.5
0.0 0.0
29.6
29.7
28.7
-0.1 -0.3
8.6
8.7
8.7
-0.1 -1.2
5.7
5.7
5.7
0.0 0.0
10.3
10.2
9.8
0.1 1.0
1.8
1.8
1.8
0.0 0.0
1.7
1.6
1.7
0.1 6.3
6.8
6.8
6.3
0.0 0.0
1.4 3.3 0.9 2.8 0.0 0.0 1.4 3.6 0.9 3.1 -0.1 -1.2 0.0 0.0 0.5 5.1 0.0 0.0 0.0 0.0 0.5 7.9
Note: These not seasonally adjusted estimates were prepared in cooperation with the U.S. Department of Labor, Bureau of Labor Statistics, based upon monthly reports submitted by
selected employers in the Brunswick Metropolitan Statistical Area, which includes Brantley, Glynn and McIntosh counties. The estimates include all full- and part-time wage and salary workers who were employed during or received pay for any part of the pay period that includes the twelfth of the month. Proprietors, domestic workers, self-employed persons, unpaid family workers and personnel of the armed forces are excluded. Estimates based on 2015 benchmark.
Source: Georgia Department of Labor, Workforce Statistics & Economic Research
6
COLUMBUS MSA Nonfarm Employment
(In thousands)
(Not Seasonally Adjusted)
Preliminary
Revised
JUL 2016 JUN 2016
Revised JUL 2015
Change in Jobs from JUN 2016
Net %
Change in Jobs from JUL 2015
Net %
Total Nonfarm Total Private Goods Producing Service-Providing Private Service-Providing Mining, Logging and Construction Manufacturing Trade, Transportation, and Utilities
Wholesale Trade Retail Trade Transportation, Warehousing, and Utilities Information Financial Activities Finance and Insurance
Insurance Carriers and Related Activities Professional and Business Services Education and Health Services Leisure and Hospitality Other Services Government
Federal Government State Government Local Government
121.8 97.9 14.2
107.6 83.7 4.2 10.0 19.3 3.2 14.0 2.1 1.5 13.4 11.4 4.5 12.8 16.5 15.5 4.7 23.9 6.9 4.6 12.4
122.3 97.6 14.2
108.1 83.4 4.2 10.0 19.2 3.2 13.9 2.1 1.5 13.4 11.4 4.5 12.6 16.4 15.6 4.7 24.7 6.9 4.7 13.1
120.6 97.0 14.6
106.0 82.4 4.3 10.3 18.7 3.1 13.6 2.0 1.5 13.5 11.5 4.5 12.6 16.3 15.1 4.7 23.6 6.8 4.4 12.4
-0.5 -0.4 0.3 0.3 0.0 0.0 -0.5 -0.5 0.3 0.4 0.0 0.0 0.0 0.0 0.1 0.5 0.0 0.0 0.1 0.7 0.0 0.0 0.0 0.0 0.0 0.0 0.0 0.0 0.0 0.0 0.2 1.6 0.1 0.6 -0.1 -0.6 0.0 0.0 -0.8 -3.2 0.0 0.0 -0.1 -2.1 -0.7 -5.3
1.2 1.0 0.9 0.9 -0.4 -2.7 1.6 1.5 1.3 1.6 -0.1 -2.3 -0.3 -2.9 0.6 3.2 0.1 3.2 0.4 2.9 0.1 5.0 0.0 0.0 -0.1 -0.7 -0.1 -0.9 0.0 0.0 0.2 1.6 0.2 1.2 0.4 2.7 0.0 0.0 0.3 1.3 0.1 1.5 0.2 4.6 0.0 0.0
Note: These not seasonally adjusted estimates were prepared in cooperation with the U.S. Department of Labor, Bureau of Labor Statistics, based upon monthly reports submitted by
selected employers in the Columbus Metropolitan Statistical Area, which includes Chattahoochee, Harris, Marion and Muscogee counties in Georgia and Russell County in Alabama. The estimates include all full- and part-time wage and salary workers who were employed during or received pay for any part of the pay period that includes the twelfth of the month. Proprietors, domestic workers, self-employed persons, unpaid family workers and personnel of the armed forces are excluded. Estimates based on 2015 benchmark.
DALTON MSA Nonfarm Employment
(In thousands)
(Not Seasonally Adjusted)
Preliminary JUL 2016
Revised JUN 2016
Revised JUL 2015
Change in Jobs from JUN 2016
Net %
Change in Jobs from JUL 2015
Net %
Total Nonfarm Total Private Goods Producing Service-Providing Private Service-Providing Manufacturing
Textile Mills Textile Product Mills Trade, Transportation, and Utilities Retail Trade Transportation, Warehousing, and Utilities Professional and Business Services Government Federal Government State Government Local Government
68.3
68.6
67.2
-0.3 -0.4
61.5
61.8
60.5
-0.3 -0.5
25.0
25.1
24.5
-0.1 -0.4
43.3
43.5
42.7
-0.2 -0.5
36.5
36.7
36.0
-0.2 -0.5
23.1
23.1
23.2
0.0 0.0
2.2
2.3
2.3
-0.1 -4.4
15.6
15.5
15.4
0.1 0.7
17.4
17.4
16.6
0.0 0.0
8.8
8.8
8.3
0.0 0.0
4.5
4.5
4.3
0.0 0.0
6.3
6.3
6.1
0.0 0.0
6.8
6.8
6.7
0.0 0.0
0.2
0.2
0.2
0.0 0.0
0.9
0.9
0.9
0.0 0.0
5.7
5.7
5.6
0.0 0.0
1.1 1.6 1.0 1.7 0.5 2.0 0.6 1.4 0.5 1.4 -0.1 -0.4 -0.1 -4.4 0.2 1.3 0.8 4.8 0.5 6.0 0.2 4.7 0.2 3.3 0.1 1.5 0.0 0.0 0.0 0.0 0.1 1.8
Note: These not seasonally adjusted estimates were prepared in cooperation with the U.S. Department of Labor, Bureau of Labor Statistics, based upon monthly reports submitted by
selected employers in the Dalton Metropolitan Statistical Area, which includes Murray and Whitfield counties. The estimates include all full- and part-time wage and salary workers who were employed during or received pay for any part of the pay period that includes the twelfth of the month. Proprietors, domestic workers, self-employed persons, unpaid family workers and personnel of the armed forces are excluded. Estimates based on 2015 benchmark.
Source: Georgia Department of Labor, Workforce Statistics & Economic Research
7
GAINESVILLE MSA Nonfarm Employment
(In thousands)
(Not Seasonally Adjusted)
Preliminary
Revised
Revised
JUL 2016 JUN 2016 JUL 2015
Change in Jobs from JUN 2016
Net %
Change in Jobs from JUL 2015
Net %
Total Nonfarm Total Private Goods Producing Service-Providing Private Service-Providing Trade, Transportation, and Utilities
Retail Trade Government
Federal Government State Government Local Government
86.5
87.2
83.8
-0.7 -0.8
77.0
77.0
74.0
0.0 0.0
23.3
23.1
22.5
0.2 0.9
63.2
64.1
61.3
-0.9 -1.4
53.7
53.9
51.5
-0.2 -0.4
16.0
16.3
15.9
-0.3 -1.8
9.4
9.3
8.9
0.1 1.1
9.5
10.2
9.8
-0.7 -6.9
0.5
0.5
0.5
0.0 0.0
2.3
2.3
2.3
0.0 0.0
6.7
7.4
7.0
-0.7 -9.5
2.7 3.2 3.0 4.1 0.8 3.6 1.9 3.1 2.2 4.3 0.1 0.6 0.5 5.6 -0.3 -3.1 0.0 0.0 0.0 0.0 -0.3 -4.3
Note: These not seasonally adjusted estimates were prepared in cooperation with the U.S. Department of Labor, Bureau of Labor Statistics, based upon monthly reports submitted by
selected employers in the Gainesville Metropolitan Statistical Area, which comprises Hall county. The estimates include all full- and part-time wage and salary workers who were employed during or received pay for any part of the pay period that includes the twelfth of the month. Proprietors, domestic workers, self-employed persons, unpaid family workers and personnel of the armed forces are excluded. Estimates based on 2015 benchmark.
HINESVILLE MSA Nonfarm Employment
(In thousands)
(Not Seasonally Adjusted)
Preliminary Revised Revised JUL 2016 JUN 2016 JUL 2015
Change in Jobs from JUN 2016
Net %
Change in Jobs from JUL 2015
Net %
Total Nonfarm Total Private Goods Producing Service-Providing Private Service-Providing Government
Federal Government State Government Local Government
19.4
19.4
19.5
11.6
11.6
11.7
2.6
2.6
2.6
16.8
16.8
16.9
9.0
9.0
9.1
7.8
7.8
7.8
3.9
3.9
3.9
0.4
0.4
0.4
3.5
3.5
3.5
0.0 0.0 0.0 0.0 0.0 0.0 0.0 0.0 0.0 0.0 0.0 0.0 0.0 0.0 0.0 0.0 0.0 0.0
-0.1 -0.5 -0.1 -0.9 0.0 0.0 -0.1 -0.6 -0.1 -1.1 0.0 0.0 0.0 0.0 0.0 0.0 0.0 0.0
Note: These not seasonally adjusted estimates were prepared in cooperation with the U.S. Department of Labor, Bureau of Labor Statistics, based upon monthly reports submitted by
selected employers in the Hinesville Metropolitan Statistical Area, which includes Liberty and Long counties. The estimates include all full- and part-time wage and salary workers who were employed during or received pay for any part of the pay period that includes the twelfth of the month. Proprietors, domestic workers, self-employed persons, unpaid family workers and personnel of the armed forces are excluded. Estimates based on 2015 benchmark.
Source: Georgia Department of Labor, Workforce Statistics & Economic Research
8
MACON MSA Nonfarm Employment
(In thousands)
(Not Seasonally Adjusted)
Preliminary
Revised
Revised
JUL 2016 JUN 2016 JUL 2015
Change in Jobs from JUN 2016
Net %
Change in Jobs from JUL 2015
Net %
Total Nonfarm Total Private Goods Producing Service-Providing Private Service-Providing Trade, Transportation, and Utilities
Retail Trade Transportation, Warehousing, and Utilities Financial Activities Professional and Business Services Education and Health Services Leisure and Hospitality Government Federal Government State Government Local Government
103.8 89.9 9.6 94.2 80.3 21.1 14.5 3.7 9.9 12.3 20.9 10.6 13.9 1.1 3.6 9.2
104.3 89.8 9.6 94.7 80.2 21.0 14.3 3.7 10.0 12.4 20.8 10.7 14.5 1.2 3.7 9.6
101.6 87.4 9.6 92.0 77.8 20.8 14.2 3.6 9.9 12.2 20.3 10.0 14.2 1.1 3.7 9.4
-0.5 -0.5 0.1 0.1 0.0 0.0 -0.5 -0.5 0.1 0.1 0.1 0.5 0.2 1.4 0.0 0.0 -0.1 -1.0 -0.1 -0.8 0.1 0.5 -0.1 -0.9 -0.6 -4.1 -0.1 -8.3 -0.1 -2.7 -0.4 -4.2
2.2 2.2 2.5 2.9 0.0 0.0 2.2 2.4 2.5 3.2 0.3 1.4 0.3 2.1 0.1 2.8 0.0 0.0 0.1 0.8 0.6 3.0 0.6 6.0 -0.3 -2.1 0.0 0.0 -0.1 -2.7 -0.2 -2.1
Note: These not seasonally adjusted estimates were prepared in cooperation with the U.S. Department of Labor, Bureau of Labor Statistics, based upon monthly reports submitted by
selected employers in the Macon Metropolitan Statistical Area, which includes Bibb, Crawford, Jones, Monroe and Twiggs counties. The estimates include all full- and part-time wage and salary workers who were employed during or received pay for any part of the pay period that includes the twelfth of the month. Proprietors, domestic workers, self-employed persons, unpaid family workers and personnel of the armed forces are excluded. Estimates based on 2015 benchmark.
ROME MSA Nonfarm Employment
(In thousands)
(Not Seasonally Adjusted)
Preliminary
Revised
JUL 2016 JUN 2016
Revised JUL 2015
Change in Jobs from JUN 2016
Net %
Change in Jobs from JUL 2015
Net %
Total Nonfarm Total Private Goods Producing Service-Providing Private Service-Providing Manufacturing Trade, Transportation, and Utilities
Retail Trade Education and Health Services Government
Federal Government State Government Local Government
40.4
40.8
39.7
-0.4 -1.0
34.9
35.0
34.1
-0.1 -0.3
7.0
7.0
6.9
0.0 0.0
33.4
33.8
32.8
-0.4 -1.2
27.9
28.0
27.2
-0.1 -0.4
6.0
6.0
6.0
0.0 0.0
7.9
7.8
7.8
0.1 1.3
5.0
5.0
4.9
0.0 0.0
10.3
10.2
9.6
0.1 1.0
5.5
5.8
5.6
-0.3 -5.2
0.2
0.2
0.2
0.0 0.0
1.5
1.6
1.6
-0.1 -6.3
3.8
4.0
3.8
-0.2 -5.0
0.7 1.8 0.8 2.4 0.1 1.5 0.6 1.8 0.7 2.6 0.0 0.0 0.1 1.3 0.1 2.0 0.7 7.3 -0.1 -1.8 0.0 0.0 -0.1 -6.3 0.0 0.0
Note: These not seasonally adjusted estimates were prepared in cooperation with the U.S. Department of Labor, Bureau of Labor Statistics, based upon monthly reports submitted by
selected employers in the Rome Metropolitan Statistical Area, which comprises Floyd county. The estimates include all full- and part-time wage and salary workers who were employed during or received pay for any part of the pay period that includes the twelfth of the month. Proprietors, domestic workers, self-employed persons, unpaid family workers and personnel of the armed forces are excluded. Estimates based on 2015 benchmark.
Source: Georgia Department of Labor, Workforce Statistics & Economic Research
9
SAVANNAH MSA Nonfarm Employment
(In thousands)
(Not Seasonally Adjusted)
Preliminary Revised JUL 2016 JUN 2016
Revised JUL 2015
Change in Jobs from JUN 2016
Net %
Change in Jobs from JUL 2015
Net %
Total Nonfarm Total Private Goods Producing Service-Providing Private Service-Providing Mining, Logging and Construction Manufacturing Trade, Transportation, and Utilities
Wholesale Trade Retail Trade Transportation, Warehousing, and Utilities Information Financial Activities Professional and Business Services Education and Health Services Leisure and Hospitality Other Services Government Federal Government State Government Local Government
179.5 154.9
25.2 154.3 129.7
6.5 18.7 39.1
6.4 21.1 11.6
1.9 6.7 21.1 25.8 27.8 7.3 24.6 2.9 6.2 15.5
179.8 155.0
24.7 155.1 130.3
6.4 18.3 38.9
6.4 20.9 11.6
2.0 6.7 20.9 25.8 28.6 7.4 24.8 2.9 6.4 15.5
171.5 148.7
24.1 147.4 124.6
6.4 17.7 38.3
6.4 20.4 11.5
1.9 6.6 19.3 25.2 26.1 7.2 22.8 2.8 5.6 14.4
-0.3 -0.2 -0.1 -0.1 0.5 2.0 -0.8 -0.5 -0.6 -0.5 0.1 1.6 0.4 2.2 0.2 0.5 0.0 0.0 0.2 1.0 0.0 0.0 -0.1 -5.0 0.0 0.0 0.2 1.0 0.0 0.0 -0.8 -2.8 -0.1 -1.4 -0.2 -0.8 0.0 0.0 -0.2 -3.1 0.0 0.0
8.0 4.7 6.2 4.2 1.1 4.6 6.9 4.7 5.1 4.1 0.1 1.6 1.0 5.7 0.8 2.1 0.0 0.0 0.7 3.4 0.1 0.9 0.0 0.0 0.1 1.5 1.8 9.3 0.6 2.4 1.7 6.5 0.1 1.4 1.8 7.9 0.1 3.6 0.6 10.7 1.1 7.6
Note: These not seasonally adjusted estimates were prepared in cooperation with the U.S. Department of Labor, Bureau of Labor Statistics, based upon monthly reports submitted by
selected employers in the Savannah Metropolitan Statistical Area, which includes Bryan, Chatham and Effingham counties. The estimates include all full- and part-time wage and salary workers who were employed during or received pay for any part of the pay period that includes the twelfth of the month. Proprietors, domestic workers, self-employed persons, unpaid family workers and personnel of the armed forces are excluded. Estimates based on 2015 benchmark.
VALDOSTA MSA Nonfarm Employment
(In thousands)
(Not Seasonally Adjusted)
Preliminary Revised JUL 2016 JUN 2016
Revised JUL 2015
Change in Jobs from JUN 2016
Net %
Change in Jobs from JUL 2015
Net %
Total Nonfarm Total Private Goods Producing Service-Providing Private Service-Providing Trade, Transportation, and Utilities
Retail Trade Government
Federal Government State Government Local Government
56.1
55.8
54.5
0.3 0.5
43.2
42.9
41.9
0.3 0.7
7.0
6.9
7.0
0.1 1.5
49.1
48.9
47.5
0.2 0.4
36.2
36.0
34.9
0.2 0.6
12.2
12.2
11.5
0.0 0.0
7.6
7.5
7.0
0.1 1.3
12.9
12.9
12.6
0.0 0.0
1.2
1.2
1.2
0.0 0.0
3.9
3.8
3.8
0.1 2.6
7.8
7.9
7.6
-0.1 -1.3
1.6 2.9 1.3 3.1 0.0 0.0 1.6 3.4 1.3 3.7 0.7 6.1 0.6 8.6 0.3 2.4 0.0 0.0 0.1 2.6 0.2 2.6
Note: These not seasonally adjusted estimates were prepared in cooperation with the U.S. Department of Labor, Bureau of Labor Statistics, based upon monthly reports submitted by
selected employers in the Valdosta Metropolitan Statistical Area, which includes Brooks, Echols, Lanier and Lowndes counties. The estimates include all full- and part-time wage and salary workers who were employed during or received pay for any part of the pay period that includes the twelfth of the month. Proprietors, domestic workers, self-employed persons, unpaid family workers and personnel of the armed forces are excluded. Estimates based on 2015 benchmark.
Source: Georgia Department of Labor, Workforce Statistics & Economic Research
10
WARNER ROBINS MSA Nonfarm Employment
(In thousands)
(Not Seasonally Adjusted)
Preliminary Revised JUL 2016 JUN 2016
Revised JUL 2015
Change in Jobs from JUN 2016
Net %
Change in Jobs from JUL 2015
Net %
Total Nonfarm Total Private Goods Producing Service-Providing Private Service-Providing Trade, Transportation, and Utilities
Retail Trade Government
Federal Government State Government Local Government
70.8
71.7
70.1
-0.9 -1.3
44.4
44.7
43.7
-0.3 -0.7
9.7
9.7
9.4
0.0 0.0
61.1
62.0
60.7
-0.9 -1.5
34.7
35.0
34.3
-0.3 -0.9
10.5
10.6
10.2
-0.1 -0.9
8.2
8.4
7.9
-0.2 -2.4
26.4
27.0
26.4
-0.6 -2.2
14.8
14.8
14.8
0.0 0.0
2.3
2.3
2.4
0.0 0.0
9.3
9.9
9.2
-0.6 -6.1
0.7 1.0 0.7 1.6 0.3 3.2 0.4 0.7 0.4 1.2 0.3 2.9 0.3 3.8 0.0 0.0 0.0 0.0 -0.1 -4.2 0.1 1.1
Note: These not seasonally adjusted estimates were prepared in cooperation with the U.S. Department of Labor, Bureau of Labor Statistics, based upon monthly reports submitted by
selected employers in the Warner Robins Metropolitan Statistical Area, which includes Houston, Peach and Pulaski counties. The estimates include all full- and part-time wage and salary workers who were employed during or received pay for any part of the pay period that includes the twelfth of the month. Proprietors, domestic workers, self-employed persons, unpaid family workers and personnel of the armed forces are excluded. Estimates based on 2015 benchmark.
Total Nonfarm Employment by Metro Statistical Area
(In thousands)
(Seasonally Adjusted)
Preliminary
Revised
JUL 2016 JUN 2016
Revised JUL 2015
Change in Jobs from JUN 2016
Net %
Change in Jobs from JUL 2015
Net %
Albany MSA
62.2
61.9
61.1
0.3 0.5
1.1 1.8
Athens-Clarke County MSA
94.7
95.3
91.6
-0.6 -0.6
3.1 3.4
Atlanta MSA
2,658.3
2,654.0
2,588.9
4.3 0.2
69.4 2.7
Augusta-Richmond MSA
230.8
230.7
228.4
0.1 0.0
2.4 1.1
Brunswick MSA
43.5
43.2
41.9
0.3 0.7
1.6 3.8
Columbus MSA
122.3
122.1
121.5
0.2 0.2
0.8 0.7
Dalton MSA
68.6
68.5
67.4
0.1 0.1
1.2 1.8
Gainesville MSA
87.0
86.4
84.3
0.6 0.7
2.7 3.2
Hinesville MSA
19.7
19.5
19.7
0.2 1.0
0.0 0.0
Macon MSA
104.5
104.3
102.0
0.2 0.2
2.5 2.5
Rome MSA
40.7
40.9
40.2
-0.2 -0.5
0.5 1.2
Savannah MSA
180.5
179.2
171.5
1.3 0.7
9.0 5.2
Valdosta MSA
56.9
56.5
55.1
0.4 0.7
1.8 3.3
Warner Robins MSA
NO DATA AVAILABLE
Note: These seasonally adjusted estimates were prepared in cooperation with the U.S. Department of Labor, Bureau of Labor Statistics, based upon monthly reports submitted by selected
employers throughout Georgia. The estimates include all full- and part-time wage and salary workers who were employed during or received pay for any part of the pay period that includes the twelfth of the month. Proprietors, domestic workers, self-employed persons, unpaid family workers and personnel of the armed forces are excluded. Estimates based on 2015 benchmark.
Source: Georgia Department of Labor, Workforce Statistics & Economic Research
11
Georgia Statewide Hours and Earnings
All Employee
Average Weekly Earnings
Preliminary JUL 2016
Revised JUN 2016
Revised JUL 2015
Total Private.....................................................................................................$847.38............................ $843.88.......................$826.61 Goods Producing.......................................................................................$1,008.86.......................... $1,027.54....................... $979.12 Private Service Providing..............................................................................$816.55.............................$810.49.......................$799.02 Construction............................................................................................$1,013.38.......................... $1,012.70........................$977.13 Manufacturing........................................................................................... $999.35.......................... $1,027.54.......................$979.32 Trade, Transportation, and Utilities............................................................$746.82.............................$740.88.......................$750.29 Financial Activities.................................................................................. $1,109.30..........................$1,083.94.................... $1,078.13 Professional and Business Services......................................................$1,035.23.......................... $1,031.12...................... $996.86 Educational and Health Services.............................................................. $900.67............................ $888.55...................... $869.36 Leisure and Hospitality.............................................................................. $336.52.............................$337.40.......................$330.46 Other Services.......................................................................................... $700.90............................ $685.80.......................$723.49
Average Weekly Hours
Preliminary JUL 2016
Revised JUN 2016
Revised JUL 2015
Total Private...........................................................................................................34.8.................................. 34.9............................. 35.1 Goods Producing................................................................................................40.5................................... 41.5............................. 41.7 Private Service Providing....................................................................................33.7...................................33.7.............................33.9 Construction..................................................................................................... 41.6...................................41.2.............................42.3 Manufacturing..................................................................................................39.5................................... 41.3............................. 41.2 Trade, Transportation, and Utilities..................................................................34.4.................................. 34.3.............................34.8 Financial Activities........................................................................................... 37.2................................... 37.3..............................37.1 Professional and Business Services...............................................................34.6.................................. 34.8.............................35.4 Educational and Health Services.....................................................................35.1.................................. 34.9.............................34.9 Leisure and Hospitality.....................................................................................26.9................................... 27.1.............................26.5 Other Services.................................................................................................33.6.................................. 33.8.............................34.6
Average Hourly Earnings
Preliminary JUL 2016
Revised JUN 2016
Revised JUL 2015
Total Private.......................................................................................................$24.35............................... $24.18.........................$23.55 Goods Producing............................................................................................$24.91...............................$24.76.........................$23.48 Private Service Providing................................................................................$24.23...............................$24.05.........................$23.57 Construction.................................................................................................$24.36...............................$24.58......................... $23.10 Manufacturing..............................................................................................$25.30...............................$24.88.........................$23.77 Trade, Transportation, and Utilities.............................................................. $21.71...............................$21.60.........................$21.56 Financial Activities.......................................................................................$29.82.............................. $29.06.........................$29.06 Professional and Business Services...........................................................$29.92.............................. $29.63......................... $28.16 Educational and Health Services.................................................................$25.66.............................. $25.46.........................$24.91 Leisure and Hospitality................................................................................. $12.51...............................$12.45......................... $12.47 Other Services.............................................................................................$20.86.............................. $20.29.........................$20.91
Read more about the hours and earnings series at http://www.bls.gov/sae/home.htm
Note: These not seasonally adjusted estimates were prepared in cooperation with the U.S. Department of Labor, Bureau of Labor Statistics, based upon monthly reports submitted by
selected employers throughout Georgia. The estimates include all full- and part-time wage and salary workers who were employed during or received pay for any part of the pay period that includes the twelfth of the month. Proprietors, domestic workers, self-employed persons, unpaid family workers and personnel of the armed forces are excluded. Estimates based on 2015 benchmark.
Source: Georgia Department of Labor, Workforce Statistics & Economic Research
12
Georgia MSA Hours and Earnings
All Employee Total Private
Average Weekly Earnings
Preliminary JUL 2016
Revised JUN 2016
Revised JUL 2015
Albany MSA ................................................................................................... $623.60.............................$618.09...................... $558.90 Athens-Clarke County MSA ........................................................................... $714.19............................. $707.61.......................$720.46 Atlanta MSA ..................................................................................................$937.66............................ $933.68...................... $909.30 Augusta-Richmond County MSA ................................................................... $812.75.............................$801.44...................... $864.49 Brunswick MSA ............................................................................................ $580.92............................ $575.89.......................$591.54 Columbus MSA ..............................................................................................$708.07.............................$688.16....................... $653.14 Dalton MSA .................................................................................................. $680.86............................ $678.59...................... $684.68 Gainesville MSA ............................................................................................ $968.79.............................$951.98....................... $837.14 Hinesville MSA ............................................................................................... $742.01............................ $729.05....................... $771.78 Macon MSA ....................................................................................................$736.71.............................$731.24.......................$724.66 Rome MSA ..................................................................................................... $811.37............................. $847.17.......................$875.96 Savannah MSA ..............................................................................................$750.96..............................$741.18.......................$678.78 Valdosta MSA ................................................................................................. $627.17.............................$615.28...................... $590.90 Warner Robins MSA ...................................................................................... $804.40.............................$813.50.......................$728.22
Average Weekly Hours
Preliminary JUL 2016
Revised JUN 2016
Revised JUL 2015
Albany MSA ..........................................................................................................33.1...................................33.0............................. 34.1 Athens-Clarke County MSA .................................................................................33.8.................................. 34.3.............................34.0 Atlanta MSA ........................................................................................................34.6.................................. 34.8.............................35.0 Augusta-Richmond County MSA .........................................................................34.6.................................. 34.5.............................36.6 Brunswick MSA ...................................................................................................30.9...................................30.6.............................32.9 Columbus MSA ....................................................................................................36.2.................................. 35.2.............................34.0 Dalton MSA ......................................................................................................... 37.7.................................. 38.6.............................39.6 Gainesville MSA ...................................................................................................40.4...................................39.6.............................38.0 Hinesville MSA .....................................................................................................35.3...................................35.0.............................36.2 Macon MSA ..........................................................................................................35.3.................................. 36.2............................. 38.1 Rome MSA ...........................................................................................................34.6.................................. 36.5.............................34.5 Savannah MSA ....................................................................................................33.6...................................33.0.............................32.4 Valdosta MSA .......................................................................................................35.9.................................. 35.3.............................34.8 Warner Robins MSA .............................................................................................40.0...................................40.9.............................40.3
Average Hourly Earnings
Preliminary JUL 2016
Revised JUN 2016
Revised JUL 2015
Albany MSA ......................................................................................................$18.84...............................$18.73.........................$16.39 Athens-Clarke County MSA ............................................................................. $21.13.............................. $20.63......................... $21.19 Atlanta MSA .................................................................................................... $27.10.............................. $26.83.........................$25.98 Augusta-Richmond County MSA .....................................................................$23.49.............................. $23.23.........................$23.62 Brunswick MSA ...............................................................................................$18.80...............................$18.82......................... $17.98 Columbus MSA ................................................................................................$19.56...............................$19.55......................... $19.21 Dalton MSA .....................................................................................................$18.06............................... $17.58......................... $17.29 Gainesville MSA .............................................................................................. $23.98...............................$24.04.........................$22.03 Hinesville MSA .................................................................................................$21.02.............................. $20.83......................... $21.32 Macon MSA ......................................................................................................$20.87.............................. $20.20......................... $19.02 Rome MSA .......................................................................................................$23.45...............................$23.21.........................$25.39 Savannah MSA ............................................................................................... $22.35.............................. $22.46.........................$20.95 Valdosta MSA ................................................................................................... $17.47............................... $17.43.........................$16.98 Warner Robins MSA ......................................................................................... $20.11...............................$19.89......................... $18.07
Read more about the hours and earnings series at http://www.bls.gov/sae/home.htm
Note: These not seasonally adjusted estimates were prepared in cooperation with the U.S. Department of Labor, Bureau of Labor Statistics, based upon monthly reports submitted by
selected employers throughout Georgia. The estimates include all full- and part-time wage and salary workers who were employed during or received pay for any part of the pay period that includes the twelfth of the month. Proprietors, domestic workers, self-employed persons, unpaid family workers and personnel of the armed forces are excluded. Estimates based on 2015 benchmark.
Source: Georgia Department of Labor, Workforce Statistics & Economic Research
13
Dimensions - Measuring Georgia's Labor Force
Unemployment rates -- Georgia and U.S.
7%
Georgia
U.S.
6%
5%
4% Jul Aug Sep Oct Nov Dec Jan Feb Mar Apr May Jun Jul
WA 5.8 OR 5.2 NV 6.5 CA 5.5
AK 6.7
ID 3.8
UT 3.9 AZ 6.0
StaStteatuenUenmepmlopylomymenetntrRataetess
July 2016
National Unemployment Rate: 4.9% Rates are seasonally adjusted
MT 4.2
WY 5.7
CO 3.8 NM 6.4
ND 3.1 SD 2.8
NE 3.1
KS 4.1
MN 3.9
WI 4.2
IA 4.1
IL 5.8 MO 4.7
OK 5.0 TX 4.6
AR 3.9
MS 6.0 LA 6.3
MI 4.5
OH
IN
4.8
4.6
KY 4.9 TN 4.3
PA 5.6
WV
5.7
VA
3.7
NC 4.7
SC 5.2
AL
GA
5.7
5.0
FL 4.7
NH
2.9 ME
VT
3.9
3.2
MA 4.1
NY 4.7
RI 5.5
NJ
CT 5.7
5.2
DE
4.3
DC 5.9
MD 4.3
Unemployment rate
6.0% to 6.9% 5.0% to 5.9% 4.0% to 4.9% 3.0% to 3.9% Less than 3.0%
HI 3.5 Source: Georgia Department of Labor, Workforce Statistics & Economic Research
14
Georgia Labor Force Estimates
Place of Residence - Persons 16 Years and Older
Georgia
(Seasonally adjusted)
Georgia
(Not Seasonally adjusted)
Albany MSA Athens-Clarke County MSA
Atlanta MSA
Augusta-Richmond County MSA
Brunswick MSA
Columbus MSA
Dalton MSA
Gainesville MSA
Employment Status
Civilian labor force Employed Unemployed Rate
Civilian labor force Employed Unemployed Rate
Civilian labor force Employed Unemployed Rate
Civilian labor force Employed Unemployed Rate
Civilian labor force Employed Unemployed Rate
Civilian labor force Employed Unemployed Rate
Civilian labor force Employed Unemployed Rate
Civilian labor force Employed Unemployed Rate
Civilian labor force Employed Unemployed Rate
Civilian labor force Employed Unemployed Rate
Preliminary JUL 2016
4,882,256 4,639,363
242,893 5.0
4,942,143 4,673,505
268,638 5.4
66,763 62,540
4,223 6.3
97,109 92,038
5,071 5.2
2,950,335 2,799,438
150,897 5.1
262,508 246,564
15,944 6.1
52,771 49,789
2,982 5.7
125,991 117,880
8,111 6.4
61,884 57,978 3,906
6.3
96,476 92,084
4,392 4.6
Revised JUN 2016
4,869,223 4,620,121
249,102 5.1
4,907,634 4,636,235
271,399 5.5
66,786 62,411 4,375
6.6
97,353 91,921 5,432
5.6
2,918,767 2,764,986
153,781 5.3
260,756 245,156 15,600
6.0
52,378 49,463
2,915 5.6
125,323 117,075
8,248 6.6
61,443 57,583 3,860
6.3
96,267 91,814 4,453
4.6
Revised JUL 2015
4,751,156 4,480,699
270,457 5.7
4,788,247 4,485,282
302,965 6.3
64,855 59,886
4,969 7.7
93,272 87,508
5,764 6.2
2,853,915 2,683,424
170,491 6.0
256,796 239,186
17,610 6.9
50,802 47,442 3,360
6.6
124,275 115,090
9,185 7.4
60,669 56,286
4,383 7.2
92,730 87,878 4,852
5.2
Change From
JUN 2016
JUL 2015
13,033 19,242 -6,209
131,100 158,664 -27,564
34,509 37,270 -2,761
153,896 188,223 -34,327
-23
1,908
129
2,654
-152
-746
-244 117 -361
3,837 4,530 -693
31,568 34,452 -2,884
96,420 116,014 -19,594
1,752 1,408
344
5,712 7,378 -1,666
393
1,969
326
2,347
67
-378
668
1,716
805
2,790
-137
-1,074
441
1,215
395
1,692
46
-477
209
3,746
270
4,206
-61
-460
Note: MSA data are not seasonally adjusted. Employment includes nonagricultural wage and salary employment, self-employment, unpaid family and private
household workers and agricultural workers. Persons in labor disputes are counted as employed. The use of unrounded data does not imply that the numbers are exact.
Albany MSA: Baker, Dougherty, Lee, Terrell, and Worth counties. Athens - Clarke County MSA: Clarke, Madison, Oconee, and Oglethorpe counties. Atlanta MSA: Barrow, Bartow, Butts, Carroll, Cherokee, Clayton, Cobb, Coweta, Dawson, DeKalb, Douglas, Fayette, Forsyth, Fulton, Gwinnett, Haralson, Heard, Henry, Jasper, Lamar, Meriwether, Morgan, Newton, Paulding, Pickens, Pike, Rockdale, Spalding, and Walton counties. Augusta - Richmond County MSA: Burke, Columbia, Lincoln, McDuffie, and Richmond counties in Georgia and Aiken and Edgefield counties in South Carolina. Brunswick MSA: Brantley, Glynn, and McIntosh counties. Columbus MSA: Chattahoochee, Harris, Marion, and Muscogee counties in Georgia and Russell County in Alabama. Dalton MSA: Murray and Whitfield counties. Gainesville MSA: Hall County. Hinesville MSA: Liberty and Long counties. Macon MSA: Bibb, Crawford, Jones, Monroe, and Twiggs counties. Rome MSA: Floyd County. Savannah MSA: Bryan, Chatham, and Effingham counties. Valdosta MSA: Brooks, Echols, Lanier, and Lowndes counties. Warner Robins MSA: Houston, Peach and Pulaski counties.
Source: Georgia Department of Labor, Workforce Statistics & Economic Research
15
Hinesville MSA Macon MSA Rome MSA
Savannah MSA Valdosta MSA Warner Robins MSA
Georgia Labor Force Estimates
Place of Residence - Persons 16 Years and Older
Employment Status
Civilian labor force Employed Unemployed Rate
Civilian labor force Employed Unemployed Rate
Preliminary JUL 2016
32,250 30,387
1,863 5.8
106,086 100,000
6,086 5.7
Revised JUN 2016
32,082 30,178 1,904
5.9
105,577 99,383 6,194 5.9
Revised JUL 2015
31,827 29,716
2,111 6.6
103,330 96,336 6,994 6.8
Civilian labor force Employed Unemployed Rate
Civilian labor force Employed Unemployed Rate
43,869 40,973
2,896 6.6
185,855 176,538
9,317 5.0
43,495 40,790
2,705 6.2
184,211 174,393
9,818 5.3
42,794 39,633
3,161 7.4
176,957 166,420
10,537 6.0
Civilian labor force Employed Unemployed Rate
Civilian labor force Employed Unemployed Rate
64,320 60,851
3,469 5.4
82,002 77,388
4,614 5.6
63,908 60,279
3,629 5.7
82,357 77,614 4,743
5.8
62,249 58,165 4,084
6.6
80,536 75,206
5,330 6.6
Change From
JUN 2016
JUL 2015
168
423
209
671
-41
-248
509
2,756
617
3,664
-108
-908
374
1,075
183
1,340
191
-265
1,644 2,145 -501
8,898 10,118 -1,220
412
2,071
572
2,686
-160
-615
-355 -226 -129
1,466 2,182 -716
Area United States
(Seasonally adjusted)
United States
(Not Seasonally adjusted)
United States Labor Force Estimates
Place of Residence - Persons 16 Years and Older
Employment Status
Civilian labor force Employed Unemployed Rate
Civilian labor force Employed Unemployed Rate
JUL 2016
159,287,000 151,517,000
7,770,000 4.9
160,705,000 152,437,000
8,267,000 5.1
JUN 2016
158,880,000 151,097,000
7,783,000 4.9
160,135,000 151,990,000
8,144,000 5.1
JUL 2015
157,115,000 148,866,000
8,249,000 5.3
158,527,000 149,722,000
8,805,000 5.6
Change From
JUN 2016
JUL 2015
407,000 420,000 -13,000
2,172,000 2,651,000 -479,000
570,000 447,000 123,000
2,178,000 2,715,000 -538,000
Note: MSA data are not seasonally adjusted. Employment includes nonagricultural wage and salary employment, self-employment, unpaid family and private
household workers and agricultural workers. Persons in labor disputes are counted as employed. The use of unrounded data does not imply that the numbers are exact.
Albany MSA: Baker, Dougherty, Lee, Terrell, and Worth counties. Athens - Clarke County MSA: Clarke, Madison, Oconee, and Oglethorpe counties. Atlanta MSA: Barrow, Bartow, Butts, Carroll, Cherokee, Clayton, Cobb, Coweta, Dawson, DeKalb, Douglas, Fayette, Forsyth, Fulton, Gwinnett, Haralson, Heard, Henry, Jasper, Lamar, Meriwether, Morgan, Newton, Paulding, Pickens, Pike, Rockdale, Spalding, and Walton counties. Augusta - Richmond County MSA: Burke, Columbia, Lincoln, McDuffie, and Richmond counties in Georgia and Aiken and Edgefield counties in South Carolina. Brunswick MSA: Brantley, Glynn, and McIntosh counties. Columbus MSA: Chattahoochee, Harris, Marion, and Muscogee counties in Georgia and Russell County in Alabama. Dalton MSA: Murray and Whitfield counties. Gainesville MSA: Hall County. Hinesville MSA: Liberty and Long counties. Macon MSA: Bibb, Crawford, Jones, Monroe, and Twiggs counties. Rome MSA: Floyd County. Savannah MSA: Bryan, Chatham, and Effingham counties. Valdosta MSA: Brooks, Echols, Lanier, and Lowndes counties. Warner Robins MSA: Houston, Peach and Pulaski counties.
Source: Georgia Department of Labor, Workforce Statistics & Economic Research
16
Georgia Labor Force Estimates by County (not seasonally adjusted)
Place of Residence - Persons 16 Years and Older
Georgia
Preliminary July 2016
Labor Force
Employment
Unemployment Number Rate
4,942,143 4,673,505 268,638 5.4
Appling Atkinson Bacon Baker Baldwin
8,787 8,161
626 7.1
4,080 3,837
243 6.0
5,026 4,762
264 5.3
1,169 1,075
94 8.0
17,286 15,988 1,298 7.5
Banks Barrow Bartow Ben Hill Berrien
8,577 8,132
445 5.2
36,980 35,241 1,739 4.7
48,805 46,268 2,537 5.2
5,431 4,933
498 9.2
7,101 6,628
473 6.7
Bibb Bleckley Brantley Brooks Bryan
70,163 66,023 4,140 5.9
4,412 4,052 360 8.2
7,327 6,814
513 7.0
6,903 6,539 364 5.3
16,756 15,928
828 4.9
Bulloch Burke Butts Calhoun Camden
35,905 33,581 2,324 6.5
9,394 8,584
810 8.6
10,509 9,916
593 5.6
2,106 1,975
131 6.2
22,780 21,566 1,214 5.3
Candler Carroll Catoosa Charlton Chatham
5,115 4,828
287 5.6
54,643 51,059 3,584 6.6
32,205 30,603 1,602 5.0
4,958 4,657
301 6.1
140,807 133,652 7,155 5.1
Chattahoochee Chattooga Cherokee Clarke Clay
2,238 10,599 124,616 58,745
861
2,036 9,834 119,271 55,428
771
202 9.0 765 7.2 5,345 4.3 3,317 5.6
90 10.5
Clayton Clinch Cobb Coffee Colquitt
129,137 120,812 8,325 6.4
2,787 2,614
173 6.2
414,510 395,692 18,818 4.5
18,359 17,183 1,176 6.4
20,331 19,149 1,182 5.8
Columbia Cook Coweta Crawford Crisp
68,305 64,916 3,389 5.0
7,453 7,027
426 5.7
70,295 66,705 3,590 5.1
5,744 5,424
320 5.6
9,507 8,942
565 5.9
Revised June 2016
Labor Force
Employment
Unemployment Number Rate
4,907,634 4,636,235 271,399 5.5
9,034 8,456
578 6.4
4,160 3,954 206 5.0
5,246 4,965
281 5.4
1,232 1,138
94 7.6
17,393 16,025 1,368 7.9
8,726 8,275
451 5.2
36,639 34,844 1,795 4.9
48,357 45,793 2,564 5.3
5,432 4,991
441 8.1
7,221 6,779
442 6.1
69,735 65,512 4,223 6.1
4,507 4,121 386 8.6
7,317
6,818
499 6.8
7,010 6,637
373 5.3
16,601 15,747 854 5.1
35,792 33,490 2,302 6.4
9,311 8,617 694 7.5
10,394 9,819
575 5.5
2,251
2,123
128 5.7
22,584 21,345 1,239 5.5
5,217 4,957
260 5.0
53,945 50,513 3,432 6.4
31,900 30,294 1,606 5.0
4,978 4,682 296 5.9
139,504 131,992 7,512 5.4
2,235 2,041
194 8.7
10,485 9,834
651 6.2
123,280 117,738 5,542 4.5
58,916 55,313 3,603 6.1
901
814
87 9.7
127,873 119,392 8,481 6.6
2,887
2,715
172 6.0
409,927 390,603 19,324 4.7
18,149 17,079 1,070 5.9
21,088 19,905 1,183 5.6
67,871 64,440 3,431 5.1
7,486
7,063
423 5.7
69,769 65,935 3,834 5.5
5,759 5,427
332 5.8
9,594 9,027
567 5.9
Revised July 2015
Labor Force
Employment
Unemployment Number Rate
4,788,247 4,485,282 302,965 6.3
8,694 3,808 5,027 1,094 17,219
7,997 3,594 4,725 1,004 15,745
697 8.0 214 5.6 302 6.0 90 8.2 1,474 8.6
8,080 7,585 495 6.1
35,774 33,773 2,001 5.6
47,267 44,321 2,946 6.2
5,293 4,791
502 9.5
6,895 6,368
527 7.6
68,432 4,340 7,025 6,612
15,922
63,655 3,913 6,466 6,181
15,010
4,777 7.0 427 9.8 559 8.0 431 6.5 912 5.7
34,562 9,119
10,237 2,000 22,456
32,186 8,270 9,499 1,858 21,135
2,376 6.9 849 9.3 738 7.2 142 7.1
1,321 5.9
4,973 4,665
308 6.2
52,702 48,898 3,804 7.2
31,545 29,788 1,757 5.6
4,781 4,459 322 6.7
134,142 126,001 8,141 6.1
2,186 10,348 120,342 56,506
848
1,977 9,631 114,327 52,728
739
209 9.6 717 6.9 6,015 5.0 3,778 6.7 109 12.9
125,558 115,814 9,744 7.8
2,785 2,591
194 7.0
400,702 379,343 21,359 5.3
17,590 16,383 1,207 6.9
19,095 17,764 1,331 7.0
66,520 7,174
67,844 5,578 9,331
62,787 6,666 63,931 5,211 8,661
3,733 5.6 508 7.1
3,913 5.8 367 6.6 670 7.2
Source: Georgia Department of Labor, Workforce Statistics & Economic Research
17
Georgia Labor Force Estimates by County (not seasonally adjusted)
Place of Residence - Persons 16 Years and Older
Dade Dawson Decatur DeKalb Dodge
Preliminary July 2016
Labor Force
Employment
Unemployment Number Rate
8,285 7,823
462 5.6
11,416 10,875
541 4.7
11,391 10,652
739 6.5
385,903 365,462 20,441 5.3
6,944 6,445 499 7.2
Dooly Dougherty Douglas Early Echols
5,052 4,764
288 5.7
38,609 35,948 2,661 6.9
70,859 66,967 3,892 5.5
4,392 4,104
288 6.6
1,874 1,792
82 4.4
Effingham Elbert Emanuel Evans Fannin
28,292 26,958 1,334 4.7
7,689 7,096
593 7.7
8,411 7,722 689 8.2
4,787 4,513
274 5.7
10,609 10,032
577 5.4
Fayette Floyd Forsyth Franklin Fulton
56,674 53,926 2,748 4.8 43,869 40,973 2,896 6.6 106,192 101,680 4,512 4.2
9,710 9,127 583 6.0 534,419 506,056 28,363 5.3
Gilmer Glascock Glynn Gordon Grady
12,081 11,404
677 5.6
1,255 1,170
85 6.8
39,196 37,101 2,095 5.3
27,033 25,517 1,516 5.6
10,648 10,048 600 5.6
Greene
6,490 6,087
403 6.2
Gwinnett 468,690 446,399 22,291 4.8
Habersham 19,354 18,276 1,078 5.6
Hall
96,476 92,084 4,392 4.6
Hancock
2,382 2,158
224 9.4
Haralson Harris Hart Heard Henry
12,548 11,698 850 6.8
15,745 14,956
789 5.0
10,675 9,995 680 6.4
5,235 4,900 335 6.4
108,504 102,488 6,016 5.5
Houston Irwin Jackson Jasper Jeff Davis
66,400 62,804 3,596 5.4
3,148 2,905
243 7.7
33,159 31,729 1,430 4.3
6,678 6,358
320 4.8
6,550 6,146 404 6.2
Revised June 2016
Labor Force
Employment
Unemployment Number Rate
8,167
7,738
429 5.3
11,322 10,763 559 4.9
11,607 10,837
770 6.6
381,255 360,720 20,535 5.4
7,013 6,504 509 7.3
5,180 4,882 298 5.8
38,522 35,764 2,758 7.2
70,076 66,102 3,974 5.7
4,451
4,141
310 7.0
1,946 1,857
89 4.6
28,106 26,654 1,452 5.2
7,635
7,132
503 6.6
8,473 7,805 668 7.9
4,799 4,554
245 5.1
10,531 9,951 580 5.5
56,153 53,261 2,892 5.2 43,495 40,790 2,705 6.2 105,231 100,481 4,750 4.5
9,740 9,206 534 5.5 528,703 499,815 28,888 5.5
11,993 11,319
674 5.6
1,272 1,191
81 6.4
38,798 36,741 2,057 5.3
26,827 25,320 1,507 5.6
10,917 10,293
624 5.7
6,499 6,101 398 6.1 463,592 440,621 22,971 5.0
19,381 18,341 1,040 5.4 96,267 91,814 4,453 4.6
2,450 2,228 222 9.1
12,265 11,551
714 5.8
15,682 14,889
793 5.1
10,712 10,109 603 5.6
5,171 4,860
311 6.0
107,395 101,276 6,119 5.7
66,570 62,876 3,694 5.5
3,230 3,003 227 7.0
32,874 31,407 1,467 4.5
6,634 6,314
320 4.8
6,539 6,141 398 6.1
Revised July 2015
Labor Force
Employment
Unemployment Number Rate
8,082 7,586
496 6.1
10,999 10,405
594 5.4
11,247 10,444
803 7.1
373,786 350,438 23,348 6.2
6,977 6,371 606 8.7
4,858 37,637 68,683
4,317 1,781
4,485 34,469 64,208
3,993 1,682
373 7.7 3,168 8.4 4,475 6.5
324 7.5 99 5.6
26,893 7,589 8,308 4,622
10,243
25,409 7,000 7,558 4,345 9,602
1,484 5.5 589 7.8 750 9.0 277 6.0 641 6.3
54,779 51,703 3,076 5.6
42,794 39,633 3,161 7.4
102,403 97,446 4,957 4.8
9,154 8,516
638 7.0
517,100 485,109 31,991 6.2
11,820 1,203 37,788 26,406 10,278
11,080 1,120
35,404 24,775 9,566
740 6.3 83 6.9 2,384 6.3 1,631 6.2 712 6.9
6,467 5,998
469 7.3
452,741 427,916 24,825 5.5
18,751 17,582 1,169 6.2
92,730 87,878 4,852 5.2
2,354 2,094
260 11.0
12,025 15,446 10,262
5,028 105,095
11,210 14,555
9,557 4,687 98,278
815 6.8 891 5.8 705 6.9 341 6.8 6,817 6.5
65,206 2,978
30,590 6,452 6,405
61,101 2,725 28,997 6,078 5,952
4,105 6.3 253 8.5
1,593 5.2 374 5.8 453 7.1
Source: Georgia Department of Labor, Workforce Statistics & Economic Research
18
Georgia Labor Force Estimates by County (not seasonally adjusted)
Place of Residence - Persons 16 Years and Older
Jefferson Jenkins Johnson Jones Lamar
Preliminary July 2016
Labor Force
6,448 3,202 3,905 14,062 8,082
Employment
5,916 2,929 3,657 13,380 7,539
Unemployment Number Rate
532 8.3 273 8.5 248 6.4 682 4.8 543 6.7
Lanier Laurens Lee Liberty Lincoln
3,876 3,651
225 5.8
18,766 17,499 1,267 6.8
14,300 13,599
701 4.9
25,505 24,029 1,476 5.8
3,420 3,199
221 6.5
Long Lowndes Lumpkin McDuffie McIntosh
6,745 6,358
387 5.7
51,667 48,869 2,798 5.4
15,534 14,733
801 5.2
8,931 8,209
722 8.1
6,248 5,874
374 6.0
Macon Madison Marion Meriwether Miller
4,673 13,244
3,491 9,099 2,710
4,317 12,592
3,240 8,467 2,556
356 7.6 652 4.9 251 7.2 632 6.9 154 5.7
Mitchell
8,711 8,146 565 6.5
Monroe
13,083 12,407
676 5.2
Montgomery 3,732 3,453
279 7.5
Morgan
8,852 8,406 446 5.0
Murray
16,153 15,018 1,135 7.0
Muscogee Newton Oconee Oglethorpe Paulding
80,124 74,604 5,520 6.9
50,063 47,049 3,014 6.0
18,170 17,398
772 4.2
6,950 6,620 330 4.7
78,737 75,042 3,695 4.7
Peach Pickens Pierce Pike Polk
11,498 10,716
782 6.8
14,502 13,788
714 4.9
8,484 8,013
471 5.6
8,622 8,163 459 5.3
18,342 17,182 1,160 6.3
Pulaski Putnam Quitman Rabun Randolph
4,104 7,844
840 7,130 2,438
3,868 7,288
776 6,655 2,218
236 5.8 556 7.1
64 7.6 475 6.7 220 9.0
Revised June 2016
Labor Force
6,511 3,194 3,952 14,020 8,010
Employment
6,013 2,934 3,706 13,329 7,442
Unemployment Number Rate
498 7.6 260 8.1 246 6.2 691 4.9 568 7.1
3,846 3,615
231 6.0
18,879 17,594 1,285 6.8
14,272 13,540
732 5.1
25,304 23,804 1,500 5.9
3,436 3,229
207 6.0
6,778 6,374 404 6.0
51,106 48,170 2,936 5.7
15,589 14,716
873 5.6
8,779 8,162
617 7.0
6,263 5,904 359 5.7
4,758 13,238
3,477 9,018 2,795
4,391 12,569
3,232 8,406 2,640
367 7.7 669 5.1 245 7.0 612 6.8 155 5.5
8,889 8,303 586 6.6
13,043 12,358 685 5.3
3,779 3,507
272 7.2
8,832 8,385
447 5.1
16,090 14,952 1,138 7.1
79,466 73,958 5,508 6.9
49,589 46,537 3,052 6.2
18,188 17,368
820 4.5
7,011 6,671 340 4.8
77,947 74,183 3,764 4.8
11,626 10,824 802 6.9
14,343 13,617
726 5.1
8,511 8,045 466 5.5
8,539 8,084 455 5.3
18,227 17,101 1,126 6.2
4,161 7,871
829 6,904 2,525
3,914 7,310
772 6,515 2,302
247 5.9 561 7.1
57 6.9 389 5.6 223 8.8
Revised July 2015
Labor Force
6,307 3,150 3,799 13,654 7,871
Employment
5,663 2,859 3,519 12,873 7,225
Unemployment Number Rate
644 10.2 291 9.2 280 7.4 781 5.7 646 8.2
3,760 18,383 13,840 25,215
3,315
3,491 16,893 13,034 23,532
3,072
269 7.2 1,490 8.1
806 5.8 1,683 6.7
243 7.3
6,612 50,096 15,011
8,727 5,989
6,184 46,811 14,097
7,939 5,572
428 6.5 3,285 6.6
914 6.1 788 9.0 417 7.0
4,645 12,720 3,480 8,886
2,616
4,223 11,969
3,147 8,093 2,463
422 9.1 751 5.9 333 9.6 793 8.9 153 5.8
8,678 12,720
3,769 8,510 15,825
8,043 11,933 3,429
8,018 14,562
635 7.3 787 6.2 340 9.0 492 5.8 1,263 8.0
78,912 72,783 6,129 7.8
48,480 45,080 3,400 7.0
17,381 16,540
841 4.8
6,665 6,271 394 5.9
76,087 71,925 4,162 5.5
11,301 13,996
8,116 8,316 18,004
10,368 13,217
7,567 7,812 16,719
933 8.3 779 5.6 549 6.8 504 6.1 1,285 7.1
4,029 7,738
834 6,949 2,396
3,737 7,056
771 6,501 2,148
292 7.2 682 8.8
63 7.6 448 6.4 248 10.4
Source: Georgia Department of Labor, Workforce Statistics & Economic Research
19
Georgia Labor Force Estimates by County (not seasonally adjusted) Place of Residence - Persons 16 Years and Older
Richmond Rockdale Schley Screven Seminole
Preliminary July 2016
Labor Force
Employment
Unemployment Number Rate
86,008 79,982 6,026 7.0
43,870 41,395 2,475 5.6
2,133 2,002
131 6.1
5,160 4,687
473 9.2
3,136 2,900
236 7.5
Spalding Stephens Stewart Sumter Talbot
28,399 26,409 1,990 7.0
10,985 10,257
728 6.6
2,177 2,041
136 6.2
13,062 12,107
955 7.3
2,767 2,572
195 7.0
Taliaferro Tattnall Taylor Telfair Terrell
587 9,312 2,864 4,727 3,657
547 8,796 2,637 4,345 3,423
40 6.8 516 5.5 227 7.9 382 8.1 234 6.4
Thomas Tift Toombs Towns Treutlen
17,065 15,945 1,120 6.6
19,033 17,989 1,044 5.5
11,973 11,033 940 7.9
3,969 3,677
292 7.4
2,822 2,607
215 7.6
Troup Turner Twiggs Union Upson
37,502 35,399 2,103 5.6
3,229 3,023
206 6.4
3,034 2,766
268 8.8
10,257 9,769
488 4.8
11,174 10,484 690 6.2
Walker
30,403 28,684 1,719 5.7
Walton
43,496 41,407 2,089 4.8
Ware
15,400 14,524
876 5.7
Warren
2,710 2,495
215 7.9
Washington
7,153 6,678
475 6.6
Wayne Webster Wheeler White Whitfield
11,347 10,556
791 7.0
988
902
86 8.7
1,676 1,518
158 9.4
14,499 13,828
671 4.6
45,731 42,960 2,771 6.1
Wilcox Wilkes Wilkinson Worth
2,735 3,770 3,682 9,028
2,535 3,521 3,443 8,495
200 7.3 249 6.6 239 6.5 533 5.9
Revised June 2016
Labor Force
Employment
Unemployment Number Rate
85,120 79,409 5,711 6.7
43,405 40,876 2,529 5.8
2,157 2,021
136 6.3
5,182 4,780
402 7.8
3,178 2,937
241 7.6
27,988 26,117 1,871 6.7
11,001 10,341 660 6.0
2,208 2,075
133 6.0
13,265 12,270 995 7.5
2,740 2,556
184 6.7
595 9,459 2,887 4,857 3,675
552 8,945 2,666 4,429 3,423
43 7.2 514 5.4 221 7.7 428 8.8 252 6.9
17,269 19,275 12,064
3,923 2,863
16,130 18,169 11,184 3,607 2,668
1,139 6.6 1,106 5.7
880 7.3 316 8.1 195 6.8
36,962 35,040 1,922 5.2
3,322
3,113
209 6.3
3,020 2,757
263 8.7
10,302 9,804
498 4.8
11,202 10,510
692 6.2
30,202 28,459 1,743 5.8
43,115 40,938 2,177 5.0
15,436 14,560
876 5.7
2,670 2,496
174 6.5
7,194 6,697
497 6.9
11,440 10,658
782 6.8
1,005
922
83 8.3
1,742 1,583
159 9.1
14,362 13,671
691 4.8
45,353 42,631 2,722 6.0
2,843 3,824 3,665 9,085
2,640 3,576 3,436 8,546
203 7.1 248 6.5 229 6.2 539 5.9
Revised July 2015
Labor Force
Employment
Unemployment Number Rate
84,333 42,525
2,088 5,073 3,118
77,422 39,685
1,935 4,600 2,855
6,911 8.2 2,840 6.7
153 7.3 473 9.3 263 8.4
27,650 10,735
2,091 12,815
2,716
25,302 9,999 1,935 11,697 2,482
2,348 8.5 736 6.9 156 7.5
1,118 8.7 234 8.6
586 9,253 2,702 4,697 3,558
538 8,642 2,448 4,270 3,274
48 8.2 611 6.6 254 9.4 427 9.1 284 8.0
16,797 17,902 12,019 3,849 2,783
15,465 16,714 10,946 3,520 2,529
1,332 7.9 1,188 6.6 1,073 8.9
329 8.5 254 9.1
36,372 3,174 2,946 9,827 11,114
33,894 2,948 2,664 9,280
10,254
2,478 6.8 226 7.1 282 9.6 547 5.6 860 7.7
29,775 42,077 14,740
2,631 7,279
27,892 39,683 13,725
2,415 6,732
1,883 6.3 2,394 5.7 1,015 6.9
216 8.2 547 7.5
11,395 979
1,674 13,943 44,844
10,467 866
1,479 13,175 41,724
928 8.1 113 11.5 195 11.6 768 5.5 3,120 7.0
2,672 3,744 3,579 8,726
2,457 3,446 3,288 8,105
215 8.0 298 8.0 291 8.1 621 7.1
Source: Georgia Department of Labor, Workforce Statistics & Economic Research
20
New Developments
Top Gun Powder Coating & Architectural Coating, a leading provider of world class architectural finishes, will expand to create a total of 70 new jobs in Adairsville and Jasper. Top Gun Powder Coating & Architectural Coating currently employs 35 full-time associates at four locations. The company provides architectural coatings such as Kynar, powder, industrial liquid and military and media blast cleaning services to support industries including: defense, sports and recreation, commercial food and lodging, transportation, oil, gas and electric. Top Gun plans to add 10 employees to their existing location in Jasper and create an additional 60 new jobs with the opening of a new facility in Adairsville.
Wholesale Screening Solutions and Georgia Public Records Solutions have announced plans to open an office in Flowery Branch. Both of the companies are subsidiaries of Lowers Risk Group, headquartered in Virginia. The Hall County location they will lease is about 19,600 square feet on Spout Springs Road. The company plans to hire about 50 people by October for its background check business as well as another 100 people by the end of 2017. The company provides public records research and verifications for employment and tenant screenings.
Atlanta based financial technology company Payscape has said it will relocate to midtown Atlanta. The company plans to move into a 43,000 square foot building on West Peachtree St. Payscape is investing $50 million in this expansion which will also bring in about 200 jobs. The company provides web based payment applications that allow small businesses to accept mobile and online payments from their customers.
Hubbell Incorporated, a manufacturer of electrical and electronic products for a broad range of non-residential and residential construction, industrial and utility applications, recently announced plans to create 100 new jobs in Jackson County. Hubbell's new warehouse and distribution facility will be located in Jefferson Distribution Industrial Park.
Pratt & Whitney, a world leader in the design, manufacturing and servicing of aircraft engines and auxiliary power units, has said it will invest $65 million in its Columbus facility. Plans are to retrofit and equip their Columbus Engine Center to perform PurePower Geared Turbofan (GTF) engine maintenance on-site. The company's current facility is located at 8801 Macon Road. The investment will support the current employment of administrative, technical, supervision and technical support, production and maintenance positions at the facility. Pratt & Whitney will invest capital for facilities construction and improvement, infrastructure and equipment. The company's operations in Columbus include Pratt & Whitney Columbus Engine Center, Columbus Forge and PCI.
Granite Telecommunications, LLC, a provider of communications solutions to businesses and governments, has said it will expand its current operation in Cobb County. The expansion should bring 50 new jobs in sales, engineering, support and leadership. Granite's current Georgia operation is located on Circle 75 Pkwy, Atlanta. Granite Telecommunications has provided voice, data and other related communications products and services to multi-location businesses and governmental agencies throughout the United States and Canada.
Global Payments recently announced plans on expanding its office in Sandy Springs as well as move its headquarters to Buckhead in Atlanta in early 2017. The company will create more than 275 jobs in the dual expansion that involves relocating its headquarters to Buckhead's Three Alliance Center, while making a significant investment in improvements and upgrades to the current Sandy Springs operations center. Global Payments Inc. is a leading provider of payment technology services in markets throughout North America, Europe, the Asia-Pacific region and Brazil.
Note: Information in New Developments are from a variety of public sources and by no means are a comprehensive listing of new and expanding business in Georgia
Source: Georgia Department of Labor, Workforce Statistics and Economic Research
21
UNEMGPeoLrOgiaYUMneEmNploTymReAntTREateBs bYy CCoOunUtyNTIES JULY 2016
July 2016
Dade 5.6
Catoosa 5.0
Walker
Whitfield
Murray 7.0
Fannin 5.4
Union 4.8
Towns 7.4
Rabun 6.7
5.7
6.1
Chattooga 7.2
Gordon 5.6
Floyd 6.6
Bartow 5.2
Gilmer 5.6
Pickens 4.9
Cherokee 4.3
Lumpkin 5.2
Dawson 4.7
Forsyth 4.2
White Habersham
4.6
5.6
Stephens
6.6
Hall 4.6
Banks Franklin
5.2
6.0
Jackson 4.3
Madison 4.9
Hart 6.4
Elbert 7.7
7.0% or greater 42 counties (26%)
6.0% to 6.9% 44 counties (28%)
5.0% to 5.9% 50 counties (31%)
Polk 6.3
Paulding
Cobb 4.5
Gwinnett 4.8
Barrow 4.7
Clarke 5.6
Oglethorpe 4.7
Less than 5.0% 23 counties (14%)
Haralson 6.8
Carroll 6.6
Heard 6.4
4.7 Douglas 5.5
Coweta 5.1
Fulton 5.3
DeKalb 5.3 Rockdale
Walton 4.8
Oconee 4.2
Wilkes 6.6
Lincoln 6.5
Percentages of number of counties may not total 100 due to rounding
Clayton
6.4
Fayette 4.8
Henry 5.5
Spalding 7.0
5.6 Newton 6.0
Morgan 5.0
Butts 5.6
Jasper 4.8
Putnam 7.1
Greene 6.2
Taliaferro
6.8
McDuffie
Warren 8.1
Columbia 5.0
7.9
Richmond
Hancock
7.0
9.4
Glascock
6.8
Troup 5.6
Meriwether 6.9
Pike 5.3
Lamar 6.7
Monroe 5.2
Jones 4.8
Baldwin 7.5
Washington
Jefferson 8.3
Burke 8.6
Upson
6.6
Harris 5.0
Talbot 7.0
Muscogee 6.9
Marion Chattahoochee 7.2
6.2
Taylor 7.9
Crawford 5.6
Bibb 5.9
Twiggs 8.8
Wilkinson 6.5
Peach 6.8
Macon 7.6
Houston 5.4
Bleckley 8.2
Laurens 6.8
Johnson 6.4
Emanuel 8.2
Jenkins 8.5
Screven 9.2
Treutlen 7.6
Candler 5.6
Bulloch 6.5
Effingham 4.7
9.0
Stewart 6.2
Schley 6.1
Webster 8.7
Sumter 7.3
Quitman
7.6 Randolph 9.0
Terrell 6.4
Lee 4.9
Clay 10.5
Calhoun 6.2
Dougherty 6.9
Early 6.6
Miller 5.7
Baker 8.0
Mitchell 6.5
Dooly 5.7
Pulaski 5.8
Dodge 7.2
Crisp 5.9
Wilcox 7.3
Turner 6.4
Ben Hill 9.2
Montgomery
Wheeler 9.4
7.5
Toombs 7.9
Evans 5.7
Tattnall
Telfair
5.5
8.1
Jeff Davis 6.2
Appling 7.1
Long 5.7
Bryan 4.9
Liberty 5.8
Worth 5.9
Colquitt 5.8
Irwin
7.7 Tift 5.5
Coffee 6.4
Berrien
Atkinson
6.7
6.0
Cook
5.7 Lanier
Bacon 5.3
Wayne 7.0
Pierce 5.6
Ware 5.7
Brantley 7.0
McIntosh 6.0
Glynn 5.3
Chatham 5.1
Seminole 7.5
Decatur 6.5
Grady 5.6
Thomas 6.6
Brooks 5.3
5.8
Lowndes 5.4
Clinch 6.2
Charlton 6.1
Camden 5.3
Echols
4.4
Georgia's Unemployment Rate: 5.4%
Georgia's U(nNoet SmeasponlaollyyAmdjusetend)t Rate: 5.4% (not seasonally adjusted) Source: Georgia Department of Labor, Workforce Statistics and Economic Research
22
Georgia Unemployment Insurance Claims by County
County
July 2016 Average Average Initial Weekly Duration
Claims Benefit Weeks
County
July 2016 Average Average Initial Weekly Duration
Claims Benefit Weeks
County
July 2016 Average Average Initial Weekly Duration
Claims Benefit Weeks
Georgia
35,639........ $275.........8.9
Appling
127........ $256.........9.1
Atkinson
181........ $255.........5.6
Bacon
40........ $227.........6.4
Baker
10........ $247.......10.5
Baldwin
118........ $201.........9.7
Banks
77........ $214.........7.2
Barrow
123........ $247.........9.6
Bartow
365........ $259.........6.8
Ben Hill
170........ $204.........7.7
Berrien
80........ $232.........6.6
Bibb
480........ $199.......10.6
Bleckley
33........ $212.........9.0
Brantley
44........ $270.......10.0
Brooks
30........ $188.........9.9
Bryan
68........ $263.......10.7
Bulloch
320........ $239.........8.2
Burke
190........ $224.........7.8
Butts
91........ $250.......12.3
Calhoun
15........ $229.........7.0
Camden
83........ $216.......10.6
Candler
68........ $238.........8.1
Carroll
862........ $225.........8.3
Catoosa
107........ $253.........6.4
Charlton
19........ $187.......10.6
Chatham
617........ $243.......10.5
Chattahoochee 17........$250.......12.3
Chattooga
45........ $255.........9.4
Cherokee
328........ $274.........9.8
Clarke
294........ $215.........8.9
Clay
16........ $241.........8.4
Clayton
1,080........$241....... 11.1
Clinch
18........ $160.......12.2
Cobb
1,410........$263....... 11.0
Coffee
358........ $249.........6.6
Colquitt
140........ $193.........9.9
Columbia
283........ $253.........9.5
Cook
42........ $226.........7.9
Coweta
492........ $269.........8.6
Crawford
37........ $234.........9.2
Crisp
64........ $202.........9.1
Dade
43........ $236.........5.8
Dawson
30........ $255.......10.2
Decatur
89........ $231.......12.1
DeKalb
2,047........$246....... 11.2
Dodge
151........ $207.........9.9
Dooly
20........ $208.........7.9
Dougherty
344........ $206.......10.4
Douglas
386........ $257.......10.7
Early
16........ $174.......13.4
Echols
5........ $202.........8.6
Effingham
122........ $275.........9.4
Elbert Emanuel Evans Fannin Fayette Floyd Forsyth Franklin Fulton Gilmer Glascock Glynn Gordon Grady Greene Gwinnett Habersham Hall Hancock Haralson Harris Hart Heard Henry Houston Irwin Jackson Jasper Jeff Davis Jefferson Jenkins Johnson Jones Lamar Lanier Laurens Lee Liberty Lincoln Long Lowndes Lumpkin Macon Madison Marion McDuffie McIntosh Meriwether Miller Mitchell Monroe Montgomery Morgan Murray
220........ $229.........6.4 179........ $204.........8.9
45........ $252.........8.5 85........ $226.........7.8 173........ $264.......10.4 675........ $237.........7.5 233........ $276.......10.2 206........ $222.........5.7 2,828........$245....... 11.1 81........ $259.........6.9 14........ $171.........9.3 255........ $217.......10.1 393........ $246.........5.8 64........ $173.........6.7 32........ $234.......10.7 1,620........ $261.......10.7 377........ $191.........5.8 890........ $233.........8.2 33........ $225.........8.8 245........ $229.........6.9 94........ $248.........7.9 172........ $233.........5.6 84........ $251.........6.4 651........ $254.......10.5 379........ $215.........9.5 66........ $220.........8.1 177........ $237.........8.2 27........ $232.........8.4 50........ $248.........7.3 117........ $204.........8.2 52........ $229.........7.2 44........ $209.........8.9 65........ $242.........9.7 88........ $232.........8.5 20........ $208.........8.4 223........ $189.......10.4 94........ $248.........8.3 141........ $206.......10.9 46........ $201.........6.9 31........ $218.......10.5 228........ $197.........9.8 56........ $251.........9.1 92........ $211.........9.1 88........ $242.........7.3 40........ $231.......13.8 246........ $218.........7.3 29........$248....... 11.1 198........ $241.........8.0 21........ $227.......12.1 66........ $223.......10.6 76........$235....... 11.0 65........ $218.........8.8 41........ $254.........9.3 484........ $247.........5.0
Muscogee Newton Oconee Oglethorpe Paulding Peach Pickens Pierce Pike Polk Pulaski Putnam Quitman Rabun Randolph Richmond Rockdale Schley Screven Seminole Spalding Stephens Stewart Sumter Talbot Taliaferro Tattnall Taylor Telfair Terrell Thomas Tift Toombs Towns Treutlen Troup Turner Twiggs Union Upson Walker Walton Ware Warren Washington Wayne Webster Wheeler White Whitfield Wilcox Wilkes Wilkinson Worth
761........ $229.........8.7 410........ $244.........9.8
33........ $237.........8.5 29........ $243.........9.1 301........ $262.......10.0 107........ $223.........8.0 67........ $259.........8.1 42........ $264.........9.2 92........ $258.........8.6 215........ $244.........6.9 27........ $194.........9.2 79........ $230.........9.3
2........ $315.........8.9 106........ $209.........5.4
54........ $207.........8.0 1,005........ $232.........9.8
252........ $251.......10.2 14........ $278.........9.9
126........ $225.........6.0 19........$210....... 11.8
526........ $228.........9.0 260........ $213.........5.6
26........$240....... 11.3 177........ $188.......10.8
46........ $217.........9.2 5........ $206.........4.5
60........ $211.........9.5 39........ $197.........8.3 226........ $203.........8.7 48........ $155.........7.5 120........ $197.........9.5 98........ $213.........9.2 192........ $236.........8.8 15........ $215.........9.5 44........ $187.........9.3 888........ $218.........7.3 29........ $185.........8.7 31........ $216.......10.1 30........ $255.........9.4 242........ $244.........9.2 204........ $232.........4.7 162........ $257.........9.2 145........ $195.........9.0 83........ $216.........7.0 52........ $197.........9.6 84........$251....... 11.0
8........ $200.......14.6 37........ $217.........8.4 85........ $208.........7.8 1,080........ $238.........4.8 42........ $182.........9.5 48........ $208.........6.7 23........ $232.........9.2 72........ $247.........9.6
Note: Initial claims include intrastate initial and additional claims, as well as agent state initial and additional claims for regular UI only. Average duration of benefits is represented in weeks.
Data does not include state or federal extended benefits.
Source: Georgia Department of Labor, Workforce Statistics and Economic Research
23
Mark Butler, Commissioner 148 Andrew Young International Boulevard, N.E. Atlanta, Georgia 30303-1751
Return Service Requested