- Collection:
- Georgia Government Publications
- Title:
- Dimensions: measuring Georgia's workforce, Vol. 42, no. 2 (Feb. 2016)
- Creator:
- Georgia. Department of Labor
- Contributor to Resource:
- Georgia. Workforce Information and Analysis
- Publisher:
- Atlanta, Ga. : Georgia Dept. of Labor, 2016-02
- Date of Original:
- 2016-02
- Subject:
- Labor market--Georgia--Statistics
Wages--Georgia--Statistics
Hours of labor--Georgia--Statistics - Location:
- United States, Georgia, 32.75042, -83.50018
- Medium:
- state government records
- Type:
- Text
- Format:
- application/pdf
- External Identifiers:
- Call Number GA L200.E46 P1 T7 42/2
- Metadata URL:
- https://dlg.galileo.usg.edu/id:dlg_ggpd_i-ga-bl200-pe46-bp1-bt7-b42-s2-belec-p-btext
- Digital Object URL:
- https://dlg.galileo.usg.edu/do:dlg_ggpd_i-ga-bl200-pe46-bp1-bt7-b42-s2-belec-p-btext
- Language:
- eng
- Holding Institution:
- University of Georgia. Map and Government Information Library
- Rights:
-

Jackson Madison Elbert
Polk
Cobb
Gwinnett Barrow Clarke
D I M E N S I O Paulding
Haralson Douglas
DeKalb Rock-
Walton
Oconee Oglethorpe
Wilkes
Lincoln
EdgefieSlCd,
Carroll
Fulton Clayton
dale Newton
Morgan Greene Taliaferro
Columbia
Fayette Henry
McDuffie Warren
Heard
Coweta
Spalding Butts Jasper Putnam Hancock
Glascock
Richmond
AikenSC,
N
S
Russell, AL
Measuring Georgia's Workforce Troup Meriwether Pike Lamar Monroe Upson
Jones
Baldwin
Jefferson Washington
Burke
Bibb
Harris
Talbot
Crawford
February
Muscogee
2016
Data
Taylor
Peach
Wilkinson Twiggs
Johnson
Jenkins Emanuel
Screven
Volume XLII, Number 2
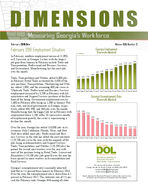
February 2016 Employment Situation Marion Chattahoo-
Houston Bleckley Macon
Laurens
Treutlen
chee
In millions
CandlGereorgBuialloEcmh ploEyfmfinegnhatm
(Seasonally Adjusted)
QuIojiontrmbSF0atgn.ee3wabairpnruteafrrrcoyWe,mnenbt,osJtianenrnSfcauGhralmeerSyoyuremgtmotiearpF.leoSbyermcuDtaoeCorrnroiysstlpyiwinnicctPlrhuueWldatahisselckeeoiTdxlra1arDd1goe,e9dsag0ten0d,TelfairWheeleMr ontgoTmooemrybs
TanradnRGsapnodovoreltprahntimoneTe,nrrPte.rllMofaenssLuiefoeancatul rainndg
Business Services, loTusrtnetrhe mosBtejnoHbisll
Jeff Davis
Appling
Evans Tattnall
Bryan
Liberty Long
4.28 4.28
Chatham 4.32 4.33
4.31
4.33
4.34
over the month.
Clay
Calhoun
Dougherty Worth
Irwin
Coffee
Tift
TrEaadrlye, TranspBoarkteartion and Utilities added 6,000 jobs in February. Retail Trade accounted for 3,400Beorrfietnhe
Atkinson
4.23
new pMosililetrions; TranMspitcohretlal tion,CWolqaurietthouCsoionkg and Utili-
Bacon
4.25
4.23 4.23
Pierce
4.26 4.27 Wayne
Ware
Brantley
McIntosh Glynn
ties added 2,000; and the remaining 600 jobs werLeaniiner
WhSeomleinsoalele Trade. Professional and Business Services employmDeenctatiunrcreaGsreaddyby 3Th,7om00as in FBreobokrsuaryLwowitnhdeAs d-
ClincFheb-15 Mar-15 Apr-15 May-15 Jun-15 JuCl-1a5mAduge-n15 Sep-15 Oct-15 Nov-15 Dec-15 Jan-16 Feb-16 Charlton
ministrative and Support Services positions at the foEcrheo-ls
Georgia Unemployment Rate
front of the hiring. Government employment rose by
(Seasonally Adjusted)
1,600 in February after being up 1,300 in January. Fed-
eral, state, and local governments in Georgia, respec-
tively, added 300, 900, and 400 jobs over the month.
Manufacturing took the biggest job hit in February with employment down 1,200. After 10 consecutive months of employment growth, the sector is experiencing a decline this month.
6.2% 6.2% 6.1%
5.9% 5.8% 5.7% 5.6% 5.6% 5.5% 5.5% 5.5%
Over the year, Georgia has added 116,000 jobs to its
5.4% 5.4%
economy. Only California, Florida, Texas, and New
York have added more jobs. Professional and Busi-
ness Services in the state has added the most positions (+29,700 jobs) over the year, with the majority of the
Feb-15 Mar-15 Apr-15 May-15 Jun-15 Jul-15 Aug-15 Sep-15 Oct-15 Nov-15 Dec-15 Jan-16 Feb-16
jobs being in Administrative and Support Services.
Trade, Transportation, and Utilities (+28,500 jobs) has
gained the second most workers over the year with
most of the positions being in Retail Trade. Leisure and
Hospitality (+19,100 jobs) job growth over the year has been spurred by more workers in Accommodation and Food Services.
Workforce Statistics & Economic Research Mark Butler, Commissioner
Georgia's unemployment rate (seasonally adjusted) held flat at 5.4 percent from January to February 2016. Over the year, the unemployment rate is down from 6.2 percent in February 2015. The statewide rate of 5.4 percent this February ranks Georgia 34th among all states.
For more information, contact Corey Smith or Evan Cross at (404) 232-3875
corey.smith@gdol.ga.gov evan.cross@gdol.ga.gov
Equal Opportunity Employer/ProgramAuxiliary Aids and Services Available upon Request to Individuals with Disabilities
GEORGIA Nonfarm Employment
(In thousands)
(Seasonally Adjusted)
Preliminary
Revised
FEB 2016 JAN 2016
Revised FEB 2015
Change in Jobs from JAN 2016
Net %
Change in Jobs from FEB 2015
Net %
Total Nonfarm
4,342.1
4,330.2
4,226.1
11.9 0.3
116.0 2.7
Total Private
3,658.1
3,647.8
3,547.2
10.3 0.3
110.9 3.1
Goods Producing
567.3
567.7
549.4
-0.4 -0.1
17.9 3.3
Service-Providing
3,774.8
3,762.5
3,676.7
12.3 0.3
98.1 2.7
Private Service-Providing
3,090.8
3,080.1
2,997.8
10.7 0.3
93.0 3.1
Mining and Logging
8.8
8.9
9.0
-0.1 -1.1
-0.2 -2.2
Mining, Logging and Construction
182.2
181.4
173.4
0.8 0.4
8.8 5.1
Construction
173.4
172.5
164.4
0.9 0.5
9.0 5.5
Manufacturing
385.1
386.3
376.0
-1.2 -0.3
9.1 2.4
Durable Goods
189.2
189.9
182.8
-0.7 -0.4
6.4 3.5
Non-Durable Goods
195.9
196.4
193.2
-0.5 -0.3
2.7 1.4
Trade, Transportation, and Utilities
924.1
918.1
895.6
6.0 0.7
28.5 3.2
Wholesale Trade
216.9
216.3
213.9
0.6 0.3
3.0 1.4
Retail Trade
499.4
496.0
479.4
3.4 0.7
20.0 4.2
Transportation, Warehousing, and Utilities
207.8
205.8
202.3
2.0 1.0
5.5 2.7
Information
102.4
102.1
104.8
0.3 0.3
-2.4 -2.3
Financial Activities
238.5
238.7
232.8
-0.2 -0.1
5.7 2.4
Finance and Insurance
177.2
176.4
171.2
0.8 0.5
6.0 3.5
Real Estate and Rental and Leasing
61.3
62.3
61.6
-1.0 -1.6
-0.3 -0.5
Professional and Business Services
662.8
659.1
633.1
3.7 0.6
29.7 4.7
Professional, Scientific, and Technical Services
265.5
266.3
255.6
-0.8 -0.3
9.9 3.9
Management of Companies and Enterprises
66.0
65.4
66.3
0.6 0.9
-0.3 -0.5
Admin and Support, Waste Mngmnt and Remediation
331.3
327.4
311.2
3.9 1.2
20.1 6.5
Education and Health Services
543.8
542.9
533.4
0.9 0.2
10.4 1.9
Educational Services
70.1
71.6
69.9
-1.5 -2.1
0.2 0.3
Health Care and Social Assistance
473.7
471.3
463.5
2.4 0.5
10.2 2.2
Leisure and Hospitality
462.1
461.7
443.0
0.4 0.1
19.1 4.3
Arts, Entertainment, and Recreation
49.8
49.7
45.5
0.1 0.2
4.3 9.5
Accommodation and Food Services
412.3
412.0
397.5
0.3 0.1
14.8 3.7
Other Services
157.1
157.5
155.1
-0.4 -0.3
2.0 1.3
Government
684.0
682.4
678.9
1.6 0.2
5.1 0.8
Federal Government
99.5
99.2
98.8
0.3 0.3
0.7 0.7
State Government
172.6
171.7
172.7
0.9 0.5
-0.1 -0.1
Local Government
411.9
411.5
407.4
0.4 0.1
4.5 1.1
Note: These seasonally adjusted estimates were prepared in cooperation with the U.S. Department of Labor, Bureau of Labor Statistics, based upon monthly reports submitted by selected
employers throughout Georgia. The estimates include all full- and part-time wage and salary workers who were employed during or received pay for any part of the pay period that includes the twelfth of the month. Proprietors, domestic workers, self-employed persons, unpaid family workers and personnel of the armed forces are excluded. Estimates based on 2015 benchmark.
Source: Georgia Department of Labor, Workforce Statistics & Economic Research
Georgia Department of Labor, Mark Butler, Commissioner Equal Opportunity Employer/Program Auxiliary Aids and Services Available Upon Request to Individuals With Disabilities
2
GEORGIA Nonfarm Employment
(In thousands)
(Not Seasonally Adjusted)
Preliminary
Revised
Revised
FEB 2016 JAN 2016 FEB 2015
Change in Jobs from JAN 2016
Net %
Change in Jobs from FEB 2015
Net %
Total Nonfarm
4,308.1
4,289.3
4,188.1
18.8 0.4
120.0 2.9
Total Private
3,619.6
3,606.9
3,505.3
12.7 0.4
114.3 3.3
Goods Producing
565.3
562.7
545.1
2.6 0.5
20.2 3.7
Service-Providing
3,742.8
3,726.6
3,643.0
16.2 0.4
99.8 2.7
Private Service-Providing
3,054.3
3,044.2
2,960.2
10.1 0.3
94.1 3.2
Mining and Logging
8.8
8.9
9.0
-0.1 -1.1
-0.2 -2.2
Mining, Logging and Construction
180.0
176.9
170.3
3.1 1.8
9.7 5.7
Construction
171.2
168.0
161.3
3.2 1.9
9.9 6.1
Construction of Buildings
36.8
36.6
35.8
0.2 0.6
1.0 2.8
Heavy and Civil Engineering Construction
25.1
24.6
21.7
0.5 2.0
3.4 15.7
Specialty Trade Contractors
109.3
106.8
103.8
2.5 2.3
5.5 5.3
Manufacturing
385.3
385.8
374.8
-0.5 -0.1
10.5 2.8
Durable Goods
189.4
189.9
182.3
-0.5 -0.3
7.1 3.9
Computer, Electrical Equip and Appliance Mfg
22.7
22.8
22.9
-0.1 -0.4
-0.2 -0.9
Transportation Equipment Manufacturing
50.6
50.5
48.8
0.1 0.2
1.8 3.7
Non-Durable Goods
195.9
195.9
192.5
0.0 0.0
3.4 1.8
Food Manufacturing
64.5
64.6
63.9
-0.1 -0.2
0.6 0.9
Textile Mills
20.0
19.7
19.4
0.3 1.5
0.6 3.1
Textile Product Mills
29.1
29.1
27.6
0.0 0.0
1.5 5.4
Trade, Transportation, and Utilities
913.9
914.7
884.1
-0.8 -0.1
29.8 3.4
Wholesale Trade
216.8
216.6
213.2
0.2 0.1
3.6 1.7
Merchant Wholesalers, Durable Goods
106.3
106.0
103.6
0.3 0.3
2.7 2.6
Merchant Wholesalers, Nondurable Goods
60.2
60.7
60.7
-0.5 -0.8
-0.5 -0.8
Wholesale Electronic Markets and Agents and Brokers 50.3
49.9
48.9
0.4 0.8
1.4 2.9
Retail Trade
492.1
492.5
470.9
-0.4 -0.1
21.2 4.5
Food and Beverage Stores
91.2
91.4
89.9
-0.2 -0.2
1.3 1.5
General Merchandise Stores
105.4
107.9
102.0
-2.5 -2.3
3.4 3.3
Miscellaneous Store Retailers
20.5
20.7
20.3
-0.2 -1.0
0.2 1.0
Transportation, Warehousing, and Utilities
205.0
205.6
200.0
-0.6 -0.3
5.0 2.5
Utilities
20.3
20.2
20.2
0.1 0.5
0.1 0.5
Transportation and Warehousing
184.7
185.4
179.8
-0.7 -0.4
4.9 2.7
Air Transportation
40.0
39.8
41.0
0.2 0.5
-1.0 -2.4
Truck Transportation
49.9
50.1
48.9
-0.2 -0.4
1.0 2.0
Couriers and Messengers
21.2
23.2
20.4
-2.0 -8.6
0.8 3.9
Warehousing and Storage
33.2
33.2
31.1
0.0 0.0
2.1 6.8
Information
101.7
100.7
104.1
1.0 1.0
-2.4 -2.3
Telecommunications
45.2
45.0
43.8
0.2 0.4
1.4 3.2
Wired Telecommunications Carriers
30.1
30.0
29.5
0.1 0.3
0.6 2.0
Wireless Telecommunications Carriers
7.4
7.4
7.0
0.0 0.0
0.4 5.7
Internet Service Providers, Search Portals, and DP
8.1
8.1
8.2
0.0 0.0
-0.1 -1.2
Financial Activities
237.1
238.3
231.7
-1.2 -0.5
5.4 2.3
Finance and Insurance
176.7
176.7
170.8
0.0 0.0
5.9 3.5
Insurance Carriers and Related Activities
82.5
82.1
79.5
0.4 0.5
3.0 3.8
Real Estate and Rental and Leasing
60.4
61.6
60.9
-1.2 -2.0
-0.5 -0.8
Professional and Business Services
651.8
644.9
625.3
6.9 1.1
26.5 4.2
Professional, Scientific, and Technical Services
267.5
265.5
256.2
2.0 0.8
11.3 4.4
Accounting, Tax Prep, and Bookkeeping Services
48.8
47.7
42.1
1.1 2.3
6.7 15.9
Architectural, Engineering, and Related Services
44.6
43.9
41.0
0.7 1.6
3.6 8.8
Computer Systems Design and Related Services
64.5
64.4
63.7
0.1 0.2
0.8 1.3
Management and Technical Consulting Services
38.4
38.5
37.4
-0.1 -0.3
1.0 2.7
Management of Companies and Enterprises
65.6
65.3
65.9
0.3 0.5
-0.3 -0.5
Admin and Support, Waste Mngmnt and Remediation
318.7
314.1
303.2
4.6 1.5
15.5 5.1
Employment Services
160.3
156.8
146.4
3.5 2.2
13.9 9.5
Education and Health Services
544.9
542.6
533.3
2.3 0.4
11.6 2.2
Educational Services
71.8
70.7
71.3
1.1 1.6
0.5 0.7
Colleges, Universities, and Professional Schools
33.1
31.4
32.2
1.7 5.4
0.9 2.8
Health Care and Social Assistance
473.1
471.9
462.0
1.2 0.3
11.1 2.4
Ambulatory Health Care Services
181.2
181.7
180.0
-0.5 -0.3
1.2 0.7
Hospitals
167.3
166.9
159.3
0.4 0.2
8.0 5.0
Nursing and Residential Care Facilities
59.1
59.1
59.0
0.0 0.0
0.1 0.2
Social Assistance
65.5
64.2
63.7
1.3 2.0
1.8 2.8
Leisure and Hospitality
447.9
446.8
428.1
1.1 0.3
19.8 4.6
Arts, Entertainment, and Recreation
44.5
44.2
40.4
0.3 0.7
4.1 10.2
Amusement, Gambling, and Recreation Industries
34.1
33.7
30.0
0.4 1.2
4.1 13.7
Accommodation and Food Services
403.4
402.6
387.7
0.8 0.2
15.7 4.1
Accommodation
43.3
43.6
41.5
-0.3 -0.7
1.8 4.3
Food Services and Drinking Places
360.1
359.0
346.2
1.1 0.3
13.9 4.0
Other Services
157.0
156.2
153.6
0.8 0.5
3.4 2.2
Repair and Maintenance
38.1
36.6
37.1
1.5 4.1
1.0 2.7
Personal and Laundry Services
36.1
36.8
35.4
-0.7 -1.9
0.7 2.0
Religious, Grantmaking, Civic, Professional, and Similar
82.8
82.8
81.1
0.0 0.0
1.7 2.1
Government
688.5
682.4
682.8
6.1 0.9
5.7 0.8
Federal Government
99.5
99.6
98.6
-0.1 -0.1
0.9 0.9
Department of Defense
40.7
40.6
40.2
0.1 0.3
0.5 1.2
State Government
175.0
170.1
174.5
4.9 2.9
0.5 0.3
State Government Educational Services
104.0
98.8
101.5
5.2 5.3
2.5 2.5
Local Government
414.0
412.7
409.7
1.3 0.3
4.3 1.1
Local Government Educational Services
245.1
244.0
242.5
1.1 0.5
2.6 1.1
Note: These not seasonally adjusted estimates were prepared in cooperation with the U.S. Department of Labor, Bureau of Labor Statistics, based upon monthly reports submitted by selected
employers throughout Georgia. The estimates include all full- and part-time wage and salary workers who were employed during or received pay for any part of the pay period that includes the twelfth
of the month. Proprietors, domestic workers, self-employed persons, unpaid family workers and personnel of the armed forces are excluded. Estimates based on 2015 benchmark.
Source: Georgia Department of Labor, Workforce Statistics & Economic Research
3
ALBANY MSA Nonfarm Employment
(In thousands)
(Not Seasonally Adjusted)
Preliminary
Revised
Revised
FEB 2016 JAN 2016 FEB 2015
Change in Jobs from JAN 2016
Net %
Change in Jobs from FEB 2015
Net %
Total Nonfarm Total Private Goods Producing Service-Providing Private Service-Providing Manufacturing Trade, Transportation, and Utilities
Retail Trade Government
Federal Government State Government Local Government
61.9
61.6
60.9
0.3 0.5
49.1
48.9
47.8
0.2 0.4
7.1
7.1
6.9
0.0 0.0
54.8
54.5
54.0
0.3 0.6
42.0
41.8
40.9
0.2 0.5
4.3
4.3
4.3
0.0 0.0
11.9
12.0
11.9
-0.1 -0.8
7.2
7.1
7.0
0.1 1.4
12.8
12.7
13.1
0.1 0.8
2.6
2.7
2.8
-0.1 -3.7
2.9
2.7
3.0
0.2 7.4
7.3
7.3
7.3
0.0 0.0
1.0 1.6 1.3 2.7 0.2 2.9 0.8 1.5 1.1 2.7 0.0 0.0 0.0 0.0 0.2 2.9 -0.3 -2.3 -0.2 -7.1 -0.1 -3.3 0.0 0.0
Note: These not seasonally adjusted estimates were prepared in cooperation with the U.S. Department of Labor, Bureau of Labor Statistics, based upon monthly reports submitted by
selected employers in the Albany Metropolitan Statistical Area, which includes Baker, Dougherty, Lee, Terrell and Worth counties. The estimates include all full- and part-time wage and salary workers who were employed during or received pay for any part of the pay period that includes the twelfth of the month. Proprietors, domestic workers, self-employed persons, unpaid familyworkers and personnel of the armed forces are excluded. Estimates based on 2015 benchmark.
ATHENS-CLARKE MSA Nonfarm Employment
(In thousands)
(Not Seasonally Adjusted)
Preliminary
Revised
Revised
FEB 2016 JAN 2016 FEB 2015
Change in Jobs from JAN 2016
Net %
Change in Jobs from FEB 2015
Net %
Total Nonfarm Total Private Goods Producing Service-Providing Private Service-Providing Trade, Transportation, and Utilities
Retail Trade Professional and Business Services Leisure and Hospitality Government
Federal Government State Government Local Government
93.4
92.2
89.4
63.8
63.5
61.0
9.2
9.1
9.2
84.2
83.1
80.2
54.6
54.4
51.8
16.3
16.1
14.7
10.2
10.2
9.8
7.7
7.7
7.3
10.3
10.2
9.7
29.6
28.7
28.4
1.1
1.1
1.2
20.6
19.8
19.6
7.9
7.8
7.6
1.2 1.3 0.3 0.5 0.1 1.1 1.1 1.3 0.2 0.4 0.2 1.2 0.0 0.0 0.0 0.0 0.1 1.0 0.9 3.1 0.0 0.0 0.8 4.0 0.1 1.3
4.0 4.5 2.8 4.6 0.0 0.0 4.0 5.0 2.8 5.4 1.6 10.9 0.4 4.1 0.4 5.5 0.6 6.2 1.2 4.2 -0.1 -8.3 1.0 5.1 0.3 4.0
Note: These not seasonally adjusted estimates were prepared in cooperation with the U.S. Department of Labor, Bureau of Labor Statistics, based upon monthly reports submitted by selected
employers in the Athens - Clarke County Metropolitan Statistical Area, which includes Clarke, Madison, Oconee and Oglethorpe counties. The estimates include all full- and part-time wage and salary workers who were employed during or received pay for any part of the pay period that includes the twelfth of the month. Proprietors, domestic workers, self-employed persons, unpaid family workers and personnel of the armed forces are excluded. Estimates based on 2015 benchmark.
Source: Georgia Department of Labor, Workforce Statistics & Economic Research
4
ATLANTA MSA Nonfarm Employment
(In thousands)
(Not Seasonally Adjusted)
Preliminary FEB 2016
Revised JAN 2016
Revised FEB 2015
Change in Jobs from JAN 2016
Net %
Change in Jobs from FEB 2015
Net %
Total Nonfarm
2,606.5
2,598.8
2,534.0
7.7 0.3
72.5 2.9
Total Private
2,278.3
2,273.4
2,209.2
4.9 0.2
69.1 3.1
Goods Producing
271.5
271.7
261.5
-0.2 -0.1
10.0 3.8
Service-Providing
2,335.0
2,327.1
2,272.5
7.9 0.3
62.5 2.8
Private Service-Providing
2,006.8
2,001.7
1,947.7
5.1 0.3
59.1 3.0
Mining and Logging
1.5
1.5
1.4
0.0 0.0
0.1 7.1
Mining, Logging and Construction
111.6
111.2
105.9
0.4 0.4
5.7 5.4
Construction
110.1
109.7
104.5
0.4 0.4
5.6 5.4
Construction of Buildings
22.7
23.1
22.4
-0.4 -1.7
0.3 1.3
Specialty Trade Contractors
71.1
70.5
68.4
0.6 0.9
2.7 4.0
Manufacturing
159.9
160.5
155.6
-0.6 -0.4
4.3 2.8
Durable Goods
83.7
83.6
80.5
0.1 0.1
3.2 4.0
Transportation Equipment Manufacturing
14.6
14.7
14.3
-0.1 -0.7
0.3 2.1
Non-Durable Goods
76.2
76.9
75.1
-0.7 -0.9
1.1 1.5
Food Manufacturing
24.8
24.8
24.5
0.0 0.0
0.3 1.2
Trade, Transportation, and Utilities
585.9
587.4
567.0
-1.5 -0.3
18.9 3.3
Wholesale Trade
159.1
159.8
156.0
-0.7 -0.4
3.1 2.0
Merchant Wholesalers, Durable Goods
77.8
77.8
76.2
0.0 0.0
1.6 2.1
Merchant Wholesalers, Nondurable Goods
40.0
40.4
40.1
-0.4 -1.0
-0.1 -0.3
Wholesale Electronic Markets and Agents and Brokers
41.3
41.6
39.7
-0.3 -0.7
1.6 4.0
Retail Trade
286.9
287.2
273.5
-0.3 -0.1
13.4 4.9
Food and Beverage Stores
56.5
56.5
55.2
0.0 0.0
1.3 2.4
General Merchandise Stores
57.7
59.4
55.6
-1.7 -2.9
2.1 3.8
Miscellaneous Store Retailers
13.4
13.5
13.3
-0.1 -0.7
0.1 0.8
Transportation, Warehousing, and Utilities
139.9
140.4
137.5
-0.5 -0.4
2.4 1.8
Utilities
10.6
10.5
10.5
0.1 1.0
0.1 1.0
Transportation and Warehousing
129.3
129.9
127.0
-0.6 -0.5
2.3 1.8
Air Transportation
39.4
39.2
40.7
0.2 0.5
-1.3 -3.2
Truck Transportation
31.3
31.3
30.5
0.0 0.0
0.8 2.6
Couriers and Messengers
16.4
17.8
16.0
-1.4 -7.9
0.4 2.5
Information
86.1
86.6
86.7
-0.5 -0.6
-0.6 -0.7
Telecommunications
38.1
38.3
37.3
-0.2 -0.5
0.8 2.1
Wired Telecommunications Carriers
25.4
25.3
25.0
0.1 0.4
0.4 1.6
Wireless Telecommunications Carriers
6.5
6.5
6.1
0.0 0.0
0.4 6.6
Internet Service Providers, Search Portals, and DP
7.2
7.3
7.6
-0.1 -1.4
-0.4 -5.3
Financial Activities
161.8
163.0
160.0
-1.2 -0.7
1.8 1.1
Finance and Insurance
118.5
118.7
116.0
-0.2 -0.2
2.5 2.2
Insurance Carriers and Related Activities
57.3
57.1
55.2
0.2 0.4
2.1 3.8
Real Estate and Rental and Leasing
43.3
44.3
44.0
-1.0 -2.3
-0.7 -1.6
Professional and Business Services
483.0
476.3
467.6
6.7 1.4
15.4 3.3
Professional, Scientific, and Technical Services
209.9
207.1
202.4
2.8 1.4
7.5 3.7
Accounting, Tax Prep, and Bookkeeping Services
33.4
31.8
28.9
1.6 5.0
4.5 15.6
Architectural, Engineering, and Related Services
30.2
30.0
28.0
0.2 0.7
2.2 7.9
Computer Systems Design and Related Services
56.1
55.9
55.7
0.2 0.4
0.4 0.7
Management and Technical Consulting Services
34.5
34.1
33.5
0.4 1.2
1.0 3.0
Management of Companies and Enterprises
51.7
51.9
53.4
-0.2 -0.4
-1.7 -3.2
Admin and Support, Waste Mngmnt and Remediation
221.4
217.3
211.8
4.1 1.9
9.6 4.5
Employment Services
110.4
107.8
104.3
2.6 2.4
6.1 5.9
Education and Health Services
322.5
320.1
314.7
2.4 0.8
7.8 2.5
Educational Services
51.5
50.8
51.2
0.7 1.4
0.3 0.6
Health Care and Social Assistance
271.0
269.3
263.5
1.7 0.6
7.5 2.9
Ambulatory Health Care Services
106.8
106.9
106.1
-0.1 -0.1
0.7 0.7
Hospitals
95.8
95.5
89.6
0.3 0.3
6.2 6.9
Social Assistance
41.8
40.5
40.1
1.3 3.2
1.7 4.2
Leisure and Hospitality
271.1
271.1
257.2
0.0 0.0
13.9 5.4
Arts, Entertainment, and Recreation
31.2
30.9
27.4
0.3 1.0
3.8 13.9
Accommodation and Food Services
239.9
240.2
229.8
-0.3 -0.1
10.1 4.4
Accommodation
23.7
23.6
23.5
0.1 0.4
0.2 0.9
Food Services and Drinking Places
216.2
216.6
206.3
-0.4 -0.2
9.9 4.8
Other Services
96.4
97.2
94.5
-0.8 -0.8
1.9 2.0
Repair and Maintenance
22.4
21.9
21.8
0.5 2.3
0.6 2.8
Personal and Laundry Services
25.1
26.1
24.6
-1.0 -3.8
0.5 2.0
Government
328.2
325.4
324.8
2.8 0.9
3.4 1.1
Federal Government
45.5
45.6
45.1
-0.1 -0.2
0.4 0.9
State Government
74.3
72.4
74.2
1.9 2.6
0.1 0.1
Local Government
208.4
207.4
205.5
1.0 0.5
2.9 1.4
Note: These not seasonally adjusted estimates were prepared in cooperation with the U.S. Department of Labor, Bureau of Labor Statistics, based upon monthly reports submitted by
selected employers in the Atlanta Metropolitan Statistical Area, which includes Barrow, Bartow, Butts, Carroll, Cherokee, Clayton, Cobb, Coweta, Dawson, DeKalb, Douglas, Fayette, Forsyth,
Fulton, Gwinnett, Haralson, Heard, Henry, Jasper, Lamar, Meriwether, Morgan, Newton, Paulding, Pickens, Pike, Rockdale, Spalding and Walton counties. The estimates include all full- and
part-time wage and salary workers who were employed during or received pay for any part of the pay period that includes the twelfth of the month. Proprietors, domestic workers, self-employed
persons, unpaid family workers and personnel of the armed forces are excluded. Estimates based on 2015 benchmark.
Source: Georgia Department of Labor, Workforce Statistics & Economic Research
5
AUGUSTA-RICHMOND MSA Nonfarm Employment
(In thousands)
(Not Seasonally Adjusted)
Preliminary
Revised
Revised
FEB 2016 JAN 2016 FEB 2015
Change in Jobs from JAN 2016
Net %
Change in Jobs from FEB 2015
Net %
Total Nonfarm Total Private Goods Producing Service-Providing Private Service-Providing Mining, Logging and Construction Manufacturing Trade, Transportation, and Utilities
Wholesale Trade Retail Trade Transportation, Warehousing, and Utilities Information Financial Activities Professional and Business Services Education and Health Services Leisure and Hospitality Other Services Government Federal Government State Government Local Government
226.8 179.3
32.3 194.5 147.0
11.9 20.4 39.7
6.1 26.3
7.3 2.9 7.6 33.5 31.9 23.2 8.2 47.5 9.2 16.2 22.1
227.2 179.7
32.1 195.1 147.6
11.8 20.3 39.8
6.1 26.4
7.3 2.9 7.7 33.6 32.1 23.3 8.2 47.5 9.2 16.3 22.0
226.4 179.0
31.9 194.5 147.1
11.5 20.4 39.3
6.0 25.8
7.5 3.0 7.5 34.0 31.7 23.4 8.2 47.4 9.1 16.2 22.1
-0.4 -0.2 -0.4 -0.2 0.2 0.6 -0.6 -0.3 -0.6 -0.4 0.1 0.9 0.1 0.5 -0.1 -0.3 0.0 0.0 -0.1 -0.4 0.0 0.0 0.0 0.0 -0.1 -1.3 -0.1 -0.3 -0.2 -0.6 -0.1 -0.4 0.0 0.0 0.0 0.0 0.0 0.0 -0.1 -0.6 0.1 0.5
0.4 0.2 0.3 0.2 0.4 1.3 0.0 0.0 -0.1 -0.1 0.4 3.5 0.0 0.0 0.4 1.0 0.1 1.7 0.5 1.9 -0.2 -2.7 -0.1 -3.3 0.1 1.3 -0.5 -1.5 0.2 0.6 -0.2 -0.9 0.0 0.0 0.1 0.2 0.1 1.1 0.0 0.0 0.0 0.0
Note: These not seasonally adjusted estimates were prepared in cooperation with the U.S. Department of Labor, Bureau of Labor Statistics, based upon monthly reports submitted by
selected employers in the Augusta - Richmond County Metropolitan Statistical Area, which includes Burke, Columbia, Lincoln, McDuffie and Richmond counties in Georgia and Aiken and Edgefield counties in South Carolina. The estimates include all full- and part-time wage and salary workers who were employed during or received pay for any part of the pay period that includes the
twelfth of the month. Proprietors, domestic workers, self-employed persons, unpaid family workers and personnel of the armed forces are excluded. Estimates based on 2015 benchmark.
BRUNSWICK MSA Nonfarm Employment
(In thousands)
(Not Seasonally Adjusted)
Preliminary
Revised
Revised
FEB 2016 JAN 2016 FEB 2015
Change in Jobs from JAN 2016
Net %
Change in Jobs from FEB 2015
Net %
Total Nonfarm Total Private Goods Producing Service-Providing Private Service-Providing Trade, Transportation, and Utilities
Retail Trade Government
Federal Government State Government Local Government
42.5
42.1
40.7
0.4 1.0
32.2
31.9
30.5
0.3 0.9
3.9
3.9
3.8
0.0 0.0
38.6
38.2
36.9
0.4 1.1
28.3
28.0
26.7
0.3 1.1
8.7
8.9
8.2
-0.2 -2.3
5.7
5.7
5.6
0.0 0.0
10.3
10.2
10.2
0.1 1.0
1.8
1.8
1.8
0.0 0.0
1.7
1.7
1.8
0.0 0.0
6.8
6.7
6.6
0.1 1.5
1.8 4.4 1.7 5.6 0.1 2.6 1.7 4.6 1.6 6.0 0.5 6.1 0.1 1.8 0.1 1.0 0.0 0.0 -0.1 -5.6 0.2 3.0
Note: These not seasonally adjusted estimates were prepared in cooperation with the U.S. Department of Labor, Bureau of Labor Statistics, based upon monthly reports submitted by
selected employers in the Brunswick Metropolitan Statistical Area, which includes Brantley, Glynn and McIntosh counties. The estimates include all full- and part-time wage and salary workers who were employed during or received pay for any part of the pay period that includes the twelfth of the month. Proprietors, domestic workers, self-employed persons, unpaid family workers and personnel of the armed forces are excluded. Estimates based on 2015 benchmark.
Source: Georgia Department of Labor, Workforce Statistics & Economic Research
6
COLUMBUS MSA Nonfarm Employment
(In thousands)
(Not Seasonally Adjusted)
Preliminary
Revised
Revised
FEB 2016 JAN 2016 FEB 2015
Change in Jobs from JAN 2016
Net %
Change in Jobs from FEB 2015
Net %
Total Nonfarm Total Private Goods Producing Service-Providing Private Service-Providing Mining, Logging and Construction Manufacturing Trade, Transportation, and Utilities
Wholesale Trade Retail Trade Transportation, Warehousing, and Utilities Information Financial Activities Finance and Insurance
Insurance Carriers and Related Activities Professional and Business Services Education and Health Services Leisure and Hospitality Other Services Government
Federal Government State Government Local Government
121.0 96.0 14.2
106.8 81.8 4.0 10.2 18.6 3.1 13.4 2.1 1.4 13.3 11.7 4.5 12.9 16.4 14.5 4.7 25.0 7.0 5.0 13.0
121.2 95.8 14.2
107.0 81.6 4.1 10.1 18.7 3.1 13.5 2.1 1.4 13.3 11.7 4.4 12.8 16.3 14.4 4.7 25.4 7.0 4.8 13.6
120.6 95.9 15.0
105.6 80.9 4.2 10.8 18.2 3.0 13.3 1.9 1.4 13.3 11.4 4.5 12.7 16.3 14.3 4.7 24.7 6.9 4.8 13.0
-0.2 -0.2 0.2 0.2 0.0 0.0 -0.2 -0.2 0.2 0.3 -0.1 -2.4 0.1 1.0 -0.1 -0.5 0.0 0.0 -0.1 -0.7 0.0 0.0 0.0 0.0 0.0 0.0 0.0 0.0 0.1 2.3 0.1 0.8 0.1 0.6 0.1 0.7 0.0 0.0 -0.4 -1.6 0.0 0.0 0.2 4.2 -0.6 -4.4
0.4 0.3 0.1 0.1 -0.8 -5.3 1.2 1.1 0.9 1.1 -0.2 -4.8 -0.6 -5.6 0.4 2.2 0.1 3.3 0.1 0.8 0.2 10.5 0.0 0.0 0.0 0.0 0.3 2.6 0.0 0.0 0.2 1.6 0.1 0.6 0.2 1.4 0.0 0.0 0.3 1.2 0.1 1.5 0.2 4.2 0.0 0.0
Note: These not seasonally adjusted estimates were prepared in cooperation with the U.S. Department of Labor, Bureau of Labor Statistics, based upon monthly reports submitted by
selected employers in the Columbus Metropolitan Statistical Area, which includes Chattahoochee, Harris, Marion and Muscogee counties in Georgia and Russell County in Alabama. The estimates include all full- and part-time wage and salary workers who were employed during or received pay for any part of the pay period that includes the twelfth of the month. Proprietors, domestic workers, self-employed persons, unpaid family workers and personnel of the armed forces are excluded. Estimates based on 2015 benchmark.
DALTON MSA Nonfarm Employment
(In thousands)
(Not Seasonally Adjusted)
Preliminary FEB 2016
Revised Revised JAN 2016 FEB 2015
Change in Jobs from JAN 2016
Net %
Change in Jobs from FEB 2015
Net %
Total Nonfarm Total Private Goods Producing Service-Providing Private Service-Providing Manufacturing
Textile Mills Textile Product Mills Trade, Transportation, and Utilities Retail Trade Transportation, Warehousing, and Utilities Professional and Business Services Government Federal Government State Government Local Government
68.0
67.4
66.8
61.2
60.7
59.9
25.0
24.8
24.2
43.0
42.6
42.6
36.2
35.9
35.7
23.7
23.7
22.9
2.3
2.3
2.3
15.8
15.8
15.3
17.0
16.8
16.4
8.6
8.4
8.2
4.5
4.5
4.2
6.1
6.0
6.2
6.8
6.7
6.9
0.2
0.2
0.2
1.0
1.0
1.1
5.6
5.5
5.6
0.6 0.9 0.5 0.8 0.2 0.8 0.4 0.9 0.3 0.8 0.0 0.0 0.0 0.0 0.0 0.0 0.2 1.2 0.2 2.4 0.0 0.0 0.1 1.7 0.1 1.5 0.0 0.0 0.0 0.0 0.1 1.8
1.2 1.8 1.3 2.2 0.8 3.3 0.4 0.9 0.5 1.4 0.8 3.5 0.0 0.0 0.5 3.3 0.6 3.7 0.4 4.9 0.3 7.1 -0.1 -1.6 -0.1 -1.5 0.0 0.0 -0.1 -9.1 0.0 0.0
Note: These not seasonally adjusted estimates were prepared in cooperation with the U.S. Department of Labor, Bureau of Labor Statistics, based upon monthly reports submitted by
selected employers in the Dalton Metropolitan Statistical Area, which includes Murray and Whitfield counties. The estimates include all full- and part-time wage and salary workers who were employed during or received pay for any part of the pay period that includes the twelfth of the month. Proprietors, domestic workers, self-employed persons, unpaid family workers and personnel of the armed forces are excluded. Estimates based on 2015 benchmark.
Source: Georgia Department of Labor, Workforce Statistics & Economic Research
7
GAINESVILLE MSA Nonfarm Employment
(In thousands)
(Not Seasonally Adjusted)
Preliminary
Revised
Revised
FEB 2016 JAN 2016 FEB 2015
Change in Jobs from JAN 2016
Net %
Change in Jobs from FEB 2015
Net %
Total Nonfarm Total Private Goods Producing Service-Providing Private Service-Providing Trade, Transportation, and Utilities
Retail Trade Government
Federal Government State Government Local Government
85.6
84.5
81.3
1.1 1.3
75.1
74.3
71.0
0.8 1.1
22.9
22.7
22.0
0.2 0.9
62.7
61.8
59.3
0.9 1.5
52.2
51.6
49.0
0.6 1.2
15.7
15.7
15.4
0.0 0.0
9.3
9.4
8.6
-0.1 -1.1
10.5
10.2
10.3
0.3 2.9
0.5
0.5
0.5
0.0 0.0
2.4
2.4
2.4
0.0 0.0
7.6
7.3
7.4
0.3 4.1
4.3 5.3 4.1 5.8 0.9 4.1 3.4 5.7 3.2 6.5 0.3 2.0 0.7 8.1 0.2 1.9 0.0 0.0 0.0 0.0 0.2 2.7
Note: These not seasonally adjusted estimates were prepared in cooperation with the U.S. Department of Labor, Bureau of Labor Statistics, based upon monthly reports submitted by
selected employers in the Gainesville Metropolitan Statistical Area, which comprises Hall county. The estimates include all full- and part-time wage and salary workers who were employed during or received pay for any part of the pay period that includes the twelfth of the month. Proprietors, domestic workers, self-employed persons, unpaid family workers and personnel of the armed forces are excluded. Estimates based on 2015 benchmark.
HINESVILLE MSA Nonfarm Employment
(In thousands)
(Not Seasonally Adjusted)
Preliminary Revised Revised FEB 2016 JAN 2016 FEB 2015
Change in Jobs from JAN 2016
Net %
Change in Jobs from FEB 2015
Net %
Total Nonfarm Total Private Goods Producing Service-Providing Private Service-Providing Government
Federal Government State Government Local Government
19.6
19.6
19.8
11.5
11.5
11.8
2.5
2.5
2.6
17.1
17.1
17.2
9.0
9.0
9.2
8.1
8.1
8.0
4.0
4.0
4.0
0.4
0.4
0.4
3.7
3.7
3.6
0.0 0.0 0.0 0.0 0.0 0.0 0.0 0.0 0.0 0.0 0.0 0.0 0.0 0.0 0.0 0.0 0.0 0.0
-0.2 -1.0 -0.3 -2.5 -0.1 -3.9 -0.1 -0.6 -0.2 -2.2 0.1 1.3 0.0 0.0 0.0 0.0 0.1 2.8
Note: These not seasonally adjusted estimates were prepared in cooperation with the U.S. Department of Labor, Bureau of Labor Statistics, based upon monthly reports submitted by
selected employers in the Hinesville Metropolitan Statistical Area, which includes Liberty and Long counties. The estimates include all full- and part-time wage and salary workers who were employed during or received pay for any part of the pay period that includes the twelfth of the month. Proprietors, domestic workers, self-employed persons, unpaid family workers and personnel of the armed forces are excluded. Estimates based on 2015 benchmark.
Source: Georgia Department of Labor, Workforce Statistics & Economic Research
8
MACON MSA Nonfarm Employment
(In thousands)
(Not Seasonally Adjusted)
Preliminary
Revised
Revised
FEB 2016 JAN 2016 FEB 2015
Change in Jobs from JAN 2016
Net %
Change in Jobs from FEB 2015
Net %
Total Nonfarm Total Private Goods Producing Service-Providing Private Service-Providing Trade, Transportation, and Utilities
Retail Trade Transportation, Warehousing, and Utilities Financial Activities Professional and Business Services Education and Health Services Leisure and Hospitality Government Federal Government State Government Local Government
102.8 88.0 9.4 93.4 78.6 20.8 14.0 3.7 10.1 12.7 20.8 10.0 14.8 1.2 3.8 9.8
102.6 88.0 9.3 93.3 78.7 21.2 14.4 3.7 10.1 12.9 20.7 9.9 14.6 1.2 3.7 9.7
100.6 85.6 9.3 91.3 76.3 20.3 13.7 3.5 9.7 12.0 20.4 9.5 15.0 1.1 3.9 10.0
0.2 0.2 0.0 0.0 0.1 1.1 0.1 0.1 -0.1 -0.1 -0.4 -1.9 -0.4 -2.8 0.0 0.0 0.0 0.0 -0.2 -1.6 0.1 0.5 0.1 1.0 0.2 1.4 0.0 0.0 0.1 2.7 0.1 1.0
2.2 2.2 2.4 2.8 0.1 1.1 2.1 2.3 2.3 3.0 0.5 2.5 0.3 2.2 0.2 5.7 0.4 4.1 0.7 5.8 0.4 2.0 0.5 5.3 -0.2 -1.3 0.1 9.1 -0.1 -2.6 -0.2 -2.0
Note: These not seasonally adjusted estimates were prepared in cooperation with the U.S. Department of Labor, Bureau of Labor Statistics, based upon monthly reports submitted by
selected employers in the Macon Metropolitan Statistical Area, which includes Bibb, Crawford, Jones, Monroe and Twiggs counties. The estimates include all full- and part-time wage and salary workers who were employed during or received pay for any part of the pay period that includes the twelfth of the month. Proprietors, domestic workers, self-employed persons, unpaid family workers and personnel of the armed forces are excluded. Estimates based on 2015 benchmark.
ROME MSA Nonfarm Employment
(In thousands)
(Not Seasonally Adjusted)
Preliminary
Revised
Revised
FEB 2016 JAN 2016 FEB 2015
Change in Jobs from JAN 2016
Net %
Change in Jobs from FEB 2015
Net %
Total Nonfarm Total Private Goods Producing Service-Providing Private Service-Providing Manufacturing Trade, Transportation, and Utilities
Retail Trade Education and Health Services Government
Federal Government State Government Local Government
40.3
40.3
39.7
0.0 0.0
34.5
34.5
33.9
0.0 0.0
6.9
7.0
6.7
-0.1 -1.4
33.4
33.3
33.0
0.1 0.3
27.6
27.5
27.2
0.1 0.4
6.0
6.0
5.9
0.0 0.0
7.9
7.9
7.7
0.0 0.0
4.9
4.9
5.0
0.0 0.0
10.1
10.0
9.9
0.1 1.0
5.8
5.8
5.8
0.0 0.0
0.2
0.2
0.2
0.0 0.0
1.6
1.6
1.6
0.0 0.0
4.0
4.0
4.0
0.0 0.0
0.6 1.5 0.6 1.8 0.2 3.0 0.4 1.2 0.4 1.5 0.1 1.7 0.2 2.6 -0.1 -2.0 0.2 2.0 0.0 0.0 0.0 0.0 0.0 0.0 0.0 0.0
Note: These not seasonally adjusted estimates were prepared in cooperation with the U.S. Department of Labor, Bureau of Labor Statistics, based upon monthly reports submitted by
selected employers in the Rome Metropolitan Statistical Area, which comprises Floyd county. The estimates include all full- and part-time wage and salary workers who were employed during or received pay for any part of the pay period that includes the twelfth of the month. Proprietors, domestic workers, self-employed persons, unpaid family workers and personnel of the armed forces are excluded. Estimates based on 2015 benchmark.
Source: Georgia Department of Labor, Workforce Statistics & Economic Research
9
SAVANNAH MSA Nonfarm Employment
(In thousands)
(Not Seasonally Adjusted)
Preliminary Revised
Revised
FEB 2016 JAN 2016 FEB 2015
Change in Jobs from JAN 2016
Net %
Change in Jobs from FEB 2015
Net %
Total Nonfarm Total Private Goods Producing Service-Providing Private Service-Providing Mining, Logging and Construction Manufacturing Trade, Transportation, and Utilities
Wholesale Trade Retail Trade Transportation, Warehousing, and Utilities Information Financial Activities Professional and Business Services Education and Health Services Leisure and Hospitality Other Services Government Federal Government State Government Local Government
174.7 150.4
24.4 150.3 126.0
6.4 18.0 38.5
6.3 20.7 11.5
1.9 6.7 20.5 25.8 25.3 7.3 24.3 2.9 6.4 15.0
172.5 148.7
24.1 148.4 124.6
6.2 17.9 38.1
6.3 20.3 11.5
1.9 6.7 20.0 25.6 25.0 7.3 23.8 2.9 6.0 14.9
167.6 143.8
23.5 144.1 120.3
6.4 17.1 36.8
6.2 19.7 10.9
2.5 6.4 18.7 24.8 24.0 7.1 23.8 2.9 6.2 14.7
2.2 1.3 1.7 1.1 0.3 1.2 1.9 1.3 1.4 1.1 0.2 3.2 0.1 0.6 0.4 1.1 0.0 0.0 0.4 2.0 0.0 0.0 0.0 0.0 0.0 0.0 0.5 2.5 0.2 0.8 0.3 1.2 0.0 0.0 0.5 2.1 0.0 0.0 0.4 6.7 0.1 0.7
7.1 4.2 6.6 4.6 0.9 3.8 6.2 4.3 5.7 4.7 0.0 0.0 0.9 5.3 1.7 4.6 0.1 1.6 1.0 5.1 0.6 5.5 -0.6 -24.0 0.3 4.7 1.8 9.6 1.0 4.0 1.3 5.4 0.2 2.8 0.5 2.1 0.0 0.0 0.2 3.2 0.3 2.0
Note: These not seasonally adjusted estimates were prepared in cooperation with the U.S. Department of Labor, Bureau of Labor Statistics, based upon monthly reports submitted by
selected employers in the Savannah Metropolitan Statistical Area, which includes Bryan, Chatham and Effingham counties. The estimates include all full- and part-time wage and salary workers who were employed during or received pay for any part of the pay period that includes the twelfth of the month. Proprietors, domestic workers, self-employed persons, unpaid family workers and personnel of the armed forces are excluded. Estimates based on 2015 benchmark.
VALDOSTA MSA Nonfarm Employment
(In thousands)
(Not Seasonally Adjusted)
Preliminary Revised
Revised
FEB 2016 JAN 2016 FEB 2015
Change in Jobs from JAN 2016
Net %
Change in Jobs from FEB 2015
Net %
Total Nonfarm Total Private Goods Producing Service-Providing Private Service-Providing Trade, Transportation, and Utilities
Retail Trade Government
Federal Government State Government Local Government
55.5
54.8
54.6
42.1
41.8
41.3
6.9
6.9
6.9
48.6
47.9
47.7
35.2
34.9
34.4
11.8
11.7
11.4
7.1
7.0
6.9
13.4
13.0
13.3
1.2
1.1
1.1
4.2
4.0
4.2
8.0
7.9
8.0
0.7 1.3 0.3 0.7 0.0 0.0 0.7 1.5 0.3 0.9 0.1 0.9 0.1 1.4 0.4 3.1 0.1 9.1 0.2 5.0 0.1 1.3
0.9 1.7 0.8 1.9 0.0 0.0 0.9 1.9 0.8 2.3 0.4 3.5 0.2 2.9 0.1 0.8 0.1 9.1 0.0 0.0 0.0 0.0
Note: These not seasonally adjusted estimates were prepared in cooperation with the U.S. Department of Labor, Bureau of Labor Statistics, based upon monthly reports submitted by
selected employers in the Valdosta Metropolitan Statistical Area, which includes Brooks, Echols, Lanier and Lowndes counties. The estimates include all full- and part-time wage and salary workers who were employed during or received pay for any part of the pay period that includes the twelfth of the month. Proprietors, domestic workers, self-employed persons, unpaid family workers and personnel of the armed forces are excluded. Estimates based on 2015 benchmark.
Source: Georgia Department of Labor, Workforce Statistics & Economic Research
10
WARNER ROBINS MSA Nonfarm Employment
(In thousands)
(Not Seasonally Adjusted)
Preliminary Revised
Revised
FEB 2016 JAN 2016 FEB 2015
Change in Jobs from JAN 2016
Net %
Change in Jobs from FEB 2015
Net %
Total Nonfarm Total Private Goods Producing Service-Providing Private Service-Providing Trade, Transportation, and Utilities
Retail Trade Government
Federal Government State Government Local Government
70.5
70.1
69.3
43.6
43.3
42.5
9.3
9.2
8.9
61.2
60.9
60.4
34.3
34.1
33.6
10.2
10.1
10.0
8.0
7.9
7.7
26.9
26.8
26.8
14.6
14.6
14.7
2.4
2.3
2.4
9.9
9.9
9.7
0.4 0.6 0.3 0.7 0.1 1.1 0.3 0.5 0.2 0.6 0.1 1.0 0.1 1.3 0.1 0.4 0.0 0.0 0.1 4.4 0.0 0.0
1.2 1.7 1.1 2.6 0.4 4.5 0.8 1.3 0.7 2.1 0.2 2.0 0.3 3.9 0.1 0.4 -0.1 -0.7 0.0 0.0 0.2 2.1
Note: These not seasonally adjusted estimates were prepared in cooperation with the U.S. Department of Labor, Bureau of Labor Statistics, based upon monthly reports submitted by
selected employers in the Warner Robins Metropolitan Statistical Area, which includes Houston, Peach and Pulaski counties. The estimates include all full- and part-time wage and salary workers who were employed during or received pay for any part of the pay period that includes the twelfth of the month. Proprietors, domestic workers, self-employed persons, unpaid family workers and personnel of the armed forces are excluded. Estimates based on 2015 benchmark.
Total Nonfarm Employment by Metro Statistical Area
(In thousands)
(Seasonally Adjusted)
Preliminary
Revised
FEB 2016 JAN 2016
Revised FEB 2015
Change in Jobs from JAN 2016
Net %
Change in Jobs from FEB 2015
Net %
Albany MSA
62.0
61.9
61.1
0.1 0.2
0.9
1.5
Athens-Clarke County MSA
93.7
93.1
90.4
0.6 0.6
3.3
3.7
Atlanta MSA
2,624.9
2,620.6
2,555.0
4.3 0.2
69.9
2.7
Augusta-Richmond MSA
228.4
229.9
227.1
-1.5 -0.7
1.3
0.6
Brunswick MSA
43.1
42.8
41.4
0.3 0.7
1.7
4.1
Columbus MSA
121.8
122.4
121.6
-0.6 -0.5
0.2
0.2
Dalton MSA
68.5
68.1
67.2
0.4 0.6
1.3
1.9
Gainesville MSA
86.0
85.6
82.2
0.4 0.5
3.8
4.6
Hinesville MSA
19.6
19.8
19.8
-0.2 -1.0
-0.2 -1.0
Macon MSA
103.6
103.3
101.4
0.3 0.3
2.2
2.2
Rome MSA
40.5
40.6
39.9
-0.1 -0.2
0.6
1.5
Savannah MSA
175.6
174.8
169.6
0.8 0.5
6.0
3.5
Valdosta MSA
55.5
55.4
54.8
0.1 0.2
0.7
1.3
Warner Robins MSA
NO DATA AVAILABLE
Note: These seasonally adjusted estimates were prepared in cooperation with the U.S. Department of Labor, Bureau of Labor Statistics, based upon monthly reports submitted by selected
employers throughout Georgia. The estimates include all full- and part-time wage and salary workers who were employed during or received pay for any part of the pay period that includes the twelfth of the month. Proprietors, domestic workers, self-employed persons, unpaid family workers and personnel of the armed forces are excluded. Estimates based on 2015 benchmark.
Source: Georgia Department of Labor, Workforce Statistics & Economic Research
11
Georgia Statewide Hours and Earnings
All Employee
Average Weekly Earnings
Preliminary FEB 2016
Revised JAN 2016
Revised FEB 2015
Total Private.................................................................................................... $846.68............................ $839.36.......................$849.32 Goods Producing....................................................................................... $1,003.13..........................$1,005.49....................... $948.19 Private Service Providing..............................................................................$816.82............................ $808.52....................... $832.14 Construction...............................................................................................$967.61.............................$983.74....................... $916.01 Manufacturing......................................................................................... $1,017.86..........................$1,013.20.......................$970.06 Trade, Transportation, and Utilities............................................................$743.90..............................$741.11.......................$788.00 Financial Activities...................................................................................$1,114.88..........................$1,066.65.................... $1,142.24 Professional and Business Services...................................................... $1,014.00..........................$1,016.06.................... $1,057.41 Educational and Health Services...............................................................$906.75............................ $896.27....................... $881.76 Leisure and Hospitality.............................................................................. $340.90............................ $330.23...................... $334.46 Other Services...........................................................................................$733.52............................. $717.28.......................$702.98
Average Weekly Hours
Preliminary FEB 2016
Revised JAN 2016
Revised FEB 2015
Total Private...........................................................................................................34.7.................................. 34.4.............................35.3 Goods Producing................................................................................................40.4...................................40.3.............................40.4 Private Service Providing....................................................................................33.6.................................. 33.3.............................34.4 Construction.....................................................................................................40.2...................................40.4.............................39.5 Manufacturing..................................................................................................40.2...................................40.0............................. 41.0 Trade, Transportation, and Utilities..................................................................34.6.................................. 34.2.............................35.4 Financial Activities........................................................................................... 37.5................................... 37.4............................. 38.1 Professional and Business Services...............................................................33.8...................................33.6.............................36.5 Educational and Health Services.....................................................................35.2.................................. 35.3.............................35.2 Leisure and Hospitality.....................................................................................26.8...................................25.9.............................26.8 Other Services.................................................................................................34.6.................................. 33.3.............................33.7
Average Hourly Earnings
Preliminary FEB 2016
Revised JAN 2016
Revised FEB 2015
Total Private.......................................................................................................$24.40...............................$24.40.........................$24.06 Goods Producing............................................................................................$24.83...............................$24.95.........................$23.47 Private Service Providing................................................................................$24.31...............................$24.28......................... $24.19 Construction.................................................................................................$24.07...............................$24.35......................... $23.19 Manufacturing..............................................................................................$25.32.............................. $25.33.........................$23.66 Trade, Transportation, and Utilities..............................................................$21.50...............................$21.67.........................$22.26 Financial Activities.......................................................................................$29.73...............................$28.52.........................$29.98 Professional and Business Services.......................................................... $30.00.............................. $30.24.........................$28.97 Educational and Health Services.................................................................$25.76.............................. $25.39.........................$25.05 Leisure and Hospitality................................................................................. $12.72............................... $12.75......................... $12.48 Other Services.............................................................................................$21.20...............................$21.54.........................$20.86
Read more about the hours and earnings series at http://www.bls.gov/sae/home.htm
Note: These not seasonally adjusted estimates were prepared in cooperation with the U.S. Department of Labor, Bureau of Labor Statistics, based upon monthly reports submitted by
selected employers throughout Georgia. The estimates include all full- and part-time wage and salary workers who were employed during or received pay for any part of the pay period that includes the twelfth of the month. Proprietors, domestic workers, self-employed persons, unpaid family workers and personnel of the armed forces are excluded. Estimates based on 2015 benchmark.
Source: Georgia Department of Labor, Workforce Statistics & Economic Research
12
Georgia Statewide Hours and Earnings
All Employee Total Private
Average Weekly Earnings
Preliminary FEB 2016
Revised JAN 2016
Revised FEB 2015
Albany MSA ....................................................................................................$597.68............................ $582.40.......................$579.20 Athens-Clarke County MSA ...........................................................................$725.45............................ $720.44....................... $677.65 Atlanta MSA ................................................................................................. $940.30.............................$930.12....................... $938.10 Augusta-Richmond County MSA ...................................................................$844.19............................ $833.63.......................$899.47 Brunswick MSA .............................................................................................$587.28............................ $573.95.......................$620.57 Columbus MSA ............................................................................................. $695.21.............................$680.74.......................$702.46 Dalton MSA .................................................................................................. $686.34.............................$701.99...................... $688.54 Gainesville MSA ............................................................................................ $933.32.............................$914.09.......................$826.00 Hinesville MSA ............................................................................................... $742.71.............................$732.78....................... $787.89 Macon MSA ................................................................................................... $734.56.............................$743.87....................... $737.58 Rome MSA .................................................................................................... $833.80.............................$812.78...................... $844.49 Savannah MSA .............................................................................................. $747.33.............................$731.06.......................$704.93 Valdosta MSA .................................................................................................$604.12.............................$604.13....................... $611.90 Warner Robins MSA .......................................................................................$769.08............................. $781.70...................... $658.08
Average Weekly Hours
Preliminary FEB 2016
Revised JAN 2016
Revised FEB 2015
Albany MSA ..........................................................................................................32.5...................................32.0.............................34.6 Athens-Clarke County MSA .................................................................................34.3...................................33.4.............................32.3 Atlanta MSA ........................................................................................................34.8.................................. 34.5.............................35.4 Augusta-Richmond County MSA .........................................................................35.5...................................35.1............................. 37.4 Brunswick MSA ...................................................................................................31.9...................................32.5............................. 35.1 Columbus MSA ....................................................................................................34.9...................................33.7............................. 34.1 Dalton MSA .........................................................................................................36.9................................... 37.6.............................39.8 Gainesville MSA ................................................................................................... 39.1...................................38.7.............................36.5 Hinesville MSA .....................................................................................................35.3...................................35.4.............................36.8 Macon MSA ..........................................................................................................36.6.................................. 36.5.............................38.0 Rome MSA ...........................................................................................................34.2...................................33.6.............................33.3 Savannah MSA ....................................................................................................33.2.................................. 33.2.............................32.5 Valdosta MSA .......................................................................................................34.6.................................. 34.8.............................35.7 Warner Robins MSA ............................................................................................. 37.1.................................. 38.3.............................36.0
Average Hourly Earnings
Preliminary FEB 2016
Revised JAN 2016
Revised FEB 2015
Albany MSA ......................................................................................................$18.39...............................$18.20......................... $16.74 Athens-Clarke County MSA ............................................................................. $21.15...............................$21.57.........................$20.98 Atlanta MSA .................................................................................................... $27.02.............................. $26.96.........................$26.50 Augusta-Richmond County MSA .....................................................................$23.78...............................$23.75.........................$24.05 Brunswick MSA ............................................................................................... $18.41............................... $17.66......................... $17.68 Columbus MSA ................................................................................................$19.92.............................. $20.20.........................$20.60 Dalton MSA .....................................................................................................$18.60...............................$18.67......................... $17.30 Gainesville MSA ...............................................................................................$23.87.............................. $23.62.........................$22.63 Hinesville MSA .................................................................................................$21.04...............................$20.70......................... $21.41 Macon MSA ......................................................................................................$20.07.............................. $20.38......................... $19.41 Rome MSA .......................................................................................................$24.38............................... $24.19.........................$25.36 Savannah MSA ................................................................................................$22.51.............................. $22.02......................... $21.69 Valdosta MSA ................................................................................................... $17.46............................... $17.36..........................$17.14 Warner Robins MSA .........................................................................................$20.73...............................$20.41.........................$18.28
Read more about the hours and earnings series at http://www.bls.gov/sae/home.htm
Note: These not seasonally adjusted estimates were prepared in cooperation with the U.S. Department of Labor, Bureau of Labor Statistics, based upon monthly reports submitted by
selected employers throughout Georgia. The estimates include all full- and part-time wage and salary workers who were employed during or received pay for any part of the pay period that includes the twelfth of the month. Proprietors, domestic workers, self-employed persons, unpaid family workers and personnel of the armed forces are excluded. Estimates based on 2015 benchmark.
Source: Georgia Department of Labor, Workforce Statistics & Economic Research
13
Dimensions - Measuring Georgia's Labor Force
Unemployment rates -- Georgia and U.S.
8%
Georgia
U.S.
7%
6%
5%
4% Feb-15 Mar-15 Apr-15 May-15 Jun-15 Jul-15 Aug-15 Sep-15 Oct-15 Nov-15 Dec-15 Jan-16 Feb-16
WA 5.8 OR 4.8 NV 5.9 CA 5.5
AK 6.6
ID 3.9
UT 3.4 AZ 5.5
StaStteatuenUenmepmlopylomymenetntrRataetess
February 2016
National Unemployment Rate: 4.9% Rates are seasonally adjusted
MT 4.2
WY 5.0
CO 3.0 NM 6.4
ND 2.9 SD 2.7
NE 3.0
KS 4.0
MN 3.7
WI 4.6
IA 3.7
IL 6.4 MO 4.2
OK 4.2 TX 4.4
AR 4.2
MS 6.5 LA 5.9
MI 4.8
OH
IN
4.9
4.7
KY 5.8 TN 4.9
PA 4.6
WV
6.5
VA
4.1
NC 5.5
SC 5.5
AL
GA
6.2
5.4
FL 4.9
NH
2.7 ME
VT
3.6
3.4
MA 4.5
NY 4.8
RI 5.4
NJ
CT 5.5
4.3
DE
4.6
DC 6.5
MD 4.7
Unemployment rate
6.0% to 6.9% 5.0% to 5.9% 4.0% to 4.9% 3.0% to 3.9% Less than 3.0%
HI 3.1 Source: Georgia Department of Labor, Workforce Statistics & Economic Research
14
Georgia Labor Force Estimates
Place of Residence - Persons 16 Years and Older
Georgia
(Seasonally adjusted)
Georgia
(Not Seasonally adjusted)
Albany MSA Athens-Clarke County MSA
Atlanta MSA
Augusta-Richmond County MSA
Brunswick MSA
Columbus MSA
Dalton MSA
Gainesville MSA
Employment Status
Civilian labor force Employed Unemployed Rate
Civilian labor force Employed Unemployed Rate
Civilian labor force Employed Unemployed Rate
Civilian labor force Employed Unemployed Rate
Civilian labor force Employed Unemployed Rate
Civilian labor force Employed Unemployed Rate
Civilian labor force Employed Unemployed Rate
Civilian labor force Employed Unemployed Rate
Civilian labor force Employed Unemployed Rate
Civilian labor force Employed Unemployed Rate
Preliminary FEB 2016
4,817,993 4,556,791
261,202 5.4
4,815,363 4,544,757
270,606 5.6
66,249 61,891 4,358
6.6
95,462 90,617 4,845
5.1
2,867,818 2,715,259
152,559 5.3
255,949 240,472
15,477 6.0
50,640 47,635 3,005
5.9
124,405 115,934
8,471 6.8
60,989 57,081 3,908
6.4
94,171 89,838
4,333 4.6
Revised JAN 2016
4,800,864 4,542,051
258,813 5.4
4,793,290 4,532,319
260,971 5.4
66,229 62,090
4,139 6.2
94,624 90,063
4,561 4.8
2,847,513 2,700,885
146,628 5.1
255,822 240,378
15,444 6.0
50,535 47,617 2,918
5.8
124,286 115,872
8,414 6.8
61,001 56,596
4,405 7.2
93,343 89,202
4,141 4.4
Revised FEB 2015
4,750,706 4,454,580
296,126 6.2
4,759,653 4,461,428
298,225 6.3
66,079 61,228
4,851 7.3
92,758 87,468 5,290
5.7
2,825,989 2,657,156
168,833 6.0
257,250 240,296
16,954 6.6
49,358 46,039
3,319 6.7
125,351 116,272
9,079 7.2
60,668 56,396
4,272 7.0
91,091 86,478
4,613 5.1
Change From
JAN 2016
FEB 2015
17,129 14,740 2,389
67,287 102,211 -34,924
22,073 12,438
9,635
55,710 83,329 -27,619
20
170
-199
663
219
-493
838
2,704
554
3,149
284
-445
20,305 14,374 5,931
41,829 58,103 -16,274
127
-1,301
94
176
33
-1,477
105
1,282
18
1,596
87
-314
119
-946
62
-338
57
-608
-12 485 -497
321 685 -364
828
3,080
636
3,360
192
-280
Note: MSA data are not seasonally adjusted. Employment includes nonagricultural wage and salary employment, self-employment, unpaid family and private
household workers and agricultural workers. Persons in labor disputes are counted as employed. The use of unrounded data does not imply that the numbers are exact.
Albany MSA: Baker, Dougherty, Lee, Terrell, and Worth counties. Athens - Clarke County MSA: Clarke, Madison, Oconee, and Oglethorpe counties. Atlanta MSA: Barrow, Bartow, Butts, Carroll, Cherokee, Clayton, Cobb, Coweta, Dawson, DeKalb, Douglas, Fayette, Forsyth, Fulton, Gwinnett, Haralson, Heard, Henry, Jasper, Lamar, Meriwether, Morgan, Newton, Paulding, Pickens, Pike, Rockdale, Spalding, and Walton counties. Augusta - Richmond County MSA: Burke, Columbia, Lincoln, McDuffie, and Richmond counties in Georgia and Aiken and Edgefield counties in South Carolina. Brunswick MSA: Brantley, Glynn, and McIntosh counties. Columbus MSA: Chattahoochee, Harris, Marion, and Muscogee counties in Georgia and Russell County in Alabama. Dalton MSA: Murray and Whitfield counties. Gainesville MSA: Hall County. Hinesville MSA: Liberty and Long counties. Macon MSA: Bibb, Crawford, Jones, Monroe, and Twiggs counties. Rome MSA: Floyd County. Savannah MSA: Bryan, Chatham, and Effingham counties. Valdosta MSA: Brooks, Echols, Lanier, and Lowndes counties. Warner Robins MSA: Houston, Peach and Pulaski counties.
Source: Georgia Department of Labor, Workforce Statistics & Economic Research
15
Hinesville MSA Macon MSA Rome MSA
Savannah MSA Valdosta MSA Warner Robins MSA
Georgia Labor Force Estimates
Place of Residence - Persons 16 Years and Older
Employment Status
Civilian labor force Employed Unemployed Rate
Civilian labor force Employed Unemployed Rate
Preliminary FEB 2016
32,096 30,169
1,927 6.0
104,087 97,830 6,257 6.0
Revised JAN 2016
31,935 30,075
1,860 5.8
103,835 97,823 6,012 5.8
Revised FEB 2015
32,385 30,229
2,156 6.7
103,340 96,431 6,909 6.7
Civilian labor force Employed Unemployed Rate
Civilian labor force Employed Unemployed Rate
43,064 40,380
2,684 6.2
179,114 169,631
9,483 5.3
42,875 40,232
2,643 6.2
176,569 167,350
9,219 5.2
42,999 40,072
2,927 6.8
174,529 164,091
10,438 6.0
Civilian labor force Employed Unemployed Rate
Civilian labor force Employed Unemployed Rate
62,861 59,353
3,508 5.6
80,780 76,093
4,687 5.8
62,686 59,346
3,340 5.3
80,615 75,991
4,624 5.7
63,044 59,025
4,019 6.4
80,518 75,351
5,167 6.4
Change From
JAN 2016
FEB 2015
161
-289
94
-60
67
-229
252
747
7
1,399
245
-652
189
65
148
308
41
-243
2,545 2,281
264
4,585 5,540 -955
175
-183
7
328
168
-511
165
262
102
742
63
-480
Area United States
(Seasonally adjusted)
United States
(Not Seasonally adjusted)
United States Labor Force Estimates
Place of Residence - Persons 16 Years and Older
Employment Status
Civilian labor force Employed Unemployed Rate
Civilian labor force Employed Unemployed Rate
FEB 2016
158,890,000 151,074,000
7,815,000 4.9
158,279,000 150,060,000
8,219,000 5.2
JAN 2016
158,335,000 150,544,000
7,791,000 4.9
157,347,000 149,037,000
8,309,000 5.3
FEB 2015
156,878,000 148,231,000
8,646,000 5.5
156,213,000 147,118,000
9,095,000 5.8
Change From
JAN 2016
FEB 2015
555,000 530,000
24,000
2,012,000 2,843,000
-831,000
932,000 1,023,000
-90,000
2,066,000 2,942,000
-876,000
Note: MSA data are not seasonally adjusted. Employment includes nonagricultural wage and salary employment, self-employment, unpaid family and private
household workers and agricultural workers. Persons in labor disputes are counted as employed. The use of unrounded data does not imply that the numbers are exact.
Albany MSA: Baker, Dougherty, Lee, Terrell, and Worth counties. Athens - Clarke County MSA: Clarke, Madison, Oconee, and Oglethorpe counties. Atlanta MSA: Barrow, Bartow, Butts, Carroll, Cherokee, Clayton, Cobb, Coweta, Dawson, DeKalb, Douglas, Fayette, Forsyth, Fulton, Gwinnett, Haralson, Heard, Henry, Jasper, Lamar, Meriwether, Morgan, Newton, Paulding, Pickens, Pike, Rockdale, Spalding, and Walton counties. Augusta - Richmond County MSA: Burke, Columbia, Lincoln, McDuffie, and Richmond counties in Georgia and Aiken and Edgefield counties in South Carolina. Brunswick MSA: Brantley, Glynn, and McIntosh counties. Columbus MSA: Chattahoochee, Harris, Marion, and Muscogee counties in Georgia and Russell County in Alabama. Dalton MSA: Murray and Whitfield counties. Gainesville MSA: Hall County. Hinesville MSA: Liberty and Long counties. Macon MSA: Bibb, Crawford, Jones, Monroe, and Twiggs counties. Rome MSA: Floyd County. Savannah MSA: Bryan, Chatham, and Effingham counties. Valdosta MSA: Brooks, Echols, Lanier, and Lowndes counties. Warner Robins MSA: Houston, Peach and Pulaski counties.
Source: Georgia Department of Labor, Workforce Statistics & Economic Research
16
Georgia Labor Force Estimates by County (not seasonally adjusted)
Place of Residence - Persons 16 Years and Older
Georgia
Preliminary February 2016
Labor Force
Employment
Unemployment Number Rate
4,815,363 4,544,757 270,606 5.6
Appling Atkinson Bacon Baker Baldwin
8,780 8,218
562 6.4
3,966 3,727
239 6.0
5,110 4,838
272 5.3
1,142 1,052
90 7.9
17,474 16,233 1,241 7.1
Banks Barrow Bartow Ben Hill Berrien
8,154 7,723
431 5.3
35,931 34,211 1,720 4.8
47,426 44,900 2,526 5.3
5,199 4,735 464 8.9
6,959 6,452
507 7.3
Bibb Bleckley Brantley Brooks Bryan
68,884 64,633 4,251 6.2
4,354 3,994 360 8.3
6,953 6,472
481 6.9
6,710 6,320 390 5.8
16,111 15,287
824 5.1
Bulloch Burke Butts Calhoun Camden
35,528 33,580 1,948 5.5
9,080 8,384 696 7.7
10,266 9,628
638 6.2
2,038 1,904
134 6.6
22,752 21,552 1,200 5.3
Candler Carroll Catoosa Charlton Chatham
4,963 4,708
255 5.1
52,779 49,462 3,317 6.3
31,894 30,209 1,685 5.3
4,834 4,555
279 5.8
135,717 128,414 7,303 5.4
Chattahoochee 2,200
Chattooga 11,002
Cherokee 120,888
Clarke
57,776
Clay
833
2,004 9,893 115,573 54,648
733
196 8.9 1,109 10.1 5,315 4.4 3,128 5.4
100 12.0
Clayton Clinch Cobb Coffee Colquitt
126,192 117,344 8,848 7.0
2,865 2,673
192 6.7
402,823 383,634 19,189 4.8
17,889 16,765 1,124 6.3
19,270 18,100 1,170 6.1
Columbia Cook Coweta Crawford Crisp
66,535 63,292 3,243 4.9
7,177 6,732
445 6.2
68,150 64,738 3,412 5.0
5,621 5,302
319 5.7
9,247 8,671
576 6.2
Revised January 2016
Labor Force
Employment
Unemployment Number Rate
4,793,290 4,532,319 260,971 5.4
9,099 4,075 5,283 1,224 17,294
8,506 3,863 5,023 1,140 16,114
593 6.5 212 5.2 260 4.9 84 6.9 1,180 6.8
8,323 7,917 406 4.9
35,719 34,056 1,663 4.7
47,227 44,762 2,465 5.2
5,248 4,765
483 9.2
7,049
6,613
436 6.2
68,547 64,479 4,068 5.9
4,368 4,033
335 7.7
7,032 6,564 468 6.7
6,931 6,545 386 5.6
15,884 15,109
775 4.9
35,197 33,340 1,857 5.3
9,241 8,484
757 8.2
10,243 9,600 643 6.3
2,199 2,079
120 5.5
22,609 21,461 1,148 5.1
5,078 4,826
252 5.0
52,543 49,338 3,205 6.1
31,480 29,898 1,582 5.0
4,870 4,597
273 5.6
133,787 126,650 7,137 5.3
2,217 10,544 119,980 57,141
882
2,026 9,923 114,950 54,210
790
191 8.6 621 5.9 5,030 4.2 2,931 5.1
92 10.4
125,311 116,706 8,605 6.9
2,936
2,752
184 6.3
399,611 381,433 18,178 4.5
17,908 16,831 1,077 6.0
20,132 19,007 1,125 5.6
66,363 63,237 3,126 4.7
7,253 6,833
420 5.8
67,780 64,433 3,347 4.9
5,674 5,348
326 5.7
9,384
8,781
603 6.4
Revised February 2015
Labor Force
Employment
Unemployment Number Rate
4,759,653 4,461,428 298,225 6.3
8,746 3,764 4,806 1,128 17,743
8,116 3,513 4,522 1,044 16,354
630 7.2 251 6.7 284 5.9 84 7.4 1,389 7.8
8,051 35,410 46,821
5,414 7,014
7,576 33,479 43,945
4,913 6,462
475 5.9 1,931 5.5 2,876 6.1
501 9.3 552 7.9
68,458 4,465 6,815 6,742
15,634
63,702 4,013 6,272 6,290
14,793
4,756 6.9 452 10.1 543 8.0 452 6.7 841 5.4
34,681 9,156
10,085 2,182
22,445
32,558 8,412 9,423 2,042 21,145
2,123 6.1 744 8.1 662 6.6 140 6.4
1,300 5.8
4,987 52,192 31,044 4,766 132,428
4,680 48,415 29,366 4,442 124,218
307 6.2 3,777 7.2 1,678 5.4
324 6.8 8,210 6.2
2,208 10,380 118,811 56,138
860
2,010 9,687 113,104 52,730
756
198 9.0 693 6.7 5,707 4.8 3,408 6.1 104 12.1
124,888 114,824 10,064 8.1
2,823 2,632
191 6.8
396,329 375,420 20,909 5.3
16,957 15,667 1,290 7.6
19,815 18,401 1,414 7.1
66,903 7,334
67,063 5,581 9,267
63,480 6,780
63,355 5,228 8,570
3,423 5.1 554 7.6
3,708 5.5 353 6.3 697 7.5
Source: Georgia Department of Labor, Workforce Statistics & Economic Research
17
Georgia Labor Force Estimates by County (not seasonally adjusted)
Place of Residence - Persons 16 Years and Older
Dade Dawson Decatur DeKalb Dodge
Preliminary February 2016
Labor Force
Employment
Unemployment Number Rate
8,068 7,630 438 5.4
11,033 10,502
531 4.8
11,389 10,527 862 7.6
375,826 354,615 21,211 5.6
6,888 6,364
524 7.6
Dooly Dougherty Douglas Early Echols
4,830 4,534 296 6.1
38,382 35,604 2,778 7.2
69,021 64,960 4,061 5.9
4,396 4,037 359 8.2
1,818 1,738
80 4.4
Effingham Elbert Emanuel Evans Fannin
27,286 25,930 1,356 5.0
7,515 6,981 534 7.1
8,430
7,727
703 8.3
4,694 4,434 260 5.5
10,039 9,436 603 6.0
Fayette Floyd Forsyth Franklin Fulton
55,035 52,353 2,682 4.9
43,064 40,380 2,684 6.2
102,980 98,611 4,369 4.2
9,244 8,732
512 5.5
519,954 490,936 29,018 5.6
Gilmer Glascock Glynn Gordon Grady
11,601 10,944
657 5.7
1,229 1,151
78 6.3
37,707 35,540 2,167 5.7
26,511 25,067 1,444 5.4
10,306 9,724 582 5.6
Greene
6,339 5,905 434 6.8
Gwinnett
454,749 432,540 22,209 4.9
Habersham 18,778 17,709 1,069 5.7
Hall
94,171 89,838 4,333 4.6
Hancock
2,402 2,176 226 9.4
Haralson Harris Hart Heard Henry
12,069 11,323
746 6.2
15,467 14,670
797 5.2
10,258 9,646
612 6.0
5,039
4,747
292 5.8
105,756 99,675 6,081 5.8
Houston Irwin Jackson Jasper Jeff Davis
65,444 61,815 3,629 5.5
2,995 2,746
249 8.3
30,978 29,596 1,382 4.5
6,493 6,153 340 5.2
6,418 6,035 383 6.0
Revised January 2016
Labor Force
Employment
Unemployment Number Rate
8,004 7,598 406 5.1
11,041 10,501 540 4.9
11,658 10,840
818 7.0
372,821 352,355 20,466 5.5
6,903 6,388
515 7.5
5,047 4,741 306 6.1
38,190 35,569 2,621 6.9
68,457 64,563 3,894 5.7
4,444
4,128
316 7.1
1,921 1,840
81 4.2
26,898 25,591 1,307 4.9
7,510 6,981
529 7.0
8,636
7,915
721 8.3
4,755 4,502 253 5.3
9,996 9,432 564 5.6
54,602 52,044 2,558 4.7
42,875 40,232 2,643 6.2
102,307 98,159 4,148 4.1
9,318 8,827
491 5.3
516,032 488,262 27,770 5.4
11,654 11,022
632 5.4
1,251 1,179
72 5.8
37,446 35,350 2,096 5.6
26,408 24,962 1,446 5.5
10,479 9,939 540 5.2
6,345 5,941 404 6.4
451,291 430,165 21,126 4.7
18,920 17,900 1,020 5.4
93,343 89,202 4,141 4.4
2,470 2,246
224 9.1
11,989 11,274
715 6.0
15,652 14,738
914 5.8
10,393 9,800 593 5.7
5,054 4,751 303 6.0
104,890 99,046 5,844 5.6
65,123 61,556 3,567 5.5 3,110 2,855 255 8.2
30,760 29,453 1,307 4.2 6,478 6,170 308 4.8 6,488 6,098 390 6.0
Revised February 2015
Labor Force
Employment
Unemployment Number Rate
7,880 7,427
453 5.7
10,852 10,283
569 5.2
11,323 10,501
822 7.3
371,055 346,996 24,059 6.5
7,059 6,467
592 8.4
4,446 38,278 68,060
4,384 1,823
4,046 35,217 63,565 4,065
1,732
400 9.0 3,061 8.0 4,495 6.6
319 7.3 91 5.0
26,467 7,754 8,361 4,701
10,011
25,080 7,124 7,645 4,424 9,299
1,387 5.2 630 8.1 716 8.6 277 5.9 712 7.1
54,122 51,229 2,893 5.3 42,999 40,072 2,927 6.8 101,176 96,507 4,669 4.6
9,386 8,717 669 7.1 512,728 480,421 32,307 6.3
11,620 1,237 36,710 26,147 10,399
10,844 1,150
34,325 24,554
9,710
776 6.7 87 7.0
2,385 6.5 1,593 6.1
689 6.6
6,269 447,097 18,822
91,091 2,444
5,757 423,300
17,659 86,478
2,192
512 8.2 23,797 5.3
1,163 6.2 4,613 5.1
252 10.3
11,909 11,083
826 6.9
15,568 14,715
853 5.5
10,359 9,696
663 6.4
4,977 4,647
330 6.6
104,172 97,524 6,648 6.4
65,155 3,063 30,193 6,404 6,389
61,207 2,790
28,631 6,025 5,963
3,948 6.1 273 8.9
1,562 5.2 379 5.9 426 6.7
Source: Georgia Department of Labor, Workforce Statistics & Economic Research
18
Georgia Labor Force Estimates by County (not seasonally adjusted)
Place of Residence - Persons 16 Years and Older
Jefferson Jenkins Johnson Jones Lamar
Preliminary February 2016
Labor Force
6,250 3,143 3,800 13,768 7,828
Employment
5,729 2,893 3,557 13,075 7,296
Unemployment Number Rate
521 8.3 250 8.0 243 6.4 693 5.0 532 6.8
Lanier Laurens Lee Liberty Lincoln
3,796 3,553
243 6.4
18,347 17,026 1,321 7.2
14,173 13,459
714 5.0
25,429 23,886 1,543 6.1
3,329
3,114
215 6.5
Long Lowndes Lumpkin McDuffie McIntosh
6,667 6,283 384 5.8
50,537 47,742 2,795 5.5
15,320 14,554
766 5.0
8,693 8,021
672 7.7
5,980 5,623
357 6.0
Macon Madison Marion Meriwether Miller
4,619 13,005
3,442 8,800 2,693
4,228 12,367
3,169 8,187 2,517
391 8.5 638 4.9 273 7.9 613 7.0 176 6.5
Mitchell
8,753 8,144 609 7.0
Monroe
12,813 12,101
712 5.6
Montgomery 3,758 3,469
289 7.7
Morgan
8,566 8,105
461 5.4
Murray
15,949 14,776 1,173 7.4
Muscogee Newton Oconee Oglethorpe Paulding
78,981 73,307 5,674 7.2
48,671 45,658 3,013 6.2
17,818 17,092
726 4.1
6,863 6,510 353 5.1
76,550 72,867 3,683 4.8
Peach Pickens Pierce Pike Polk
11,295 10,495 800 7.1
14,105 13,378
727 5.2
8,075 7,631 444 5.5
8,326 7,896 430 5.2
18,135 16,903 1,232 6.8
Pulaski Putnam Quitman Rabun Randolph
4,041 7,633
820 6,297 2,410
3,783 6,998
765 5,867 2,185
258 6.4 635 8.3
55 6.7 430 6.8 225 9.3
Revised January 2016
Labor Force
6,384 3,147 3,839 13,778 7,813
Employment
5,859 2,898 3,595 13,121 7,260
Unemployment Number Rate
525 8.2 249 7.9 244 6.4 657 4.8 553 7.1
3,779 3,555
224 5.9
18,338 17,037 1,301 7.1
14,136 13,464
672 4.8
25,227 23,725 1,502 6.0
3,384 3,179 205 6.1
6,708 6,350 358 5.3
50,055 47,406 2,649 5.3
15,158 14,445
713 4.7
8,692 8,021
671 7.7
6,057 5,703 354 5.8
4,847 12,913 3,459 8,895
2,819
4,427 12,303
3,195 8,212 2,652
420 8.7 610 4.7 264 7.6 683 7.7 167 5.9
9,060 8,467 593 6.5
12,860 12,154 706 5.5
3,817 3,528 289 7.6
8,616
8,192
424 4.9
15,916 14,700 1,216 7.6
78,735 73,200 5,535 7.0 48,433 45,485 2,948 6.1 17,685 17,000 685 3.9
6,885 6,550 335 4.9 76,000 72,511 3,489 4.6
11,421 10,601
820 7.2
13,981 13,303
678 4.8
8,216 7,771 445 5.4
8,331 7,895 436 5.2
18,016 16,889 1,127 6.3
4,071 7,650
825 6,333 2,478
3,834 7,077
771 5,903 2,269
237 5.8 573 7.5
54 6.5 430 6.8 209 8.4
Revised February 2015
Labor Force
6,448 3,164 3,891 13,659 7,782
Employment
5,850 2,879 3,606 12,890 7,140
Unemployment Number Rate
598 9.3 285 9.0 285 7.3 769 5.6 642 8.2
3,811 18,760 14,088 25,671 3,363
3,533 17,263 13,313 23,934
3,123
278 7.3 1,497 8.0
775 5.5 1,737 6.8
240 7.1
6,714 50,668 15,150
8,824 5,833
6,295 47,470 14,316 8,047 5,442
419 6.2 3,198 6.3
834 5.5 777 8.8 391 6.7
4,698 12,673 3,440
8,757 2,686
4,243 11,943
3,178 8,016 2,525
455 9.7 730 5.8 262 7.6 741 8.5 161 6.0
8,754 12,662
3,721 8,447 15,908
8,156 11,931 3,385
7,941 14,601
598 6.8 731 5.8 336 9.0 506 6.0 1,307 8.2
79,837 73,539 6,298 7.9
48,090 44,684 3,406 7.1
17,271 16,503
768 4.4
6,676 6,292 384 5.8
75,385 71,306 4,079 5.4
11,345 13,872 8,095
8,214 18,233
10,397 13,092
7,566 7,731 16,966
948 8.4 780 5.6 529 6.5 483 5.9 1,267 6.9
4,018 7,735
845 6,268 2,460
3,747 7,066
788 5,761 2,233
271 6.7 669 8.6
57 6.7 507 8.1 227 9.2
Source: Georgia Department of Labor, Workforce Statistics & Economic Research
19
Georgia Labor Force Estimates by County (not seasonally adjusted) Place of Residence - Persons 16 Years and Older
Richmond Rockdale Schley Screven Seminole
Preliminary February 2016
Labor Force
Employment
Unemployment Number Rate
84,038 78,218 5,820 6.9
42,696 40,155 2,541 6.0
2,077 1,940
137 6.6
5,130 4,707
423 8.2
3,144 2,868
276 8.8
Spalding Stephens Stewart Sumter Talbot
27,561 25,616 1,945 7.1
10,728 10,066
662 6.2
2,103 1,958
145 6.9
12,772 11,753 1,019 8.0
2,688 2,499
189 7.0
Taliaferro Tattnall Taylor Telfair Terrell
567 9,245 2,725 5,143 3,615
529 8,736 2,489 4,747 3,383
38 6.7 509 5.5 236 8.7 396 7.7 232 6.4
Thomas Tift Toombs Towns Treutlen
16,623 15,505 1,118 6.7
17,798 16,748 1,050 5.9
12,036 11,048 988 8.2
3,867 3,574
293 7.6
2,701 2,470
231 8.6
Troup Turner Twiggs Union Upson
36,269 34,362 1,907 5.3
3,203 2,988
215 6.7
3,001 2,719
282 9.4
9,876 9,340
536 5.4
11,047 10,330
717 6.5
Walker
30,602 28,307 2,295 7.5
Walton
42,305 40,196 2,109 5.0
Ware
14,741 13,854
887 6.0
Warren
2,633 2,444
189 7.2
Washington
7,176 6,704
472 6.6
Wayne Webster Wheeler White Whitfield
11,378 10,574 804 7.1
977
885
92 9.4
1,675 1,526
149 8.9
13,759 13,045
714 5.2
45,040 42,305 2,735 6.1
Wilcox Wilkes Wilkinson Worth
2,693 3,664 3,587 8,937
2,497 3,411 3,341 8,393
196 7.3 253 6.9 246 6.9 544 6.1
Revised January 2016
Labor Force
Employment
Unemployment Number Rate
83,908 78,026 5,882 7.0
42,427 39,927 2,500 5.9
2,101 1,955
146 6.9
5,165 4,761 404 7.8
3,203 2,943
260 8.1
27,605 25,520 2,085 7.6
10,689 10,054
635 5.9
2,134 1,999
135 6.3
12,920 11,894 1,026 7.9
2,707
2,511
196 7.2
576 9,484 2,756 5,065 3,646
537 8,995 2,518 4,692 3,405
39 6.8 489 5.2 238 8.6 373 7.4 241 6.6
16,663 15,570 1,093 6.6
18,027 17,022 1,005 5.6
12,195 11,237 958 7.9
3,830 3,554
276 7.2
2,728 2,516
212 7.8
36,232 34,179 2,053 5.7
3,303 3,080
223 6.8
2,976
2,721
255 8.6
9,977 9,480
497 5.0
11,138 10,382
756 6.8
29,810 28,100 1,710 5.7
42,036 40,012 2,024 4.8
14,923 14,064
859 5.8
2,625 2,444
181 6.9
7,218 6,764 454 6.3
11,365 10,570
795 7.0
1,001
915
86 8.6
1,727 1,588
139 8.0
13,555 12,909 646 4.8
45,085 41,896 3,189 7.1
2,791 3,726 3,571 9,033
2,599 3,492 3,336 8,512
192 6.9 234 6.3 235 6.6 521 5.8
Revised February 2015
Labor Force
Employment
Unemployment Number Rate
84,922 78,478 6,444 7.6
42,204 39,296 2,908 6.9
2,114 1,972
142 6.7
5,114 4,678
436 8.5
3,160 2,883
277 8.8
27,421 10,795
2,135 13,122 2,749
25,070 10,015 1,987 11,958 2,526
2,351 8.6 780 7.2 148 6.9
1,164 8.9 223 8.1
571 9,351 2,775 5,157 3,659
518 8,731 2,513 4,746 3,347
53 9.3 620 6.6 262 9.4 411 8.0 312 8.5
16,825 18,023 11,935
3,959 2,702
15,571 16,830 10,786
3,631 2,450
1,254 7.5 1,193 6.6 1,149 9.6
328 8.3 252 9.3
35,680 3,263 2,980 9,625 11,229
33,387 3,032 2,680 9,065
10,389
2,293 6.4 231 7.1 300 10.1 560 5.8 840 7.5
29,351 41,666 14,736 2,689
7,337
27,525 39,335 13,736
2,469 6,800
1,826 6.2 2,331 5.6 1,000 6.8
220 8.2 537 7.3
11,274 980
1,758 13,570 44,760
10,407 905
1,557 12,779 41,795
867 7.7 75 7.7
201 11.4 791 5.8 2,965 6.6
2,756 3,638 3,602 8,926
2,533 3,330 3,316 8,307
223 8.1 308 8.5 286 7.9 619 6.9
Source: Georgia Department of Labor, Workforce Statistics & Economic Research
20
New Developments
Yulista Aviation has announced it could double its number of employees in Middle Georgia with a hangar it will move into at the Middle Georgia Regional Airport. The company currently has offices in Byron and Warner Robins. They have more than 40 employees in the area now and looking to double that by next year. Yulista Aviation works with all branches of the military on the modification and maintenance of aircraft as new technologies and improved capabilities are developed. The Macon-Bibb County Industrial Authority invested more than $1 million in a partnership with Yulista by leasing the hangar.
Varian Medical Systems, a leading manufacturer of medical devices and software for treating cancer and a premier supplier of X-ray imaging components, has announced plans to expand its operations in Atlanta and create up to 100 new high-paying technical jobs over the next five years. The facility will be located on Northside Parkway and should be ready for occupancy in November 2016. The expansion into the state allows the California-based company to operate the Atlanta location as an East Coast hub to better serve its customers and accommodate growth. The new center will include a state-of-the-art customer visit facility so that customers in Europe and the eastern part of the United States do not need to travel far to meet with the company about technology needs. Varian has maintained an office in Marietta for more than 30 years.
Jindal Films Americas has announced a growth plan that will bring new technology and expanded capabilities. The plan includes relocating its research and development center and national headquarters to LaGrange from Macedon, N.Y. The company, which manufactures specialty films for packaging and labels, will expand an existing manufacturing facility in Troup County. The company will spend $180 million to enlarge its LaGrange facility and expects to create 240 new jobs there in the expansion and relocation. It now employs 200 people in LaGrange.
German based automotive product maker Linde & Wiemann has said it plans to establish a U.S. assembly operation with associated national sales and distribution activities in Hart County, GA. The company's first facility will initially employ approximately 200 people and represent an investment of around $35 million on a 29-acre site in the Gateway II Industrial Park in Hart County, in northeast Georgia. Linde & Wiemann is a privatelyheld, mid-sized German company specializing in manufacturing and assembling engineered steel systems mounted in motor vehicles like instrument panel assemblies and front end and door structure assemblies.
Capella Hotel Group has announced that it will introduce and manage a 214-room Sols Hotel at Two Porsche Drive, located adjacent to the Porsche Experience Center in Atlanta. The fivestar luxury Sols property, scheduled to open in 2017, will be designed by HOK Architects firm, which also designed the Porsche Cars North America Headquarters. The new Porsche complex, which opened in May 2015, is adjacent to the Hartsfield-Jackson Atlanta International Airport. As an integral part of the complex, in addition to guestrooms and signature suites, the hotel will include restaurants and bars featuring fresh, seasonal cooking, 6,500 square feet of event space including a 3,600 square foot ballroom, and a rooftop lounge with views of the Porsche handling course.
Heavy equipment distributor HD Supply has plans to expand operations in Cobb County that could bring more than 500 jobs to the area. HD Supply would invest $100 million for the expansion and accommodate the new employees in a 200,000 square foot office tower. The new headquarters and a Supply Leadership Development Center is part of a consolidation of HD Supply's operations and will tie together the company's existing field support units. The company currently employs 200 at its current headquarters near Cumberland Mall.
Note: Information in New Developments are from a variety of public sources and by no means are a comprehensive listing of new and expanding business in Georgia
Source: Georgia Department of Labor, Workforce Statistics and Economic Research
21
UNEMGPeoLrOgiaYUMneEmNploTymReAntTREateBs bYy CCoOunUtyNTIES FEBRUARY 2016
February 2016
Dade 5.4
Catoosa 5.3
Walker
Whitfield
Murray 7.4
Fannin 6.0
Union 5.4
Towns 7.6
Rabun 6.8
7.5
6.1
Chattooga 10.1
Gordon 5.4
Floyd 6.2
Bartow 5.3
Gilmer 5.7
Pickens 5.2
Cherokee 4.4
Lumpkin 5.0
Dawson 4.8
Forsyth 4.2
White Habersham
5.2
5.7
Stephens
6.2
Hall 4.6
Banks Franklin
5.3
5.5
Jackson 4.5
Madison 4.9
Hart 6.0
Elbert 7.1
7.0% or greater 49 counties (31%)
6.0% to 6.9% 48 counties (30%)
5.0% to 5.9% 48 counties (30%)
Polk 6.8
Paulding
Cobb 4.8
Gwinnett 4.9
Barrow 4.8
Clarke 5.4
Oglethorpe 5.1
Less than 5.0% 14 counties (9%)
Haralson 6.2
Carroll 6.3
Heard 5.8
4.8 Douglas 5.9
Coweta 5.0
Fulton 5.6
DeKalb 5.6 Rockdale
Walton 5.0
Oconee 4.1
Wilkes 6.9
Lincoln 6.5
Percentages of number of counties may not total 100 due to rounding
Clayton
7.0
Fayette 4.9
Henry 5.8
Spalding 7.1
6.0 Newton 6.2
Morgan 5.4
Butts 6.2
Jasper 5.2
Putnam 8.3
Greene 6.8
Taliaferro
6.7
McDuffie
Warren 7.7
Columbia 4.9
7.2
Richmond
Hancock
6.9
9.4
Glascock
6.3
Troup 5.3
Meriwether 7.0
Pike 5.2
Lamar 6.8
Upson
Monroe 5.6
Jones 5.0
Baldwin 7.1
Washington 6.6
Jefferson 8.3
Burke 7.7
Harris 5.2
Talbot 7.0
Muscogee 7.2
Marion Chattahoochee 7.9
6.5
Taylor 8.7
Crawford 5.7
Bibb 6.2
Twiggs 9.4
Wilkinson 6.9
Peach
7.1
Macon 8.5
Houston 5.5
Bleckley 8.3
Laurens 7.2
Johnson 6.4
Emanuel 8.3
Jenkins 8.0
Screven 8.2
Treutlen 8.6
Candler 5.1
Bulloch 5.5
Effingham 5.0
8.9
Stewart 6.9
Schley 6.6
Webster 9.4
Sumter 8.0
Quitm an
6.7 Randolph 9.3
Terrell 6.4
Lee 5.0
Clay 12.0
Calhoun 6.6
Dougherty 7.2
Early 8.2
Miller 6.5
Baker 7.9
Mitchell 7.0
Dooly 6.1
Pulaski 6.4
Dodge 7.6
Crisp 6.2
Wilcox 7.3
Turner 6.7
Ben Hill 8.9
Montgomery
Wheeler 8.9
7.7
Toombs 8.2
Evans 5.5
Tattnall
Telfair
5.5
7.7
Jeff Davis 6.0
Appling 6.4
Long 5.8
Bryan 5.1
Liberty 6.1
Worth 6.1
Colquitt 6.1
Irwin 8.3 Tift 5.9
Coffee 6.3
Berrien
Atkinson
7.3
6.0
Cook
6.2 Lanier
Bacon 5.3
Wayne 7.1
Ware 6.0
Pierce 5.5
Brantley 6.9
McIntosh 6.0
Glynn 5.7
Chatham 5.4
Seminole 8.8
Decatur 7.6
Grady 5.6
Thomas 6.7
Brooks 5.8
6.4
Lowndes 5.5 Echols
Clinch 6.7
Charlton 5.8
Camden 5.3
4.4
Georgia's Unemployment Rate: 5.6%
Georgia's U(nNoet SmeasponlaollyyAmdjusetend)t Rate: 5.6% (not seasonally adjusted) Source: Georgia Department of Labor, Workforce Statistics and Economic Research
22
Georgia Unemployment Insurance Claims by County
County
February 2016 Initial
Claims
Average Average Weekly Duration Benefit Weeks
County
February 2016 Initial
Claims
Average Average Weekly Duration Benefit Weeks
County
February 2016 Initial
Claims
Average Average Weekly Duration Benefit Weeks
Georgia
29,339........ $269.........9.3
Appling
103........ $245.........8.6
Atkinson
74........ $249.........6.9
Bacon
24........ $253.........6.1
Baker
10........$235....... 11.2
Baldwin
77........ $196.......10.9
Banks
122........ $251.........6.4
Barrow
138........ $250.......10.2
Bartow
315........ $238.........7.6
Ben Hill
103........ $208.........7.5
Berrien
96........ $236.........6.7
Bibb
409........$190....... 11.1
Bleckley
33........ $202.........9.8
Brantley
27........ $240.........9.7
Brooks
26........ $182.......10.5
Bryan
64........ $260.......10.6
Bulloch
161........ $204.........8.3
Burke
90........ $223.........8.4
Butts
60........$231....... 11.5
Calhoun
32........ $212.........7.1
Camden
79........ $238.......10.4
Candler
32........ $203.........9.0
Carroll
343........ $210.........8.2
Catoosa
157........ $247.........6.9
Charlton
17........$187....... 11.9
Chatham
505........$223....... 11.0
Chattahoochee 10........$204.......13.2
Chattooga
36........ $248.......10.8
Cherokee
415........ $267.......10.3
Clarke
249........ $211.........9.0
Clay
12........ $203.......12.0
Clayton
972........$226....... 11.0
Clinch
28........ $188.......12.2
Cobb
1,486........$257....... 11.5
Coffee
211........ $240.........7.4
Colquitt
142........ $193.......10.0
Columbia
181........ $245.........9.5
Cook
39........ $189.........8.0
Coweta
432........ $252.........8.5
Crawford
22........ $227.........9.1
Crisp
59........ $186.........9.5
Dade
26........ $219.........6.8
Dawson
37........ $258.......10.3
Decatur
83........ $215.......10.2
DeKalb
1,991........$236....... 11.6
Dodge
34........ $242.......10.3
Dooly
24........ $184.........8.3
Dougherty
350........$195....... 11.2
Douglas
358........$234....... 11.1
Early
35........ $210.......12.3
Echols
2........ $212.........7.8
Effingham
95........ $247.........9.8
Elbert Emanuel Evans Fannin Fayette Floyd Forsyth Franklin Fulton Gilmer Glascock Glynn Gordon Grady Greene Gwinnett Habersham Hall Hancock Haralson Harris Hart Heard Henry Houston Irwin Jackson Jasper Jeff Davis Jefferson Jenkins Johnson Jones Lamar Lanier Laurens Lee Liberty Lincoln Long Lowndes Lumpkin Macon Madison Marion McDuffie McIntosh Meriwether Miller Mitchell Monroe Montgomery Morgan Murray
104........ $208.........7.1 106........ $191.........9.6
20........ $248.........8.7 66........ $212.........9.1 163........ $265.......10.5 423........ $231.........7.8 234........ $279.......10.6 81........ $243.........6.5 2,565........$236....... 11.5 66........ $227.........7.0
3........ $226.........9.0 209........$197....... 11.7 266........ $244.........6.3
41........ $221.........6.9 36........$212....... 11.3 1,748........$257....... 11.1 567........ $252.........5.9 802........ $250.........8.7 27........ $205.........8.6 84........ $225.........7.3 136........ $193.........8.0 115........ $210.........5.7 38........ $242.........6.9 548........$245....... 11.0 257........ $221.......10.1 48........ $203.........8.0 146........ $234.........8.4 46........ $207.........7.7 34........ $244.........7.4 49........ $203.........9.7 38........ $185.........7.3 19........ $194.......10.1 35........$204....... 11.9 59........ $238.........8.2 19........$216....... 11.1 137........ $177.......10.1 82........ $244.........8.6 111........$206....... 11.2 41........ $256.........6.7 29........$220....... 11.8 168........ $185.......10.4 66........ $249.........9.1 48........ $195.........9.6 65........ $247.........7.6 22........ $214.......12.5 83........ $189.........7.8 24........$196....... 11.8 105........ $205.........7.5
9........$219....... 11.7 69........$202....... 11.6 47........$227....... 11.4 34........ $197.........9.5 31........ $256.........8.1 411........ $255.........5.0
Muscogee Newton Oconee Oglethorpe Paulding Peach Pickens Pierce Pike Polk Pulaski Putnam Quitman Rabun Randolph Richmond Rockdale Schley Screven Seminole Spalding Stephens Stewart Sumter Talbot Taliaferro Tattnall Taylor Telfair Terrell Thomas Tift Toombs Towns Treutlen Troup Turner Twiggs Union Upson Walker Walton Ware Warren Washington Wayne Webster Wheeler White Whitfield Wilcox Wilkes Wilkinson Worth
607........ $212.........9.5 287........ $231.......10.0
27........ $242.........8.9 26........ $239.......10.1 294........ $258.......10.7 46........ $202.........8.3 53........ $259.........8.4 21........ $198.........9.6 41........ $222.........7.6 275........ $231.........7.2 18........ $254.......10.4 85........ $229.........9.6
2........ $277.......10.2 42........ $227.........9.7 29........ $202.........8.4 516........ $205.......10.0 234........ $234.......10.6
7........ $181.......10.7 78........ $209.........5.7 17........ $216.......10.9 286........ $211.........9.1 92........ $237.........7.4 24........$191....... 11.7 119........$175....... 11.1 38........ $171.........9.7
3............ $0.........7.3 52........ $219.......10.8 11........ $201.........8.0 23........ $218.........9.7 29........ $155.........8.8 79........ $200.........9.5 101........ $201.........9.3 134........ $213.........9.2 20........ $236.......10.0 62........ $181.........8.2 214........ $211.........7.7 23........ $166.........9.1 45........$212....... 11.2 65........ $238.......10.2 95........ $210.........8.3 536........ $246.........5.9 159........ $249.........9.6 89........ $185.........9.2 26........ $180.........7.7 51........ $223.......10.5 66........ $234.......10.9
5........ $161.......12.5 10........ $219.........8.1 138........ $208.........8.2 1,115........ $257.........4.6 21........ $220.........9.4 44........ $192.........6.4 17........ $202.......10.8 49........ $214.......10.4
Note: Initial claims include intrastate initial and additional claims, as well as agent state initial and additional claims for regular UI only. Average duration of benefits is represented in weeks.
Data does not include state or federal extended benefits.
Source: Georgia Department of Labor, Workforce Statistics and Economic Research
23
Mark Butler, Commissioner 148 Andrew Young International Boulevard, N.E. Atlanta, Georgia 30303-1751
Return Service Requested