- Collection:
- Georgia Government Publications
- Title:
- Dimensions: measuring Georgia's workforce [Vol. 42, no. 10 (Oct. 2016)]
- Creator:
- Georgia. Department of Labor. Workforce Statistics and Economic Research Division
- Contributor to Resource:
- Georgia. Department of Labor. Workforce Statistics and Economic Research Division
- Publisher:
- Atlanta, Ga. : Georgia. Department of Labor. Workforce Statistics and Economic Research Division
- Date of Original:
- 2016-10
- Subject:
- Georgia
- Location:
- United States, Georgia, 32.75042, -83.50018
- Medium:
- publications (documents)
- Type:
- Text
- Format:
- application/pdf
- External Identifiers:
- Call Number GA L200.E46 P1 T7 42/10
- Metadata URL:
- https://dlg.galileo.usg.edu/id:dlg_ggpd_i-ga-bl200-pe46-bp1-bt7-b42-s10-belec-p-btext
- Digital Object URL:
- https://dlg.galileo.usg.edu/do:dlg_ggpd_i-ga-bl200-pe46-bp1-bt7-b42-s10-belec-p-btext
- Language:
- eng
- Holding Institution:
- University of Georgia. Map and Government Information Library
- Rights:
-

Jackson Madison Elbert
Polk
Cobb
Gwinnett Barrow Clarke
D I M E N S I O Paulding
Haralson Douglas
DeKalb Rock-
Walton
Oconee Oglethorpe
Wilkes
Lincoln
EdgefieSlCd,
Carroll
Fulton Clayton
dale Newton
Morgan Greene Taliaferro
Columbia
Fayette Henry
McDuffie Warren
Heard
Coweta
Spalding Butts Jasper Putnam Hancock
Glascock
Richmond
AikenSC,
N
S
Russell, AL
Measuring Georgia's Workforce Troup Meriwether Pike Lamar Monroe Upson
Jones
Baldwin
Jefferson Washington
Burke
Harris
Talbot
October 2016 Data
Muscogee
Taylor
Bibb Crawford
Peach
Wilkinson Twiggs
Johnson
Jenkins Emanuel
Screven
Volume XLII, Number 10
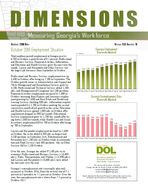
October 2016 Employment Situation Marion Chattahoo-
Houston Bleckley Macon
Laurens
Treutlen
chee
In millions
CandlGereorgBuialloEcmh ploEyfmfinegnhatm
(Seasonally Adjusted)
Total nonfarm payScrhollelyemploymeDnotoilyn 6,7S0te0wianrtOcWtoebbestre,ra grSouwmttehr rate of 0.2
GPeuolragskiia percent.
rosDeodbgye Professional
Montgomery
Wheeler
Toombs
Evans
Bryan
QuaaitnnmddaBnEdusuicnaetsios nSearnvdicHese,aFltihnaSnecrivailcACerscistgpivreitwiesWt,hiIlecnomfxoormstaotvioenrT,etlhfaeir monRtahn.dLolepihsureTearrnedll HosLpeietality and TOurtnheerr ServiBceensHsiallw the largest job decreases from September to October.
Jeff Davis
4.31
Tattnall 4.32App4l.3in3g 4.33 4.35
4.36 4.3L7ibe4r.t3y8 Long
Chatham 4.38 4.38 4.39
4.40
4.41
Clay
Calhoun
Dougherty Worth
Irwin
Coffee
Professional and Business Services empTloiftyment was up
Bacon
Wayne
McIntosh
4,4Ea0r0ly in OctobBeark,erafter being up 7,200 in September. The OWcatsotbeeMMrillgaerrnoawgethmceonmt MaenistdcahsRelAlemdmedinCiaoitsliqtoruanitttiSveerCvaoincodeksSBguerprerpiweonrbt yanAdtkinson 3,100, Professional and Technical Services added 1,L5a0ni0er
Pierce
Ware
Brantley
Glynn
jobSse,mainnodleManagement of Companies lost 200 positions. Financial DAeccatitvurities GermadpyloymTheomntasincrBeraosoeksd by 1Lo,8w0nd0eisn
ClincOhct-15 Nov-15 Dec-15 Jan-16 Feb-16 MaCr-1a6mAdper-1n6 May-16 Jun-16 Jul-16 Aug-16 Sep-16 Oct-16 Charlton
October stemming from Finance and Insurance emploEyc-hols
Georgia Unemployment Rate
ment growing by 2,600 and Real Estate and Rental and
(Seasonally Adjusted)
Leasing Services shedding 800 jobs. Information employ-
ment expanded by 1,700 in October marking the second
consecutive month of job growth in the sector. Education
and Health Services gained 1,000 jobs in October after
employment dropped by 900 last month. Educational Services employment grew by 1,700 this month after be-
5.5% 5.5% 5.5%
5.5% 5.5%
5.4% 5.4%
ing down 1,600 last month, while Health Care and Social Assistance employment fell by 700 in October after being up 700 in September.
5.3%
5.2%
5.1%
5.1%
5.0%
4.9%
Leisure and Hospitality employment declined by 1,600 in October, the sector added 6,500 jobs in August and 3,100 positions in September. Arts, Entertainment and Recreation lost 1,200 jobs in October while Accommodation and Food Services shed 400 positions. Jobs in Other Services fell by 1,100 October.
Oct-15 Nov-15 Dec-15 Jan-16 Feb-16 Mar-16 Apr-16 May-16 Jun-16 Jul-16 Aug-16 Sep-16 Oct-16
Over the year, Georgia has added 97,100 jobs to its economy. Professional and Business Services (+24,400 jobs); Trade, Transportation, and Utilities (+21,900 jobs); and Leisure and Hospitality (+18,600 jobs) have added the most jobs over the year.
Georgia's unemployment rate (seasonally adjusted) increased in October 2016, from the revised rate of 5.1 percent in September to 5.2 percent in October. Over the year, the unemployment rate is down from 5.5 percent in October 2015.
Workforce Statistics & Economic Research Mark Butler, Commissioner
For more information, contact Corey Smith or Evan Cross at (404) 232-3875
corey.smith@gdol.ga.gov evan.cross@gdol.ga.gov
Equal Opportunity Employer/ProgramAuxiliary Aids and Services Available upon Request to Individuals with Disabilities
GEORGIA Nonfarm Employment
(In thousands)
(Seasonally Adjusted)
Preliminary
Revised
OCT 2016 SEP 2016
Revised OCT 2015
Change in Jobs from SEP 2016
Net %
Change in Jobs from OCT 2015
Net %
Total Nonfarm
4,410.3
4,403.6
4,313.2
6.7 0.2
97.1 2.3
Total Private
3,721.4
3,715.1
3,631.7
6.3 0.2
89.7 2.5
Goods Producing
570.6
570.6
560.8
0.0 0.0
9.8 1.7
Service-Providing
3,839.7
3,833.0
3,752.4
6.7 0.2
87.3 2.3
Private Service-Providing
3,150.8
3,144.5
3,070.9
6.3 0.2
79.9 2.6
Mining and Logging
8.6
8.6
9.1
0.0 0.0
-0.5 -5.5
Mining, Logging and Construction
186.4
186.1
177.3
0.3 0.2
9.1 5.1
Construction
177.8
177.5
168.2
0.3 0.2
9.6 5.7
Manufacturing
384.2
384.5
383.5
-0.3 -0.1
0.7 0.2
Durable Goods
191.1
190.9
187.1
0.2 0.1
4.0 2.1
Non-Durable Goods
193.1
193.6
196.4
-0.5 -0.3
-3.3 -1.7
Trade, Transportation, and Utilities
937.6
937.5
915.7
0.1 0.0
21.9 2.4
Wholesale Trade
225.2
222.5
218.5
2.7 1.2
6.7 3.1
Retail Trade
506.0
506.7
491.7
-0.7 -0.1
14.3 2.9
Transportation, Warehousing, and Utilities
206.4
208.3
205.5
-1.9 -0.9
0.9 0.4
Information
105.0
103.3
105.3
1.7 1.6
-0.3 -0.3
Financial Activities
244.5
242.7
238.2
1.8 0.7
6.3 2.6
Finance and Insurance
183.8
181.2
175.7
2.6 1.4
8.1 4.6
Real Estate and Rental and Leasing
60.7
61.5
62.5
-0.8 -1.3
-1.8 -2.9
Professional and Business Services
676.3
671.9
651.9
4.4 0.7
24.4 3.7
Professional, Scientific, and Technical Services
275.2
273.7
264.3
1.5 0.5
10.9 4.1
Management of Companies and Enterprises
66.1
66.3
66.0
-0.2 -0.3
0.1 0.2
Admin and Support, Waste Mngmnt and Remediation
335.0
331.9
321.6
3.1 0.9
13.4 4.2
Education and Health Services
556.1
555.1
544.7
1.0 0.2
11.4 2.1
Educational Services
72.4
70.7
72.1
1.7 2.4
0.3 0.4
Health Care and Social Assistance
483.7
484.4
472.6
-0.7 -0.1
11.1 2.3
Leisure and Hospitality
476.3
477.9
457.7
-1.6 -0.3
18.6 4.1
Arts, Entertainment, and Recreation
54.9
56.1
48.9
-1.2 -2.1
6.0 12.3
Accommodation and Food Services
421.4
421.8
408.8
-0.4 -0.1
12.6 3.1
Other Services
155.0
156.1
157.4
-1.1 -0.7
-2.4 -1.5
Government
688.9
688.5
681.5
0.4 0.1
7.4 1.1
Federal Government
100.3
100.2
98.6
0.1 0.1
1.7 1.7
State Government
172.8
171.3
172.4
1.5 0.9
0.4 0.2
Local Government
415.8
417.0
410.5
-1.2 -0.3
5.3 1.3
Note: These seasonally adjusted estimates were prepared in cooperation with the U.S. Department of Labor, Bureau of Labor Statistics, based upon monthly reports submitted by selected
employers throughout Georgia. The estimates include all full- and part-time wage and salary workers who were employed during or received pay for any part of the pay period that includes the twelfth of the month. Proprietors, domestic workers, self-employed persons, unpaid family workers and personnel of the armed forces are excluded. Estimates based on 2015 benchmark.
Source: Georgia Department of Labor, Workforce Statistics & Economic Research
Georgia Department of Labor, Mark Butler, Commissioner Equal Opportunity Employer/Program Auxiliary Aids and Services Available Upon Request to Individuals With Disabilities
2
GEORGIA Nonfarm Employment
(In thousands)
(Not Seasonally Adjusted)
Preliminary
Revised
Revised
OCT 2016 SEP 2016 OCT 2015
Change in Jobs from SEP 2016
Net %
Change in Jobs from OCT 2015
Net %
Total Nonfarm
4,428.1
4,393.4
4,334.4
34.7 0.8
93.7 2.2
Total Private
3,732.7
3,702.7
3,645.5
30.0 0.8
87.2 2.4
Goods Producing
573.2
573.8
563.2
-0.6 -0.1
10.0 1.8
Service-Providing
3,854.9
3,819.6
3,771.2
35.3 0.9
83.7 2.2
Private Service-Providing
3,159.5
3,128.9
3,082.3
30.6 1.0
77.2 2.5
Mining and Logging
8.7
8.6
9.2
0.1 1.2
-0.5 -5.4
Mining, Logging and Construction
189.4
189.7
180.2
-0.3 -0.2
9.2 5.1
Construction
180.7
181.1
171.0
-0.4 -0.2
9.7 5.7
Construction of Buildings
38.3
38.5
37.7
-0.2 -0.5
0.6 1.6
Heavy and Civil Engineering Construction
28.7
28.2
23.6
0.5 1.8
5.1 21.6
Specialty Trade Contractors
113.7
114.4
109.7
-0.7 -0.6
4.0 3.7
Manufacturing
383.8
384.1
383.0
-0.3 -0.1
0.8 0.2
Durable Goods
190.3
190.4
186.1
-0.1 -0.1
4.2 2.3
Computer, Electrical Equip and Appliance Mfg
22.1
22.2
23.0
-0.1 -0.5
-0.9 -3.9
Transportation Equipment Manufacturing
51.2
51.8
49.8
-0.6 -1.2
1.4 2.8
Non-Durable Goods
193.5
193.7
196.9
-0.2 -0.1
-3.4 -1.7
Food Manufacturing
65.5
65.3
65.3
0.2 0.3
0.2 0.3
Textile Mills
19.3
19.2
19.4
0.1 0.5
-0.1 -0.5
Textile Product Mills
28.5
28.7
28.8
-0.2 -0.7
-0.3 -1.0
Trade, Transportation, and Utilities
938.5
929.0
918.1
9.5 1.0
20.4 2.2
Wholesale Trade
225.2
221.8
219.5
3.4 1.5
5.7 2.6
Merchant Wholesalers, Durable Goods
110.4
109.4
106.8
1.0 0.9
3.6 3.4
Merchant Wholesalers, Nondurable Goods
62.7
61.3
63.0
1.4 2.3
-0.3 -0.5
Wholesale Electronic Markets and Agents and Brokers 52.1
51.1
49.7
1.0 2.0
2.4 4.8
Retail Trade
506.8
501.4
492.1
5.4 1.1
14.7 3.0
Food and Beverage Stores
92.5
92.4
91.7
0.1 0.1
0.8 0.9
General Merchandise Stores
112.7
110.4
110.1
2.3 2.1
2.6 2.4
Miscellaneous Store Retailers
21.9
20.9
21.6
1.0 4.8
0.3 1.4
Transportation, Warehousing, and Utilities
206.5
205.8
206.5
0.7 0.3
0.0 0.0
Utilities
19.8
19.8
20.1
0.0 0.0
-0.3 -1.5
Transportation and Warehousing
186.7
186.0
186.4
0.7 0.4
0.3 0.2
Air Transportation
40.5
39.4
39.7
1.1 2.8
0.8 2.0
Truck Transportation
49.3
48.7
50.7
0.6 1.2
-1.4 -2.8
Couriers and Messengers
21.8
21.9
20.7
-0.1 -0.5
1.1 5.3
Warehousing and Storage
34.7
34.4
33.6
0.3 0.9
1.1 3.3
Information
105.4
103.4
106.1
2.0 1.9
-0.7 -0.7
Telecommunications
46.6
46.3
45.0
0.3 0.7
1.6 3.6
Wired Telecommunications Carriers
30.0
30.0
30.3
0.0 0.0
-0.3 -1.0
Wireless Telecommunications Carriers
7.8
7.5
7.3
0.3 4.0
0.5 6.9
Internet Service Providers, Search Portals, and DP
8.4
8.2
8.1
0.2 2.4
0.3 3.7
Financial Activities
245.0
242.2
239.2
2.8 1.2
5.8 2.4
Finance and Insurance
183.6
180.4
176.0
3.2 1.8
7.6 4.3
Insurance Carriers and Related Activities
86.7
85.4
81.5
1.3 1.5
5.2 6.4
Real Estate and Rental and Leasing
61.4
61.8
63.2
-0.4 -0.7
-1.8 -2.9
Professional and Business Services
681.7
672.0
657.7
9.7 1.4
24.0 3.7
Professional, Scientific, and Technical Services
274.6
270.1
264.4
4.5 1.7
10.2 3.9
Accounting, Tax Prep, and Bookkeeping Services
45.2
44.1
41.3
1.1 2.5
3.9 9.4
Architectural, Engineering, and Related Services
44.2
44.5
42.9
-0.3 -0.7
1.3 3.0
Computer Systems Design and Related Services
70.1
68.5
66.2
1.6 2.3
3.9 5.9
Management and Technical Consulting Services
38.3
38.3
39.7
0.0 0.0
-1.4 -3.5
Management of Companies and Enterprises
66.1
66.6
66.0
-0.5 -0.8
0.1 0.2
Admin and Support, Waste Mngmnt and Remediation
341.0
335.3
327.3
5.7 1.7
13.7 4.2
Employment Services
172.3
169.3
160.9
3.0 1.8
11.4 7.1
Education and Health Services
560.9
553.8
549.0
7.1 1.3
11.9 2.2
Educational Services
74.1
69.9
73.7
4.2 6.0
0.4 0.5
Colleges, Universities, and Professional Schools
34.3
30.6
33.6
3.7 12.1
0.7 2.1
Health Care and Social Assistance
486.8
483.9
475.3
2.9 0.6
11.5 2.4
Ambulatory Health Care Services
187.8
185.1
184.9
2.7 1.5
2.9 1.6
Hospitals
173.1
172.6
166.6
0.5 0.3
6.5 3.9
Nursing and Residential Care Facilities
59.4
60.3
59.4
-0.9 -1.5
0.0 0.0
Social Assistance
66.5
65.9
64.4
0.6 0.9
2.1 3.3
Leisure and Hospitality
473.6
473.0
456.0
0.6 0.1
17.6 3.9
Arts, Entertainment, and Recreation
53.4
55.4
47.6
-2.0 -3.6
5.8 12.2
Amusement, Gambling, and Recreation Industries
38.8
40.2
35.3
-1.4 -3.5
3.5 9.9
Accommodation and Food Services
420.2
417.6
408.4
2.6 0.6
11.8 2.9
Accommodation
43.4
43.3
43.2
0.1 0.2
0.2 0.5
Food Services and Drinking Places
376.8
374.3
365.2
2.5 0.7
11.6 3.2
Other Services
154.4
155.5
156.2
-1.1 -0.7
-1.8 -1.2
Repair and Maintenance
37.1
37.0
37.9
0.1 0.3
-0.8 -2.1
Personal and Laundry Services
36.1
36.6
36.1
-0.5 -1.4
0.0 0.0
Religious, Grantmaking, Civic, Professional, and Similar
81.2
81.9
82.2
-0.7 -0.9
-1.0 -1.2
Government
695.4
690.7
688.9
4.7 0.7
6.5 0.9
Federal Government
99.6
99.3
98.7
0.3 0.3
0.9 0.9
Department of Defense
41.6
41.4
40.6
0.2 0.5
1.0 2.5
State Government
175.5
172.9
176.0
2.6 1.5
-0.5 -0.3
State Government Educational Services
105.0
102.7
103.7
2.3 2.2
1.3 1.3
Local Government
420.3
418.5
414.2
1.8 0.4
6.1 1.5
Local Government Educational Services
248.9
247.6
244.9
1.3 0.5
4.0 1.6
Note: These not seasonally adjusted estimates were prepared in cooperation with the U.S. Department of Labor, Bureau of Labor Statistics, based upon monthly reports submitted by selected
employers throughout Georgia. The estimates include all full- and part-time wage and salary workers who were employed during or received pay for any part of the pay period that includes the twelfth
of the month. Proprietors, domestic workers, self-employed persons, unpaid family workers and personnel of the armed forces are excluded. Estimates based on 2015 benchmark.
Source: Georgia Department of Labor, Workforce Statistics & Economic Research
3
ALBANY MSA Nonfarm Employment
(In thousands)
(Not Seasonally Adjusted)
Preliminary
Revised
Revised
OCT 2016 SEP 2016 OCT 2015
Change in Jobs from SEP 2016
Net %
Change in Jobs from OCT 2015
Net %
Total Nonfarm Total Private Goods Producing Service-Providing Private Service-Providing Manufacturing Trade, Transportation, and Utilities
Retail Trade Government
Federal Government State Government Local Government
63.3
62.6
62.1
50.4
49.7
49.1
7.4
7.3
6.9
55.9
55.3
55.2
43.0
42.4
42.2
4.3
4.2
4.2
12.5
12.2
12.2
7.7
7.4
7.1
12.9
12.9
13.0
2.7
2.7
2.7
2.9
2.9
3.0
7.3
7.3
7.3
0.7 1.1 0.7 1.4 0.1 1.4 0.6 1.1 0.6 1.4 0.1 2.4 0.3 2.5 0.3 4.1 0.0 0.0 0.0 0.0 0.0 0.0 0.0 0.0
1.2 1.9 1.3 2.7 0.5 7.3 0.7 1.3 0.8 1.9 0.1 2.4 0.3 2.5 0.6 8.5 -0.1 -0.8 0.0 0.0 -0.1 -3.3 0.0 0.0
Note: These not seasonally adjusted estimates were prepared in cooperation with the U.S. Department of Labor, Bureau of Labor Statistics, based upon monthly reports submitted by
selected employers in the Albany Metropolitan Statistical Area, which includes Baker, Dougherty, Lee, Terrell and Worth counties. The estimates include all full- and part-time wage and salary workers who were employed during or received pay for any part of the pay period that includes the twelfth of the month. Proprietors, domestic workers, self-employed persons, unpaid familyworkers and personnel of the armed forces are excluded. Estimates based on 2015 benchmark.
ATHENS-CLARKE MSA Nonfarm Employment
(In thousands)
(Not Seasonally Adjusted)
Preliminary
Revised
Revised
OCT 2016 SEP 2016 OCT 2015
Change in Jobs from SEP 2016
Net %
Change in Jobs from OCT 2015
Net %
Total Nonfarm Total Private Goods Producing Service-Providing Private Service-Providing Trade, Transportation, and Utilities
Retail Trade Professional and Business Services Leisure and Hospitality Government
Federal Government State Government Local Government
96.2
96.5
93.4
-0.3 -0.3
65.7
66.3
63.9
-0.6 -0.9
9.0
9.2
9.3
-0.2 -2.2
87.2
87.3
84.1
-0.1 -0.1
56.7
57.1
54.6
-0.4 -0.7
16.1
16.3
15.7
-0.2 -1.2
10.3
10.5
10.2
-0.2 -1.9
8.2
8.1
7.8
0.1 1.2
10.8
10.8
10.5
0.0 0.0
30.5
30.2
29.5
0.3 1.0
1.1
1.1
1.1
0.0 0.0
21.9
21.6
20.7
0.3 1.4
7.5
7.5
7.7
0.0 0.0
2.8 3.0 1.8 2.8 -0.3 -3.2 3.1 3.7 2.1 3.9 0.4 2.6 0.1 1.0 0.4 5.1 0.3 2.9 1.0 3.4 0.0 0.0 1.2 5.8 -0.2 -2.6
Note: These not seasonally adjusted estimates were prepared in cooperation with the U.S. Department of Labor, Bureau of Labor Statistics, based upon monthly reports submitted by selected
employers in the Athens - Clarke County Metropolitan Statistical Area, which includes Clarke, Madison, Oconee and Oglethorpe counties. The estimates include all full- and part-time wage and salary workers who were employed during or received pay for any part of the pay period that includes the twelfth of the month. Proprietors, domestic workers, self-employed persons, unpaid family workers and personnel of the armed forces are excluded. Estimates based on 2015 benchmark.
Source: Georgia Department of Labor, Workforce Statistics & Economic Research
4
ATLANTA MSA Nonfarm Employment
(In thousands)
(Not Seasonally Adjusted)
Preliminary OCT 2016
Revised SEP 2016
Revised OCT 2015
Change in Jobs from SEP 2016
Net %
Change in Jobs from OCT 2015
Net %
Total Nonfarm
2,693.6
2,668.0
2,623.2
25.6 1.0
70.4 2.7
Total Private
2,361.2
2,337.8
2,295.8
23.4 1.0
65.4 2.9
Goods Producing
281.1
279.6
271.8
1.5 0.5
9.3 3.4
Service-Providing
2,412.5
2,388.4
2,351.4
24.1 1.0
61.1 2.6
Private Service-Providing
2,080.1
2,058.2
2,024.0
21.9 1.1
56.1 2.8
Mining and Logging
1.4
1.4
1.5
0.0 0.0
-0.1 -6.7
Mining, Logging and Construction
120.0
118.4
111.9
1.6 1.4
8.1 7.2
Construction
118.6
117.0
110.4
1.6 1.4
8.2 7.4
Construction of Buildings
22.6
22.4
23.6
0.2 0.9
-1.0 -4.2
Specialty Trade Contractors
76.1
75.4
71.5
0.7 0.9
4.6 6.4
Manufacturing
161.1
161.2
159.9
-0.1 -0.1
1.2 0.8
Durable Goods
83.2
83.0
82.1
0.2 0.2
1.1 1.3
Transportation Equipment Manufacturing
14.2
14.3
14.8
-0.1 -0.7
-0.6 -4.1
Non-Durable Goods
77.9
78.2
77.8
-0.3 -0.4
0.1 0.1
Food Manufacturing
25.4
25.3
25.1
0.1 0.4
0.3 1.2
Trade, Transportation, and Utilities
599.5
593.0
586.2
6.5 1.1
13.3 2.3
Wholesale Trade
164.5
162.0
159.2
2.5 1.5
5.3 3.3
Merchant Wholesalers, Durable Goods
80.4
79.5
78.1
0.9 1.1
2.3 2.9
Merchant Wholesalers, Nondurable Goods
41.0
40.7
41.1
0.3 0.7
-0.1 -0.2
Wholesale Electronic Markets and Agents and Brokers
43.1
41.8
40.0
1.3 3.1
3.1 7.8
Retail Trade
293.5
291.6
286.1
1.9 0.7
7.4 2.6
Food and Beverage Stores
57.8
57.5
56.5
0.3 0.5
1.3 2.3
General Merchandise Stores
61.0
59.7
60.0
1.3 2.2
1.0 1.7
Miscellaneous Store Retailers
14.2
13.5
14.0
0.7 5.2
0.2 1.4
Transportation, Warehousing, and Utilities
141.5
139.4
140.9
2.1 1.5
0.6 0.4
Utilities
10.0
10.1
10.3
-0.1 -1.0
-0.3 -2.9
Transportation and Warehousing
131.5
129.3
130.6
2.2 1.7
0.9 0.7
Air Transportation
39.8
38.7
39.6
1.1 2.8
0.2 0.5
Truck Transportation
32.1
31.7
31.8
0.4 1.3
0.3 0.9
Couriers and Messengers
17.0
17.1
16.1
-0.1 -0.6
0.9 5.6
Information
88.2
88.2
88.4
0.0 0.0
-0.2 -0.2
Telecommunications
37.7
37.6
38.4
0.1 0.3
-0.7 -1.8
Wired Telecommunications Carriers
25.3
25.3
25.7
0.0 0.0
-0.4 -1.6
Wireless Telecommunications Carriers
6.6
6.4
6.4
0.2 3.1
0.2 3.1
Internet Service Providers, Search Portals, and DP
7.3
7.2
7.4
0.1 1.4
-0.1 -1.4
Financial Activities
168.8
168.2
164.0
0.6 0.4
4.8 2.9
Finance and Insurance
124.4
123.1
118.6
1.3 1.1
5.8 4.9
Insurance Carriers and Related Activities
61.4
60.6
56.5
0.8 1.3
4.9 8.7
Real Estate and Rental and Leasing
44.4
45.1
45.4
-0.7 -1.6
-1.0 -2.2
Professional and Business Services
507.5
497.9
489.5
9.6 1.9
18.0 3.7
Professional, Scientific, and Technical Services
215.8
212.4
208.7
3.4 1.6
7.1 3.4
Accounting, Tax Prep, and Bookkeeping Services
29.1
28.2
27.7
0.9 3.2
1.4 5.1
Architectural, Engineering, and Related Services
31.2
31.1
29.5
0.1 0.3
1.7 5.8
Computer Systems Design and Related Services
60.2
60.0
58.0
0.2 0.3
2.2 3.8
Management and Technical Consulting Services
34.1
34.2
35.4
-0.1 -0.3
-1.3 -3.7
Management of Companies and Enterprises
52.9
53.2
53.3
-0.3 -0.6
-0.4 -0.8
Admin and Support, Waste Mngmnt and Remediation
238.8
232.3
227.5
6.5 2.8
11.3 5.0
Employment Services
119.5
114.3
112.8
5.2 4.6
6.7 5.9
Education and Health Services
334.2
329.5
323.0
4.7 1.4
11.2 3.5
Educational Services
53.0
51.3
52.3
1.7 3.3
0.7 1.3
Health Care and Social Assistance
281.2
278.2
270.7
3.0 1.1
10.5 3.9
Ambulatory Health Care Services
112.1
109.8
108.1
2.3 2.1
4.0 3.7
Hospitals
100.1
99.5
94.7
0.6 0.6
5.4 5.7
Social Assistance
42.4
41.8
40.4
0.6 1.4
2.0 5.0
Leisure and Hospitality
286.4
286.3
275.6
0.1 0.0
10.8 3.9
Arts, Entertainment, and Recreation
36.6
38.2
33.0
-1.6 -4.2
3.6 10.9
Accommodation and Food Services
249.8
248.1
242.6
1.7 0.7
7.2 3.0
Accommodation
24.2
24.0
24.0
0.2 0.8
0.2 0.8
Food Services and Drinking Places
225.6
224.1
218.6
1.5 0.7
7.0 3.2
Other Services
95.5
95.1
97.3
0.4 0.4
-1.8 -1.9
Repair and Maintenance
20.9
20.6
22.9
0.3 1.5
-2.0 -8.7
Personal and Laundry Services
25.7
25.6
25.4
0.1 0.4
0.3 1.2
Government
332.4
330.2
327.4
2.2 0.7
5.0 1.5
Federal Government
47.0
46.8
44.8
0.2 0.4
2.2 4.9
State Government
72.2
71.1
74.4
1.1 1.6
-2.2 -3.0
Local Government
213.2
212.3
208.2
0.9 0.4
5.0 2.4
Note: These not seasonally adjusted estimates were prepared in cooperation with the U.S. Department of Labor, Bureau of Labor Statistics, based upon monthly reports submitted by
selected employers in the Atlanta Metropolitan Statistical Area, which includes Barrow, Bartow, Butts, Carroll, Cherokee, Clayton, Cobb, Coweta, Dawson, DeKalb, Douglas, Fayette, Forsyth,
Fulton, Gwinnett, Haralson, Heard, Henry, Jasper, Lamar, Meriwether, Morgan, Newton, Paulding, Pickens, Pike, Rockdale, Spalding and Walton counties. The estimates include all full- and
part-time wage and salary workers who were employed during or received pay for any part of the pay period that includes the twelfth of the month. Proprietors, domestic workers, self-employed
persons, unpaid family workers and personnel of the armed forces are excluded. Estimates based on 2015 benchmark.
Source: Georgia Department of Labor, Workforce Statistics & Economic Research
5
AUGUSTA-RICHMOND MSA Nonfarm Employment
(In thousands)
(Not Seasonally Adjusted)
Preliminary
Revised
Revised
OCT 2016 SEP 2016 OCT 2015
Change in Jobs from SEP 2016
Net %
Change in Jobs from OCT 2015
Net %
Total Nonfarm Total Private Goods Producing Service-Providing Private Service-Providing Mining, Logging and Construction Manufacturing Trade, Transportation, and Utilities
Wholesale Trade Retail Trade Transportation, Warehousing, and Utilities Information Financial Activities Professional and Business Services Education and Health Services Leisure and Hospitality Other Services Government Federal Government State Government Local Government
231.5 183.5
32.4 199.1 151.1
12.0 20.4 40.3
6.4 26.5
7.4 2.8 7.8 35.9 32.6 23.4 8.3 48.0 9.3 16.6 22.1
230.3 182.5
32.5 197.8 150.0
12.1 20.4 40.0
6.3 26.2
7.5 2.8 7.7 35.3 32.6 23.3 8.3 47.8 9.3 16.5 22.0
229.1 181.6
32.6 196.5 149.0
12.0 20.6 39.8
6.1 26.3
7.4 3.0 7.7 34.8 32.0 23.5 8.2 47.5 9.3 16.2 22.0
1.2 0.5 1.0 0.6 -0.1 -0.3 1.3 0.7 1.1 0.7 -0.1 -0.8 0.0 0.0 0.3 0.8 0.1 1.6 0.3 1.2 -0.1 -1.3 0.0 0.0 0.1 1.3 0.6 1.7 0.0 0.0 0.1 0.4 0.0 0.0 0.2 0.4 0.0 0.0 0.1 0.6 0.1 0.5
2.4 1.1 1.9 1.1 -0.2 -0.6 2.6 1.3 2.1 1.4 0.0 0.0 -0.2 -1.0 0.5 1.3 0.3 4.9 0.2 0.8 0.0 0.0 -0.2 -6.7 0.1 1.3 1.1 3.2 0.6 1.9 -0.1 -0.4 0.1 1.2 0.5 1.1 0.0 0.0 0.4 2.5 0.1 0.5
Note: These not seasonally adjusted estimates were prepared in cooperation with the U.S. Department of Labor, Bureau of Labor Statistics, based upon monthly reports submitted by
selected employers in the Augusta - Richmond County Metropolitan Statistical Area, which includes Burke, Columbia, Lincoln, McDuffie and Richmond counties in Georgia and Aiken and Edgefield counties in South Carolina. The estimates include all full- and part-time wage and salary workers who were employed during or received pay for any part of the pay period that includes the
twelfth of the month. Proprietors, domestic workers, self-employed persons, unpaid family workers and personnel of the armed forces are excluded. Estimates based on 2015 benchmark.
BRUNSWICK MSA Nonfarm Employment
(In thousands)
(Not Seasonally Adjusted)
Preliminary
Revised
Revised
OCT 2016 SEP 2016 OCT 2015
Change in Jobs from SEP 2016
Net %
Change in Jobs from OCT 2015
Net %
Total Nonfarm Total Private Goods Producing Service-Providing Private Service-Providing Trade, Transportation, and Utilities
Retail Trade Government
Federal Government State Government Local Government
42.8
43.2
42.6
-0.4 -0.9
32.5
32.8
32.4
-0.3 -0.9
3.7
3.8
3.8
-0.1 -2.6
39.1
39.4
38.8
-0.3 -0.8
28.8
29.0
28.6
-0.2 -0.7
8.7
8.5
8.8
0.2 2.4
5.8
5.6
5.8
0.2 3.6
10.3
10.4
10.2
-0.1 -1.0
1.9
1.9
1.8
0.0 0.0
1.6
1.6
1.7
0.0 0.0
6.8
6.9
6.7
-0.1 -1.5
0.2 0.5 0.1 0.3 -0.1 -2.6 0.3 0.8 0.2 0.7 -0.1 -1.1 0.0 0.0 0.1 1.0 0.1 5.6 -0.1 -5.9 0.1 1.5
Note: These not seasonally adjusted estimates were prepared in cooperation with the U.S. Department of Labor, Bureau of Labor Statistics, based upon monthly reports submitted by
selected employers in the Brunswick Metropolitan Statistical Area, which includes Brantley, Glynn and McIntosh counties. The estimates include all full- and part-time wage and salary workers who were employed during or received pay for any part of the pay period that includes the twelfth of the month. Proprietors, domestic workers, self-employed persons, unpaid family workers and personnel of the armed forces are excluded. Estimates based on 2015 benchmark.
Source: Georgia Department of Labor, Workforce Statistics & Economic Research
6
COLUMBUS MSA Nonfarm Employment
(In thousands)
(Not Seasonally Adjusted)
Preliminary
Revised
Revised
OCT 2016 SEP 2016 OCT 2015
Change in Jobs from SEP 2016
Net %
Change in Jobs from OCT 2015
Net %
Total Nonfarm Total Private Goods Producing Service-Providing Private Service-Providing Mining, Logging and Construction Manufacturing Trade, Transportation, and Utilities
Wholesale Trade Retail Trade Transportation, Warehousing, and Utilities Information Financial Activities Finance and Insurance
Insurance Carriers and Related Activities Professional and Business Services Education and Health Services Leisure and Hospitality Other Services Government
Federal Government State Government Local Government
122.7 97.0 14.1
108.6 82.9 4.2 9.9 19.5 3.2 14.2 2.1 1.4 13.5 11.4 4.6 11.9 16.8 15.2 4.6 25.7 7.0 5.0 13.7
123.1 97.4 14.0
109.1 83.4 4.1 9.9 19.4 3.2 14.1 2.1 1.4 13.4 11.3 4.5 12.7 16.6 15.2 4.7 25.7 7.0 5.1 13.6
122.2 97.3 14.4
107.8 82.9 4.2 10.2 19.0 3.1 13.8 2.1 1.4 13.4 11.7 4.4 13.2 16.5 14.8 4.6 24.9 6.9 4.9 13.1
-0.4 -0.3 -0.4 -0.4 0.1 0.7 -0.5 -0.5 -0.5 -0.6 0.1 2.4 0.0 0.0 0.1 0.5 0.0 0.0 0.1 0.7 0.0 0.0 0.0 0.0 0.1 0.8 0.1 0.9 0.1 2.2 -0.8 -6.3 0.2 1.2 0.0 0.0 -0.1 -2.1 0.0 0.0 0.0 0.0 -0.1 -2.0 0.1 0.7
0.5 0.4 -0.3 -0.3 -0.3 -2.1 0.8 0.7 0.0 0.0 0.0 0.0 -0.3 -2.9 0.5 2.6 0.1 3.2 0.4 2.9 0.0 0.0 0.0 0.0 0.1 0.8 -0.3 -2.6 0.2 4.6 -1.3 -9.9 0.3 1.8 0.4 2.7 0.0 0.0 0.8 3.2 0.1 1.5 0.1 2.0 0.6 4.6
Note: These not seasonally adjusted estimates were prepared in cooperation with the U.S. Department of Labor, Bureau of Labor Statistics, based upon monthly reports submitted by
selected employers in the Columbus Metropolitan Statistical Area, which includes Chattahoochee, Harris, Marion and Muscogee counties in Georgia and Russell County in Alabama. The estimates include all full- and part-time wage and salary workers who were employed during or received pay for any part of the pay period that includes the twelfth of the month. Proprietors, domestic workers, self-employed persons, unpaid family workers and personnel of the armed forces are excluded. Estimates based on 2015 benchmark.
DALTON MSA Nonfarm Employment
(In thousands)
(Not Seasonally Adjusted)
Preliminary
Revised Revised
OCT 2016 SEP 2016 OCT 2015
Change in Jobs from SEP 2016
Net %
Change in Jobs from OCT 2015
Net %
Total Nonfarm Total Private Goods Producing Service-Providing Private Service-Providing Manufacturing
Textile Mills Textile Product Mills Trade, Transportation, and Utilities Retail Trade Transportation, Warehousing, and Utilities Professional and Business Services Government Federal Government State Government Local Government
68.2
68.5
68.6
-0.3 -0.4
61.3
61.7
61.6
-0.4 -0.7
24.7
25.0
25.0
-0.3 -1.2
43.5
43.5
43.6
0.0 0.0
36.6
36.7
36.6
-0.1 -0.3
22.9
23.0
23.4
-0.1 -0.4
2.2
2.2
2.3
0.0 0.0
14.9
15.2
15.7
-0.3 -2.0
17.4
17.5
17.2
-0.1 -0.6
8.7
8.7
8.6
0.0 0.0
4.5
4.6
4.6
-0.1 -2.2
6.3
6.3
6.2
0.0 0.0
6.9
6.8
7.0
0.1 1.5
0.2
0.2
0.2
0.0 0.0
1.1
1.0
1.0
0.1 10.0
5.6
5.6
5.8
0.0 0.0
-0.4 -0.6 -0.3 -0.5 -0.3 -1.2 -0.1 -0.2 0.0 0.0 -0.5 -2.1 -0.1 -4.4 -0.8 -5.1 0.2 1.2 0.1 1.2 -0.1 -2.2 0.1 1.6 -0.1 -1.4 0.0 0.0 0.1 10.0 -0.2 -3.5
Note: These not seasonally adjusted estimates were prepared in cooperation with the U.S. Department of Labor, Bureau of Labor Statistics, based upon monthly reports submitted by
selected employers in the Dalton Metropolitan Statistical Area, which includes Murray and Whitfield counties. The estimates include all full- and part-time wage and salary workers who were employed during or received pay for any part of the pay period that includes the twelfth of the month. Proprietors, domestic workers, self-employed persons, unpaid family workers and personnel of the armed forces are excluded. Estimates based on 2015 benchmark.
Source: Georgia Department of Labor, Workforce Statistics & Economic Research
7
GAINESVILLE MSA Nonfarm Employment
(In thousands)
(Not Seasonally Adjusted)
Preliminary
Revised
Revised
OCT 2016 SEP 2016 OCT 2015
Change in Jobs from SEP 2016
Net %
Change in Jobs from OCT 2015
Net %
Total Nonfarm Total Private Goods Producing Service-Providing Private Service-Providing Trade, Transportation, and Utilities
Retail Trade Government
Federal Government State Government Local Government
87.5
86.8
85.6
77.1
76.6
75.1
23.4
23.2
22.6
64.1
63.6
63.0
53.7
53.4
52.5
16.1
15.9
16.1
9.5
9.4
9.3
10.4
10.2
10.5
0.5
0.4
0.5
2.5
2.5
2.5
7.4
7.3
7.5
0.7 0.8 0.5 0.7 0.2 0.9 0.5 0.8 0.3 0.6 0.2 1.3 0.1 1.1 0.2 2.0 0.1 25.0 0.0 0.0 0.1 1.4
1.9 2.2 2.0 2.7 0.8 3.5 1.1 1.8 1.2 2.3 0.0 0.0 0.2 2.2 -0.1 -1.0 0.0 0.0 0.0 0.0 -0.1 -1.3
Note: These not seasonally adjusted estimates were prepared in cooperation with the U.S. Department of Labor, Bureau of Labor Statistics, based upon monthly reports submitted by
selected employers in the Gainesville Metropolitan Statistical Area, which comprises Hall county. The estimates include all full- and part-time wage and salary workers who were employed during or received pay for any part of the pay period that includes the twelfth of the month. Proprietors, domestic workers, self-employed persons, unpaid family workers and personnel of the armed forces are excluded. Estimates based on 2015 benchmark.
HINESVILLE MSA Nonfarm Employment
(In thousands)
(Not Seasonally Adjusted)
Preliminary Revised Revised OCT 2016 SEP 2016 OCT 2015
Change in Jobs from SEP 2016
Net %
Change in Jobs from OCT 2015
Net %
Total Nonfarm Total Private Goods Producing Service-Providing Private Service-Providing Government
Federal Government State Government Local Government
19.7
19.7
19.9
11.7
11.7
11.9
2.6
2.6
2.6
17.1
17.1
17.3
9.1
9.1
9.3
8.0
8.0
8.0
3.9
3.9
3.9
0.4
0.4
0.4
3.7
3.7
3.7
0.0 0.0 0.0 0.0 0.0 0.0 0.0 0.0 0.0 0.0 0.0 0.0 0.0 0.0 0.0 0.0 0.0 0.0
-0.2 -1.0 -0.2 -1.7 0.0 0.0 -0.2 -1.2 -0.2 -2.2 0.0 0.0 0.0 0.0 0.0 0.0 0.0 0.0
Note: These not seasonally adjusted estimates were prepared in cooperation with the U.S. Department of Labor, Bureau of Labor Statistics, based upon monthly reports submitted by
selected employers in the Hinesville Metropolitan Statistical Area, which includes Liberty and Long counties. The estimates include all full- and part-time wage and salary workers who were employed during or received pay for any part of the pay period that includes the twelfth of the month. Proprietors, domestic workers, self-employed persons, unpaid family workers and personnel of the armed forces are excluded. Estimates based on 2015 benchmark.
Source: Georgia Department of Labor, Workforce Statistics & Economic Research
8
MACON MSA Nonfarm Employment
(In thousands)
(Not Seasonally Adjusted)
Preliminary
Revised
Revised
OCT 2016 SEP 2016 OCT 2015
Change in Jobs from SEP 2016
Net %
Change in Jobs from OCT 2015
Net %
Total Nonfarm Total Private Goods Producing Service-Providing Private Service-Providing Trade, Transportation, and Utilities
Retail Trade Transportation, Warehousing, and Utilities Financial Activities Professional and Business Services Education and Health Services Leisure and Hospitality Government Federal Government State Government Local Government
104.8 90.1 9.8 95.0 80.3 21.4 14.8 3.7 10.1 11.8 21.3 10.5 14.7 1.3 3.7 9.7
104.1 89.5 9.7 94.4 79.8 21.1 14.5 3.7 10.0 11.8 21.1 10.5 14.6 1.2 3.7 9.7
103.2 88.4 9.5 93.7 78.9 21.2 14.4 3.7 9.9 12.6 21.0 10.1 14.8 1.2 3.8 9.8
0.7 0.7 0.6 0.7 0.1 1.0 0.6 0.6 0.5 0.6 0.3 1.4 0.3 2.1 0.0 0.0 0.1 1.0 0.0 0.0 0.2 1.0 0.0 0.0 0.1 0.7 0.1 8.3 0.0 0.0 0.0 0.0
1.6 1.6 1.7 1.9 0.3 3.2 1.3 1.4 1.4 1.8 0.2 0.9 0.4 2.8 0.0 0.0 0.2 2.0 -0.8 -6.4 0.3 1.4 0.4 4.0 -0.1 -0.7 0.1 8.3 -0.1 -2.6 -0.1 -1.0
Note: These not seasonally adjusted estimates were prepared in cooperation with the U.S. Department of Labor, Bureau of Labor Statistics, based upon monthly reports submitted by
selected employers in the Macon Metropolitan Statistical Area, which includes Bibb, Crawford, Jones, Monroe and Twiggs counties. The estimates include all full- and part-time wage and salary workers who were employed during or received pay for any part of the pay period that includes the twelfth of the month. Proprietors, domestic workers, self-employed persons, unpaid family workers and personnel of the armed forces are excluded. Estimates based on 2015 benchmark.
ROME MSA Nonfarm Employment
(In thousands)
(Not Seasonally Adjusted)
Preliminary
Revised
Revised
OCT 2016 SEP 2016 OCT 2015
Change in Jobs from SEP 2016
Net %
Change in Jobs from OCT 2015
Net %
Total Nonfarm Total Private Goods Producing Service-Providing Private Service-Providing Manufacturing Trade, Transportation, and Utilities
Retail Trade Education and Health Services Government
Federal Government State Government Local Government
40.9
40.8
40.5
0.1 0.3
35.2
35.0
34.6
0.2 0.6
6.9
6.9
6.9
0.0 0.0
34.0
33.9
33.6
0.1 0.3
28.3
28.1
27.7
0.2 0.7
6.0
6.0
6.0
0.0 0.0
8.1
7.9
7.9
0.2 2.5
5.1
5.0
4.9
0.1 2.0
10.3
10.2
10.0
0.1 1.0
5.7
5.8
5.9
-0.1 -1.7
0.2
0.2
0.2
0.0 0.0
1.6
1.6
1.7
0.0 0.0
3.9
4.0
4.0
-0.1 -2.5
0.4 1.0 0.6 1.7 0.0 0.0 0.4 1.2 0.6 2.2 0.0 0.0 0.2 2.5 0.2 4.1 0.3 3.0 -0.2 -3.4 0.0 0.0 -0.1 -5.9 -0.1 -2.5
Note: These not seasonally adjusted estimates were prepared in cooperation with the U.S. Department of Labor, Bureau of Labor Statistics, based upon monthly reports submitted by
selected employers in the Rome Metropolitan Statistical Area, which comprises Floyd county. The estimates include all full- and part-time wage and salary workers who were employed during or received pay for any part of the pay period that includes the twelfth of the month. Proprietors, domestic workers, self-employed persons, unpaid family workers and personnel of the armed forces are excluded. Estimates based on 2015 benchmark.
Source: Georgia Department of Labor, Workforce Statistics & Economic Research
9
SAVANNAH MSA Nonfarm Employment
(In thousands)
(Not Seasonally Adjusted)
Preliminary Revised
Revised
OCT 2016 SEP 2016 OCT 2015
Change in Jobs from SEP 2016
Net %
Change in Jobs from OCT 2015
Net %
Total Nonfarm Total Private Goods Producing Service-Providing Private Service-Providing Mining, Logging and Construction Manufacturing Trade, Transportation, and Utilities
Wholesale Trade Retail Trade Transportation, Warehousing, and Utilities Information Financial Activities Professional and Business Services Education and Health Services Leisure and Hospitality Other Services Government Federal Government State Government Local Government
179.0 154.3
24.5 154.5 129.8
6.3 18.2 39.2
6.4 21.1 11.7
1.9 6.8 21.2 26.4 27.0 7.3 24.7 2.9 6.7 15.1
178.7 154.0
24.6 154.1 129.4
6.3 18.3 39.3
6.4 21.2 11.7
1.9 6.7 21.4 26.0 26.8 7.3 24.7 2.9 6.7 15.1
174.4 149.9
24.3 150.1 125.6
6.4 17.9 38.7
6.4 20.6 11.7
2.0 6.7 19.3 25.8 25.8 7.3 24.5 2.9 6.7 14.9
0.3 0.2 0.3 0.2 -0.1 -0.4 0.4 0.3 0.4 0.3 0.0 0.0 -0.1 -0.6 -0.1 -0.3 0.0 0.0 -0.1 -0.5 0.0 0.0 0.0 0.0 0.1 1.5 -0.2 -0.9 0.4 1.5 0.2 0.8 0.0 0.0 0.0 0.0 0.0 0.0 0.0 0.0 0.0 0.0
4.6 2.6 4.4 2.9 0.2 0.8 4.4 2.9 4.2 3.3 -0.1 -1.6 0.3 1.7 0.5 1.3 0.0 0.0 0.5 2.4 0.0 0.0 -0.1 -5.0 0.1 1.5 1.9 9.8 0.6 2.3 1.2 4.7 0.0 0.0 0.2 0.8 0.0 0.0 0.0 0.0 0.2 1.3
Note: These not seasonally adjusted estimates were prepared in cooperation with the U.S. Department of Labor, Bureau of Labor Statistics, based upon monthly reports submitted by
selected employers in the Savannah Metropolitan Statistical Area, which includes Bryan, Chatham and Effingham counties. The estimates include all full- and part-time wage and salary workers who were employed during or received pay for any part of the pay period that includes the twelfth of the month. Proprietors, domestic workers, self-employed persons, unpaid family workers and personnel of the armed forces are excluded. Estimates based on 2015 benchmark.
VALDOSTA MSA Nonfarm Employment
(In thousands)
(Not Seasonally Adjusted)
Preliminary Revised
Revised
OCT 2016 SEP 2016 OCT 2015
Change in Jobs from SEP 2016
Net %
Change in Jobs from OCT 2015
Net %
Total Nonfarm Total Private Goods Producing Service-Providing Private Service-Providing Trade, Transportation, and Utilities
Retail Trade Government
Federal Government State Government Local Government
56.4
55.9
55.8
42.9
42.6
42.3
7.2
7.0
7.2
49.2
48.9
48.6
35.7
35.6
35.1
12.0
11.9
11.7
7.4
7.4
7.1
13.5
13.3
13.5
1.2
1.2
1.2
4.4
4.3
4.3
7.9
7.8
8.0
0.5 0.9 0.3 0.7 0.2 2.9 0.3 0.6 0.1 0.3 0.1 0.8 0.0 0.0 0.2 1.5 0.0 0.0 0.1 2.3 0.1 1.3
0.6 1.1 0.6 1.4 0.0 0.0 0.6 1.2 0.6 1.7 0.3 2.6 0.3 4.2 0.0 0.0 0.0 0.0 0.1 2.3 -0.1 -1.3
Note: These not seasonally adjusted estimates were prepared in cooperation with the U.S. Department of Labor, Bureau of Labor Statistics, based upon monthly reports submitted by
selected employers in the Valdosta Metropolitan Statistical Area, which includes Brooks, Echols, Lanier and Lowndes counties. The estimates include all full- and part-time wage and salary workers who were employed during or received pay for any part of the pay period that includes the twelfth of the month. Proprietors, domestic workers, self-employed persons, unpaid family workers and personnel of the armed forces are excluded. Estimates based on 2015 benchmark.
Source: Georgia Department of Labor, Workforce Statistics & Economic Research
10
WARNER ROBINS MSA Nonfarm Employment
(In thousands)
(Not Seasonally Adjusted)
Preliminary Revised
Revised
OCT 2016 SEP 2016 OCT 2015
Change in Jobs from SEP 2016
Net %
Change in Jobs from OCT 2015
Net %
Total Nonfarm Total Private Goods Producing Service-Providing Private Service-Providing Trade, Transportation, and Utilities
Retail Trade Government
Federal Government State Government Local Government
70.8
70.8
70.7
0.0 0.0
43.8
44.0
43.6
-0.2 -0.5
9.2
9.5
9.1
-0.3 -3.2
61.6
61.3
61.6
0.3 0.5
34.6
34.5
34.5
0.1 0.3
10.4
10.5
10.3
-0.1 -1.0
8.2
8.2
8.0
0.0 0.0
27.0
26.8
27.1
0.2 0.8
14.8
14.8
14.7
0.0 0.0
2.6
2.4
2.6
0.2 8.3
9.6
9.6
9.8
0.0 0.0
0.1 0.1 0.2 0.5 0.1 1.1 0.0 0.0 0.1 0.3 0.1 1.0 0.2 2.5 -0.1 -0.4 0.1 0.7 0.0 0.0 -0.2 -2.0
Note: These not seasonally adjusted estimates were prepared in cooperation with the U.S. Department of Labor, Bureau of Labor Statistics, based upon monthly reports submitted by
selected employers in the Warner Robins Metropolitan Statistical Area, which includes Houston, Peach and Pulaski counties. The estimates include all full- and part-time wage and salary workers who were employed during or received pay for any part of the pay period that includes the twelfth of the month. Proprietors, domestic workers, self-employed persons, unpaid family workers and personnel of the armed forces are excluded. Estimates based on 2015 benchmark.
Total Nonfarm Employment by Metro Statistical Area
(In thousands)
(Seasonally Adjusted)
Preliminary
Revised
Revised
OCT 2016 SEP 2016 OCT 2015
Change in Jobs from SEP 2016
Net %
Change in Jobs from OCT 2015
Net %
Albany MSA
63.3
63.1
61.7
0.2 0.3
1.6 2.6
Athens-Clarke County MSA
94.9
96.4
92.1
-1.5 -1.6
2.8 3.0
Atlanta MSA
2,683.9
2,675.8
2,612.0
8.1 0.3
71.9 2.8
Octobera-Richmond MSA
231.0
230.6
228.0
0.4 0.2
3.0 1.3
Brunswick MSA
42.9
43.6
42.6
-0.7 -1.6
0.3 0.7
Columbus MSA
122.4
123.5
122.1
-1.1 -0.9
0.3 0.2
Dalton MSA
67.8
68.3
68.3
-0.5 -0.7
-0.5 -0.7
Gainesville MSA
87.2
86.7
85.4
0.5 0.6
1.8 2.1
Hinesville MSA
19.7
19.8
19.9
-0.1 -0.5
-0.2 -1.0
Macon MSA
104.6
104.5
102.7
0.1 0.1
1.9 1.9
Rome MSA
40.6
40.9
40.2
-0.3 -0.7
0.4 1.0
Savannah MSA
178.3
178.8
173.7
-0.5 -0.3
4.6 2.6
Valdosta MSA
56.2
56.3
55.6
-0.1 -0.2
0.6 1.1
Warner Robins MSA
NO DATA AVAILABLE
Note: These seasonally adjusted estimates were prepared in cooperation with the U.S. Department of Labor, Bureau of Labor Statistics, based upon monthly reports submitted by selected
employers throughout Georgia. The estimates include all full- and part-time wage and salary workers who were employed during or received pay for any part of the pay period that includes the twelfth of the month. Proprietors, domestic workers, self-employed persons, unpaid family workers and personnel of the armed forces are excluded. Estimates based on 2015 benchmark.
Source: Georgia Department of Labor, Workforce Statistics & Economic Research
11
Georgia Statewide Hours and Earnings
All Employee
Average Weekly Earnings
Preliminary OCT 2016
Revised SEP 2016
Revised OCT 2015
Total Private.....................................................................................................$879.26............................ $848.39.......................$839.03 Goods Producing....................................................................................... $1,019.23..........................$1,018.44.................... $1,002.14 Private Service Providing..............................................................................$852.72.............................$816.63.......................$810.43 Construction............................................................................................ $1,021.63.......................... $1,014.71....................... $999.18 Manufacturing......................................................................................... $1,012.25..........................$1,014.04....................$1,002.46 Trade, Transportation, and Utilities............................................................$769.35.............................$744.06....................... $744.51 Financial Activities..................................................................................$1,228.72.......................... $1,150.71.................... $1,079.24 Professional and Business Services...................................................... $1,085.10.......................... $1,037.31....................$1,000.87 Educational and Health Services.............................................................. $932.45............................ $894.22....................... $907.69 Leisure and Hospitality.............................................................................. $342.03............................ $332.25....................... $336.15 Other Services.......................................................................................... $694.64............................ $682.44....................... $741.22
Average Weekly Hours
Preliminary OCT 2016
Revised SEP 2016
Revised OCT 2015
Total Private...........................................................................................................35.1...................................34.6.............................34.8 Goods Producing................................................................................................40.9................................... 41.0............................. 41.6 Private Service Providing....................................................................................34.0...................................33.4.............................33.6 Construction.....................................................................................................40.8................................... 41.4.............................42.5 Manufacturing..................................................................................................40.8...................................40.4.............................40.9 Trade, Transportation, and Utilities..................................................................34.5...................................34.1.............................34.5 Financial Activities........................................................................................... 37.9................................... 37.3..............................37.1 Professional and Business Services...............................................................35.8...................................34.6.............................34.3 Educational and Health Services.....................................................................35.2...................................34.7............................. 35.1 Leisure and Hospitality.....................................................................................26.7...................................26.1.............................26.7 Other Services.................................................................................................33.3...................................33.0.............................34.3
Average Hourly Earnings
Preliminary OCT 2016
Revised SEP 2016
Revised OCT 2015
Total Private.......................................................................................................$25.05...............................$24.52......................... $24.11 Goods Producing............................................................................................$24.92.............................. $24.84.........................$24.09 Private Service Providing................................................................................$25.08...............................$24.45......................... $24.12 Construction.................................................................................................$25.04............................... $24.51......................... $23.51 Manufacturing..............................................................................................$24.81............................... $25.10......................... $24.51 Trade, Transportation, and Utilities............................................................. $22.30...............................$21.82.........................$21.58 Financial Activities.......................................................................................$32.42.............................. $30.85.........................$29.09 Professional and Business Services...........................................................$30.31.............................. $29.98......................... $29.18 Educational and Health Services.................................................................$26.49...............................$25.77.........................$25.86 Leisure and Hospitality................................................................................. $12.81...............................$12.73......................... $12.59 Other Services.............................................................................................$20.86.............................. $20.68......................... $21.61
Read more about the hours and earnings series at http://www.bls.gov/sae/home.htm
Note: These not seasonally adjusted estimates were prepared in cooperation with the U.S. Department of Labor, Bureau of Labor Statistics, based upon monthly reports submitted by
selected employers throughout Georgia. The estimates include all full- and part-time wage and salary workers who were employed during or received pay for any part of the pay period that includes the twelfth of the month. Proprietors, domestic workers, self-employed persons, unpaid family workers and personnel of the armed forces are excluded. Estimates based on 2015 benchmark.
Source: Georgia Department of Labor, Workforce Statistics & Economic Research
12
Georgia MSA Hours and Earnings
All Employee Total Private
Average Weekly Earnings
Preliminary OCT 2016
Revised SEP 2016
Revised OCT 2015
Albany MSA ................................................................................................... $668.78.............................$627.58.......................$603.75 Athens-Clarke County MSA ...........................................................................$720.51............................ $688.27....................... $734.74 Atlanta MSA ..................................................................................................$977.46.............................$937.37.......................$925.94 Augusta-Richmond County MSA .................................................................. $825.65............................ $805.97.......................$878.40 Brunswick MSA .............................................................................................$610.58............................ $583.38.......................$561.02 Columbus MSA .............................................................................................. $741.49.............................$705.76.......................$672.86 Dalton MSA .................................................................................................. $660.44............................. $656.11....................... $714.31 Gainesville MSA ............................................................................................ $959.54............................ $970.00....................... $914.47 Hinesville MSA .............................................................................................. $908.96............................ $778.32....................... $763.71 Macon MSA ................................................................................................... $773.98............................ $738.48.......................$705.96 Rome MSA .....................................................................................................$851.22............................ $873.63.......................$870.25 Savannah MSA ............................................................................................. $788.96............................ $793.48....................... $712.62 Valdosta MSA ................................................................................................ $672.69............................ $639.28.......................$613.90 Warner Robins MSA .......................................................................................$789.08............................ $783.62.......................$685.52
Average Weekly Hours
Preliminary OCT 2016
Revised SEP 2016
Revised OCT 2015
Albany MSA ..........................................................................................................34.0.................................. 32.2.............................34.5 Athens-Clarke County MSA .................................................................................33.7...................................32.9.............................34.0 Atlanta MSA ........................................................................................................35.3.................................. 34.5............................. 35.1 Augusta-Richmond County MSA .........................................................................35.0.................................. 34.8.............................36.0 Brunswick MSA ...................................................................................................30.9...................................30.4............................. 31.5 Columbus MSA ....................................................................................................35.7.................................. 35.2.............................34.4 Dalton MSA .........................................................................................................38.0................................... 37.3.............................38.8 Gainesville MSA ...................................................................................................40.3...................................40.4.............................39.4 Hinesville MSA .....................................................................................................38.0.................................. 36.8............................. 37.4 Macon MSA ..........................................................................................................35.7.................................. 35.3.............................36.0 Rome MSA ........................................................................................................... 37.4...................................38.1.............................36.2 Savannah MSA ....................................................................................................31.8.................................. 33.2.............................33.3 Valdosta MSA .......................................................................................................36.9.................................. 34.8............................. 35.1 Warner Robins MSA ............................................................................................. 37.9.................................. 38.3.............................36.6
Average Hourly Earnings
Preliminary OCT 2016
Revised SEP 2016
Revised OCT 2015
Albany MSA ......................................................................................................$19.67...............................$19.49......................... $17.50 Athens-Clarke County MSA .............................................................................$21.38.............................. $20.92......................... $21.61 Atlanta MSA ....................................................................................................$27.69............................... $27.17.........................$26.38 Augusta-Richmond County MSA .....................................................................$23.59............................... $23.16.........................$24.40 Brunswick MSA ............................................................................................... $19.76............................... $19.19......................... $17.81 Columbus MSA ................................................................................................$20.77.............................. $20.05.........................$19.56 Dalton MSA ..................................................................................................... $17.38............................... $17.59......................... $18.41 Gainesville MSA ...............................................................................................$23.81...............................$24.01.........................$23.21 Hinesville MSA .................................................................................................$23.92............................... $21.15.........................$20.42 Macon MSA ......................................................................................................$21.68.............................. $20.92......................... $19.61 Rome MSA .......................................................................................................$22.76.............................. $22.93.........................$24.04 Savannah MSA ................................................................................................$24.81.............................. $23.90......................... $21.40 Valdosta MSA ...................................................................................................$18.23...............................$18.37......................... $17.49 Warner Robins MSA .........................................................................................$20.82.............................. $20.46......................... $18.73
Read more about the hours and earnings series at http://www.bls.gov/sae/home.htm
Note: These not seasonally adjusted estimates were prepared in cooperation with the U.S. Department of Labor, Bureau of Labor Statistics, based upon monthly reports submitted by
selected employers throughout Georgia. The estimates include all full- and part-time wage and salary workers who were employed during or received pay for any part of the pay period that includes the twelfth of the month. Proprietors, domestic workers, self-employed persons, unpaid family workers and personnel of the armed forces are excluded. Estimates based on 2015 benchmark.
Source: Georgia Department of Labor, Workforce Statistics & Economic Research
13
Dimensions - Measuring Georgia's Labor Force
Unemployment rates -- Georgia and U.S.
7%
Georgia
U.S.
6%
5%
4% Oct Nov Dec Jan Feb Mar Apr May Jun Jul Aug Sep Oct
WA 5.4 OR 5.3 NV 5.5 CA 5.5
AK 6.8
ID 3.8
UT 3.2 AZ 5.2
StaStteatuenUenmepmlopylomymenetntrRataetess
October 2016
National Unemployment Rate: 4.9% Rates are seasonally adjusted
MT 4.3
WY 5.1
CO 3.5 NM 6.7
ND 3.0 SD 2.8
NE 3.3
KS 4.4
MN 4.0
WI 4.1
IA 4.1
IL 5.6 MO 5.1
OK 5.2 TX 4.7
AR 4.0
MS 5.9 LA 6.3
MI 4.7
OH
IN
4.9
4.4
KY 5.1 TN 4.8
PA 5.8
WV
6.0
VA
4.2
NC 4.9
SC 4.7
AL
GA
5.7
5.2
FL 4.8
NH
2.8 ME
VT
4.0
3.3
MA 3.3
NY 5.2
RI 5.5
NJ
CT 5.1
5.2
DE
4.3
DC 6.1
MD 4.2
Unemployment rate
6.0% to 6.9% 5.0% to 5.9% 4.0% to 4.9% 3.0% to 3.9% Less than 3.0%
HI 3.2 Source: Georgia Department of Labor, Workforce Statistics & Economic Research
14
Georgia Labor Force Estimates
Place of Residence - Persons 16 Years and Older
Georgia
(Seasonally adjusted)
Georgia
(Not Seasonally adjusted)
Albany MSA Athens-Clarke County MSA
Atlanta MSA
Augusta-Richmond County MSA
Brunswick MSA
Columbus MSA
Dalton MSA
Gainesville MSA
Employment Status
Civilian labor force Employed Unemployed Rate
Civilian labor force Employed Unemployed Rate
Civilian labor force Employed Unemployed Rate
Civilian labor force Employed Unemployed Rate
Civilian labor force Employed Unemployed Rate
Civilian labor force Employed Unemployed Rate
Civilian labor force Employed Unemployed Rate
Civilian labor force Employed Unemployed Rate
Civilian labor force Employed Unemployed Rate
Civilian labor force Employed Unemployed Rate
Preliminary OCT 2016
4,945,950 4,691,161
254,789 5.2
4,948,431 4,691,706
256,725 5.2
67,806 63,739
4,067 6.0
98,659 93,924
4,735 4.8
2,955,368 2,811,642
143,726 4.9
260,078 245,387
14,691 5.6
51,402 48,458
2,944 5.7
126,009 118,254
7,755 6.2
61,100 57,454 3,646
6.0
96,876 92,568
4,308 4.4
Revised SEP 2016
4,918,155 4,669,688
248,467 5.1
4,929,794 4,669,188
260,606 5.3
67,132 62,967
4,165 6.2
99,572 94,033
5,539 5.6
2,943,724 2,796,147
147,577 5.0
259,611 244,766
14,845 5.7
51,606 48,795
2,811 5.4
126,434 118,571
7,863 6.2
61,514 57,853 3,661
6.0
96,184 91,993
4,191 4.4
Revised OCT 2015
4,770,319 4,507,616
262,703 5.5
4,772,874 4,507,787
265,087 5.6
65,534 61,225 4,309
6.6
94,376 89,502
4,874 5.2
2,842,017 2,691,854
150,163 5.3
255,042 239,389
15,653 6.1
50,154 47,242 2,912
5.8
123,771 115,726
8,045 6.5
60,429 56,681
3,748 6.2
92,804 88,607
4,197 4.5
Change From
SEP 2016
OCT 2015
27,795 21,473 6,322
175,631 183,545
-7,914
18,637 22,518 -3,881
175,557 183,919
-8,362
674
2,272
772
2,514
-98
-242
-913 -109 -804
4,283 4,422
-139
11,644 15,495 -3,851
113,351 119,788
-6,437
467
5,036
621
5,998
-154
-962
-204 -337 133
1,248 1,216
32
-425 -317 -108
2,238 2,528 -290
-414 -399
-15
671 773 -102
692
4,072
575
3,961
117
111
Note: MSA data are not seasonally adjusted. Employment includes nonagricultural wage and salary employment, self-employment, unpaid family and private
household workers and agricultural workers. Persons in labor disputes are counted as employed. The use of unrounded data does not imply that the numbers are exact.
Albany MSA: Baker, Dougherty, Lee, Terrell, and Worth counties. Athens - Clarke County MSA: Clarke, Madison, Oconee, and Oglethorpe counties. Atlanta MSA: Barrow, Bartow, Butts, Carroll, Cherokee, Clayton, Cobb, Coweta, Dawson, DeKalb, Douglas, Fayette, Forsyth, Fulton, Gwinnett, Haralson, Heard, Henry, Jasper, Lamar, Meriwether, Morgan, Newton, Paulding, Pickens, Pike, Rockdale, Spalding, and Walton counties. Augusta - Richmond County MSA: Burke, Columbia, Lincoln, McDuffie, and Richmond counties in Georgia and Aiken and Edgefield counties in South Carolina. Brunswick MSA: Brantley, Glynn, and McIntosh counties. Columbus MSA: Chattahoochee, Harris, Marion, and Muscogee counties in Georgia and Russell County in Alabama. Dalton MSA: Murray and Whitfield counties. Gainesville MSA: Hall County. Hinesville MSA: Liberty and Long counties. Macon MSA: Bibb, Crawford, Jones, Monroe, and Twiggs counties. Rome MSA: Floyd County. Savannah MSA: Bryan, Chatham, and Effingham counties. Valdosta MSA: Brooks, Echols, Lanier, and Lowndes counties. Warner Robins MSA: Houston, Peach and Pulaski counties.
Source: Georgia Department of Labor, Workforce Statistics & Economic Research
15
Hinesville MSA Macon MSA Rome MSA
Savannah MSA Valdosta MSA Warner Robins MSA
Georgia Labor Force Estimates
Place of Residence - Persons 16 Years and Older
Employment Status
Civilian labor force Employed Unemployed Rate
Civilian labor force Employed Unemployed Rate
Preliminary OCT 2016
32,357 30,513 1,844
5.7
106,430 100,136
6,294 5.9
Revised SEP 2016
32,458 30,600
1,858 5.7
105,712 99,718 5,994 5.7
Revised OCT 2015
31,828 29,951
1,877 5.9
103,166 96,843
6,323 6.1
Civilian labor force Employed Unemployed Rate
Civilian labor force Employed Unemployed Rate
43,637 41,188 2,449
5.6
183,229 174,214
9,015 4.9
43,813 41,122 2,691
6.1
183,986 174,776
9,210 5.0
42,598 39,944
2,654 6.2
176,049 166,853
9,196 5.2
Civilian labor force Employed Unemployed Rate
Civilian labor force Employed Unemployed Rate
64,193 60,937
3,256 5.1
82,636 77,093 5,543
6.7
63,851 60,486
3,365 5.3
81,614 77,053
4,561 5.6
62,637 59,145 3,492
5.6
80,489 75,352
5,137 6.4
Change From
SEP 2016
OCT 2015
-101
529
-87
562
-14
-33
718
3,264
418
3,293
300
-29
-176 66
-242
1,039 1,244 -205
-757 -562 -195
7,180 7,361
-181
342
1,556
451
1,792
-109
-236
1,022 40
982
2,147 1,741
406
Area United States
(Seasonally adjusted)
United States
(Not Seasonally adjusted)
United States Labor Force Estimates
Place of Residence - Persons 16 Years and Older
Employment Status
Civilian labor force Employed Unemployed Rate
Civilian labor force Employed Unemployed Rate
OCT 2016
159,712,000 151,925,000
7,787,000 4.9
159,783,000 152,335,000
7,447,000 4.7
SEP 2016
159,907,000 151,968,000
7,939,000 5.0
159,636,000 151,977,000
7,658,000 4.8
OCT 2015
157,096,000 149,197,000
7,899,000 5.0
157,313,000 149,716,000
7,597,000 4.8
Change From
SEP 2016
OCT 2015
-195,000 -43,000 -152,000
2,616,000 2,728,000
-112,000
147,000 358,000 -211,000
2,470,000 2,619,000
-150,000
Note: MSA data are not seasonally adjusted. Employment includes nonagricultural wage and salary employment, self-employment, unpaid family and private
household workers and agricultural workers. Persons in labor disputes are counted as employed. The use of unrounded data does not imply that the numbers are exact.
Albany MSA: Baker, Dougherty, Lee, Terrell, and Worth counties. Athens - Clarke County MSA: Clarke, Madison, Oconee, and Oglethorpe counties. Atlanta MSA: Barrow, Bartow, Butts, Carroll, Cherokee, Clayton, Cobb, Coweta, Dawson, DeKalb, Douglas, Fayette, Forsyth, Fulton, Gwinnett, Haralson, Heard, Henry, Jasper, Lamar, Meriwether, Morgan, Newton, Paulding, Pickens, Pike, Rockdale, Spalding, and Walton counties. Octobera - Richmond County MSA: Burke, Columbia, Lincoln, McDuffie, and Richmond counties in Georgia and Aiken and Edgefield counties in South Carolina. Brunswick MSA: Brantley, Glynn, and McIntosh counties. Columbus MSA: Chattahoochee, Harris, Marion, and Muscogee counties in Georgia and Russell County in Alabama. Dalton MSA: Murray and Whitfield counties. Gainesville MSA: Hall County. Hinesville MSA: Liberty and Long counties. Macon MSA: Bibb, Crawford, Jones, Monroe, and Twiggs counties. Rome MSA: Floyd County. Savannah MSA: Bryan, Chatham, and Effingham counties. Valdosta MSA: Brooks, Echols, Lanier, and Lowndes counties. Warner Robins MSA: Houston, Peach and Pulaski counties.
Source: Georgia Department of Labor, Workforce Statistics & Economic Research
16
Georgia Labor Force Estimates by County (not seasonally adjusted)
Place of Residence - Persons 16 Years and Older
Georgia
Preliminary October 2016
Labor Force
Employment
Unemployment Number Rate
4,948,431 4,691,706 256,725 5.2
Appling Atkinson Bacon Baker Baldwin
9,107 8,556
551 6.1
4,085 3,896
189 4.6
5,035 4,790
245 4.9
1,218 1,125
93 7.6
17,400 16,192 1,208 6.9
Banks Barrow Bartow Ben Hill Berrien
8,966 8,544
422 4.7
37,129 35,446 1,683 4.5
48,931 46,547 2,384 4.9
5,486 5,043 443 8.1
7,207 6,802
405 5.6
Bibb Bleckley Brantley Brooks Bryan
70,369 66,085 4,284 6.1
4,521 4,131 390 8.6
7,075 6,628
447 6.3
6,929 6,591
338 4.9
16,499 15,710
789 4.8
Bulloch Burke Butts Calhoun Camden
36,677 34,753 1,924 5.2
9,434 8,636
798 8.5
10,533 9,983
550 5.2
2,237 2,107
130 5.8
20,616 19,467 1,149 5.6
Candler Carroll Catoosa Charlton Chatham
5,013 4,792
221 4.4
54,314 51,268 3,046 5.6
32,321 30,815 1,506 4.7
4,821 4,556
265 5.5
138,772 131,863 6,909 5.0
Chattahoochee 2,232 2,052
180 8.1
Chattooga
10,442 9,847
595 5.7
Cherokee 124,758 119,641 5,117 4.1
Clarke
59,680 56,611 3,069 5.1
Clay
909
827
82 9.0
Clayton Clinch Cobb Coffee Colquitt
129,577 121,543 8,034 6.2
2,812 2,657
155 5.5
415,342 397,130 18,212 4.4
18,022 17,028 994 5.5
21,065 20,019 1,046 5.0
Columbia Cook Coweta Crawford Crisp
67,958 64,779 3,179 4.7
7,578
7,195
383 5.1
70,343 67,065 3,278 4.7
5,891 5,450
441 7.5
9,048 8,447
601 6.6
Revised September 2016
Labor Force
Employment
Unemployment Number Rate
4,929,794 4,669,188 260,606 5.3
8,954 4,005 4,935 1,174 17,421
8,345 3,816 4,684 1,072 16,149
609 6.8 189 4.7 251 5.1 102 8.7 1,272 7.3
8,814 8,390
424 4.8
37,051 35,234 1,817 4.9
48,664 46,238 2,426 5.0
5,488 5,031
457 8.3
7,047 6,637
410 5.8
69,976 65,881 4,095 5.9
4,398 4,064 334 7.6
7,102 6,627
475 6.7
6,788 6,441
347 5.1
16,558 15,748
810 4.9
36,637 34,585 2,052 5.6
9,297 8,570
727 7.8
10,470
9,915
555 5.3
2,159 2,031
128 5.9
20,604 19,435 1,169 5.7
4,913 4,676
237 4.8
54,069 50,927 3,142 5.8
32,260 30,757 1,503 4.7
4,825 4,547
278 5.8
139,364 132,308 7,056 5.1
2,238 2,050
188 8.4
10,356
9,774
582 5.6
124,197 119,004 5,193 4.2
60,337 56,722 3,615 6.0
890
804
86 9.7
129,102 120,859 8,243 6.4
2,790 2,632
158 5.7
413,488 395,047 18,441 4.5
17,992 16,970 1,022 5.7
20,454 19,350 1,104 5.4
67,946 64,691 3,255 4.8
7,532
7,148
384 5.1
70,024 66,670 3,354 4.8
5,741 5,404
337 5.9
8,897 8,345
552 6.2
Revised October 2015
Labor Force
Employment
Unemployment Number Rate
4,772,874 4,507,787 265,087 5.6
8,638 3,885 5,088 1,138 17,293
8,064 3,683 4,823 1,059 16,033
574 6.6 202 5.2 265 5.2
79 6.9 1,260 7.3
8,139 35,651 47,054
5,198 6,998
7,719 33,921 44,535
4,752 6,549
420 5.2 1,730 4.9 2,519 5.4
446 8.6 449 6.4
68,270 4,377 6,903 6,703
15,829
63,952 3,995 6,438 6,339
15,044
4,318 6.3 382 8.7 465 6.7 364 5.4 785 5.0
35,144 9,080 10,189 2,089 22,393
33,194 8,362 9,549 1,970 21,216
1,950 5.5 718 7.9 640 6.3 119 5.7
1,177 5.3
4,967 52,220 31,375
4,782 133,454
4,705 49,064 29,850
4,493 126,302
262 5.3 3,156 6.0 1,525 4.9
289 6.0 7,152 5.4
2,187 10,393 119,796 57,098
851
2,000 9,782 114,572 53,954
765
187 8.6 611 5.9 5,224 4.4 3,144 5.5 86 10.1
125,098 116,334 8,764 7.0 2,837 2,631 206 7.3
399,178 380,288 18,890 4.7 17,497 16,480 1,017 5.8 19,566 18,422 1,144 5.8
66,199 62,963 3,236 4.9
7,163 6,726
437 6.1
67,482 64,189 3,293 4.9
5,638 5,258 380 6.7
9,216 8,623
593 6.4
Source: Georgia Department of Labor, Workforce Statistics & Economic Research
17
Georgia Labor Force Estimates by County (not seasonally adjusted)
Place of Residence - Persons 16 Years and Older
Dade Dawson Decatur DeKalb Dodge
Preliminary October 2016
Labor Force
Employment
Unemployment Number Rate
8,205 7,795
410 5.0
11,408 10,889
519 4.5
11,452 10,726
726 6.3
386,845 367,058 19,787 5.1
7,126 6,431 695 9.8
Dooly Dougherty Douglas Early Echols
5,144 4,800 344 6.7
39,156 36,596 2,560 6.5
70,907 67,242 3,665 5.2
4,493 4,212
281 6.3
1,915 1,835
80 4.2
Effingham Elbert Emanuel Evans Fannin
27,958 26,641 1,317 4.7
7,713 7,244 469 6.1
8,291
7,674
617 7.4
4,905 4,681
224 4.6
11,053 10,507 546 4.9
Fayette Floyd Forsyth Franklin Fulton
56,774 54,208 2,566 4.5
43,637 41,188 2,449 5.6
106,419 102,142 4,277 4.0
9,655 9,143
512 5.3
535,740 508,352 27,388 5.1
Gilmer Glascock Glynn Gordon Grady
12,084 11,437
647 5.4
1,284 1,209
75 5.8
38,188 36,069 2,119 5.5
25,263 23,928 1,335 5.3
10,743 10,171
572 5.3
Greene
6,489 6,108
381 5.9
Gwinnett 468,954 447,743 21,211 4.5
Habersham 19,667 18,590 1,077 5.5
Hall
96,876 92,568 4,308 4.4
Hancock
2,421 2,218
203 8.4
Haralson Harris Hart Heard Henry
12,364 11,724 640 5.2
15,709 14,975 734 4.7
10,834 10,245 589 5.4
5,204 4,926
278 5.3
108,941 103,234 5,707 5.2
Houston Irwin Jackson Jasper Jeff Davis
66,646 62,538 4,108 6.2
3,181 2,953
228 7.2
33,889 32,555 1,334 3.9
6,699 6,392
307 4.6
6,321 5,925 396 6.3
Revised September 2016
Labor Force
Employment
Unemployment Number Rate
8,180 7,767
413 5.0
11,318 10,809 509 4.5
11,264 10,538
726 6.4
385,433 365,201 20,232 5.2
6,913 6,427 486 7.0
4,948 4,668 280 5.7
38,826 36,221 2,605 6.7
70,673 66,896 3,777 5.3
4,415
4,124
291 6.6
1,860 1,774
86 4.6
28,064 26,720 1,344 4.8
7,781 7,242 539 6.9
8,193
7,551
642 7.8
4,860 4,625 235 4.8
10,979 10,410 569 5.2
56,576 53,918 2,658 4.7
43,813 41,122 2,691 6.1
105,939 101,547 4,392 4.1
9,588 9,078
510 5.3
533,592 505,574 28,018 5.3
12,041 11,369
672 5.6
1,270 1,194
76 6.0
38,392 36,409 1,983 5.2
25,408 24,004 1,404 5.5
10,639 10,060
579 5.4
6,525 6,126 399 6.1 467,297 445,379 21,918 4.7
19,517 18,508 1,009 5.2 96,184 91,993 4,191 4.4 2,377 2,171 206 8.7
12,338 11,658 680 5.5
15,780 15,010
770 4.9
10,795 10,209 586 5.4
5,183 4,886
297 5.7
108,575 102,675 5,900 5.4
66,148 62,591 3,557 5.4
3,129 2,891 238 7.6
33,531 32,084 1,447 4.3
6,641 6,333 308 4.6
6,284 5,887
397 6.3
Revised October 2015
Labor Force
Employment
Unemployment Number Rate
7,942 7,548 394 5.0
10,949 10,421
528 4.8
11,321 10,610
711 6.3
372,296 351,484 20,812 5.6
6,926 6,356
570 8.2
4,937 4,588
349 7.1
37,928 35,189 2,739 7.2
68,388 64,388 4,000 5.8
4,333 4,060
273 6.3
1,835 1,752
83 4.5
26,766 7,503 8,398 4,706
10,144
25,507 7,001 7,663 4,462 9,603
1,259 4.7 502 6.7 735 8.8 244 5.2 541 5.3
54,552 51,897 2,655 4.9
42,598 39,944 2,654 6.2
102,161 97,775 4,386 4.3
9,089 8,563
526 5.8
515,091 486,690 28,401 5.5
11,713 1,227 37,301 26,139 10,298
11,077 1,150
35,212 24,675
9,724
636 5.4 77 6.3
2,089 5.6 1,464 5.6
574 5.6
6,345 5,928
417 6.6
450,670 428,785 21,885 4.9
18,769 17,768 1,001 5.3
92,804 88,607 4,197 4.5
2,376 2,168
208 8.8
11,929 15,370 10,179 4,999 104,773
11,229 14,628 9,580
4,711 98,801
700 5.9 742 4.8 599 5.9 288 5.8 5,972 5.7
65,045 3,008
30,522 6,446 6,309
61,178 2,786 29,160 6,111 5,938
3,867 5.9 222 7.4
1,362 4.5 335 5.2 371 5.9
Source: Georgia Department of Labor, Workforce Statistics & Economic Research
18
Georgia Labor Force Estimates by County (not seasonally adjusted)
Place of Residence - Persons 16 Years and Older
Jefferson Jenkins Johnson Jones Lamar
Preliminary October 2016
Labor Force
6,550 3,169 3,963 14,062 8,048
Employment
6,089 2,946 3,722 13,406 7,552
Unemployment Number Rate
461 7.0 223 7.0 241 6.1 656 4.7 496 6.2
Lanier Laurens Lee Liberty Lincoln
3,856 3,646
210 5.4
19,041 17,737 1,304 6.8
14,503 13,842
661 4.6
25,586 24,113 1,473 5.8
3,410 3,220
190 5.6
Long Lowndes Lumpkin McDuffie McIntosh
6,771 6,400
371 5.5
51,493 48,865 2,628 5.1
15,696 14,945
751 4.8
8,827 8,214
613 6.9
6,139 5,761
378 6.2
Macon Madison Marion Meriwether Miller
4,885 13,442
3,474 9,068 2,824
4,338 12,817 3,239 8,503 2,686
547 11.2 625 4.6 235 6.8 565 6.2 138 4.9
Mitchell
8,735 8,208
527 6.0
Monroe
13,063 12,409 654 5.0
Montgomery 3,753 3,494
259 6.9
Morgan
8,870 8,441
429 4.8
Murray
15,982 14,899 1,083 6.8
Muscogee Newton Oconee Oglethorpe Paulding
79,816 74,616 5,200 6.5
50,131 47,316 2,815 5.6
18,430 17,712
718 3.9
7,107 6,784
323 4.5
78,953 75,489 3,464 4.4
Peach Pickens Pierce Pike Polk
11,833 10,694 1,139 9.6
14,538 13,853 685 4.7
8,486 8,045
441 5.2
8,610 8,191
419 4.9
18,057 17,031 1,026 5.7
Pulaski Putnam Quitman Rabun Randolph
4,157 7,895
828 6,607 2,493
3,861 7,368
762 6,229 2,296
296 7.1 527 6.7
66 8.0 378 5.7 197 7.9
Revised September 2016
Labor Force
6,516 3,168 3,941 13,972 8,030
Employment
6,041 2,931 3,692 13,328 7,510
Unemployment Number Rate
475 7.3 237 7.5 249 6.3 644 4.6 520 6.5
3,835 3,620
215 5.6
18,940 17,677 1,263 6.7
14,363 13,693
670 4.7
25,703 24,225 1,478 5.8
3,380
3,182
198 5.9
6,755 6,375 380 5.6
51,368 48,651 2,717 5.3
15,699 14,912
787 5.0
8,837 8,199 638 7.2
6,112 5,759 353 5.8
4,586 13,560
3,487 9,039 2,731
4,239 12,829
3,242 8,425 2,588
347 7.6 731 5.4 245 7.0 614 6.8 143 5.2
8,551 7,983 568 6.6
13,004 12,334
670 5.2
3,772 3,491
281 7.4
8,788 8,339 449 5.1
16,059 14,976 1,083 6.7
80,356 75,013 5,343 6.6
49,956 47,019 2,937 5.9
18,549 17,729
820 4.4
7,126 6,753
373 5.2
78,607 75,048 3,559 4.5
11,397 10,630
767 6.7
14,465 13,777 688 4.8
8,394 7,931 463 5.5
8,566 8,130 436 5.1
18,088 17,033 1,055 5.8
4,069 7,824
833 6,694 2,423
3,832 7,282
767 6,324 2,221
237 5.8 542 6.9
66 7.9 370 5.5 202 8.3
Revised October 2015
Labor Force
6,212 3,125 3,800 13,659 7,772
Employment
5,696 2,882 3,551 12,952 7,233
Unemployment Number Rate
516 8.3 243 7.8 249 6.6 707 5.2 539 6.9
3,776 18,281 14,019 25,204
3,311
3,540 16,958 13,306 23,696
3,109
236 6.3 1,323 7.2
713 5.1 1,508 6.0
202 6.1
6,624 6,255
369 5.6
50,323 47,514 2,809 5.6
15,198 14,427
771 5.1
8,616 7,981
635 7.4
5,950 5,592
358 6.0
4,705 12,869
3,443 8,754 2,709
4,227 12,217
3,162 8,129 2,582
478 10.2 652 5.1 281 8.2 625 7.1 127 4.7
8,749 12,665
3,737 8,474 15,764
8,205 11,989 3,435 8,059 14,682
544 6.2 676 5.3 302 8.1 415 4.9 1,082 6.9
78,483 73,015 5,468 7.0
48,300 45,278 3,022 6.3
17,618 16,884
734 4.2
6,791 6,447 344 5.1
75,907 72,247 3,660 4.8
11,420 13,958
8,054 8,283 17,812
10,416 13,262
7,602 7,837 16,732
1,004 8.8 696 5.0 452 5.6 446 5.4
1,080 6.1
4,024 7,616
820 6,518 2,419
3,758 7,061
766 6,128 2,212
266 6.6 555 7.3
54 6.6 390 6.0 207 8.6
Source: Georgia Department of Labor, Workforce Statistics & Economic Research
19
Georgia Labor Force Estimates by County (not seasonally adjusted) Place of Residence - Persons 16 Years and Older
Richmond Rockdale Schley Screven Seminole
Preliminary October 2016
Labor Force
Employment
Unemployment Number Rate
85,947 80,026 5,921 6.9
43,973 41,575 2,398 5.5
2,100 1,969
131 6.2
5,317 4,949 368 6.9
3,177 2,932
245 7.7
Spalding Stephens Stewart Sumter Talbot
28,340 26,544 1,796 6.3
10,965 10,332
633 5.8
2,168 2,041
127 5.9
12,950 11,962 988 7.6
2,806 2,620
186 6.6
Taliaferro Tattnall Taylor Telfair Terrell
591 9,380 3,429 4,933 3,722
549 8,902 3,029 4,282 3,489
42 7.1 478 5.1 400 11.7 651 13.2 233 6.3
Thomas Tift Toombs Towns Treutlen
17,679 16,627 1,052 6.0
18,574 17,606 968 5.2
11,946 11,128
818 6.8
4,459 4,198
261 5.9
2,822 2,589
233 8.3
Troup Turner Twiggs Union Upson
37,788 35,999 1,789 4.7
3,277 3,061
216 6.6
3,045 2,786
259 8.5
10,385 9,921 464 4.5
11,308 10,564
744 6.6
Walker
30,479 28,917 1,562 5.1
Walton
43,655 41,645 2,010 4.6
Ware
15,405 14,597 808 5.2
Warren
2,739 2,543
196 7.2
Washington
7,224 6,774
450 6.2
Wayne Webster Wheeler White Whitfield
11,413 988
1,774 14,840 45,118
10,674 908
1,572 14,187 42,555
739 6.5 80 8.1
202 11.4 653 4.4 2,563 5.7
Wilcox Wilkes Wilkinson Worth
2,838 3,824 3,787 9,207
2,634 3,556 3,547 8,687
204 7.2 268 7.0 240 6.3 520 5.6
Revised September 2016
Labor Force
Employment
Unemployment Number Rate
85,689 79,959 5,730 6.7
43,832 41,353 2,479 5.7
2,087 1,951
136 6.5
5,268 4,904 364 6.9
3,133 2,886
247 7.9
28,220 26,379 1,841 6.5
10,923 10,271
652 6.0
2,160 2,032
128 5.9
12,799 11,823
976 7.6
2,802
2,617
185 6.6
584 9,280 3,255 4,652 3,670
550 8,790 3,006 4,268 3,441
34 5.8 490 5.3 249 7.6 384 8.3 229 6.2
17,602 16,519 1,083 6.2
18,422 17,418 1,004 5.5
11,976 11,120 856 7.1
4,490 4,212
278 6.2
2,795 2,586
209 7.5
37,676 35,828 1,848 4.9
3,207 2,990
217 6.8
3,019
2,771
248 8.2
10,298 9,836
462 4.5
11,311 10,545
766 6.8
30,407 28,820 1,587 5.2
43,591 41,397 2,194 5.0
15,212 14,405
807 5.3
2,730 2,536
194 7.1
7,191 6,724
467 6.5
11,464 10,710
754 6.6
967
885
82 8.5
1,699 1,546
153 9.0
14,782 14,135
647 4.4
45,455 42,877 2,578 5.7
2,754 3,796 3,723 9,099
2,572 3,535 3,491 8,540
182 6.6 261 6.9 232 6.2 559 6.1
Revised October 2015
Labor Force
Employment
Unemployment Number Rate
83,622 42,343
2,062 5,058 3,080
77,797 39,806
1,934 4,678 2,855
5,825 7.0 2,537 6.0
128 6.2 380 7.5 225 7.3
27,374 10,634
2,105 12,737 2,678
25,403 10,009
1,968 11,727 2,491
1,971 7.2 625 5.9 137 6.5
1,010 7.9 187 7.0
573 9,289 2,777 4,670 3,602
532 8,764 2,477 4,269 3,349
41 7.2 525 5.7 300 10.8 401 8.6 253 7.0
16,628 17,857 11,888 3,995 2,669
15,516 16,842 10,942
3,715 2,481
1,112 6.7 1,015 5.7
946 8.0 280 7.0 188 7.0
35,979 3,239 2,934 9,840 11,026
34,065 3,036 2,692 9,361
10,262
1,914 5.3 203 6.3 242 8.2 479 4.9 764 6.9
29,628 41,930 14,691
2,618 7,193
27,988 39,856 13,794
2,428 6,724
1,640 5.5 2,074 4.9
897 6.1 190 7.3 469 6.5
11,275 989
1,660 13,856 44,665
10,490 892
1,496 13,221 41,999
785 7.0 97 9.8
164 9.9 635 4.6 2,666 6.0
2,716 3,684 3,567 8,847
2,517 3,434 3,317 8,322
199 7.3 250 6.8 250 7.0 525 5.9
Source: Georgia Department of Labor, Workforce Statistics & Economic Research
20
City Labor Force Estimates
Place of Residence - Persons 16 Years and Older
Preliminary October 2016
Labor Force
Employment
Unemployment Number Rate
*Albany 31,739 29,626 2,113 6.7
*Alpharetta 35,303 33,850 1,453 4.1
*Athens 59,680 56,611 3,069 5.1
*Atlanta 243,081 229,634 13,447 5.5
Fulton Part 224,533 211,896 12,637 5.6
Dekalb Part
18,548 17,738
810 4.4
*Augusta 85,947 80,026 5,921 6.9
*Brookhaven
32,414 31,606
808 2.5
Carrollton 11,805 10,978
827 7.0
*Columbus 79,816 74,616 5,200 6.5
Dalton 14,389 13,459
930 6.5
Douglasville
16,766 15,815
951 5.7
Duluth 15,968 15,202
766 4.8
*Dunwoody
27,016 25,928 1,088 4.0
East Point 17,435 16,138 1,297 7.4
Gainesville 17,413 16,556
857 4.9
Hinesville 14,864 14,077
787 5.3
*Johns Creek
44,761 42,980 1,781 4.0
Kennesaw 19,311 18,422
889 4.6
LaGrange 15,664 14,863
801 5.1
Lawrenceville
14,924 14,059
865 5.8
*Macon-Bibb
70,369 66,085 4,284 6.1
*Marietta 35,648 33,962 1,686 4.7
Milton 19,035 18,284
751 3.9
Newnan 17,142 16,159
983 5.7
Peachtree City 18,480 17,670
810 4.4
P'tree Corners 23,188 22,519
669 2.9
Rome 15,344 14,380
964 6.3
*Roswell 53,936 51,904 2,032 3.8
*Sandy Springs 62,305 59,681 2,624 4.2
*Savannah 67,602 63,969 3,633 5.4
*Smyrna 34,621 33,021 1,600 4.6
Statesboro 14,318 13,267 1,051 7.3
Stockbridge 13,854 12,909
945 6.8
*Valdosta 25,909 24,493 1,416 5.5
*Warner Robins 31,965 29,759 2,206 6.9
Woodstock 15,213 14,536
677 4.5
Revised September 2016
Labor Force
Employment
Unemployment Number Rate
31,471 29,323 2,148 6.8
35,144 33,665 1,479 4.2
60,337 56,722 3,615 6.0
241,797 228,386 13,411 5.5
223,330 210,738 12,592 5.6
18,467 17,648
819 4.4
85,689 79,959 5,730 6.7
32,241 31,447
794 2.5
11,776 10,905
871 7.4
80,356 75,013 5,343 6.6
14,430 13,561
869 6.0
16,702 15,734
968 5.8
15,914 15,122
792 5.0
26,856 25,797 1,059 3.9
17,325 16,050 1,275 7.4
17,247 16,453
794 4.6
14,926 14,143
783 5.2
44,581 42,745 1,836 4.1
19,233 18,326
907 4.7
15,652 14,793
859 5.5
14,882 13,985
897 6.0
69,976 65,881 4,095 5.9
35,458 33,783 1,675 4.7
18,966 18,184
782 4.1
16,944 16,064
880 5.2
18,374 17,575
799 4.3
23,077 22,401
676 2.9
15,408 14,357 1,051 6.8
53,809 51,621 2,188 4.1
62,012 59,355 2,657 4.3
68,043 64,185 3,858 5.7
34,424 32,848 1,576 4.6
14,262 13,203 1,059 7.4
13,777 12,839
938 6.8
25,819 24,385 1,434 5.6
31,606 29,782 1,824 5.8
15,148 14,458
690 4.6
Revised October 2015
Labor Force
Employment
Unemployment Number Rate
30,752 28,487 2,265 7.4
33,772 32,408 1,364 4.0
57,098 53,954 3,144 5.5
233,599 219,853 13,746 5.9
215,795 202,867 12,928 6.0
17,804 16,986
818 4.6
83,622 77,797 5,825 7.0
31,056 30,265
791 2.5
11,362 10,506
856 7.5
78,483 73,015 5,468 7.0
14,197 13,283
914 6.4
16,178 15,144 1,034 6.4
15,323 14,559
764 5.0
25,841 24,828 1,013 3.9
16,776 15,451 1,325 7.9
16,702 15,848
854 5.1
14,652 13,834
818 5.6
42,987 41,149 1,838 4.3
18,586 17,641
945 5.1
14,923 14,065
858 5.7
14,369 13,464
905 6.3
68,270 63,952 4,318 6.3
34,239 32,521 1,718 5.0
18,281 17,505
776 4.2
16,381 15,466
915 5.6
17,701 16,917
784 4.4
22,224 21,566
658 3.0
14,980 13,946 1,034 6.9
51,919 49,693 2,226 4.3
59,643 57,138 2,505 4.2
65,144 61,271 3,873 5.9
33,118 31,620 1,498 4.5
13,697 12,672 1,025 7.5
13,280 12,354
926 7.0
25,328 23,816 1,512 6.0
31,019 29,110 1,909 6.2
14,653 13,920
733 5.0
Note: City estimates were prepared in cooperation with the U.S. Department of Labor, Bureau of Labor Statistics. All cities listed have total population of 25,000 or more and an asterisks (*) designates cities with population of 50,000 or more.
Source: Georgia Department of Labor, Workforce Statistics & Economic Research
21
UNEMGPeoLrOgiaYUMneEmNploTymReAntTREateBs bYy CCoOunUtyNTIES OCTOBER 2016
October 2016
Dade 5.0
Catoosa 4.7
Walker
Whitfield
Murray 6.8
Fannin 4.9
Union 4.5
Towns 5.9
Rabun 5.7
5.1
5.7
Chattooga 5.7
Gordon 5.3
Floyd 5.6
Bartow 4.9
Gilmer 5.4
Pickens 4.7
Cherokee 4.1
Lumpkin 4.8
Dawson 4.5
Forsyth 4.0
White Habersham
4.4
5.5
Stephens
5.8
Hall 4.4
Banks Franklin
4.7
5.3
Jackson 3.9
Madison 4.6
Hart 5.4
Elbert 6.1
7.0% or greater 30 counties (19%)
6.0% to 6.9% 38 counties (24%)
5.0% to 5.9% 51 counties (32%)
Polk 5.7
Paulding
Cobb 4.4
Gwinnett 4.5
Barrow 4.5
Clarke 5.1
Oglethorpe 4.5
Less than 5.0% 40 counties (25%)
Haralson 5.2
Carroll 5.6
Heard 5.3
4.4 Douglas 5.2
Coweta 4.7
Fulton 5.1
DeKalb 5.1 Rockdale
Walton 4.6
Oconee 3.9
Wilkes 7.0
Lincoln 5.6
Percentages of number of counties may not total 100 due to rounding
Clayton
6.2
Fayette 4.5
Henry 5.2
Spalding 6.3
5.5 Newton 5.6
Morgan 4.8
Butts 5.2
Jasper 4.6
Putnam 6.7
Greene 5.9
Taliaferro
7.1
McDuffie
Warren 6.9
Columbia 4.7
7.2
Richmond
Hancock
6.9
8.4
Glascock
5.8
Troup 4.7
Meriwether 6.2
Pike 4.9
Lamar 6.2
Monroe 5.0
Jones 4.7
Baldwin 6.9
Washington
Jefferson 7.0
Burke 8.5
Upson
6.2
Harris 4.7
Talbot 6.6
Muscogee 6.5
Marion Chattahoochee 6.8
6.6
Taylor 11.7
Crawford 7.5
Bibb 6.1
Twiggs 8.5
Wilkinson 6.3
Peach 9.6
Macon 11.2
Houston 6.2
Bleckley 8.6
Laurens 6.8
Johnson 6.1
Emanuel 7.4
Jenkins 7.0
Screven 6.9
Treutlen 8.3
Candler 4.4
Bulloch 5.2
Effingham 4.7
8.1
Stewart 5.9
Schley 6.2
Webster 8.1
Sumter 7.6
Quitman
8.0 Randolph 7.9
Terrell 6.3
Lee 4.6
Clay 9.0
Calhoun 5.8
Dougherty 6.5
Early 6.3
Miller 4.9
Baker 7.6
Mitchell 6.0
Dooly 6.7
Pulaski 7.1
Dodge 9.8
Crisp 6.6
Wilcox 7.2
Turner 6.6
Ben Hill 8.1
Montgomery
Wheeler 11.4
6.9
Toombs 6.8
Evans 4.6
Tattnall
Telfair
5.1
13.2
Jeff Davis 6.3
Appling 6.1
Long 5.5
Bryan 4.8
Liberty 5.8
Worth 5.6
Colquitt 5.0
Irwin
7.2 Tift 5.2
Coffee 5.5
Berrien
Atkinson
5.6
4.6
Cook
5.1 Lanier
Bacon 4.9
Wayne 6.5
Pierce 5.2
Ware 5.2
Brantley 6.3
McIntosh 6.2
Glynn 5.5
Chatham 5.0
Seminole 7.7
Decatur 6.3
Grady 5.3
Thomas 6.0
Brooks 4.9
5.4
Lowndes 5.1
Clinch 5.5
Charlton 5.5
Camden 5.6
Echols
4.2
Georgia's Unemployment Rate: 5.2%
Georgia's U(nNoet SmeasponlaollyyAmdjusetend)t Rate: 5.2% (not seasonally adjusted) Source: Georgia Department of Labor, Workforce Statistics and Economic Research
22
Georgia Unemployment Insurance Claims by County
County
October 2016 Average Average Initial Weekly Duration
Claims Benefit Weeks
County
October 2016 Average Average Initial Weekly Duration
Claims Benefit Weeks
County
October 2016 Average Average Initial Weekly Duration
Claims Benefit Weeks
Georgia
29,355........ $277.........8.5
Appling
123........ $230.........8.9
Atkinson
50........ $204.........5.7
Bacon
22........ $189.........6.4
Baker
3........ $217.......10.4
Baldwin
116........ $184.........9.1
Banks
40........ $268.........6.8
Barrow
138........ $258.........8.2
Bartow
227........ $248.........6.7
Ben Hill
62........ $213.........7.6
Berrien
71........ $223.........6.2
Bibb
704........ $213.........9.8
Bleckley
124........ $211.........8.6
Brantley
52........ $252.........9.5
Brooks
31........ $195.........9.8
Bryan
102........ $268.......10.4
Bulloch
129........ $250.........8.2
Burke
244........ $229.........7.5
Butts
55........ $219.........9.5
Calhoun
17........ $176.........7.3
Camden
88........ $259.......10.2
Candler
23........ $211.........7.9
Carroll
206........ $245.........8.1
Catoosa
81........ $254.........6.6
Charlton
12........ $201.......12.1
Chatham
1,007........ $231.......10.5
Chattahoochee
6........ $251.......10.9
Chattooga
33........ $263.........9.7
Cherokee
286........ $275.........9.5
Clarke
248........ $230.........7.0
Clay
6........ $198.........7.3
Clayton
914........ $237.......10.6
Clinch
9........ $252.......14.4
Cobb
1,342........ $268.......10.5
Coffee
91........ $227.........6.5
Colquitt
126........ $211.........9.4
Columbia
186........ $242.........9.0
Cook
50........ $238.........7.1
Coweta
224........ $256.........8.3
Crawford
108........ $237.........8.6
Crisp
130........ $201.........8.9
Dade
40........ $253.........5.2
Dawson
29........ $259.........9.7
Decatur
73........ $200.......12.0
DeKalb
1,718........ $247.......10.7
Dodge
241........ $187.......10.1
Dooly
89........ $250.........6.7
Dougherty
261........ $202.........9.8
Douglas
300........ $251.......10.3
Early
13........ $172.......13.2
Echols
1........ $302.........8.6
Effingham
117........ $250.........9.2
Elbert Emanuel Evans Fannin Fayette Floyd Forsyth Franklin Fulton Gilmer Glascock Glynn Gordon Grady Greene Gwinnett Habersham Hall Hancock Haralson Harris Hart Heard Henry Houston Irwin Jackson Jasper Jeff Davis Jefferson Jenkins Johnson Jones Lamar Lanier Laurens Lee Liberty Lincoln Long Lowndes Lumpkin Macon Madison Marion McDuffie McIntosh Meriwether Miller Mitchell Monroe Montgomery Morgan Murray
121........ $143.........6.0 158........ $200.........8.0
25........ $175.........8.0 35........ $234.........8.2 117........ $255.......10.0 313........ $239.........6.7 200........ $278.........9.8 86........ $237.........5.4 2,303........ $245.......10.8 64........ $252.........7.2
8........ $175.........8.5 896........ $189.........8.1 184........ $262.........5.8
46........ $195.........6.9 28........ $228.........9.5 1,427........ $263.......10.3 165........ $260.........5.9 806........ $254.........7.9 23........ $170.........8.4 38........ $246.........6.9 52........ $265.........7.4 87........ $230.........5.3 20........ $235.........6.4 426........ $249.......10.0 867........ $236.........9.0 19........ $204.........8.4 94........ $246.........7.5 37........ $209.........8.8 73........ $212.........7.5 94........ $190.........7.7 27........ $227.........7.1 58........ $182.........8.3 42........ $226.........9.3 54........ $234.........8.1 19........ $243.........7.8 252........ $193.........9.4 52........ $256.........8.2 140........$209....... 11.1 18........ $243.........6.6 25........ $240.......10.0 239........ $214.........9.1 49........ $247.........9.0 263........ $229.........9.1 50........ $239.........6.0 29........ $186.........9.7 119........ $226.........6.9 86........ $201.........9.7 55........ $237.........7.0 12........$225....... 11.9 55........ $192.........9.9 51........ $218.........9.5 66........ $209.........8.0 37........ $242.........7.9 309........ $257.........5.0
Muscogee Newton Oconee Oglethorpe Paulding Peach Pickens Pierce Pike Polk Pulaski Putnam Quitman Rabun Randolph Richmond Rockdale Schley Screven Seminole Spalding Stephens Stewart Sumter Talbot Taliaferro Tattnall Taylor Telfair Terrell Thomas Tift Toombs Towns Treutlen Troup Turner Twiggs Union Upson Walker Walton Ware Warren Washington Wayne Webster Wheeler White Whitfield Wilcox Wilkes Wilkinson Worth
567........ $214.........8.9 262........ $232.........9.4
30........ $239.........6.9 28........ $213.........7.1 235........ $256.........9.7 595........ $239.........7.6 41........ $260.........8.3 32........ $233.........8.4 32........ $244.........8.0 146........ $250.........6.6 102........ $218.........8.3 27........ $214.........9.1
1........ $277.......12.5 29........ $236.........5.4 17........ $204.........7.9 927........ $222.........9.0 207........ $253.........9.9 12........ $235.........9.4 54........ $231.........6.0 16........$195....... 11.1 226........ $213.........8.5 75........ $227.........5.6 23........ $241.......10.8 221........ $200.......10.2 27........ $214.........8.9
5........ $166.........5.3 62........ $220.........8.8 183........ $233.........8.1 338........ $194.........9.7 32........ $212.........6.9 92........ $215.........9.0 71........ $235.........8.9 228........ $196.........7.9 16........ $200.........9.3 54........ $176.........9.4 181........ $236.........6.8 22........ $204.........8.2 29........ $214.........9.6 21........ $253.........9.8 157........ $227.........8.2 109........ $240.........4.9 167........ $242.........8.4 97........ $211.........8.6 40........ $230.........6.3 31........ $201.........9.4 73........ $220.......10.9
3........ $194.......10.0 73........ $211.........7.1 53........ $222.........8.0 656........ $265.........4.9 41........ $195.........9.7 53........ $182.........6.6 28........ $213.........8.5 54........ $249.........8.4
Note: Initial claims include intrastate initial and additional claims, as well as agent state initial and additional claims for regular UI only. Average duration of benefits is represented in weeks.
Data does not include state or federal extended benefits.
Source: Georgia Department of Labor, Workforce Statistics and Economic Research
23
Mark Butler, Commissioner 148 Andrew Young International Boulevard, N.E. Atlanta, Georgia 30303-1751
Return Service Requested