- Collection:
- Georgia Government Publications
- Title:
- Dimensions: measuring Georgia's workforce, Vol. 41, no. 8 (Aug. 2015)
- Creator:
- Georgia. Department of Labor
- Contributor to Resource:
- Georgia. Workforce Information and Analysis
- Publisher:
- Atlanta, Ga. : Georgia Dept. of Labor, 2015-08
- Date of Original:
- 2015-08
- Subject:
- Labor market--Georgia--Statistics
Wages--Georgia--Statistics
Hours of labor--Georgia--Statistics - Location:
- United States, Georgia, 32.75042, -83.50018
- Medium:
- state government records
- Type:
- Text
- Format:
- application/pdf
- External Identifiers:
- Call Number GA L200.E46 P1 T7 41/8
- Metadata URL:
- https://dlg.galileo.usg.edu/id:dlg_ggpd_i-ga-bl200-pe46-bp1-bt7-b41-s8-belec-p-btext
- Digital Object URL:
- https://dlg.galileo.usg.edu/do:dlg_ggpd_i-ga-bl200-pe46-bp1-bt7-b41-s8-belec-p-btext
- Language:
- eng
- Holding Institution:
- University of Georgia. Map and Government Information Library
- Rights:
-

August 2015 Data
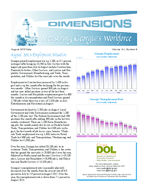
August 2015 Employment Situation
Georgia payroll employment was up 2,200, or 0.1 percent, in August after being up 10,500 in July. Sectors with the largest job gain from July to August include Construction, Financial Activities, Other Services, and Leisure and Hospitality. Government, Manufacturing, and Trade, Transportation, and Utilities lost the most jobs over the month.
Employment in Construction increased by 2,400 in August and is up this month after declining for the previous two months. Other Services gained 800 jobs in August and has now added positions in two of the last three months. Leisure and Hospitality employment grew by 600 this month as Accommodation and Food Services gained 2,700 jobs while there was a loss of 2,100 jobs in Arts, Entertainment, and Recreation in August.
Government declined by 2,500 jobs in August. Local Government and State Government combined for 2,200 of the 2,500 jobs lost. The Federal Government shed 300 positions this month after adding 300 jobs in the last two months combined. There are 1,100 fewer Manufacturing jobs this month mainly due to cuts in Durable Goods. Trade, Transportation, and Utilities lost 400 jobs in August, the first month of job losses since January. Wholesale Trade employment was up 1,400, however Retail Trade lost 800 jobs and Transportation, Warehousing, and Utilities lost 1,000 jobs.
Over the year, Georgia has added 83,200 jobs to its economy. Trade, Transportation, and Utilities is the sector that has gained the most jobs (+29,800 jobs) over the year, followed by Professional and Business Services (+19,100 jobs), Leisure and Hospitality (+18,900 jobs), and Education and Health Services (+14,100 jobs).
Georgia's unemployment rate (seasonally adjusted) decreased over the month, from the revised rate of 6.0 percent in July to 5.9 percent in August 2015. Over the year, the unemployment rate is down from 7.1 percent in August 2014.
In millions
Georgia EmplVooylummeeXnLI,tNumber 8
Georgi(Ian MEimlliopnsl)oyment
(Seasonally Adjusted)
4.206
4.216
4.227
4.220
4.246
4.240
4.249
4.252
4.248
4.258
4.260
4.185 4.177
Aug Sep Oct Nov Dec Jan Feb Mar Apr May Jun Jul Aug
2014
2015
GeorgGieaorgUianUenmemppllooymyemnteRnatte Rate (S(eSaesaosnonaallllyy AAddjujsutesdt)ed)
7.1%
6.9%
6.8%
6.7%
6.6%
6.4%
6.3%
6.3%
6.2%
6.3%
6.1%
6.0%
5.9%
Aug Sep Oct Nov Dec Jan Feb Mar Apr May Jun Jul Aug
2014
2015
Workforce Statistics & Economic Research Mark Butler, Commissioner
For more information, contact Corey Smith or Evan Cross at (404) 232-3875
corey.smith@gdol.ga.gov evan.cross@gdol.ga.gov
Equal Opportunity Employer/ProgramAuxiliary Aids and Services Available upon Request to Individuals with Disabilities
GEORGIA Nonfarm Employment
(In thousands)
(Seasonally Adjusted)
Preliminary AUG 2015
Revised Revised JUL 2015 AUG 2014
Change in Jobs from JUL 2015
Net %
Change in Jobs from AUG 2014
Net %
Total Nonfarm
4,260.3
4,258.1
4,177.1
2.2 0.1
83.2 2.0
Total Private
3,577.9
3,573.2
3,487.6
4.7 0.1
90.3 2.6
Goods Producing
540.2
539.1
536.7
1.1 0.2
3.5 0.7
Service-Providing
3,720.1
3,719.0
3,640.4
1.1 0.0
79.7 2.2
Private Service-Providing
3,037.7
3,034.1
2,950.9
3.6 0.1
86.8 2.9
Mining and Logging
8.6
8.8
9.0
-0.2 -2.3
-0.4 -4.4
Construction
159.9
157.5
157.7
2.4 1.5
2.2 1.4
Manufacturing
371.7
372.8
370.0
-1.1 -0.3
1.7 0.5
Durable Goods
178.3
179.5
178.6
-1.2 -0.7
-0.3 -0.2
Non-Durable Goods
193.4
193.3
191.4
0.1 0.1
2.0 1.0
Trade, Transportation, and Utilities
903.1
903.5
873.3
-0.4 0.0
29.8 3.4
Wholesale Trade
215.9
214.5
211.1
1.4 0.7
4.8 2.3
Retail Trade
486.6
487.4
468.3
-0.8 -0.2
18.3 3.9
Transportation, Warehousing, and Utilities
200.6
201.6
193.9
-1.0 -0.5
6.7 3.5
Information
107.6
107.1
106.4
0.5 0.5
1.2 1.1
Financial Activities
238.1
236.8
233.7
1.3 0.5
4.4 1.9
Finance and Insurance
179.0
177.7
174.1
1.3 0.7
4.9 2.8
Real Estate and Rental and Leasing
59.1
59.1
59.6
0.0 0.0
-0.5 -0.8
Professional and Business Services
644.4
644.4
625.3
0.0 0.0
19.1 3.1
Professional, Scientific, and Technical Services
263.5
265.7
255.5
-2.2 -0.8
8.0 3.1
Management of Companies and Enterprises
64.6
63.9
63.6
0.7 1.1
1.0 1.6
Admin and Support, Waste Mngmnt and Remediation
316.3
314.8
306.2
1.5 0.5
10.1 3.3
Education and Health Services
540.5
539.7
526.4
0.8 0.1
14.1 2.7
Educational Services
69.6
69.1
70.0
0.5 0.7
-0.4 -0.6
Health Care and Social Assistance
470.9
470.6
456.4
0.3 0.1
14.5 3.2
Leisure and Hospitality
450.1
449.5
431.2
0.6 0.1
18.9 4.4
Arts, Entertainment, and Recreation
46.0
48.1
44.3
-2.1 -4.4
1.7 3.8
Accommodation and Food Services
404.1
401.4
386.9
2.7 0.7
17.2 4.4
Other Services
153.9
153.1
154.6
0.8 0.5
-0.7 -0.5
Government
682.4
684.9
689.5
-2.5 -0.4
-7.1 -1.0
Federal Government
98.1
98.4
98.8
-0.3 -0.3
-0.7 -0.7
State Government
173.5
174.3
179.3
-0.8 -0.5
-5.8 -3.2
Local Government
410.8
412.2
411.4
-1.4 -0.3
-0.6 -0.1
Note: These seasonally adjusted estimates were prepared in cooperation with the U.S. Department of Labor, Bureau of Labor Statistics, based upon monthly reports submitted by selected
employers throughout Georgia. The estimates include all full- and part-time wage and salary workers who were employed during or received pay for any part of the pay period that includes the twelfth of the month. Proprietors, domestic workers, self-employed persons, unpaid family workers and personnel of the armed forces are excluded. Estimates based on 2014 benchmark.
Source: Georgia Department of Labor, Workforce Statistics & Economic Research
2
GEORGIA Nonfarm Employment
(In thousands)
(Not Seasonally Adjusted)
Preliminary
Revised
Revised
AUG 2015 JUL 2015 AUG 2014
Change in Jobs from JUL 2015
Net %
Change in Jobs from AUG 2014
Net %
Total Nonfarm
4,264.9
4,243.8
4,184.8
21.1 0.5
80.1 1.9
Total Private
3,590.9
3,583.5
3,505.1
7.4 0.2
85.8 2.5
Goods Producing
545.1
541.6
539.9
3.5 0.7
5.2 1.0
Service-Providing
3,719.8
3,702.2
3,644.9
17.6 0.5
74.9 2.1
Private Service-Providing
3,045.8
3,041.9
2,965.2
3.9 0.1
80.6 2.7
Mining and Logging
8.7
8.7
9.0
0.0 0.0
-0.3 -3.3
Construction
163.8
159.4
160.3
4.4 2.8
3.5 2.2
Construction of Buildings
33.1
32.5
35.4
0.6 1.9
-2.3 -6.5
Heavy and Civil Engineering Construction
24.2
23.6
22.4
0.6 2.5
1.8 8.0
Specialty Trade Contractors
106.5
103.3
102.5
3.2 3.1
4.0 3.9
Manufacturing
372.6
373.5
370.6
-0.9 -0.2
2.0 0.5
Durable Goods
179.4
180.6
178.8
-1.2 -0.7
0.6 0.3
Computer, Electrical Equip and Appliance Mfg
23.1
23.0
23.1
0.1 0.4
0.0 0.0
Transportation Equipment Manufacturing
49.3
49.5
47.5
-0.2 -0.4
1.8 3.8
Non-Durable Goods
193.2
192.9
191.8
0.3 0.2
1.4 0.7
Food Manufacturing
64.5
64.4
63.3
0.1 0.2
1.2 1.9
Textile Mills
20.0
20.0
19.6
0.0 0.0
0.4 2.0
Textile Product Mills
29.0
28.7
27.4
0.3 1.1
1.6 5.8
Trade, Transportation, and Utilities
899.0
900.3
872.3
-1.3 -0.1
26.7 3.1
Wholesale Trade
215.2
215.8
211.5
-0.6 -0.3
3.7 1.8
Merchant Wholesalers, Durable Goods
107.2
106.6
102.8
0.6 0.6
4.4 4.3
Merchant Wholesalers, Nondurable Goods
60.2
61.7
61.7
-1.5 -2.4
-1.5 -2.4
Wholesale Electronic Markets and Agents and Brokers 47.8
47.5
47.0
0.3 0.6
0.8 1.7
Retail Trade
483.2
483.3
466.7
-0.1 0.0
16.5 3.5
Food and Beverage Stores
94.1
94.9
89.8
-0.8 -0.8
4.3 4.8
General Merchandise Stores
105.4
104.7
104.1
0.7 0.7
1.3 1.3
Miscellaneous Store Retailers
20.0
19.8
21.0
0.2 1.0
-1.0 -4.8
Transportation, Warehousing, and Utilities
200.6
201.2
194.1
-0.6 -0.3
6.5 3.4
Utilities
19.6
19.7
19.6
-0.1 -0.5
0.0 0.0
Transportation and Warehousing
181.0
181.5
174.5
-0.5 -0.3
6.5 3.7
Air Transportation
39.8
39.9
39.5
-0.1 -0.3
0.3 0.8
Truck Transportation
49.8
49.9
48.7
-0.1 -0.2
1.1 2.3
Couriers and Messengers
20.9
20.6
19.7
0.3 1.5
1.2 6.1
Warehousing and Storage
29.9
29.5
28.9
0.4 1.4
1.0 3.5
Information
107.4
107.4
107.0
0.0 0.0
0.4 0.4
Telecommunications
49.6
50.5
49.6
-0.9 -1.8
0.0 0.0
Wired Telecommunications Carriers
29.4
29.6
29.7
-0.2 -0.7
-0.3 -1.0
Wireless Telecommunications Carriers
12.6
12.7
12.3
-0.1 -0.8
0.3 2.4
Internet Service Providers, Search Portals, and DP
9.1
8.7
8.0
0.4 4.6
1.1 13.8
Financial Activities
238.3
237.2
234.5
1.1 0.5
3.8 1.6
Finance and Insurance
178.9
178.2
174.5
0.7 0.4
4.4 2.5
Insurance Carriers and Related Activities
88.2
87.8
82.8
0.4 0.5
5.4 6.5
Real Estate and Rental and Leasing
59.4
59.0
60.0
0.4 0.7
-0.6 -1.0
Professional and Business Services
647.3
648.7
628.7
-1.4 -0.2
18.6 3.0
Professional, Scientific, and Technical Services
262.2
264.5
254.7
-2.3 -0.9
7.5 2.9
Accounting, Tax Prep, and Bookkeeping Services
44.1
44.0
43.3
0.1 0.2
0.8 1.9
Architectural, Engineering, and Related Services
42.5
42.7
39.9
-0.2 -0.5
2.6 6.5
Computer Systems Design and Related Services
63.1
63.5
61.6
-0.4 -0.6
1.5 2.4
Management and Technical Consulting Services
38.3
38.2
36.3
0.1 0.3
2.0 5.5
Management of Companies and Enterprises
64.8
64.1
63.6
0.7 1.1
1.2 1.9
Admin and Support, Waste Mngmnt and Remediation
320.3
320.1
310.4
0.2 0.1
9.9 3.2
Employment Services
157.5
157.7
150.0
-0.2 -0.1
7.5 5.0
Education and Health Services
540.9
532.2
526.9
8.7 1.6
14.0 2.7
Educational Services
68.1
66.1
68.4
2.0 3.0
-0.3 -0.4
Colleges, Universities, and Professional Schools
29.0
28.7
30.8
0.3 1.1
-1.8 -5.8
Health Care and Social Assistance
472.8
466.1
458.5
6.7 1.4
14.3 3.1
Ambulatory Health Care Services
184.8
184.0
178.6
0.8 0.4
6.2 3.5
Hospitals
163.4
162.7
157.4
0.7 0.4
6.0 3.8
Nursing and Residential Care Facilities
59.2
58.3
59.5
0.9 1.5
-0.3 -0.5
Social Assistance
65.4
61.1
63.0
4.3 7.0
2.4 3.8
Leisure and Hospitality
457.7
461.1
440.3
-3.4 -0.7
17.4 4.0
Arts, Entertainment, and Recreation
48.5
53.4
47.3
-4.9 -9.2
1.2 2.5
Amusement, Gambling, and Recreation Industries
34.9
38.6
35.4
-3.7 -9.6
-0.5 -1.4
Accommodation and Food Services
409.2
407.7
393.0
1.5 0.4
16.2 4.1
Accommodation
42.5
43.2
43.2
-0.7 -1.6
-0.7 -1.6
Food Services and Drinking Places
366.7
364.5
349.8
2.2 0.6
16.9 4.8
Other Services
155.2
155.0
155.5
0.2 0.1
-0.3 -0.2
Repair and Maintenance
36.5
35.6
36.4
0.9 2.5
0.1 0.3
Personal and Laundry Services
35.2
35.1
35.7
0.1 0.3
-0.5 -1.4
Religious, Grantmaking, Civic, Professional, and Similar
83.5
84.3
83.4
-0.8 -1.0
0.1 0.1
Government
674.0
660.3
679.7
13.7 2.1
-5.7 -0.8
Federal Government
97.7
97.9
98.6
-0.2 -0.2
-0.9 -0.9
Department of Defense
40.6
40.6
40.3
0.0 0.0
0.3 0.7
State Government
170.1
167.5
174.6
2.6 1.6
-4.5 -2.6
State Government Educational Services
99.0
95.8
102.3
3.2 3.3
-3.3 -3.2
Local Government
406.2
394.9
406.5
11.3 2.9
-0.3 -0.1
Local Government Educational Services
238.8
224.3
235.3
14.5 6.5
3.5 1.5
Note: These not seasonally adjusted estimates were prepared in cooperation with the U.S. Department of Labor, Bureau of Labor Statistics, based upon monthly reports submitted by selected
employers throughout Georgia. The estimates include all full- and part-time wage and salary workers who were employed during or received pay for any part of the pay period that includes the
twelfth of the month. Proprietors, domestic workers, self-employed persons, unpaid family workers and personnel of the armed forces are excluded. Estimates based on 2014 benchmark.
Source: Georgia Department of Labor, Workforce Statistics & Economic Research
3
ALBANY MSA Nonfarm Employment
(In thousands)
(Not Seasonally Adjusted)
Preliminary
Revised
Revised
AUG 2015 JUL 2015 AUG 2014
Change in Jobs from JUL 2015
Net %
Change in Jobs from AUG 2014
Net %
Total Nonfarm Total Private Goods Producing Service-Providing Private Service-Providing Manufacturing Trade, Transportation, and Utilities
Retail Trade Government
Federal Government State Government Local Government
59.7
59.7
60.4
0.0 0.0
47.1
47.1
47.2
0.0 0.0
6.5
6.5
6.9
0.0 0.0
53.2
53.2
53.5
0.0 0.0
40.6
40.6
40.3
0.0 0.0
4.3
4.3
4.3
0.0 0.0
11.6
11.9
11.9
-0.3 -2.5
6.8
6.9
7.0
-0.1 -1.5
12.6
12.6
13.2
0.0 0.0
2.8
2.8
2.9
0.0 0.0
2.5
2.5
2.9
0.0 0.0
7.3
7.3
7.4
0.0 0.0
-0.7 -1.2 -0.1 -0.2 -0.4 -5.8 -0.3 -0.6 0.3 0.7 0.0 0.0 -0.3 -2.5 -0.2 -2.9 -0.6 -4.6 -0.1 -3.5 -0.4 -13.8 -0.1 -1.4
Note: These not seasonally adjusted estimates were prepared in cooperation with the U.S. Department of Labor, Bureau of Labor Statistics, based upon monthly reports submitted by
selected employers in the Albany Metropolitan Statistical Area, which includes Baker, Dougherty, Lee, Terrell and Worth counties. The estimates include all full- and part-time wage and salary workers who were employed during or received pay for any part of the pay period that includes the twelfth of the month. Proprietors, domestic workers, self-employed persons, unpaid familyworkers and personnel of the armed forces are excluded. Estimates based on 2014 benchmark.
ATHENS-CLARKE MSA Nonfarm Employment
(In thousands)
(Not Seasonally Adjusted)
Preliminary
Revised
Revised
AUG 2015 JUL 2015 AUG 2014
Change in Jobs from JUL 2015
Net %
Change in Jobs from AUG 2014
Net %
Total Nonfarm Total Private Goods Producing Service-Providing Private Service-Providing Trade, Transportation, and Utilities
Retail Trade Professional and Business Services Leisure and Hospitality Government
Federal Government State Government Local Government
92.8
91.6
91.0
1.2 1.3
62.1
61.5
61.0
0.6 1.0
9.2
9.2
9.3
0.0 0.0
83.6
82.4
81.7
1.2 1.5
52.9
52.3
51.7
0.6 1.2
14.6
14.6
14.7
0.0 0.0
10.2
10.2
10.1
0.0 0.0
7.5
7.5
6.9
0.0 0.0
10.2
10.3
9.5
-0.1 -1.0
30.7
30.1
30.0
0.6 2.0
1.2
1.2
1.2
0.0 0.0
21.7
21.6
21.3
0.1 0.5
7.8
7.3
7.5
0.5 6.9
1.8 2.0 1.1 1.8 -0.1 -1.1 1.9 2.3 1.2 2.3 -0.1 -0.7 0.1 1.0 0.6 8.7 0.7 7.4 0.7 2.3 0.0 0.0 0.4 1.9 0.3 4.0
Note: These not seasonally adjusted estimates were prepared in cooperation with the U.S. Department of Labor, Bureau of Labor Statistics, based upon monthly reports submitted by selected
employers in the Athens - Clarke County Metropolitan Statistical Area, which includes Clarke, Madison, Oconee and Oglethorpe counties. The estimates include all full- and part-time wage and salary workers who were employed during or received pay for any part of the pay period that includes the twelfth of the month. Proprietors, domestic workers, self-employed persons, unpaid family workers and personnel of the armed forces are excluded. Estimates based on 2014 benchmark.
Source: Georgia Department of Labor, Workforce Statistics & Economic Research
4
ATLANTA MSA Nonfarm Employment
(In thousands)
(Not Seasonally Adjusted)
Preliminary AUG 2015
Revised
Revised
JUL 2015 AUG 2014
Change in Jobs from JUL 2015
Net %
Change in Jobs from AUG 2014
Net %
Total Nonfarm Total Private Goods Producing Service-Providing Private Service-Providing Mining and Logging Construction
Construction of Buildings Specialty Trade Contractors Manufacturing Durable Goods Transportation Equipment Manufacturing Non-Durable Goods Food Manufacturing Trade, Transportation, and Utilities Wholesale Trade Merchant Wholesalers, Durable Goods Merchant Wholesalers, Nondurable Goods Wholesale Electronic Markets and Agents and Brokers Retail Trade Food and Beverage Stores General Merchandise Stores Miscellaneous Store Retailers Transportation, Warehousing, and Utilities Utilities Transportation and Warehousing Air Transportation Truck Transportation Couriers and Messengers Information Telecommunications Wired Telecommunications Carriers Wireless Telecommunications Carriers Internet Service Providers, Search Portals, and DP Financial Activities Finance and Insurance Insurance Carriers and Related Activities Real Estate and Rental and Leasing Professional and Business Services Professional, Scientific, and Technical Services Accounting, Tax Prep, and Bookkeeping Services Architectural, Engineering, and Related Services Computer Systems Design and Related Services Management and Technical Consulting Services Management of Companies and Enterprises Admin and Support, Waste Mngmnt and Remediation Employment Services Education and Health Services Educational Services Health Care and Social Assistance Ambulatory Health Care Services Hospitals Social Assistance Leisure and Hospitality Arts, Entertainment, and Recreation Accommodation and Food Services Accommodation Food Services and Drinking Places Other Services Repair and Maintenance Personal and Laundry Services Government Federal Government State Government Local Government
2,592.2 2,272.1
268.1 2,324.1 2,004.0
1.3 110.9 23.5 71.3 155.9 81.2 14.8 74.7 23.7 572.2 156.5 77.8 40.9 37.8 278.4 55.9 57.2 13.7 137.3 10.0 127.3 39.5 31.6 16.2 88.1 42.4 24.7
11.1 8.2 165.6 121.5 62.5 44.1 488.8 207.8 33.4 28.3 55.4 34.2 51.5 229.5 112.1 318.8 51.1 267.7 107.8 92.4 41.0 275.9 32.7 243.2 24.0 219.2 94.6 20.5 24.8 320.1 44.3 73.0 202.8
2,587.4 2,272.1
265.3 2,322.1 2,006.8
1.3 107.8
23.1 69.0 156.2 81.6 14.9 74.6 23.7 573.0 157.0 77.7 41.4 37.9 278.8 56.4 56.7 13.8 137.2 10.1 127.1 39.6 31.7 16.1 88.8 43.0 24.9 11.1
8.0 165.0 121.2
62.4 43.8 491.9 209.4 33.3 28.4 55.7 34.0 50.7 231.8 112.6 312.4 49.2 263.2 107.8 91.4 38.3 280.1 36.1 244.0 24.1 219.9 95.6 20.0 24.7 315.3 44.5 73.1 197.7
2,525.8 2,204.9
258.5 2,267.3 1,946.4
1.3 103.6
22.4 67.0 153.6 79.1 14.1 74.5 23.8 555.4 154.3 75.5 41.0 37.8 267.6 54.2 56.6 13.9 133.5 10.0 123.5 39.4 30.4 15.4 89.2 42.2 25.1 10.7
7.4 160.8 117.1
56.6 43.7 470.3 203.8 32.1 27.6 53.6 32.7 50.7 215.8 104.7 309.0 49.3 259.7 103.9 88.1 39.7 265.8 32.9 232.9 23.9 209.0 95.9 21.4 25.2 320.9 44.7 71.8 204.4
4.8 0.2 0.0 0.0 2.8 1.1 2.0 0.1 -2.8 -0.1 0.0 0.0 3.1 2.9 0.4 1.7 2.3 3.3 -0.3 -0.2 -0.4 -0.5 -0.1 -0.7 0.1 0.1 0.0 0.0 -0.8 -0.1 -0.5 -0.3 0.1 0.1 -0.5 -1.2 -0.1 -0.3 -0.4 -0.1 -0.5 -0.9 0.5 0.9 -0.1 -0.7 0.1 0.1 -0.1 -1.0 0.2 0.2 -0.1 -0.3 -0.1 -0.3 0.1 0.6 -0.7 -0.8 -0.6 -1.4 -0.2 -0.8 0.0 0.0 0.2 2.5 0.6 0.4 0.3 0.3 0.1 0.2 0.3 0.7 -3.1 -0.6 -1.6 -0.8 0.1 0.3 -0.1 -0.4 -0.3 -0.5 0.2 0.6 0.8 1.6 -2.3 -1.0 -0.5 -0.4 6.4 2.1 1.9 3.9 4.5 1.7 0.0 0.0 1.0 1.1 2.7 7.1 -4.2 -1.5 -3.4 -9.4 -0.8 -0.3 -0.1 -0.4 -0.7 -0.3 -1.0 -1.1 0.5 2.5 0.1 0.4 4.8 1.5 -0.2 -0.5 -0.1 -0.1 5.1 2.6
66.4 2.6 67.2 3.1
9.6 3.7 56.8 2.5 57.6 3.0
0.0 0.0 7.3 7.1 1.1 4.9 4.3 6.4 2.3 1.5 2.1 2.7 0.7 5.0 0.2 0.3 -0.1 -0.4 16.8 3.0 2.2 1.4 2.3 3.1 -0.1 -0.2 0.0 0.0 10.8 4.0 1.7 3.1 0.6 1.1 -0.2 -1.4 3.8 2.9 0.0 0.0 3.8 3.1 0.1 0.3 1.2 4.0 0.8 5.2 -1.1 -1.2 0.2 0.5 -0.4 -1.6 0.4 3.7 0.8 10.8 4.8 3.0 4.4 3.8 5.9 10.4 0.4 0.9 18.5 3.9 4.0 2.0 1.3 4.1 0.7 2.5 1.8 3.4 1.5 4.6 0.8 1.6 13.7 6.4 7.4 7.1 9.8 3.2 1.8 3.7 8.0 3.1 3.9 3.8 4.3 4.9 1.3 3.3 10.1 3.8 -0.2 -0.6 10.3 4.4 0.1 0.4 10.2 4.9 -1.3 -1.4 -0.9 -4.2 -0.4 -1.6 -0.8 -0.3 -0.4 -0.9 1.2 1.7 -1.6 -0.8
Note: These not seasonally adjusted estimates were prepared in cooperation with the U.S. Department of Labor, Bureau of Labor Statistics, based upon monthly reports submitted by
selected employers in the Atlanta Metropolitan Statistical Area, which includes Barrow, Bartow, Butts, Carroll, Cherokee, Clayton, Cobb, Coweta, Dawson, DeKalb, Douglas, Fayette, Forsyth,
Fulton, Gwinnett, Haralson, Heard, Henry, Jasper, Lamar, Meriwether, Morgan, Newton, Paulding, Pickens, Pike, Rockdale, Spalding and Walton counties. The estimates include all full- and
part-time wage and salary workers who were employed during or received pay for any part of the pay period that includes the twelfth of the month. Proprietors, domestic workers, self-employed
persons, unpaid family workers and personnel of the armed forces are excluded. Estimates based on 2014 benchmark.
Source: Georgia Department of Labor, Workforce Statistics & Economic Research
5
AUGUSTA-RICHMOND MSA Nonfarm Employment
(In thousands)
(Not Seasonally Adjusted)
Preliminary
Revised
Revised
AUG 2015 JUL 2015 AUG 2014
Change in Jobs from JUL 2015
Net %
Change in Jobs from AUG 2014
Net %
Total Nonfarm Total Private Goods Producing Service-Providing Private Service-Providing Mining, Logging and Construction Manufacturing Trade, Transportation, and Utilities
Wholesale Trade Retail Trade Transportation, Warehousing, and Utilities Information Financial Activities Professional and Business Services Education and Health Services Leisure and Hospitality Other Services Government Federal Government State Government Local Government
229.3 182.7
31.1 198.2 151.6
11.1 20.0 40.2
6.0 26.8
7.4 3.0 8.3 33.7 32.0 26.0 8.4 46.6 9.1 16.4 21.1
228.1 181.8
31.1 197.0 150.7
11.1 20.0 39.7
6.0 26.3
7.4 3.1 8.3 33.7 31.5 26.0 8.4 46.3 9.2 16.2 20.9
224.0 177.9
31.5 192.5 146.4
11.4 20.1 38.7
5.9 25.6
7.2 3.2 8.2 33.5 30.9 23.5 8.4 46.1 9.0 16.6 20.5
1.2 0.5 0.9 0.5 0.0 0.0 1.2 0.6 0.9 0.6 0.0 0.0 0.0 0.0 0.5 1.3 0.0 0.0 0.5 1.9 0.0 0.0 -0.1 -3.2 0.0 0.0 0.0 0.0 0.5 1.6 0.0 0.0 0.0 0.0 0.3 0.7 -0.1 -1.1 0.2 1.2 0.2 1.0
5.3 2.4 4.8 2.7 -0.4 -1.3 5.7 3.0 5.2 3.6 -0.3 -2.6 -0.1 -0.5 1.5 3.9 0.1 1.7 1.2 4.7 0.2 2.8 -0.2 -6.3 0.1 1.2 0.2 0.6 1.1 3.6 2.5 10.6 0.0 0.0 0.5 1.1 0.1 1.1 -0.2 -1.2 0.6 2.9
Note: These not seasonally adjusted estimates were prepared in cooperation with the U.S. Department of Labor, Bureau of Labor Statistics, based upon monthly reports submitted by
selected employers in the Augusta - Richmond County Metropolitan Statistical Area, which includes Burke, Columbia, Lincoln, McDuffie and Richmond counties in Georgia and Aiken and Edgefield counties in South Carolina. The estimates include all full- and part-time wage and salary workers who were employed during or received pay for any part of the pay period that includes the
twelfth of the month. Proprietors, domestic workers, self-employed persons, unpaid family workers and personnel of the armed forces are excluded. Estimates based on 2014 benchmark.
BRUNSWICK MSA Nonfarm Employment
(In thousands)
(Not Seasonally Adjusted)
Preliminary
Revised
Revised
AUG 2015 JUL 2015 AUG 2014
Change in Jobs from JUL 2015
Net %
Change in Jobs from AUG 2014
Net %
Total Nonfarm Total Private Goods Producing Service-Providing Private Service-Providing Trade, Transportation, and Utilities
Retail Trade Government
Federal Government State Government Local Government
41.4
42.3
41.5
-0.9 -2.1
31.5
32.5
31.5
-1.0 -3.1
3.8
3.8
3.9
0.0 0.0
37.6
38.5
37.6
-0.9 -2.3
27.7
28.7
27.6
-1.0 -3.5
8.5
9.0
8.4
-0.5 -5.6
5.7
5.8
5.8
-0.1 -1.7
9.9
9.8
10.0
0.1 1.0
1.7
1.7
1.7
0.0 0.0
1.8
1.8
1.7
0.0 0.0
6.4
6.3
6.6
0.1 1.6
-0.1 -0.2 0.0 0.0 -0.1 -2.6 0.0 0.0 0.1 0.4 0.1 1.2 -0.1 -1.7 -0.1 -1.0 0.0 0.0 0.1 5.9 -0.2 -3.0
Note: These not seasonally adjusted estimates were prepared in cooperation with the U.S. Department of Labor, Bureau of Labor Statistics, based upon monthly reports submitted by
selected employers in the Brunswick Metropolitan Statistical Area, which includes Brantley, Glynn and McIntosh counties. The estimates include all full- and part-time wage and salary workers who were employed during or received pay for any part of the pay period that includes the twelfth of the month. Proprietors, domestic workers, self-employed persons, unpaid family workers and personnel of the armed forces are excluded. Estimates based on 2014 benchmark.
Source: Georgia Department of Labor, Workforce Statistics & Economic Research
6
COLUMBUS MSA Nonfarm Employment
(In thousands)
(Not Seasonally Adjusted)
Preliminary
Revised
Revised
AUG 2015 JUL 2015 AUG 2014
Change in Jobs from JUL 2015
Net %
Change in Jobs from AUG 2014
Net %
Total Nonfarm Total Private Goods Producing Service-Providing Private Service-Providing Mining, Logging and Construction Manufacturing Trade, Transportation, and Utilities
Wholesale Trade Retail Trade Transportation, Warehousing, and Utilities Information Financial Activities Finance and Insurance
Insurance Carriers and Related Activities Professional and Business Services Education and Health Services Leisure and Hospitality Other Services Government
Federal Government State Government Local Government
124.1 99.6 15.2
108.9 84.4 4.4 10.8 18.6 2.7 13.9 2.0 1.6 13.6 11.8 4.7 13.4 17.3 15.1 4.8 24.5 6.8 4.8 12.9
124.1 100.0
15.2 108.9
84.8 4.4
10.8 18.6
2.7 13.9
2.0 1.6 13.6 11.8 4.7 13.9 17.1 15.2 4.8 24.1 6.7 4.7 12.7
121.9 97.8 15.4
106.5 82.4 4.4 11.0 18.3 2.7 13.7 1.9 1.5 13.5 11.6 4.6 12.7 16.9 14.7 4.8 24.1 6.9 4.7 12.5
0.0 0.0 -0.4 -0.4 0.0 0.0 0.0 0.0 -0.4 -0.5 0.0 0.0 0.0 0.0 0.0 0.0 0.0 0.0 0.0 0.0 0.0 0.0 0.0 0.0 0.0 0.0 0.0 0.0 0.0 0.0 -0.5 -3.6 0.2 1.2 -0.1 -0.7 0.0 0.0 0.4 1.7 0.1 1.5 0.1 2.1 0.2 1.6
2.2 1.8 1.8 1.8 -0.2 -1.3 2.4 2.3 2.0 2.4 0.0 0.0 -0.2 -1.8 0.3 1.6 0.0 0.0 0.2 1.5 0.1 5.3 0.1 6.7 0.1 0.7 0.2 1.7 0.1 2.2 0.7 5.5 0.4 2.4 0.4 2.7 0.0 0.0 0.4 1.7 -0.1 -1.5 0.1 2.1 0.4 3.2
Note: These not seasonally adjusted estimates were prepared in cooperation with the U.S. Department of Labor, Bureau of Labor Statistics, based upon monthly reports submitted by
selected employers in the Columbus Metropolitan Statistical Area, which includes Chattahoochee, Harris, Marion and Muscogee counties in Georgia and Russell County in Alabama. The estimates include all full- and part-time wage and salary workers who were employed during or received pay for any part of the pay period that includes the twelfth of the month. Proprietors, domestic workers, self-employed persons, unpaid family workers and personnel of the armed forces are excluded. Estimates based on 2014 benchmark.
DALTON MSA Nonfarm Employment
(In thousands)
(Not Seasonally Adjusted)
Preliminary
Revised Revised
AUG 2015 JUL 2015 AUG 2014
Change in Jobs from JUL 2015
Net %
Change in Jobs from AUG 2014
Net %
Total Nonfarm Total Private Goods Producing Service-Providing Private Service-Providing Manufacturing
Textile Mills Textile Product Mills Trade, Transportation, and Utilities Retail Trade Transportation, Warehousing, and Utilities Professional and Business Services Government Federal Government State Government Local Government
68.3
68.1
67.2
61.4
61.2
60.3
24.8
24.7
24.4
43.5
43.4
42.8
36.6
36.5
35.9
24.1
24.0
23.0
2.5
2.5
2.5
15.8
15.7
15.4
17.3
17.2
16.3
8.4
8.4
8.2
4.4
4.4
4.2
6.5
6.5
6.3
6.9
6.9
6.9
0.2
0.2
0.2
1.0
1.0
1.0
5.7
5.7
5.7
0.2 0.3 0.2 0.3 0.1 0.4 0.1 0.2 0.1 0.3 0.1 0.4 0.0 0.0 0.1 0.6 0.1 0.6 0.0 0.0 0.0 0.0 0.0 0.0 0.0 0.0 0.0 0.0 0.0 0.0 0.0 0.0
1.1 1.6 1.1 1.8 0.4 1.6 0.7 1.6 0.7 2.0 1.1 4.8 0.0 0.0 0.4 2.6 1.0 6.1 0.2 2.4 0.2 4.8 0.2 3.2 0.0 0.0 0.0 0.0 0.0 0.0 0.0 0.0
Note: These not seasonally adjusted estimates were prepared in cooperation with the U.S. Department of Labor, Bureau of Labor Statistics, based upon monthly reports submitted by
selected employers in the Dalton Metropolitan Statistical Area, which includes Murray and Whitfield counties. The estimates include all full- and part-time wage and salary workers who were employed during or received pay for any part of the pay period that includes the twelfth of the month. Proprietors, domestic workers, self-employed persons, unpaid family workers and personnel of the armed forces are excluded. Estimates based on 2014 benchmark.
Source: Georgia Department of Labor, Workforce Statistics & Economic Research
7
GAINESVILLE MSA Nonfarm Employment
(In thousands)
(Not Seasonally Adjusted)
Preliminary
Revised
Revised
AUG 2015 JUL 2015 AUG 2014
Change in Jobs from JUL 2015
Net %
Change in Jobs from AUG 2014
Net %
Total Nonfarm Total Private Goods Producing Service-Providing Private Service-Providing Trade, Transportation, and Utilities
Retail Trade Government
Federal Government State Government Local Government
82.4
81.5
80.3
72.6
72.2
70.1
22.5
22.3
21.7
59.9
59.2
58.6
50.1
49.9
48.4
15.7
15.4
15.0
8.5
8.5
8.1
9.8
9.3
10.2
0.5
0.5
0.5
2.2
2.1
2.4
7.1
6.7
7.3
0.9 1.1 0.4 0.6 0.2 0.9 0.7 1.2 0.2 0.4 0.3 2.0 0.0 0.0 0.5 5.4 0.0 0.0 0.1 4.8 0.4 6.0
2.1 2.6 2.5 3.6 0.8 3.7 1.3 2.2 1.7 3.5 0.7 4.7 0.4 4.9 -0.4 -3.9 0.0 0.0 -0.2 -8.3 -0.2 -2.7
Note: These not seasonally adjusted estimates were prepared in cooperation with the U.S. Department of Labor, Bureau of Labor Statistics, based upon monthly reports submitted by
selected employers in the Gainesville Metropolitan Statistical Area, which comprises Hall county. The estimates include all full- and part-time wage and salary workers who were employed during or received pay for any part of the pay period that includes the twelfth of the month. Proprietors, domestic workers, self-employed persons, unpaid family workers and personnel of the armed forces are excluded. Estimates based on 2014 benchmark.
HINESVILLE MSA Nonfarm Employment
(In thousands)
(Not Seasonally Adjusted)
Preliminary Revised Revised AUG 2015 JUL 2015 AUG 2014
Change in Jobs from JUL 2015
Net %
Change in Jobs from AUG 2014
Net %
Total Nonfarm Total Private Goods Producing Service-Providing Private Service-Providing Government
Federal Government State Government Local Government
19.7
19.3
19.9
11.7
11.5
11.9
2.8
2.8
2.7
16.9
16.5
17.2
8.9
8.7
9.2
8.0
7.8
8.0
4.0
4.0
4.0
0.4
0.4
0.4
3.6
3.4
3.6
0.4 2.1 0.2 1.7 0.0 0.0 0.4 2.4 0.2 2.3 0.2 2.6 0.0 0.0 0.0 0.0 0.2 5.9
-0.2 -1.0 -0.2 -1.7 0.1 3.7 -0.3 -1.7 -0.3 -3.3 0.0 0.0 0.0 0.0 0.0 0.0 0.0 0.0
Note: These not seasonally adjusted estimates were prepared in cooperation with the U.S. Department of Labor, Bureau of Labor Statistics, based upon monthly reports submitted by
selected employers in the Hinesville Metropolitan Statistical Area, which includes Liberty and Long counties. The estimates include all full- and part-time wage and salary workers who were employed during or received pay for any part of the pay period that includes the twelfth of the month. Proprietors, domestic workers, self-employed persons, unpaid family workers and personnel of the armed forces are excluded. Estimates based on 2014 benchmark.
Source: Georgia Department of Labor, Workforce Statistics & Economic Research
8
MACON MSA Nonfarm Employment
(In thousands)
(Not Seasonally Adjusted)
Preliminary
Revised
Revised
AUG 2015 JUL 2015 AUG 2014
Change in Jobs from JUL 2015
Net %
Change in Jobs from AUG 2014
Net %
Total Nonfarm Total Private Goods Producing Service-Providing Private Service-Providing Trade, Transportation, and Utilities
Retail Trade Transportation, Warehousing, and Utilities Financial Activities Professional and Business Services Education and Health Services Leisure and Hospitality Government Federal Government State Government Local Government
101.4 86.4 9.4 92.0 77.0 19.1 13.4 3.6 10.0 12.3 20.3 10.0 15.0 1.1 3.8 10.1
101.2 86.8 9.4 91.8 77.4 19.5 13.6 3.7 10.0 12.6 20.1 10.1 14.4 1.1 3.8 9.5
101.0 86.0 9.4 91.6 76.6 20.4 13.8 3.6 9.9 12.2 20.0 9.4 15.0 1.1 3.8 10.1
0.2 0.2 -0.4 -0.5 0.0 0.0 0.2 0.2 -0.4 -0.5 -0.4 -2.1 -0.2 -1.5 -0.1 -2.7 0.0 0.0 -0.3 -2.4 0.2 1.0 -0.1 -1.0 0.6 4.2 0.0 0.0 0.0 0.0 0.6 6.3
0.4 0.4 0.4 0.5 0.0 0.0 0.4 0.4 0.4 0.5 -1.3 -6.4 -0.4 -2.9 0.0 0.0 0.1 1.0 0.1 0.8 0.3 1.5 0.6 6.4 0.0 0.0 0.0 0.0 0.0 0.0 0.0 0.0
Note: These not seasonally adjusted estimates were prepared in cooperation with the U.S. Department of Labor, Bureau of Labor Statistics, based upon monthly reports submitted by
selected employers in the Macon Metropolitan Statistical Area, which includes Bibb, Crawford, Jones, Monroe and Twiggs counties. The estimates include all full- and part-time wage and salary workers who were employed during or received pay for any part of the pay period that includes the twelfth of the month. Proprietors, domestic workers, self-employed persons, unpaid family workers and personnel of the armed forces are excluded. Estimates based on 2014 benchmark.
ROME MSA Nonfarm Employment
(In thousands)
(Not Seasonally Adjusted)
Preliminary
Revised
Revised
AUG 2015 JUL 2015 AUG 2014
Change in Jobs from JUL 2015
Net %
Change in Jobs from AUG 2014
Net %
Total Nonfarm Total Private Goods Producing Service-Providing Private Service-Providing Manufacturing Trade, Transportation, and Utilities
Retail Trade Education and Health Services Government
Federal Government State Government Local Government
40.1
39.8
39.5
0.3 0.8
34.3
34.2
33.8
0.1 0.3
6.7
6.8
6.4
-0.1 -1.5
33.4
33.0
33.1
0.4 1.2
27.6
27.4
27.4
0.2 0.7
5.8
5.8
5.6
0.0 0.0
7.6
7.6
7.7
0.0 0.0
5.2
5.2
4.9
0.0 0.0
9.9
9.7
9.8
0.2 2.1
5.8
5.6
5.7
0.2 3.6
0.2
0.2
0.2
0.0 0.0
1.6
1.6
1.6
0.0 0.0
4.0
3.8
3.9
0.2 5.3
0.6 1.5 0.5 1.5 0.3 4.7 0.3 0.9 0.2 0.7 0.2 3.6 -0.1 -1.3 0.3 6.1 0.1 1.0 0.1 1.8 0.0 0.0 0.0 0.0 0.1 2.6
Note: These not seasonally adjusted estimates were prepared in cooperation with the U.S. Department of Labor, Bureau of Labor Statistics, based upon monthly reports submitted by
selected employers in the Rome Metropolitan Statistical Area, which comprises Floyd county. The estimates include all full- and part-time wage and salary workers who were employed during or received pay for any part of the pay period that includes the twelfth of the month. Proprietors, domestic workers, self-employed persons, unpaid family workers and personnel of the armed forces are excluded. Estimates based on 2014 benchmark.
Source: Georgia Department of Labor, Workforce Statistics & Economic Research
9
SAVANNAH MSA Nonfarm Employment
(In thousands)
(Not Seasonally Adjusted)
Preliminary Revised
Revised
AUG 2015 JUL 2015 AUG 2014
Change in Jobs from JUL 2015
Net %
Change in Jobs from AUG 2014
Net %
Total Nonfarm Total Private Goods Producing Service-Providing Private Service-Providing Mining, Logging and Construction Manufacturing Trade, Transportation, and Utilities
Wholesale Trade Retail Trade Transportation, Warehousing, and Utilities Information Financial Activities Professional and Business Services Education and Health Services Leisure and Hospitality Other Services Government Federal Government State Government Local Government
170.9 149.0
22.8 148.1 126.2
5.9 16.9 38.3
6.6 20.8 10.9
1.8 6.5 23.1 24.4 24.9 7.2 21.9 2.8 4.7 14.4
170.7 149.0
22.9 147.8 126.1
6.0 16.9 37.6
6.6 20.1 10.9
1.8 6.5 23.1 24.1 25.8 7.2 21.7 2.9 4.7 14.1
167.1 143.4
22.3 144.8 121.1
6.1 16.2 37.0
6.5 20.1 10.4
1.7 6.5 19.8 24.1 24.8 7.2 23.7 2.9 6.0 14.8
0.2 0.1 0.0 0.0 -0.1 -0.4 0.3 0.2 0.1 0.1 -0.1 -1.7 0.0 0.0 0.7 1.9 0.0 0.0 0.7 3.5 0.0 0.0 0.0 0.0 0.0 0.0 0.0 0.0 0.3 1.2 -0.9 -3.5 0.0 0.0 0.2 0.9 -0.1 -3.5 0.0 0.0 0.3 2.1
3.8 2.3 5.6 3.9 0.5 2.2 3.3 2.3 5.1 4.2 -0.2 -3.3 0.7 4.3 1.3 3.5 0.1 1.5 0.7 3.5 0.5 4.8 0.1 5.9 0.0 0.0 3.3 16.7 0.3 1.2 0.1 0.4 0.0 0.0 -1.8 -7.6 -0.1 -3.5 -1.3 -21.7 -0.4 -2.7
Note: These not seasonally adjusted estimates were prepared in cooperation with the U.S. Department of Labor, Bureau of Labor Statistics, based upon monthly reports submitted by
selected employers in the Savannah Metropolitan Statistical Area, which includes Bryan, Chatham and Effingham counties. The estimates include all full- and part-time wage and salary workers who were employed during or received pay for any part of the pay period that includes the twelfth of the month. Proprietors, domestic workers, self-employed persons, unpaid family workers and personnel of the armed forces are excluded. Estimates based on 2014 benchmark.
VALDOSTA MSA Nonfarm Employment
(In thousands)
(Not Seasonally Adjusted)
Preliminary Revised
Revised
AUG 2015 JUL 2015 AUG 2014
Change in Jobs from JUL 2015
Net %
Change in Jobs from AUG 2014
Net %
Total Nonfarm Total Private Goods Producing Service-Providing Private Service-Providing Trade, Transportation, and Utilities
Retail Trade Government
Federal Government State Government Local Government
53.7
53.3
54.7
41.0
40.8
41.3
6.8
6.7
7.0
46.9
46.6
47.7
34.2
34.1
34.3
12.4
12.3
11.4
8.5
8.5
7.9
12.7
12.5
13.4
1.1
1.1
1.1
3.7
3.6
4.4
7.9
7.8
7.9
0.4 0.8 0.2 0.5 0.1 1.5 0.3 0.6 0.1 0.3 0.1 0.8 0.0 0.0 0.2 1.6 0.0 0.0 0.1 2.8 0.1 1.3
-1.0 -1.8 -0.3 -0.7 -0.2 -2.9 -0.8 -1.7 -0.1 -0.3 1.0 8.8 0.6 7.6 -0.7 -5.2 0.0 0.0 -0.7 -15.9 0.0 0.0
Note: These not seasonally adjusted estimates were prepared in cooperation with the U.S. Department of Labor, Bureau of Labor Statistics, based upon monthly reports submitted by
selected employers in the Valdosta Metropolitan Statistical Area, which includes Brooks, Echols, Lanier and Lowndes counties. The estimates include all full- and part-time wage and salary workers who were employed during or received pay for any part of the pay period that includes the twelfth of the month. Proprietors, domestic workers, self-employed persons, unpaid family workers and personnel of the armed forces are excluded. Estimates based on 2014 benchmark.
Source: Georgia Department of Labor, Workforce Statistics & Economic Research
10
WARNER ROBINS MSA Nonfarm Employment
(In thousands)
(Not Seasonally Adjusted)
Preliminary Revised
Revised
AUG 2015 JUL 2015 AUG 2014
Change in Jobs from JUL 2015
Net %
Change in Jobs from AUG 2014
Net %
Total Nonfarm Total Private Goods Producing Service-Providing Private Service-Providing Trade, Transportation, and Utilities
Retail Trade Government
Federal Government State Government Local Government
69.2
69.3
70.5
-0.1 -0.1
42.3
42.4
43.5
-0.1 -0.2
8.7
8.8
8.8
-0.1 -1.1
60.5
60.5
61.7
0.0 0.0
33.6
33.6
34.7
0.0 0.0
10.4
10.4
10.5
0.0 0.0
7.7
7.7
7.8
0.0 0.0
26.9
26.9
27.0
0.0 0.0
15.0
15.1
15.0
-0.1 -0.7
2.5
2.5
2.5
0.0 0.0
9.4
9.3
9.5
0.1 1.1
-1.3 -1.8 -1.2 -2.8 -0.1 -1.1 -1.2 -1.9 -1.1 -3.2 -0.1 -1.0 -0.1 -1.3 -0.1 -0.4 0.0 0.0 0.0 0.0 -0.1 -1.1
Note: These not seasonally adjusted estimates were prepared in cooperation with the U.S. Department of Labor, Bureau of Labor Statistics, based upon monthly reports submitted by
selected employers in the Warner Robins Metropolitan Statistical Area, which includes Houston, Peach and Pulaski counties. The estimates include all full- and part-time wage and salary workers who were employed during or received pay for any part of the pay period that includes the twelfth of the month. Proprietors, domestic workers, self-employed persons, unpaid family workers and personnel of the armed forces are excluded. Estimates based on 2014 benchmark.
Source: Georgia Department of Labor, Workforce Statistics & Economic Research
Total Nonfarm Employment by Metro Statistical Area
(In thousands)
(Seasonally Adjusted)
Preliminary AUG 2015
Revised Revised JUL 2015 AUG 2014
Change in Jobs from JUL 2015
Net %
Change in Jobs from AUG 2014
Net %
Albany MSA
60.0
60.4
60.7
-0.4 -0.7
-0.7 -1.2
Athens-Clarke County MSA
93.3
92.8
91.5
0.5 0.5
1.8 2.0
Atlanta MSA
2,590.1
2,589.5
2,520.3
0.6 0.0
69.8 2.8
Augusta-Richmond MSA
228.9
227.6
225.4
1.3 0.6
3.5 1.6
Brunswick MSA
41.0
41.9
41.2
-0.9 -2.1
-0.2 -0.5
Columbus MSA
124.2
124.6
122.3
-0.4 -0.3
1.9 1.6
Dalton MSA
67.9
68.2
66.8
-0.3 -0.4
1.1 1.6
Gainesville MSA
82.2
81.4
80.0
0.8 1.0
2.2 2.8
Hinesville MSA
19.7
19.5
19.9
0.2 1.0
-0.2 -1.0
Macon MSA
101.2
101.0
101.0
0.2 0.2
0.2 0.2
Rome MSA
40.1
40.1
39.6
0.0 0.0
0.5 1.3
Savannah MSA
171.4
171.3
166.9
0.1 0.1
4.5 2.7
Valdosta MSA
53.7
53.6
54.8
0.1 0.2
-1.1 -2.0
Warner Robins MSA
NO DATA AVAILABLE
Note: These seasonally adjusted estimates were prepared in cooperation with the U.S. Department of Labor, Bureau of Labor Statistics, based upon monthly reports submitted by selected
employers throughout Georgia. The estimates include all full- and part-time wage and salary workers who were employed during or received pay for any part of the pay period that includes the twelfth of the month. Proprietors, domestic workers, self-employed persons, unpaid family workers and personnel of the armed forces are excluded. Estimates based on 2014 benchmark.
Source: Georgia Department of Labor, Workforce Statistics & Economic Research
11
Georgia Statewide Hours and Earnings
All Employee
Average Weekly Earnings
Preliminary AUG 2015
Revised JUL 2015
Revised AUG 2014
Total Private.................................................................................................... $850.02.............................$826.61.......................$830.48 Goods Producing........................................................................................ $1,011.39............................. $979.12.......................$970.40 Private Service Providing..............................................................................$820.76............................ $799.02.......................$804.73
Construction...............................................................................................$979.04............................. $977.13.......................$968.01 Manufacturing.........................................................................................$1,028.84.............................$979.32.......................$968.07 Trade, Transportation, and Utilities............................................................$752.24............................ $750.29.......................$769.95 Financial Activities...................................................................................$1,139.17.......................... $1,078.13..................... $1,111.79 Professional and Business Services......................................................$1,043.25............................ $996.86.......................$994.42 Educational and Health Services...............................................................$881.79............................ $869.36...................... $883.82 Leisure and Hospitality.............................................................................. $335.00............................ $330.46....................... $319.19 Other Services........................................................................................... $767.83............................ $723.49.......................$691.56
Average Weekly Hours
Preliminary AUG 2015
Revised JUL 2015
Revised AUG 2014
Total Private...........................................................................................................35.7...................................35.1.............................35.4 Goods Producing.................................................................................................42.3................................... 41.7............................. 41.9 Private Service Providing....................................................................................34.5...................................33.9.............................34.2
Construction.....................................................................................................42.2...................................42.3............................. 42.7 Manufacturing..................................................................................................42.2...................................41.2............................. 41.3 Trade, Transportation, and Utilities..................................................................35.3.................................. 34.8.............................35.4 Financial Activities...........................................................................................38.8................................... 37.1.............................36.5 Professional and Business Services...............................................................35.9...................................35.4.............................36.6 Educational and Health Services.....................................................................35.3.................................. 34.9............................. 35.1 Leisure and Hospitality.....................................................................................26.8...................................26.5.............................26.8 Other Services.................................................................................................35.4...................................34.6.............................33.9
Average Hourly Earnings
Preliminary AUG 2015
Revised JUL 2015
Revised AUG 2014
Total Private.......................................................................................................$23.81.............................. $23.55.........................$23.46 Goods Producing.............................................................................................$23.91.............................. $23.48......................... $23.16 Private Service Providing................................................................................$23.79.............................. $23.57.........................$23.53
Construction................................................................................................ $23.20............................... $23.10.........................$22.67 Manufacturing..............................................................................................$24.38...............................$23.77.........................$23.44 Trade, Transportation, and Utilities.............................................................. $21.31...............................$21.56......................... $21.75 Financial Activities.......................................................................................$29.36.............................. $29.06.........................$30.46 Professional and Business Services...........................................................$29.06............................... $28.16..........................$27.17 Educational and Health Services.................................................................$24.98...............................$24.91......................... $25.18 Leisure and Hospitality.................................................................................$12.50...............................$12.47......................... $11.91 Other Services.............................................................................................$21.69...............................$20.91.........................$20.40
Read more about the hours and earnings series at http://www.bls.gov/sae/home.htm
Note: These not seasonally adjusted estimates were prepared in cooperation with the U.S. Department of Labor, Bureau of Labor Statistics, based upon monthly reports submitted by
selected employers throughout Georgia. The estimates include all full- and part-time wage and salary workers who were employed during or received pay for any part of the pay period that includes the twelfth of the month. Proprietors, domestic workers, self-employed persons, unpaid family workers and personnel of the armed forces are excluded. Estimates based on 2014 benchmark.
12
Source: Georgia Department of Labor, Workforce Statistics & Economic Research
Georgia MSA Hours and Earnings
All Employee Total Private
Average Weekly Earnings
Preliminary AUG 2015
Revised JUL 2015
Revised AUG 2014
Albany MSA ....................................................................................................$576.20............................ $558.90.......................$620.98 Athens-Clarke County MSA ...........................................................................$750.48............................ $720.46...................... $640.58 Atlanta MSA ..................................................................................................$940.70............................ $909.30.......................$912.97 Augusta-Richmond County MSA .................................................................. $888.55............................ $864.49....................... $901.41 Brunswick MSA ............................................................................................. $629.15.............................$591.54.......................$531.98 Columbus MSA ..............................................................................................$677.93.............................$653.14...................... $684.00 Dalton MSA ...................................................................................................$725.60............................ $684.68.......................$672.32 Gainesville MSA ............................................................................................ $834.39............................. $837.14....................... $863.18 Hinesville MSA ............................................................................................... $749.76............................. $771.78.......................$820.99 Macon MSA ....................................................................................................$720.47.............................$724.66.......................$738.67 Rome MSA .....................................................................................................$874.57............................ $875.96.......................$939.80 Savannah MSA ............................................................................................. $688.24.............................$678.78...................... $666.50 Valdosta MSA .................................................................................................$601.30............................ $590.90........................$611.11 Warner Robins MSA .......................................................................................$712.64............................ $728.22...................... $634.26
Average Weekly Hours
Preliminary AUG 2015
Revised JUL 2015
Revised AUG 2014
Albany MSA ..........................................................................................................34.4...................................34.1.............................36.4 Athens-Clarke County MSA .................................................................................35.3...................................34.0.............................32.8 Atlanta MSA ........................................................................................................35.7...................................35.0.............................35.4 Augusta-Richmond County MSA .........................................................................36.9...................................36.6............................. 37.7 Brunswick MSA ...................................................................................................34.1...................................32.9.............................32.3 Columbus MSA ....................................................................................................34.5...................................34.0.............................34.2 Dalton MSA .........................................................................................................40.0...................................39.6.............................39.9 Gainesville MSA ................................................................................................... 37.4...................................38.0.............................39.2 Hinesville MSA .....................................................................................................35.5.................................. 36.2.............................38.4 Macon MSA ..........................................................................................................38.1...................................38.1............................. 37.9 Rome MSA ........................................................................................................... 37.2.................................. 34.5............................. 37.0 Savannah MSA ....................................................................................................33.2...................................32.4.............................32.8 Valdosta MSA .......................................................................................................35.0.................................. 34.8.............................35.8 Warner Robins MSA .............................................................................................38.5...................................40.3............................. 37.2
Average Hourly Earnings
Preliminary AUG 2015
Revised JUL 2015
Revised AUG 2014
Albany MSA ...................................................................................................... $16.75...............................$16.39......................... $17.06 Athens-Clarke County MSA .............................................................................$21.26............................... $21.19......................... $19.53 Atlanta MSA ....................................................................................................$26.35.............................. $25.98.........................$25.79 Augusta-Richmond County MSA .....................................................................$24.08.............................. $23.62.........................$23.91 Brunswick MSA ...............................................................................................$18.45............................... $17.98......................... $16.47 Columbus MSA ................................................................................................$19.65...............................$19.21.........................$20.00 Dalton MSA ..................................................................................................... $18.14............................... $17.29.........................$16.85 Gainesville MSA ...............................................................................................$22.31.............................. $22.03.........................$22.02 Hinesville MSA ................................................................................................. $21.12...............................$21.32.........................$21.38 Macon MSA ......................................................................................................$18.91...............................$19.02......................... $19.49 Rome MSA .......................................................................................................$23.51.............................. $25.39.........................$25.40 Savannah MSA ................................................................................................$20.73.............................. $20.95.........................$20.32 Valdosta MSA ....................................................................................................$17.18...............................$16.98......................... $17.07 Warner Robins MSA ......................................................................................... $18.51...............................$18.07......................... $17.05
Read more about the hours and earnings series at http://www.bls.gov/sae/home.htm
Note: These not seasonally adjusted estimates were prepared in cooperation with the U.S. Department of Labor, Bureau of Labor Statistics, based upon monthly reports submitted by
selected employers throughout Georgia. The estimates include all full- and part-time wage and salary workers who were employed during or received pay for any part of the pay period that includes the twelfth of the month. Proprietors, domestic workers, self-employed persons, unpaid family workers and personnel of the armed forces are excluded. Estimates based on 2014 benchmark.
Source: Georgia Department of Labor, Workforce Statistics & Economic Research
13
Dimensions - Measuring Georgia's Labor Force
Unemployment rates -- Georgia and U.S.
8%
Georgia
U.S.
7%
6%
5% Aug Sep Oct Nov Dec Jan Feb Mar Apr May Jun Jul Aug
2014
2015
WA 5.3
OR
6.1
ID
4.2
NV
6.8
UT
CA
3.7
6.1
AZ 6.3
AK 6.6
StatSetautenUenmemppllooyymmenetnRtatreas tes
August 2015
National Unemployment Rate: 5.1% Rates are seasonally adjusted
MT 4.1
WY 4.0
CO 4.2 NM 6.7
ND 2.9 SD 3.7
NE 2.8
KS 4.6
MN 4.0
WI 4.5
IA 3.7
IL 5.6 MO 5.6
OK 4.6 TX 4.1
AR 5.4
MS 6.3 LA 6.0
NH
3.6 ME
VT
4.5
3.6
MI 5.1
OH
IN
4.7
4.6
KY 5.2 TN 5.7
PA 5.4
WV
7.6
VA
4.5
NC 5.9
SC 6.0
AL
GA
6.2
5.9
FL 5.3
MA 4.7
NY 5.2
RI 5.6
NJ 5.7
CT 5.3
DE
4.9
DC 6.8
MD 5.1
Unemployment rate
10.0% or greater 7.0% to 9.9% 6.0% to 6.9% 5.0% to 5.9% 4.0% to 4.9% 3.0% to 3.9% Less than 3.0%
HI 3.5
Source: Georgia Department of Labor, Workforce Statistics & Economic Research
14
Georgia Labor Force Estimates (not seasonally adjusted) Place of Residence - Persons 16 Years and Older
Georgia
(Seasonally adjusted)
Georgia
(Not Seasonally adjusted)
Albany MSA Athens-Clarke County MSA
Atlanta MSA
Augusta-Richmond County MSA
Brunswick MSA
Columbus MSA
Dalton MSA
Gainesville MSA
Employment Status
Civilian labor force Employed Unemployed Rate
Civilian labor force Employed Unemployed Rate
Civilian labor force Employed Unemployed Rate
Civilian labor force Employed Unemployed Rate
Civilian labor force Employed Unemployed Rate
Civilian labor force Employed Unemployed Rate
Civilian labor force Employed Unemployed Rate
Civilian labor force Employed Unemployed Rate
Civilian labor force Employed Unemployed Rate
Civilian labor force Employed Unemployed Rate
Preliminary AUG 2015
4,732,365 4,455,050
277,315 5.9
4,727,267 4,445,740
281,527 6.0
63,438 58,756
4,682 7.4
93,651 88,409
5,242 5.6
2,810,168 2,650,797
159,371 5.7
256,914 240,158
16,756 6.5
48,878 45,715
3,163 6.5
125,786 116,989
8,797 7.0
60,136 56,322
3,814 6.3
90,112 85,767 4,345
4.8
Revised JUL 2015
4,743,943 4,460,741
283,202 6.0
4,771,817 4,464,036
307,781 6.4
64,140 59,055
5,085 7.9
93,750 87,840
5,910 6.3
2,840,231 2,667,625
172,606 6.1
258,627 240,494
18,133 7.0
50,547 47,113 3,434
6.8
127,526 118,055
9,471 7.4
60,856 56,393
4,463 7.3
90,549 85,643
4,906 5.4
Revised AUG 2014
4,738,502 4,404,059
334,443 7.1
4,759,336 4,391,670
367,666 7.7
65,856 59,817 6,039
9.2
94,231 87,518 6,713
7.1
2,812,866 2,606,620
206,246 7.3
255,804 235,348
20,456 8.0
50,312 46,143
4,169 8.3
126,607 115,848
10,759 8.5
61,591 55,820
5,771 9.4
90,134 84,305
5,829 6.5
Change From
JUL 2015
AUG 2014
-11,578 -5,691 -5,887
-6,137 50,991 -57,128
-44,550 -18,296 -26,254
-32,069 54,070 -86,139
-702 -299 -403
-2,418 -1,061 -1,357
-99 569 -668
-580 891 -1,471
-30,063 -16,828 -13,235
-2,698 44,177 -46,875
-1,713 -336
-1,377
1,110 4,810 -3,700
-1,669 -1,398
-271
-1,434 -428
-1,006
-1,740 -1,066
-674
-821 1,141 -1,962
-720 -71
-649
-1,455 502
-1,957
-437 124 -561
-22 1,462 -1,484
Note: MSA data are not seasonally adjusted. Employment includes nonagricultural wage and salary employment, self-employment, unpaid family and private
household workers and agricultural workers. Persons in labor disputes are counted as employed. The use of unrounded data does not imply that the numbers are exact. Georgia and Metropolitan Statistical Area data have not been seasonally adjusted.
Albany MSA: Baker, Dougherty, Lee, Terrell, and Worth counties. Athens - Clarke County MSA: Clarke, Madison, Oconee, and Oglethorpe counties. Atlanta MSA: Barrow, Bartow, Butts, Carroll, Cherokee, Clayton, Cobb, Coweta, Dawson, DeKalb, Douglas, Fayette, Forsyth, Fulton, Gwinnett, Haralson, Heard, Henry, Jasper, Lamar, Meriwether, Morgan, Newton, Paulding, Pickens, Pike, Rockdale, Spalding, and Walton counties. Augusta - Richmond County MSA: Burke, Columbia, Lincoln, McDuffie, and Richmond counties in Georgia and Aiken and Edgefield counties in South Carolina. Brunswick MSA: Brantley, Glynn, and McIntosh counties. Columbus MSA: Chattahoochee, Harris, Marion, and Muscogee counties in Georgia and Russell County in Alabama. Dalton MSA: Murray and Whitfield counties. Gainesville MSA: Hall County. Hinesville MSA: Liberty and Long counties. Macon MSA: Bibb, Crawford, Jones, Monroe, and Twiggs counties. Rome MSA: Floyd County. Savannah MSA: Bryan, Chatham, and Effingham counties. Valdosta MSA: Brooks, Echols, Lanier, and Lowndes counties. Warner Robins MSA: Houston, Peach and Pulaski counties.
Source: Georgia Department of Labor, Workforce Statistics & Economic Research
15
Georgia Labor Force Estimates (not seasonally adjusted) Place of Residence - Persons 16 Years and Older
Hinesville MSA Macon MSA Rome MSA
Savannah MSA Valdosta MSA Warner Robins MSA
Employment Status
Civilian labor force Employed Unemployed Rate
Civilian labor force Employed Unemployed Rate
Civilian labor force Employed Unemployed Rate
Civilian labor force Employed Unemployed Rate
Civilian labor force Employed Unemployed Rate
Civilian labor force Employed Unemployed Rate
Preliminary AUG 2015
31,635 29,646
1,989 6.3
101,529 94,895
6,634 6.5
42,210 39,422
2,788 6.6
172,631 162,960
9,671 5.6
60,485 56,739
3,746 6.2
78,561 73,601
4,960 6.3
Revised JUL 2015
31,377 29,230
2,147 6.8
102,571 95,410 7,161 7.0
42,592 39,379
3,213 7.5
174,880 164,282
10,598 6.1
60,843 56,687
4,156 6.8
79,356 73,909
5,447 6.9
Revised AUG 2014
32,559 29,883
2,676 8.2
103,929 95,278 8,651 8.3
42,910 39,275
3,635 8.5
174,104 160,857
13,247 7.6
62,989 58,010
4,979 7.9
81,539 75,099
6,440 7.9
Change From
JUL 2015
AUG 2014
258
-924
416
-237
-158
-687
-1,042 -515 -527
-2,400 -383
-2,017
-382 43
-425
-700 147 -847
-2,249 -1,322
-927
-1,473 2,103 -3,576
-358 52
-410
-2,504 -1,271 -1,233
-795 -308 -487
-2,978 -1,498 -1,480
Area United States
(Seasonally adjusted)
United States
(Not Seasonally adjusted)
United States Labor Force Estimates Place of Residence - Persons 16 Years and Older
Employment Status
Civilian labor force Employed Unemployed Rate
AUG 2015
157,065,000 149,036,000
8,029,000 5.1
JUL 2015
157,106,000 148,840,000
8,266,000 5.3
AUG 2014
156,018,000 146,451,000
9,568,000 6.1
Civilian labor force Employed Unemployed
Rate
157,390,000 149,228,000
8,162,000 5.2
158,527,000 149,722,000
8,805,000 5.6
156,434,000 146,647,000
9,787,000 6.3
Change From
JUL 2015
AUG 2014
-41,000 196,000 -237,000
1,047,000 2,585,000 -1,539,000
-1,137,000 -494,000 -643,000
956,000 2,581,000 -1,625,000
Note: Employment includes nonagricultural wage and salary employment, self-employment, unpaid family and private household workers and agricultural
workers. Persons in labor disputes are counted as employed. The use of unrounded data does not imply that the numbers are exact. Georgia and Metropolitan Statistical Area data have not been seasonally adjusted. Seasonally adjusted data for Georgia available upon request.
Albany MSA: Baker, Dougherty, Lee, Terrell, and Worth counties. Athens - Clarke County MSA: Clarke, Madison, Oconee, and Oglethorpe counties. Atlanta MSA: Barrow, Bartow, Butts, Carroll, Cherokee, Clayton, Cobb, Coweta, Dawson, DeKalb, Douglas, Fayette, Forsyth, Fulton, Gwinnett, Haralson, Heard, Henry, Jasper, Lamar, Meriwether, Morgan, Newton, Paulding, Pickens, Pike, Rockdale, Spalding, and Walton counties. Augusta - Richmond County MSA: Burke, Columbia, Lincoln, McDuffie, and Richmond counties in Georgia and Aiken and Edgefield counties in South Carolina. Brunswick MSA: Brantley, Glynn, and McIntosh counties. Columbus MSA: Chattahoochee, Harris, Marion, and Muscogee counties in Georgia and Russell County in Alabama. Dalton MSA: Murray and Whitfield counties. Gainesville MSA: Hall County. Hinesville MSA: Liberty and Long counties. Macon MSA: Bibb, Crawford, Jones, Monroe, and Twiggs counties. Rome MSA: Floyd County. Savannah MSA: Bryan, Chatham, and Effingham counties. Valdosta MSA: Brooks, Echols, Lanier, and Lowndes counties. Warner Robins MSA: Houston, Peach and Pulaski counties.
Source: Georgia Department of Labor, Workforce Statistics & Economic Research
16
Georgia Labor Force Estimates by County (not seasonally adjusted)
Georgia
Place of Residence - Persons 16 Years and Older
Preliminary August 2015
Revised July 2015
Labor Force
Employment
Unemployment Number Rate
4,727,267 4,445,740 281,527 6.0
Labor Force
Employment
Unemployment Number Rate
4,771,817 4,464,036 307,781 6.4
Revised August 2014
Labor Force
Employment
Unemployment Number Rate
4,759,336 4,391,670 367,666 7.7
Appling Atkinson Bacon Baker Baldwin
8,572
7,915
657 7.7
3,663 3,468
195 5.3
4,999 4,728
271 5.4
1,111 1,024
87 7.8
17,647 16,278 1,369 7.8
8,586
7,877
709 8.3
3,646 3,427
219 6.0
4,972 4,667 305 6.1
1,109 1,015
94 8.5
17,543 16,047 1,496 8.5
8,769 3,696 4,978 1,157 17,889
7,922 3,405 4,619 1,046 16,116
847 9.7 291 7.9 359 7.2 111 9.6 1,773 9.9
Banks Barrow Bartow Ben Hill Berrien
8,198 7,764 434 5.3
34,945 33,138 1,807 5.2
47,047 44,370 2,677 5.7
5,379 4,882
497 9.2
7,273 6,787
486 6.7
8,184 7,680 504 6.2
35,306 33,304 2,002 5.7
47,587 44,591 2,996 6.3
5,440
4,918
522 9.6
7,319 6,765 554 7.6
8,149 34,947 47,203
5,590 7,109
7,567 32,570 43,623
4,971 6,423
582 7.1 2,377 6.8 3,580 7.6
619 11.1 686 9.6
Bibb Bleckley Brantley Brooks Bryan
67,363 62,831 4,532 6.7
4,399 4,011
388 8.8
6,732 6,211
521 7.7
6,504 6,095
409 6.3
15,440 14,618
822 5.3
68,054 63,167 4,887 7.2
4,412 3,978 434 9.8
6,998 6,432 566 8.1
6,551 6,095
456 7.0
15,667 14,752
915 5.8
69,025 4,575 6,972 6,791
15,531
63,061 4,011 6,296 6,251
14,441
5,964 8.6 564 12.3 676 9.7 540 8.0
1,090 7.0
Bulloch Burke Butts Calhoun Camden
34,896 32,779 2,117 6.1
9,237 8,455
782 8.5
10,277 9,556
721 7.0
2,170 2,035
135 6.2
22,412 21,175 1,237 5.5
34,543 9,310
10,355 2,117
22,500
32,150 2,393 6.9
8,431
879 9.4
9,598
757 7.3
1,971
146 6.9
21,149 1,351 6.0
34,417 9,318
10,211 2,190
21,769
31,649 8,332 9,393 2,018 20,152
2,768 8.0 986 10.6 818 8.0 172 7.9
1,617 7.4
Candler Carroll Catoosa Charlton Chatham
5,084 4,811
273 5.4
51,716 48,316 3,400 6.6
30,762 29,163 1,599 5.2
4,739 4,425
314 6.6
130,924 123,412 7,512 5.7
5,093 4,779
314 6.2
52,467 48,662 3,805 7.3
30,971 29,184 1,787 5.8
4,774 4,433
341 7.1
132,624 124,437 8,187 6.2
5,080 4,685
395 7.8
52,098 47,559 4,539 8.7
30,940 28,803 2,137 6.9
4,834 4,422
412 8.5
132,215 121,823 10,392 7.9
Chattahoochee 2,381
Chattooga 10,531
Cherokee 117,224
Clarke
57,261
Clay
890
2,173 9,892 111,750 53,803
789
208 8.7 639 6.1 5,474 4.7 3,458 6.0 101 11.3
2,405 10,514 118,643 57,312
895
2,179 9,777 112,606 53,394
785
226 9.4 737 7.0 6,037 5.1 3,918 6.8 110 12.3
2,413 10,442 117,055 57,571
936
2,156 9,606 109,956 53,216
832
257 10.7 836 8.0 7,099 6.1 4,355 7.6 104 11.1
Clayton Clinch Cobb Coffee Colquitt
124,456 115,095 9,361 7.5
2,769 2,576
193 7.0
393,452 373,539 19,913 5.1
18,076 16,962 1,114 6.2
19,396 18,121 1,275 6.6
125,477 115,614 9,863 7.9
2,737 2,541
196 7.2
397,823 376,171 21,652 5.4
18,127 16,873 1,254 6.9
19,274 17,898 1,376 7.1
125,353 113,071 12,282 9.8 2,769 2,516 253 9.1
393,186 367,403 25,783 6.6 17,522 15,977 1,545 8.8 20,677 18,868 1,809 8.7
Columbia Cook Coweta Crawford Crisp
64,857 7,145
66,857 5,526 9,108
61,475 6,659 63,139 5,174 8,463
3,382 5.2 486 6.8
3,718 5.6 352 6.4 645 7.1
65,429 61,684 3,745 5.7
7,167 6,645
522 7.3
67,431 63,478 3,953 5.9
5,573 5,194
379 6.8
9,175 8,476 699 7.6
Source: Georgia Department of Labor, Workforce Statistics & Economic Research
64,796 7,365
66,612 5,643 9,449
60,591 6,702
62,065 5,199 8,535
4,205 6.5 663 9.0
4,547 6.8 444 7.9 914 9.7
17
Georgia Labor Force Estimates by County (not seasonally adjusted)
Dade Dawson Decatur DeKalb Dodge
Place of Residence - Persons 16 Years and Older
Preliminary August 2015
Revised July 2015
Labor Force
Employment
Unemployment Number Rate
7,886 7,433 453 5.7
10,809 10,278
531 4.9
11,085 10,323
762 6.9
369,811 347,758 22,053 6.0
6,984 6,391
593 8.5
Labor Force
Employment
Unemployment Number Rate
8,054 7,534
520 6.5
10,989 10,387 602 5.5
11,070 10,244
826 7.5
373,584 349,894 23,690 6.3
7,091 6,457 634 8.9
Dooly Dougherty Douglas Early Echols
4,527 4,181 346 7.6
36,838 33,842 2,996 8.1
67,586 63,369 4,217 6.2
4,246 3,949
297 7.0
1,780 1,692
88 4.9
4,558
4,181
377 8.3
37,270 34,032 3,238 8.7
68,291 63,778 4,513 6.6
4,236 3,906 330 7.8
1,773
1,671
102 5.8
Effingham Elbert Emanuel Evans Fannin
26,267 24,930 1,337 5.1
7,711
7,150
561 7.3
8,279
7,574
705 8.5
4,696 4,443
253 5.4
9,870 9,295
575 5.8
26,589 25,093 1,496 5.6
7,756
7,152
604 7.8
8,313 7,543
770 9.3
4,672 4,388 284 6.1
10,060 9,404 656 6.5
Fayette Floyd Forsyth Franklin Fulton
54,223 51,370 2,853 5.3 42,210 39,422 2,788 6.6 98,025 93,609 4,416 4.5
8,925 8,335 590 6.6 511,816 481,451 30,365 5.9
54,771 51,641 3,130 5.7
42,592 39,379 3,213 7.5
99,060 94,198 4,862 4.9
8,985 8,338
647 7.2
517,048 484,404 32,644 6.3
Gilmer Glascock Glynn Gordon Grady
11,700 11,022
678 5.8
1,254 1,164
90 7.2
36,389 34,140 2,249 6.2
25,867 24,390 1,477 5.7
10,252 9,636
616 6.0
11,907 11,151
756 6.3
1,230 1,143
87 7.1
37,617 35,181 2,436 6.5
26,022 24,362 1,660 6.4
10,320 9,598
722 7.0
Greene
6,313 5,890
423 6.7
Gwinnett 443,057 420,044 23,013 5.2
Habersham 18,703 17,673 1,030 5.5
Hall
90,112 85,767 4,345 4.8
Hancock
2,515 2,263
252 10.0
6,393 5,921
472 7.4
448,399 423,306 25,093 5.6
18,673 17,498 1,175 6.3
90,549 85,643 4,906 5.4
2,491 2,214
277 11.1
Haralson Harris Hart Heard Henry
11,905 11,172
733 6.2
15,367 14,558 809 5.3
10,143 9,483 660 6.5
5,005 4,689
316 6.3
104,178 97,784 6,394 6.1
12,092 11,270 822 6.8
15,597 14,690 907 5.8
10,241
9,515
726 7.1
5,066 4,717 349 6.9
104,960 98,082 6,878 6.6
Houston Irwin Jackson Jasper Jeff Davis
63,452 59,654 3,798 6.0
3,077 2,825
252 8.2
30,278 28,871 1,407 4.6
6,519 6,175 344 5.3
6,471 6,042
429 6.6
64,067 59,886 4,181 6.5
3,053 2,781
272 8.9
30,504 28,892 1,612 5.3
6,604 6,217
387 5.9
6,472 6,003 469 7.2
Revised August 2014
Labor Force
Employment
Unemployment Number Rate
7,963 7,392
571 7.2
10,860 10,140
720 6.6
11,528 10,518 1,010 8.8
370,787 341,844 28,943 7.8
7,487 6,695
792 10.6
4,720 38,349 67,658
4,345 1,848
4,245 34,444 62,305
3,879 1,732
475 10.1 3,905 10.2 5,353 7.9
466 10.7 116 6.3
26,358 8,087 8,501 4,750 9,814
24,593 7,363 7,563 4,411 9,012
1,765 6.7 724 9.0 938 11.0 339 7.1 802 8.2
54,176 50,481 3,695 6.8
42,910 39,275 3,635 8.5
97,673 92,061 5,612 5.7
9,190 8,299
891 9.7
512,692 473,359 39,333 7.7
11,924 1,268 37,385 26,156 10,468
10,962 1,157
34,430 24,091
9,600
962 8.1 111 8.8 2,955 7.9 2,065 7.9 868 8.3
6,418 5,851
567 8.8
442,851 413,309 29,542 6.7
19,012 17,611 1,401 7.4
90,134 84,305 5,829 6.5
2,587 2,250
337 13.0
11,992 15,492 10,257
5,037 103,978
11,001 14,457
9,374 4,617 95,977
991 8.3 1,035 6.7
883 8.6 420 8.3 8,001 7.7
65,750 3,188
29,622 6,549 6,461
60,846 2,844 27,694 6,086 5,889
4,904 7.5 344 10.8
1,928 6.5 463 7.1 572 8.9
Source: Georgia Department of Labor, Workforce Statistics & Economic Research
18
Georgia Labor Force Estimates by County (not seasonally adjusted)
Jefferson Jenkins Johnson Jones Lamar
Place of Residence - Persons 16 Years and Older
Preliminary August 2015
Revised July 2015
Labor Force
6,477 3,210 3,816 13,283 7,734
Employment
5,893 2,952 3,553 12,543 7,135
Unemployment Number Rate
584 9.0 258 8.0 263 6.9 740 5.6 599 7.7
Labor Force
6,518 3,239 3,826 13,410 7,847
Employment
5,854 2,937 3,539 12,614 7,203
Unemployment Number Rate
664 10.2 302 9.3 287 7.5 796 5.9 644 8.2
Lanier Laurens Lee Liberty Lincoln
3,658 3,416
242 6.6
18,356 16,951 1,405 7.7
13,414 12,664
750 5.6
25,146 23,547 1,599 6.4
3,374 3,155
219 6.5
3,697 3,426
271 7.3
18,463 16,929 1,534 8.3
13,559 12,739
820 6.0
24,930 23,208 1,722 6.9
3,405
3,153
252 7.4
Long Lowndes Lumpkin McDuffie McIntosh
6,489 6,099 390 6.0
48,543 45,536 3,007 6.2
15,417 14,594
823 5.3
8,840 8,092
748 8.5
5,757 5,364 393 6.8
6,447 6,022
425 6.6
48,822 45,495 3,327 6.8
15,288 14,353 935 6.1
8,897 8,095 802 9.0
5,932 5,500
432 7.3
Macon Madison Marion Meriwether Miller
4,584 12,688
3,432 8,849 2,680
4,180 12,019
3,105 8,124 2,540
404 8.8 669 5.3 327 9.5 725 8.2 140 5.2
4,613 12,731 3,475 8,995 2,661
4,176 11,975
3,139 8,188 2,504
437 9.5 756 5.9 336 9.7 807 9.0 157 5.9
Mitchell Monroe Montgomery Morgan Murray
8,531 12,410 3,759 8,377 15,740
7,941 11,664 3,420
7,939 14,599
590 6.9 746 6.0 339 9.0 438 5.2 1,141 7.2
8,548 7,898 650 7.6 12,559 11,755 804 6.4
3,752 3,402 350 9.3 8,516 8,016 500 5.9 15,898 14,612 1,286 8.1
Muscogee Newton Oconee Oglethorpe Paulding
79,884 74,016 5,868 7.3
48,003 44,787 3,216 6.7
17,002 16,256
746 4.4
6,700 6,331 369 5.5
75,198 71,371 3,827 5.1
81,035 74,683 6,352 7.8
48,445 45,022 3,423 7.1
17,033 16,196
837 4.9
6,674 6,275 399 6.0
75,915 71,708 4,207 5.5
Peach Pickens Pierce Pike Polk
11,146 10,248 898 8.1
13,803 13,098
705 5.1
7,959 7,447
512 6.4
8,313 7,834
479 5.8
17,955 16,786 1,169 6.5
11,267 10,303 964 8.6
13,962 13,176
786 5.6
8,009 7,453 556 6.9
8,413 7,899
514 6.1
18,156 16,851 1,305 7.2
Pulaski Putnam Quitman Rabun Randolph
3,963 7,798
861 6,416 2,605
3,699 7,193
798 6,002 2,379
264 6.7 605 7.8
63 7.3 414 6.5 226 8.7
4,022 7,944
868 6,698 2,605
3,720 7,245
803 6,239 2,359
302 7.5 699 8.8
65 7.5 459 6.9 246 9.4
Revised August 2014
Labor Force
6,621 3,288 3,896 13,562 7,806
Employment
5,835 2,945 3,541 12,602 7,028
Unemployment Number Rate
786 11.9 343 10.4 355 9.1 960 7.1 778 10.0
3,816 18,778 13,861 25,889 3,406
3,496 16,888 12,893 23,724
3,118
320 8.4 1,890 10.1
968 7.0 2,165 8.4
288 8.5
6,670 50,534 15,151
8,939 5,955
6,159 46,531 14,056
7,965 5,417
511 7.7 4,003 7.9 1,095 7.2
974 10.9 538 9.0
4,587 12,830
3,356 8,958 2,706
4,020 11,914 3,088 8,010 2,514
567 12.4 916 7.1 268 8.0 948 10.6 192 7.1
8,876 12,656
3,945 8,430 16,236
8,105 11,729 3,525 7,848 14,475
771 8.7 927 7.3 420 10.6 582 6.9 1,761 10.8
80,881 48,159 17,085
6,745 75,122
73,405 44,033 16,113
6,275 70,133
7,476 9.2 4,126 8.6
972 5.7 470 7.0 4,989 6.6
11,656 13,852
8,074 8,336 18,164
10,471 12,877
7,427 7,720 16,675
1,185 10.2 975 7.0 647 8.0 616 7.4
1,489 8.2
4,133 8,063
885 6,719 2,717
3,782 7,267
806 6,172 2,422
351 8.5 796 9.9
79 8.9 547 8.1 295 10.9
Source: Georgia Department of Labor, Workforce Statistics & Economic Research
19
Georgia Labor Force Estimates by County (not seasonally adjusted)
Richmond Rockdale Schley Screven Seminole
Place of Residence - Persons 16 Years and Older
Preliminary August 2015
Revised July 2015
Labor Force
Employment
Unemployment Number Rate
Labor Force
Employment
Unemployment Number Rate
84,904 78,488 6,416 7.6
42,166 39,482 2,684 6.4
2,103 1,966
137 6.5
5,154 4,730
424 8.2
3,057 2,816
241 7.9
85,533 78,486 7,047 8.2
42,616 39,730 2,886 6.8
2,118 1,964
154 7.3
5,170 4,684 486 9.4
3,123 2,853
270 8.6
Spalding Stephens Stewart Sumter Talbot
27,584 25,362 2,222 8.1
10,655 9,983
672 6.3
2,176 2,033
143 6.6
13,229 12,145 1,084 8.2
2,747 2,552
195 7.1
27,900 25,507 2,393 8.6
10,825 10,076
749 6.9
2,184 2,022
162 7.4
13,234 12,093 1,141 8.6
2,805 2,565
240 8.6
Taliaferro Tattnall Taylor Telfair Terrell
582 9,398 2,722 4,755 3,430
536 8,835 2,466 4,350 3,158
46 7.9 563 6.0 256 9.4 405 8.5 272 7.9
590 9,435 2,735 4,777 3,466
539 8,798 2,471 4,341 3,177
51 8.6 637 6.8 264 9.7 436 9.1 289 8.3
Thomas Tift Toombs Towns Treutlen
16,287 15,097 1,190 7.3
17,979 16,872 1,107 6.2
11,915 10,847 1,068 9.0
4,090 3,804
286 7.0
2,743 2,517
226 8.2
16,457 15,107 1,350 8.2
17,991 16,797 1,194 6.6
11,916 10,826 1,090 9.1
3,952 3,635
317 8.0
2,802 2,545
257 9.2
Troup Turner Twiggs Union Upson
36,598 34,448 2,150 5.9
3,187 2,982
205 6.4
2,947 2,683
264 9.0
9,593
9,110
483 5.0
11,141 10,310
831 7.5
36,840 34,309 2,531 6.9
3,179 2,954
225 7.1
2,975 2,680
295 9.9
9,683 9,137 546 5.6
11,221 10,330
891 7.9
Walker
29,142 27,448 1,694 5.8
Walton
41,233 39,063 2,170 5.3
Ware
14,598 13,643
955 6.5
Warren
2,692 2,447
245 9.1
Washington
7,396 6,897
499 6.7
29,359 27,450 1,909 6.5
41,669 39,258 2,411 5.8
14,677 13,626 1,051 7.2
2,667 2,443
224 8.4
7,441
6,874
567 7.6
Wayne Webster Wheeler White Whitfield
11,588 1,026 1,687
13,892 44,396
10,701 920
1,499 13,223 41,723
887 7.7 106 10.3 188 11.1 669 4.8 2,673 6.0
11,627 1,022 1,682 14,070 44,958
10,675 911
1,486 13,289 41,781
952 8.2 111 10.9 196 11.7 781 5.6 3,177 7.1
Wilcox Wilkes Wilkinson Worth
2,762 3,721 3,636 8,645
2,552 3,452 3,372 8,068
210 7.6 269 7.2 264 7.3 577 6.7
2,759 3,764 3,651 8,736
2,534 3,459 3,352 8,092
225 8.2 305 8.1 299 8.2 644 7.4
Revised August 2014
Labor Force
Employment
Unemployment Number Rate
85,095 42,360
2,153 5,492 3,190
77,209 38,818
1,978 4,929 2,861
7,886 9.3 3,542 8.4
175 8.1 563 10.3 329 10.3
27,671 11,084
2,193 13,590
2,831
24,940 10,160 2,016 12,219 2,602
2,731 9.9 924 8.3 177 8.1
1,371 10.1 229 8.1
605 9,629 2,862 4,846 3,517
534 8,893 2,555 4,319 3,216
71 11.7 736 7.6 307 10.7 527 10.9 301 8.6
17,442 18,065 12,485
4,164 2,778
15,809 16,636 11,188
3,781 2,475
1,633 9.4 1,429 7.9 1,297 10.4
383 9.2 303 10.9
36,409 3,208 3,043 9,448 11,235
33,546 2,941 2,687 8,800 10,148
2,863 7.9 267 8.3 356 11.7 648 6.9
1,087 9.7
29,369 41,254 14,872
2,749 7,516
27,116 38,393 13,585
2,422 6,840
2,253 7.7 2,861 6.9 1,287 8.7
327 11.9 676 9.0
11,779 1,008 1,904 13,946 45,355
10,680 923
1,656 13,018 41,345
1,099 9.3 85 8.4
248 13.0 928 6.7 4,010 8.8
2,880 3,806 3,714 8,972
2,593 3,435 3,365 8,218
287 10.0 371 9.7 349 9.4 754 8.4
Source: Georgia Department of Labor, Workforce Statistics & Economic Research
20
New Developments
Performance Food Group recently announced plans to expand its Performance Foodservice Milton's food distribution facility in Oakwood, GA. The expansion project will include construction of a new 174,000-square foot building to be built on 43 acres of land adjacent to the current facility located at 3501 Old Oakwood Road. The new building will feature a freezer, meat cutting operation, maintenance areas and space for fleet operations. The project is scheduled for completion in 2016. The company distributes fresh meats and produce, dry groceries, frozen and refrigerated products, and restaurant supplies. Customers include local and multichain restaurants, country clubs, daycare centers, hospitals, schools, nursing homes and correctional facilities primarily located in Georgia, Alabama, North Carolina and South Carolina.
Kodak will invest $28 million to expand its production facility in Columbus and create 240 jobs. Rochester, N.Y.-based Eastman Kodak Co. recently announced that it will manufacture the popular Kodak Sonora Process Free Plate in the U.S. for the first time and that the Columbus facility will serve as the sole manufacturer of all the plates sold in the Americas. The plant in east Columbus is located inside Corporate Ridge Business Park. Kodak has said demand for its Sonora plates have risen amid the trend toward environmentally friendly printing and printers using Sonora plates do not require water, chemicals and the energy typically needed to process them. They also do the job without losing the quality that traditional printing plates offer. The Columbus plant is also certified in manufacturing lithographic printing plates from sheet aluminum, a process that includes electrochemical etching, surface treatment and solvent-based coating processes. Printers and publishers are among the customers who use the plates.
Primetals Technologies, a global leader in engineering, plant-building, and lifecycle partnership for the metals industry, is investing
more than $2 million over the next five years and is relocating 140 current staff to its new headquarters in Alpharetta. Formed in 2015 through a joint venture of Siemens and Mitsubishi Heavy Industries, Primetals Technologies offers a complete technology, product, and service portfolio that includes integrated electrics, automation and environmental solutions for the metals industry.
Black & Decker has leased 5,000 square feet of office space at Ten 10th St. in Atlanta. The company plans to open an innovation center at the location. The tool and equipment maker is the latest in a number of corporations establishing research and development centers in the area.
The Chicago-based online job site CareerBuilder plans to expand in the Buckhead area. The company is leasing more than 30,000 square feet on two floors at the 13-story Two Live Oak across from Lenox Square Mall in Atlanta. CareerBuilder currently employs over 600 at its IT headquarters in Gwinnett's Peachtree Corners. CareerBuilder operates sites in 23 countries outside the U.S., and has a presence in over 60 markets. The new Buckhead office will be CareerBuilder's sales hub. Technology and support teams will be based in Peachtree Corners.
A merican Home Products has announced that it will be relocating and consolidating parts of its operations to Gainesville. This relocation will be home for their new corporate headquarters and manufacturing facility in an $8 million capital investment. The company is expected to create 210 new jobs in the area. American Home just completed purchase of a 300,000 square foot building in Gainesville Industrial Park that has been unoccupied since 2009. It includes 270,000 square feet of manufacturing space and 30,000 square feet of administrative space.
Note: Information in New Developments are from a variety of public sources and by no means are a comprehensive listing of new and expanding business in Georgia
Source: Georgia Department of Labor, Workforce Statistics and Economic Research
21
UNGEMeorPgLiaOUYnMemEpNloTymReAntTREaBteYs bCy OCUouNntTyIES
AUGUST 2015
August 2015
Dade 5.7
Catoosa 5.2
Walker
Whitfield
Murray 7.2
Fannin 5.8
Union 5.0
Towns 7.0
Rabun 6.5
5.8
6.0
Chattooga 6.1
Gordon 5.7
Floyd 6.6
Bartow 5.7
Gilmer 5.8
Pickens 5.1
Cherokee 4.7
Lumpkin 5.3
Dawson 4.9
Forsyth 4.5
White Habersham
4.8
5.5
Stephens
6.3
Hall 4.8
Banks Franklin
5.3
6.6
Jackson 4.6
Madison 5.3
Hart 6.5
Elbert 7.3
8.0% or greater 30 counties (19%)
7.0% to 7.9% 30 counties (19%)
6.0% to 6.9% 52 counties (33%)
Polk 6.5
Paulding
Cobb 5.1
Gwinnett 5.2
Barrow 5.2
Clarke 6.0
Oglethorpe 5.5
Less than 6.0% 47 counties (30%)
Haralson 6.2
Carroll 6.6
Heard 6.3
5.1 Douglas 6.2
Coweta 5.6
Fulton 5.9
DeKalb 6.0 Rockdale
Walton 5.3
Oconee 4.4
Wilkes 7.2
Lincoln 6.5
Percentages of number of counties may not total 100 due to rounding
Clayton
7.5
Fayette 5.3
Henry 6.1
Spalding 8.1
6.4 Newton 6.7
Morgan 5.2
Butts 7.0
Jasper 5.3
Putnam 7.8
Greene 6.7
Taliaferro
7.9
McDuffie
Warren 8.5
Columbia 5.2
9.1
Richmond
Hancock
7.6
10.0
Glascock
7.2
Troup 5.9
Meriwether 8.2
Pike 5.8
Lamar 7.7
Monroe 6.0
Jones 5.6
Baldwin 7.8
Washington
Jefferson 9.0
Burke 8.5
Upson
6.7
Harris 5.3
Talbot 7.1
Muscogee 7.3
Marion Chattahoochee 9.5
7.5
Taylor 9.4
Crawford 6.4
Bibb 6.7
Twiggs 9.0
Wilkinson 7.3
Peach
8.1
Macon 8.8
Houston 6.0
Bleckley 8.8
Laurens 7.7
Johnson 6.9
Emanuel 8.5
Jenkins 8.0
Screven 8.2
Treutlen 8.2
Candler 5.4
Bulloch 6.1
Effingham 5.1
8.7
Stewart 6.6
Schley 6.5
Webster 10.3
Sumter 8.2
Quitman
7.3 Randolph 8.7
Terrell 7.9
Lee 5.6
Clay 11.3
Calhoun 6.2
Dougherty 8.1
Early 7.0
Miller 5.2
Baker 7.8
Mitchell 6.9
Dooly 7.6
Pulaski 6.7
Dodge 8.5
Crisp 7.1
Wilcox 7.6
Turner 6.4
Ben Hill 9.2
Montgomery
Wheeler 11.1
9.0
Toombs 9.0
Evans 5.4
Tattnall
Telfair
6.0
8.5
Jeff Davis 6.6
Appling 7.7
Long 6.0
Bryan 5.3
Liberty 6.4
Worth 6.7
Colquitt 6.6
Irwin
8.2 Tift 6.2
Coffee 6.2
Berrien
Atkinson
6.7
5.3
Cook
6.8 Lanier
Bacon 5.4
Wayne 7.7
Pierce 6.4
Ware 6.5
Brantley 7.7
McIntosh 6.8
Glynn 6.2
Chatham 5.7
Seminole 7.9
Decatur 6.9
Grady 6.0
Thomas 7.3
Brooks 6.3
6.6
Lowndes 6.2
Clinch 7.0
Charlton 6.6
Camden 5.5
Echols
4.9
Georgia's Unemployment Rate: 6.0%
Georgia's(NUont Seemasopnlaollyy mAdejunsttedR) ate: 6.0% (not seasonally adjusted) Source: Georgia Department of Labor, Workforce Statistics and Economic Research
22
Georgia Unemployment Insurance Claims by County
County
August 2015 Average Average Initial Weekly Duration
Claims Benefit Weeks
County
August 2015 Average Average Initial Weekly Duration
Claims Benefit Weeks
County
August 2015 Average Average Initial Weekly Duration
Claims Benefit Weeks
Georgia
26,335........ $273.........9.5
Appling
151........ $266.........8.9
Atkinson
28........ $211.........6.2
Bacon
17........ $238.........8.0
Baker
8........ $281.........9.2
Baldwin
104........$212....... 11.1
Banks
49........ $245.........7.7
Barrow
143........ $252.........9.6
Bartow
248........ $248.........8.4
Ben Hill
105........ $198.........7.1
Berrien
32........ $233.........4.3
Bibb
399........$195....... 11.5
Bleckley
31........$192....... 11.6
Brantley
34........ $246.........9.6
Brooks
25........$207....... 11.6
Bryan
52........$237....... 11.6
Bulloch
185........ $210.........8.5
Burke
81........ $224.........9.2
Butts
81........ $242.......10.3
Calhoun
12........ $197.........8.7
Camden
72........$234....... 11.2
Candler
22........ $240.........8.5
Carroll
248........ $234.........7.7
Catoosa
72........ $242.........7.1
Charlton
13........ $246.......12.2
Chatham
675........$227....... 11.3
Chattahoochee 16........$260.......12.8
Chattooga
31........ $255.......10.9
Cherokee
344........ $272.......10.5
Clarke
213........ $213.......10.0
Clay
7........$198....... 11.7
Clayton
922........$234....... 11.4
Clinch
24........ $179.........9.8
Cobb
1,419........$263....... 11.8
Coffee
99........ $229.........7.2
Colquitt
143........ $212.......10.8
Columbia
222........ $262.......10.1
Cook
40........ $225.........7.3
Coweta
524........ $267.........8.8
Crawford
32........ $235.........9.6
Crisp
63........ $209.......10.6
Dade
16........ $207.........7.5
Dawson
36........ $285.........9.8
Decatur
76........ $229.........8.8
DeKalb
1,973........ $240.......12.0
Dodge
66........ $206.......10.7
Dooly
23........ $185.......10.5
Dougherty
318........$201....... 11.3
Douglas
348........$257....... 11.3
Early
17........$222....... 11.6
Echols
7........ $227.........8.3
Effingham
97........ $257.......10.0
Elbert Emanuel Evans Fannin Fayette Floyd Forsyth Franklin Fulton Gilmer Glascock Glynn Gordon Grady Greene Gwinnett Habersham Hall Hancock Haralson Harris Hart Heard Henry Houston Irwin Jackson Jasper Jeff Davis Jefferson Jenkins Johnson Jones Lamar Lanier Laurens Lee Liberty Lincoln Long Lowndes Lumpkin Macon Madison Marion McDuffie McIntosh Meriwether Miller Mitchell Monroe Montgomery Morgan Murray
148........ $184.........6.8 157........ $197.........9.0
23........ $245.........9.1 34........ $206.........9.5 161........ $259.......10.9 316........ $240.........7.4 214........ $284.......10.9 88........ $223.........7.1 2,608........$247....... 11.8 47........ $251.........7.3 21........ $206.........8.0 166........$221....... 11.2 177........ $245.........6.1 79........ $200.........7.8 33........ $225.......10.9 1,593........$260....... 11.3 184........ $233.........6.9 290........ $250.........9.4 28........ $196.........8.1 54........ $237.........7.6 51........ $251.........8.0 101........ $234.........7.2 47........ $275.........6.0 499........$262....... 11.1 310........ $223.......10.5 28........ $213.........8.3 106........ $256.........8.7 32........ $229.........8.3 43........ $223.........8.2 82........ $203.......10.0 21........ $205.........8.9 43........$186....... 11.3 60........ $236.......10.9 54........ $231.........8.2 15........ $197.........9.1 218........ $192.......10.2 87........ $236.........8.6 112........ $220.......12.6 29........ $215.........8.1 28........$201....... 11.6 196........$218....... 11.0 45........ $253.........8.3 44........ $209.......10.4 59........ $246.........8.1 21........$214....... 11.7 113........ $201.........9.2 19........$225....... 11.6 115........ $235.........7.2
6........ $216.........7.8 63........ $218.........9.9 50........ $254.......10.8 38........ $226.........8.9 32........ $241.........9.3 198........ $259.........5.5
Muscogee Newton Oconee Oglethorpe Paulding Peach Pickens Pierce Pike Polk Pulaski Putnam Quitman Rabun Randolph Richmond Rockdale Schley Screven Seminole Spalding Stephens Stewart Sumter Talbot Taliaferro Tattnall Taylor Telfair Terrell Thomas Tift Toombs Towns Treutlen Troup Turner Twiggs Union Upson Walker Walton Ware Warren Washington Wayne Webster Wheeler White Whitfield Wilcox Wilkes Wilkinson Worth
631........ $217.......10.1 321........ $243.......10.0
45........ $259.........9.8 41........ $237.........9.1 278........$261....... 11.1 97........ $194.......10.0 59........ $264.......10.2 38........ $237.......10.7 60........ $260.........8.1 131........ $244.........7.8 16........$199....... 11.4 56........ $250.........8.9
2........ $247.......12.1 21........ $240.........7.7 19........ $214.........5.6 676........ $221.......10.4 237........$242....... 11.1 12........ $228.......10.3 52........ $230.........7.3 13........ $197.........9.6 317........ $217.........9.5 105........ $216.........9.1 13........$218....... 11.2 99........$203....... 11.7 20........ $228.........8.3
4........ $213.......10.9 34........ $206.......10.0 55........ $212.........9.1 61........ $185.........9.0 50........ $185.........8.3 114........ $205.......10.2 101........ $194.........9.2 157........ $221.........9.5 13........$247....... 11.2 31........ $218.......10.5 246........ $242.........6.9 24........ $192.........8.9 14........ $222.......12.1 25........ $226.........9.4 146........ $218.........8.0 112........ $227.........5.2 164........ $255.........9.8 97........ $226.......10.5 80........ $192.........9.2 52........ $237.......10.4 107........$236....... 11.2
4........ $267.......10.1 35........ $212.........8.8 47........ $260.........8.9 439........ $254.........5.3 23........ $216.........9.5 28........ $169.........9.2 15........ $241.......12.1 58........ $229.........9.6
Note: Initial claims include intrastate initial and additional claims, as well as agent state initial and additional claims for regular UI only. Average duration of benefits is represented in weeks.
Data does not include state or federal extended benefits.
Source: Georgia Department of Labor, Workforce Statistics and Economic Research
23
Mark Butler, Commissioner 148 Andrew Young International Boulevard, N.E. Atlanta, Georgia 30303-1751
Return Service Requested