- Collection:
- Georgia Government Publications
- Title:
- Dimensions: measuring Georgia's workforce, Vol. 41, no. 2 (Feb. 2015)
- Creator:
- Georgia. Department of Labor
- Contributor to Resource:
- Georgia. Workforce Information and Analysis
- Publisher:
- Atlanta, Ga. : Georgia Dept. of Labor, 2015-02
- Date of Original:
- 2015-02
- Subject:
- Labor market--Georgia--Statistics
Wages--Georgia--Statistics
Hours of labor--Georgia--Statistics - Location:
- United States, Georgia, 32.75042, -83.50018
- Medium:
- state government records
- Type:
- Text
- Format:
- application/pdf
- External Identifiers:
- Call Number GA L200.E46 P1 T7 41/2
- Metadata URL:
- https://dlg.galileo.usg.edu/id:dlg_ggpd_i-ga-bl200-pe46-bp1-bt7-b41-s2-belec-p-btext
- Digital Object URL:
- https://dlg.galileo.usg.edu/do:dlg_ggpd_i-ga-bl200-pe46-bp1-bt7-b41-s2-belec-p-btext
- Language:
- eng
- Holding Institution:
- University of Georgia. Map and Government Information Library
- Rights:
-

February 2015 Data
February 2015 Employment Situation
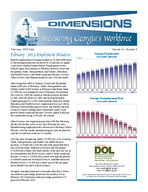
Payroll employment in Georgia jumped by 25,400 in February as the unemployment rate decreased to 6.3 percent, its eighth consecutive month of improvement. Employment sectors with job gains from January to February include Leisure and Hospitality, Trade, Transportation, and Utilities, Education and Health Services, and Professional and Business Services. Other Services and Manufacturing lost jobs over the month.
After being down 800 in January, Leisure and Hospitality added 6,300 jobs in February. Trade, Transportation, and Utilities added 6,200 workers in February with Retail Trade (+5,300 jobs) accounting for most of the gain. Government jobs were up 2,300 this month as federal positions declined by 300, state jobs grew by 1,600, and local government employment grew by 1,000. After holding steady last month, Education and Health Services employment was up 4,200 in February with both Education Services and Health Care and Social Assistance making almost equivalent strides of job growth. Professional and Business Services added 3,600 jobs this month after losing 4,700 jobs last month.
Other Services saw employment go down 900 this February, the first job decline in the sector since February last year. Manufacturing employment also decreased in February. Down 800 jobs over the month, manufacturing has now declined for only the second time in the last 21 months.
Over the year, Georgia has added 157,400 jobs to its economy. Trade, Transportation, and Utilities has added the most positions (+37,000 jobs) over the year with nearly half those jobs in Retail Trade; followed by Leisure and Hospitality (+29,900 jobs) where over three-fourths of the new jobs are in Accommodation and Food Services; next is Professional and Business Services (+29,400 jobs) where over half the growth is in Professional and Technical Services; and Education and Health Services (+21,500 jobs) where most of the job gains are in Health Care and Social Assistance.
Georgia's unemployment rate (seasonally adjusted) is down one-tenth of a percentage point over the month to 6.3 in February 2015 and down a full percentage point from 7.3 percent in February 2014.
In millions
Volume XLI, Number 2
Georgia Employment
(Seasonally Adjusted)
4.088
4.112
4.126
4.138
4.148
4.163
4.177
4.185
4.206
4.216
4.227
4.220
4.246
Feb Mar Apr May Jun Jul Aug Sep Oct Nov Dec Jan Feb
2014
2015
Georgia Unemployment Rate
(Seasonally Adjusted)
7.3%
7.3%
7.3%
7.3%
7.3%
7.2%
7.1%
6.9%
6.8%
6.7%
6.6%
6.4% 6.3%
Feb Mar Apr May Jun Jul Aug Sep Oct Nov Dec Jan Feb
2014
2015
Workforce Statistics & Economic Research Mark Butler, Commissioner
For more information, contact Corey Smith or Evan Cross at (404) 232-3875
corey.smith@gdol. ga.gov evan.cross@gdol. ga.gov
Equal Opportunity Employer/ProgramAuxiliary Aids and Services Available upon Request to Individuals with Disabilities
GEORGIA Nonfarm Employment
(In thousands)
(Seasonally Adjusted)
Preliminary
Revised
Revised
FEB 2015 JAN 2014 FEB 2014
Change in Jobs from JAN 2014
Net %
Change in Jobs from FEB 2014
Net %
Total Nonfarm
4,245.8
4,220.4
4,088.4
25.4 0.6
157.4 3.8
Total Private
3,555.6
3,532.5
3,408.9
23.1 0.7
146.7 4.3
Goods Producing
540.6
538.7
524.4
1.9 0.4
16.2 3.1
Service-Providing
3,705.2
3,681.7
3,564.0
23.5 0.6
141.2 4.0
Private Service-Providing
3,015.0
2,993.8
2,884.5
21.2 0.7
130.5 4.5
Mining and Logging
9.0
9.1
8.9
-0.1 -1.1
0.1 1.1
Construction
159.1
156.3
153.1
2.8 1.8
6.0 3.9
Manufacturing
372.5
373.3
362.4
-0.8 -0.2
10.1 2.8
Durable Goods
180.2
181.9
174.4
-1.7 -0.9
5.8 3.3
Non-Durable Goods
192.3
191.4
188.0
0.9 0.5
4.3 2.3
Trade, Transportation, and Utilities
895.6
889.4
858.6
6.2 0.7
37.0 4.3
Wholesale Trade
216.4
215.1
207.6
1.3 0.6
8.8 4.2
Retail Trade
479.9
474.6
461.7
5.3 1.1
18.2 3.9
Transportation, Warehousing, and Utilities
199.3
199.7
189.3
-0.4 -0.2
10.0 5.3
Information
108.3
106.3
105.9
2.0 1.9
2.4 2.3
Financial Activities
236.7
236.9
230.4
-0.2 -0.1
6.3 2.7
Finance and Insurance
176.9
177.7
171.8
-0.8 -0.5
5.1 3.0
Real Estate and Rental and Leasing
59.8
59.2
58.6
0.6 1.0
1.2 2.0
Professional and Business Services
630.7
627.1
601.3
3.6 0.6
29.4 4.9
Professional, Scientific, and Technical Services
259.4
257.3
243.6
2.1 0.8
15.8 6.5
Management of Companies and Enterprises
63.8
63.6
62.3
0.2 0.3
1.5 2.4
Admin and Support, Waste Mngmnt and Remediation
307.5
306.2
295.4
1.3 0.4
12.1 4.1
Education and Health Services
537.2
533.0
515.7
4.2 0.8
21.5 4.2
Educational Services
72.7
70.5
68.3
2.2 3.1
4.4 6.4
Health Care and Social Assistance
464.5
462.5
447.4
2.0 0.4
17.1 3.8
Leisure and Hospitality
450.1
443.8
420.2
6.3 1.4
29.9 7.1
Arts, Entertainment, and Recreation
47.4
46.6
42.5
0.8 1.7
4.9 11.5
Accommodation and Food Services
402.7
397.2
377.7
5.5 1.4
25.0 6.6
Other Services
156.4
157.3
152.4
-0.9 -0.6
4.0 2.6
Government
690.2
687.9
679.5
2.3 0.3
10.7 1.6
Federal Government
98.4
98.7
98.3
-0.3 -0.3
0.1 0.1
State Government
182.6
181.0
178.1
1.6 0.9
4.5 2.5
Local Government
409.2
408.2
403.1
1.0 0.2
6.1 1.5
Note: These seasonally adjusted estimates were prepared in cooperation with the U.S. Department of Labor, Bureau of Labor Statistics, based upon monthly reports submitted by selected
employers throughout Georgia. The estimates include all full- and part-time wage and salary workers who were employed during or received pay for any part of the pay period that includes the twelfth of the month. Proprietors, domestic workers, self-employed persons, unpaid family workers and personnel of the armed forces are excluded. Estimates based on 2014 benchmark.
Source: Georgia Department of Labor, Workforce Statistics & Economic Research
2
GEORGIA Nonfarm Employment
(In thousands)
(Not Seasonally Adjusted)
Preliminary
Revised
Revised
FEB 2015 JAN 2014 FEB 2014
Change in Jobs from JAN 2014
Net %
Change in Jobs from FEB 2014
Net %
Total Nonfarm
4,208.8
4,181.8
4,051.8
27.0 0.7
157.0 3.9
Total Private
3,514.5
3,493.6
3,367.6
20.9 0.6
146.9 4.4
Goods Producing
536.3
532.9
519.2
3.4 0.6
17.1 3.3
Service-Providing
3,672.5
3,648.9
3,532.6
23.6 0.7
139.9 4.0
Private Service-Providing
2,978.2
2,960.7
2,848.4
17.5 0.6
129.8 4.6
Mining and Logging
8.9
9.0
8.9
-0.1 -1.1
0.0 0.0
Construction
155.6
152.5
149.1
3.1 2.0
6.5 4.4
Construction of Buildings
32.6
32.3
32.7
0.3 0.9
-0.1 -0.3
Heavy and Civil Engineering Construction
22.3
22.1
20.6
0.2 0.9
1.7 8.3
Specialty Trade Contractors
100.7
98.1
95.8
2.6 2.7
4.9 5.1
Manufacturing
371.8
371.4
361.2
0.4 0.1
10.6 2.9
Durable Goods
180.4
180.8
173.7
-0.4 -0.2
6.7 3.9
Computer, Electrical Equip and Appliance Mfg
23.1
23.1
22.7
0.0 0.0
0.4 1.8
Transportation Equipment Manufacturing
48.6
48.4
46.2
0.2 0.4
2.4 5.2
Non-Durable Goods
191.4
190.6
187.5
0.8 0.4
3.9 2.1
Food Manufacturing
64.9
64.7
62.2
0.2 0.3
2.7 4.3
Textile Mills
19.5
19.3
18.8
0.2 1.0
0.7 3.7
Textile Product Mills
27.6
27.5
26.7
0.1 0.4
0.9 3.4
Trade, Transportation, and Utilities
885.2
886.6
848.0
-1.4 -0.2
37.2 4.4
Wholesale Trade
215.0
214.3
206.7
0.7 0.3
8.3 4.0
Merchant Wholesalers, Durable Goods
105.4
103.9
100.5
1.5 1.4
4.9 4.9
Merchant Wholesalers, Nondurable Goods
62.9
62.3
60.5
0.6 1.0
2.4 4.0
Wholesale Electronic Markets and Agents and Brokers 46.7
48.1
45.7
-1.4 -2.9
1.0 2.2
Retail Trade
473.2
472.7
453.7
0.5 0.1
19.5 4.3
Food and Beverage Stores
92.1
92.0
87.5
0.1 0.1
4.6 5.3
General Merchandise Stores
102.8
105.8
100.3
-3.0 -2.8
2.5 2.5
Miscellaneous Store Retailers
20.5
20.6
20.7
-0.1 -0.5
-0.2 -1.0
Transportation, Warehousing, and Utilities
197.0
199.6
187.6
-2.6 -1.3
9.4 5.0
Utilities
19.5
19.5
19.9
0.0 0.0
-0.4 -2.0
Transportation and Warehousing
177.5
180.1
167.7
-2.6 -1.4
9.8 5.8
Air Transportation
39.5
39.3
38.2
0.2 0.5
1.3 3.4
Truck Transportation
48.5
49.3
45.8
-0.8 -1.6
2.7 5.9
Couriers and Messengers
20.9
23.7
18.9
-2.8 -11.8
2.0 10.6
Warehousing and Storage
29.3
28.9
28.6
0.4 1.4
0.7 2.5
Information
108.0
105.8
105.6
2.2 2.1
2.4 2.3
Telecommunications
50.2
50.1
48.6
0.1 0.2
1.6 3.3
Wired Telecommunications Carriers
29.8
29.8
29.4
0.0 0.0
0.4 1.4
Wireless Telecommunications Carriers
12.6
12.5
12.0
0.1 0.8
0.6 5.0
Internet Service Providers, Search Portals, and DP
8.5
8.5
7.8
0.0 0.0
0.7 9.0
Financial Activities
235.8
236.3
229.5
-0.5 -0.2
6.3 2.8
Finance and Insurance
176.6
177.3
171.6
-0.7 -0.4
5.0 2.9
Insurance Carriers and Related Activities
85.9
85.6
81.5
0.3 0.4
4.4 5.4
Real Estate and Rental and Leasing
59.2
59.0
57.9
0.2 0.3
1.3 2.3
Professional and Business Services
620.3
614.1
594.0
6.2 1.0
26.3 4.4
Professional, Scientific, and Technical Services
261.2
256.9
245.3
4.3 1.7
15.9 6.5
Accounting, Tax Prep, and Bookkeeping Services
45.8
44.1
44.8
1.7 3.9
1.0 2.2
Architectural, Engineering, and Related Services
41.1
41.0
37.5
0.1 0.2
3.6 9.6
Computer Systems Design and Related Services
61.7
61.5
59.0
0.2 0.3
2.7 4.6
Management and Technical Consulting Services
37.8
36.5
34.3
1.3 3.6
3.5 10.2
Management of Companies and Enterprises
63.3
63.5
62.0
-0.2 -0.3
1.3 2.1
Admin and Support, Waste Mngmnt and Remediation
295.8
293.7
286.7
2.1 0.7
9.1 3.2
Employment Services
144.5
141.9
135.1
2.6 1.8
9.4 7.0
Education and Health Services
537.9
533.2
515.4
4.7 0.9
22.5 4.4
Educational Services
74.1
70.3
69.6
3.8 5.4
4.5 6.5
Colleges, Universities, and Professional Schools
32.9
30.4
32.1
2.5 8.2
0.8 2.5
Health Care and Social Assistance
463.8
462.9
445.8
0.9 0.2
18.0 4.0
Ambulatory Health Care Services
180.9
180.4
172.5
0.5 0.3
8.4 4.9
Hospitals
158.1
157.6
154.1
0.5 0.3
4.0 2.6
Nursing and Residential Care Facilities
58.7
59.2
57.7
-0.5 -0.8
1.0 1.7
Social Assistance
66.1
65.7
61.5
0.4 0.6
4.6 7.5
Leisure and Hospitality
435.5
429.8
404.7
5.7 1.3
30.8 7.6
Arts, Entertainment, and Recreation
42.6
41.6
37.3
1.0 2.4
5.3 14.2
Amusement, Gambling, and Recreation Industries
29.7
29.0
27.4
0.7 2.4
2.3 8.4
Accommodation and Food Services
392.9
388.2
367.4
4.7 1.2
25.5 6.9
Accommodation
40.5
39.9
40.0
0.6 1.5
0.5 1.3
Food Services and Drinking Places
352.4
348.3
327.4
4.1 1.2
25.0 7.6
Other Services
155.5
154.9
151.2
0.6 0.4
4.3 2.8
Repair and Maintenance
35.8
35.4
35.4
0.4 1.1
0.4 1.1
Personal and Laundry Services
37.1
37.0
34.2
0.1 0.3
2.9 8.5
Religious, Grantmaking, Civic, Professional, and Similar
82.6
82.5
81.6
0.1 0.1
1.0 1.2
Government
694.3
688.2
684.2
6.1 0.9
10.1 1.5
Federal Government
98.4
99.0
98.3
-0.6 -0.6
0.1 0.1
Department of Defense
40.6
40.6
40.1
0.0 0.0
0.5 1.3
State Government
184.6
179.2
180.1
5.4 3.0
4.5 2.5
State Government Educational Services
113.0
107.6
108.0
5.4 5.0
5.0 4.6
Local Government
411.3
410.0
405.8
1.3 0.3
5.5 1.4
Local Government Educational Services
243.9
243.2
239.9
0.7 0.3
4.0 1.7
Note: These not seasonally adjusted estimates were prepared in cooperation with the U.S. Department of Labor, Bureau of Labor Statistics, based upon monthly reports submitted by selected
employers throughout Georgia. The estimates include all full- and part-time wage and salary workers who were employed during or received pay for any part of the pay period that includes the
twelfth of the month. Proprietors, domestic workers, self-employed persons, unpaid family workers and personnel of the armed forces are excluded. Estimates based on 2014 benchmark.
Source: Georgia Department of Labor, Workforce Statistics & Economic Research
3
ALBANY MSA Nonfarm Employment
(In thousands)
(Not Seasonally Adjusted)
Preliminary
Revised
Revised
FEB 2015 JAN 2014 FEB 2014
Change in Jobs from JAN 2014
Net %
Change in Jobs from FEB 2014
Net %
Total Nonfarm Total Private Goods Producing Service-Providing Private Service-Providing Manufacturing Trade, Transportation, and Utilities
Retail Trade Government
Federal Government State Government Local Government
61.4
61.1
60.7
0.3 0.5
47.9
47.9
46.9
0.0 0.0
6.6
6.5
6.7
0.1 1.5
54.8
54.6
54.0
0.2 0.4
41.3
41.4
40.2
-0.1 -0.2
4.3
4.3
4.3
0.0 0.0
12.0
12.0
12.1
0.0 0.0
6.9
6.8
7.2
0.1 1.5
13.5
13.2
13.8
0.3 2.3
2.9
2.9
2.9
0.0 0.0
3.2
2.9
3.2
0.3 10.3
7.4
7.4
7.7
0.0 0.0
0.7 1.2 1.0 2.1 -0.1 -1.5 0.8 1.5 1.1 2.7 0.0 0.0 -0.1 -0.8 -0.3 -4.2 -0.3 -2.2 0.0 0.0 0.0 0.0 -0.3 -3.9
Note: These not seasonally adjusted estimates were prepared in cooperation with the U.S. Department of Labor, Bureau of Labor Statistics, based upon monthly reports submitted by
selected employers in the Albany Metropolitan Statistical Area, which includes Baker, Dougherty, Lee, Terrell and Worth counties. The estimates include all full- and part-time wage and salary workers who were employed during or received pay for any part of the pay period that includes the twelfth of the month. Proprietors, domestic workers, self-employed persons, unpaid familyworkers and personnel of the armed forces are excluded. Estimates based on 2014 benchmark.
ATHENS-CLARKE MSA Nonfarm Employment
(In thousands)
(Not Seasonally Adjusted)
Preliminary
Revised
Revised
FEB 2015 JAN 2014 FEB 2014
Change in Jobs from JAN 2014
Net %
Change in Jobs from FEB 2014
Net %
Total Nonfarm Total Private Goods Producing Service-Providing Private Service-Providing Trade, Transportation, and Utilities
Retail Trade Professional and Business Services Leisure and Hospitality Government
Federal Government State Government Local Government
92.6
92.2
88.5
0.4 0.4
61.4
61.7
58.6
-0.3 -0.5
9.1
9.1
8.9
0.0 0.0
83.5
83.1
79.6
0.4 0.5
52.3
52.6
49.7
-0.3 -0.6
14.7
14.9
13.7
-0.2 -1.3
10.1
10.2
9.5
-0.1 -1.0
7.1
7.1
6.7
0.0 0.0
9.8
9.6
8.9
0.2 2.1
31.2
30.5
29.9
0.7 2.3
1.2
1.2
1.2
0.0 0.0
22.5
21.9
21.1
0.6 2.7
7.5
7.4
7.6
0.1 1.4
4.1 4.6 2.8 4.8 0.2 2.3 3.9 4.9 2.6 5.2 1.0 7.3 0.6 6.3 0.4 6.0 0.9 10.1 1.3 4.4 0.0 0.0 1.4 6.6 -0.1 -1.3
Note: These not seasonally adjusted estimates were prepared in cooperation with the U.S. Department of Labor, Bureau of Labor Statistics, based upon monthly reports submitted by selected
employers in the Athens - Clarke County Metropolitan Statistical Area, which includes Clarke, Madison, Oconee and Oglethorpe counties. The estimates include all full- and part-time wage and salary workers who were employed during or received pay for any part of the pay period that includes the twelfth of the month. Proprietors, domestic workers, self-employed persons, unpaid family workers and personnel of the armed forces are excluded. Estimates based on 2014 benchmark.
Source: Georgia Department of Labor, Workforce Statistics & Economic Research
4
ATLANTA MSA Nonfarm Employment
(In thousands)
(Not Seasonally Adjusted)
Preliminary FEB 2015
Revised
Revised
JAN 2014 FEB 2014
Change in Jobs from JAN 2014
Net %
Change in Jobs from FEB 2014
Net %
Total Nonfarm Total Private Goods Producing Service-Providing Private Service-Providing Mining and Logging Construction
Construction of Buildings Specialty Trade Contractors Manufacturing Durable Goods Transportation Equipment Manufacturing Non-Durable Goods Food Manufacturing Trade, Transportation, and Utilities Wholesale Trade Merchant Wholesalers, Durable Goods Merchant Wholesalers, Nondurable Goods Wholesale Electronic Markets and Agents and Brokers Retail Trade Food and Beverage Stores General Merchandise Stores Miscellaneous Store Retailers Transportation, Warehousing, and Utilities Utilities Transportation and Warehousing Air Transportation Truck Transportation Couriers and Messengers Information Telecommunications Wired Telecommunications Carriers Wireless Telecommunications Carriers Internet Service Providers, Search Portals, and DP Financial Activities Finance and Insurance Insurance Carriers and Related Activities Real Estate and Rental and Leasing Professional and Business Services Professional, Scientific, and Technical Services Accounting, Tax Prep, and Bookkeeping Services Architectural, Engineering, and Related Services Computer Systems Design and Related Services Management and Technical Consulting Services Management of Companies and Enterprises Admin and Support, Waste Mngmnt and Remediation Employment Services Education and Health Services Educational Services Health Care and Social Assistance Ambulatory Health Care Services Hospitals Social Assistance Leisure and Hospitality Arts, Entertainment, and Recreation Accommodation and Food Services Accommodation Food Services and Drinking Places Other Services Repair and Maintenance Personal and Laundry Services Government Federal Government State Government Local Government
2,541.0 2,212.7
258.3 2,282.7 1,954.4
1.3 103.4
22.2 65.6 153.6 79.6 14.8 74.0 23.7 563.3 154.9 77.4 42.2 35.3 272.6 55.0 56.4 13.8 135.8 10.0 125.8 39.1 30.4 16.2 88.4 42.8 25.2 11.0
7.8 163.5 120.5
60.5 43.0 467.3 207.0 33.3 27.8 53.8 33.7 50.1 210.2 102.8 316.5 53.5 263.0 105.6 89.1 41.5 259.8 28.5 231.3 23.0 208.3 95.6 21.0 26.4 328.3 44.8 76.7 206.8
2,528.8 2,203.3
255.6 2,273.2 1,947.7
1.3 100.4
22.0 64.0 153.9 80.2 14.8 73.7 23.6 565.9 157.4 76.9 41.6 38.9 272.3 55.0 58.3 13.9 136.2 10.0 126.2 38.9 30.3 18.4 87.8 42.7 25.1 10.9
7.8 163.6 120.6
60.2 43.0 462.6 204.9 32.5 27.8 53.6 33.2 50.4 207.3 99.9 313.6 50.8 262.8 105.4 88.6 41.7 258.2 28.5 229.7 22.9 206.8 96.0 21.1 26.2 325.5 44.8 74.5 206.2
2,430.1 2,108.4
246.8 2,183.3 1,861.6
1.3 95.7 20.3 62.5 149.8 77.1 14.2 72.7 23.4 539.2 151.0 74.4 40.4 36.2 260.1 52.9 55.0 13.7 128.1 10.1 118.0 38.1 28.4 14.7 87.9 41.3 24.9 10.4
7.2 156.6 114.6
55.6 42.0 443.1 194.8 31.7 26.4 51.3 30.7 49.4 198.9 94.8 300.9 49.6 251.3 100.2 86.1 38.9 241.6 25.2 216.4 22.9 193.5 92.3 20.5 23.8 321.7 44.7 75.6 201.4
12.2 0.5 9.4 0.4 2.7 1.1 9.5 0.4 6.7 0.3 0.0 0.0 3.0 3.0 0.2 0.9 1.6 2.5 -0.3 -0.2 -0.6 -0.8 0.0 0.0 0.3 0.4 0.1 0.4 -2.6 -0.5 -2.5 -1.6 0.5 0.7 0.6 1.4 -3.6 -9.3 0.3 0.1 0.0 0.0 -1.9 -3.3 -0.1 -0.7 -0.4 -0.3 0.0 0.0 -0.4 -0.3 0.2 0.5 0.1 0.3 -2.2 -12.0 0.6 0.7 0.1 0.2 0.1 0.4 0.1 0.9 0.0 0.0 -0.1 -0.1 -0.1 -0.1 0.3 0.5 0.0 0.0 4.7 1.0 2.1 1.0 0.8 2.5 0.0 0.0 0.2 0.4 0.5 1.5 -0.3 -0.6 2.9 1.4 2.9 2.9 2.9 0.9 2.7 5.3 0.2 0.1 0.2 0.2 0.5 0.6 -0.2 -0.5 1.6 0.6 0.0 0.0 1.6 0.7 0.1 0.4 1.5 0.7 -0.4 -0.4 -0.1 -0.5 0.2 0.8 2.8 0.9 0.0 0.0 2.2 3.0 0.6 0.3
110.9 4.6 104.3 5.0
11.5 4.7 99.4 4.6 92.8 5.0
0.0 0.0 7.7 8.1 1.9 9.4 3.1 5.0 3.8 2.5 2.5 3.2 0.6 4.2 1.3 1.8 0.3 1.3 24.1 4.5 3.9 2.6 3.0 4.0 1.8 4.5 -0.9 -2.5 12.5 4.8 2.1 4.0 1.4 2.6 0.1 0.7 7.7 6.0 -0.1 -1.0 7.8 6.6 1.0 2.6 2.0 7.0 1.5 10.2 0.5 0.6 1.5 3.6 0.3 1.2 0.6 5.8 0.6 8.3 6.9 4.4 5.9 5.2 4.9 8.8 1.0 2.4 24.2 5.5 12.2 6.3 1.6 5.1 1.4 5.3 2.5 4.9 3.0 9.8 0.7 1.4 11.3 5.7 8.0 8.4 15.6 5.2 3.9 7.9 11.7 4.7 5.4 5.4 3.0 3.5 2.6 6.7 18.2 7.5 3.3 13.1 14.9 6.9 0.1 0.4 14.8 7.7 3.3 3.6 0.5 2.4 2.6 10.9 6.6 2.1 0.1 0.2 1.1 1.5 5.4 2.7
Note: These not seasonally adjusted estimates were prepared in cooperation with the U.S. Department of Labor, Bureau of Labor Statistics, based upon monthly reports submitted by
selected employers in the Atlanta Metropolitan Statistical Area, which includes Barrow, Bartow, Butts, Carroll, Cherokee, Clayton, Cobb, Coweta, Dawson, DeKalb, Douglas, Fayette, Forsyth,
Fulton, Gwinnett, Haralson, Heard, Henry, Jasper, Lamar, Meriwether, Morgan, Newton, Paulding, Pickens, Pike, Rockdale, Spalding and Walton counties. The estimates include all full- and
part-time wage and salary workers who were employed during or received pay for any part of the pay period that includes the twelfth of the month. Proprietors, domestic workers, self-employed
persons, unpaid family workers and personnel of the armed forces are excluded. Estimates based on 2014 benchmark.
Source: Georgia Department of Labor, Workforce Statistics & Economic Research
5
AUGUSTA-RICHMOND MSA Nonfarm Employment
(In thousands)
(Not Seasonally Adjusted)
Preliminary
Revised
Revised
FEB 2015 JAN 2014 FEB 2014
Change in Jobs from JAN 2014
Net %
Change in Jobs from FEB 2014
Net %
Total Nonfarm Total Private Goods Producing Service-Providing Private Service-Providing Mining, Logging and Construction Manufacturing Trade, Transportation, and Utilities
Wholesale Trade Retail Trade Transportation, Warehousing, and Utilities Information Financial Activities Professional and Business Services Education and Health Services Leisure and Hospitality Other Services Government Federal Government State Government Local Government
227.9 180.4
31.6 196.3 148.8
11.2 20.4 39.0
6.0 25.8
7.2 3.1 8.3 33.0 32.4 24.7 8.3 47.5 9.1 17.0 21.4
226.3 179.1
31.4 194.9 147.7
11.0 20.4 39.4
6.0 26.1
7.3 3.1 8.3 32.2 32.2 24.2 8.3 47.2 9.2 16.6 21.4
220.6 172.9
30.9 189.7 142.0
10.8 20.1 37.3
5.4 24.7
7.2 3.2 8.0 32.4 30.4 22.4 8.3 47.7 8.9 17.2 21.6
1.6 0.7 1.3 0.7 0.2 0.6 1.4 0.7 1.1 0.7 0.2 1.8 0.0 0.0 -0.4 -1.0 0.0 0.0 -0.3 -1.2 -0.1 -1.4 0.0 0.0 0.0 0.0 0.8 2.5 0.2 0.6 0.5 2.1 0.0 0.0 0.3 0.6 -0.1 -1.1 0.4 2.4 0.0 0.0
7.3 3.3 7.5 4.3 0.7 2.3 6.6 3.5 6.8 4.8 0.4 3.7 0.3 1.5 1.7 4.6 0.6 11.1 1.1 4.5 0.0 0.0 -0.1 -3.1 0.3 3.8 0.6 1.9 2.0 6.6 2.3 10.3 0.0 0.0 -0.2 -0.4 0.2 2.3 -0.2 -1.2 -0.2 -0.9
Note: These not seasonally adjusted estimates were prepared in cooperation with the U.S. Department of Labor, Bureau of Labor Statistics, based upon monthly reports submitted by
selected employers in the Augusta - Richmond County Metropolitan Statistical Area, which includes Burke, Columbia, Lincoln, McDuffie and Richmond counties in Georgia and Aiken and Edgefield counties in South Carolina. The estimates include all full- and part-time wage and salary workers who were employed during or received pay for any part of the pay period that includes the
twelfth of the month. Proprietors, domestic workers, self-employed persons, unpaid family workers and personnel of the armed forces are excluded. Estimates based on 2014 benchmark.
BRUNSWICK MSA Nonfarm Employment
(In thousands)
(Not Seasonally Adjusted)
Preliminary
Revised
Revised
FEB 2015 JAN 2014 FEB 2014
Change in Jobs from JAN 2014
Net %
Change in Jobs from FEB 2014
Net %
Total Nonfarm Total Private Goods Producing Service-Providing Private Service-Providing Trade, Transportation, and Utilities
Retail Trade Government
Federal Government State Government Local Government
41.5
41.5
39.7
31.4
31.4
29.7
4.0
4.0
3.9
37.5
37.5
35.8
27.4
27.4
25.8
8.6
8.5
8.0
5.9
5.9
5.4
10.1
10.1
10.0
1.7
1.7
1.7
1.8
1.8
1.7
6.6
6.6
6.6
0.0 0.0 0.0 0.0 0.0 0.0 0.0 0.0 0.0 0.0 0.1 1.2 0.0 0.0 0.0 0.0 0.0 0.0 0.0 0.0 0.0 0.0
1.8 4.5 1.7 5.7 0.1 2.6 1.7 4.8 1.6 6.2 0.6 7.5 0.5 9.3 0.1 1.0 0.0 0.0 0.1 5.9 0.0 0.0
Note: These not seasonally adjusted estimates were prepared in cooperation with the U.S. Department of Labor, Bureau of Labor Statistics, based upon monthly reports submitted by
selected employers in the Brunswick Metropolitan Statistical Area, which includes Brantley, Glynn and McIntosh counties. The estimates include all full- and part-time wage and salary workers who were employed during or received pay for any part of the pay period that includes the twelfth of the month. Proprietors, domestic workers, self-employed persons, unpaid family workers and personnel of the armed forces are excluded. Estimates based on 2014 benchmark.
Source: Georgia Department of Labor, Workforce Statistics & Economic Research
6
COLUMBUS MSA Nonfarm Employment
(In thousands)
(Not Seasonally Adjusted)
Preliminary
Revised
Revised
FEB 2015 JAN 2014 FEB 2014
Change in Jobs from JAN 2014
Net %
Change in Jobs from FEB 2014
Net %
Total Nonfarm Total Private Goods Producing Service-Providing Private Service-Providing Mining, Logging and Construction Manufacturing Trade, Transportation, and Utilities
Wholesale Trade Retail Trade Transportation, Warehousing, and Utilities Information Financial Activities Finance and Insurance
Insurance Carriers and Related Activities Professional and Business Services Education and Health Services Leisure and Hospitality Other Services Government
Federal Government State Government Local Government
122.9 98.0 15.1
107.8 82.9 4.3 10.8 18.6 2.7 13.9 2.0 1.6 13.5 11.7 4.6 12.7 17.4 14.3 4.8 24.9 6.9 5.1 12.9
121.9 97.3 15.1
106.8 82.2 4.3 10.8 18.5 2.7 13.8 2.0 1.5 13.5 11.7 4.6 12.6 17.2 14.1 4.8 24.6 6.9 4.7 13.0
121.2 96.1 15.3
105.9 80.8 4.4 10.9 18.1 2.8 13.4 1.9 1.5 13.3 11.5 4.6 12.6 16.6 14.0 4.7 25.1 6.8 5.0 13.3
1.0 0.8 0.7 0.7 0.0 0.0 1.0 0.9 0.7 0.9 0.0 0.0 0.0 0.0 0.1 0.5 0.0 0.0 0.1 0.7 0.0 0.0 0.1 6.7 0.0 0.0 0.0 0.0 0.0 0.0 0.1 0.8 0.2 1.2 0.2 1.4 0.0 0.0 0.3 1.2 0.0 0.0 0.4 8.5 -0.1 -0.8
1.7 1.4 1.9 2.0 -0.2 -1.3 1.9 1.8 2.1 2.6 -0.1 -2.3 -0.1 -0.9 0.5 2.8 -0.1 -3.6 0.5 3.7 0.1 5.3 0.1 6.7 0.2 1.5 0.2 1.7 0.0 0.0 0.1 0.8 0.8 4.8 0.3 2.1 0.1 2.1 -0.2 -0.8 0.1 1.5 0.1 2.0 -0.4 -3.0
Note: These not seasonally adjusted estimates were prepared in cooperation with the U.S. Department of Labor, Bureau of Labor Statistics, based upon monthly reports submitted by
selected employers in the Columbus Metropolitan Statistical Area, which includes Chattahoochee, Harris, Marion and Muscogee counties in Georgia and Russell County in Alabama. The estimates include all full- and part-time wage and salary workers who were employed during or received pay for any part of the pay period that includes the twelfth of the month. Proprietors, domestic workers, self-employed persons, unpaid family workers and personnel of the armed forces are excluded. Estimates based on 2014 benchmark.
DALTON MSA Nonfarm Employment
(In thousands)
(Not Seasonally Adjusted)
Preliminary
Revised Revised
FEB 2015 JAN 2014 FEB 2014
Change in Jobs from JAN 2014
Net %
Change in Jobs from FEB 2014
Net %
Total Nonfarm Total Private Goods Producing Service-Providing Private Service-Providing Manufacturing
Textile Mills Textile Product Mills Trade, Transportation, and Utilities Retail Trade Transportation, Warehousing, and Utilities Professional and Business Services Government Federal Government State Government Local Government
68.0
67.8
64.4
0.2 0.3
61.0
60.9
57.5
0.1 0.2
24.5
24.3
23.2
0.2 0.8
43.5
43.5
41.2
0.0 0.0
36.5
36.6
34.3
-0.1 -0.3
23.2
23.2
22.0
0.0 0.0
2.5
2.4
2.2
0.1 4.2
15.4
15.3
14.9
0.1 0.7
16.5
16.9
15.7
-0.4 -2.4
8.2
8.1
7.9
0.1 1.2
4.3
4.3
4.0
0.0 0.0
6.2
6.1
5.7
0.1 1.6
7.0
6.9
6.9
0.1 1.5
0.2
0.2
0.2
0.0 0.0
1.1
1.0
1.0
0.1 10.0
5.7
5.7
5.7
0.0 0.0
3.6 5.6 3.5 6.1 1.3 5.6 2.3 5.6 2.2 6.4 1.2 5.5 0.3 13.6 0.5 3.4 0.8 5.1 0.3 3.8 0.3 7.5 0.5 8.8 0.1 1.5 0.0 0.0 0.1 10.0 0.0 0.0
Note: These not seasonally adjusted estimates were prepared in cooperation with the U.S. Department of Labor, Bureau of Labor Statistics, based upon monthly reports submitted by
selected employers in the Dalton Metropolitan Statistical Area, which includes Murray and Whitfield counties. The estimates include all full- and part-time wage and salary workers who were employed during or received pay for any part of the pay period that includes the twelfth of the month. Proprietors, domestic workers, self-employed persons, unpaid family workers and personnel of the armed forces are excluded. Estimates based on 2014 benchmark.
Source: Georgia Department of Labor, Workforce Statistics & Economic Research
7
GAINESVILLE MSA Nonfarm Employment
(In thousands)
(Not Seasonally Adjusted)
Preliminary
Revised
Revised
FEB 2015 JAN 2014 FEB 2014
Change in Jobs from JAN 2014
Net %
Change in Jobs from FEB 2014
Net %
Total Nonfarm Total Private Goods Producing Service-Providing Private Service-Providing Trade, Transportation, and Utilities
Retail Trade Government
Federal Government State Government Local Government
82.2
81.3
77.7
0.9 1.1
72.0
71.2
67.5
0.8 1.1
22.2
22.0
20.7
0.2 0.9
60.0
59.3
57.0
0.7 1.2
49.8
49.2
46.8
0.6 1.2
15.5
15.7
15.0
-0.2 -1.3
8.6
8.7
8.1
-0.1 -1.2
10.2
10.1
10.2
0.1 1.0
0.5
0.5
0.5
0.0 0.0
2.3
2.2
2.3
0.1 4.6
7.4
7.4
7.4
0.0 0.0
4.5 5.8 4.5 6.7 1.5 7.3 3.0 5.3 3.0 6.4 0.5 3.3 0.5 6.2 0.0 0.0 0.0 0.0 0.0 0.0 0.0 0.0
Note: These not seasonally adjusted estimates were prepared in cooperation with the U.S. Department of Labor, Bureau of Labor Statistics, based upon monthly reports submitted by
selected employers in the Gainesville Metropolitan Statistical Area, which comprises Hall county. The estimates include all full- and part-time wage and salary workers who were employed during or received pay for any part of the pay period that includes the twelfth of the month. Proprietors, domestic workers, self-employed persons, unpaid family workers and personnel of the armed forces are excluded. Estimates based on 2014 benchmark.
HINESVILLE MSA Nonfarm Employment
(In thousands)
(Not Seasonally Adjusted)
Preliminary Revised Revised FEB 2015 JAN 2014 FEB 2014
Change in Jobs from JAN 2014
Net %
Change in Jobs from FEB 2014
Net %
Total Nonfarm Total Private Goods Producing Service-Providing Private Service-Providing Government
Federal Government State Government Local Government
20.1
19.8
19.3
11.9
11.7
11.4
2.8
2.8
2.4
17.3
17.0
16.9
9.1
8.9
9.0
8.2
8.1
7.9
4.1
4.1
3.9
0.5
0.4
0.4
3.6
3.6
3.6
0.3 1.5 0.2 1.7 0.0 0.0 0.3 1.8 0.2 2.3 0.1 1.2 0.0 0.0 0.1 25.0 0.0 0.0
0.8 4.2 0.5 4.4 0.4 16.7 0.4 2.4 0.1 1.1 0.3 3.8 0.2 5.1 0.1 25.0 0.0 0.0
Note: These not seasonally adjusted estimates were prepared in cooperation with the U.S. Department of Labor, Bureau of Labor Statistics, based upon monthly reports submitted by
selected employers in the Hinesville Metropolitan Statistical Area, which includes Liberty and Long counties. The estimates include all full- and part-time wage and salary workers who were employed during or received pay for any part of the pay period that includes the twelfth of the month. Proprietors, domestic workers, self-employed persons, unpaid family workers and personnel of the armed forces are excluded. Estimates based on 2014 benchmark.
Source: Georgia Department of Labor, Workforce Statistics & Economic Research
8
MACON MSA Nonfarm Employment
(In thousands)
(Not Seasonally Adjusted)
Preliminary
Revised
Revised
FEB 2015 JAN 2014 FEB 2014
Change in Jobs from JAN 2014
Net %
Change in Jobs from FEB 2014
Net %
Total Nonfarm Total Private Goods Producing Service-Providing Private Service-Providing Trade, Transportation, and Utilities
Retail Trade Transportation, Warehousing, and Utilities Financial Activities Professional and Business Services Education and Health Services Leisure and Hospitality Government Federal Government State Government Local Government
101.3 86.1 9.2 92.1 76.9 19.4 13.5 3.6 9.9 11.9 20.4 9.5 15.2 1.1 4.1 10.0
101.2 86.1 9.2 92.0 76.9 19.9 13.9 3.6 9.9 11.9 20.2 9.4 15.1 1.2 3.9 10.0
98.9 83.9
8.9 90.0 75.0 20.2 13.6
3.6 9.6 11.6 19.9 9.3 15.0 1.1 4.1 9.8
0.1 0.1 0.0 0.0 0.0 0.0 0.1 0.1 0.0 0.0 -0.5 -2.5 -0.4 -2.9 0.0 0.0 0.0 0.0 0.0 0.0 0.2 1.0 0.1 1.1 0.1 0.7 -0.1 -8.3 0.2 5.1 0.0 0.0
2.4 2.4 2.2 2.6 0.3 3.4 2.1 2.3 1.9 2.5 -0.8 -4.0 -0.1 -0.7 0.0 0.0 0.3 3.1 0.3 2.6 0.5 2.5 0.2 2.2 0.2 1.3 0.0 0.0 0.0 0.0 0.2 2.0
Note: These not seasonally adjusted estimates were prepared in cooperation with the U.S. Department of Labor, Bureau of Labor Statistics, based upon monthly reports submitted by
selected employers in the Macon Metropolitan Statistical Area, which includes Bibb, Crawford, Jones, Monroe and Twiggs counties. The estimates include all full- and part-time wage and salary workers who were employed during or received pay for any part of the pay period that includes the twelfth of the month. Proprietors, domestic workers, self-employed persons, unpaid family workers and personnel of the armed forces are excluded. Estimates based on 2014 benchmark.
ROME MSA Nonfarm Employment
(In thousands)
(Not Seasonally Adjusted)
Preliminary
Revised
Revised
FEB 2015 JAN 2014 FEB 2014
Change in Jobs from JAN 2014
Net %
Change in Jobs from FEB 2014
Net %
Total Nonfarm Total Private Goods Producing Service-Providing Private Service-Providing Manufacturing Trade, Transportation, and Utilities
Retail Trade Education and Health Services Government
Federal Government State Government Local Government
40.1
40.0
39.3
34.2
34.1
33.4
6.6
6.6
6.3
33.5
33.4
33.0
27.6
27.5
27.1
5.7
5.7
5.6
7.7
7.7
7.7
5.1
5.0
5.0
9.9
9.8
10.0
5.9
5.9
5.9
0.2
0.2
0.2
1.7
1.7
1.7
4.0
4.0
4.0
0.1 0.3 0.1 0.3 0.0 0.0 0.1 0.3 0.1 0.4 0.0 0.0 0.0 0.0 0.1 2.0 0.1 1.0 0.0 0.0 0.0 0.0 0.0 0.0 0.0 0.0
0.8 2.0 0.8 2.4 0.3 4.8 0.5 1.5 0.5 1.9 0.1 1.8 0.0 0.0 0.1 2.0 -0.1 -1.0 0.0 0.0 0.0 0.0 0.0 0.0 0.0 0.0
Note: These not seasonally adjusted estimates were prepared in cooperation with the U.S. Department of Labor, Bureau of Labor Statistics, based upon monthly reports submitted by
selected employers in the Rome Metropolitan Statistical Area, which comprises Floyd county. The estimates include all full- and part-time wage and salary workers who were employed during or received pay for any part of the pay period that includes the twelfth of the month. Proprietors, domestic workers, self-employed persons, unpaid family workers and personnel of the armed forces are excluded. Estimates based on 2014 benchmark.
Source: Georgia Department of Labor, Workforce Statistics & Economic Research
9
SAVANNAH MSA Nonfarm Employment
(In thousands)
(Not Seasonally Adjusted)
Preliminary Revised
Revised
FEB 2015 JAN 2014 FEB 2014
Change in Jobs from JAN 2014
Net %
Change in Jobs from FEB 2014
Net %
Total Nonfarm Total Private Goods Producing Service-Providing Private Service-Providing Mining, Logging and Construction Manufacturing Trade, Transportation, and Utilities
Wholesale Trade Retail Trade Transportation, Warehousing, and Utilities Information Financial Activities Professional and Business Services Education and Health Services Leisure and Hospitality Other Services Government Federal Government State Government Local Government
167.7 144.4
22.7 145.0 121.7
6.2 16.5 36.6
6.5 19.5 10.6
1.9 6.4 20.4 24.6 24.6 7.2 23.3 2.9 6.0 14.4
166.0 143.2
22.6 143.4 120.6
6.1 16.5 36.7
6.5 19.5 10.7
1.9 6.4 19.6 24.3 24.5 7.2 22.8 2.8 5.6 14.4
159.9 136.6
21.3 138.6 115.3
5.6 15.7 35.5
6.3 19.1 10.1
1.8 6.4 18.5 23.9 22.2 7.0 23.3 2.8 6.2 14.3
1.7 1.0 1.2 0.8 0.1 0.4 1.6 1.1 1.1 0.9 0.1 1.6 0.0 0.0 -0.1 -0.3 0.0 0.0 0.0 0.0 -0.1 -0.9 0.0 0.0 0.0 0.0 0.8 4.1 0.3 1.2 0.1 0.4 0.0 0.0 0.5 2.2 0.1 3.6 0.4 7.1 0.0 0.0
7.8 4.9 7.8 5.7 1.4 6.6 6.4 4.6 6.4 5.6 0.6 10.7 0.8 5.1 1.1 3.1 0.2 3.2 0.4 2.1 0.5 5.0 0.1 5.6 0.0 0.0 1.9 10.3 0.7 2.9 2.4 10.8 0.2 2.9 0.0 0.0 0.1 3.6 -0.2 -3.2 0.1 0.7
Note: These not seasonally adjusted estimates were prepared in cooperation with the U.S. Department of Labor, Bureau of Labor Statistics, based upon monthly reports submitted by
selected employers in the Savannah Metropolitan Statistical Area, which includes Bryan, Chatham and Effingham counties. The estimates include all full- and part-time wage and salary workers who were employed during or received pay for any part of the pay period that includes the twelfth of the month. Proprietors, domestic workers, self-employed persons, unpaid family workers and personnel of the armed forces are excluded. Estimates based on 2014 benchmark.
VALDOSTA MSA Nonfarm Employment
(In thousands)
(Not Seasonally Adjusted)
Preliminary Revised
Revised
FEB 2015 JAN 2014 FEB 2014
Change in Jobs from JAN 2014
Net %
Change in Jobs from FEB 2014
Net %
Total Nonfarm Total Private Goods Producing Service-Providing Private Service-Providing Trade, Transportation, and Utilities
Retail Trade Government
Federal Government State Government Local Government
55.3
54.7
54.1
41.6
41.3
40.3
7.2
7.1
6.5
48.1
47.6
47.6
34.4
34.2
33.8
12.1
12.1
11.2
8.4
8.4
7.7
13.7
13.4
13.8
1.1
1.1
1.1
4.5
4.3
4.6
8.1
8.0
8.1
0.6 1.1 0.3 0.7 0.1 1.4 0.5 1.1 0.2 0.6 0.0 0.0 0.0 0.0 0.3 2.2 0.0 0.0 0.2 4.7 0.1 1.3
1.2 2.2 1.3 3.2 0.7 10.8 0.5 1.1 0.6 1.8 0.9 8.0 0.7 9.1 -0.1 -0.7 0.0 0.0 -0.1 -2.2 0.0 0.0
Note: These not seasonally adjusted estimates were prepared in cooperation with the U.S. Department of Labor, Bureau of Labor Statistics, based upon monthly reports submitted by
selected employers in the Valdosta Metropolitan Statistical Area, which includes Brooks, Echols, Lanier and Lowndes counties. The estimates include all full- and part-time wage and salary workers who were employed during or received pay for any part of the pay period that includes the twelfth of the month. Proprietors, domestic workers, self-employed persons, unpaid family workers and personnel of the armed forces are excluded. Estimates based on 2014 benchmark.
Source: Georgia Department of Labor, Workforce Statistics & Economic Research
10
WARNER ROBINS MSA Nonfarm Employment
(In thousands)
(Not Seasonally Adjusted)
Preliminary Revised
Revised
FEB 2015 JAN 2014 FEB 2014
Change in Jobs from JAN 2014
Net %
Change in Jobs from FEB 2014
Net %
Total Nonfarm Total Private Goods Producing Service-Providing Private Service-Providing Trade, Transportation, and Utilities
Retail Trade Government
Federal Government State Government Local Government
69.5
69.5
69.7
0.0 0.0
42.3
42.3
42.1
0.0 0.0
8.6
8.6
8.4
0.0 0.0
60.9
60.9
61.3
0.0 0.0
33.7
33.7
33.7
0.0 0.0
10.2
10.4
10.2
-0.2 -1.9
7.6
7.7
7.7
-0.1 -1.3
27.2
27.2
27.6
0.0 0.0
15.0
15.1
15.2
-0.1 -0.7
2.6
2.5
2.6
0.1 4.0
9.6
9.6
9.8
0.0 0.0
-0.2 -0.3 0.2 0.5 0.2 2.4 -0.4 -0.7 0.0 0.0 0.0 0.0 -0.1 -1.3 -0.4 -1.5 -0.2 -1.3 0.0 0.0 -0.2 -2.0
Note: These not seasonally adjusted estimates were prepared in cooperation with the U.S. Department of Labor, Bureau of Labor Statistics, based upon monthly reports submitted by
selected employers in the Warner Robins Metropolitan Statistical Area, which includes Houston, Peach and Pulaski counties. The estimates include all full- and part-time wage and salary workers who were employed during or received pay for any part of the pay period that includes the twelfth of the month. Proprietors, domestic workers, self-employed persons, unpaid family workers and personnel of the armed forces are excluded. Estimates based on 2014 benchmark.
Source: Georgia Department of Labor, Workforce Statistics & Economic Research
Total Nonfarm Employment by Metro Statistical Area
(In thousands)
(Seasonally Adjusted)
Preliminary
Revised
Revised
FEB 2015 JAN 2014 FEB 2014
Change in Jobs from JAN 2014
Net %
Change in Jobs from FEB 2014
Net %
Albany MSA
61.7
61.5
61.0
0.2 0.3
0.7 1.1
Athens-Clarke County MSA
93.1
93.6
89.3
-0.5 -0.5
3.8 4.3
Atlanta MSA
2,560.7
2,547.9
2,447.5
12.8 0.5
113.2 4.6
Augusta-Richmond MSA
230.1
229.0
221.5
1.1 0.5
8.6 3.9
Brunswick MSA
42.2
42.3
40.4
-0.1 -0.2
1.8 4.5
Columbus MSA
123.9
123.2
122.1
0.7 0.6
1.8 1.5
Dalton MSA
68.3
68.4
64.8
-0.1 -0.1
3.5 5.4
Gainesville MSA
83.0
82.5
78.6
0.5 0.6
4.4 5.6
Hinesville MSA
20.1
20.0
19.3
0.1 0.5
0.8 4.1
Macon MSA
102.3
101.1
99.6
1.2 1.2
2.7 2.7
Rome MSA
40.3
40.4
39.6
-0.1 -0.2
0.7 1.8
Savannah MSA
168.6
168.3
162.0
0.3 0.2
6.6 4.1
Valdosta MSA
55.6
55.5
54.5
0.1 0.2
1.1 2.0
Warner Robins MSA
No Data Available
Note: These seasonally adjusted estimates were prepared in cooperation with the U.S. Department of Labor, Bureau of Labor Statistics, based upon monthly reports submitted by selected
employers throughout Georgia. The estimates include all full- and part-time wage and salary workers who were employed during or received pay for any part of the pay period that includes the twelfth of the month. Proprietors, domestic workers, self-employed persons, unpaid family workers and personnel of the armed forces are excluded. Estimates based on 2014 benchmark.
Source: Georgia Department of Labor, Workforce Statistics & Economic Research
11
Georgia Statewide Hours and Earnings
All Employee
Average Weekly Earnings
Preliminary FEB 2015
Revised JAN 2014
Revised FEB 2014
Total Private.....................................................................................................$850.31............................ $830.68.......................$803.76 Goods Producing......................................................................................... $938.67............................ $948.31.......................$880.77 Private Service Providing............................................................................. $833.52............................ $808.46.......................$790.24 Construction...............................................................................................$907.44.............................$915.20...................... $822.94 Manufacturing............................................................................................ $952.15.............................$974.68....................... $910.25 Trade, Transportation, and Utilities........................................................... $788.46.............................$778.67....................... $729.74 Financial Activities.................................................................................. $1,143.38..........................$1,078.60....................$1,202.25 Professional and Business Services...................................................... $1,061.77.......................... $1,015.61.......................$987.54 Educational and Health Services.............................................................. $885.00.............................$870.41........................$841.11 Leisure and Hospitality.............................................................................. $334.64.............................$326.71.......................$308.81 Other Services...........................................................................................$703.76............................. $687.16....................... $625.12
Average Weekly Hours
Preliminary FEB 2015
Revised JAN 2014
Revised FEB 2014
Total Private...........................................................................................................35.4.................................. 34.8.............................34.0 Goods Producing................................................................................................40.2...................................40.7............................. 37.4 Private Service Providing....................................................................................34.5...................................33.7.............................33.4 Construction.....................................................................................................39.3...................................40.0.............................34.9 Manufacturing..................................................................................................40.9................................... 41.3.............................38.8 Trade, Transportation, and Utilities..................................................................35.5...................................34.7.............................33.8 Financial Activities...........................................................................................38.1...................................36.6............................. 37.7 Professional and Business Services...............................................................36.6...................................35.9.............................36.2 Educational and Health Services.....................................................................35.4.................................. 34.9.............................34.5 Leisure and Hospitality.....................................................................................26.9.................................. 26.2.............................25.5 Other Services.................................................................................................33.9...................................33.1............................. 31.7
Average Hourly Earnings
Preliminary FEB 2015
Revised JAN 2014
Revised FEB 2014
Total Private.......................................................................................................$24.02...............................$23.87.........................$23.64 Goods Producing............................................................................................$23.35.............................. $23.30.........................$23.55 Private Service Providing................................................................................ $24.16.............................. $23.99.........................$23.66 Construction.................................................................................................$23.09.............................. $22.88.........................$23.58 Manufacturing..............................................................................................$23.28.............................. $23.60.........................$23.46 Trade, Transportation, and Utilities..............................................................$22.21.............................. $22.44......................... $21.59 Financial Activities.......................................................................................$30.01...............................$29.47.........................$31.89 Professional and Business Services...........................................................$29.01.............................. $28.29......................... $27.28 Educational and Health Services.................................................................$25.00.............................. $24.94.........................$24.38 Leisure and Hospitality.................................................................................$12.44...............................$12.47..........................$12.11 Other Services.............................................................................................$20.76...............................$20.76......................... $19.72
Read more about the hours and earnings series at http://www.bls.gov/sae/home.htm
Note: These not seasonally adjusted estimates were prepared in cooperation with the U.S. Department of Labor, Bureau of Labor Statistics, based upon monthly reports submitted by
selected employers throughout Georgia. The estimates include all full- and part-time wage and salary workers who were employed during or received pay for any part of the pay period that includes the twelfth of the month. Proprietors, domestic workers, self-employed persons, unpaid family workers and personnel of the armed forces are excluded. Estimates based on 2014 benchmark.
12
Source: Georgia Department of Labor, Workforce Statistics & Economic Research
Georgia MSA Hours and Earnings
All Employee Total Private
Average Weekly Earnings
Preliminary FEB 2015
Revised JAN 2014
Revised FEB 2014
Albany MSA ................................................................................................... $584.64............................ $594.65.......................$550.40 Athens-Clarke County MSA ...........................................................................$675.88............................ $676.84.......................$560.07 Atlanta MSA ................................................................................................. $936.33............................. $917.52.......................$888.52 Augusta-Richmond County MSA ...................................................................$899.12.............................$871.21....................... $876.15 Brunswick MSA ............................................................................................ $650.84............................. $617.21.......................$508.61 Columbus MSA ..............................................................................................$715.50............................ $688.09....................... $701.09 Dalton MSA .................................................................................................. $688.28............................ $668.69.......................$612.84 Gainesville MSA .............................................................................................$813.95.............................$761.84.......................$777.94 Hinesville MSA ............................................................................................... $788.18.............................$807.53.......................$865.76 Macon MSA ................................................................................................... $735.30..............................$741.11.......................$764.67 Rome MSA .....................................................................................................$848.10............................ $854.55.......................$770.06 Savannah MSA ..............................................................................................$710.57............................ $688.44....................... $685.17 Valdosta MSA .................................................................................................$614.61............................. $611.40....................... $617.75 Warner Robins MSA ...................................................................................... $658.83............................ $642.46....................... $619.10
Average Weekly Hours
Preliminary FEB 2015
Revised JAN 2014
Revised FEB 2014
Albany MSA ..........................................................................................................34.8...................................35.0.............................32.0 Athens-Clarke County MSA .................................................................................32.2...................................32.4.............................29.4 Atlanta MSA ........................................................................................................35.4.................................. 34.9.............................34.0 Augusta-Richmond County MSA ......................................................................... 37.2.................................. 36.9.............................36.4 Brunswick MSA ...................................................................................................35.8...................................34.1.............................30.9 Columbus MSA ....................................................................................................34.3.................................. 33.5.............................34.3 Dalton MSA .........................................................................................................39.9.................................. 38.9.............................34.9 Gainesville MSA ...................................................................................................36.5...................................35.7.............................36.2 Hinesville MSA .....................................................................................................36.9...................................35.7............................. 40.1 Macon MSA ..........................................................................................................38.0.................................. 38.3.............................38.6 Rome MSA ...........................................................................................................33.0.................................. 35.8.............................35.8 Savannah MSA ....................................................................................................32.7.................................. 32.2............................. 33.1 Valdosta MSA .......................................................................................................35.9.................................. 35.3.............................35.0 Warner Robins MSA .............................................................................................36.1.................................. 35.3............................. 36.1
Average Hourly Earnings
Preliminary FEB 2015
Revised JAN 2014
Revised FEB 2014
Albany MSA ......................................................................................................$16.80...............................$16.99......................... $17.20 Athens-Clarke County MSA .............................................................................$20.99.............................. $20.89......................... $19.05 Atlanta MSA ....................................................................................................$26.45.............................. $26.29......................... $26.11 Augusta-Richmond County MSA ..................................................................... $24.17...............................$23.61.........................$24.09 Brunswick MSA ............................................................................................... $18.18............................... $18.10.........................$16.46 Columbus MSA ................................................................................................$20.86.............................. $20.54.........................$20.44 Dalton MSA ..................................................................................................... $17.25................................$17.19......................... $17.56 Gainesville MSA .............................................................................................. $22.30...............................$21.34......................... $21.49 Hinesville MSA .................................................................................................$21.36.............................. $22.62......................... $21.59 Macon MSA ......................................................................................................$19.35...............................$19.35......................... $19.81 Rome MSA .......................................................................................................$25.70...............................$23.87......................... $21.51 Savannah MSA ................................................................................................ $21.73...............................$21.38.........................$20.70 Valdosta MSA ....................................................................................................$17.12............................... $17.32......................... $17.65 Warner Robins MSA .........................................................................................$18.25...............................$18.20..........................$17.14
Read more about the hours and earnings series at http://www.bls.gov/sae/home.htm
Note: These not seasonally adjusted estimates were prepared in cooperation with the U.S. Department of Labor, Bureau of Labor Statistics, based upon monthly reports submitted by
selected employers throughout Georgia. The estimates include all full- and part-time wage and salary workers who were employed during or received pay for any part of the pay period that includes the twelfth of the month. Proprietors, domestic workers, self-employed persons, unpaid family workers and personnel of the armed forces are excluded. Estimates based on 2014 benchmark.
Source: Georgia Department of Labor, Workforce Statistics & Economic Research
13
Dimensions - Measuring Georgia's Labor Force
Unemployment rates -- Georgia and U.S.
2014
2015
WA 6.3
OR
5.8
ID
3.9
NV
7.1
UT
CA
3.4
6.7
AZ 6.5
AK 6.3
StatSetautenUenmemppllooyymmenetnRtatreas tes
February 2015
National Unemployment Rate: 5.5% Rates are seasonally adjusted
MT 4.3
WY 4.0
CO 4.2 NM 6.0
ND 2.9 SD 3.4
NE 2.7
KS 4.2
MN 3.7
WI 4.8
IA 4.1
IL 6.0 MO 5.5
OK 3.9 TX 4.3
AR 5.5
MS 7.0 LA 6.7
NH
3.9 ME
VT
5.0
3.9
MI 5.9
OH
IN
5.1
5.9
KY 5.2 TN 6.6
PA 5.2
WV
6.1
VA
4.7
NC 5.3
SC 6.6
AL
GA
5.8
6.3
FL 5.6
MA 4.9 NY 5.8
RI 6.3
NJ 6.4
CT 6.4 DE
4.8
DC 7.8
MD 5.5
Unemployment rate
10.0% or greater 7.0% to 9.9% 6.0% to 6.9% 5.0% to 5.9% 4.0% to 4.9% 3.0% to 3.9% Less than 3.0%
HI 4.1
Source: Georgia Department of Labor, Workforce Statistics & Economic Research
14
Georgia Labor Force Estimates (not seasonally adjusted) Place of Residence - Persons 16 Years and Older
Georgia
(Seasonally adjusted)
Georgia
(Not Seasonally adjusted)
Albany MSA Athens-Clarke County MSA
Atlanta MSA
Augusta-Richmond County MSA
Brunswick MSA
Columbus MSA
Dalton MSA
Gainesville MSA
Employment Status
Civilian labor force Employed Unemployed Rate
Civilian labor force Employed Unemployed Rate
Civilian labor force Employed Unemployed Rate
Civilian labor force Employed Unemployed Rate
Civilian labor force Employed Unemployed Rate
Civilian labor force Employed Unemployed Rate
Civilian labor force Employed Unemployed Rate
Civilian labor force Employed Unemployed Rate
Civilian labor force Employed Unemployed Rate
Civilian labor force Employed Unemployed Rate
Preliminary FEB 2015
4,763,414 4,462,509
300,905 6.3
4,750,504 4,447,096
303,408 6.4
66,115 61,149 4,966
7.5
95,062 89,662
5,400 5.7
2,813,106 2,641,634
171,472 6.1
257,144 239,821
17,323 6.7
49,941 46,542
3,399 6.8
126,559 117,352
9,207 7.3
61,234 56,873
4,361 7.1
91,108 86,453
4,655 5.1
Revised JAN 2014
4,754,025 4,449,793
304,232 6.4
4,744,224 4,435,462
308,762 6.5
66,305 61,282
5,023 7.6
95,156 89,674 5,482
5.8
2,804,187 2,631,277
172,910 6.2
256,510 238,798
17,712 6.9
50,188 46,691
3,497 7.0
125,978 116,508
9,470 7.5
61,747 56,864
4,883 7.9
90,675 85,966
4,709 5.2
Revised FEB 2014
4,721,735 4,376,571
345,164 7.3
4,737,275 4,382,290
354,985 7.5
67,317 61,418 5,899
8.8
93,378 87,338 6,040
6.5
2,787,772 2,589,371
198,401 7.1
255,121 235,925
19,196 7.5
49,772 45,496
4,276 8.6
128,701 118,209
10,492 8.2
60,495 55,051 5,444
9.0
88,948 83,652
5,296 6.0
Change From
JAN 2014
FEB 2014
9,389 12,716 -3,327
41,679 85,938 -44,259
6,280 11,634 -5,354
13,229 64,806 -51,577
-190
-1,202
-133
-269
-57
-933
-94
1,684
-12
2,324
-82
-640
8,919 10,357 -1,438
25,334 52,263 -26,929
634 1,023 -389
2,023 3,896 -1,873
-247
169
-149
1,046
-98
-877
581 844 -263
-2,142 -857
-1,285
-513 9
-522
739 1,822 -1,083
433
2,160
487
2,801
-54
-641
Note: MSA data are not seasonally adjusted. Employment includes nonagricultural wage and salary employment, self-employment, unpaid family and private
household workers and agricultural workers. Persons in labor disputes are counted as employed. The use of unrounded data does not imply that the numbers are exact. Georgia and Metropolitan Statistical Area data have not been seasonally adjusted.
Albany MSA: Baker, Dougherty, Lee, Terrell, and Worth counties. Athens - Clarke County MSA: Clarke, Madison, Oconee, and Oglethorpe counties. Atlanta MSA: Barrow, Bartow, Butts, Carroll, Cherokee, Clayton, Cobb, Coweta, Dawson, DeKalb, Douglas, Fayette, Forsyth, Fulton, Gwinnett, Haralson, Heard, Henry, Jasper, Lamar, Meriwether, Morgan, Newton, Paulding, Pickens, Pike, Rockdale, Spalding, and Walton counties. Augusta - Richmond County MSA: Burke, Columbia, Lincoln, McDuffie, and Richmond counties in Georgia and Aiken and Edgefield counties in South Carolina. Brunswick MSA: Brantley, Glynn, and McIntosh counties. Columbus MSA: Chattahoochee, Harris, Marion, and Muscogee counties in Georgia and Russell County in Alabama. Dalton MSA: Murray and Whitfield counties. Gainesville MSA: Hall County. Hinesville MSA: Liberty and Long counties. Macon MSA: Bibb, Crawford, Jones, Monroe, and Twiggs counties. Rome MSA: Floyd County. Savannah MSA: Bryan, Chatham, and Effingham counties. Valdosta MSA: Brooks, Echols, Lanier, and Lowndes counties. Warner Robins MSA: Houston, Peach and Pulaski counties.
Source: Georgia Department of Labor, Workforce Statistics & Economic Research
15
Georgia Labor Force Estimates (not seasonally adjusted) Place of Residence - Persons 16 Years and Older
Hinesville MSA Macon MSA Rome MSA
Savannah MSA Valdosta MSA Warner Robins MSA
Employment Status
Civilian labor force Employed Unemployed Rate
Civilian labor force Employed Unemployed Rate
Civilian labor force Employed Unemployed Rate
Civilian labor force Employed Unemployed Rate
Civilian labor force Employed Unemployed Rate
Civilian labor force Employed Unemployed Rate
Preliminary FEB 2015
32,449 30,247
2,202 6.8
103,356 96,292 7,064 6.8
43,049 40,074
2,975 6.9
173,258 162,784
10,474 6.0
63,242 59,152 4,090
6.5
80,235 74,956
5,279 6.6
Revised JAN 2014
32,228 29,969
2,259 7.0
103,532 96,341 7,191 6.9
43,030 39,980
3,050 7.1
172,175 161,227 10,948
6.4
63,160 58,958
4,202 6.7
80,424 75,019 5,405
6.7
Revised FEB 2014
32,493 29,845
2,648 8.1
104,426 95,949
8,477 8.1
43,779 40,114 3,665
8.4
171,500 159,004
12,496 7.3
63,304 58,622
4,682 7.4
82,130 76,040
6,090 7.4
Change From
JAN 2014
FEB 2014
221
-44
278
402
-57
-446
-176
-1,070
-49
343
-127
-1,413
19
-730
94
-40
-75
-690
1,083 1,557
-474
1,758 3,780 -2,022
82
-62
194
530
-112
-592
-189
-1,895
-63
-1,084
-126
-811
Area United States
(Seasonally adjusted)
United States
(Not Seasonally adjusted)
United States Labor Force Estimates Place of Residence - Persons 16 Years and Older
Employment Status
Civilian labor force Employed Unemployed Rate
FEB 2015
157,002,000 148,297,000
8,705,000 5.5
JAN 2014
157,180,000 148,201,000
8,979,000 5.7
FEB 2014
155,688,000 145,301,000
10,387,000 6.7
Civilian labor force Employed Unemployed
Rate
156,213,000 147,118,000
9,095,000 5.8
156,050,000 146,552,000
9,498,000 6.1
155,027,000 144,134,000 10,893,000
7.0
Change From
JAN 2014
FEB 2014
-178,000 96,000
-274,000
1,314,000 2,996,000 -1,682,000
163,000 566,000 -403,000
1,186,000 2,984,000 -1,798,000
Note: Employment includes nonagricultural wage and salary employment, self-employment, unpaid family and private household workers and agricultural
workers. Persons in labor disputes are counted as employed. The use of unrounded data does not imply that the numbers are exact. Georgia and Metropolitan Statistical Area data have not been seasonally adjusted. Seasonally adjusted data for Georgia available upon request.
Albany MSA: Baker, Dougherty, Lee, Terrell, and Worth counties. Athens - Clarke County MSA: Clarke, Madison, Oconee, and Oglethorpe counties. Atlanta MSA: Barrow, Bartow, Butts, Carroll, Cherokee, Clayton, Cobb, Coweta, Dawson, DeKalb, Douglas, Fayette, Forsyth, Fulton, Gwinnett, Haralson, Heard, Henry, Jasper, Lamar, Meriwether, Morgan, Newton, Paulding, Pickens, Pike, Rockdale, Spalding, and Walton counties. Augusta - Richmond County MSA: Burke, Columbia, Lincoln, McDuffie, and Richmond counties in Georgia and Aiken and Edgefield counties in South Carolina. Brunswick MSA: Brantley, Glynn, and McIntosh counties. Columbus MSA: Chattahoochee, Harris, Marion, and Muscogee counties in Georgia and Russell County in Alabama. Dalton MSA: Murray and Whitfield counties. Gainesville MSA: Hall County. Hinesville MSA: Liberty and Long counties. Macon MSA: Bibb, Crawford, Jones, Monroe, and Twiggs counties. Rome MSA: Floyd County. Savannah MSA: Bryan, Chatham, and Effingham counties. Valdosta MSA: Brooks, Echols, Lanier, and Lowndes counties. Warner Robins MSA: Houston, Peach and Pulaski counties.
Source: Georgia Department of Labor, Workforce Statistics & Economic Research
16
Georgia Labor Force Estimates by County (not seasonally adjusted)
Georgia
Place of Residence - Persons 16 Years and Older
Preliminary February 2015
Revised January 2015
Labor Force
Employment
Unemployment Number Rate
Labor Force
Employment
Unemployment Number Rate
4,750,504 4,447,096 303,408 6.4
4,744,224 4,435,462 308,762 6.5
Revised February 2014
Labor Force
Employment
Unemployment Number Rate
4,737,275 4,382,290 354,985 7.5
Appling Atkinson Bacon Baker Baldwin
8,647 8,007
640 7.4
3,690 3,432
258 7.0
4,973 4,685
288 5.8
1,152 1,066
86 7.5
17,731 16,307 1,424 8.0
8,800 8,096
704 8.0
3,716 3,469
247 6.6
5,015 4,710 305 6.1
1,195 1,105
90 7.5
17,718 16,261 1,457 8.2
8,412 3,634 4,542 1,115 19,202
7,619 3,305 4,187 1,007 17,521
793 9.4 329 9.1 355 7.8 108 9.7 1,681 8.8
Banks Barrow Bartow Ben Hill Berrien
8,084 34,958 47,136
5,210 7,025
7,602 33,014 44,215 4,690
6,447
482 6.0 1,944 5.6 2,921 6.2
520 10.0 578 8.2
8,144 34,859 47,137
5,229 7,070
7,647 32,894 44,083
4,690 6,510
497 6.1 1,965 5.6 3,054 6.5
539 10.3 560 7.9
8,002 34,622 46,848
5,416 7,192
7,457 32,311 43,237 4,831
6,519
545 6.8 2,311 6.7 3,611 7.7
585 10.8 673 9.4
Bibb Bleckley Brantley Brooks Bryan
68,600 4,471 6,887 6,823
15,452
63,740 4,011 6,341 6,354
14,611
4,860 7.1 460 10.3 546 7.9 469 6.9 841 5.4
68,643 4,482 6,963 6,909
15,348
63,705 4,030 6,402 6,438
14,485
4,938 7.2 452 10.1 561 8.1 471 6.8 863 5.6
69,446 5,985 6,883 6,689
15,302
63,599 5,431 6,188 6,170
14,273
5,847 8.4 554 9.3 695 10.1 519 7.8
1,029 6.7
Bulloch Burke Butts Calhoun Camden
34,354 32,196 2,158 6.3
9,298 8,533
765 8.2
10,201 9,520
681 6.7
2,133 1,987
146 6.8
21,643 20,311 1,332 6.2
34,167 31,965 2,202 6.4
9,333 8,529 804 8.6
10,192 9,494 698 6.8
2,207 2,066
141 6.4
21,672 20,326 1,346 6.2
34,342 9,380 10,137 2,054 21,529
31,758 8,353 9,303 1,883 20,016
2,584 7.5 1,027 10.9
834 8.2 171 8.3 1,513 7.0
Candler Carroll Catoosa Charlton Chatham
4,983 4,666
317 6.4
51,979 48,182 3,797 7.3
30,914 29,201 1,713 5.5
4,823 4,481
342 7.1
131,516 123,280 8,236 6.3
5,060
4,719
341 6.7
51,868 48,056 3,812 7.3
30,856 29,078 1,778 5.8
4,845 4,498
347 7.2
130,761 122,085 8,676 6.6
5,045 4,657
388 7.7
51,695 47,194 4,501 8.7
31,062 29,122 1,940 6.2
4,822 4,438
384 8.0
130,256 120,454 9,802 7.5
Chattahoochee Chattooga Cherokee Clarke Clay
2,399 10,410 117,167 58,052
920
2,187 9,695 111,407 54,543
815
212 8.8 715 6.9 5,760 4.9 3,509 6.0 105 11.4
2,408 10,415 116,825 58,040
945
2,183 9,715 110,974 54,503
838
225 9.3 700 6.7 5,851 5.0 3,537 6.1 107 11.3
2,421 10,505 115,873 57,021
849
2,180 9,579 109,332 53,131
746
241 10.0 926 8.8 6,541 5.6 3,890 6.8 103 12.1
Clayton Clinch Cobb Coffee Colquitt
124,826 114,630 10,196 8.2
2,744 2,550
194 7.1
393,619 372,302 21,317 5.4
17,138 15,799 1,339 7.8
20,293 18,825 1,468 7.2
124,520 114,162 10,358 8.3
2,805 2,576
229 8.2
392,319 370,780 21,539 5.5
17,070 15,762 1,308 7.7
20,734 19,240 1,494 7.2
124,731 112,190 12,541 10.1
2,844 2,578
266 9.4
389,208 365,241 23,967 6.2
19,701 18,093 1,608 8.2
19,701 17,959 1,742 8.8
Columbia Cook Coweta Crawford Crisp
65,485 7,290
66,679 5,616 9,256
62,039 6,713
62,907 5,253 8,528
3,446 5.3 577 7.9
3,772 5.7 363 6.5 728 7.9
65,195 61,670 3,525 5.4
7,317 6,755
562 7.7
66,435 62,674 3,761 5.7
5,649 5,276
373 6.6
9,351 8,578
773 8.3
Source: Georgia Department of Labor, Workforce Statistics & Economic Research
65,328 7,419
65,778 5,650 9,361
61,458 6,798
61,593 5,200 8,428
3,870 5.9 621 8.4
4,185 6.4 450 8.0 933 10.0
17
Georgia Labor Force Estimates by County (not seasonally adjusted)
Dade Dawson Decatur DeKalb Dodge
Place of Residence - Persons 16 Years and Older
Preliminary February 2015
Revised January 2015
Labor Force
Employment
Unemployment Number Rate
7,927
7,475
452 5.7
10,842 10,264
578 5.3
11,220 10,373
847 7.5
370,871 346,473 24,398 6.6
7,306 6,692
614 8.4
Labor Force
Employment
Unemployment Number Rate
7,934 7,468 466 5.9
10,827 10,251
576 5.3
11,403 10,553 850 7.5
369,331 344,938 24,393 6.6
7,338 6,708 630 8.6
Dooly Dougherty Douglas Early Echols
4,657 4,248 409 8.8
38,357 35,221 3,136 8.2
67,684 63,143 4,541 6.7
4,210 3,888
322 7.6
1,855 1,762
93 5.0
4,797 4,358 439 9.2
38,468 35,230 3,238 8.4
67,466 62,872 4,594 6.8
4,257 3,941
316 7.4
1,901 1,803
98 5.2
Effingham Elbert Emanuel Evans Fannin
26,290 24,893 1,397 5.3
7,985 7,342 643 8.1
8,361 7,624
737 8.8
4,686 4,403
283 6.0
9,541 8,816
725 7.6
26,066 24,657 1,409 5.4
8,040 7,363
677 8.4
8,514
7,738
776 9.1
4,714 4,432
282 6.0
9,589 8,836
753 7.9
Fayette Floyd Forsyth Franklin Fulton
54,128 51,171 2,957 5.5
43,049 40,074 2,975 6.9
97,908 93,295 4,613 4.7
9,014 8,389
625 6.9
512,839 479,743 33,096 6.5
53,950 50,953 2,997 5.6 43,030 39,980 3,050 7.1 97,610 92,960 4,650 4.8
9,073 8,429 644 7.1 511,155 477,823 33,332 6.5
Gilmer Glascock Glynn Gordon Grady
11,676 10,882 794 6.8
1,259 1,169
90 7.1
37,184 34,737 2,447 6.6
25,898 24,268 1,630 6.3
10,357 9,656
701 6.8
11,710 10,923
787 6.7
1,281
1,181
100 7.8
37,285 34,773 2,512 6.7
25,958 24,217 1,741 6.7
10,441 9,733
708 6.8
Greene
6,626 6,128 498 7.5
Gwinnett 442,923 418,762 24,161 5.5
Habersham 18,621 17,452 1,169 6.3
Hall
91,108 86,453 4,655 5.1
Hancock
2,543 2,274 269 10.6
6,632 441,353
18,761 90,675
2,629
6,144 488 7.4
417,112 24,241 5.5
17,562 1,199 6.4
85,966 4,709 5.2
2,306
323 12.3
Haralson Harris Hart Heard Henry
11,975 11,143
832 6.9
15,535 14,662
873 5.6
10,046 9,365
681 6.8
5,015 4,677 338 6.7
104,035 97,331 6,704 6.4
11,935 11,105 830 7.0
15,599 14,601 998 6.4
10,157 9,448
709 7.0
5,037 4,671 366 7.3
103,608 96,887 6,721 6.5
Houston Irwin Jackson Jasper Jeff Davis
64,749 60,732 4,017 6.2
3,075 2,787
288 9.4
29,710 28,117 1,593 5.4
6,553 6,163 390 6.0
6,347 5,905
442 7.0
64,802 60,704 4,098 6.3
3,142 2,832
310 9.9
29,702 28,086 1,616 5.4
6,553 6,163 390 6.0
6,381 5,920
461 7.2
Revised February 2014
Labor Force
Employment
Unemployment Number Rate
8,017 7,499
518 6.5
10,751 10,072
679 6.3
11,252 10,232 1,020 9.1
367,934 339,750 28,184 7.7
7,500 6,754
746 9.9
4,456 39,300 67,163
4,073 1,784
3,974 35,482 61,926
3,732 1,674
482 10.8 3,818 9.7 5,237 7.8
341 8.4 110 6.2
25,942 8,146 8,749 4,652 9,418
24,277 7,337 7,745 4,335 8,611
1,665 6.4 809 9.9
1,004 11.5 317 6.8 807 8.6
53,445 50,128 3,317 6.2
43,779 40,114 3,665 8.4
96,594 91,411 5,183 5.4
9,229 8,412
817 8.9
508,256 470,200 38,056 7.5
11,791 10,859
932 7.9
1,273 1,150
123 9.7
37,093 34,029 3,064 8.3
25,685 23,621 2,064 8.0
10,286 9,497
789 7.7
6,903 438,491
18,632 88,948
2,715
6,347 411,021
17,213 83,652
2,362
556 8.1 27,470 6.3
1,419 7.6 5,296 6.0
353 13.0
11,946 15,696 10,292
4,977 103,040
10,941 14,736 9,458 4,569 95,182
1,005 8.4 960 6.1 834 8.1 408 8.2
7,858 7.6
66,296 3,061
30,372 6,476 6,321
61,716 2,748 28,527 6,019 5,771
4,580 6.9 313 10.2
1,845 6.1 457 7.1 550 8.7
Source: Georgia Department of Labor, Workforce Statistics & Economic Research
18
Georgia Labor Force Estimates by County (not seasonally adjusted)
Jefferson Jenkins Johnson Jones Lamar
Place of Residence - Persons 16 Years and Older
Preliminary February 2015
Revised January 2015
Labor Force
6,479 3,255 3,845 13,516 7,760
Employment
5,863 2,958 3,551 12,734 7,118
Unemployment Number Rate
616 9.5 297 9.1 294 7.6 782 5.8 642 8.3
Labor Force
6,563 3,247 3,867 13,553 7,744
Employment
5,919 2,950 3,566 12,761 7,093
Unemployment Number Rate
644 9.8 297 9.1 301 7.8 792 5.8 651 8.4
Lanier Laurens Lee Liberty Lincoln
3,843 3,562
281 7.3
18,473 16,929 1,544 8.4
13,972 13,179
793 5.7
25,810 24,018 1,792 6.9
3,437 3,189
248 7.2
3,834 3,552
282 7.4
18,496 16,931 1,565 8.5
13,988 13,192 796 5.7
25,584 23,756 1,828 7.1
3,456 3,202 254 7.3
Long Lowndes Lumpkin McDuffie McIntosh
6,639 6,229
410 6.2
50,721 47,474 3,247 6.4
15,046 14,189
857 5.7
8,948
8,161
787 8.8
5,870 5,464 406 6.9
6,644 6,213
431 6.5
50,516 47,165 3,351 6.6
14,961 14,107 854 5.7
8,921
8,114
807 9.0
5,940
5,516
424 7.1
Macon Madison Marion Meriwether Miller
4,452 12,932 3,392
8,871 2,663
3,981 12,197 3,130
8,111 2,501
471 10.6 735 5.7 262 7.7 760 8.6 162 6.1
4,556 12,983
3,402 8,962 2,737
4,082 12,205
3,124 8,110 2,572
474 10.4 778 6.0 278 8.2 852 9.5 165 6.0
Mitchell
8,742 8,129
613 7.0
Monroe
12,594 11,847
747 5.9
Montgomery 3,867 3,522 345 8.9
Morgan
8,451 7,941
510 6.0
Murray
16,074 14,745 1,329 8.3
8,926 8,297 629 7.0
12,638 11,878
760 6.0
3,899 3,554 345 8.8
8,497 7,969
528 6.2
16,175 14,764 1,411 8.7
Muscogee Newton Oconee Oglethorpe Paulding
80,961 74,477 6,484 8.0
48,053 44,628 3,425 7.1
17,265 16,496
769 4.5
6,813 6,426
387 5.7
75,238 71,092 4,146 5.5
80,455 73,952 6,503 8.1
47,975 44,481 3,494 7.3
17,279 16,506
773 4.5
6,854 6,460 394 5.7
75,010 70,822 4,188 5.6
Peach Pickens Pierce Pike Polk
11,429 10,450
979 8.6
13,838 13,052
786 5.7
7,980 7,441 539 6.8
8,308
7,817
491 5.9
18,131 16,850 1,281 7.1
11,523 10,513 1,010 8.8
13,822 12,998
824 6.0
8,069 7,519 550 6.8
8,308 7,804 504 6.1
18,138 16,860 1,278 7.0
Pulaski Putnam Quitman Rabun Randolph
4,057 7,960
866 6,221 2,648
3,774 7,274
806 5,704 2,422
283 7.0 686 8.6
60 6.9 517 8.3 226 8.5
4,099 8,007
872 6,282 2,691
3,802 7,312
808 5,750 2,461
297 7.2 695 8.7
64 7.3 532 8.5 230 8.5
Revised February 2014
Labor Force
6,654 3,275 3,921 13,563 7,776
Employment
5,781 2,920 3,546 12,663 6,994
Unemployment Number Rate
873 13.1 355 10.8 375 9.6 900 6.6 782 10.1
3,853 18,949 14,185 25,887
3,448
3,538 17,036 13,269 23,742
3,111
315 8.2 1,913 10.1
916 6.5 2,145 8.3
337 9.8
6,606 50,978 16,637
8,986 5,796
6,103 47,240 15,625 8,062 5,279
503 7.6 3,738 7.3 1,012 6.1
924 10.3 517 8.9
4,815 12,754 3,393
8,841 2,614
4,168 11,903
3,143 7,927 2,444
647 13.4 851 6.7 250 7.4 914 10.3 170 6.5
8,619 12,677 3,884
8,318 15,928
7,899 11,793 3,454
7,741 14,247
720 8.4 884 7.0 430 11.1 577 6.9 1,681 10.6
82,259 47,886 16,945 6,658 74,372
75,130 43,670 16,098
6,206 69,573
7,129 8.7 4,216 8.8
847 5.0 452 6.8 4,799 6.5
11,682 13,803
7,915 8,280 18,361
10,529 12,790
7,292 7,657 16,768
1,153 9.9 1,013 7.3
623 7.9 623 7.5 1,593 8.7
4,152 8,072
899 6,263 2,687
3,795 7,199
816 5,623 2,417
357 8.6 873 10.8
83 9.2 640 10.2 270 10.0
Source: Georgia Department of Labor, Workforce Statistics & Economic Research
19
Georgia Labor Force Estimates by County (not seasonally adjusted)
Richmond Rockdale Schley Screven Seminole
Place of Residence - Persons 16 Years and Older
Preliminary February 2015
Revised January 2015
Labor Force
Employment
Unemployment Number Rate
Labor Force
Employment
Unemployment Number Rate
85,678 79,129 6,549 7.6
42,302 39,341 2,961 7.0
2,119 1,973
146 6.9
5,424 4,975
449 8.3
3,126 2,846
280 9.0
85,335 78,579 6,756 7.9
42,176 39,180 2,996 7.1
2,126 1,978
148 7.0
5,459 4,991 468 8.6
3,177 2,899
278 8.8
Spalding Stephens Stewart Sumter Talbot
27,681 25,276 2,405 8.7
11,123 10,331
792 7.1
2,173 2,016
157 7.2
13,375 12,181 1,194 8.9
2,846 2,620
226 7.9
27,569 25,194 2,375 8.6
11,058 10,282
776 7.0
2,190 2,031
159 7.3
13,417 12,239 1,178 8.8
2,860
2,615
245 8.6
Taliaferro Tattnall Taylor Telfair Terrell
612 9,540 2,843 5,276 3,603
559 8,883 2,571 4,852 3,287
53 8.7 657 6.9 272 9.6 424 8.0 316 8.8
621 9,665 2,874 5,224 3,581
561 9,003 2,586 4,775 3,299
60 9.7 662 6.8 288 10.0 449 8.6 282 7.9
Thomas Tift Toombs Towns Treutlen
17,034 15,775 1,259 7.4
17,771 16,564 1,207 6.8
12,341 11,172 1,169 9.5
3,904 3,589
315 8.1
2,698 2,440
258 9.6
17,092 17,911 12,436 3,905 2,737
15,793 16,679 11,273
3,581 2,461
1,299 7.6 1,232 6.9 1,163 9.4
324 8.3 276 10.1
Troup Turner Twiggs Union Upson
36,464 3,143 3,030 9,347
11,031
34,118 2,916 2,718 8,792 10,160
2,346 6.4 227 7.2 312 10.3 555 5.9 871 7.9
36,700 3,201 3,049 9,427 11,081
33,920 2,973 2,721 8,851 10,194
2,780 7.6 228 7.1 328 10.8 576 6.1 887 8.0
Walker
29,331 27,490 1,841 6.3
Walton
41,266 38,916 2,350 5.7
Ware
14,653 13,615 1,038 7.1
Warren
2,683 2,457
226 8.4
Washington
7,304 6,747
557 7.6
29,288 27,409 1,879 6.4
41,144 38,774 2,370 5.8
14,822 13,738 1,084 7.3
2,694 2,444
250 9.3
7,355 6,790 565 7.7
Wayne Webster Wheeler White Whitfield
11,603 1,010 1,876
13,724 45,160
10,709 935
1,674 12,914 42,128
894 7.7 75 7.4
202 10.8 810 5.9 3,032 6.7
11,606 1,025 1,910
13,591 45,572
10,692 948
1,702 12,808 42,100
914 7.9 77 7.5 208 10.9 783 5.8 3,472 7.6
Wilcox Wilkes Wilkinson Worth
2,824 3,907 3,683 9,031
2,592 3,591 3,390 8,396
232 8.2 316 8.1 293 8.0 635 7.0
2,875 3,940 3,669 9,073
2,639 3,628 3,383 8,456
236 8.2 312 7.9 286 7.8 617 6.8
Revised February 2014
Labor Force
Employment
Unemployment Number Rate
85,996 42,070
2,325 5,438 3,124
78,254 38,569
2,147 4,869 2,825
7,742 9.0 3,501 8.3
178 7.7 569 10.5 299 9.6
27,602 11,230
2,185 14,597 2,835
24,743 10,318 1,986 13,217 2,591
2,859 10.4 912 8.1 199 9.1
1,380 9.5 244 8.6
647 9,402 2,854 5,593 3,608
575 8,647 2,533 5,100 3,297
72 11.1 755 8.0 321 11.2 493 8.8 311 8.6
16,947 17,944 12,268 4,098
2,741
15,409 16,565 10,984
3,698 2,414
1,538 9.1 1,379 7.7 1,284 10.5
400 9.8 327 11.9
36,066 3,157 3,090 9,217
11,248
33,194 2,883 2,694 8,521 10,099
2,872 8.0 274 8.7 396 12.8 696 7.6
1,149 10.2
29,528 40,859 14,623
2,719 7,494
27,354 38,087 13,349
2,449 6,813
2,174 7.4 2,772 6.8 1,274 8.7
270 9.9 681 9.1
11,804 1,032 1,846
13,495 44,567
10,634 936
1,629 12,559 40,804
1,170 9.9 96 9.3 217 11.8
936 6.9 3,763 8.4
2,794 4,072 3,717 9,109
2,525 3,669 3,369 8,363
269 9.6 403 9.9 348 9.4 746 8.2
Source: Georgia Department of Labor, Workforce Statistics & Economic Research
20
New Developments
Global IT consulting firm Unisys Corp. has announced plans to build a service center in downtown Augusta and create around 700 jobs over five years. Unisys will occupy 60,000 square feet at the former Fort Discovery. Unisys will initially use the center to provide services to the U.S. Army, which recently selected Unisys for the Army Enterprise Service Desk, a single point of contact for Army personnel who need help desk or other end user IT support services. The company expects to hire approximately 250 employees within the first year and will work with the Fort Gordon Cyber Center of Excellence to recruit IT professionals, including Georgia veterans, for the center.
Mobile home manufacturer Live Oak Homes recently announced it will open a new facility in Coffee County that will employ 200 people by 2016. The $1.4 million Broxton plant will be Live Oak Homes' second in Georgia. The homes will be sold under the Live Oak Homes, Mossy Oaks and Plantation brands.
Fresh produce distributor Castellini Group of Companies a fresh produce distributor, will build a large-scale fresh-cut fruits and vegetables processing and produce distribution center in Conley. This will create 300 jobs and bring with it an investment of $52 million over the next few years. The Highland Heights, Kentucky-based company will create a factory in Clayton County to process and distribute produce to wholesale, retail and food service customers on the East Coast. Planning for the 180,000-square-foot facility has already begun and should open in September 2015.
Hring, a German maker of precision components and subassemblies for the automotive industry, will open its first U.S. manufacturing facility in Hartwell. This opening will create about 800 jobs by 2025 and investing $54 million into the project over the next five years. Hring, will construct a 196,000-foot training center, industrial unit and separate dining hall.
The location will be 83 Anton Haering Street in the Gateway II Industrial Park.
South Korea-based Hyundai Glovis Georgia has announced the company will relocate its parts consolidation center to a 310,000 square foot logistics center in Northwest Harris Business Park in Harris County. The expectation is that up to 190 people will be employed at the new site within four years. A major Hyundai and Kia auto parts supplier, the Hyundai Glovis Georgia facility is expected to open in the fall of 2015.
Tyson Foods has announced that it will improve its Vienna poultry plant to maximize efficiency and meet demands for their products. The company has said it will create more than 500 jobs in Vienna and the project will improve parts of the facility. In addition to adding about 100,000 square feet, some of the improvements include new equipment and production lines and processes and technology designed to benefit food safety, quality and workplace safety.
Osmose Utilities Services Inc. recently announced that it will open a new headquarters in Peachtree City. The company will construct a plant for its new headquarters at 635 Highway 74 South and create 100 new jobs in the next year. The new jobs from the project will include executive, administrative, IT/ technology and supervisory positions.
Mercedes-Benz USA recently announced it will build a nearly 12-acre headquarters campus at Georgia 400 and Abernathy Road in Sandy Springs. The company plans to build a 250,000-square-foot office building on the 12-acre slice of property. Mercedes-Benz USA, which is moving its headquarters from New Jersey, says it plans a $93 million campus and will relocate or create 800 to 1,000 jobs with hopes to open the new complex in 2017.
Note: Information in New Developments are from a variety of public sources and by no means are a comprehensive listing of new and expanding business in Georgia
Source: Georgia Department of Labor, Workforce Statistics and Economic Research
21
UNGEMeorPgLiaOUYnMemEpNloTymReAntTREaBteYs bCy OCUouNntTyIES
FEBRUARY 2015
February 2015
Dade 5.7
Catoosa 5.5
Walker
Whitfield
Murray 8.3
Fannin 7.6
Union 5.9
Towns 8.1
Rabun 8.3
6.3
6.7
Chattooga 6.9
Gordon 6.3
Floyd 6.9
Bartow 6.2
Gilmer 6.8
Pickens 5.7
Cherokee 4.9
Lumpkin 5.7
Dawson 5.3
Forsyth 4.7
White Habersham
5.9
6.3
Stephens
7.1
Hall 5.1
Banks Franklin
6.0
6.9
Jackson 5.4
Madison 5.7
Hart 6.8
Elbert 8.1
8.0% or greater 46 counties (29%)
7.0% to 7.9% 39 counties (25%)
6.0% to 6.9% 43 counties (27%)
Polk 7.1
Paulding
Cobb 5.4
Gwinnett 5.5
Barrow 5.6
Clarke 6.0
Oglethorpe 5.7
Less than 6.0% 31 counties (19%)
Haralson 6.9
Carroll 7.3
Heard 6.7
5.5 Douglas 6.7
Coweta 5.7
Fulton 6.5
DeKalb 6.6 Rockdale
Walton 5.7
Oconee 4.5
Wilkes 8.1
Lincoln 7.2
Percentages of number of counties may not total 100 due to rounding
Clayton
8.2
Fayette 5.5
Henry 6.4
Spalding 8.7
7.0 Newton 7.1
Morgan 6.0
Butts 6.7
Jasper 6.0
Putnam 8.6
Greene 7.5
Taliaferro
8.7
McDuffie
Warren 8.8
Columbia 5.3
8.4
Richmond
Hancock
7.6
10.6
Glascock
7.1
Troup 6.4
Meriwether 8.6
Pike 5.9
Lamar 8.3
Upson
Monroe 5.9
Jones 5.8
Baldwin 8.0
Washington 7.6
Jefferson 9.5
Burke 8.2
Harris 5.6
Talbot 7.9
Muscogee 8.0
Marion Chattahoochee 7.7
7.9
Taylor 9.6
Crawford 6.5
Bibb 7.1
Twiggs 10.3
Wilkinson 8.0
Peach
8.6
Macon 10.6
Houston 6.2
Bleckley 10.3
Laurens 8.4
Johnson 7.6
Emanuel 8.8
Jenkins 9.1
Screven 8.3
Treutlen 9.6
Candler 6.4
Bulloch 6.3
Effingham 5.3
8.8
Stewart 7.2
Schley 6.9
Webster 7.4
Sumter 8.9
Quitman
6.9 Randolph 8.5
Terrell 8.8
Lee 5.7
Clay 11.4
Calhoun 6.8
Dougherty 8.2
Early 7.6
Miller 6.1
Baker 7.5
Mitchell 7.0
Dooly 8.8
Pulaski 7.0
Dodge 8.4
Crisp 7.9
Wilcox 8.2
Turner 7.2
Ben Hill 10.0
Montgomery
Wheeler 10.8
8.9
Toombs 9.5
Evans 6.0
Tattnall
Telfair
6.9
8.0
Jeff Davis 7.0
Appling 7.4
Long 6.2
Bryan 5.4
Liberty 6.9
Worth 7.0
Colquitt 7.2
Irwin
9.4 Tift 6.8
Coffee 7.8
Berrien
Atkinson
8.2
7.0
Cook
7.9 Lanier
Bacon 5.8
Wayne 7.7
Ware 7.1
Pierce 6.8
Brantley 7.9
McIntosh 6.9
Glynn 6.6
Chatham 6.3
Seminole 9.0
Decatur 7.5
Grady 6.8
Thomas 7.4
Brooks 6.9
7.3
Lowndes 6.4
Clinch 7.1
Charlton 7.1
Camden 6.2
Echols
5.0
Georgia's Unemployment Rate:6.4%
Georgia's(NUont Seemasopnlaollyy mAdejunsttedR) ate: 6.4% (not seasonally adjusted) Source: Georgia Department of Labor, Workforce Statistics and Economic Research
22
Georgia Unemployment Insurance Claims by County
County
February Average Average Initial Weekly Duration
Claims Benefit Weeks
County
February Average Average Initial Weekly Duration
Claims Benefit Weeks
County
February Average Average Initial Weekly Duration
Claims Benefit Weeks
Georgia
29,291........ $260.......10.1
Appling
153........ $236.........9.6
Atkinson
46........ $239.........6.8
Bacon
10........ $201.........9.3
Baker
6........ $189.........8.5
Baldwin
258........ $179.......10.5
Banks
70........ $228.........8.4
Barrow
203........ $236.......10.7
Bartow
313........ $236.........8.8
Ben Hill
33........ $209.........7.6
Berrien
60........ $238.........5.8
Bibb
535........ $193.......12.5
Bleckley
49........ $197.......12.5
Brantley
44........ $237.......10.7
Brooks
26........$213....... 11.7
Bryan
53........$243....... 11.7
Bulloch
124........ $220.........9.2
Burke
72........ $208.........9.8
Butts
65........ $213.......10.5
Calhoun
21........ $197.........7.4
Camden
66........$227....... 11.8
Candler
35........ $241.........8.9
Carroll
507........ $203.........8.2
Catoosa
132........ $238.........7.3
Charlton
16........ $217.......14.7
Chatham
593........ $219.......12.6
Chattahoochee 13........$236.......12.0
Chattooga
26........$245....... 11.2
Cherokee
482........$263....... 11.1
Clarke
234........ $206.......10.8
Clay
13........ $199.......10.4
Clayton
954........ $221.......12.7
Clinch
12........$219....... 11.4
Cobb
1,409........ $254.......12.3
Coffee
159........ $224.........7.9
Colquitt
166........ $191.......12.1
Columbia
176........ $245.......10.9
Cook
67........ $217.........9.7
Coweta
484........ $236.........9.6
Crawford
29........$235....... 11.2
Crisp
49........ $194.........9.3
Dade
20........ $227.........9.0
Dawson
37........ $283.......10.7
Decatur
84........ $205.........9.4
DeKalb
1,966........ $234.......12.4
Dodge
46........$202....... 11.3
Dooly
26........ $175.........8.7
Dougherty
306........$190....... 11.6
Douglas
348........$243....... 11.8
Early
31........ $167.......12.1
Echols
6........ $240.......13.2
Effingham
112........$235....... 11.4
Elbert Emanuel Evans Fannin Fayette Floyd Forsyth Franklin Fulton Gilmer Glascock Glynn Gordon Grady Greene Gwinnett Habersham Hall Hancock Haralson Harris Hart Heard Henry Houston Irwin Jackson Jasper Jeff Davis Jefferson Jenkins Johnson Jones Lamar Lanier Laurens Lee Liberty Lincoln Long Lowndes Lumpkin Macon Madison Marion McDuffie McIntosh Meriwether Miller Mitchell Monroe Montgomery Morgan Murray
117........ $226.........6.5 86........ $181.........8.6 15........ $218.........9.6 92........ $186.......10.2 173........ $254.......12.1 334........ $225.........8.0 241........$274....... 11.9 67........ $227.........7.7 2,415........ $231.......12.6 159........ $244.........8.0
4........ $244.......10.6 247........$202....... 11.1 273........ $242.........6.4 105........ $191.........9.1
94........ $191.......10.9 1,722........ $259.......12.0
220........ $225.........7.7 581........ $241.........9.0
63........ $208.........8.3 70........ $216.........8.0 102........ $220.........8.8 76........ $188.........8.0 42........ $204.........6.9 632........$244....... 11.7 279........$214....... 11.5 14........ $187.........9.5 150........ $240.........9.7 38........ $230.........9.4 52........ $236.........8.3 60........ $193.........9.3 30........ $211.........8.8 36........ $212.......12.1 89........$230....... 11.2 52........ $203.......10.2 24........ $202.......10.0 193........$175....... 11.1 84........ $219.........9.2 94........ $198.......13.4 42........ $244.........9.6 20........ $201.......12.6 209........$187....... 11.5 68........ $246.........9.5 35........ $199.......13.6 89........ $225.........9.5 15........$249....... 11.1 105........ $180.........8.8 33........ $250.......12.1 117........ $217.........9.0 11........ $249.........7.4 94........ $178.........6.7 52........$228....... 11.4 51........ $197.......10.3 23........$210....... 11.3 420........ $223.........5.3
Muscogee Newton Oconee Oglethorpe Paulding Peach Pickens Pierce Pike Polk Pulaski Putnam Quitman Rabun Randolph Richmond Rockdale Schley Screven Seminole Spalding Stephens Stewart Sumter Talbot Taliaferro Tattnall Taylor Telfair Terrell Thomas Tift Toombs Towns Treutlen Troup Turner Twiggs Union Upson Walker Walton Ware Warren Washington Wayne Webster Wheeler White Whitfield Wilcox Wilkes Wilkinson Worth
694........ $208.......10.3 293........ $242.......10.7
38........ $249.......10.6 55........ $251.......10.4 296........$256....... 11.6 99........$218....... 11.3 57........$253....... 11.1 29........$209....... 11.4 46........ $202.......10.1 216........ $239.........8.2 26........$207....... 11.3 87........ $251.......10.3
1........ $330.......12.6 43........ $223.........8.4 24........ $188.........5.3 524........$201....... 11.1 273........$249....... 11.5 22........ $173.........9.4 68........ $217.........7.2 18........ $193.........9.4 306........ $197.......10.7 125........ $208.........8.5 15........ $206.......12.3 161........$170....... 11.6 25........ $204.........8.6 10........$229....... 11.9 48........ $213.........9.8 38........ $175.........9.6 27........ $205.......10.2 101........ $159.........8.6 76........ $216.......12.2 83........ $205.........9.6 173........ $210.........9.8 23........ $208.......12.4 20........ $232.........9.7 246........ $225.........8.3 16........ $160.........8.3 51........$184....... 11.8 83........ $230.........9.9 84........ $202.........8.4 454........ $246.........6.2 234........ $230.......10.6 73........$220....... 11.3 39........ $214.........8.0 80........ $177.........9.7 60........ $225.......12.2 12........ $235.......12.3 24........ $228.......10.2 102........ $188.........9.7 857........ $223.........5.3 12........ $191.........9.5 45........ $206.......10.3 57........$183....... 11.8 52........ $214.........9.6
Note: Initial claims include intrastate initial and additional claims, as well as agent state initial and additional claims for regular UI only. Average duration of benefits is represented in weeks.
Data does not include state or federal extended benefits.
Source: Georgia Department of Labor, Workforce Statistics and Economic Research
23
Mark Butler, Commissioner 148 Andrew Young International Boulevard, N.E. Atlanta, Georgia 30303-1751
Return Service Requested