- Collection:
- Georgia Government Publications
- Title:
- Dimensions: measuring Georgia's workforce, Vol. 39, no. 12 (Annual issue)
- Creator:
- Georgia. Department of Labor
- Contributor to Resource:
- Georgia. Workforce Information and Analysis
- Publisher:
- Atlanta, Ga. : Georgia Dept. of Labor, 2013
- Date of Original:
- 2013
- Subject:
- Labor market--Georgia--Statistics
Wages--Georgia--Statistics
Hours of labor--Georgia--Statistics - Location:
- United States, Georgia, 32.75042, -83.50018
- Medium:
- state government records
- Type:
- Text
- Format:
- application/pdf
- External Identifiers:
- Call Number GA L200.E46 P1 T7 39/12
- Metadata URL:
- https://dlg.galileo.usg.edu/id:dlg_ggpd_i-ga-bl200-pe46-bp1-bt7-b39-s12-belec-p-btext
- Digital Object URL:
- https://dlg.galileo.usg.edu/do:dlg_ggpd_i-ga-bl200-pe46-bp1-bt7-b39-s12-belec-p-btext
- Language:
- eng
- Holding Institution:
- University of Georgia. Map and Government Information Library
- Rights:
-

Revised estimates for 2012-- 2013 in this issue
Annual 2013 Employment Situation
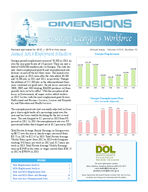
Georgia payroll employment increased 78,500 in 2013, an over the year growth rate of 2.0 percent. There are now a total of 4,033,400 nonfarm jobs in Georgia. The state has now shown employment growth and unemployment rate declines in each of the last three years. The annual average job gains in 2013 come after the state added 40,200 and 53,500 jobs in 2011 and 2012, respectively. Though the addition of 172,200 jobs in the aforementioned three years combined are good news, the job losses incurred in 2008, 2009, and 2010 totaling 306,000 positions cut from payrolls have yet to be offset. With the exception of job losses in Government, all major sectors added workers in 2013. Sectors with the most employment growth were Professional and Business Services, Leisure and Hospitality, and Education and Health Services.
The unemployment rate (not seasonally adjusted) in Georgia is down eight-tenths of a percentage point over the year and has been steadily declining for the last several years. The rate dropped to 8.2 percent in 2013 from 9.0 percent in 2012. In 2011 the unemployment rate was 9.9 percent and before that it topped out at 10.2 percent in 2010.
Total Private Average Hourly Earnings in Georgia were up $0.72 over the year as hourly wages increased from $21.75 in 2012 to $22.47 in 2013. Total Private Average Weekly Hours grew from 2012 to 2013 with Georgians working 35.0 hours per week in 2012 and 35.2 hours per week in 2013. Total Private Average Weekly Earnings were up $29.69 in the states as wages moved from $761.25 in 2012 to $790.94 in 2013.
INSIDE
State Employment Analysis................................................ 2 MSA Employment Analysis................................................ 3 State and MSA Employment Data...................................... 7 State and MSA Hours and Earnings.................................. 26 State and Area Unemployment Data................................. 31
Annual Issue - Volume XXXIX, Number 12 Georgia Employment
4,167,200
4,111,700
4,123,100
4,033,400
3,900,900
3,861,200
3,901,400
3,954,900
2006
2007
2008
2009
2010
2011
2012
2013
Georgia Unemployment Rate
(Not Seasonally Adjusted)
4.7%
4.6%
6.3%
9.7%
10.2%
9.9%
9.0%
8.2%
2006
2007
2008
2009
2010
2011
2012
2013
Workforce Statistics & Economic Research Mark Butler, Commissioner
For more information, contact Corey Smith or Jonathan Roche at (404) 232-3875
corey.smith@dol.state.ga.us jonathan.roche@dol.state.ga.us
Equal Opportunity Employer/ProgramAuxiliary Aids and Services Available upon Request to Individuals with Disabilities
Annual Dimensions - Measuring Georgia's Workforce
Georgia Annual Employment Change
150,000 100,000 50,000
86,600
55,500
40,200
53,500
78,500
0
-50,000 -100,000
-44,100
-39,700
-150,000
-200,000
-250,000
-222,200
2006
2007
2008
2009
2010
2011
2012
2013
2013 Nonfarm Payroll Employment by Industry Sector
ing 4,100 jobs in 2012. Retail Trade positions were up 7,800 in 2013 after growing by 4,500 in 2012. The Transportation, Warehousing, and Utilities industry added 1,000 jobs in 2013 after adding 3,000 workers in 2012.
The Information sector added 1,800 jobs to Georgia payrolls in 2013. The employment growth in 2013 just tops the 1,700 jobs added in 2012. The Information sector, which includes the publishing, motion picture, sound recording, telecommunications, and data processing industries, has added workers in only three (2007, 2012, and 2013) of the last 12 years.
The Financial Activities sector added 3,700 jobs in 2013 after growing by 3,400 in 2012 and 4,900 in 2011. The sector lost an average of 8,200 jobs per year in 2008, 2009, and 2010. In 2013, the Finance and Insurance industry added 3,100 workers, while the Real Estate, Rental and Leasing industry added 600.
After losing workers for six consecutive years, Georgia's Mining and Logging sector added 300 jobs in 2013. Total employment in the sector was 8,600 in 2012 and inched up to 8,900 in 2013.
The Construction sector grew by 4,700 jobs over the year. Before 2013, Construction positions in the state had declined for five straight years. Job losses from 2008-2012 were, respectively, -17,100, -38,300, -16,100, -3,800, and -4,400. In 2013, of the 4,700 Construction jobs added in the state, 1,400 were in the Construction of Buildings industry, Heavy and Civil Engineering Construction grew by 300, and Specialty Trade Contractors saw the largest increase at it added 3,100 positions.
The Manufacturing sector in Georgia grew by 2,600 jobs in 2013 after payrolls were up by 4,000 in 2012 and 5,600 in 2011. These three years of employment growth in the sector came after five years of job losses. Including 2013, Manufacturing payrolls in the state have grown in only four of the last 16 years (2005, 2011, 2012, and 2013). All of the 2,600 jobs added in 2013 were in Durable Goods Manufacturing (+4,200 jobs) while Non-Durable Goods Manufacturing (-1,700 jobs) saw payrolls shrink.
All Employee Average Hourly Earnings in the Manufacturing sector increased $0.59 over the year as earnings grew from $21.62 in 2012 to $22.21 in 2013. Average Weekly Hours were also up as the workweek grew from 40.2 hours in 2012 to 41.8 hours in 2013. Average Weekly Earnings increased from $869.12 in 2012 to $928.38 in 2013.
Production Worker Average Hourly Earnings increased $0.18 in the Manufacturing sector; from $17.90 in 2012 to $18.08 in 2013. Average Weekly Hours were also up; from 40.2 hours in 2012 to 41.5 hours in 2013 while Average Weekly Earnings moved from $719.58 in 2012 to $750.32 in 2013.
Trade, Transportation and Utilities employment grew by 12,100 in 2013 after growing by 11,500 and 11,800 in 2012 and 2011, respectively. The sector endured job losses in the previous three years with employment down 8,800 in 2010 after dropping by 54,900 in 2009 and 13,000 in 2008. The Wholesale Trade portion of this sector added 3,200 jobs in 2013 after add-
Professional and Business Services employment was up 24,900 workers in 2013 after growing by 17,200 jobs in 2012. The sector is broken into three industries: Professional and Technical Services where 6,900 jobs were added in 2013; Management of Companies and Enterprises which gained 2,900 new positions in 2013; and Administrative and Support Services where employment grew by 15,100 over the year.
After growing by 10,600 in 2012, the Education and Health Services sector added 13,400 payroll positions in 2013 as both the education segment and the health services portion of the sector experienced gains. The Educational Services industry grew by 600 while the Health Care and Social Services industry grew by 12,800 over the year. In the twenty-year span from 1994-2013, Educational and Health Services has grown by an average of 11,500 jobs per year.
Payrolls in Georgia's Leisure and Hospitality sector were up 17,800 in 2013 after growing by 12,100 in 2012 and 7,700 in 2011. This comes after the sector lost 5,400 jobs in 2010, shed 14,300 positions in 2009, and cut 2,200 workers in 2008. Prior to 2008 the sector had grown for 16 consecutive years without contraction. The Arts and Entertainment portion of the sector added 1,600 jobs in 2013 after growing by 1,000 in 2012 while the Accommodation and Food Services portion of the sector added 16,300 payroll employees in 2013 and 1,200 in 2012.
Employment in Other Services grew by 1,200 in 2013 after it lost 500 jobs in 2012 and held flat in 2011. In 2010, the sector lost 3,000 jobs while payrolls were down 4,300 in 2009. The 1,200 jobs gained in 2013 were a result of Repair and Maintenance adding 1,200 workers and the 400 jobs created in Personal and Laundry Services being offset by the 400 positions cut in Religious, Civic, and Similar Organizations.
The number of Government jobs in Georgia dropped by 4,100 in 2013 after being down 1,600 in 2012 and falling 11,900 in 2011; the sector has now contracted for five consecutive years, shedding 29,300 jobs over the span. Federal Government payrolls were down 2,400 in 2013 after being cut 1,900 in 2012. State Government jobs were down 1,600 in 2013 and have now fallen five years in a row. Local Government payrolls added 100 jobs in 2013 after adding 900 positions in 2012.
Note: Data may not add due to rounding.
2
Source: Georgia Department of Labor, Workforce Statistics & Economic Research
MSA Nonagricultural Employment
2006 2013 Annual Employment Change
Albany MSA
500
300
100
0
-500 -500
100
-200
-100
-1,000
-900
-1,500
-2,000
-2,500
-2,300
2006
2007
2008
2009
2010
2011
2012
2013
3,000 2,000 1,000
0 -1,000 -2,000 -3,000 -4,000 -5,000
2,200 2006
2,000 2007
Athens MSA
1,500 200
-1,100
-4,300
2008
2009
2010
2011
1,200 2012
1,700 2013
With 100 jobs added in 2013, the Albany MSA saw its first over-the-year job growth since 2007. Total employment in the MSA remains 3,900 positions short of its 2007 high. The modest over-the-year job gains occurred as Private Sector employment growth, including Manufacturing (+100 jobs), was tempered by Government job losses.
The Athens MSA added jobs for the third year in a row in 2013, showing an increase of 1,700 positions over the year; though employment remains below its 2008 peak. The over-the-year growth was driven by Private Service-Providing industries, including a second year of growth for Trade, Transportation, and Utilities as well as a third year of job gains for Leisure and Hospitality. Government employment stayed flat over the year.
Atlanta MSA
120,000
80,000 66,100 40,000
48,800
35,500
42,400
56,900
0 -40,000
-26,600
-20,800
-80,000
-120,000
-160,000 2006
2007
2008
-136,100 2009
2010
2011
2012
2013
Augusta MSA
4,000 2,000
2,300
0
-400
-300
-2,000
1,300
1,800
1,600
800
-4,000
-6,000
-6,400
-8,000
2006
2007
2008
2009
2010
2011
2012
2013
The Atlanta MSA added 56,900 jobs in 2013. With its third consecutive year of job growth, the area is still 48,700 positions short of its 2007 employment peak. Adding a combined total of 47,600 jobs, Professional and Business Services, Leisure and Hospitality, Education and Health Services, and Trade, Transportation and Utilities led the major sectors in over-the-year employment growth. Meanwhile, after shedding 2,000 jobs in 2012, Government employment declined by 2,800 in 2013, led by losses in Local Government (-2,500 jobs).
There were 1,600 jobs gained in the Augusta MSA in 2013. The MSA has now added positions for the fourth year in a row though employment remains below a 2007 peak of 219,000 jobs. The Leisure and Hospitality sector, adding 1,300 payroll positions, led the way in job growth in 2013. The Government sector lost jobs in 2013 as federal and state positions were cut and local positions held steady.
Note: MSA = Metropolitan Statistical Area
Source: Georgia Department of Labor, Workforce Statistics & Economic Research
3
MSA Nonagricultural Employment
2006 2013 Annual Employment Change
Brunswick MSA
1,000
500
600
500
600 200
0
-100 -500
-500
-1,000
-1,500
-2,000 -2,500
-2,000
-3,000
-2,800
2006
2007
2008
2009
2010
2011
2012
2013
Employment in the Brunswick MSA grew by 200 jobs in 2013 after being up 600 positions in 2012. Brunswick employment is still 4,600 positions short of its 2007 high. Private ServiceProviding industries including Trade, Transportation and Utilities (+200 jobs) added 500 jobs over the year. Losses in Federal Government countered gains in Local Government, leading to no change in Government employment in 2013.
Columbus MSA
2,500
1,500 500
500
1,500
1,000
900
0
-500 -1,500
-100 -800
-2,500
-3,500 -4,500
2006
2007
2008
-3,900 2009
2010
2011
2012
2013
The Columbus MSA added jobs for the third year in a row in 2013, with employment growing by 900. Though employment has not returned to its 2006 high of 122,700, the metro area has not lost jobs in four years. The job gains occurred in the Private Service-Providing sector, in industries including Professional and Business Services (+500 jobs) and Leisure and Hospitality (+300 jobs). Government employment held flat over the year with losses in Federal Government countering gains in State and Local Government.
3,000 1,500
1,500
Dalton MSA
0 -1,500 -3,000
-1,300
-600
-500
-100
-2,100
-4,500 -6,000
-4,500
-7,500 -9,000
2006
2007
-7,200
2008
2009
2010
2011
2012
2013
Employment in the Dalton MSA was down 100 in 2013 and has now declined for the seventh year in a row, down 16,300 jobs since 2006. Service-Providing employment held flat over the year, with gains in industries like Trade, Transportation and Utilities (+200 jobs) being balanced by losses in sectors including Professional and Business Services (-500 jobs). Meanwhile, Manufacturing employment was down 100 in 2013 after declining by 1,400 in 2012.
6,000
4,000 2,000
3,000
0
-2,000
-4,000
-6,000
-8,000
2006
Gainesville MSA
3,700 500
1,600 -100
2007
2008
-6,200 2009
2010
2011
1,900 2012
2,000 2013
With 2,000 jobs added in 2013, Gainesville MSA employment grew for the third year in a row. Having added 5,500 jobs since 2011, employment is still below a 2008 high of 77,800 jobs. The over-the-year gain of positions occurred largely in Private Service-Providing industries including Trade, Transportation and Utilities (+400 jobs). Goods-Producing sectors also added 700 jobs, while Government employment remained flat over the year.
Note: MSA = Metropolitan Statistical Area
Source: Georgia Department of Labor, Workforce Statistics & Economic Research
4
MSA Nonagricultural Employment
2006 2013 Annual Employment Change
Hinesville - Ft. Stewart MSA
1,200
1,100
1,000
800
600
500
400
200
100
0
400 300
100
-200
-400 2006
2007
2008
2009
2010
2011
-200 2012
-300 2013
Following 14 consecutive years of employment growth, the Hinesville-Fort Stewart MSA saw a second straight year of job losses as 300 positions were cut in 2013. Over-the-year gains in Goods-Producing industries were overshadowed by losses in Private Service-Providing and Government sectors. HinesvilleFort Stewart was one of only three MSAs statewide (out of 14) that saw declines in employment in 2013.
Macon MSA
2,000 1,000
0
800 100
1,200
1,200
600
-1,000
-500
-2,000
-1,000
-3,000
-4,000
-5,000 -6,000
2006
2007
2008
-5,200 2009
2010
2011
2012
2013
Employment in the Macon MSA increased for the third year in a row in 2013, adding 600 jobs over the year. Despite this employment growth, Macon remains 3,200 jobs below a 2008 peak. Employment increased over the year in Private-ServiceProviding and Goods-Producing industries including Trade, Transportation, and Utilities (+600 jobs) and Professional and Business Services (+400 jobs). Government employment declined in 2013, with all losses in State Government. This offset Government growth in 2012.
Rome MSA
500
300
200
0 -500 -1,000
-100 -600
-500
-400
-1,500
-1,200
-2,000
-2,500
2006
2007
2008
-2,200 2009
2010
2011
2012
2013
9,000 6,000
6,100
3,000
0
-3,000
-6,000
-9,000
-12,000
2006
Savannah MSA
5,500 -2,100
1,400 100
-8,300
2007
2008
2009
2010
2011
3,600 2012
4,100 2013
The Rome MSA saw a second year of employment gains in 2013, adding 200 jobs following six years of losses. Goods-Producing industries saw flat growth over the year, with all growth occurring in Private Service-Providing sectors such as Trade, Transportation, and Utilities (+600 jobs) and Education and Health Services (+100 jobs). Government saw employment declines over the year, with all losses in Local Government.
Employment in the Savannah MSA increased for the fourth year in a row, adding 4,100 jobs in 2013. Despite these four years of gains, employment continues to be lower than a 2007 high of 162,200 jobs. Over-the-year growth occurred as no major industry saw employment declines in 2013. Industries such as Professional and Business Services (+1,300 jobs) and Leisure and Hospitality (+1,100 jobs) led the overall increase in employment. Government declines in 2013 came as Federal Government losses offset gains in Local Government.
Note: MSA = Metropolitan Statistical Area
Source: Georgia Department of Labor, Workforce Statistics & Economic Research
5
MSA Nonagricultural Employment
2006 2013 Annual Employment Change
Valdosta MSA
2,500
1,500 1,100 800
500
100
-500
800 200
-100
-1,500
-2,500
-3,500
2006
2007
-1,400
2008
-2,900 2009
2010
2011
2012
2013
Warner Robins MSA
4,000 3,500
3,400
3,000
2,500 2,000
1,900
1,500
1,000 500 0
500
400
200
200
0
-500 -1,000
2006
2007
2008
2009
2010
2011
2012
-400 2013
The Valdosta MSA saw jobs grow by 200 in 2013, the second straight year of gains after three years of job losses. Both Goods-Producing and Private Service-Providing industries had over-the-year employment increases, with sectors such as Trade, Transportation, and Utilities adding jobs. Government employment declined in 2013, following two years of growth.
Having gone 21 straight years without job losses, a second year of decreases in Federal Government employment largely led to the first overall loss of jobs in the Warner Robins MSA in over two decades. The 400 jobs lost in the MSA in 2013 came from Private Service-Providing industry employment gains being offset by large cuts in Federal Government jobs and a sixth year of losses in Goods-Producing sectors.
Note: MSA = Metropolitan Statistical Area
Source: Georgia Department of Labor, Workforce Statistics & Economic Research
6
GEORGIA Nonagricultural Employment (000s)
2013 Preliminary Series
Industry
Total Nonfarm Total Private Goods Producing Service-Providing Private Service-Providing Mining and Logging Construction
Construction of Buildings Heavy and Civil Engineering Construction Specialty Trade Contractors Manufacturing Durable Goods Computer, Electrical Equip and Appliance Mfg Transportation Equipment Manufacturing Non-Durable Goods Food Manufacturing Textile Mills Textile Product Mills Trade, Transportation, and Utilities Wholesale Trade Merchant Wholesalers, Durable Goods Merchant Wholesalers, Nondurable Goods Wholesale Electronic Markets and Agents and Brokers Retail Trade Food and Beverage Stores General Merchandise Stores Miscellaneous Store Retailers Transportation, Warehousing, and Utilities Utilities Transportation and Warehousing Air Transportation Truck Transportation Couriers and Messengers Warehousing and Storage Information Telecommunications Wired Telecommunications Carriers Wireless Telecommunications Carriers Internet Service Providers, Search Portals, and DP Financial Activities Finance and Insurance Insurance Carriers and Related Activities Real Estate and Rental and Leasing Professional and Business Services Professional, Scientific, and Technical Services Accounting, Tax Prep, and Bookkeeping Services Architectural, Engineering, and Related Services Computer Systems Design and Related Services Management and Technical Consulting Services Management of Companies and Enterprises Admin and Support, Waste Mngmnt and Remediation Employment Services Education and Health Services Educational Services Colleges, Universities, and Professional Schools Health Care and Social Assistance Ambulatory Health Care Services Hospitals Nursing and Residential Care Facilities Social Assistance Leisure and Hospitality Arts, Entertainment, and Recreation Amusement, Gambling, and Recreation Industries Accommodation and Food Services Accommodation Food Services and Drinking Places Other Services Repair and Maintenance Personal and Laundry Services Religious, Grantmaking, Civic, Professional, and Similar Government Federal Government Department of Defense State Government State Government Educational Services Local Government Local Government Educational Services
J an
3951.2 3265.7 502.4 3448.8 2763.3
8.7 138.6 31.2 19.6
87.8 355.1 168.6 22.7 44.3 186.5 62.7 18.4 26.8 831.7 202.2 98.3 60.0 43.9 442.4 84.2 99.8 20.1 187.1 19.6 167.5 39.2 45.0 20.2 27.3 100.7
47.8 29.0 11.7 6.6 226.4 169.5 80.8 56.9 563.9 234.1 40.1 36.7 56.6 32.6 58.3 271.5 127.0 501.1 67.1 31.6 434.0 168.2 147.7 58.1 60.0 388.0 37.0 27.3 351.0 38.9 312.1 151.5 34.1 33.7 83.7 685.5 101.8 41.5 172.8 98.9 410.9 244.8
Feb
3979.7 3288.1 504.8 3474.9 2783.3
8.7 140.0 31.4 19.6 89.0 356.1 169.8 22.8 44.6 186.3 62.7 18.3 26.6 829.8 203.2 98.8 60.1 44.3 441.0 85.0
97.8 20.0 185.6 19.6 166.0 39.1 45.2 18.6 27.1 101.8 48.1 29.1 11.8 6.4 227.3 170.3 81.3 57.0 573.9 238.2 43.1 36.7 57.0 32.7 58.5 277.2 131.5 505.9 69.5 33.1 436.4 170.2 147.5 58.2 60.5 392.2 37.4 27.5 354.8 39.3 315.5 152.4 34.8 33.7 83.9 691.6 101.7 41.5 177.5 103.6 412.4 246.0
M ar
3995.2 3302.1
507.6 3487.6 2794.5
8.7 142.2 31.9 19.9 90.4 356.7 170.4 23.0 44.7 186.3 62.4 18.3 26.7 830.2 202.9 98.7 59.8 44.4 442.0 84.7 98.0 19.7 185.3 19.7 165.6 38.7 45.4 18.7 26.9 101.8 48.0
29.1 11.7 6.5 227.6 170.2 81.3 57.4 577.4 237.5 42.7 36.8 56.7 32.7 58.9 281.0 134.1 506.0 69.3 32.7 436.7 169.2 148.4 58.4 60.7 399.4 39.3 29.2 360.1 40.3 319.8 152.1 34.8 33.5 83.8 693.1 101.1 41.3 177.9 104.4 414.1 246.6
Apr
4032.1 3339.0 508.0 3524.1 2831.0
8.9 142.9 31.9 19.9
91.1 356.2 170.8 23.0 44.9 185.4
61.6 18.4 26.4 837.1 204.5 99.1 60.5 44.9 445.8 85.3 98.6 20.1 186.8 19.6 167.2 39.7 46.0 18.6 27.0 102.3 48.0 29.2 11.6 6.7 229.0 171.3 81.7 57.7 583.1 240.4 44.1 36.8 57.4 33.0 59.7 283.0 132.6 510.3 69.9 33.2 440.4 171.6 148.9 58.3 61.6 415.2 45.4 33.4 369.8 40.9 328.9 154.0 35.2 34.6 84.2 693.1 101.0 41.2 179.0 105.2 413.1 244.8
M ay
4044.9 3356.2
510.6 3534.3 2845.6
8.9 145.5 32.3 20.4 92.8 356.2 170.9
23.1 44.6 185.3 61.1 18.5 26.3 841.3 205.2 99.3 60.6 45.3 448.8 86.3 99.2 20.5 187.3 19.6 167.7 39.4 46.4 18.7 26.9 102.9 48.4 29.1 12.1 6.8 229.7 171.6 82.0 58.1 585.3 237.8 40.4 37.0 57.7 33.2 59.8 287.7 137.0 510.7 68.7 32.0 442.0 172.5 149.3 58.6 61.6 420.7 45.9 33.6 374.8 41.7 333.1 155.0 35.3 34.5 85.2 688.7 100.1 40.7 173.8 100.3 414.8 245.3
Jun
4027.0 3352.6
511.9 3515.1 2840.7
8.8 146.4 32.3 20.7 93.4 356.7 171.0
23.1 44.8 185.7 61.3 18.5 26.3 841.0 205.1 99.4 60.6 45.1 449.5 86.3 100.4 20.3 186.4 19.6 166.8 38.6 46.5 18.8 27.1 102.3 48.4 29.3 11.8
6.7 230.0 172.1 82.4
57.9 587.8 236.1 38.4 36.9 57.4 33.3 60.7 291.0 139.8 502.6 65.4
31.1 437.2 171.2 149.1 58.6 58.3 421.3 47.8 35.8 373.5 42.1 331.4 155.7 35.1 34.3 86.3 674.4 99.8 40.7 167.8 93.8 406.8 235.9
Jul
4015.1 3361.5
514.2 3500.9 2847.3
8.9 148.1 32.9 20.9 94.3 357.2 171.3 23.0 44.3 185.9 61.3 18.6 26.2 845.9 205.6 99.6 60.7 45.3 453.1 86.6 101.1 20.6 187.2 19.5 167.7 39.4 46.9 18.7 27.2 102.2 48.1 28.8 12.0
6.5 231.5 172.9 82.8 58.6 589.7 238.4 39.4 36.9 58.1 33.6 60.5 290.8 137.2 500.3 63.8 29.9 436.5 171.8 149.3 58.5 56.9 421.7 46.7 35.3 375.0 42.3 332.7 156.0 35.2 34.6 86.2 653.6 99.7 40.6 166.2 93.1 387.7 217.3
Aug
4053.6 3383.6
516.3 3537.3 2867.3
8.9 149.4 33.0
21.1 95.3 358.0 171.7 22.9 44.4 186.3 61.6 18.7 26.2 849.6 206.0 99.8 61.0 45.2 455.9 86.6 102.2 20.8 187.7 19.5 168.2 39.1 47.1 18.7 27.0 102.6 48.9 29.4 12.0 6.5 232.2 173.4 83.1 58.8 595.4 238.5 39.1 36.9 58.6 33.7 61.0 295.9 141.8 509.1 66.2 30.3 442.9 173.1 150.1 58.8 60.9 423.0 45.2 33.6 377.8 42.0 335.8 155.4 35.2 34.8 85.4 670.0 99.4 40.4 168.5 96.0 402.1 233.2
Sep
4049.2 3368.4
515.2 3534.0 2853.2
8.8 149.0 32.9
21.1 95.0 357.4 170.9 22.9 44.4 186.5 61.8 18.6 26.2 845.4 204.9 99.1 60.6 45.2 453.6 86.8 102.4 20.6 186.9 19.4 167.5 38.7 46.6 18.9 27.1 102.0 48.8 29.4 12.0 6.5 230.5 172.1 82.5 58.4 595.5 237.9 40.1 36.7 58.3 33.4 61.1 296.5 142.6 509.9 68.3 31.6 441.6 171.6 150.1 58.8 61.1 415.4 42.7 31.5 372.7 41.4 331.3 154.5 35.2 34.2 85.1 680.8 99.1 40.3 176.4 103.9 405.3 237.4
Oct
4070.4 3386.8
517.5 3552.9 2869.3
8.9 150.5 32.6 21.4 96.5 358.1 172.4 22.8 44.5 185.7
62.1 18.7 26.1 852.6 206.1 99.2 60.6 46.3 458.6 87.8 103.7 21.3 187.9 19.4 168.5 38.9 46.8 18.8 27.2 101.7 48.9 29.5 12.1 6.5 231.7 172.9 82.9 58.8 595.5 238.0 39.1 37.3 59.7 33.7 61.3 296.2 144.5 516.3 71.3 32.6 445.0 174.7 150.6 58.6 61.1 415.8 43.5 31.0 372.3 40.5 331.8 155.7 36.1 34.5 85.1 683.6 98.8 40.4 176.8 104.9 408.0 239.6
Nov
4093.8 3409.1 519.8 3574.0 2889.3
9.0 152.4 33.3 21.8
97.3 358.4 172.4 22.7 44.6 186.0
61.9 18.7 25.7 866.8 207.7 100.7 61.1 45.9 467.9 89.0 108.3 21.2 191.2 19.5 171.7 38.9 47.7 20.6 27.3 102.5 49.2 29.6 12.1 6.5 233.6 174.5 84.7 59.1 597.8 241.3 38.9 37.2 59.1 33.2 61.2 295.3 143.4 517.8 71.1 32.7 446.7 176.1 150.8 58.8 61.0 415.1 40.2 27.8 374.9 39.4 335.5 155.7 36.2 34.1 85.4 684.7 99.3 40.4 176.5 105.3 408.9 240.3
Annual Dec Average
4088.2 3406.4
518.6 3569.6 2887.8
9.0 149.6 33.1 21.6 94.9 360.0 173.4 22.8 44.8 186.6 61.9 18.7 25.9 875.9 208.0 100.3 61.0 46.7 474.4 89.3 111.2 21.2 193.5 19.5 174.0 39.1 46.1 23.7
27.3 102.7 49.4 29.3 12.2
6.5 233.9 175.0
85.1 58.9 593.3 242.5 41.0 37.6 59.2 32.7 61.4 289.4 140.7 514.1 70.0 31.9 444.1 174.3 150.4 59.1 60.3 413.9 39.7 27.2 374.2 38.2 336.0 154.0 35.2 33.6 85.2 681.8 99.5 40.3 174.5 103.8 407.8 240.2
4033.4 3351.6 512.2 3521.1 2839.4
8.9 146.2 32.4 20.7 93.2 357.2 171.1 22.9 44.6 186.0
61.9 18.5 26.3 845.6 205.1 99.4 60.6 45.2 452.8 86.5 101.9 20.5 187.7 19.5 168.2 39.1 46.3 19.4 27.1 102.1 48.5 29.2 11.9 6.6 230.3 172.2 82.6 58.1 586.6 238.4 40.5 37.0 58.0 33.2 60.2 288.0 137.7 508.7 68.4 31.9 440.3 172.0 149.4 58.6 60.3 411.8 42.6 31.1 369.2 40.6 328.7 154.3 35.2 34.2 85.0 681.7 100.1 40.8 174.0 101.1 407.7 239.3
Note: These not seasonally adjusted estimates were prepared in cooperation with the U.S. Department of Labor, Bureau of Labor Statistics, based upon monthly reports
submitted by selected employers throughout Georgia. The estimates include all full- and part-time wage and salary workers who were employed during or received pay for any part of the pay period that includes the twelfth of the month. Proprietors, domestic workers, self-employed persons, unpaid family workers and personnel of the armed forces are excluded. Estimates based on 2013 benchmark.
Source: Georgia Department of Labor, Workforce Statistics & Economic Research
7
GEORGIA Nonagricultural Employment (000s)
2012 Final Series
Industry
Total Nonfarm Total Private Goods Producing Service-Providing Private Service-Providing Mining and Logging Construction
Construction of Buildings Heavy and Civil Engineering Construction Specialty Trade Contractors Manufacturing Durable Goods Computer, Electrical Equip and Appliance Mfg Transportation Equipment Manufacturing Non-Durable Goods Food Manufacturing Textile Mills Textile Product Mills Trade, Transportation, and Utilities Wholesale Trade Merchant Wholesalers, Durable Goods Merchant Wholesalers, Nondurable Goods Wholesale Electronic Markets and Agents and Brokers Retail Trade Food and Beverage Stores General Merchandise Stores Miscellaneous Store Retailers Transportation, Warehousing, and Utilities Utilities Transportation and Warehousing Air Transportation Truck Transportation Couriers and Messengers Warehousing and Storage Information Telecommunications Wired Telecommunications Carriers Wireless Telecommunications Carriers Internet Service Providers, Search Portals, and DP Financial Activities Finance and Insurance Insurance Carriers and Related Activities Real Estate and Rental and Leasing Professional and Business Services Professional, Scientific, and Technical Services Accounting, Tax Prep, and Bookkeeping Services Architectural, Engineering, and Related Services Computer Systems Design and Related Services Management and Technical Consulting Services Management of Companies and Enterprises Admin and Support, Waste Mngmnt and Remediation Employment Services Education and Health Services Educational Services Colleges, Universities, and Professional Schools Health Care and Social Assistance Ambulatory Health Care Services Hospitals Nursing and Residential Care Facilities Social Assistance Leisure and Hospitality Arts, Entertainment, and Recreation Amusement, Gambling, and Recreation Industries Accommodation and Food Services Accommodation Food Services and Drinking Places Other Services Repair and Maintenance Personal and Laundry Services Religious, Grantmaking, Civic, Professional, and Similar Government Federal Government Department of Defense State Government State Government Educational Services Local Government Local Government Educational Services
J an
3877.5 3193.9
498.2 3379.3 2695.7
8.6 138.3
30.0 20.4 87.9 351.3 163.6 22.7 42.6 187.7 62.9 18.6 27.1 823.4 198.1 97.4 58.1 42.6 440.5 83.0 103.8 20.2 184.8 19.9 164.9 39.6 43.9 18.8 27.5 98.0 46.4 28.7 11.2
6.1 225.0 168.5
78.2 56.5 539.8 228.9 40.1 35.9 54.5 31.3 56.1 254.8 115.7 486.2 67.1 31.3 419.1 160.0 143.2 57.1 58.8 372.8 35.4 25.7 337.4 37.8 299.6 150.5 33.1 32.7 84.7 683.6 103.3 42.3 174.4 98.6 405.9 249.1
Feb
3899.0 3210.4
499.7 3399.3 2710.7
8.7 139.3
30.1 20.2 89.0 351.7 164.2 22.7 43.0 187.5 62.6 18.7 26.8 820.4 199.3 98.0 58.4 42.9 436.4 82.3 101.1 20.0 184.7 19.9 164.8 39.4 44.0 18.5 27.5 99.3 46.4 28.6 11.2
6.1 225.5 169.0
78.3 56.5 547.0 232.1 41.7 36.2 54.9 32.1 56.2 258.7 119.4 490.9 69.1 32.5 421.8 161.6 143.7 57.2 59.3 376.1 35.9 25.8 340.2 38.0 302.2 151.5 33.6 33.0 84.9 688.6 103.0 42.3 177.0 101.5 408.6 251.3
M ar
3922.3 3228.5
501.0 3421.3 2727.5
8.5 139.9
30.7 20.2 89.0 352.6 165.0 22.8 43.2 187.6 62.5 18.9 26.9 822.6 199.3 97.8 58.6 42.9 438.1 81.9 101.4 19.7 185.2 19.9 165.3 39.7 44.1 18.6 27.4 99.1 46.4 28.6 11.2
6.3 225.9 168.7
78.4 57.2 551.6 231.2 41.4 36.3 54.6 31.6 56.4 264.0 123.4 491.2 69.0 32.4 422.2 160.9 144.3 57.5 59.5 385.7 38.5 28.0 347.2 39.0 308.2 151.4 33.5 32.8 85.1 693.8 103.1 42.3 177.2 101.8 413.5 252.5
Apr
3956.0 3262.1
503.1 3452.9 2759.0
8.6 140.9
30.3 20.3 90.3 353.6 166.3 22.9 43.5 187.3 62.2 18.6 27.1 828.3 200.9 98.4 59.2 43.3 441.1 82.0 102.0 20.0 186.3 19.8 166.5 40.2 44.7 18.6 27.5 98.6 46.5 28.6 11.3
6.1 225.7 168.2
78.6 57.5 559.2 232.7 42.3 35.9 55.0 31.8 56.9 269.6 125.7 495.5 69.6 33.2 425.9 163.8 143.9 58.0 60.2 398.6 43.6 31.8 355.0 39.8 315.2 153.1 34.2 33.7 85.2 693.9 102.9 42.3 180.3 105.5 410.7 250.7
M ay
3972.8 3281.0
504.6 3468.2 2776.4
8.6 140.9
30.1 20.4 90.4 355.1 167.7 23.1 43.8 187.4 62.3 18.5 27.1 833.5 202.3 99.0 59.6 43.7 444.0 82.7 102.3 20.2 187.2 19.9 167.3 40.2 45.0 18.7 27.6 99.7 46.5 28.6 11.3
6.3 225.9 168.2
79.0 57.7 562.2 230.2 38.2 35.9 55.4 32.4 57.3 274.7 129.0 496.3 68.6 32.3 427.7 164.8 144.8 58.1 60.0 404.9 44.5 32.1 360.4 40.7 319.7 153.9 34.0 34.1 85.8 691.8 102.2 41.8 176.9 101.8 412.7 251.1
Jun
3958.4 3275.4
505.3 3453.1 2770.1
8.6 141.2
30.4 20.2 90.6 355.5 167.9 23.2 43.9 187.6 62.4 18.6 27.0 830.3 201.5 98.8 59.4 43.3 441.7 83.1 102.1 20.0 187.1 19.9 167.2 40.4 45.3 18.6 27.4 99.8 46.7 28.6 11.4
6.4 226.1 168.4
79.2 57.7 566.0 230.1 37.5 36.0 55.5 32.3 57.9 278.0 132.1 488.8 65.3 31.4 423.5 163.7 144.8 58.3 56.7 404.4 46.1 34.2 358.3 40.9 317.4 154.7 33.7 33.9 87.1 683.0 102.3 41.8 173.1 98.1 407.6 243.0
Jul
3927.1 3270.4
506.2 3420.9 2764.2
8.7 142.7
31.2 20.4 91.1 354.8 168.0 23.1 43.9 186.8 62.4 18.3 26.8 830.4 202.6 99.3 59.8 43.5 441.7 82.9 101.9 20.1 186.1 19.8 166.3 39.8 45.5 18.5 27.3 100.4 46.8 28.6 11.6
6.2 226.9 169.1
79.5 57.8 562.4 231.0 37.8 36.0 56.3 32.3 57.6 273.8 127.7 487.6 62.9 30.3 424.7 166.1 144.9 57.9 55.8 401.4 45.3 33.9 356.1 41.1 315.0 155.1 34.2 34.3 86.6 656.7 102.1 41.7 167.1 92.4 387.5 223.0
Aug
3962.1 3287.9
507.4 3454.7 2780.5
8.7 143.5
31.7 20.6 91.2 355.2 167.8 23.1 43.8 187.4 63.0 18.6 26.6 831.5 203.1 99.5 60.2 43.4 442.0 82.6 101.5 20.2 186.4 19.8 166.6 39.7 45.6 18.6 27.3 100.9 47.1 28.7 11.6
6.1 227.2 169.3
79.9 57.9 567.5 231.0 37.2 36.2 56.8 32.5 57.4 279.1 131.8 497.1 66.2 31.2 430.9 167.6 145.7 58.2 59.4 402.3 43.9 32.7 358.4 40.9 317.5 154.0 34.3 34.3 85.4 674.2 101.9 41.5 170.3 95.8 402.0 235.8
Sep
3956.0 3271.4
506.7 3449.3 2764.7
8.5 142.7
31.4 20.6 90.7 355.5 167.6 23.0 43.8 187.9 63.5 18.5 26.7 828.1 202.0 98.5 60.1 43.4 439.7 82.4 101.2 19.8 186.4 19.8 166.6 39.3 45.3 18.6 27.5 100.8 47.0 28.6 11.5
6.2 226.0 168.7
79.6 57.3 564.1 227.2 35.3 35.9 55.9 32.3 57.3 279.6 133.0 497.8 68.0 32.3 429.8 166.0 146.0 58.3 59.5 395.3 41.2 30.1 354.1 40.3 313.8 152.6 33.9 33.7 85.0 684.6 102.0 41.4 177.3 103.2 405.3 242.0
Oct
3993.0 3302.2
508.2 3484.8 2794.0
8.7 143.6
32.3 20.5 90.8 355.9 167.7 22.9 44.0 188.2 63.9 18.4 26.8 838.4 204.4 99.3 61.0 44.1 447.1 84.0 102.7 20.9 186.9 19.8 167.1 39.5 45.5 18.1 28.0 101.6 47.2 28.6 11.6
6.3 227.8 169.9
80.1 57.9 571.3 233.2 36.8 36.4 57.2 33.3 57.8 280.3 132.9 503.7 69.7 32.8 434.0 169.1 146.3 58.6 60.0 397.2 40.8 29.8 356.4 40.7 315.7 154.0 34.5 34.5 85.0 690.8 102.4 41.6 178.5 104.1 409.9 245.4
Nov
4023.7 3326.8
509.2 3514.5 2817.6
8.7 143.5
32.0 20.3 91.2 357.0 168.3 23.0 44.1 188.7 64.3 18.5 26.9 857.1 204.8 99.4 61.3 44.1 464.1 85.8 108.0 20.7 188.2 19.8 168.4 39.5 45.6 19.3 27.9 102.5 47.7 28.8 11.8
6.3 228.9 170.9
80.9 58.0 575.1 235.2 37.9 36.5 57.3 33.8 58.2 281.7 133.2 505.2 69.6 33.0 435.6 169.9 146.7 58.7 60.3 395.1 39.0 28.2 356.1 40.3 315.8 153.7 34.4 34.3 85.0 696.9 102.5 41.7 178.7 104.6 415.7 245.8
Annual Dec Average
4010.6 3319.5
506.6 3504.0 2812.9
8.6 141.3
31.7 20.1 89.5 356.7 168.8 23.1 44.2 187.9 63.8 18.5 26.7 858.2 204.3 99.4 60.8 44.1 463.4 85.6 109.8 20.6 190.5 19.8 170.7 39.4 45.4 22.2 27.6 102.3 47.9 28.8 12.0
6.2 228.6 170.5
80.9 58.1 574.4 235.2 38.1 36.4 57.3 34.0 58.8 280.4 134.6 503.4 68.2 32.2 435.2 168.6 147.4 59.1 60.1 393.8 38.2 27.6 355.6 39.6 316.0 152.2 34.0 33.8 84.4 691.1 102.4 41.7 176.8 103.0 411.9 246.2
3954.9 3269.1
504.7 3450.2 2764.4
8.6 141.5
31.0 20.4 90.1 354.6 166.9 23.0 43.7 187.7 63.0 18.6 26.9 833.5 201.9 98.7 59.7 43.4 445.0 83.2 103.2 20.2 186.7 19.8 166.8 39.7 45.0 18.9 27.5 100.3 46.9 28.7 11.5
6.2 226.6 169.1
79.4 57.5 561.7 231.5 38.7 36.1 55.9 32.5 57.3 272.9 128.2 495.3 67.8 32.1 427.5 165.2 145.1 58.1 59.1 394.0 41.0 30.0 352.9 39.9 313.0 153.1 34.0 33.8 85.4 685.8 102.5 41.9 175.6 100.9 407.6 244.7
Note: These not seasonally adjusted estimates were prepared in cooperation with the U.S. Department of Labor, Bureau of Labor Statistics, based upon monthly reports
submitted by selected employers throughout Georgia. The estimates include all full- and part-time wage and salary workers who were employed during or received pay for any part of the pay period that includes the twelfth of the month. Proprietors, domestic workers, self-employed persons, unpaid family workers and personnel of the armed forces are excluded. Estimates based on 2013 benchmark.
8
Source: Georgia Department of Labor, Workforce Statistics & Economic Research
ATLANTA MSA Nonagricultural Employment (000s)
2013 Preliminary Series
Industry
Total Nonfarm Total Private Goods Producing Service-Providing Private Service-Providing Mining and Logging Construction
Construction of Buildings Specialty Trade Contractors Manufacturing Durable Goods Transportation Equipment Manufacturing Non-Durable Goods Food Manufacturing Trade, Transportation, and Utilities Wholesale Trade Merchant Wholesalers, Durable Goods Merchant Wholesalers, Nondurable Goods Wholesale Electronic Markets and Agents and Brokers Retail Trade Food and Beverage Stores General Merchandise Stores Miscellaneous Store Retailers Transportation, Warehousing, and Utilities Utilities Transportation and Warehousing Air Transportation Truck Transportation Couriers and Messengers Information Telecommunications Wired Telecommunications Carriers Wireless Telecommunications Carriers Internet Service Providers, Search Portals, and DP Financial Activities Finance and Insurance Insurance Carriers and Related Activities Real Estate and Rental and Leasing Professional and Business Services Professional, Scientific, and Technical Services Accounting, Tax Prep, and Bookkeeping Services Architectural, Engineering, and Related Services Computer Systems Design and Related Services Management and Technical Consulting Services Management of Companies and Enterprises Admin and Support, Waste Mngmnt and Remediation Employment Services Education and Health Services Educational Services Health Care and Social Assistance Ambulatory Health Care Services Hospitals Social Assistance Leisure and Hospitality Arts, Entertainment, and Recreation Accommodation and Food Services Accommodation Food Services and Drinking Places Other Services Repair and Maintenance Personal and Laundry Services Government Federal Government State Government Local Government
J an
2351.0 2031.6
235.6 2115.4 1796.0
1.1 85.6 18.3 55.4 148.9 76.3 14.6 72.6 24.0 527.6 146.3 72.6 39.3 34.4 253.5 51.5 54.3 13.4 127.8 10.2 117.6 38.7 27.8 15.4 83.1 39.8 24.7 10.3
6.0 153.1 112.2
54.4 40.9 419.7 184.9 28.3 25.4 49.3 29.2 46.0 188.8 89.3 289.4 47.7 241.7 96.2 82.2 37.4 231.0 24.7 206.3 21.8 184.5 92.1 19.7 23.4 319.4 45.5 70.6 203.3
Feb
2366.4 2044.8
236.8 2129.6 1808.0
1.1 86.8 18.4 56.4 148.9 76.4 14.4 72.5 24.0 526.1 146.9 72.9 39.4 34.6 252.4 52.1 53.1 13.3 126.8 10.2 116.6 38.6 27.9 14.5 84.1 40.1 24.7 10.4
5.8 153.7 112.8
54.8 40.9 426.7 188.6 30.9 25.4 49.7 29.3 46.2 191.9 91.7 292.1 48.9 243.2 97.6 81.7 37.9 232.8 25.0 207.8 22.1 185.7 92.5 20.1 23.4 321.6 45.6 72.6 203.4
M ar
2375.6 2053.5
238.5 2137.1 1815.0
1.1 88.3 18.8 57.4 149.1 76.6 14.4 72.5 23.9 526.0 146.6 72.7 39.2 34.7 252.9 51.8 53.1 13.2 126.5 10.3 116.2 38.2 27.9 14.6 84.1 40.1 24.8 10.2
5.9 154.2 112.9
55.0 41.3 428.5 187.2 29.9 25.4 49.3 29.3 46.6 194.7 93.4 292.7 48.9 243.8 97.4 82.4 38.0 237.2 26.6 210.6 22.5 188.1 92.3 20.2 23.2 322.1 45.4 72.6 204.1
Apr
2396.7 2073.5
238.2 2158.5 1835.3
1.2 88.6 18.7 57.8 148.4 76.5 14.3 71.9 23.5 529.7 147.5 73.0 39.4 35.1 254.4 52.0 53.4 13.3 127.8 10.4 117.4 39.3 28.3 14.5 84.4 40.0 24.8 10.2
6.0 155.3 113.7
55.3 41.6 432.7 189.8 30.8 25.6 50.2 29.6 47.2 195.7 91.9 294.9 49.3 245.6 98.7 82.5 38.3 244.8 28.9 215.9 22.6 193.3 93.5 20.3 24.0 323.2 45.4 73.8 204.0
M ay
2405.8 2084.9
240.5 2165.3 1844.4
1.2 90.5 19.0 59.0 148.8 76.5 14.1 72.3 23.5 532.3 148.0 73.3 39.4 35.3 256.4 52.7 53.7 13.5 127.9 10.4 117.5 39.0 28.5 14.7 84.8 40.3 24.8 10.6
6.1 155.9 114.0
55.6 41.9 433.2 188.4 28.4 25.8 50.4 29.8 47.4 197.4 93.7 295.2 48.6 246.6 99.1 83.0 38.4 249.1 30.8 218.3 22.9 195.4 93.9 20.4 24.0 320.9 45.1 70.9 204.9
Jun
2402.6 2088.2
242.1 2160.5 1846.1
1.2 91.8 19.2 59.9 149.1 76.6 13.9 72.5 23.6 532.7 148.0 73.4 39.5 35.1 257.4 52.7 54.4 13.5 127.3 10.4 116.9 38.2 28.7 14.8 84.3 40.4 25.0 10.4
6.0 156.4 114.7
56.1 41.7 436.5 187.4 27.1 25.9 50.2 29.9 48.3 200.8 96.3 290.8 47.0 243.8 98.6 82.9 36.2 251.2 32.8 218.4 23.0 195.4 94.2 20.5 23.9 314.4 45.0 68.9 200.5
Jul
2397.3 2094.1
244.0 2153.3 1850.1
1.2 93.5 19.9 60.6 149.3 76.5 13.8 72.8 23.7 536.3 148.3 73.5 39.6 35.2 259.3 52.9 54.8 13.6 128.7 10.3 118.4 39.0 29.1 14.6 84.8 40.8 24.5 10.5
5.9 157.3 115.2
56.3 42.1 436.1 189.4 28.1 25.9 50.7 30.1 47.8 198.9 92.8 289.1 46.4 242.7 98.5 83.0 34.9 252.2 32.3 219.9 23.0 196.9 94.3 20.4 24.1 303.2 45.0 68.2 190.0
Aug
2419.2 2107.5
244.8 2174.4 1862.7
1.2 94.3 19.9 61.3 149.3 76.6 13.8 72.7 23.8 538.2 148.5 73.5 39.8 35.2 261.1 53.0 55.6 13.6 128.6 10.1 118.5 38.8 29.4 14.6 85.2 41.5 25.2 10.6
5.8 157.9 115.6
56.5 42.3 439.8 190.2 28.7 25.9 50.9 30.1 48.3 201.3 95.1 294.5 47.6 246.9 99.1 83.4 37.9 252.9 31.1 221.8 23.1 198.7 94.2 20.4 24.2 311.7 44.8 68.3 198.6
Sep
2416.7 2100.1
245.4 2171.3 1854.7
1.2 94.6 20.0 61.2 149.6 76.5 14.0 73.1 24.0 536.3 147.8 73.2 39.5 35.1 260.3 53.1 56.0 13.6 128.2 10.1 118.1 38.5 29.1 14.8 84.9 41.5 25.1 10.5
5.9 157.0 114.8
56.4 42.2 439.5 189.4 29.1 25.8 50.5 29.9 48.5 201.6 96.0 295.4 48.8 246.6 98.8 83.5 37.9 247.9 29.2 218.7 23.0 195.7 93.7 20.3 23.9 316.6 44.6 72.7 199.3
Oct
2431.3 2113.4 247.9 2183.4 1865.5
1.2 95.5 20.4 62.6 151.2 77.7 14.1 73.5 24.1 541.1 148.9 72.6 39.5 36.8 263.3 53.6 57.0 13.8 128.9 10.1 118.8 38.7 29.2 14.7 84.6 41.5 25.1 10.6
5.8 158.2 115.2
56.7 43.0 440.7 191.9 30.5 26.4 51.6 30.1 48.8 200.0 96.3 298.6 50.6 248.0 100.3 83.7 37.6 248.4 30.0 218.4 22.7 195.7 93.9 20.6 24.0 317.9 44.6 72.4 200.9
Nov
2446.8 2126.9
248.3 2198.5 1878.6
1.2 96.3 20.4 63.7 150.8 77.4 14.1 73.4 24.1 549.6 150.3 73.7 40.1 36.5 268.0 54.3 60.2 13.7 131.3 10.1 121.2 38.7 29.3 16.0 85.2 41.7 25.2 10.6
5.9 158.2 115.3
57.0 42.9 442.2 191.3 30.0 26.3 51.3 30.2 48.7 202.2 98.0 299.8 50.4 249.4 101.4 83.7 37.7 249.8 28.3 221.5 22.5 199.0 93.8 20.4 23.9 319.9 45.0 72.6 202.3
Annual Dec Average
2449.3 2404.9
2130.2 2087.4
247.5 242.5
2201.8 2162.4
1882.7 1844.9
1.2
1.2
95.3 91.8
20.5 19.5
63.1 59.9
151.0 149.5
77.8 76.8
14.3 14.2
73.2 72.8
24.1 23.9
555.4 535.9
150.8 148.2
73.5 73.2
40.0 39.6
37.3 35.4
272.1 259.3
54.7 52.9
61.9 55.6
13.7 13.5
132.5 128.5
10.1 10.2
122.4 118.3
38.9 38.7
29.1 28.7
18.2 15.1
85.0 84.5
41.9 40.8
25.1 24.9
10.7 10.5
5.9
5.9
159.0 156.4
116.2 114.4
57.9 56.0
42.8 42.0
441.9 434.8
192.2 189.2
30.4 29.4
26.6 25.9
51.2 50.4
30.2 29.8
48.7 47.7
201.0 197.9
98.7 94.4
299.3 294.3
49.3 48.6
250.0 245.7
101.5 98.9
83.9 83.0
37.4 37.5
249.5 245.6
28.6 29.0
220.9 216.5
21.6 22.6
199.3 194.0
92.6 93.4
20.1 20.3
23.7 23.8
319.1 317.5
45.3 45.1
72.0 71.3
201.8 201.1
Note: These not seasonally adjusted estimates were prepared in cooperation with the U.S. Department of Labor, Bureau of Labor Statistics, based upon monthly reports submitted by
selected employers in the Atlanta Metropolitan Statistical Area, which includes Barrow, Bartow, Butts, Carroll, Cherokee, Clayton, Cobb, Coweta, Dawson, DeKalb, Douglas, Fayette, Forsyth, Fulton, Gwinnett, Haralson, Heard, Henry, Jasper, Lamer, Meriwether, Newton, Paulding, Pickens, Pike, Rockdale, Spalding and Walton counties. The estimates include all full- and parttime wage and salary workers who were employed during or received pay for any part of the pay period that includes the twelfth of the month. Proprietors, domestic workers, self-employed persons, unpaid family workers and personnel of the armed forces are excluded. Estimates based on 2013 benchmark.
Source: Georgia Department of Labor, Workforce Statistics & Economic Research
9
ATLANTA MSA Nonagricultural Employment (000s)
2012 Final Series
Industry Total Nonfarm Total Private Goods Producing Service-Providing Private Service-Providing Mining and Logging Construction
Construction of Buildings Specialty Trade Contractors Manufacturing Durable Goods Transportation Equipment Manufacturing Non-Durable Goods Food Manufacturing Trade, Transportation, and Utilities Wholesale Trade Merchant Wholesalers, Durable Goods Merchant Wholesalers, Nondurable Goods Wholesale Electronic Markets and Agents and Brokers Retail Trade Food and Beverage Stores General Merchandise Stores Miscellaneous Store Retailers Transportation, Warehousing, and Utilities Utilities Transportation and Warehousing Air Transportation Truck Transportation Couriers and Messengers Information Telecommunications Wired Telecommunications Carriers Wireless Telecommunications Carriers Internet Service Providers, Search Portals, and DP Financial Activities Finance and Insurance Insurance Carriers and Related Activities Real Estate and Rental and Leasing Professional and Business Services Professional, Scientific, and Technical Services Accounting, Tax Prep, and Bookkeeping Services Architectural, Engineering, and Related Services Computer Systems Design and Related Services Management and Technical Consulting Services Management of Companies and Enterprises Admin and Support, Waste Mngmnt and Remediation Employment Services Education and Health Services Educational Services Health Care and Social Assistance Ambulatory Health Care Services Hospitals Social Assistance Leisure and Hospitality Arts, Entertainment, and Recreation Accommodation and Food Services Accommodation Food Services and Drinking Places Other Services Repair and Maintenance Personal and Laundry Services Government Federal Government State Government Local Government
J an 2299.0 1978.4
233.0 2066.0 1745.4
1.2 85.4 17.8 55.3 146.4 74.0 15.0 72.4 24.5 522.1 145.1 72.8 38.7 33.6 250.9 50.0 55.7 13.4 126.1 10.3 115.8 39.0 26.8 14.7 80.2 38.2 24.2
9.8 5.7 152.3 111.8 51.8 40.5 401.1 180.4 28.0 25.5 47.2 27.9 43.7 177.0 81.8 277.8 47.8 230.0 90.0 78.2 37.2 221.2 23.8 197.4 21.1 176.3 90.7 19.2 22.5 320.6 45.6 71.2 203.8
Feb 2310.8 1987.8
233.9 2076.9 1753.9
1.2 86.2 17.8 56.1 146.5 74.1 14.9 72.4 24.4 520.0 146.0 73.2 39.0 33.8 248.5 49.9 54.3 13.2 125.5 10.3 115.2 38.8 26.7 14.5 81.4 38.3 24.2
9.8 5.7 152.7 112.3 51.9 40.4 405.1 182.8 29.1 25.5 47.7 28.6 43.8 178.5 83.3 280.7 48.9 231.8 90.7 78.7 37.4 222.8 24.0 198.8 21.3 177.5 91.2 19.4 22.6 323.0 45.6 72.1 205.3
M ar 2325.6 1999.2
234.2 2091.4 1765.0
1.2 86.3 17.8 56.1 146.7 74.2 14.9 72.5 24.4 521.8 146.0 73.1 39.1 33.8 249.9 49.7 54.3 13.0 125.9 10.3 115.6 39.1 26.7 14.5 81.2 38.2 24.2
9.8 5.8 153.1 112.1 52.0 41.0 408.0 182.1 29.0 25.4 47.5 28.1 44.1 181.8 85.6 282.0 48.8 233.2 90.9 79.2 37.5 227.6 25.9 201.7 21.4 180.3 91.3 19.3 22.6 326.4 45.6 72.1 208.7
Apr 2343.4 2018.2
235.4 2108.0 1782.8
1.2 87.0 18.0 56.9 147.2 74.9 14.9 72.3 24.3 525.0 146.8 73.2 39.4 34.2 251.1 49.6 54.6 13.2 127.1 10.3 116.8 39.6 27.2 14.6 80.7 38.4 24.2 9.8
5.7 153.0 111.7
52.2 41.3 412.7 183.2 29.8 24.9 47.7 28.4 44.4 185.1 87.0 284.0 49.2 234.8 92.2 78.8 37.9 234.9 27.9 207.0 21.7 185.3 92.5 19.9 23.3 325.2 45.4 73.6 206.2
M ay 2356.5 2032.6
236.2 2120.3 1796.4
1.2 86.8 17.7 56.9 148.2 75.7 15.0 72.5 24.3 528.0 147.6 73.5 39.6 34.5 252.8 50.2 54.8 13.3 127.6 10.4 117.2 39.6 27.4 14.6 81.6 38.4 24.2 9.9
5.8 152.8 111.6
52.5 41.2 415.8 182.7 27.7 25.1 48.2 28.9 44.7 188.4 88.8 284.8 48.8 236.0 92.9 79.6 37.6 240.3 30.2 210.1 22.0 188.1 93.1 19.8 23.5 323.9 45.3 71.6 207.0
Jun 2354.0 2034.1
236.7 2117.3 1797.4
1.2 87.1 17.8 57.2 148.4 75.8 14.8 72.6 24.2 527.5 147.3 73.5 39.5 34.3 252.5 50.6 54.9 13.2 127.7 10.4 117.3 39.7 27.6 14.6 81.5 38.6 24.2 10.0
5.9 153.2 111.9
52.8 41.3 419.9 182.9 27.2 25.2 48.3 28.9 45.5 191.5 91.4 280.7 47.1 233.6 92.8 79.5 35.4 241.1 31.8 209.3 22.0 187.3 93.5 19.7 23.5 319.9 45.3 70.3 204.3
Jul 2336.9 2030.9
237.5 2099.4 1793.4
1.2 87.7 18.3 57.3 148.6 76.1 15.0 72.5 24.1 527.6 148.2 74.0 39.8 34.4 252.0 50.7 54.7 13.4 127.4 10.3 117.1 39.2 27.9 14.5 82.1 38.7 24.2 10.2
5.7 153.5 112.1
53.1 41.4 416.8 183.6 27.3 25.2 49.2 28.9 45.1 188.1 88.0 279.7 45.5 234.2 93.9 79.3 34.9 240.0 31.4 208.6 22.3 186.3 93.7 19.9 23.7 306.0 45.1 68.1 192.8
Aug 2354.8 2040.7
237.7 2117.1 1803.0
1.2 87.9 18.3 57.3 148.6 75.9 14.8 72.7 24.2 527.6 148.1 74.1 39.9 34.1 251.9 50.5 54.6 13.4 127.6 10.3 117.3 39.1 28.1 14.6 82.7 39.0 24.3 10.2
5.7 153.5 112.1
53.4 41.4 420.1 183.7 27.1 25.2 49.6 29.1 44.8 191.6 90.4 285.3 47.2 238.1 94.7 80.0 37.3 240.5 30.2 210.3 22.3 188.0 93.3 19.9 23.7 314.1 45.1 68.4 200.6
Sep 2347.5 2029.4
237.4 2110.1 1792.0
1.1 87.7 18.3 57.2 148.6 75.8 14.8 72.8 24.4 525.3 146.6 73.3 39.5 33.8 251.2 50.5 54.4 13.2 127.5 10.3 117.2 38.7 28.0 14.6 82.7 38.9 24.2 10.2
5.7 152.5 111.6
53.2 40.9 417.0 180.8 25.8 25.0 48.8 28.9 44.8 191.4 90.9 286.4 48.2 238.2 94.4 80.5 37.4 235.5 28.2 207.3 22.3 185.0 92.6 19.7 23.4 318.1 45.3 72.0 200.8
Oct 2369.8 2049.5
238.8 2131.0 1810.7
1.1 88.6 18.8 57.5 149.1 75.9 14.8 73.2 24.6 530.4 147.9 73.7 39.8 34.4 254.7 51.0 55.2 14.0 127.8 10.3 117.5 38.9 28.2 14.0 83.7 39.1 24.3 10.2
5.8 153.9 112.5
53.5 41.4 423.8 185.6 27.1 25.2 49.8 29.8 45.3 192.9 91.3 289.5 49.4 240.1 95.7 80.4 37.8 235.9 27.4 208.5 22.2 186.3 93.5 20.0 24.0 320.3 45.5 72.2 202.6
Nov 2390.9 2065.7
239.3 2151.6 1826.4
1.1 89.1 18.7 58.0 149.1 76.0 14.7 73.1 24.6 543.1 148.1 73.7 40.0 34.4 266.0 52.3 58.7 13.8 129.0 10.3 118.7 38.9 28.4 15.1 84.3 39.5 24.4 10.4
5.7 155.0 113.5
54.3 41.5 426.8 187.4 28.1 25.2 49.8 30.4 45.8 193.6 91.8 289.8 49.3 240.5 96.2 80.4 37.7 233.9 25.8 208.1 22.1 186.0 93.5 19.9 23.9 325.2 45.8 72.5 206.9
Annual Dec Average
2386.2 2348.0
2065.1 2027.6
238.2 236.5
2148.0 2111.4
1826.9 1791.1
1.1
1.2
87.8 87.3
18.7 18.2
56.9 56.9
149.3 148.1
76.2 75.4
14.7 14.9
73.1 72.7
24.4 24.4
544.4 528.6
147.9 147.1
73.6 73.5
39.8 39.5
34.5 34.2
266.0 254.0
52.3 50.6
59.7 55.5
13.8 13.4
130.5 127.5
10.3 10.3
120.2 117.2
38.9 39.1
28.3 27.6
17.0 14.8
84.2 82.2
39.8 38.8
24.4 24.3
10.5 10.1
5.7
5.7
155.0 153.4
113.3 112.2
54.4 52.9
41.7 41.2
426.8 416.2
187.2 183.5
27.9 27.8
25.2 25.2
49.8 48.6
30.5 29.0
46.4 44.9
193.2 187.8
93.0 88.6
290.1 284.2
48.9 48.3
241.2 236.0
95.9 93.4
81.3 79.7
37.6 37.1
234.0 234.0
25.4 27.7
208.6 206.3
22.0 21.9
186.6 184.4
92.4 92.6
19.6 19.7
23.5 23.4
321.1 320.3
45.5 45.4
71.8 71.3
203.8 203.6
Note: These not seasonally adjusted estimates were prepared in cooperation with the U.S. Department of Labor, Bureau of Labor Statistics, based upon monthly reports submit-
ted by selected employers in the Atlanta Metropolitan Statistical Area, which includes Barrow, Bartow, Butts, Carroll, Cherokee, Clayton, Cobb, Coweta, Dawson, DeKalb, Douglas, Fayette, Forsyth, Fulton, Gwinnett, Haralson, Heard, Henry, Jasper, Lamer, Meriwether, Newton, Paulding, Pickens, Pike, Rockdale, Spalding and Walton counties. The estimates include all full- and part-time wage and salary workers who were employed during or received pay for any part of the pay period that includes the twelfth of the month. Proprietors, domestic workers, self-employed persons, unpaid family workers and personnel of the armed forces are excluded. Estimates based on 2013 benchmark.
10
Source: Georgia Department of Labor, Workforce Statistics & Economic Research
ALBANY MSA Nonagricultural Employment (000s)
Industry Total Nonfarm Total Private Goods Producing Service-Providing Private Service-Providing Manufacturing
Trade, Transportation, and Utilities Retail Trade Government
Federal Government State Government Local Government
2013 Preliminary Series
Annual Jan Feb Mar Apr M ay Jun Jul Aug Sep Oct Nov Dec Average
60.6 60.6 60.6 60.7 60.9 60.6 60.8 60.9 61.2 61.8 62.3 62.1 61.1
46.8 46.5 46.4 46.5 46.9 46.9 47.2 47.4 47.3 47.9 48.4 48.2 47.2
6.7
6.7
6.7
6.8
7.0
6.8 6.9
6.9
7.0
7.0
6.9
6.9
6.9
53.9 53.9 53.9 53.9 53.9 53.8 53.9 54.0 54.2 54.8 55.4 55.2 54.2
40.1 39.8 39.7 39.7 39.9 40.1 40.3 40.5 40.3 40.9 41.5 41.3 40.3
4.4
4.4
4.4
4.4
4.4
4.4 4.4
4.4
4.4
4.4
4.4
4.4
4.4
12.1 12.0 11.8 11.7 11.7 11.8 12.0 12.1 11.9 12.1 12.5 12.7 12.0
7.2
7.1
6.9
7.0
7.0
7.0 7.0
7.1
7.0
7.2
7.4
7.5
7.1
13.8 14.1 14.2 14.2 14.0 13.7 13.6 13.5 13.9 13.9 13.9 13.9 13.9
3.1
3.1
3.1
3.1
3.0
3.0 3.0
3.0
3.0
3.0
3.0
3.0
3.0
2.9
3.2
3.2
3.2
3.1
2.9 2.8
2.8
3.1
3.1
3.1
3.1
3.0
7.8
7.8
7.9
7.9
7.9
7.8 7.8
7.7
7.8
7.8
7.8
7.8
7.8
2012 Final Series
Industry
Annual Jan Feb Mar Apr M ay Jun Jul Aug Sep Oct Nov Dec Average
Total Nonfarm
60.8 61.1 60.9 61.5 61.3 60.8 60.4 60.8 60.6 61.0 61.4 61.0 61.0
Total Private
46.8 47.0 46.7 47.1 47.1 46.7 46.5 46.9 46.5 46.8 47.1 46.8 46.8
Goods Producing
6.6
6.6
6.5
6.5
6.6
6.6 6.7
6.7
6.7
6.7
6.7
6.7
6.6
Service-Providing
54.2 54.5 54.4 55.0 54.7 54.2 53.7 54.1 53.9 54.3 54.7 54.3 54.3
Private Service-Providing
40.2 40.4 40.2 40.6 40.5 40.1 39.8 40.2 39.8 40.1 40.4 40.1 40.2
Manufacturing
4.3
4.3
4.2
4.2
4.2
4.3 4.3
4.3
4.3
4.3
4.3
4.3
4.3
Trade, Transportation, and Utilities
12.5 12.4 12.3 12.5 12.6 12.4 12.3 12.2 12.2 12.3 12.5 12.4 12.4
Retail Trade
7.7
7.6
7.5
7.6
7.6
7.5 7.4
7.3
7.2
7.2
7.5
7.4
7.5
Government
14.0 14.1 14.2 14.4 14.2 14.1 13.9 13.9 14.1 14.2 14.3 14.2 14.1
Federal Government
3.3
3.2
3.2
3.2
3.2
3.2 3.3
3.2
3.2
3.2
3.2
3.1
3.2
State Government
3.0
3.2
3.3
3.4
3.2
3.2 2.9
2.9
3.2
3.2
3.2
3.2
3.2
Local Government
7.7
7.7
7.7
7.8
7.8
7.7 7.7
7.8
7.7
7.8
7.9
7.9
7.8
Note: These not seasonally adjusted estimates were prepared in cooperation with the U.S. Department of Labor, Bureau of Labor Statistics, based upon monthly reports submitted by se-
lected employers in the Albany Metropolitan Statistical Area, which includes Baker, Dougherty, Lee, Terrell and Worth counties. The estimates include all full- and part-time wage and salary workers who were employed during or received pay for any part of the pay period that includes the twelfth of the month. Proprietors, domestic workers, self-employed persons, unpaid family workers and personnel of the armed forces are excluded. Estimates based on 2013 benchmark.
Source: Georgia Department of Labor, Workforce Statistics & Economic Research
11
ATHENS - CLARKE MSA Nonagricultural Employment (000s)
Industry Total Nonfarm Total Private Goods Producing Service-Providing Private Service-Providing Trade, Transportation, and Utilities
Retail Trade Professional and Business Services Leisure and Hospitality Government
Federal Government State Government Local Government
2013 Preliminary Series
Annual Jan Feb Mar Apr M ay Jun Jul Aug Sep Oct Nov Dec Average
87.0 88.7 88.5 89.6 88.8 87.0 87.6 89.0 90.9 91.5 92.0 91.7 89.4
56.8 57.5 57.1 58.1 57.8 57.4 57.7 58.8 59.4 59.8 60.1 60.0 58.4
9.0
9.0
8.9
9.0
8.9
9.0 9.0
8.9
8.9
8.8
8.8
8.8
8.9
78.0 79.7 79.6 80.6 79.9 78.0 78.6 80.1 82.0 82.7 83.2 82.9 80.4
47.8 48.5 48.2 49.1 48.9 48.4 48.7 49.9 50.5 51.0 51.3 51.2 49.5
13.1 13.0 13.0 13.2 13.1 13.2 13.4 13.6 13.7 13.9 14.4 14.6 13.5
9.3
9.2
9.1
9.3
9.2
9.2 9.3
9.5
9.6
9.7
9.9
9.9
9.4
6.4
6.8
6.6
6.8
6.6
6.5 6.6
6.7
7.2
7.2
7.2
7.2
6.8
8.5
8.8
8.8
9.1
9.1
8.8 8.7
9.1
9.2
9.3
9.3
9.2
9.0
30.2 31.2 31.4 31.5 31.0 29.6 29.9 30.2 31.5 31.7 31.9 31.7 31.0
1.5
1.3
1.3
1.3
1.3
1.2 1.3
1.2
1.3
1.2
1.3
1.2
1.3
20.6 21.7 21.8 21.9 21.3 20.6 20.8 20.9 22.0 22.4 22.5 22.2 21.6
8.1
8.2
8.3
8.3
8.4
7.8 7.8
8.1
8.2
8.1
8.1
8.3
8.1
2012 Final Series
Industry
Annual Jan Feb Mar Apr M ay Jun Jul Aug Sep Oct Nov Dec Average
Total Nonfarm
85.9 86.9 87.2 87.5 87.6 86.2 85.5 87.2 89.0 89.5 90.7 89.6 87.7
Total Private
55.8 56.1 56.2 56.4 56.6 56.1 55.8 56.5 57.3 57.4 58.4 57.9 56.7
Goods Producing
9.1
9.1
9.1
9.1
9.1
9.2 9.2
9.2
9.1
9.2
9.1
9.2
9.1
Service-Providing
76.8 77.8 78.1 78.4 78.5 77.0 76.3 78.0 79.9 80.3 81.6 80.4 78.6
Private Service-Providing
46.7 47.0 47.1 47.3 47.5 46.9 46.6 47.3 48.2 48.2 49.3 48.7 47.6
Trade, Transportation, and Utilities
12.9 12.8 12.7 12.9 12.9 12.8 12.7 12.9 13.0 13.1 13.4 13.5 13.0
Retail Trade
9.2
9.1
9.1
9.2
9.3
9.1 9.1
9.2
9.2
9.4
9.7
9.6
9.3
Professional and Business Services
6.4
6.5
6.7
6.7
6.6
6.3 6.2
6.3
6.8
6.5
6.9
6.5
6.5
Leisure and Hospitality
8.0
8.2
8.2
8.2
8.4
8.3 8.2
8.4
8.6
8.8
9.0
8.8
8.4
Government
30.1 30.8 31.0 31.1 31.0 30.1 29.7 30.7 31.7 32.1 32.3 31.7 31.0
Federal Government
1.5
1.3
1.3
1.3
1.3
1.3 1.3
1.3
1.4
1.4
1.5
1.5
1.4
State Government
20.6 21.5 21.5 21.7 21.6 21.0 20.7 21.3 22.2 22.5 22.5 22.1 21.6
Local Government
8.0
8.0
8.2
8.1
8.1
7.8 7.7
8.1
8.1
8.2
8.3
8.1
8.1
Note: These not seasonally adjusted estimates were prepared in cooperation with the U.S. Department of Labor, Bureau of Labor Statistics, based upon monthly reports submitted by selected
employers in the Athens - Clarke County Metropolitan Statistical Area, which includes Clarke, Madison, Oconee and Oglethorpe counties. The estimates include all full- and part-time wage and salary workers who were employed during or received pay for any part of the pay period that includes the twelfth of the month. Proprietors, domestic workers, self-employed persons, unpaid family workers and personnel of the armed forces are excluded. Estimates based on 2013 benchmark.
Source: Georgia Department of Labor, Workforce Statistics & Economic Research
12
AUGUSTA - RICHMOND MSA Nonagricultural Employment (000s)
Industry Total Nonfarm Total Private Goods Producing Service-Providing Private Service-Providing Mining, Logging and Construction Manufacturing Trade, Transportation, and Utilities
Wholesale Trade Retail Trade Transportation, Warehousing, and Utilities Information Financial Activities Professional and Business Services Education and Health Services Leisure and Hospitality Other Services Government Federal Government State Government Local Government
2013 Preliminary Series
J an 216.0 168.5
31.4 184.6 137.1
11.3 20.1 36.2
5.1 23.9
7.2 3.0 7.5 30.7 29.9 21.9 7.9 47.5 9.1 17.2 21.2
Feb 217.7 169.5
31.4 186.3 138.1
11.3 20.1 36.1
5.2 23.8
7.1 3.0 7.6 31.0 30.1 22.4 7.9 48.2 9.1 17.5 21.6
M ar 219.3 170.8
31.6 187.7 139.2
11.4 20.2 36.3
5.2 24.0
7.1 3.0 7.6 31.4 30.2 22.7 8.0 48.5 9.1 17.6 21.8
Apr 221.9 173.9
31.4 190.5 142.5
11.2 20.2 36.2
5.2 23.9
7.1 3.1 7.6 31.4 30.4 25.8 8.0 48.0 9.0 17.4 21.6
M ay 219.6 172.0
31.5 188.1 140.5
11.2 20.3 36.5
5.2 24.2
7.1 3.1 7.7 31.2 30.3 23.6 8.1 47.6 9.0 17.0 21.6
Jun 217.0 170.6
31.5 185.5 139.1
11.0 20.5 36.7
5.2 24.3
7.2 3.0 7.7 30.9 29.9 22.8 8.1 46.4 9.0 16.1 21.3
Jul 214.5 169.8
31.3 183.2 138.5
11.0 20.3 36.6
5.2 24.3
7.1 3.1 7.8 31.0 29.6 22.2 8.2 44.7 9.0 16.0 19.7
Aug 216.3 171.0
31.5 184.8 139.5
11.1 20.4 36.8
5.2 24.3
7.3 3.1 7.8 31.1 30.0 22.5 8.2 45.3 9.0 16.1 20.2
Sep 216.7 170.0
31.4 185.3 138.6
11.0 20.4 36.4
5.1 24.2
7.1 3.1 7.8 30.8 30.1 22.3 8.1 46.7 8.9 17.0 20.8
Oct 217.2 170.6
31.4 185.8 139.2
11.0 20.4 36.8
5.1 24.5
7.2 3.1 7.8 30.1 30.6 22.7 8.1 46.6 8.9 16.9 20.8
Nov 217.7 170.9
31.4 186.3 139.5
11.0 20.4 37.3
5.2 24.9
7.2 3.1 7.8 29.9 30.4 22.9 8.1 46.8 8.9 17.0 20.9
Annual Dec Average
219.1 217.8
172.4 170.8
31.1 31.4
188.0 186.3
141.3 139.4
10.7 11.1
20.4 20.3
38.1 36.7
5.2
5.2
25.6 24.3
7.3
7.2
3.2
3.1
7.8
7.7
30.1 30.8
30.1 30.1
23.9 23.0
8.1
8.1
46.7 46.9
8.9
9.0
16.9 16.9
20.9 21.0
2012 Final Series
Industry
Annual Jan Feb Mar Apr M ay Jun Jul Aug Sep Oct Nov Dec Average
Total Nonfarm
212.6 213.9 215.9 218.1 216.5 214.8 213.4 215.2 216.8 217.6 219.3 219.7 216.2
Total Private
165.4 165.8 167.7 170.3 168.6 167.8 168.4 169.7 169.4 170.2 171.7 172.1 168.9
Goods Producing Service-Providing Private Service-Providing Mining, Logging and Construction Manufacturing Trade, Transportation, and Utilities
Wholesale Trade Retail Trade Transportation, Warehousing, and Utilities
30.4 182.2 135.0
10.7 19.7 36.4
5.0 24.3
7.1
30.6 183.3 135.2
10.8 19.8 36.0
5.0 23.9
7.1
31.4 184.5 136.3
11.6 19.8 36.2
5.0 24.1
7.1
30.9 187.2 139.4
11.1 19.8 36.0
5.1 23.9
7.0
31.2 185.3 137.4
11.3 19.9 35.9
5.0 24.2
6.7
31.5 183.3 136.3
11.5 20.0 36.0
5.1 24.1
6.8
31.8 181.6 136.6
11.9 19.9 36.2
4.9 24.2
7.1
32.3 182.9 137.4
12.2 20.1 36.0
4.9 24.0
7.1
32.7 184.1 136.7
12.5 20.2 35.9
5.0 23.8
7.1
32.5 185.1 137.7
12.3 20.2 36.2
5.0 24.0
7.2
32.1 187.2 139.6
11.8 20.3 37.4
5.1 24.9
7.4
32.1 187.6 140.0
11.7 20.4 37.5
5.1 25.0
7.4
31.6 184.5 137.3
11.6 20.0 36.3
5.0 24.2
7.1
Information
2.8
2.7
2.8
2.8
2.8
2.8 2.8
2.8
2.9
2.9
3.0
2.9
2.8
Financial Activities
7.6
7.6
7.6
7.6
7.6
7.6 7.6
7.7
7.6
7.7
7.7
7.6
7.6
Professional and Business Services
30.0 30.0 30.3 31.1 30.9 31.0 30.9 31.2 30.9 31.2 31.2 31.6 30.9
Education and Health Services
29.5 29.8 29.8 29.9 30.1 29.5 29.7 30.2 30.1 30.3 30.5 30.4 30.0
Leisure and Hospitality
20.8 21.2 21.6 24.0 22.0 21.4 21.3 21.5 21.3 21.5 21.9 22.1 21.7
Other Services
7.9
7.9
8.0
8.0
8.1
8.0 8.1
8.0
8.0
7.9
7.9
7.9
8.0
Government
47.2 48.1 48.2 47.8 47.9 47.0 45.0 45.5 47.4 47.4 47.6 47.6 47.2
Federal Government
9.1
9.1
9.1
9.1
9.1
9.2 9.3
9.2
9.3
9.2
9.2
9.2
9.2
State Government
17.0 17.5 17.4 17.5 17.2 16.6 16.1 16.4 17.3 17.2 17.3 17.2 17.1
Local Government
21.1 21.5 21.7 21.2 21.6 21.2 19.6 19.9 20.8 21.0 21.1 21.2 21.0
Note: These not seasonally adjusted estimates were prepared in cooperation with the U.S. Department of Labor, Bureau of Labor Statistics, based upon monthly reports submitted
by selected employers in the Augusta - Richmond County Metropolitan Statistical Area, which includes Burke, Columbia, McDuffie and Richmond counties in Georgia and Aiken and Edgefield counties in South Carolina. The estimates include all full- and part-time wage and salary workers who were employed during or received pay for any part of the pay period that includes the twelfth of the month. Proprietors, domestic workers, self-employed persons, unpaid family workers and personnel of the armed forces are excluded. Estimates based on 2013 benchmark.
Source: Georgia Department of Labor, Workforce Statistics & Economic Research
13
BRUNSWICK MSA Nonagricultural Employment (000s)
Industry Total Nonfarm Total Private Goods Producing Service-Providing Private Service-Providing Trade, Transportation, and Utilities
Retail Trade Government
Federal Government State Government Local Government
2013 Preliminary Series
Annual Jan Feb Mar Apr M ay Jun Jul Aug Sep Oct Nov Dec Average
40.4 40.5 41.0 41.4 41.6 41.5 41.2 41.1 40.4 40.4 40.5 40.1 40.8
30.3 30.4 30.9 31.3 31.4 31.5 31.4 31.1 30.4 30.2 30.4 30.0 30.8
4.9
4.9
4.9
4.7
4.6
4.5 4.4
4.3
4.0
4.0
4.1
4.0
4.4
35.5 35.6 36.1 36.7 37.0 37.0 36.8 36.8 36.4 36.4 36.4 36.1 36.4
25.4 25.5 26.0 26.6 26.8 27.0 27.0 26.8 26.4 26.2 26.3 26.0 26.3
7.9
7.8
7.8
7.8
7.9
7.9 8.1
8.2
7.9
7.9
8.1
8.1
8.0
5.3
5.3
5.2
5.3
5.3
5.3 5.5
5.5
5.4
5.5
5.6
5.7
5.4
10.1 10.1 10.1 10.1 10.2 10.0 9.8 10.0 10.0 10.2 10.1 10.1 10.1
1.7
1.7
1.7
1.7
1.7
1.7 1.7
1.7
1.7
1.7
1.7
1.7
1.7
1.8
1.8
1.8
1.8
1.8
1.8 1.8
1.7
1.8
1.8
1.8
1.8
1.8
6.6
6.6
6.6
6.6
6.7
6.5 6.3
6.6
6.5
6.7
6.6
6.6
6.6
2012 Final Series
Industry
Annual Jan Feb Mar Apr M ay Jun Jul Aug Sep Oct Nov Dec Average
Total Nonfarm
39.1 39.5 40.0 40.7 40.9 41.2 40.8 41.1 40.7 40.9 41.2 40.7 40.6
Total Private
29.0 29.4 29.9 30.5 30.8 31.1 31.0 31.1 30.7 30.9 31.0 30.7 30.5
Goods Producing
4.5
4.5
4.6
4.5
4.5
4.6 4.6
4.8
4.8
5.0
4.9
4.9
4.7
Service-Providing
34.6 35.0 35.4 36.2 36.4 36.6 36.2 36.3 35.9 35.9 36.3 35.8 35.9
Private Service-Providing
24.5 24.9 25.3 26.0 26.3 26.5 26.4 26.3 25.9 25.9 26.1 25.8 25.8
Trade, Transportation, and Utilities
7.5
7.8
7.7
7.8
7.8
7.7 7.7
7.8
7.7
7.8
8.0
8.0
7.8
Retail Trade
5.2
5.4
5.4
5.4
5.5
5.4 5.4
5.3
5.3
5.3
5.5
5.5
5.4
Government
10.1 10.1 10.1 10.2 10.1 10.1 9.8 10.0 10.0 10.0 10.2 10.0 10.1
Federal Government
1.8
1.8
1.8
1.8
1.8
1.8 1.8
1.8
1.7
1.7
1.7
1.7
1.8
State Government
1.8
1.8
1.8
1.9
1.8
1.8 1.8
1.7
1.8
1.8
1.9
1.8
1.8
Local Government
6.5
6.5
6.5
6.5
6.5
6.5 6.2
6.5
6.5
6.5
6.6
6.5
6.5
Note: These not seasonally adjusted estimates were prepared in cooperation with the U.S. Department of Labor, Bureau of Labor Statistics, based upon monthly reports submitted by selected
employers in the Brunswick Metropolitan Statistical Area, which includes Brantley, Glynn and McIntosh counties. The estimates include all full- and part-time wage and salary workers who were employed during or received pay for any part of the pay period that includes the twelfth of the month. Proprietors, domestic workers, self-employed persons, unpaid family workers and personnel of the armed forces are excluded. Estimates based on 2013 benchmark.
Source: Georgia Department of Labor, Workforce Statistics & Economic Research
14
COLUMBUS MSA Nonagricultural Employment (000s)
Industry Total Nonfarm Total Private Goods Producing Service-Providing Private Service-Providing Trade, Transportation, and Utilities
Retail Trade Information Financial Activities
Finance and Insurance Insurance Carriers and Related Activities Professional and Business Services Leisure and Hospitality Government
Federal Government State Government Local Government
2013 Preliminary Series
J an 119.2 94.0 14.7 104.5 79.3 18.5 13.2
1.5 12.7 10.8
4.5 12.4 13.2 25.2
7.1 4.4 13.7
Feb 120.3
94.7 14.7 105.6 80.0 18.4 13.2
1.5 12.8 11.0
4.5 12.6 13.5 25.6
7.1 4.8 13.7
M ar 120.5
94.9 14.8 105.7 80.1 18.3 13.2
1.5 12.8 11.0
4.5 12.6 13.8 25.6
7.0 4.8 13.8
Apr 121.5
95.7 14.7 106.8 81.0 18.4 13.3
1.5 12.8 10.9
4.4 12.8 14.2 25.8
7.1 4.9 13.8
M ay 121.9
96.3 14.8 107.1 81.5 18.6 13.3
1.6 12.8 10.9
4.4 12.9 14.4 25.6
7.0 4.8 13.8
Jun 121.7
96.6 15.0 106.7 81.6 18.5 13.4
1.6 12.8 11.0
4.4 12.9 14.4 25.1
6.9 4.5 13.7
Jul 120.6
96.2 15.0 105.6 81.2 18.4 13.4
1.6 12.8 11.0
4.4 13.1 14.4 24.4
6.9 4.4 13.1
Aug 121.1
96.7 15.1 106.0 81.6 18.4 13.5
1.5 13.0 11.1
4.4 13.3 14.4 24.4
6.9 4.5 13.0
Sep 121.3
96.3 15.0 106.3 81.3 18.1 13.3
1.5 12.9 11.1
4.3 13.4 14.4 25.0
6.9 4.8 13.3
Oct 122.0
96.7 15.1 106.9 81.6 18.1 13.5
1.5 13.0 11.1
4.4 13.3 14.4 25.3
6.9 4.9 13.5
Nov 123.0
97.6 14.9 108.1 82.7 18.2 13.7
1.5 13.0 11.1
4.4 13.3 14.4 25.4
6.9 4.9 13.6
Annual Dec Average
122.4 121.3
97.1 96.1
14.5 14.9
107.9 106.4
82.6 81.2
18.5 18.4
13.9 13.4
1.5
1.5
13.0 12.9
11.2 11.0
4.4
4.4
13.3 13.0
14.4 14.2
25.3 25.2
6.8
7.0
4.9
4.7
13.6 13.6
2012 Final Series
Industry
Annual Jan Feb Mar Apr M ay Jun Jul Aug Sep Oct Nov Dec Average
Total Nonfarm
118.6 119.7 120.5 120.4 121.0 120.6 118.6 119.7 119.6 121.8 122.5 121.8 120.4
Total Private
93.9 94.6 95.2 94.9 95.5 95.4 94.6 95.1 94.6 96.2 96.8 96.1 95.2
Goods Producing
14.9 14.9 15.0 14.9 15.0 15.1 14.9 15.1 15.1 15.3 15.3 14.7 15.0
Service-Providing
103.7 104.8 105.5 105.5 106.0 105.5 103.7 104.6 104.5 106.5 107.2 107.1 105.4
Private Service-Providing
79.0 79.7 80.2 80.0 80.5 80.3 79.7 80.0 79.5 80.9 81.5 81.4 80.2
Trade, Transportation, and Utilities
18.7 18.6 18.7 18.8 18.9 18.7 18.7 18.7 18.7 18.9 19.4 19.3 18.8
Retail Trade
13.2 13.2 13.2 13.2 13.3 13.2 13.2 13.2 13.2 13.4 13.9 13.9 13.3
Information
1.5
1.5
1.5
1.5
1.5
1.5 1.5
1.4
1.4
1.5
1.5
1.5
1.5
Financial Activities
12.7 12.7 12.7 12.6 12.7 12.6 12.8 12.8 12.8 12.8 12.8 12.9 12.7
Finance and Insurance
10.8 10.8 10.8 10.7 10.7 10.7 10.9 10.9 10.9 10.9 10.9 11.0 10.8
Insurance Carriers and Related Activities
4.6
4.6
4.6
4.5
4.6
4.6 4.6
4.6
4.6
4.6
4.6
4.6
4.6
Professional and Business Services
12.5 12.6 12.8 12.5 12.4 12.3 12.2 12.4 12.4 12.7 12.7 12.7 12.5
Leisure and Hospitality
13.4 13.7 14.2 14.0 14.3 14.2 14.0 14.0 13.7 13.8 13.9 13.9 13.9
Government
24.7 25.1 25.3 25.5 25.5 25.2 24.0 24.6 25.0 25.6 25.7 25.7 25.2
Federal Government
7.1
7.2
7.2
7.2
7.2
7.1 7.0
7.1
7.1
7.2
7.2
7.2
7.2
State Government
4.4
4.6
4.6
4.8
4.7
4.5 4.3
4.4
4.7
4.8
4.8
4.8
4.6
Local Government
13.2 13.3 13.5 13.5 13.6 13.6 12.7 13.1 13.2 13.6 13.7 13.7 13.4
Note: These not seasonally adjusted estimates were prepared in cooperation with the U.S. Department of Labor, Bureau of Labor Statistics, based upon monthly reports submitted by selected
employers in the Columbus Metropolitan Statistical Area, which includes Chattahoochee, Harris, Marion and Muscogee counties in Georgia and Russell County in Alabama. The estimates include all full- and part-time wage and salary workers who were employed during or received pay for any part of the pay period that includes the twelfth of the month. Proprietors, domestic workers, selfemployed persons, unpaid family workers and personnel of the armed forces are excluded. Estimates based on 2013 benchmark.
Source: Georgia Department of Labor, Workforce Statistics & Economic Research
15
DALTON MSA Nonagricultural Employment (000s)
Industry Total Nonfarm Total Private Goods Producing Service-Providing Private Service-Providing Manufacturing
Textile Mills Textile Product Mills Trade, Transportation, and Utilities Retail Trade Transportation, Warehousing, and Utilities Professional and Business Services Government Federal Government State Government Local Government
2013 Preliminary Series
Annual Jan Feb Mar Apr M ay Jun Jul Aug Sep Oct Nov Dec Average
62.7 62.9 63.0 63.2 63.5 63.6 63.3 64.2 63.9 64.0 64.0 63.6 63.5
55.7 56.0 56.1 56.3 56.6 56.8 56.7 57.3 57.0 57.0 57.0 56.7 56.6
22.1 22.2 22.3 22.3 22.2 22.2 22.2 22.3 22.4 22.4 22.2 22.1 22.2
40.6 40.7 40.7 40.9 41.3 41.4 41.1 41.9 41.5 41.6 41.8 41.5 41.3
33.6 33.8 33.8 34.0 34.4 34.6 34.5 35.0 34.6 34.6 34.8 34.6 34.4
21.1 21.1 21.1 21.1 21.0 21.0 21.1 21.1 21.2 21.2 21.2 21.2 21.1
2.4
2.3
2.3
2.3
2.3
2.2 2.2
2.2
2.2
2.2
2.2
2.2
2.3
14.4 14.3 14.3 14.2 14.2 14.1 14.1 14.2 14.3 14.3 14.2 14.3 14.2
15.8 15.7 15.8 16.0 16.1 16.1 15.8 16.2 16.1 16.0 16.3 16.1 16.0
7.3
7.3
7.4
7.5
7.6
7.7 7.7
7.8
7.7
7.8
8.0
8.0
7.7
4.2
4.2
4.1
4.1
4.1
4.1 3.8
4.2
4.1
4.1
4.1
4.1
4.1
5.4
5.5
5.3
5.4
5.5
5.7 5.7
5.6
5.5
5.5
5.5
5.4
5.5
7.0
6.9
6.9
6.9
6.9
6.8 6.6
6.9
6.9
7.0
7.0
6.9
6.9
0.2
0.2
0.2
0.2
0.2
0.2 0.2
0.2
0.2
0.2
0.2
0.2
0.2
1.0
1.0
1.0
1.0
1.0
0.9 0.9
0.9
1.0
1.0
1.0
1.0
1.0
5.8
5.7
5.7
5.7
5.7
5.7 5.5
5.8
5.7
5.8
5.8
5.7
5.7
2012 Final Series
Industry Total Nonfarm Total Private Goods Producing Service-Providing Private Service-Providing Manufacturing
Textile Mills Textile Product Mills Trade, Transportation, and Utilities Retail Trade Transportation, Warehousing, and Utilities Professional and Business Services Government Federal Government State Government Local Government
Jan Feb Mar Apr M ay Jun
Jul Aug Sep
Annual Oct Nov Dec Average
63.2 63.3 63.9 64.0 64.1 63.8 63.0 63.5 63.7 63.4 63.6 63.8 63.6
56.5 56.4 56.8 57.0 57.1 56.9 56.4 56.5 56.7 56.4 56.6 56.8 56.7
22.2 22.1 22.3 22.5 22.5 22.4 22.2 22.2 22.3 22.2 22.3 22.4 22.3
41.0 41.2 41.6 41.5 41.6 41.4 40.8 41.3 41.4 41.2 41.3 41.4 41.3
34.3 34.3 34.5 34.5 34.6 34.5 34.2 34.3 34.4 34.2 34.3 34.4 34.4
21.1 21.1 21.2 21.4 21.5 21.4 21.2 21.1 21.2 21.1 21.2 21.3 21.2
2.3
2.3
2.4
2.4
2.4
2.3 2.3
2.4
2.4
2.3
2.3
2.3
2.3
14.5 14.4 14.4 14.6 14.6 14.6 14.4 14.3 14.4 14.3 14.5 14.5 14.5
15.8 15.8 15.8 15.9 16.1 15.9 15.5 15.6 15.8 15.7 15.8 16.0 15.8
7.5
7.4
7.4
7.4
7.4
7.4 7.3
7.3
7.3
7.3
7.5
7.5
7.4
4.3
4.3
4.1
4.2
4.2
4.1 3.9
3.9
4.2
4.2
4.2
4.3
4.2
5.7
5.8
5.9
6.2
6.0
6.0 6.2
6.2
6.2
6.0
5.8
5.6
6.0
6.7
6.9
7.1
7.0
7.0
6.9 6.6
7.0
7.0
7.0
7.0
7.0
6.9
0.2
0.2
0.2
0.2
0.2
0.3 0.2
0.2
0.2
0.2
0.2
0.2
0.2
1.0
1.1
1.1
1.1
1.1
0.9 0.9
1.0
1.1
1.0
1.0
1.0
1.0
5.5
5.6
5.8
5.7
5.7
5.7 5.5
5.8
5.7
5.8
5.8
5.8
5.7
Note: These not seasonally adjusted estimates were prepared in cooperation with the U.S. Department of Labor, Bureau of Labor Statistics, based upon monthly reports submitted by selected
employers in the Dalton Metropolitan Statistical Area, which includes Murray and Whitfield counties. The estimates include all full- and part-time wage and salary workers who were employed during or received pay for any part of the pay period that includes the twelfth of the month. Proprietors, domestic workers, self-employed persons, unpaid family workers and personnel of the armed forces are excluded. Estimates based on 2013 benchmark.
Source: Georgia Department of Labor, Workforce Statistics & Economic Research
16
GAINESVILLE MSA Nonagricultural Employment (000s)
Industry Total Nonfarm Total Private Goods Producing Service-Providing Private Service-Providing Trade, Transportation, and Utilities
Retail Trade Government
Federal Government State Government Local Government
2013 Preliminary Series
Annual Jan Feb Mar Apr M ay Jun Jul Aug Sep Oct Nov Dec Average
75.3 75.8 76.0 76.8 77.4 77.1 76.9 77.8 77.5 77.8 78.0 77.6 77.0
65.2 65.6 65.9 66.6 67.4 67.4 67.5 67.9 67.5 67.7 67.8 67.5 67.0
19.8 20.1 20.2 20.1 20.2 20.2 20.2 20.5 20.4 20.3 20.2 20.1 20.2
55.5 55.7 55.8 56.7 57.2 56.9 56.7 57.3 57.1 57.5 57.8 57.5 56.8
45.4 45.5 45.7 46.5 47.2 47.2 47.3 47.4 47.1 47.4 47.6 47.4 46.8
14.6 14.6 14.7 14.9 15.0 15.1 15.1 15.1 15.2 15.2 15.2 15.5 15.0
7.7
7.6
7.7
7.8
7.8
7.9 7.9
7.9
8.0
8.1
8.2
8.3
7.9
10.1 10.2 10.1 10.2 10.0
9.7
9.4
9.9 10.0 10.1 10.2 10.1 10.0
0.5
0.5
0.4
0.5
0.4
0.4 0.4
0.4
0.4
0.4
0.4
0.4
0.4
2.3
2.4
2.4
2.4
2.3
2.2 2.2
2.4
2.4
2.4
2.4
2.3
2.3
7.3
7.3
7.3
7.3
7.3
7.1 6.8
7.1
7.2
7.3
7.4
7.4
7.2
2012 Final Series
Industry
Annual Jan Feb Mar Apr M ay Jun Jul Aug Sep Oct Nov Dec Average
Total Nonfarm
73.1 73.7 74.0 75.1 75.9 75.2 74.5 75.4 75.0 75.6 76.5 75.9 75.0
Total Private
63.1 63.6 63.8 64.8 65.7 65.3 65.0 65.4 64.9 65.5 66.4 66.0 65.0
Goods Producing
19.1 19.3 19.3 19.3 19.4 19.4 19.4 19.6 19.5 19.6 19.8 19.8 19.5
Service-Providing
54.0 54.4 54.7 55.8 56.5 55.8 55.1 55.8 55.5 56.0 56.7 56.1 55.5
Private Service-Providing
44.0 44.3 44.5 45.5 46.3 45.9 45.6 45.8 45.4 45.9 46.6 46.2 45.5
Trade, Transportation, and Utilities
14.1 14.1 14.1 14.6 14.6 14.6 14.6 14.7 14.8 14.7 15.0 15.1 14.6
Retail Trade
7.7
7.6
7.6
7.8
7.8
7.7 7.8
7.8
7.8
7.8
8.0
8.0
7.8
Government
10.0 10.1 10.2 10.3 10.2
9.9 9.5 10.0 10.1 10.1 10.1
9.9 10.0
Federal Government
0.5
0.5
0.5
0.5
0.5
0.5 0.5
0.5
0.5
0.5
0.5
0.5
0.5
State Government
2.3
2.3
2.4
2.4
2.3
2.2 2.2
2.4
2.4
2.4
2.4
2.2
2.3
Local Government
7.2
7.3
7.3
7.4
7.4
7.2 6.8
7.1
7.2
7.2
7.2
7.2
7.2
Note: These not seasonally adjusted estimates were prepared in cooperation with the U.S. Department of Labor, Bureau of Labor Statistics, based upon monthly reports submitted by selected
employers in the Gainesville Metropolitan Statistical Area, which comprises Hall county. The estimates include all full- and part-time wage and salary workers who were employed during or received pay for any part of the pay period that includes the twelfth of the month. Proprietors, domestic workers, self-employed persons, unpaid family workers and personnel of the armed forces are excluded. Estimates based on 2013 benchmark.
Source: Georgia Department of Labor, Workforce Statistics & Economic Research
17
HINESVILLE - FT. STEWART MSA Nonagricultural Employment (000s)
Industry Total Nonfarm Total Private Goods Producing Service-Providing Private Service-Providing Government
Federal Government State Government Local Government
2013 Preliminary Series
Annual Jan Feb Mar Apr M ay Jun Jul Aug Sep Oct Nov Dec Average
19.8 19.9 19.9 19.6 19.6 19.4 19.2 19.7 19.7 19.9 20.0 20.0 19.7
11.5 11.5 11.6 11.4 11.3 11.4 11.4 11.7 11.7 11.9 12.0 12.0 11.6
2.3
2.3
2.3
2.4
2.4
2.5 2.5
2.5
2.5
2.6
2.6
2.6
2.5
17.5 17.6 17.6 17.2 17.2 16.9 16.7 17.2 17.2 17.3 17.4 17.4 17.3
9.2
9.2
9.3
9.0
8.9
8.9 8.9
9.2
9.2
9.3
9.4
9.4
9.2
8.3
8.4
8.3
8.2
8.3
8.0 7.8
8.0
8.0
8.0
8.0
8.0
8.1
4.4
4.4
4.3
4.3
4.2
4.1 4.1
4.1
4.1
4.0
4.0
4.0
4.2
0.4
0.5
0.4
0.4
0.5
0.5 0.4
0.4
0.4
0.5
0.5
0.5
0.5
3.5
3.5
3.6
3.5
3.6
3.4 3.3
3.5
3.5
3.5
3.5
3.5
3.5
2012 Final Series
Industry
Annual Jan Feb Mar Apr M ay Jun Jul Aug Sep Oct Nov Dec Average
Total Nonfarm
20.0 19.6 20.1 20.2 20.3 19.9 19.5 19.9 19.9 20.0 20.2 20.0 20.0
Total Private
11.8 11.7 11.8 11.9 11.9 11.6 11.5 11.6 11.6 11.6 11.8 11.6 11.7
Goods Producing
2.3
2.3
2.3
2.3
2.3
2.3 2.3
2.3
2.4
2.3
2.4
2.3
2.3
Service-Providing
17.7 17.3 17.8 17.9 18.0 17.6 17.2 17.6 17.5 17.7 17.8 17.7 17.7
Private Service-Providing
9.5
9.4
9.5
9.6
9.6
9.3 9.2
9.3
9.2
9.3
9.4
9.3
9.4
Government
8.2
7.9
8.3
8.3
8.4
8.3 8.0
8.3
8.3
8.4
8.4
8.4
8.3
Federal Government
4.4
4.4
4.4
4.4
4.4
4.4 4.3
4.4
4.4
4.4
4.4
4.4
4.4
State Government
0.4
0.5
0.5
0.5
0.5
0.5 0.5
0.5
0.5
0.5
0.5
0.5
0.5
Local Government
3.4
3.0
3.4
3.4
3.5
3.4 3.2
3.4
3.4
3.5
3.5
3.5
3.4
Note: These not seasonally adjusted estimates were prepared in cooperation with the U.S. Department of Labor, Bureau of Labor Statistics, based upon monthly reports submitted by
selected employers in the Hinesville - Ft. Stewart Metropolitan Statistical Area, which includes Liberty and Long counties. The estimates include all full- and part-time wage and salary workers who were employed during or received pay for any part of the pay period that includes the twelfth of the month. Proprietors, domestic workers, self-employed persons, unpaid family workers and personnel of the armed forces are excluded. Estimates based on 2013 benchmark.
Source: Georgia Department of Labor, Workforce Statistics & Economic Research
18
MACON MSA Nonagricultural Employment (000s)
Industry Total Nonfarm Total Private Goods Producing Service-Providing Private Service-Providing Trade, Transportation, and Utilities
Retail Trade Transportation, Warehousing, and Utilities Financial Activities Professional and Business Services Education and Health Services Leisure and Hospitality Government Federal Government State Government Local Government
2013 Preliminary Series
Annual Jan Feb Mar Apr M AY Jun Jul Aug Sep Oct Nov Dec Average
97.6 97.8 97.7 98.7 98.9 98.4 98.6 99.3 99.0 98.7 100.0 99.7 98.7
82.2 82.2 82.2 83.3 83.7 83.4 84.1 84.5 84.0 83.6 84.8 84.5 83.5
9.0
9.0
9.0
9.1
9.0
9.0 9.0
9.0
9.1
9.1
9.1
8.8
9.0
88.6 88.8 88.7 89.6 89.9 89.4 89.6 90.3 89.9 89.6 90.9 90.9 89.7
73.2 73.2 73.2 74.2 74.7 74.4 75.1 75.5 74.9 74.5 75.7 75.7 74.5
19.7 19.6 19.6 19.8 19.9 20.1 20.5 20.5 20.3 20.5 21.5 22.0 20.3
13.0 13.1 13.1 13.2 13.3 13.4 13.7 13.8 13.7 13.6 14.1 14.4 13.5
3.5
3.4
3.4
3.5
3.6
3.6 3.6
3.6
3.6
3.6
3.6
3.6
3.6
9.3
9.4
9.4
9.5
9.5
9.5 9.5
9.6
9.6
9.6
9.6
9.6
9.5
10.8 10.6 10.7 11.0 11.2 11.0 11.2 11.4 11.4 11.3 11.4 11.3 11.1
20.0 20.1 20.0 20.2 20.2 20.0 20.0 20.2 20.1 20.2 20.2 20.1 20.1
9.0
9.1
9.1
9.3
9.5
9.4 9.4
9.4
9.1
9.1
9.1
9.1
9.2
15.4 15.6 15.5 15.4 15.2 15.0 14.5 14.8 15.0 15.1 15.2 15.2 15.2
1.2
1.2
1.2
1.2
1.2
1.2 1.2
1.2
1.2
1.2
1.3
1.3
1.2
4.2
4.3
4.2
4.2
4.0
3.9 3.9
3.8
4.0
4.0
4.0
4.0
4.0
10.0 10.1 10.1 10.0 10.0
9.9 9.4
9.8
9.8
9.9
9.9
9.9
9.9
2012 Final Series
Industry
Annual Jan Feb Mar Apr M AY Jun Jul Aug Sep Oct Nov Dec Average
Total Nonfarm Total Private Goods Producing Service-Providing Private Service-Providing Trade, Transportation, and Utilities
Retail Trade Transportation, Warehousing, and Utilities Financial Activities Professional and Business Services Education and Health Services Leisure and Hospitality Government Federal Government State Government Local Government
96.5 96.8 97.5 98.4 98.9 98.4 97.2 98.2 98.2 98.4 99.3 99.3 98.1
81.0 81.3 81.8 82.7 83.3 83.0 82.5 83.0 82.6 82.9 83.8 83.7 82.6
8.9
8.9
8.8
8.9
9.0
9.0 9.0
9.0
8.9
8.9
8.9
8.9
8.9
87.6 87.9 88.7 89.5 89.9 89.4 88.2 89.2 89.3 89.5 90.4 90.4 89.2
72.1 72.4 73.0 73.8 74.3 74.0 73.5 74.0 73.7 74.0 74.9 74.8 73.7
19.3 19.2 19.4 19.5 19.6 19.5 19.5 19.6 19.6 19.8 20.4 20.4 19.7
12.8 12.6 12.7 12.8 12.9 12.8 12.8 13.0 13.0 13.2 13.8 13.8 13.0
3.4
3.4
3.5
3.5
3.5
3.5 3.5
3.5
3.4
3.4
3.5
3.5
3.5
9.0
9.1
9.2
9.2
9.3
9.3 9.4
9.4
9.4
9.5
9.5
9.5
9.3
10.0 10.2 10.5 10.6 10.8 10.9 10.7 10.9 11.0 10.7 11.0 11.0 10.7
20.2 20.4 20.3 20.4 20.4 20.2 20.1 20.3 20.2 20.3 20.4 20.2 20.3
8.8
8.8
9.2
9.5
9.6
9.5 9.4
9.3
9.1
9.2
9.1
9.2
9.2
15.5 15.5 15.7 15.7 15.6 15.4 14.7 15.2 15.6 15.5 15.5 15.6 15.5
1.2
1.2
1.2
1.2
1.2
1.2 1.2
1.2
1.2
1.2
1.2
1.2
1.2
4.4
4.4
4.5
4.5
4.4
4.3 4.1
4.2
4.3
4.3
4.3
4.3
4.3
9.9
9.9 10.0 10.0 10.0
9.9 9.4
9.8 10.1 10.0 10.0 10.1
9.9
Note: These not seasonally adjusted estimates were prepared in cooperation with the U.S. Department of Labor, Bureau of Labor Statistics, based upon monthly reports submitted by selected
employers in the Macon Metropolitan Statistical Area, which includes Bibb, Crawford, Jones, Monroe and Twiggs counties. The estimates include all full- and part-time wage and salary workers who were employed during or received pay for any part of the pay period that includes the twelfth of the month. Proprietors, domestic workers, self-employed persons, unpaid family workers and personnel of the armed forces are excluded. Estimates based on 2013 benchmark.
Source: Georgia Department of Labor, Workforce Statistics & Economic Research
19
ROME MSA Nonagricultural Employment (000s)
Industry Total Nonfarm Total Private Goods Producing Service-Providing Private Service-Providing Manufacturing Trade, Transportation, and Utilities
Retail Trade Education and Health Services Government
Federal Government State Government Local Government
2013 Preliminary Series
Annual Jan Feb Mar Apr M ay Jun Jul Aug Sep Oct Nov Dec Average
38.1 38.4 38.4 38.7 38.9 38.6 38.4 38.8 38.7 39.1 39.4 39.5 38.8
31.8 32.2 32.1 32.5 32.8 32.6 32.5 32.9 32.8 33.0 33.3 33.4 32.7
6.1
6.2
6.1
6.2
6.3
6.3 6.4
6.5
6.4
6.4
6.4
6.3
6.3
32.0 32.2 32.3 32.5 32.6 32.3 32.0 32.3 32.3 32.7 33.0 33.2 32.5
25.7 26.0 26.0 26.3 26.5 26.3 26.1 26.4 26.4 26.6 26.9 27.1 26.4
5.5
5.5
5.5
5.4
5.5
5.5 5.6
5.6
5.5
5.5
5.5
5.5
5.5
6.6
6.7
6.8
6.8
6.9
7.0 7.0
7.2
7.2
7.2
7.4
7.5
7.0
4.1
4.1
4.3
4.4
4.5
4.5 4.6
4.6
4.6
4.6
4.7
4.8
4.5
9.5
9.8
9.6
9.9
9.8
9.6 9.5
9.7
9.8
9.8
9.8
9.7
9.7
6.3
6.2
6.3
6.2
6.1
6.0 5.9
5.9
5.9
6.1
6.1
6.1
6.1
0.2
0.2
0.2
0.2
0.2
0.2 0.2
0.2
0.2
0.2
0.2
0.2
0.2
1.9
1.8
1.9
1.8
1.7
1.7 1.7
1.7
1.7
1.8
1.8
1.8
1.8
4.2
4.2
4.2
4.2
4.2
4.1 4.0
4.0
4.0
4.1
4.1
4.1
4.1
2012 Final Series
Industry
Annual Jan Feb Mar Apr M ay Jun Jul Aug Sep Oct Nov Dec Average
Total Nonfarm
37.9 38.1 38.3 38.8 39.0 38.9 38.4 38.5 38.8 38.6 38.9 38.6 38.6
Total Private
31.7 31.9 32.0 32.4 32.6 32.5 32.2 32.3 32.5 32.3 32.5 32.4 32.3
Goods Producing
6.2
6.3
6.3
6.3
6.4
6.4 6.3
6.3
6.2
6.2
6.2
6.3
6.3
Service-Providing
31.7 31.8 32.0 32.5 32.6 32.5 32.1 32.2 32.6 32.4 32.7 32.3 32.3
Private Service-Providing
25.5 25.6 25.7 26.1 26.2 26.1 25.9 26.0 26.3 26.1 26.3 26.1 26.0
Manufacturing
5.5
5.5
5.6
5.6
5.6
5.7 5.6
5.6
5.6
5.6
5.6
5.6
5.6
Trade, Transportation, and Utilities
6.3
6.2
6.2
6.3
6.4
6.4 6.3
6.4
6.4
6.4
6.7
6.7
6.4
Retail Trade
3.9
3.9
3.9
3.9
4.0
3.9 3.9
3.9
3.9
4.0
4.2
4.2
4.0
Education and Health Services
9.5
9.5
9.5
9.7
9.6
9.5 9.5
9.5
9.7
9.8
9.8
9.7
9.6
Government
6.2
6.2
6.3
6.4
6.4
6.4 6.2
6.2
6.3
6.3
6.4
6.2
6.3
Federal Government
0.2
0.2
0.2
0.2
0.2
0.2 0.2
0.2
0.2
0.2
0.2
0.2
0.2
State Government
1.8
1.8
1.9
1.9
1.9
1.9 1.8
1.8
1.8
1.8
1.8
1.8
1.8
Local Government
4.2
4.2
4.2
4.3
4.3
4.3 4.2
4.2
4.3
4.3
4.4
4.2
4.3
Note: These not seasonally adjusted estimates were prepared in cooperation with the U.S. Department of Labor, Bureau of Labor Statistics, based upon monthly reports submitted by selected
employers in the Rome Metropolitan Statistical Area, which comprises Floyd county. The estimates include all full- and part-time wage and salary workers who were employed during or received pay for any part of the pay period that includes the twelfth of the month. Proprietors, domestic workers, self-employed persons, unpaid family workers and personnel of the armed forces are excluded. Estimates based on 2013 benchmark.
Source: Georgia Department of Labor, Workforce Statistics & Economic Research
20
SAVANNAH MSA Nonagricultural Employment (000s)
Industry Total Nonfarm Total Private Goods Producing Service-Providing Private Service-Providing Mining, Logging and Construction Manufacturing Trade, Transportation, and Utilities
Wholesale Trade Retail Trade Transportation, Warehousing, and Utilities Information Financial Activities Professional and Business Services Education and Health Services Leisure and Hospitality Other Services Government Federal Government State Government Local Government
2013 Preliminary Series
J an 155.6 132.3
20.5 135.1 111.8
5.6 14.9 34.8
6.0 18.3 10.5
1.4 6.3 17.7 24.0 20.7 6.9 23.3 3.1 5.8 14.4
Feb 157.6 133.6
20.6 137.0 113.0
5.7 14.9 34.8
6.1 18.2 10.5
1.4 6.4 18.1 24.3 21.0 7.0 24.0 3.1 6.2 14.7
M ar 160.5 136.5
20.9 139.6 115.6
5.9 15.0 35.0
6.1 18.3 10.6
1.4 6.4 19.3 24.6 21.9 7.0 24.0 3.0 6.2 14.8
Apr 161.7 137.6
20.6 141.1 117.0
5.6 15.0 35.5
6.1 18.7 10.7
1.4 6.4 19.2 24.7 22.8 7.0 24.1 3.1 6.2 14.8
M ay 162.8 138.8
20.6 142.2 118.2
5.8 14.8 35.6
6.2 18.6 10.8
1.4 6.4 19.5 24.8 23.3 7.2 24.0 3.0 6.2 14.8
Jun 161.4 137.8
20.7 140.7 117.1
5.7 15.0 35.1
6.2 18.5 10.4
1.4 6.5 19.4 24.3 23.2 7.2 23.6 2.9 5.9 14.8
Jul 160.8 138.0
20.6 140.2 117.4
5.5 15.1 35.3
6.2 18.7 10.4
1.3 6.5 20.0 23.9 23.3 7.1 22.8 2.9 5.8 14.1
Aug 161.4 138.3
20.6 140.8 117.7
5.5 15.1 35.4
6.1 19.0 10.3
1.4 6.5 19.8 24.1 23.4 7.1 23.1 2.9 5.9 14.3
Sep 161.6 138.0
20.6 141.0 117.4
5.4 15.2 35.4
6.1 18.9 10.4
1.3 6.6 20.3 23.9 22.9 7.0 23.6 2.9 6.2 14.5
Oct 163.4 139.8
20.6 142.8 119.2
5.4 15.2 35.6
6.1 19.2 10.3
1.3 6.6 21.3 24.3 22.9 7.2 23.6 2.8 6.1 14.7
Nov 163.4 140.3
20.6 142.8 119.7
5.3 15.3 36.3
6.1 19.6 10.6
1.3 6.6 20.9 24.3 23.1 7.2 23.1 2.8 6.2 14.1
Annual Dec Average
161.7 161.0
138.6 137.5
20.4 20.6
141.3 140.4
118.2 116.9
5.2
5.6
15.2 15.1
36.6 35.5
6.1
6.1
19.7 18.8
10.8 10.5
1.3
1.4
6.6
6.5
20.3 19.7
23.7 24.2
22.6 22.6
7.1
7.1
23.1 23.5
2.8
2.9
6.2
6.1
14.1 14.5
2012 Final Series
Industry
Annual Jan Feb Mar Apr M ay Jun Jul Aug Sep Oct Nov Dec Average
Total Nonfarm
151.1 153.5 156.0 157.5 158.5 158.3 156.9 157.3 157.7 159.0 158.8 158.0 156.9
Total Private
128.3 129.8 132.3 133.6 134.6 134.4 134.1 134.2 134.0 135.1 134.8 134.1 133.3
Goods Producing
20.2 20.4 20.6 20.5 20.5 20.7 20.9 20.8 20.8 20.5 20.4 20.4 20.6
Service-Providing
130.9 133.1 135.4 137.0 138.0 137.6 136.0 136.5 136.9 138.5 138.4 137.6 136.3
Private Service-Providing
108.1 109.4 111.7 113.1 114.1 113.7 113.2 113.4 113.2 114.6 114.4 113.7 112.7
Mining, Logging and Construction
5.5
5.6
5.6
5.5
5.5
5.5 5.7
5.7
5.7
5.5
5.4
5.4
5.6
Manufacturing
14.7 14.8 15.0 15.0 15.0 15.2 15.2 15.1 15.1 15.0 15.0 15.0 15.0
Trade, Transportation, and Utilities
33.8 33.8 34.2 34.1 34.7 34.3 34.4 34.6 34.6 35.2 36.0 36.4 34.7
Wholesale Trade
5.6
5.6
5.7
5.5
5.6
5.5 5.7
5.8
5.8
5.9
6.0
6.0
5.7
Retail Trade
17.7 17.4 17.6 17.9 18.0 17.9 18.0 18.0 18.0 18.7 19.3 19.4 18.2
Transportation, Warehousing, and Utilities
10.5 10.8 10.9 10.7 11.1 10.9 10.7 10.8 10.8 10.6 10.7 11.0 10.8
Information
1.4
1.4
1.5
1.4
1.5
1.5 1.5
1.5
1.4
1.4
1.4
1.4
1.4
Financial Activities
5.8
5.8
5.8
5.9
5.9
6.1 6.2
6.3
6.3
6.2
6.2
6.3
6.1
Professional and Business Services
16.9 17.8 18.2 18.7 18.4 18.8 18.7 18.7 18.7 19.0 18.4 18.4 18.4
Education and Health Services
23.6 23.7 24.0 24.1 24.2 23.9 23.5 23.7 23.9 24.5 24.3 23.7 23.9
Leisure and Hospitality
20.0 20.3 21.3 22.2 22.6 22.3 22.1 21.9 21.5 21.4 21.2 20.6 21.5
Other Services
6.6
6.6
6.7
6.7
6.8
6.8 6.8
6.7
6.8
6.9
6.9
6.9
6.8
Government
22.8 23.7 23.7 23.9 23.9 23.9 22.8 23.1 23.7 23.9 24.0 23.9 23.6
Federal Government
3.2
3.2
3.2
3.2
3.2
3.2 3.2
3.2
3.2
3.2
3.2
3.2
3.2
State Government
5.7
6.1
6.1
6.3
6.3
6.1 5.8
5.9
6.3
6.2
6.2
6.2
6.1
Local Government
13.9 14.4 14.4 14.4 14.4 14.6 13.8 14.0 14.2 14.5 14.6 14.5 14.3
Note: These not seasonally adjusted estimates were prepared in cooperation with the U.S. Department of Labor, Bureau of Labor Statistics, based upon monthly reports submitted by
selected employers in the Savannah Metropolitan Statistical Area, which includes Bryan, Chatham and Effingham counties. The estimates include all full- and part-time wage and salary workers who were employed during or received pay for any part of the pay period that includes the twelfth of the month. Proprietors, domestic workers, self-employed persons, unpaid family workers and personnel of the armed forces are excluded. Estimates based on 2013 benchmark.
Source: Georgia Department of Labor, Workforce Statistics & Economic Research
21
VALDOSTA MSA Nonagricultural Employment (000s)
Industry Total Nonfarm Total Private Goods Producing Service-Providing Private Service-Providing Trade, Transportation, and Utilities
Retail Trade Government
Federal Government State Government Local Government
2013 Preliminary Series
Annual Jan Feb Mar Apr M AY Jun Jul Aug Sep Oct Nov Dec Average
52.5 52.9 53.3 53.9 53.8 53.1 53.5 54.2 54.0 54.4 54.4 54.1 53.7
38.8 39.1 39.4 40.0 40.1 40.0 40.6 40.6 40.2 40.5 40.7 40.4 40.0
6.2
6.3
6.3
6.4
6.4
6.4 6.5
6.5
6.5
6.6
6.5
6.4
6.4
46.3 46.6 47.0 47.5 47.4 46.7 47.0 47.7 47.5 47.8 47.9 47.7 47.3
32.6 32.8 33.1 33.6 33.7 33.6 34.1 34.1 33.7 33.9 34.2 34.0 33.6
10.5 10.6 10.7 10.7 10.7 10.7 10.9 10.9 10.8 11.0 11.0 11.1 10.8
7.8
7.9
8.0
8.0
7.9
7.9 8.0
8.0
7.9
8.1
8.2
8.3
8.0
13.7 13.8 13.9 13.9 13.7 13.1 12.9 13.6 13.8 13.9 13.7 13.7 13.6
1.2
1.2
1.2
1.2
1.2
1.2 1.2
1.2
1.2
1.2
1.1
1.1
1.2
4.3
4.3
4.4
4.4
4.4
3.8 3.9
4.3
4.4
4.5
4.4
4.4
4.3
8.2
8.3
8.3
8.3
8.1
8.1 7.8
8.1
8.2
8.2
8.2
8.2
8.2
2012 Final Series
Industry
Annual Jan Feb Mar Apr M AY Jun Jul Aug Sep Oct Nov Dec Average
Total Nonfarm
52.6 53.0 53.6 54.4 54.5 53.8 52.9 53.4 53.3 53.4 53.9 53.5 53.5
Total Private
39.1 39.3 39.9 40.3 40.4 40.2 40.0 40.1 39.5 39.5 40.0 39.7 39.8
Goods Producing
6.2
6.3
6.2
6.3
6.3
6.4 6.3
6.4
6.3
6.4
6.4
6.4
6.3
Service-Providing
46.4 46.7 47.4 48.1 48.2 47.4 46.6 47.0 47.0 47.0 47.5 47.1 47.2
Private Service-Providing
32.9 33.0 33.7 34.0 34.1 33.8 33.7 33.7 33.2 33.1 33.6 33.3 33.5
Trade, Transportation, and Utilities
10.5 10.5 10.5 10.6 10.5 10.4 10.5 10.5 10.5 10.6 10.9 10.9 10.6
Retail Trade
7.4
7.4
7.4
7.6
7.6
7.5 7.5
7.6
7.7
7.8
8.2
8.2
7.7
Government
13.5 13.7 13.7 14.1 14.1 13.6 12.9 13.3 13.8 13.9 13.9 13.8 13.7
Federal Government
1.2
1.2
1.2
1.2
1.2
1.2 1.2
1.2
1.2
1.2
1.2
1.2
1.2
State Government
4.2
4.3
4.3
4.7
4.7
4.2 3.9
4.1
4.4
4.4
4.4
4.3
4.3
Local Government
8.1
8.2
8.2
8.2
8.2
8.2 7.8
8.0
8.2
8.3
8.3
8.3
8.2
Note: These not seasonally adjusted estimates were prepared in cooperation with the U.S. Department of Labor, Bureau of Labor Statistics, based upon monthly reports submitted by selected
employers in the Valdosta Metropolitan Statistical Area, which includes Brooks, Echols, Lanier and Lowndes counties. The estimates include all full- and part-time wage and salary workers who were employed during or received pay for any part of the pay period that includes the twelfth of the month. Proprietors, domestic workers, self-employed persons, unpaid family workers and personnel of the armed forces are excluded. Estimates based on 2013 benchmark.
Source: Georgia Department of Labor, Workforce Statistics & Economic Research
22
WARNER ROBINS MSA Nonagricultural Employment (000s)
Industry Total Nonfarm Total Private Goods Producing Service-Providing Private Service-Providing Trade, Transportation, and Utilities
Retail Trade Government
Federal Government State Government Local Government
2013 Preliminary Series
Annual Jan Feb Mar Apr M ay Jun Jul Aug Sep Oct Nov Dec Average
59.6 59.8 59.7 60.4 60.2 59.5 58.6 58.5 58.6 58.9 59.0 58.9 59.3
34.6 34.8 34.7 35.4 35.6 34.9 34.5 34.2 34.0 34.2 34.6 34.5 34.7
6.0
6.0
5.9
6.0
6.0
6.0 5.7
5.6
5.6
5.7
5.7
5.6
5.8
53.6 53.8 53.8 54.4 54.2 53.5 52.9 52.9 53.0 53.2 53.3 53.3 53.5
28.6 28.8 28.8 29.4 29.6 28.9 28.8 28.6 28.4 28.5 28.9 28.9 28.9
8.2
8.1
8.2
8.2
8.2
8.1 8.2
8.2
8.2
8.2
8.3
8.2
8.2
6.5
6.4
6.5
6.5
6.5
6.5 6.6
6.6
6.6
6.7
6.8
6.9
6.6
25.0 25.0 25.0 25.0 24.6 24.6 24.1 24.3 24.6 24.7 24.4 24.4 24.6
15.8 15.8 15.8 15.8 15.3 15.3 15.3 15.3 15.2 15.2 15.2 15.2 15.4
1.0
1.0
1.0
1.0
1.0
1.0 1.0
1.0
1.1
1.3
1.0
1.0
1.0
8.2
8.2
8.2
8.2
8.3
8.3 7.8
8.0
8.3
8.2
8.2
8.2
8.2
2012 Final Series
Industry Total Nonfarm
Annual Jan Feb Mar Apr M ay Jun Jul Aug Sep Oct Nov Dec Average 59.5 59.6 59.9 60.2 59.7 59.9 59.0 59.2 59.2 60.3 60.2 60.2 59.7
Total Private
33.5 33.7 34.0 34.2 34.3 34.2 34.0 34.2 34.0 34.7 35.0 35.0 34.2
Goods Producing
5.9
5.9
5.9
6.1
6.1
6.1 6.1
6.2
6.0
6.1
6.1
6.0
6.0
Service-Providing
53.6 53.7 54.0 54.1 53.6 53.8 52.9 53.0 53.2 54.2 54.1 54.2 53.7
Private Service-Providing
27.6 27.8 28.1 28.1 28.2 28.1 27.9 28.0 28.0 28.6 28.9 29.0 28.2
Trade, Transportation, and Utilities
7.9
7.9
7.9
8.1
8.2
8.2 8.2
8.1
8.2
8.2
8.5
8.5
8.2
Retail Trade
6.3
6.2
6.3
6.4
6.5
6.5 6.4
6.4
6.5
6.4
6.7
6.8
6.5
Government
26.0 25.9 25.9 26.0 25.4 25.7 25.0 25.0 25.2 25.6 25.2 25.2 25.5
Federal Government
16.7 16.6 16.6 16.6 16.1 16.2 16.2 16.0 15.9 16.0 15.9 15.9 16.2
State Government
1.0
1.0
1.0
1.0
1.0
1.1 1.0
1.0
1.0
1.3
1.0
1.0
1.0
Local Government
8.3
8.3
8.3
8.4
8.3
8.4 7.8
8.0
8.3
8.3
8.3
8.3
8.3
Note: These not seasonally adjusted estimates were prepared in cooperation with the U.S. Department of Labor, Bureau of Labor Statistics, based upon monthly reports submitted by selected
employers in the Warner Robins Metropolitan Statistical Area, which comprises Houston county. The estimates include all full- and part-time wage and salary workers who were employed during or received pay for any part of the pay period that includes the twelfth of the month. Proprietors, domestic workers, self-employed persons, unpaid family workers and personnel of the armed forces are excluded. Estimates based on 2013 benchmark.
Source: Georgia Department of Labor, Workforce Statistics & Economic Research
23
MSA Nonagricultural Employment
2006 2013 Annual Average Employment
4,300,000
Georgia
4,200,000 4,100,000 4,000,000 3,900,000
4,167,200
4,111,700
4,123,100
4,033,400
3,954,900
3,900,900
3,901,400
3,861,200
3,800,000
3,700,000
2006
2007
2008
2009
2010
2011
2012
2013
67,000
65,500 64,000
64,900
62,500
61,000
59,500
58,000
2006
65,000 2007
Albany MSA
64,500
62,200
61,300
2008
2009
2010
61,100 2011
61,000 2012
61,100 2013
Athens MSA
98,000
95,000 92,000 89,000 88,200 86,000
90,200
91,700
87,400
86,300
86,500
87,700
89,400
83,000
80,000
2006
2007
2008
2009
2010
2011
2012
2013
221,000 218,500 216,000 213,500 211,000
216,700
219,000
Augusta MSA
218,700
212,300
213,600
215,400
216,200
217,800
208,500
206,000
2006
2007
2008
2009
2010
2011
2012
2013
2,500,000
Atlanta MSA
2,450,000 2,400,000
2,453,600
2,404,800
2,427,000
2,404,900
2,350,000 2,300,000 2,250,000
2,348,000
2,290,900
2,305,600
2,270,100
2,200,000
2006
2007
2008
2009
2010
2011
2012
2013
48,000
46,000 44,000
44,800
42,000
40,000
38,000
36,000
2006
Brunswick MSA
45,400
45,300
42,500
40,500
40,000
2007
2008
2009
2010
2011
40,600 2012
40,800 2013
Columbus MSA
125,000
123,000 122,700 121,000 119,000 117,000
121,900
121,800
117,900
117,900
119,400
120,400
121,300
115,000
113,000
2006
2007
2008
2009
2010
2011
2012
2013
85,000 80,000
79,800
75,000
78,500
Dalton MSA
74,000
70,000 65,000
66,800
66,200
65,700
63,600
63,500
60,000
55,000
2006
2007
2008
2009
2010
2011
2012
2013
Source: Georgia Department of Labor, Workforce Statistics & Economic Research
24
MSA Nonagricultural Employment
2006 2013 Annual Average Employment
80,000 77,000 74,000 73,600 71,000
Gainesville MSA
77,300
77,800
71,600
71,500
73,100
75,000
77,000
68,000
65,000
62,000
2006
2007
2008
2009
2010
2011
2012
2013
21,000 20,000 19,000 18,000
Hinesville - Ft. Stewart MSA
19,400
19,500
19,900
20,200
20,000
18,200
18,300
19,700
17,000
16,000
2006
2007
2008
2009
2010
2011
2012
2013
104,000 102,000 100,000
101,000
101,100
Macon MSA
101,900
98,000 96,000
96,700
95,700
96,900
98,100
98,700
94,000
92,000
2006
2007
2008
2009
2010
2011
2012
2013
47,000
45,000
43,000 41,000
42,100
39,000
37,000
35,000
2006
42,000 2007
Rome MSA
41,400
39,200
38,700
2008
2009
2010
38,300 2011
38,600 2012
38,800 2013
Savannah MSA
170,000
165,000
160,000 155,000
156,700
150,000
162,200
160,100
151,800
151,900
153,300
156,900
161,000
145,000
140,000
2006
2007
2008
2009
2010
2011
2012
2013
60,000
58,000 56,000
56,200
54,000
52,000
50,000
48,000
2006
57,000 2007
Valdosta MSA
57,100
54,200
52,800
52,700
2008
2009
2010
2011
53,500 2012
53,700 2013
62,000
60,000
58,000 56,000
56,500
54,000
52,000
50,000
2006
Warner Robins MSA
58,400
58,600
58,800
59,300
59,700
2007
2008
2009
2010
2011
59,700 2012
59,300 2013
Source: Georgia Department of Labor, Workforce Statistics & Economic Research
25
Georgia Hours and Earnings
Industry Total Private
Goods Producing Private Service Providing
Construction Manufacturing Trade, Transportation, and Utilities Financial Activities Professional and Business Services Educational and Health Services Leisure and Hospitality Other Services
Jan 22.21 21.86 22.29 22.47 21.60 20.47 28.58 25.47 23.34 12.16 18.07
2013 All Employee
AVERAGE HOURLY EARNINGS (AHE) Feb Mar Apr May Jun Jul Aug Sep Oct Nov Dec Average 22.40 22.15 22.26 22.18 22.44 22.34 22.45 22.77 22.61 22.71 23.06 22.47 22.16 22.00 22.08 22.22 22.53 22.47 22.42 22.51 22.39 22.50 22.85 22.34 22.45 22.18 22.30 22.17 22.42 22.31 22.46 22.83 22.66 22.76 23.11 22.50 22.91 22.39 22.21 22.49 22.54 22.48 22.59 22.91 22.51 22.46 22.88 22.57 21.83 21.82 22.02 22.09 22.52 22.47 22.32 22.27 22.30 22.47 22.78 22.21 20.64 20.13 20.12 20.24 20.54 20.39 20.37 20.59 20.48 20.46 20.76 20.43 28.84 29.18 29.60 29.67 30.08 30.08 30.38 30.95 31.34 30.61 31.20 30.06 25.63 25.16 25.52 25.28 25.66 25.53 25.69 26.09 25.55 26.18 26.64 25.70 23.88 23.89 23.73 23.50 23.57 23.79 24.00 24.10 24.09 24.10 23.94 23.83 12.10 12.02 12.00 12.01 11.85 11.79 11.98 12.09 12.10 12.13 12.25 12.04 18.55 18.66 19.22 19.20 18.93 18.46 18.74 18.93 19.71 19.38 19.64 18.97
Industry Total Private
Goods Producing Private Service Providing
Construction Manufacturing Trade, Transportation, and Utilities Financial Activities Professional and Business Services Educational and Health Services Leisure and Hospitality Other Services
Jan 34.8 40.4 33.8 39.1 41.2 34.1 36.8 37.0 34.5 25.6 30.1
Feb 34.9 40.1 34.0 38.0 41.2 34.5 36.9 37.5 34.2 26.2 30.4
AVERAGE WEEKLY HOURS (AWH) Mar Apr May Jun 35.2 35.1 34.9 35.6 41.0 40.9 41.3 42.0 34.1 34.0 33.8 34.5 40.4 40.3 41.2 41.5 41.2 41.2 41.3 42.2 34.5 34.5 34.4 34.9 36.7 36.9 36.9 38.1 37.3 37.4 37.2 38.1 34.3 34.2 34.2 34.8 26.6 26.6 26.4 26.9 30.8 29.2 29.1 29.7
Jul 35.0 41.4 33.8 40.9 41.6 34.5 37.0 36.8 34.2 26.3 29.6
Aug 35.0 41.4 33.9 40.2 42.1 34.7 37.1 37.0 34.7 26.0 30.3
Sep 35.6 42.2 34.4 41.6 42.4 35.1 38.2 37.7 34.9 26.1 31.9
Oct 35.0 41.5 33.8 40.6 41.9 34.6 36.6 36.6 34.4 26.1 31.2
Nov 35.2 41.7 34.0 40.8 42.2 34.9 36.7 37.0 34.5 26.2 31.9
Dec 35.5 41.7 34.4 40.1 42.5 35.2 38.0 37.4 35.0 26.4 32.1
Average 35.2 41.3 34.0 40.4 41.8 34.7 37.2 37.3 34.5 26.3 30.5
Industry Total Private Goods Producing Private Service Providing
Construction Manufacturing Trade, Transportation, and Utilities Financial Activities Professional and Business Services Educational and Health Services Leisure and Hospitality Other Services
AVERAGE WEEKLY EARNINGS (AWE)
Jan
Feb Mar Apr May Jun Jul Aug Sep Oct Nov Dec Average
772.91 781.76 779.68 781.33 774.08 798.86 781.90 785.75 810.61 791.35 799.39 818.63 790.94
883.14 888.62 902.00 903.07 917.69 946.26 930.26 928.19 949.92 929.19 938.25 952.85 922.64
753.40 763.30 756.34 758.20 749.35 773.49 754.08 761.39 785.35 765.91 773.84 794.98 765.00
878.58 870.58 904.56 895.06 926.59 935.41 919.43 908.12 953.06 913.91 916.37 917.49 911.83
889.92 899.40 898.98 907.22 912.32 950.34 934.75 939.67 944.25 934.37 948.23 968.15 928.38
698.03 712.08 694.49 694.14 696.26 716.85 703.46 706.84 722.71 708.61 714.05 730.75 708.92
1,051.74 1,064.20 1,070.91 1,092.24 1,094.82 1,146.05 1,112.96 1,127.10 1,182.29 1,147.04 1,123.39 1,185.60 1,118.23
942.39 961.13 938.47 954.45 940.42 977.65 939.50 950.53 983.59 935.13 968.66 996.34 958.61
805.23 816.70 819.43 811.57 803.70 820.24 813.62 832.80 841.09 828.70 831.45 837.90 822.14
311.30 317.02 319.73 319.20 317.06 318.77 310.08 311.48 315.55 315.81 317.81 323.40 316.65
543.91 563.92 574.73 561.22 558.72 562.22 546.42 567.82 603.87 614.95 618.22 630.44 578.59
Source: Georgia Department of Labor, Workforce Statistics & Economic Research
26
Georgia Hours and Earnings
Industry Total Private
Goods Producing Private Service Providing
Construction Manufacturing Trade, Transportation, and Utilities Financial Activities Professional and Business Services Educational and Health Services Leisure and Hospitality Other Services
Jan 21.98 22.05 21.96 22.42 21.80 20.59 24.81 27.01 22.14 12.29 18.18
2012 All Employee
AVERAGE HOURLY EARNINGS (AHE) Feb Mar Apr May Jun Jul Aug Sep Oct Nov Dec Average 21.59 21.57 21.77 21.35 21.43 21.90 21.59 21.92 21.77 21.90 22.21 21.75 21.80 21.80 22.03 21.70 21.67 21.89 21.51 21.47 21.40 21.93 22.09 21.78 21.55 21.52 21.72 21.27 21.38 21.90 21.61 22.01 21.85 21.89 22.24 21.74 21.99 22.15 21.83 21.59 21.77 22.16 21.65 21.70 21.60 22.98 22.79 22.05 21.62 21.58 22.07 21.71 21.58 21.69 21.49 21.35 21.32 21.45 21.78 21.62 19.99 20.09 20.48 19.96 20.12 20.87 20.39 20.81 20.69 20.49 20.61 20.43 25.18 25.50 26.39 26.59 27.09 27.10 27.29 28.55 27.92 27.04 28.78 26.87 26.32 26.02 25.55 25.12 25.24 25.72 24.78 25.00 24.71 25.04 25.14 25.45 22.18 22.15 22.46 22.04 22.32 22.58 22.88 22.52 22.88 22.94 23.18 22.52 12.36 12.22 12.25 12.21 12.08 12.26 12.07 12.15 12.11 12.10 12.17 12.19 18.09 17.84 18.25 17.77 17.13 17.41 17.68 18.03 17.77 18.14 18.08 17.86
Industry Total Private
Goods Producing Private Service Providing
Construction Manufacturing Trade, Transportation, and Utilities Financial Activities Professional and Business Services Educational and Health Services Leisure and Hospitality Other Services
Jan 35.0 39.1 34.2 37.3 40.2 34.9 37.3 36.4 35.6 26.3 30.4
Feb 34.8 39.4 33.9 38.5 40.0 34.9 36.3 36.2 34.6 26.5 30.3
AVERAGE WEEKLY HOURS (AWH) Mar Apr May Jun 34.8 35.2 34.8 34.9 39.6 39.9 39.7 40.1 33.9 34.3 33.9 33.9 38.5 39.8 39.0 39.1 40.3 39.9 40.1 40.6 34.7 34.7 34.6 34.5 36.1 37.4 35.9 36.2 36.4 37.6 36.9 36.8 34.6 34.7 34.6 34.4 26.6 26.6 26.6 26.8 30.8 30.7 29.4 30.2
Jul 35.2 39.4 34.4 40.1 39.1 34.8 38.2 37.4 34.8 26.9 30.4
Aug 35.0 39.7 34.2 39.6 39.8 34.4 36.5 38.3 34.5 26.4 30.7
Sep 35.6 40.2 34.7 40.1 40.2 34.6 37.8 38.9 35.1 26.4 31.4
Oct 34.9 40.1 34.0 39.9 40.2 34.3 36.8 37.5 34.5 26.3 30.2
Nov 34.9 40.3 33.9 40.5 40.3 34.6 37.0 37.0 34.2 26.0 30.2
Dec 35.5 40.8 34.6 39.7 41.4 35.0 38.2 38.3 34.9 26.2 31.1
Average 35.0 39.9 34.2 39.4 40.2 34.7 37.0 37.3 34.7 26.5 30.5
Industry Total Private Goods Producing Private Service Providing
Construction Manufacturing Trade, Transportation, and Utilities Financial Activities Professional and Business Services Educational and Health Services Leisure and Hospitality Other Services
AVERAGE WEEKLY EARNINGS (AWE)
Jan
Feb Mar Apr May Jun Jul Aug Sep Oct Nov Dec Average
769.30 751.33 750.64 766.30 742.98 747.91 770.88 755.65 780.35 759.77 764.31 788.46 761.25
862.16 858.92 863.28 879.00 861.49 868.97 862.47 853.95 863.09 858.14 883.78 901.27 869.02
751.03 730.55 729.53 745.00 721.05 724.78 753.36 739.06 763.75 742.90 742.07 769.50 743.51
836.27 846.62 852.78 868.83 842.01 851.21 888.62 857.34 870.17 861.84 930.69 904.76 868.77
876.36 864.80 869.67 880.59 870.57 876.15 848.08 855.30 858.27 857.06 864.44 901.69 869.12
718.59 697.65 697.12 710.66 690.62 694.14 726.28 701.42 720.03 709.67 708.95 721.35 708.92
925.41 914.03 920.55 986.99 954.58 980.66 1,035.22 996.09 1,079.19 1,027.46 1,000.48 1,099.40 994.19
983.16 952.78 947.13 960.68 926.93 928.83 961.93 949.07 972.50 926.63 926.48 962.86 949.29
788.18 767.43 766.39 779.36 762.58 767.81 785.78 789.36 790.45 789.36 784.55 808.98 781.44
323.23 327.54 325.05 325.85 324.79 323.74 329.79 318.65 320.76 318.49 314.60 318.85 323.04
552.67 548.13 549.47 560.28 522.44 517.33 529.26 542.78 566.14 536.65 547.83 562.29 544.73
Source: Georgia Department of Labor, Workforce Statistics & Economic Research
27
Metro Statistical Area Albany MSA Athens-Clarke County MSA Atlanta MSA Augusta-Richmond County MSA Brunswick MSA Columbus MSA Dalton MSA Gainesville MSA Hinesville-Fort Stewart MSA Macon MSA Rome MSA Savannah MSA Valdosta MSA Warner Robins MSA
Metro Statistical Area Albany MSA Athens-Clarke County MSA Atlanta MSA Augusta-Richmond County MSA Brunswick MSA Columbus MSA Dalton MSA Gainesville MSA Hinesville-Fort Stewart MSA Macon MSA Rome MSA Savannah MSA Valdosta MSA Warner Robins MSA
Metro Statistical Area Albany MSA Athens-Clarke County MSA Atlanta MSA Augusta-Richmond County MSA Brunswick MSA Columbus MSA Dalton MSA Gainesville MSA Hinesville-Fort Stewart MSA Macon MSA Rome MSA Savannah MSA Valdosta MSA Warner Robins MSA
MSA Hours and Earnings
Jan 16.45 20.01 24.90 21.69 16.62 20.44 17.12 21.16 19.37 19.10 20.57 20.20 16.19 16.29
2013 All Employee
AVERAGE HOURLY EARNINGS (AHE)
Feb 16.58 19.66 24.95 22.63 17.85 20.49 16.96 21.51 19.21 18.70 21.07 20.06 16.20 16.40
Mar 16.88 19.05 24.77 22.43 17.42 20.49 17.06 21.42 20.13 19.38 20.83 20.09 16.33 15.95
Apr 16.76 18.79 24.79 21.93 17.68 19.99 16.75 21.37 18.66 19.27 21.10 20.26 16.31 15.61
May 16.67 18.66 24.67 21.83 17.28 19.95 16.79 21.27 17.96 18.36 21.14 20.21 16.81 15.58
Jun 16.63 18.29 24.94 22.70 16.25 20.18 16.74 21.51 19.90 18.69 21.49 20.28 16.95 16.03
Jul 16.60 18.16 24.66 22.26 16.44 19.74 16.60 21.84 19.34 18.81 21.41 20.17 17.08 16.23
Aug 16.96 18.32 24.87 22.39 16.23 19.58 16.66 21.88 20.26 18.79 21.32 20.28 17.30 15.68
Sep 17.69 18.04 25.24 22.83 16.92 20.21 16.72 22.09 19.26 19.49 21.20 20.65 17.61 16.01
Oct 17.30 17.80 25.05 22.31 16.67 19.86 16.44 21.38 19.71 19.05 21.73 20.86 17.59 15.67
Nov 16.62 17.64 25.14 22.77 17.15 19.77 16.77 21.91 19.91 19.11 20.72 20.80 17.52 16.30
Dec Average 16.87 16.84 17.84 18.51 25.57 24.97 22.72 22.37 17.31 16.99 20.17 20.07 17.36 16.83 21.42 21.57 20.67 19.55 19.11 18.99 20.87 21.13 20.67 20.38 17.66 16.95 16.56 16.02
Jan 32.1 32.1 34.2 35.4 30.2 34.7 36.4 38.2 41.4 39.1 33.9 33.0 38.0 34.8
Feb 31.2 32.0 34.6 35.4 31.7 33.7 36.9 36.9 40.0 39.8 33.7 33.4 37.6 35.1
AVERAGE WEEKLY HOURS (AWH)
Mar 32.8 31.0 34.8 35.9 31.6 35.2 37.8 37.2 40.9 39.5 34.9 33.3 37.2 35.7
Apr 32.8 30.8 34.8 35.6 33.0 34.1 38.1 37.6 38.5 38.8 34.7 33.4 37.7 36.7
May 33.5 30.6 34.6 35.8 30.5 34.0 38.7 36.3 44.1 38.9 35.4 33.3 36.0 37.2
Jun 33.0 32.3 35.4 35.6 30.6 34.7 37.8 37.2 43.5 39.5 37.2 33.5 36.9 37.5
Jul 34.1 32.1 34.7 35.4 31.7 34.4 37.4 37.0 45.1 39.1 35.3 33.2 36.0 37.5
Aug 33.9 30.7 34.9 35.4 32.1 34.2 37.8 37.9 45.1 39.3 36.7 33.3 35.5 37.0
Sep 33.9 31.4 35.6 35.5 32.7 34.3 37.9 38.0 45.1 39.2 38.1 33.7 36.6 37.5
Oct 33.7 30.5 34.9 34.6 33.4 34.5 37.6 37.3 44.1 38.9 37.9 33.2 35.4 37.8
Nov 34.0 31.3 35.2 35.6 33.2 34.5 38.2 36.9 43.7 39.5 37.5 33.0 34.5 37.4
Dec 33.9 31.9 35.7 35.7 33.3 34.7 37.9 37.0 43.9 39.5 37.3 33.7 35.1 37.0
Average 33.2 31.4 35.0 35.5 32.0 34.4 37.7 37.3 43.0 39.2 36.0 33.3 36.4 36.7
Jan 528.05 642.32 851.58 767.83 501.92 709.27 623.17 808.31 801.92 746.81 697.32 666.60 615.22 566.89
AVERAGE WEEKLY EARNINGS (AWE) Feb Mar Apr May Jun Jul Aug Sep Oct Nov Dec Average 517.30 553.66 549.73 558.45 548.79 566.06 574.94 599.69 583.01 565.08 571.89 559.09 629.12 590.55 578.73 571.00 590.77 582.94 562.42 566.46 542.90 552.13 569.10 581.21 863.27 862.00 862.69 853.58 882.88 855.70 867.96 898.54 874.25 884.93 912.85 873.95 801.10 805.24 780.71 781.51 808.12 788.00 792.61 810.47 771.93 810.61 811.10 794.14 565.85 550.47 583.44 527.04 497.25 521.15 520.98 553.28 556.78 569.38 576.42 543.68 690.51 721.25 681.66 678.30 700.25 679.06 669.64 693.20 685.17 682.07 699.90 690.41 625.82 644.87 638.18 649.77 632.77 620.84 629.75 633.69 618.14 640.61 657.94 634.49 793.72 796.82 803.51 772.10 800.17 808.08 829.25 839.42 797.47 808.48 792.54 804.56 768.40 823.32 718.41 792.04 865.65 872.23 913.73 868.63 869.21 870.07 907.41 840.65 744.26 765.51 747.68 714.20 738.26 735.47 738.45 764.01 741.05 754.85 754.85 744.41 710.06 726.97 732.17 748.36 799.43 755.77 782.44 807.72 823.57 777.00 778.45 760.68 670.00 669.00 676.68 672.99 679.38 669.64 675.32 695.91 692.55 686.40 696.58 678.65 609.12 607.48 614.89 605.16 625.46 614.88 614.15 644.53 622.69 604.44 619.87 616.98 575.64 569.42 572.89 579.58 601.13 608.63 580.16 600.38 592.33 609.62 612.72 587.93
Source: Georgia Department of Labor, Workforce Statistics & Economic Research
28
Metro Statistical Area Albany MSA Athens-Clarke County MSA Atlanta MSA Augusta-Richmond County MSA Brunswick MSA Columbus MSA Dalton MSA Gainesville MSA Hinesville-Fort Stewart MSA Macon MSA Rome MSA Savannah MSA Valdosta MSA Warner Robins MSA
Metro Statistical Area Albany MSA Athens-Clarke County MSA Atlanta MSA Augusta-Richmond County MSA Brunswick MSA Columbus MSA Dalton MSA Gainesville MSA Hinesville-Fort Stewart MSA Macon MSA Rome MSA Savannah MSA Valdosta MSA Warner Robins MSA
Metro Statistical Area Albany MSA Athens-Clarke County MSA Atlanta MSA Augusta-Richmond County MSA Brunswick MSA Columbus MSA Dalton MSA Gainesville MSA Hinesville-Fort Stewart MSA Macon MSA Rome MSA Savannah MSA Valdosta MSA Warner Robins MSA
MSA Hours and Earnings
Jan 17.46 20.86 24.43 20.93 14.66 18.39 16.77 21.79 17.33 20.05 18.75 20.23 17.67 17.11
2012 All Employee
AVERAGE HOURLY EARNINGS (AHE)
Feb 17.75 20.34 23.95 21.20 15.18 18.51 16.95 20.95 17.55 19.37 19.04 20.37 17.12 16.67
Mar 17.28 19.84 23.97 21.10 15.08 18.69 17.22 20.59 18.79 19.52 19.02 20.37 17.18 16.72
Apr 17.18 20.54 24.31 21.20 15.21 19.48 16.99 21.64 18.03 19.29 19.59 20.47 17.06 16.52
May 16.71 20.02 23.70 21.15 14.53 19.15 16.77 20.78 16.99 18.89 19.05 20.20 16.87 16.76
Jun 16.54 19.66 23.72 21.64 14.86 19.35 17.38 20.31 17.54 18.70 18.96 20.13 16.80 16.20
Jul 16.45 20.19 24.17 21.68 14.73 19.77 17.31 20.81 17.11 18.81 19.30 20.47 17.02 16.18
Aug 16.30 20.44 23.96 21.55 14.81 19.52 16.88 21.06 16.91 18.82 20.43 20.05 16.73 16.30
Sep 16.60 20.21 24.30 22.47 14.81 19.93 17.13 20.25 17.28 19.22 20.54 20.20 17.10 16.30
Oct 16.46 19.81 24.12 21.64 14.91 19.73 16.95 21.40 17.51 18.87 19.89 20.02 16.59 16.28
Nov 16.12 19.76 24.36 21.77 15.12 19.76 16.86 21.10 18.14 18.87 21.34 20.17 16.67 16.14
Dec Average 16.18 16.75 20.15 20.15 24.84 24.15 22.17 21.54 15.69 14.97 20.17 19.38 17.27 17.04 21.31 21.00 19.00 17.67 18.94 19.11 21.56 19.77 20.12 20.23 16.56 16.94 16.48 16.47
Jan 33.9 31.3 35.1 35.9 29.1 35.2 33.6 37.4 35.0 37.3 36.5 33.6 34.2 34.9
Feb 32.5 32.6 34.9 36.3 29.9 34.8 35.5 36.1 34.8 37.0 33.8 33.2 34.5 35.4
AVERAGE WEEKLY HOURS (AWH)
Mar 32.6 31.9 34.9 36.3 29.7 34.7 34.0 36.3 35.0 37.9 35.8 32.9 33.7 33.5
Apr 32.9 31.7 35.2 36.4 30.6 35.1 35.3 35.4 37.5 37.3 34.2 33.2 34.4 34.0
May 33.1 30.7 34.7 35.8 29.1 35.1 33.3 36.4 39.9 37.5 34.4 33.4 33.9 34.4
Jun 33.3 32.2 34.9 35.4 29.3 35.2 33.9 36.4 39.8 37.5 35.3 33.0 33.7 33.7
Jul 34.9 33.3 35.1 35.7 29.8 35.4 34.5 37.2 43.0 38.0 35.0 33.5 34.8 33.5
Aug 34.7 31.7 34.7 35.6 30.0 34.9 34.4 36.9 41.9 37.7 33.8 33.5 35.2 33.4
Sep 33.1 32.1 35.1 35.9 30.1 35.8 34.5 39.6 41.7 38.7 33.0 34.0 35.7 33.4
Oct 33.5 31.7 34.5 35.9 29.4 34.9 34.4 39.6 40.3 38.0 34.8 33.6 35.7 33.3
Nov 33.0 31.7 34.6 35.6 29.7 34.6 35.5 38.0 40.8 38.7 32.7 33.1 34.9 33.3
Dec 33.3 33.1 35.1 35.7 30.7 35.3 35.4 38.5 39.3 39.2 32.9 33.3 37.2 33.7
Average 33.4 32.0 34.9 35.9 29.8 35.1 34.5 37.3 39.1 37.9 34.3 33.4 34.8 33.9
Jan 591.89 652.92 857.49 751.39 426.61 647.33 563.47 814.95 606.55 747.87 684.38 679.73 604.31 597.14
AVERAGE WEEKLY EARNINGS (AWE) Feb Mar Apr May Jun Jul Aug Sep Oct Nov Dec Average 576.88 563.33 565.22 553.10 550.78 574.11 565.61 549.46 551.41 531.96 538.79 559.45 663.08 632.90 651.12 614.61 633.05 672.33 647.95 648.74 627.98 626.39 666.97 644.80 835.86 836.55 855.71 822.39 827.83 848.37 831.41 852.93 832.14 842.86 871.88 842.84 769.56 765.93 771.68 757.17 766.06 773.98 767.18 806.67 776.88 775.01 791.47 773.29 453.88 447.88 465.43 422.82 435.40 438.95 444.30 445.78 438.35 449.06 481.68 446.11 644.15 648.54 683.75 672.17 681.12 699.86 681.25 713.49 688.58 683.70 712.00 680.24 601.73 585.48 599.75 558.44 589.18 597.20 580.67 590.99 583.08 598.53 611.36 587.88 756.30 747.42 766.06 756.39 739.28 774.13 777.11 801.90 847.44 801.80 820.44 783.30 610.74 657.65 676.13 677.90 698.09 735.73 708.53 720.58 705.65 740.11 746.70 690.90 716.69 739.81 719.52 708.38 701.25 714.78 709.51 743.81 717.06 730.27 742.45 724.27 643.55 680.92 669.98 655.32 669.29 675.50 690.53 677.82 692.17 697.82 709.32 678.11 676.28 670.17 679.60 674.68 664.29 685.75 671.68 686.80 672.67 667.63 670.00 675.68 590.64 578.97 586.86 571.89 566.16 592.30 588.90 610.47 592.26 581.78 616.03 589.51 590.12 560.12 561.68 576.54 545.94 542.03 544.42 544.42 542.12 537.46 555.38 558.33
Source: Georgia Department of Labor, Workforce Statistics & Economic Research
29
Georgia Manufacturing Hours and Earnings
Industry Manufacturing
Durable Goods Non-Durable Goods
Jan 18.05 21.15 15.04
2013
AVERAGE HOURLY EARNINGS (AHE) Feb Mar Apr May Jun Jul Aug Sep Oct Nov Dec Average 18.14 18.05 18.48 18.04 18.21 18.15 17.83 17.92 17.90 17.94 18.26 18.08 21.00 20.96 21.53 20.88 20.88 20.87 20.20 20.36 20.35 20.29 20.63 20.75 15.23 15.13 15.45 15.06 15.42 15.42 15.35 15.42 15.30 15.36 15.77 15.33
Industry Manufacturing
Durable Goods Non-Durable Goods
Jan 40.9 41.4 40.5
AVERAGE WEEKLY HOURS (AWH)
Feb Mar Apr May Jun Jul Aug Sep Oct Nov Dec Average
40.6 40.9 40.9 41.1 41.8 41.9 42.2 42.0 41.4 41.8 42.5
42.0
41.7 41.9 41.7 42.9 43.5 42.9 44.1 43.7 43.4 44.5 44.4
43.7
39.6 40.0 40.2 39.3 40.1 41.0 40.4 40.4 39.4 39.1 40.6
40.4
Industry Manufacturing
Durable Goods Non-Durable Goods
AVERAGE WEEKLY EARNINGS (AWE)
Jan
Feb Mar Apr May Jun Jul Aug Sep Oct Nov Dec Average
738.25 736.48 738.25 755.83 741.44 761.18 760.49 752.43 752.64 741.06 749.89 776.05 752.64
875.61 875.70 878.22 897.80 895.75 908.28 895.32 890.82 889.73 883.19 902.91 915.97 889.73
609.12 603.11 605.20 621.09 591.86 618.34 632.22 620.14 622.97 602.82 600.58 640.26 622.97
Industry Manufacturing
Durable Goods Non-Durable Goods
Industry Manufacturing
Durable Goods Non-Durable Goods
Industry Manufacturing
Durable Goods Non-Durable Goods
Jan 18.14 21.58 14.97
2012
AVERAGE HOURLY EARNINGS (AHE) Feb Mar Apr May Jun Jul Aug Sep Oct Nov Dec Average 18.05 18.07 18.18 18.08 17.98 17.81 17.68 17.57 17.65 17.64 18.01 17.90 21.28 21.24 21.39 21.04 20.82 20.43 20.52 20.29 20.39 20.66 20.94 20.87 14.98 15.02 15.06 15.20 15.09 15.19 14.84 14.84 14.86 14.65 15.06 14.98
Jan 39.5 40.0 39.1
Feb 39.3 39.9 38.7
AVERAGE WEEKLY HOURS (AWH) Mar Apr May Jun 39.7 39.2 40.0 41.1 40.4 39.9 40.8 42.9 39.0 38.5 39.2 39.4
Jul 40.2 41.6 38.9
Aug 40.6 41.7 39.5
Sep 40.5 42.0 39.2
Oct 40.5 42.4 38.7
Nov 40.8 41.9 39.8
Dec 41.0 42.2 39.9
Average 40.8 41.9 39.8
AVERAGE WEEKLY EARNINGS (AWE)
Jan
Feb Mar Apr May Jun Jul Aug Sep Oct Nov Dec Average
716.53 709.37 717.38 712.66 723.20 738.98 715.96 717.81 711.59 714.83 719.71 738.41 719.71
863.20 849.07 858.10 853.46 858.43 893.18 849.89 855.68 852.18 864.54 865.65 883.67 865.65
585.33 579.73 585.78 579.81 595.84 594.55 590.89 586.18 581.73 575.08 583.07 600.89 583.07
Note: These average hours and earnings data are of production employees on manufacturing payrolls
Source: Georgia Department of Labor, Workforce Statistics & Economic Research
30
Georgia Labor Force Estimates
Place of Residence - Persons 16 Years and Older
Area
Employment Status
2013
2012
2011
Change From
2012-2013
2011-2012
Georgia
(Not seasonally adjusted)
Albany MSA
Athens-Clarke County MSA Atlanta MSA
Augusta-Richmond County MSA
Brunswick MSA
Columbus MSA
Dalton MSA
Gainesville MSA Hinesville-Ft. Stewart MSA
Civilian labor force Employed Unemployed Rate
Civilian labor force Employed Unemployed Rate
Civilian labor force Employed Unemployed Rate
Civilian labor force Employed Unemployed Rate
Civilian labor force Employed Unemployed Rate
Civilian labor force Employed Unemployed Rate
Civilian labor force Employed Unemployed Rate
Civilian labor force Employed Unemployed Rate
Civilian labor force Employed Unemployed Rate
Civilian labor force Employed Unemployed Rate
4,767,323
4,772,173
4,748,636
-4,850
23,537
4,378,029
4,342,275
4,279,820
35,754
62,455
389,294
429,898
468,816
-40,604
-38,918
8.2
9.0
9.9
72,941
74,135
74,848
-1,194
-713
66,437
67,108
67,198
-671
-90
6,504
7,027
7,650
-523
-623
8.9
9.5
10.2
113,086
112,575
111,450
511
1,125
106,323
105,046
103,387
1,277
1,659
6,763
7,529
8,063
-766
-534
6.0
6.7
7.2
2,726,160
2,718,030
2,692,586
8,130
25,444
2,510,965
2,477,843
2,429,675
33,122
48,168
215,195
240,187
262,911
-24,992
-22,724
7.9
8.8
9.8
263,375
265,874
266,259
-2,499
-385
242,147
242,968
242,178
-821
790
21,228
22,906
24,081
-1,678
-1,175
8.1
8.6
9.0
50,151
50,806
50,546
-655
260
45,570
45,760
45,136
-190
624
4,581
5,046
5,410
-465
-364
9.1
9.9
10.7
131,110
132,134
131,385
-1,024
749
120,072
120,298
119,172
-226
1,126
11,038
11,836
12,213
-798
-377
8.4
9.0
9.3
58,678
59,799
62,021
-1,121
-2,222
52,577
52,988
54,336
-411
-1,348
6,101
6,811
7,685
-710
-874
10.4
11.4
12.4
91,388
90,421
88,982
967
1,439
85,333
83,687
81,567
1,646
2,120
6,055
6,734
7,415
-679
-681
6.6
7.4
8.3
32,845
33,479
33,824
-634
-345
29,930
30,487
30,727
-557
-240
2,915
2,992
3,097
-77
-105
8.9
8.9
9.2
Note: MSA data are not seasonally adjusted. Employment includes nonagricultural wage and salary employment, self-employment, unpaid family and private
household workers and agricultural workers. Persons in labor disputes are counted as employed. The use of unrounded data does not imply that the numbers are exact.
Albany MSA: Baker, Dougherty, Lee, Terrell, and Worth counties. Athens - Clarke County MSA: Clarke, Madison, Oconee, and Oglethorpe counties. Atlanta MSA: Barrow, Bartow, Butts, Carroll, Cherokee, Clayton, Cobb, Coweta, Dawson, DeKalb, Douglas, Fayette, Forsyth, Fulton, Gwinnett, Haralson, Heard, Henry, Jasper, Lamar, Meriwether, Newton, Paulding, Pickens, Pike, Rockdale, Spalding, and Walton counties. Augusta - Richmond County MSA: Burke, Columbia, McDuffie, and Richmond counties in Georgia and Aiken and Edgefield counties in South Carolina. Brunswick MSA: Brantley, Glynn, and McIntosh counties. Columbus MSA: Chattahoochee, Harris, Marion, and Muscogee counties in Georgia and Russell County in Alabama. Dalton MSA: Murray and Whitfield counties. Gainesville MSA: Hall County. Hinesville - Fort Stewart MSA: Liberty and Long counties. Macon MSA: Bibb, Crawford, Jones, Monroe, and Twiggs counties. Rome MSA: Floyd County. Savannah MSA: Bryan, Chatham, and Effingham counties. Valdosta MSA: Brooks, Echols, Lanier, and Lowndes counties. Warner Robins MSA: Houston County.
Source: Georgia Department of Labor, Workforce Statistics & Economic Research
31
Area Macon MSA Rome MSA Savannah MSA Valdosta MSA Warner Robins MSA
Georgia Labor Force Estimates
Place of Residence - Persons 16 Years and Older
Employment Status
Civilian labor force Employed Unemployed Rate
Civilian labor force Employed Unemployed Rate
Civilian labor force Employed Unemployed Rate
Civilian labor force Employed Unemployed Rate
Civilian labor force Employed Unemployed Rate
2013
2012
2011
Change From
2012-2013
2011-2012
111,914
113,509
113,093
-1,595
416
102,353
102,840
101,622
-487
1,218
9,561
10,669
11,471
-1,108
-802
8.5
9.4
10.1
47,437
48,169
48,129
-732
40
43,244
43,392
42,931
-148
461
4,193
4,777
5,198
-584
-421
8.8
9.9
10.8
181,861
180,823
178,007
1,038
2,816
168,201
165,802
161,977
2,399
3,825
13,660
15,021
16,030
-1,361
-1,009
7.5
8.3
9.0
66,288
67,207
66,564
-919
643
61,069
61,443
60,408
-374
1,035
5,219
5,764
6,156
-545
-392
7.9
8.6
9.2
70,038
71,228
71,157
-1,190
71
65,034
65,857
65,578
-823
279
5,004
5,371
5,579
-367
-208
7.1
7.5
7.8
Area
United States
(Not Seasonally adjusted)
United States Labor Force Estimates Place of Residence - Persons 16 Years and Older
Employment Status
2013
2012
2011
Change From
2012-2013
2011-2012
Civilian labor force Employed Unemployed
Rate
155,389,000 143,929,000
11,460,000 7.4
154,975,000 142,469,000
12,506,000 8.1
153,617,000
414,000
1,358,000
139,869,000
1,460,000
2,600,000
13,747,000
-1,046,000
-1,241,000
8.9
Note: MSA data are not seasonally adjusted. Employment includes nonagricultural wage and salary employment, self-employment, unpaid family and private
household workers and agricultural workers. Persons in labor disputes are counted as employed. The use of unrounded data does not imply that the numbers are exact. Georgia and Metropolitan Statistical Area data have not been seasonally adjusted.
Albany MSA: Baker, Dougherty, Lee, Terrell, and Worth counties. Athens - Clarke County MSA: Clarke, Madison, Oconee, and Oglethorpe counties. Atlanta MSA: Barrow, Bartow, Butts, Carroll, Cherokee, Clayton, Cobb, Coweta, Dawson, DeKalb, Douglas, Fayette, Forsyth, Fulton, Gwinnett, Haralson, Heard, Henry, Jasper, Lamar, Meriwether, Newton, Paulding, Pickens, Pike, Rockdale, Spalding, and Walton counties. Augusta - Richmond County MSA: Burke, Columbia, McDuffie, and Richmond counties in Georgia and Aiken and Edgefield counties in South Carolina. Brunswick MSA: Brantley, Glynn, and McIntosh counties. Columbus MSA: Chattahoochee, Harris, Marion, and Muscogee counties in Georgia and Russell County in Alabama. Dalton MSA: Murray and Whitfield counties. Gainesville MSA: Hall County. Hinesville - Fort Stewart MSA: Liberty and Long counties. Macon MSA: Bibb, Crawford, Jones, Monroe, and Twiggs counties. Rome MSA: Floyd County. Savannah MSA: Bryan, Chatham, and Effingham counties. Valdosta MSA: Brooks, Echols, Lanier, and Lowndes counties. Warner Robins MSA: Houston County.
Source: Georgia Department of Labor, Workforce Statistics & Economic Research
32
*Albany *Alpharetta *Athens *Atlanta DeKalb part Fulton part *Augusta *Columbus Dalton Douglasville Duluth Dunwoody East Point Gainesville Hinesville *Johns Creek Kennesaw LaGrange Lawrenceville *Macon *Marietta Milton Newnan Peachtree City Rome *Roswell *Sandy Springs *Savannah *Smyrna Statesboro Stockbridge *Valdosta *Warner Robins Woodstock
City Labor Force Estimates (not Seasonally Adjusted) Place of Residence - Persons 16 Years and Older
2013 Annual Averages
Labor Force
Employment
Unemployment Number Rate
33,401 32,450 69,268 195,499 14,196 181,302 87,923 84,909 12,870 14,948 16,824 25,274 15,954 15,664 14,922 38,031 16,898 15,424 14,407 39,367 31,601 16,029 15,035 16,614 16,723 50,526 57,865 65,730 29,641 12,848 13,093 27,240 33,217 13,656
29,988 3,413 10.2
30,584 1,866 5.8
64,858 4,410 6.4
175,847 19,652 10.1
13,065 1,131 8.0
162,781 18,521 10.2
79,662 8,261 9.4
77,358 7,551 8.9
11,388 1,482 11.5
13,518 1,430 9.6
15,589 1,235 7.3
23,747 1,527 6.0
14,029 1,925 12.1
14,433 1,231 7.9
13,641 1,281 8.6
35,573 2,458 6.5
15,481 1,417 8.4
13,948 1,476 9.6
12,958 1,449 10.1
35,283 4,084 10.4
29,051 2,550 8.1
15,056
973 6.1
13,743 1,292 8.6
15,536 1,078 6.5
15,037 1,686 10.1
47,543 2,983 5.9
54,307 3,558 6.1
59,902 5,828 8.9
27,431 2,210 7.5
11,414 1,434 11.2
11,754 1,339 10.2
24,981 2,259 8.3
30,641 2,576 7.8
12,609 1,047 7.7
2012 Annual Averages
Labor Force
Employment
Unemployment Number Rate
33,995 30,291 3,704 10.9
32,258 30,181 2,077 6.4
68,896 64,079 4,817 7.0
195,440 173,527 21,913 11.2
14,156 12,893 1,263 8.9
181,283 160,634 20,649 11.4
88,945 79,900 9,045 10.2
85,295 77,451 7,844 9.2
13,034 11,477 1,557 11.9
14,862 13,339 1,523 10.2
16,656 15,384 1,272 7.6
24,951 23,434 1,517 6.1
16,001 13,844 2,157 13.5
15,437 14,155 1,282 8.3
15,199 13,895 1,304 8.6
37,876 35,104 2,772 7.3
16,869 15,277 1,592 9.4
14,794 13,205 1,589 10.7
14,421 12,787 1,634 11.3
39,998 35,451 4,547 11.4
31,581 28,668 2,913 9.2
-
-
-
-
14,959 13,562 1,397 9.3
16,541 15,331 1,210 7.3
17,045 15,088 1,957 11.5
50,235 46,916 3,319 6.6
57,471 53,591 3,880 6.8
65,465 59,048 6,417 9.8
29,664 27,069 2,595 8.7
12,584 11,042 1,542 12.3
13,054 11,599 1,455 11.1
27,559 25,134 2,425 8.8
33,786 31,029 2,757 8.2
13,626 12,443 1,183 8.7
2011 Annual Averages
Labor Force
Employment
Unemployment Number Rate
34,343 31,023 67,544
30,384 28,794 62,524
3,959 11.5 2,229 7.2 5,020 7.4
191,838 14,006 177,832
168,348 12,590 155,758
23,490 12.2 1,416 10.1
22,074 12.4
89,290 85,057 13,559
79,947 77,013 11,734
9,343 10.5 8,044 9.5 1,825 13.5
15,020 16,358 24,728
13,238 14,948 23,121
1,782 11.9 1,410 8.6 1,607 6.5
15,855 15,201 15,482
13,473 13,828 14,126
2,382 15.0 1,373 9.0 1,356 8.8
36,525 16,714 14,274
33,625 14,818 12,594
2,900 7.9 1,896 11.3 1,680 11.8
14,450 40,334 31,138
12,628 35,277 28,047
1,822 12.6 5,057 12.5 3,091 9.9
14,781 16,511
13,321 15,303
-
-
1,460 9.9
1,208 7.3
17,185 49,086 56,207
14,968 45,450 51,977
2,217 12.9 3,636 7.4 4,230 7.5
64,537 29,509 12,454
57,669 26,604 10,818
6,868 10.6 2,905 9.8 1,636 13.1
13,042 26,909 33,241
11,454 24,381 30,375
1,588 12.2 2,528 9.4 2,866 8.6
13,512 12,131 1,381 10.2
: Note City estimates were prepared in cooperation with the U.S. Department of Labor, Bureau of Labor Statistics.
All cities listed have total population of 25,000 or more and an asterisks (*) designates cities with population of 50,000 or more. Source: Georgia Department of Labor, Workforce Statistics & Economic Research
33
County Labor Force Estimates (not Seasonally Adjusted) Place of Residence - Persons 16 Years and Older
2013 Annual Averages
Labor Force
Employment
Unemployment Number Rate
2012 Annual Averages
Labor Force
Employment
Unemployment Number Rate
2011 Annual Averages
Labor Force
Employment
Unemployment Number Rate
Georgia
4,767,323 4,378,029 389,294 8.2
4,772,173 4,342,275 429,898 9.0
4,748,636 4,279,820 468,816 9.9
Appling
9,298
8,366
932 10.0
9,567
8,587
980 10.2
9,538
8,486 1,052 11.0
Atkinson
2,983
2,655
328 11.0
2,925
2,534
391 13.4
3,021
2,599
422 14.0
Bacon
4,745
4,352
393 8.3
4,490
4,053
437 9.7
4,520
4,061
459 10.2
Baker
1,464
1,350
114 7.8
1,489
1,364
125 8.4
1,376
1,250
126 9.2
Baldwin
17,376 15,433 1,943 11.2
17,905 15,724 2,181 12.2
18,086 15,627 2,459 13.6
Banks
9,591
8,989
602 6.3
10,274
9,604
670 6.5
10,176
9,440
736 7.2
Barrow
34,153 31,630 2,523 7.4
34,084 31,212 2,872 8.4
34,187 30,956 3,231 9.5
Bartow
48,041 44,115 3,926 8.2
47,978 43,533 4,445 9.3
48,223 43,230 4,993 10.4
Ben Hill
6,392
5,680
712 11.1
6,602
5,755
847 12.8
6,805
5,855
950 14.0
Berrien
7,519
6,812
707 9.4
7,876
7,093
783 9.9
7,904
6,960
944 11.9
Bibb
73,430 66,954 6,476 8.8
74,477 67,273 7,204 9.7
74,222 66,416 7,806 10.5
Bleckley
4,559
3,877
682 15.0
4,973
4,321
652 13.1
5,226
4,501
725 13.9
Brantley
7,625
6,897
728 9.5
7,781
6,925
856 11.0
7,670
6,784
886 11.6
Brooks
6,888
6,353
535 7.8
6,991
6,392
599 8.6
7,266
6,576
690 9.5
Bryan
16,442 15,277 1,165 7.1
16,293 15,059 1,234 7.6
15,893 14,585 1,308 8.2
Bulloch
33,006 29,980 3,026 9.2
32,227 29,002 3,225 10.0
32,338 28,876 3,462 10.7
Burke
9,581
8,508 1,073 11.2
9,647
8,534 1,113 11.5
9,854
8,737 1,117 11.3
Butts
9,852
8,891
961 9.8
9,827
8,774 1,053 10.7
9,917
8,726 1,191 12.0
Calhoun
1,978
1,758
220 11.1
2,143
1,920
223 10.4
2,249
2,002
247 11.0
Camden
20,684 18,935 1,749 8.5
20,903 19,021 1,882 9.0
20,398 18,405 1,993 9.8
Candler
4,513
4,068
445 9.9
4,482
4,032
450 10.0
4,387
3,917
470 10.7
Carroll
52,126 47,119 5,007 9.6
51,514 46,498 5,016 9.7
51,681 46,111 5,570 10.8
Catoosa
34,108 32,029 2,079 6.1
34,406 32,145 2,261 6.6
34,334 31,656 2,678 7.8
Charlton
4,495
4,034
461 10.3
4,457
3,964
493 11.1
4,486
3,941
545 12.1
Chatham
137,793 127,152 10,641 7.7
137,022 125,339 11,683 8.5
134,853 122,431 12,422 9.2
Chattahoochee 2,300
1,917
383 16.7
2,330
1,919
411 17.6
2,145
1,758
387 18.0
Chattooga
10,454
9,451 1,003 9.6
10,449
9,348 1,101 10.5
10,438
9,282 1,156 11.1
Cherokee
114,225 106,815 7,410 6.5
113,630 105,406 8,224 7.2
112,747 103,489 9,258 8.2
Clarke
69,268 64,858 4,410 6.4
68,896 64,079 4,817 7.0
67,544 62,524 5,020 7.4
Clay
1,281
1,173
108 8.4
1,345
1,228
117 8.7
1,400
1,278
122 8.7
Clayton
129,868 117,017 12,851 9.9
129,901 115,473 14,428 11.1
128,948 113,062 15,886 12.3
Clinch
2,572
2,308
264 10.3
2,682
2,404
278 10.4
2,699
2,393
306 11.3
Cobb
375,117 348,392 26,725 7.1
374,276 343,796 30,480 8.1
370,955 337,441 33,514 9.0
Coffee
15,587 13,800 1,787 11.5
15,156 13,174 1,982 13.1
15,430 13,209 2,221 14.4
Colquitt
19,228 17,431 1,797 9.3
19,589 17,781 1,808 9.2
19,971 18,026 1,945 9.7
Columbia
67,524 63,241 4,283 6.3
67,965 63,430 4,535 6.7
66,839 62,192 4,647 7.0
Cook
6,386
5,748
638 10.0
6,477
5,781
696 10.7
6,585
5,758
827 12.6
Coweta
63,572 58,850 4,722 7.4
63,359 58,074 5,285 8.3
62,906 57,234 5,672 9.0
Crawford
6,093
5,575
518 8.5
6,176
5,602
574 9.3
6,125
5,517
608 9.9
Crisp
9,725
8,605 1,120 11.5
9,165
8,040 1,125 12.3
9,230
7,995 1,235 13.4
Dade
7,985
7,422
563 7.1
8,052
7,448
604 7.5
8,097
7,430
667 8.2
Dawson
11,157 10,409
748 6.7
11,131 10,272
859 7.7
11,257 10,242 1,015 9.0
Decatur
10,610
9,482 1,128 10.6
11,000
9,773 1,227 11.2
10,915
9,506 1,409 12.9
DeKalb
365,841 335,473 30,368 8.3
364,948 331,048 33,900 9.3
363,358 326,181 37,177 10.2
Dodge
8,338
7,380
958 11.5
8,676
7,706
970 11.2
8,892
7,845 1,047 11.8
Dooly
4,287
3,727
560 13.1
4,597
4,018
579 12.6
4,561
3,920
641 14.1
Dougherty
41,870 37,762 4,108 9.8
42,601 38,143 4,458 10.5
43,059 38,252 4,807 11.2
Douglas
67,640 62,045 5,595 8.3
67,472 61,227 6,245 9.3
67,711 60,667 7,044 10.4
Early
5,272
4,885
387 7.3
5,361
4,922
439 8.2
5,306
4,815
491 9.3
Echols
1,892
1,780
112 5.9
1,926
1,791
135 7.0
1,996
1,849
147 7.4
34
Source: Georgia Department of Labor, Workforce Statistics & Economic Research
County Labor Force Estimates (not Seasonally Adjusted) Place of Residence - Persons 16 Years and Older
2013 Annual Averages
Labor Force
Employment
Unemployment Number Rate
2012 Annual Averages
Labor Force
Employment
Unemployment Number Rate
2011 Annual Averages
Labor Force
Employment
Unemployment Number Rate
Effingham
27,626 25,772 1,854 6.7
27,510 25,405 2,105 7.7
27,260 24,960 2,300 8.4
Elbert
8,848
7,930
918 10.4
9,080
8,030 1,050 11.6
9,403
8,039 1,364 14.5
Emanuel
9,909
8,782 1,127 11.4
10,084
8,979 1,105 11.0
10,204
9,024 1,180 11.6
Evans
4,776
4,404
372 7.8
4,876
4,469
407 8.3
4,907
4,474
433 8.8
Fannin
10,304
9,442
862 8.4
10,457
9,470
987 9.4
10,733
9,620 1,113 10.4
Fayette
52,424 48,664 3,760 7.2
52,211 48,022 4,189 8.0
52,251 47,919 4,332 8.3
Floyd
47,437 43,244 4,193 8.8
48,169 43,392 4,777 9.9
48,129 42,931 5,198 10.8
Forsyth
95,695 89,918 5,777 6.0
95,187 88,732 6,455 6.8
92,267 85,465 6,802 7.4
Franklin
9,741
8,819
922 9.5
9,994
8,950 1,044 10.4
10,221
9,091 1,130 11.1
Fulton
467,937 427,811 40,126 8.6
466,939 422,168 44,771 9.6
456,246 408,129 48,117 10.5
Gilmer
12,219 11,153 1,066 8.7
12,364 11,119 1,245 10.1
12,726 11,329 1,397 11.0
Glascock
1,128
1,001
127 11.3
1,154
1,025
129 11.2
1,163
1,025
138 11.9
Glynn
36,991 33,695 3,296 8.9
37,429 33,836 3,593 9.6
37,189 33,279 3,910 10.5
Gordon
25,640 23,300 2,340 9.1
25,769 23,207 2,562 9.9
25,492 22,542 2,950 11.6
Grady
11,496 10,704
792 6.9
11,768 10,877
891 7.6
11,837 10,851
986 8.3
Greene
7,237
6,610
627 8.7
7,198
6,509
689 9.6
7,204
6,455
749 10.4
Gwinnett
440,243 409,200 31,043 7.1
438,242 403,803 34,439 7.9
430,780 393,791 36,989 8.6
Habersham
20,704 19,152 1,552 7.5
19,503 17,787 1,716 8.8
19,531 17,663 1,868 9.6
Hall
91,388 85,333 6,055 6.6
90,421 83,687 6,734 7.4
88,982 81,567 7,415 8.3
Hancock
2,653
2,228
425 16.0
2,761
2,270
491 17.8
3,064
2,460
604 19.7
Haralson
12,401 11,318 1,083 8.7
12,353 11,168 1,185 9.6
12,538 11,210 1,328 10.6
Harris
16,663 15,586 1,077 6.5
16,760 15,605 1,155 6.9
16,923 15,721 1,202 7.1
Hart
9,761
8,777
984 10.1
10,006
8,908 1,098 11.0
10,370
9,166 1,204 11.6
Heard
4,926
4,437
489 9.9
4,882
4,378
504 10.3
4,952
4,400
552 11.1
Henry
105,695 97,167 8,528 8.1
105,410 95,885 9,525 9.0
105,032 94,673 10,359 9.9
Houston
70,038 65,034 5,004 7.1
71,228 65,857 5,371 7.5
71,157 65,578 5,579 7.8
Irwin
3,424
3,043
381 11.1
3,496
3,083
413 11.8
3,614
3,139
475 13.1
Jackson
27,799 25,728 2,071 7.4
27,665 25,302 2,363 8.5
27,367 24,689 2,678 9.8
Jasper
6,212
5,703
509 8.2
6,236
5,628
608 9.7
6,401
5,708
693 10.8
Jeff Davis
5,279
4,637
642 12.2
5,245
4,526
719 13.7
5,459
4,671
788 14.4
Jefferson
6,619
5,649
970 14.7
6,781
5,861
920 13.6
6,876
5,963
913 13.3
Jenkins
2,526
2,116
410 16.2
2,586
2,134
452 17.5
2,498
2,055
443 17.7
Johnson
3,501
3,055
446 12.7
3,492
3,037
455 13.0
3,587
3,125
462 12.9
Jones
14,400 13,369 1,031 7.2
14,679 13,433 1,246 8.5
14,532 13,236 1,296 8.9
Lamar
8,337
7,474
863 10.4
8,247
7,375
872 10.6
8,407
7,398 1,009 12.0
Lanier
4,607
4,275
332 7.2
4,651
4,301
350 7.5
4,690
4,291
399 8.5
Laurens
20,163 18,052 2,111 10.5
20,306 17,944 2,362 11.6
21,012 18,282 2,730 13.0
Lee
15,360 14,292 1,068 7.0
15,577 14,436 1,141 7.3
15,569 14,347 1,222 7.8
Liberty
24,950 22,577 2,373 9.5
25,435 22,998 2,437 9.6
26,041 23,505 2,536 9.7
Lincoln
3,577
3,230
347 9.7
3,708
3,339
369 10.0
3,741
3,338
403 10.8
Long
7,894
7,352
542 6.9
8,044
7,489
555 6.9
7,783
7,222
561 7.2
Lowndes
52,902 48,662 4,240 8.0
53,640 48,960 4,680 8.7
52,612 47,691 4,921 9.4
Lumpkin
13,031 11,916 1,115 8.6
12,992 11,760 1,232 9.5
12,785 11,419 1,366 10.7
McDuffie
10,007
9,073
934 9.3
10,111
9,100 1,011 10.0
10,314
9,171 1,143 11.1
McIntosh
5,535
4,978
557 10.1
5,596
4,999
597 10.7
5,688
5,074
614 10.8
Macon
4,793
4,114
679 14.2
4,925
4,215
710 14.4
5,035
4,296
739 14.7
Madison
16,027 15,101
926 5.8
16,007 14,919 1,088 6.8
16,165 14,918 1,247 7.7
Marion
3,797
3,528
269 7.1
3,841
3,532
309 8.0
3,953
3,605
348 8.8
Meriwether
8,831
7,861
970 11.0
8,762
7,758 1,004 11.5
9,040
7,846 1,194 13.2
Miller
3,446
3,254
192 5.6
3,423
3,212
211 6.2
3,478
3,238
240 6.9
Mitchell
9,422
8,599
823 8.7
9,874
8,998
876 8.9
9,855
8,896
959 9.7
Monroe
14,143 13,028 1,115 7.9
14,239 13,090 1,149 8.1
14,170 12,920 1,250 8.8
Montgomery
4,703
4,237
466 9.9
4,567
4,116
451 9.9
4,621
4,102
519 11.2
Morgan
9,044
8,389
655 7.2
9,150
8,415
735 8.0
9,172
8,346
826 9.0
Murray
16,582 14,808 1,774 10.7
16,984 14,924 2,060 12.1
17,682 15,369 2,313 13.1
Source: Georgia Department of Labor, Workforce Statistics & Economic Research
35
County Labor Force Estimates (not Seasonally Adjusted) Place of Residence - Persons 16 Years and Older
2013 Annual Averages
Labor Force
Employment
Unemployment Number Rate
2012 Annual Averages
Labor Force
Employment
Unemployment Number Rate
2011 Annual Averages
Labor Force
Employment
Unemployment Number Rate
Muscogee
84,909 77,358 7,551 8.9
85,295 77,451 7,844 9.2
85,057 77,013 8,044 9.5
Newton
47,766 43,376 4,390 9.2
47,751 42,803 4,948 10.4
47,933 42,317 5,616 11.7
Oconee
19,577 18,632
945 4.8
19,480 18,408 1,072 5.5
19,438 18,270 1,168 6.0
Oglethorpe
8,214
7,732
482 5.9
8,190
7,639
551 6.7
8,303
7,675
628 7.6
Paulding
72,196 66,857 5,339 7.4
72,076 65,975 6,101 8.5
71,984 65,102 6,882 9.6
Peach
12,211 10,903 1,308 10.7
12,391 11,039 1,352 10.9
12,403 10,963 1,440 11.6
Pickens
14,120 13,056 1,064 7.5
14,061 12,884 1,177 8.4
14,304 12,890 1,414 9.9
Pierce
8,548
7,853
695 8.1
8,395
7,632
763 9.1
8,608
7,780
828 9.6
Pike
8,154
7,469
685 8.4
8,117
7,370
747 9.2
8,122
7,312
810 10.0
Polk
20,341 18,727 1,614 7.9
20,412 18,604 1,808 8.9
20,410 18,352 2,058 10.1
Pulaski
4,207
3,802
405 9.6
4,401
3,989
412 9.4
4,419
3,981
438 9.9
Putnam
8,685
7,846
839 9.7
8,788
7,862
926 10.5
9,316
8,235 1,081 11.6
Quitman
809
726
83 10.3
845
752
93 11.0
926
809
117 12.6
Rabun
6,407
5,727
680 10.6
6,432
5,658
774 12.0
6,565
5,731
834 12.7
Randolph
2,603
2,312
291 11.2
2,767
2,421
346 12.5
2,830
2,468
362 12.8
Richmond
87,923 79,662 8,261 9.4
88,945 79,900 9,045 10.2
89,290 79,947 9,343 10.5
Rockdale
41,090 37,412 3,678 9.0
41,109 36,919 4,190 10.2
41,265 36,726 4,539 11.0
Schley
1,904
1,714
190 10.0
1,982
1,752
230 11.6
1,945
1,725
220 11.3
Screven
6,853
6,130
723 10.6
6,993
6,213
780 11.2
7,063
6,174
889 12.6
Seminole
3,687
3,377
310 8.4
3,746
3,404
342 9.1
3,784
3,389
395 10.4
Spalding
28,326 25,289 3,037 10.7
28,158 24,955 3,203 11.4
28,542 24,907 3,635 12.7
Stephens
13,040 12,007 1,033 7.9
13,140 11,957 1,183 9.0
13,166 11,833 1,333 10.1
Stewart
2,222
1,977
245 11.0
2,203
1,956
247 11.2
2,222
1,968
254 11.4
Sumter
12,568 11,019 1,549 12.3
12,883 11,262 1,621 12.6
13,075 11,349 1,726 13.2
Talbot
3,092
2,828
264 8.5
3,158
2,878
280 8.9
3,148
2,857
291 9.2
Taliaferro
697
634
63 9.0
701
625
76 10.8
723
631
92 12.7
Tattnall
9,332
8,436
896 9.6
9,425
8,505
920 9.8
9,556
8,606
950 9.9
Taylor
3,553
3,173
380 10.7
3,392
2,978
414 12.2
3,458
3,010
448 13.0
Telfair
4,286
3,619
667 15.6
4,463
3,786
677 15.2
4,477
3,747
730 16.3
Terrell
3,904
3,541
363 9.3
3,961
3,577
384 9.7
4,139
3,684
455 11.0
Thomas
21,244 19,707 1,537 7.2
21,643 19,940 1,703 7.9
21,690 19,875 1,815 8.4
Tift
18,717 17,095 1,622 8.7
18,703 16,823 1,880 10.1
18,692 16,494 2,198 11.8
Toombs
14,146 12,737 1,409 10.0
13,794 12,371 1,423 10.3
13,751 12,174 1,577 11.5
Towns
5,464
5,054
410 7.5
5,865
5,392
473 8.1
5,731
5,213
518 9.0
Treutlen
2,728
2,372
356 13.0
2,802
2,412
390 13.9
2,901
2,513
388 13.4
Troup
35,738 32,584 3,154 8.8
34,283 30,848 3,435 10.0
33,360 29,687 3,673 11.0
Turner
4,324
3,980
344 8.0
4,361
3,960
401 9.2
4,444
3,945
499 11.2
Twiggs
3,848
3,426
422 11.0
3,940
3,443
497 12.6
4,045
3,534
511 12.6
Union
10,745 10,037
708 6.6
10,925 10,115
810 7.4
10,810
9,897
913 8.4
Upson
11,654 10,465 1,189 10.2
11,560 10,308 1,252 10.8
11,652 10,312 1,340 11.5
Walker
32,192 29,908 2,284 7.1
32,507 30,016 2,491 7.7
33,032 30,126 2,906 8.8
Walton
40,219 37,198 3,021 7.5
40,171 36,708 3,463 8.6
40,633 36,543 4,090 10.1
Ware
14,543 13,038 1,505 10.3
14,259 12,671 1,588 11.1
14,915 13,203 1,712 11.5
Warren
2,632
2,302
330 12.5
2,541
2,153
388 15.3
2,546
2,123
423 16.6
Washington
7,332
6,538
794 10.8
7,637
6,785
852 11.2
7,784
6,753 1,031 13.2
Wayne
11,893 10,629 1,264 10.6
11,963 10,604 1,359 11.4
12,003 10,500 1,503 12.5
Webster
1,193
1,100
93 7.8
1,239
1,139
100 8.1
1,248
1,131
117 9.4
Wheeler
2,900
2,626
274 9.4
2,919
2,625
294 10.1
2,959
2,643
316 10.7
White
13,123 12,106 1,017 7.7
12,897 11,757 1,140 8.8
12,542 11,295 1,247 9.9
Whitfield
42,096 37,769 4,327 10.3
42,816 38,065 4,751 11.1
44,340 38,968 5,372 12.1
Wilcox
3,016
2,656
360 11.9
2,996
2,628
368 12.3
3,097
2,694
403 13.0
Wilkes
4,178
3,753
425 10.2
4,327
3,865
462 10.7
4,414
3,885
529 12.0
Wilkinson
4,315
3,926
389 9.0
4,365
3,949
416 9.5
4,451
3,987
464 10.4
Worth
10,346
9,493
853 8.2
10,507
9,589
918 8.7
10,707
9,666 1,041 9.7
36
Source: Georgia Department of Labor, Workforce Statistics & Economic Research
Mark Butler, Commissioner 148 Andrew Young International Boulevard, N.E. Atlanta, Georgia 30303-1751 Return Service Requested
37