- Collection:
- Georgia Government Publications
- Title:
- Dimensions: measuring Georgia's workforce, Vol. 38, no. 1 (Jan. 2012)
- Creator:
- Georgia. Department of Labor
- Contributor to Resource:
- Georgia. Workforce Information and Analysis
- Publisher:
- Atlanta, Ga. : Georgia Dept. of Labor, 2012-01
- Date of Original:
- 2012-01
- Subject:
- Labor market--Georgia--Statistics
Wages--Georgia--Statistics
Hours of labor--Georgia--Statistics - Location:
- United States, Georgia, 32.75042, -83.50018
- Medium:
- state government records
- Type:
- Text
- Format:
- application/pdf
- External Identifiers:
- Call Number GA L200.E46 P1 T7 38/1
- Metadata URL:
- https://dlg.galileo.usg.edu/id:dlg_ggpd_i-ga-bl200-pe46-bp1-bt7-b38-s1-belec-p-btext
- Digital Object URL:
- https://dlg.galileo.usg.edu/do:dlg_ggpd_i-ga-bl200-pe46-bp1-bt7-b38-s1-belec-p-btext
- Language:
- eng
- Holding Institution:
- University of Georgia. Map and Government Information Library
- Rights:
-

January 2012 Data
January 2012 Employment Situation
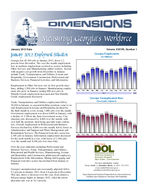
Georgia lost 45,300 jobs in January 2012, down 1.2 percent from December. The over the month employment loss in nonfarm employment occurred as sectors including Other Services and Manufacturing added workers. Sectors with negative job growth from December to January include Trade, Transportation, and Utilities, Leisure and Hospitality, Government, Construction, Professional and Business Services, Financial Activities, and Information.
Employment in Other Services saw its first growth since June, adding 1,500 jobs in January. Manufacturing employment also grew in January, netting 600 new jobs as Durable Goods employment increased and Non-Durable Goods employment decreased.
Trade, Transportation, and Utilities employment fell by 20,100 in January, as seasonal holiday positions came to an end. Employment in Leisure and Hospitality declined for the third month in a row, losing 7,400 jobs over the month. Government employment was down 6,600 in January, with a decline of 3,700 in the State Government sector. Construction jobs decreased by 4,400 over the month, with over half the positions shed being specialty trade contractors. Overall, employment in Professional and Business Services declined by 4,000 over the month, led by losses in Administrative and Support and Waste Management and Remediation Services. The Financial Activities sector lost 2,100 jobs in January. Information employment decreased for the sixth month in a row, with losses of 1,500 jobs over the month and 4,100 jobs lost since July.
Over the year, industries including Professional and Business Services, Trade, Transportation, and Utilities, Educational and Health Services, Manufacturing, Leisure and Hospitality, and Construction added payroll employees. Employment in the Information, Mining and Logging, and Financial Activities sectors has declined from January to January.
Georgia's unemployment rate (seasonally adjusted) fell to 9.2 percent in January 2012, from 9.4 percent in December. This also shows a decrease over the year, from almost a full percentage higher in January 2011, when the unemployment rate was at 10.1 percent.
Volume XXXVIII, Number 1
Georgia Employment
(In Millions)
3.839
3.859
3.904
3.911
3.888
3.863
3.890
3.878
3.904
3.922
3.916
3.870
3.787
Jan Feb Mar Apr May Jun Jul Aug Sep Oct Nov Dec Jan
2011
2012
Georgia Unemployment Rate
(Seasonally Adjusted)
10.1% 9.9%
9.8%
9.8%
9.8%
10.0%
9.9%
9.9%
9.8%
9.7%
9.5% 9.4%
9.2%
Jan Feb Mar Apr May Jun Jul Aug Sep Oct Nov Dec Jan
2011
2012
Workforce Statistics & Economic Research Mark Butler, Commissioner
For more information, contact Corey Smith or Jonathan Roche at (404) 232-3875
corey.smith@dol.state.ga.us jonathan.roche@dol.state.ga.us
Equal Opportunity Employer/ProgramAuxiliary Aids and Services Available upon Request to Individuals with Disabilities
GEORGIA Nonagricultural Employment (000s)
Change in Jobs
Change in Jobs
Preliminary Revised
Revised
JAN 2012 DEC 2011 JAN 2011
from DEC 2011 Net %
from JAN 2011 Net %
Total Nonfarm
3,870.3
3,915.6
3,786.6
-45.3 -1.2
83.7 2.2
Total Private
3,201.3
3,240.0
3,118.4
-38.7 -1.2
82.9 2.7
Goods Producing
499.5
503.3
491.2
-3.8 -0.8
8.3 1.7
Service-Providing
3,370.8
3,412.3
3,295.4
-41.5 -1.2
75.4 2.3
Private Service-Providing
2,701.8
2,736.7
2,627.2
-34.9 -1.3
74.6 2.8
Mining and Logging
8.7
8.7
9.0
0.0 0.0
-0.3 -3.3
Construction
139.2
143.6
137.9
-4.4 -3.1
1.3 0.9
Construction of Buildings
31.5
32.8
29.9
-1.3 -4.0
1.6 5.4
Heavy and Civil Engineering Construction
19.9
20.6
20.5
-0.7 -3.4
-0.6 -2.9
Specialty Trade Contractors
87.8
90.2
87.5
-2.4 -2.7
0.3 0.3
Manufacturing
351.6
351.0
344.3
0.6 0.2
7.3 2.1
Durable Goods
164.4
162.9
156.3
1.5 0.9
8.1 5.2
Computer, Electrical Equip and Appliance Mfg
22.0
21.8
21.5
0.2 0.9
0.5 2.3
Transportation Equipment Manufacturing
42.6
42.6
38.6
0.0 0.0
4.0 10.4
Non-Durable Goods
187.2
188.1
188.0
-0.9 -0.5
-0.8 -0.4
Food Manufacturing
61.5
62.4
62.0
-0.9 -1.4
-0.5 -0.8
Textile Mills
19.0
18.9
18.9
0.1 0.5
0.1 0.5
Textile Product Mills
28.4
28.5
28.2
-0.1 -0.4
0.2 0.7
Trade, Transportation, and Utilities
823.8
843.9
805.0
-20.1 -2.4
18.8 2.3
Wholesale Trade
196.6
197.3
194.2
-0.7 -0.4
2.4 1.2
Merchant Wholesalers, Durable Goods
96.7
96.9
95.0
-0.2 -0.2
1.7 1.8
Merchant Wholesalers, Nondurable Goods
57.2
58.2
57.8
-1.0 -1.7
-0.6 -1.0
Wholesale Electronic Markets and Agents and Brokers 42.7
42.2
41.4
0.5 1.2
1.3 3.1
Retail Trade
446.4
460.7
431.3
-14.3 -3.1
15.1 3.5
Food and Beverage Stores
81.6
82.8
79.2
-1.2 -1.5
2.4 3.0
General Merchandise Stores
105.9
110.9
100.9
-5.0 -4.5
5.0 5.0
Miscellaneous Store Retailers
20.2
20.8
19.5
-0.6 -2.9
0.7 3.6
Transportation, Warehousing, and Utilities
180.8
185.9
179.5
-5.1 -2.7
1.3 0.7
Utilities
20.1
20.2
20.3
-0.1 -0.5
-0.2 -1.0
Transportation and Warehousing
160.7
165.7
159.2
-5.0 -3.0
1.5 0.9
Air Transportation
40.0
40.4
39.9
-0.4 -1.0
0.1 0.3
Truck Transportation
42.4
44.0
42.0
-1.6 -3.6
0.4 1.0
Couriers and Messengers
18.4
21.2
18.3
-2.8 -13.2
0.1 0.6
Warehousing and Storage
27.2
27.9
26.2
-0.7 -2.5
1.0 3.8
Information
93.9
95.4
97.4
-1.5 -1.6
-3.5 -3.6
Telecommunications
45.3
45.2
46.1
0.1 0.2
-0.8 -1.7
Wired Telecommunications Carriers
28.3
28.0
28.9
0.3 1.1
-0.6 -2.1
Wireless Telecommunications Carriers
11.1
11.1
11.0
0.0 0.0
0.1 0.9
Internet Service Providers, Search Portals, and DP
5.9
6.2
6.0
-0.3 -4.8
-0.1 -1.7
Financial Activities
206.9
209.0
207.1
-2.1 -1.0
-0.2 -0.1
Finance and Insurance
153.7
155.7
152.3
-2.0 -1.3
1.4 0.9
Insurance Carriers and Related Activities
65.4
65.8
63.8
-0.4 -0.6
1.6 2.5
Real Estate and Rental and Leasing
53.2
53.3
54.8
-0.1 -0.2
-1.6 -2.9
Professional and Business Services
555.7
559.7
518.7
-4.0 -0.7
37.0 7.1
Professional, Scientific, and Technical Services
238.0
233.4
219.6
4.6 2.0
18.4 8.4
Accounting, Tax Prep, and Bookkeeping Services
40.6
37.4
38.0
3.2 8.6
2.6 6.8
Architectural, Engineering, and Related Services
37.9
38.0
35.0
-0.1 -0.3
2.9 8.3
Computer Systems Design and Related Services
56.0
54.8
50.4
1.2 2.2
5.6 11.1
Management and Technical Consulting Services
32.8
32.1
30.3
0.7 2.2
2.5 8.3
Management of Companies and Enterprises
57.9
57.9
52.7
0.0 0.0
5.2 9.9
Admin and Support, Waste Mngmnt and Remediation
259.8
268.4
246.4
-8.6 -3.2
13.4 5.4
Employment Services
118.1
124.2
105.7
-6.1 -4.9
12.4 11.7
Education and Health Services
504.3
505.6
489.6
-1.3 -0.3
14.7 3.0
Educational Services
95.9
98.8
92.3
-2.9 -2.9
3.6 3.9
Colleges, Universities, and Professional Schools
58.4
61.3
58.0
-2.9 -4.7
0.4 0.7
Health Care and Social Assistance
408.4
406.8
397.3
1.6 0.4
11.1 2.8
Ambulatory Health Care Services
156.9
156.5
153.4
0.4 0.3
3.5 2.3
Hospitals
133.1
131.3
130.0
1.8 1.4
3.1 2.4
Nursing and Residential Care Facilities
57.1
57.2
55.7
-0.1 -0.2
1.4 2.5
Social Assistance
61.3
61.8
58.2
-0.5 -0.8
3.1 5.3
Leisure and Hospitality
365.5
372.9
358.7
-7.4 -2.0
6.8 1.9
Arts, Entertainment, and Recreation
35.7
37.2
33.9
-1.5 -4.0
1.8 5.3
Amusement, Gambling, and Recreation Industries
24.7
26.4
24.4
-1.7 -6.4
0.3 1.2
Accommodation and Food Services
329.8
335.7
324.8
-5.9 -1.8
5.0 1.5
Accommodation
37.4
37.5
38.4
-0.1 -0.3
-1.0 -2.6
Food Services and Drinking Places
292.4
298.2
286.4
-5.8 -2.0
6.0 2.1
Other Services
151.7
150.2
150.7
1.5 1.0
1.0 0.7
Repair and Maintenance
32.9
32.0
32.8
0.9 2.8
0.1 0.3
Personal and Laundry Services
32.1
31.7
32.4
0.4 1.3
-0.3 -0.9
Religious, Grantmaking, Civic, Professional, and Similar
86.7
86.5
85.5
0.2 0.2
1.2 1.4
Government
669.0
675.6
668.2
-6.6 -1.0
0.8 0.1
Federal Government
103.4
104.7
104.3
-1.3 -1.2
-0.9 -0.9
Department of Defense
42.6
43.1
42.8
-0.5 -1.2
-0.2 -0.5
State Government
151.6
155.3
154.6
-3.7 -2.4
-3.0 -1.9
State Government Educational Services
75.3
78.2
76.6
-2.9 -3.7
-1.3 -1.7
Local Government
414.0
415.6
409.3
-1.6 -0.4
4.7 1.2
Local Government Educational Services
249.7
250.9
253.1
-1.2 -0.5
-3.4 -1.3
Note: These preliminary estimates were prepared in cooperation with the U.S. Department of Labor, Bureau of Labor Statistics, based upon monthly reports submitted by selected employers throughout
Georgia. The estimates include all full- and part-time wage and salary workers who were employed during or received pay for any part of the pay period that includes the twelfth of the month. Proprietors,
domestic workers, self-employed persons, unpaid family workers and personnel of the armed forces are excluded. Estimates based on 2011 benchmark.
2Source: Georgia Department of Labor, Workforce Statistics & Economic Research
ATLANTA MSA Nonagricultural Employment (000s)
Preliminary JAN 2012
Revised DEC 2011
Revised JAN 2011
Change in Jobs
from DEC 2011
Net
%
Change in Jobs from JAN 2011
Net %
Total Nonfarm Total Private Goods Producing Service-Providing Private Service-Providing Mining and Logging Construction
Construction of Buildings Specialty Trade Contractors Manufacturing Durable Goods
Transportation Equipment Manufacturing Non-Durable Goods
Food Manufacturing Trade, Transportation, and Utilities
Wholesale Trade Merchant Wholesalers, Durable Goods Merchant Wholesalers, Nondurable Goods Wholesale Electronic Markets and Agents and Brokers
Retail Trade Food and Beverage Stores General Merchandise Stores Miscellaneous Store Retailers
Transportation, Warehousing, and Utilities Utilities Transportation and Warehousing Air Transportation Truck Transportation Couriers and Messengers
Information Telecommunications Wired Telecommunications Carriers Wireless Telecommunications Carriers Internet Service Providers, Search Portals, and DP
Financial Activities Finance and Insurance Insurance Carriers and Related Activities Real Estate and Rental and Leasing
Professional and Business Services Professional, Scientific, and Technical Services Accounting, Tax Prep, and Bookkeeping Services Architectural, Engineering, and Related Services Computer Systems Design and Related Services Management and Technical Consulting Services Management of Companies and Enterprises Admin and Support, Waste Mngmnt and Remediation Employment Services
Education and Health Services Educational Services Health Care and Social Assistance Ambulatory Health Care Services Hospitals Social Assistance
Leisure and Hospitality Arts, Entertainment, and Recreation Accommodation and Food Services Accommodation Food Services and Drinking Places
Other Services Repair and Maintenance Personal and Laundry Services
Government Federal Government State Government Local Government
2,306.5 1,992.3
238.9 2,067.6 1,753.4
1.3 89.1 17.7 59.0 148.5 75.8 14.9 72.7 24.2 530.3 148.7 74.7 38.9 35.1 255.7 49.2 56.9 13.0 125.9 11.0 114.9 39.4 26.9 14.6 78.7 37.2 23.7
9.5 5.5 136.5 98.6 43.7 37.9 407.8 185.4 27.8 27.5 48.0 29.7 43.8 178.6 83.7 293.7 69.0 224.7 87.5 73.2 37.9 213.8 23.6 190.2 21.1 169.1 92.6 18.9 22.4 314.2 46.2 63.6 204.4
2,334.1 2,017.0
240.9 2,093.2 1,776.1
1.3 91.5 18.9 59.9 148.1 75.4 15.2 72.7 24.4 541.6 147.5 73.5 39.1 34.9 265.3 49.7 59.9 13.4 128.8 11.0 117.8 39.5 27.7 16.2 79.0 36.9 23.7
9.5 5.7 138.8 100.6 44.5 38.2 411.7 184.0 26.3 27.3 47.3 28.4 43.5 184.2 88.0 294.1 71.5 222.6 87.1 71.1 38.2 219.6 24.8 194.8 21.5 173.3 91.3 18.9 22.7 317.1 46.6 64.6 205.9
2,238.1 1,922.2
228.1 2,010.0 1,694.1
1.3 84.1 17.6 54.1 142.7 70.9 14.2 71.8 24.2 510.0 142.6 70.9 38.4 33.3 243.5 47.4 53.4 12.8 123.9 10.9 113.0 39.2 25.8 14.4 79.1 37.7 24.5
9.4 5.5 140.5 101.1 43.3 39.4 381.6 171.4 25.9 25.3 43.1 26.2 41.0 169.2 75.2 280.9 64.3 216.6 85.7 70.4 36.1 210.8 22.6 188.2 22.0 166.2 91.2 18.6 21.9 315.9 47.5 63.3 205.1
-27.6 -1.2 -24.7 -1.2
-2.0 -0.8 -25.6 -1.2 -22.7 -1.3
0.0 0.0 -2.4 -2.6 -1.2 -6.4 -0.9 -1.5 0.4 0.3 0.4 0.5 -0.3 -2.0 0.0 0.0 -0.2 -0.8 -11.3 -2.1 1.2 0.8 1.2 1.6 -0.2 -0.5 0.2 0.6 -9.6 -3.6 -0.5 -1.0 -3.0 -5.0 -0.4 -3.0 -2.9 -2.3 0.0 0.0 -2.9 -2.5 -0.1 -0.3 -0.8 -2.9 -1.6 -9.9 -0.3 -0.4 0.3 0.8 0.0 0.0 0.0 0.0 -0.2 -3.5 -2.3 -1.7 -2.0 -2.0 -0.8 -1.8 -0.3 -0.8 -3.9 -1.0 1.4 0.8 1.5 5.7 0.2 0.7 0.7 1.5 1.3 4.6 0.3 0.7 -5.6 -3.0 -4.3 -4.9 -0.4 -0.1 -2.5 -3.5 2.1 0.9 0.4 0.5 2.1 3.0 -0.3 -0.8 -5.8 -2.6 -1.2 -4.8 -4.6 -2.4 -0.4 -1.9 -4.2 -2.4 1.3 1.4 0.0 0.0 -0.3 -1.3 -2.9 -0.9 -0.4 -0.9 -1.0 -1.6 -1.5 -0.7
68.4 3.1 70.1 3.7 10.8 4.7 57.6 2.9 59.3 3.5
0.0 0.0 5.0 6.0 0.1 0.6 4.9 9.1 5.8 4.1 4.9 6.9 0.7 4.9 0.9 1.3 0.0 0.0 20.3 4.0 6.1 4.3 3.8 5.4 0.5 1.3 1.8 5.4 12.2 5.0 1.8 3.8 3.5 6.6 0.2 1.6 2.0 1.6 0.1 0.9 1.9 1.7 0.2 0.5 1.1 4.3 0.2 1.4 -0.4 -0.5 -0.5 -1.3 -0.8 -3.3 0.1 1.1 0.0 0.0 -4.0 -2.9 -2.5 -2.5 0.4 0.9 -1.5 -3.8 26.2 6.9 14.0 8.2 1.9 7.3 2.2 8.7 4.9 11.4 3.5 13.4 2.8 6.8 9.4 5.6 8.5 11.3 12.8 4.6 4.7 7.3 8.1 3.7 1.8 2.1 2.8 4.0 1.8 5.0 3.0 1.4 1.0 4.4 2.0 1.1 -0.9 -4.1 2.9 1.7 1.4 1.5 0.3 1.6 0.5 2.3 -1.7 -0.5 -1.3 -2.7 0.3 0.5 -0.7 -0.3
Note: These preliminary estimates were prepared in cooperation with the U.S. Department of Labor, Bureau of Labor Statistics, based upon monthly reports submitted by selected employers in the
Atlanta Metropolitan Statistical Area, which includes Barrow, Bartow, Butts, Carroll, Cherokee, Clayton, Cobb, Coweta, Dawson, DeKalb, Douglas, Fayette, Forsyth, Fulton, Gwinnett, Haralson, Heard, Henry, Jasper, Lamar, Meriwether, Newton, Paulding, Pickens, Pike, Rockdale, Spalding and Walton counties. The estimates include all full- and part-time wage and salary workers who were employed during or received pay for any part of the pay period that includes the twelfth of the month. Proprietors, domestic workers, self-employed persons, unpaid family workers and personnel of the armed forces are excluded. Estimates based on 2011 benchmark.
Source: Georgia Department of Labor, Workforce Statistics & Economic Research
3
ALBANY MSA Nonagricultural Employment (000s)
Preliminary
Revised
Revised
JAN 2012 DEC 2011 JAN 2011
Change in Jobs from DEC 2011
Net %
Change in Jobs
from JAN 2011
Net
%
Total Nonfarm Total Private
58.5
59.6
60.2
-1.1 -1.9
45.3
46.0
46.4
-0.7 -1.5
-1.7 -2.8 -1.1 -2.4
Goods Producing
6.6
6.6
6.6
0.0 0.0
0.0 0.0
Service-Providing Private Service-Providing
51.9
53.0
53.6
-1.1 -2.1
38.7
39.4
39.8
-0.7 -1.8
-1.7 -3.2 -1.1 -2.8
Manufacturing
4.2
4.2
4.2
0.0 0.0
0.0 0.0
Trade, Transportation, and Utilities Retail Trade
12.4
12.8
12.3
-0.4 -3.1
8.0
8.2
7.6
-0.2 -2.4
0.1 0.8 0.4 5.3
Government
13.2
13.6
13.8
-0.4 -2.9
-0.6 -4.4
Federal Government State Government
3.3
3.4
3.5
-0.1 -2.9
-0.2 -5.7
2.6
2.9
2.6
-0.3 -10.3
0.0 0.0
Local Government
7.3
7.3
7.7
0.0 0.0
-0.4 -5.2
Note: These preliminary estimates were prepared in cooperation with the U.S. Department of Labor, Bureau of Labor Statistics, based upon monthly reports submitted by selected employers in the
Albany Metropolitan Statistical Area, which includes Baker, Dougherty, Lee, Terrell and Worth counties. The estimates include all full- and part-time wage and salary workers who were employed during or received pay for any part of the pay period that includes the twelfth of the month. Proprietors, domestic workers, self-employed persons, unpaid family workers and personnel of the armed forces are
excluded. Estimates based on 2011 benchmark.
ATHENS - CLARKE MSA Nonagricultural Employment (000s)
Preliminary
Revised
Revised
JAN 2012 DEC 2011 JAN 2011
Change in Jobs
from DEC 2011
Net
%
Change in Jobs from JAN 2011
Net %
Total Nonfarm
82.6
84.4
80.5
-1.8 -2.1
2.1 2.6
Total Private
54.4
55.3
53.3
-0.9 -1.6
1.1 2.1
Goods Producing
9.1
9.2
8.9
-0.1 -1.1
0.2 2.3
Service-Providing
73.5
75.2
71.6
-1.7 -2.3
1.9 2.7
Private Service-Providing
45.3
46.1
44.4
-0.8 -1.7
0.9 2.0
Trade, Transportation, and Utilities
12.7
13.0
12.7
-0.3 -2.3
0.0 0.0
Retail Trade
9.2
9.5
9.2
-0.3 -3.2
0.0 0.0
Professional and Business Services
6.7
6.8
6.1
-0.1 -1.5
0.6 9.8
Leisure and Hospitality
7.4
7.6
7.4
-0.2 -2.6
0.0 0.0
Government
28.2
29.1
27.2
-0.9 -3.1
1.0 3.7
Federal Government
1.3
1.3
1.5
0.0 0.0
-0.2 -13.3
State Government
18.7
19.6
17.7
-0.9 -4.6
1.0 5.7
Local Government
8.2
8.2
8.0
0.0 0.0
0.2 2.5
Note: These preliminary estimates were prepared in cooperation with the U.S. Department of Labor, Bureau of Labor Statistics, based upon monthly reports submitted by selected employers in the Athens -
Clarke County Metropolitan Statistical Area, which includes Clarke, Madison, Oconee and Oglethorpe counties. The estimates include all full- and part-time wage and salary workers who were employed during or received pay for any part of the pay period that includes the twelfth of the month. Proprietors, domestic workers, self-employed persons, unpaid family workers and personnel of the armed forces are excluded. Estimates based on 2011 benchmark.
Source: Georgia Department of Labor, Workforce Statistics & Economic Research
4
AUGUSTA-RICHMOND MSA Nonagricultural Employment (000s)
Preliminary Revised Revised JAN 2012 DEC 2011 JAN 2011
Change in Jobs from DEC 2011
Net %
Change in Jobs from JAN 2011
Net %
Total Nonfarm Total Private Goods Producing Service-Providing Private Service-Providing Mining, Logging and Construction Manufacturing Trade, Transportation, and Utilities
Wholesale Trade Retail Trade Transportation, Warehousing, and Utilities Information Financial Activities Professional and Business Services Education and Health Services Leisure and Hospitality Other Services Government Federal Government State Government Local Government
205.4 161.3
29.1 176.3 132.2
10.1 19.0 35.5
4.5 25.0
6.0 2.6 6.9 29.5 29.2 20.4 8.1 44.1 9.0 13.8 21.3
208.5 164.3
30.3 178.2 134.0
10.6 19.7 36.2
4.5 25.7
6.0 2.6 6.9 30.0 29.4 20.8 8.1 44.2 9.0 13.8 21.4
207.3 163.2
30.4 176.9 132.8
10.6 19.8 35.3
4.5 25.1
5.7 2.6 7.1 30.9 28.4 20.6 7.9 44.1 8.9 13.8 21.4
-3.1 -1.5 -3.0 -1.8 -1.2 -4.0 -1.9 -1.1 -1.8 -1.3 -0.5 -4.7 -0.7 -3.6 -0.7 -1.9 0.0 0.0 -0.7 -2.7 0.0 0.0 0.0 0.0 0.0 0.0 -0.5 -1.7 -0.2 -0.7 -0.4 -1.9 0.0 0.0 -0.1 -0.2 0.0 0.0 0.0 0.0 -0.1 -0.5
-1.9 -0.9 -1.9 -1.2 -1.3 -4.3 -0.6 -0.3 -0.6 -0.5 -0.5 -4.7 -0.8 -4.0 0.2 0.6 0.0 0.0 -0.1 -0.4 0.3 5.3 0.0 0.0 -0.2 -2.8 -1.4 -4.5 0.8 2.8 -0.2 -1.0 0.2 2.5 0.0 0.0 0.1 1.1 0.0 0.0 -0.1 -0.5
Note: These preliminary estimates were prepared in cooperation with the U.S. Department of Labor, Bureau of Labor Statistics, based upon monthly reports submitted by selected employers in the Augusta -
Richmond County Metropolitan Statistical Area, which includes Burke, Columbia, McDuffie and Richmond counties in Georgia and Aiken and Edgefield counties in South Carolina. The estimates include all full- and part-time wage and salary workers who were employed during or received pay for any part of the pay period that includes the twelfth of the month. Proprietors, domestic workers, self-employed
persons, unpaid family workers and personnel of the armed forces are excluded. Estimates based on 2011 benchmark.
BRUNSWICK MSA Nonagricultural Employment (000s)
Preliminary Revised Revised JAN 2012 DEC 2011 JAN 2011
Change in Jobs from DEC 2011
Net %
Change in Jobs from JAN 2011
Net %
Total Nonfarm Total Private Goods Producing Service-Providing Private Service-Providing Trade, Transportation, and Utilities
Retail Trade Government
Federal Government State Government Local Government
39.3
39.3
39.2
0.0 0.0
29.1
29.2
29.2
-0.1 -0.3
4.3
4.4
4.4
-0.1 -2.3
35.0
34.9
34.8
0.1 0.3
24.8
24.8
24.8
0.0 0.0
7.5
7.6
7.5
-0.1 -1.3
5.5
5.6
5.4
-0.1 -1.8
10.2
10.1
10.0
0.1 1.0
1.8
1.8
1.9
0.0 0.0
1.8
1.8
1.7
0.0 0.0
6.6
6.5
6.4
0.1 1.5
0.1 0.3 -0.1 -0.3 -0.1 -2.3 0.2 0.6 0.0 0.0 0.0 0.0 0.1 1.9 0.2 2.0 -0.1 -5.3 0.1 5.9 0.2 3.1
Note: These preliminary estimates were prepared in cooperation with the U.S. Department of Labor, Bureau of Labor Statistics, based upon monthly reports submitted by selected employers in
the Brunswick Metropolitan Statistical Area, which includes Brantley, Glynn and McIntosh counties. The estimates include all full- and part-time wage and salary workers who were employed during or received pay for any part of the pay period that includes the twelfth of the month. Proprietors, domestic workers, self-employed persons, unpaid family workers and personnel of the armed forces are excluded. Estimates based on 2011 benchmark.
Source: Georgia Department of Labor, Workforce Statistics & Economic Research
5
COLUMBUS MSA Nonagricultural Employment (000s)
Preliminary Revised Revised JAN 2012 DEC 2011 JAN 2011
Change in Jobs from DEC 2011
Net %
Change in Jobs from JAN 2011
Net %
Total Nonfarm
119.6
121.0
115.3
-1.4 -1.2
4.3 3.7
Total Private Goods Producing
95.2
96.2
91.5
-1.0 -1.0
14.8
14.9
14.5
-0.1 -0.7
3.7 4.0 0.3 2.1
Service-Providing
104.8
106.1
100.8
-1.3 -1.2
4.0 4.0
Private Service-Providing Trade, Transportation, and Utilities
80.4
81.3
77.0
-0.9 -1.1
19.3
19.7
17.8
-0.4 -2.0
3.4 4.4 1.5 8.4
Retail Trade
13.4
13.8
12.9
-0.4 -2.9
0.5 3.9
Information Financial Activities
1.4
1.4
1.4
0.0 0.0
12.3
12.4
12.3
-0.1 -0.8
0.0 0.0 0.0 0.0
Finance and Insurance
10.6
10.7
10.5
-0.1 -0.9
0.1 1.0
Insurance Carriers and Related Activities Professional and Business Services
4.4
4.4
4.4
0.0 0.0
12.8
12.9
12.0
-0.1 -0.8
0.0 0.0 0.8 6.7
Leisure and Hospitality
13.0
13.4
12.6
-0.4 -3.0
0.4 3.2
Government Federal Government
24.4
24.8
23.8
-0.4 -1.6
7.1
7.1
6.4
0.0 0.0
0.6 2.5 0.7 10.9
State Government
4.0
4.2
4.0
-0.2 -4.8
0.0 0.0
Local Government
13.3
13.5
13.4
-0.2 -1.5
-0.1 -0.8
Note: These preliminary estimates were prepared in cooperation with the U.S. Department of Labor, Bureau of Labor Statistics, based upon monthly reports submitted by selected employers in
the Columbus Metropolitan Statistical Area, which includes Chattahoochee, Harris, Marion and Muscogee counties in Georgia and Russell County in Alabama. The estimates include all full- and part-time wage and salary workers who were employed during or received pay for any part of the pay period that includes the twelfth of the month. Proprietors, domestic workers, self-employed persons, unpaid family workers and personnel of the armed forces are excluded. Estimates based on 2011 benchmark.
DALTON MSA Nonagricultural Employment (000s)
Preliminary Revised
Revised
JAN 2012 DEC 2011 JAN 2011
Change in Jobs from DEC 2011
Net %
Change in Jobs from JAN 2011
Net %
Total Nonfarm Total Private Goods Producing
62.3
63.0
64.4
-0.7 -1.1
55.3
56.0
57.6
-0.7 -1.3
22.9
23.1
23.0
-0.2 -0.9
-2.1 -3.3 -2.3 -4.0 -0.1 -0.4
Service-Providing Private Service-Providing Manufacturing
39.4
39.9
41.4
-0.5 -1.3
32.4
32.9
34.6
-0.5 -1.5
22.0
22.0
22.1
0.0 0.0
-2.0 -4.8 -2.2 -6.4 -0.1 -0.5
Textile Mills Textile Product Mills Trade, Transportation, and Utilities
2.4
2.4
2.6
0.0 0.0
14.7
14.7
15.3
0.0 0.0
16.0
16.4
15.9
-0.4 -2.4
-0.2 -7.7 -0.6 -3.9 0.1 0.6
Retail Trade Transportation, Warehousing, and Utilities Professional and Business Services
7.6
7.8
4.2
4.3
7.3
7.3
7.4
-0.2 -2.6
4.4
-0.1 -2.3
6.9
0.0 0.0
0.2 2.7 -0.2 -4.6 0.4 5.8
Government Federal Government State Government
7.0
7.0
0.3
0.3
1.1
1.1
6.8
0.0 0.0
0.3
0.0 0.0
1.0
0.0 0.0
0.2 2.9 0.0 0.0 0.1 10.0
Local Government
5.6
5.6
5.5
0.0 0.0
0.1 1.8
Note: These preliminary estimates were prepared in cooperation with the U.S. Department of Labor, Bureau of Labor Statistics, based upon monthly reports submitted by selected employers in the
Dalton Metropolitan Statistical Area, which includes Murray and Whitfield counties. The estimates include all full- and part-time wage and salary workers who were employed during or received pay for any part of the pay period that includes the twelfth of the month. Proprietors, domestic workers, self-employed persons, unpaid family workers and personnel of the armed forces are excluded. Estimates based on 2011 benchmark.
Source: Georgia Department of Labor, Workforce Statistics & Economic Research
6
GAINESVILLE MSA Nonagricultural Employment (000s)
Preliminary Revised Revised JAN 2012 DEC 2011 JAN 2011
Change in Jobs from DEC 2011
Net %
Change in Jobs from JAN 2011
Net %
Total Nonfarm
75.4
75.9
71.1
-0.5 -0.7
4.3 6.1
Total Private
65.1
65.4
61.0
-0.3 -0.5
4.1 6.7
Goods Producing Service-Providing
18.2
18.3
17.7
-0.1 -0.6
57.2
57.6
53.4
-0.4 -0.7
0.5 2.8 3.8 7.1
Private Service-Providing
46.9
47.1
43.3
-0.2 -0.4
3.6 8.3
Trade, Transportation, and Utilities Retail Trade
13.0
13.4
7.9
8.2
13.6
-0.4 -3.0
7.6
-0.3 -3.7
-0.6 -4.4 0.3 4.0
Government
10.3
10.5
10.1
-0.2 -1.9
0.2 2.0
Federal Government State Government
0.5
0.5
2.4
2.5
0.5
0.0 0.0
2.3
-0.1 -4.0
0.0 0.0 0.1 4.4
Local Government
7.4
7.5
7.3
-0.1 -1.3
0.1 1.4
Note: These preliminary estimates were prepared in cooperation with the U.S. Department of Labor, Bureau of Labor Statistics, based upon monthly reports submitted by selected employers in the
Gainesville Metropolitan Statistical Area, which comprises Hall county. The estimates include all full- and part-time wage and salary workers who were employed during or received pay for any part of the pay period that includes the twelfth of the month. Proprietors, domestic workers, self-employed persons, unpaid family workers and personnel of the armed forces are excluded. Estimates based on 2011 benchmark.
HINESVILLE - FT. STEWART MSA Nonagricultural Employment (000s)
Preliminary Revised Revised JAN 2012 DEC 2011 JAN 2011
Change in Jobs from DEC 2011
Net %
Change in Jobs from JAN 2011
Net %
Total Nonfarm
19.7
19.8
19.9
-0.1 -0.5
-0.2 -1.0
Total Private Goods Producing Service-Providing
11.6
11.7
11.8
-0.1 -0.9
2.3
2.3
2.4
0.0 0.0
17.4
17.5
17.5
-0.1 -0.6
-0.2 -1.7 -0.1 -4.2 -0.1 -0.6
Private Service-Providing Government
Federal Government
9.3
9.4
8.1
8.1
4.4
4.4
9.4
-0.1 -1.1
8.1
0.0 0.0
4.5
0.0 0.0
-0.1 -1.1 0.0 0.0 -0.1 -2.2
State Government Local Government
0.3
0.3
3.4
3.4
0.3
0.0 0.0
3.3
0.0 0.0
0.0 0.0 0.1 3.0
Note: These preliminary estimates were prepared in cooperation with the U.S. Department of Labor, Bureau of Labor Statistics, based upon monthly reports submitted by selected employers in the
Hinesville - Ft. Stewart Metropolitan Statistical Area, which includes Liberty and Long counties. The estimates include all full- and part-time wage and salary workers who were employed during or received pay for any part of the pay period that includes the twelfth of the month. Proprietors, domestic workers, self-employed persons, unpaid family workers and personnel of the armed forces are excluded. Estimates based on 2011 benchmark.
Source: Georgia Department of Labor, Workforce Statistics & Economic Research
7
MACON MSA Nonagricultural Employment (000s)
Preliminary Revised
Revised
JAN 2012 DEC 2011 JAN 2011
Change in Jobs from DEC 2011
Net %
Change in Jobs from JAN 2011
Net %
Total Nonfarm
95.7
97.0
94.4
-1.3 -1.3
1.3 1.4
Total Private Goods Producing
80.8
82.1
9.2
9.3
79.4
-1.3 -1.6
9.6
-0.1 -1.1
1.4 1.8 -0.4 -4.2
Service-Providing
86.5
87.7
84.8
-1.2 -1.4
1.7 2.0
Private Service-Providing Trade, Transportation, and Utilities
71.6
72.8
69.8
-1.2 -1.7
19.1
19.8
18.8
-0.7 -3.5
1.8 2.6 0.3 1.6
Retail Trade
13.0
13.4
12.6
-0.4 -3.0
0.4 3.2
Transportation, Warehousing, and Utilities Financial Activities
2.8
2.9
8.8
8.8
3.0
-0.1 -3.5
8.3
0.0 0.0
-0.2 -6.7 0.5 6.0
Professional and Business Services
11.0
11.1
10.0
-0.1 -0.9
1.0 10.0
Education and Health Services Leisure and Hospitality
19.6
19.6
8.1
8.3
19.5
0.0 0.0
8.4
-0.2 -2.4
0.1 0.5 -0.3 -3.6
Government
14.9
14.9
15.0
0.0 0.0
-0.1 -0.7
Federal Government State Government
1.2
1.2
4.0
4.0
1.2
0.0 0.0
3.8
0.0 0.0
0.0 0.0 0.2 5.3
Local Government
9.7
9.7
10.0
0.0 0.0
-0.3 -3.0
Note: These preliminary estimates were prepared in cooperation with the U.S. Department of Labor, Bureau of Labor Statistics, based upon monthly reports submitted by selected employers in the
Macon Metropolitan Statistical Area, which includes Bibb, Crawford, Jones, Monroe and Twiggs counties. The estimates include all full- and part-time wage and salary workers who were employed during or received pay for any part of the pay period that includes the twelfth of the month. Proprietors, domestic workers, self-employed persons, unpaid family workers and personnel of the armed forces are excluded. Estimates based on 2011 benchmark.
ROME MSA Nonagricultural Employment (000s)
Preliminary Revised
Revised
JAN 2012 DEC 2011 JAN 2011
Change in Jobs from DEC 2011
Net %
Change in Jobs from JAN 2011
Net %
Total Nonfarm Total Private Goods Producing Service-Providing Private Service-Providing Manufacturing Trade, Transportation, and Utilities
Retail Trade Education and Health Services Government
Federal Government State Government Local Government
36.7
37.2
37.8
-0.5 -1.3
30.6
31.0
31.1
-0.4 -1.3
6.2
6.3
6.5
-0.1 -1.6
30.5
30.9
31.3
-0.4 -1.3
24.4
24.7
24.6
-0.3 -1.2
5.5
5.5
5.7
0.0 0.0
6.2
6.4
6.1
-0.2 -3.1
4.0
4.1
3.9
-0.1 -2.4
9.7
9.7
9.0
0.0 0.0
6.1
6.2
6.7
-0.1 -1.6
0.2
0.2
0.2
0.0 0.0
1.7
1.8
2.4
-0.1 -5.6
4.2
4.2
4.1
0.0 0.0
-1.1 -2.9 -0.5 -1.6 -0.3 -4.6 -0.8 -2.6 -0.2 -0.8 -0.2 -3.5 0.1 1.6 0.1 2.6 0.7 7.8 -0.6 -9.0 0.0 0.0 -0.7 -29.2 0.1 2.4
Note: These preliminary estimates were prepared in cooperation with the U.S. Department of Labor, Bureau of Labor Statistics, based upon monthly reports submitted by selected employers in the
Rome Metropolitan Statistical Area, which comprises Floyd county. The estimates include all full- and part-time wage and salary workers who were employed during or received pay for any part of the pay period that includes the twelfth of the month. Proprietors, domestic workers, self-employed persons, unpaid family workers and personnel of the armed forces are excluded. Estimates based on 2011 benchmark.
Source: Georgia Department of Labor, Workforce Statistics & Economic Research
8
SAVANNAH MSA Nonagricultural Employment (000s)
Preliminary Revised
Revised
JAN 2012 DEC 2011 JAN 2011
Change in Jobs from DEC 2011
Net %
Change in Jobs from JAN 2011
Net %
Total Nonfarm Total Private Goods Producing Service-Providing Private Service-Providing Mining, Logging and Construction Manufacturing Trade, Transportation, and Utilities
Wholesale Trade Retail Trade Transportation, Warehousing, and Utilities Information Financial Activities Professional and Business Services Education and Health Services Leisure and Hospitality Other Services Government Federal Government State Government Local Government
149.0 126.6
20.0 129.0 106.6
5.7 14.3 32.9
5.7 17.4
9.8 1.4 5.0 17.3 23.9 19.3 6.8 22.4 3.2 5.0 14.2
150.5 127.5
20.1 130.4 107.4
5.8 14.3 33.2
5.6 17.7
9.9 1.4 5.1 17.4 23.9 19.6 6.8 23.0 3.2 5.3 14.5
147.7 125.1
19.7 128.0 105.4
5.8 13.9 32.8
5.5 17.6
9.7 1.5 5.2 16.2 23.8 19.1 6.8 22.6 3.1 5.0 14.5
-1.5 -1.0 -0.9 -0.7 -0.1 -0.5 -1.4 -1.1 -0.8 -0.7 -0.1 -1.7 0.0 0.0 -0.3 -0.9 0.1 1.8 -0.3 -1.7 -0.1 -1.0 0.0 0.0 -0.1 -2.0 -0.1 -0.6 0.0 0.0 -0.3 -1.5 0.0 0.0 -0.6 -2.6 0.0 0.0 -0.3 -5.7 -0.3 -2.1
1.3 0.9 1.5 1.2 0.3 1.5 1.0 0.8 1.2 1.1 -0.1 -1.7 0.4 2.9 0.1 0.3 0.2 3.6 -0.2 -1.1 0.1 1.0 -0.1 -6.7 -0.2 -3.9 1.1 6.8 0.1 0.4 0.2 1.1 0.0 0.0 -0.2 -0.9 0.1 3.2 0.0 0.0 -0.3 -2.1
Note: These preliminary estimates were prepared in cooperation with the U.S. Department of Labor, Bureau of Labor Statistics, based upon monthly reports submitted by selected employers in the
Savannah Metropolitan Statistical Area, which includes Bryan, Chatham and Effingham counties. The estimates include all full- and part-time wage and salary workers who were employed during or received pay for any part of the pay period that includes the twelfth of the month. Proprietors, domestic workers, self-employed persons, unpaid family workers and personnel of the armed forces are excluded. Estimates based on 2011 benchmark.
VALDOSTA MSA Nonagricultural Employment (000s)
Preliminary Revised
Revised
JAN 2012 DEC 2011 JAN 2011
Change in Jobs from DEC 2011
Net %
Change in Jobs from JAN 2011
Net %
Total Nonfarm
52.0
52.2
51.6
-0.2 -0.4
0.4 0.8
Total Private Goods Producing Service-Providing
39.6
39.7
6.0
6.1
46.0
46.1
38.8
-0.1 -0.3
6.2
-0.1 -1.6
45.4
-0.1 -0.2
0.8 2.1 -0.2 -3.2 0.6 1.3
Private Service-Providing Trade, Transportation, and Utilities
Retail Trade
33.6
33.6
32.6
0.0 0.0
10.6
10.6
10.5
0.0 0.0
7.7
7.9
7.6
-0.2 -2.5
1.0 3.1 0.1 1.0 0.1 1.3
Government Federal Government State Government
12.4
12.5
1.2
1.2
3.4
3.5
12.8
-0.1 -0.8
1.2
0.0 0.0
3.8
-0.1 -2.9
-0.4 -3.1 0.0 0.0 -0.4 -10.5
Local Government
7.8
7.8
7.8
0.0 0.0
0.0 0.0
Note: These preliminary estimates were prepared in cooperation with the U.S. Department of Labor, Bureau of Labor Statistics, based upon monthly reports submitted by selected employers in the
Valdosta Metropolitan Statistical Area, which includes Brooks, Echols, Lanier and Lowndes counties. The estimates include all full- and part-time wage and salary workers who were employed during or received pay for any part of the pay period that includes the twelfth of the month. Proprietors, domestic workers, self-employed persons, unpaid family workers and personnel of the armed forces are excluded. Estimates based on 2011 benchmark.
Source: Georgia Department of Labor, Workforce Statistics & Economic Research
9
WARNER ROBINS MSA Nonagricultural Employment (000s)
Preliminary Revised
Revised
JAN 2012 DEC 2011 JAN 2011
Change in Jobs from DEC 2011
Net %
Change in Jobs from JAN 2011
Net %
Total Nonfarm Total Private Goods Producing Service-Providing Private Service-Providing Trade, Transportation, and Utilities
Retail Trade Government
Federal Government State Government Local Government
58.9
59.3
33.1
33.2
6.0
6.0
52.9
53.3
27.1
27.2
8.0
8.2
6.4
6.6
25.8
26.1
16.7
17.0
1.0
1.0
8.1
8.1
58.3
-0.4 -0.7
32.8
-0.1 -0.3
6.3
0.0 0.0
52.0
-0.4 -0.8
26.5
-0.1 -0.4
7.7
-0.2 -2.4
6.2
-0.2 -3.0
25.5
-0.3 -1.2
16.4
-0.3 -1.8
1.0
0.0 0.0
8.1
0.0 0.0
0.6 1.0 0.3 0.9 -0.3 -4.8 0.9 1.7 0.6 2.3 0.3 3.9 0.2 3.2 0.3 1.2 0.3 1.8 0.0 0.0 0.0 0.0
Note: These preliminary estimates were prepared in cooperation with the U.S. Department of Labor, Bureau of Labor Statistics, based upon monthly reports submitted by selected employers in the
Warner Robins Metropolitan Statistical Area, which comprises Houston county. The estimates include all full- and part-time wage and salary workers who were employed during or received pay for any part of the pay period that includes the twelfth of the month. Proprietors, domestic workers, self-employed persons, unpaid family workers and personnel of the armed forces are excluded. Estimates based on 2011 benchmark.
Source: Georgia Department of Labor, Workforce Statistics & Economic Research
10
Georgia Statewide Hours and Earnings
All Employee
Average Weekly Earnings
Preliminary JAN 2012
Revised DEC 2011
Revised JAN 2011
Total Private ........................................................................................... $773.60 ........................ $760.12 ................... $750.40 Goods Producing ................................................................................ $870.63 ........................ $894.46 ................... $784.06 Private Service Providing .................................................................... $754.94 ........................ $733.46 ................... $745.08
Construction .................................................................................... $836.63 ........................ $860.09 ................... $757.86 Manufacturing .................................................................................. $884.99 ........................ $910.51 ................... $765.07 Trade, Transportation, and Utilities ................................................ $717.50 ........................ $702.45 ................... $680.40 Financial Activities ........................................................................... $930.26 ........................ $866.36 ................... $896.97 Professional and Business Services ............................................. $984.98 ........................ $977.56 ................... $942.89 Educational and Health Services .................................................... $789.96 ........................ $768.15 ................... $788.74 Leisure and Hospitality ................................................................... $319.73 ........................ $327.70 ................... $313.72 Other Services ................................................................................. $555.41 ........................ $538.80 ................... $595.93
Average Weekly Hours
Preliminary JAN 2012
Revised DEC 2011
Revised JAN 2011
Total Private ..................................................................................................35.1 .............................. 34.9 ......................... 33.5 Goods Producing ....................................................................................... 39.2 .............................. 40.4 ......................... 35.9 Private Service Providing ........................................................................... 34.3 .............................. 33.8 ......................... 33.1
Construction ........................................................................................... 37.2 .............................. 38.5 ......................... 34.0 Manufacturing ......................................................................................... 40.3 .............................. 41.5 ......................... 36.8 Trade, Transportation, and Utilities ....................................................... 35.0 .............................. 35.0 ......................... 33.7 Financial Activities .................................................................................. 37.3 .............................. 35.8 ......................... 36.3 Professional and Business Services .................................................... 36.4 .............................. 35.9 ......................... 34.2 Educational and Health Services ........................................................... 35.6 .............................. 34.9 ......................... 34.9 Leisure and Hospitality ..........................................................................26.1 .............................. 26.3 ......................... 25.3 Other Services ........................................................................................ 30.5 .............................. 29.9 ......................... 31.8
Average Hourly Earnings
Preliminary JAN 2012
Revised DEC 2011
Revised JAN 2011
Total Private ............................................................................................. $22.04 .......................... $21.78 ..................... $22.40 Goods Producing .................................................................................. $22.21 .......................... $22.14 ..................... $21.84 Private Service Providing ...................................................................... $22.01 .......................... $21.70 ..................... $22.51 Construction ...................................................................................... $22.49 .......................... $22.34 ..................... $22.29 Manufacturing .................................................................................... $21.96 .......................... $21.94 ..................... $20.79 Trade, Transportation, and Utilities ................................................... $20.50 .......................... $20.07 ..................... $20.19 Financial Activities ............................................................................. $24.94 .......................... $24.20 ..................... $24.71 Professional and Business Services ............................................... $27.06 .......................... $27.23 ..................... $27.57 Educational and Health Services ...................................................... $22.19 .......................... $22.01 ..................... $22.60 Leisure and Hospitality ..................................................................... $12.25 .......................... $12.46 ..................... $12.40 Other Services ................................................................................... $18.21 .......................... $18.02 ..................... $18.74
Read more about the hours and earnings series at http://www.bls.gov/sae/home.htm
Source: Georgia Department of Labor, Workforce Statistics & Economic Research
11
Georgia MSA Hours and Earnings
All Employee Total Private
Average Weekly Earnings
Preliminary JAN 2012
Revised DEC 2011
Revised JAN 2011
Albany MSA ............................................................................................ $579.30 ........................ $601.34 ................... $533.81 Athens-Clarke County MSA ................................................................... $653.23 ........................ $644.32 ................... $666.88 Atlanta MSA ............................................................................................ $858.55 ........................ $841.12 ................... $833.79 Augusta-Richmond County MSA ........................................................... $751.80 ........................ $753.00 ................... $723.60 Brunswick MSA ...................................................................................... $425.43 ........................ $435.71 ................... $467.18 Columbus MSA ..................................................................................... $647.95 ........................ $635.71 ................... $586.20 Dalton MSA ............................................................................................ $565.49 ........................ $560.79 ................... $545.46 Gainesville MSA .................................................................................... $819.00 ........................ $788.80 ................... $827.64 Hinesville-Fort Stewart MSA .................................................................. $609.70 ........................ $578.84 ................... $461.65 Macon MSA ............................................................................................ $745.49 ........................ $732.23 ................... $752.92 Rome MSA ............................................................................................ $695.57 ........................ $698.05 ................... $684.05 Savannah MSA ...................................................................................... $677.35 ........................ $673.30 ................... $654.38 Valdosta MSA ......................................................................................... $604.31 ........................ $599.56 ................... $530.55 Warner Robins MSA .............................................................................. $599.20 ........................ $608.66 ................... $604.44
Average Weekly Hours
Preliminary JAN 2012
Revised DEC 2011
Revised JAN 2011
Albany MSA ................................................................................................... 33.7 .............................. 34.8 ......................... 33.7 Athens-Clarke County MSA ..........................................................................31.3 .............................. 32.2 ......................... 32.0 Atlanta MSA ................................................................................................... 35.1 .............................. 34.8 ......................... 33.1 Augusta-Richmond County MSA .................................................................. 35.8 .............................. 36.5 ......................... 36.0 Brunswick MSA ............................................................................................. 29.0 .............................. 29.4 ......................... 29.7 Columbus MSA ............................................................................................35.1 .............................. 35.2 ......................... 33.1 Dalton MSA ................................................................................................... 33.7 .............................. 33.5 ......................... 32.8 Gainesville MSA ........................................................................................... 37.5 .............................. 36.3 ......................... 36.3 Hinesville-Fort Stewart MSA ......................................................................... 35.0 .............................. 36.2 ......................... 30.9 Macon MSA ................................................................................................... 37.2 .............................. 37.0 ......................... 38.2 Rome MSA ................................................................................................... 36.9 .............................. 36.3 ......................... 34.1 Savannah MSA ............................................................................................. 33.4 .............................. 33.2 ......................... 32.9 Valdosta MSA ................................................................................................ 34.2 .............................. 34.3 ......................... 30.3 Warner Robins MSA ..................................................................................... 35.0 .............................. 34.9 ......................... 33.9
Average Hourly Earnings
Preliminary JAN 2012
Revised DEC 2011
Revised JAN 2011
Albany MSA .............................................................................................. $17.19 .......................... $17.28 ..................... $15.84 Athens-Clarke County MSA ..................................................................... $20.87 .......................... $20.01 ..................... $20.84 Atlanta MSA .............................................................................................. $24.46 .......................... $24.17 ..................... $25.19 Augusta-Richmond County MSA ............................................................. $21.00 .......................... $20.63 ..................... $20.10 Brunswick MSA ........................................................................................ $14.67 .......................... $14.82 ..................... $15.73 Columbus MSA ....................................................................................... $18.46 .......................... $18.06 ..................... $17.71 Dalton MSA .............................................................................................. $16.78 .......................... $16.74 ..................... $16.63 Gainesville MSA ...................................................................................... $21.84 .......................... $21.73 ..................... $22.80 Hinesville-Fort Stewart MSA .................................................................... $17.42 .......................... $15.99 ..................... $14.94 Macon MSA .............................................................................................. $20.04 .......................... $19.79 ..................... $19.71 Rome MSA .............................................................................................. $18.85 .......................... $19.23 ..................... $20.06 Savannah MSA ........................................................................................ $20.28 .......................... $20.28 ..................... $19.89 Valdosta MSA ........................................................................................... $17.67 .......................... $17.48 ..................... $17.51 Warner Robins MSA ................................................................................ $17.12 .......................... $17.44 ..................... $17.83
Read more about the hours and earnings series at http://www.bls.gov/sae/home.htm
Source: Georgia Department of Labor, Workforce Statistics & Economic Research
12
Dimensions - Measuring Georgia's Labor Force
Unemployment rates -- Georgia and U.S.
11.0%
10.0%
9.0%
8.0%
7.0%
Ge orgia
U.S.
6.0%
Jan Feb Mar Apr May Jun Jul Aug Sep Oct Nov Dec Jan
2011
2012
WA 8.3
OR
8.8
ID
8.1
NV
12.7
UT
CA
5.7
10.9
AZ 8.7
AK 7.2
State unemployment rates
January 2012
National Unemployment Rate: 8.3% Rates are seasonally adjusted
MT 6.5
WY 5.5
CO 7.8
NM 7.0
HI 6.5
ND 3.2
SD 4.2
NE 4.0
KS 6.1
MN 5.6
WI 6.9
IA 5.4
IL 9.4
MO 7.5
OK 6.1
TX 7.3
AR 7.6
MS 9.9
LA 6.9
NH
5.2 ME
VT
7.0
5.0
MI 9.0
OH
IN
7.7
8.7
KY 8.8
TN 8.2
PA 7.6
WV
7.4
VA
5.8
NC 10.2
SC 9.3
AL
GA
7.8
9.2
FL 9.6
MA 6.9 NY 8.3
RI 10.9
CT NJ 8.0 9.0
DE 7.0 DC 9.9
MD 6.5
Unemployment rate 10.0% or greater 7.0% to 9.9% 6.0% to 6.9% 5.0% to 5.9% 4.0% to 4.9% 3.0% to 3.9%
13
Georgia Labor Force Estimates (not seasonally adjusted) Place of Residence - Persons 16 Years and Older
Georgia
(Seasonally adjusted)
Georgia
(Not Seasonally adjusted)
Albany MSA
Athens-Clarke County MSA
Atlanta MSA
Augusta-Richmond County MSA
Brunswick MSA
Columbus MSA
Dalton MSA
Gainesville MSA
Employment Status
Civilian labor force Employed Unemployed Rate
Civilian labor force Employed Unemployed Rate
Civilian labor force Employed Unemployed Rate
Civilian labor force Employed Unemployed Rate
Civilian labor force Employed Unemployed Rate
Civilian labor force Employed Unemployed Rate
Civilian labor force Employed Unemployed Rate
Civilian labor force Employed Unemployed Rate
Civilian labor force Employed Unemployed Rate
Civilian labor force Employed Unemployed Rate
JAN 2012
4,745,138 4,307,718
437,420 9.2
4,739,095 4,293,271
445,824 9.4
72,715 65,366
7,349 10.1
108,021 100,309
7,712 7.1
2,706,060 2,458,442
247,618 9.2
255,430 232,194
23,236 9.1
50,261 44,890
5,371 10.7
132,295 120,371
11,924 9.0
59,901 52,267
7,634 12.7
91,320 84,357
6,963 7.6
DEC 2011
4,740,075 4,294,720
445,355 9.4
4,749,657 4,314,451
435,206 9.2
73,336 66,132
7,204 9.8
109,240 101,640
7,600 7.0
2,710,503 2,468,133
242,370 8.9
256,957 234,084
22,873 8.9
49,810 44,616
5,194 10.4
132,956 121,278
11,678 8.8
59,839 52,499
7,340 12.3
91,280 84,392
6,888 7.5
JAN 2011
4,715,566 4,240,092
475,474 10.1
4,705,500 4,216,338
489,162 10.4
75,012 67,033
7,979 10.6
106,658 98,180 8,478 7.9
2,663,891 2,390,575
273,316 10.3
258,975 234,825
24,150 9.3
50,353 44,788
5,565 11.1
129,158 116,379
12,779 9.9
62,431 53,969
8,462 13.6
88,408 80,442
7,966 9.0
Change From
DEC 2011
JAN 2011
5,063 12,998 -7,935
29,572 67,626 -38,054
-10,562 -21,180 10,618
33,595 76,933 -43,338
-621 -766 145
-2,297 -1,667
-630
-1,219 -1,331
112
1,363 2,129 -766
-4,443 -9,691 5,248
42,169 67,867 -25,698
-1,527 -1,890
363
-3,545 -2,631
-914
451
-92
274
102
177
-194
-661 -907 246
3,137 3,992 -855
62 -232 294
-2,530 -1,702
-828
40
2,912
-35
3,915
75
-1,003
Note: MSA data are not seasonally adjusted. Employment includes nonagricultural wage and salary employment, self-employment, unpaid family and private
household workers and agricultural workers. Persons in labor disputes are counted as employed. The use of unrounded data does not imply that the numbers are exact. Georgia and Metropolitan Statistical Area data have not been seasonally adjusted.
Albany MSA: Baker, Dougherty, Lee, Terrell, and Worth counties. Athens - Clarke County MSA: Clarke, Madison, Oconee, and Oglethorpe counties. Atlanta MSA: Barrow, Bartow, Butts, Carroll, Cherokee, Clayton, Cobb, Coweta, Dawson, DeKalb, Douglas, Fayette, Forsyth, Fulton, Gwinnett, Haralson, Heard, Henry, Jasper, Lamar, Meriwether, Newton, Paulding, Pickens, Pike, Rockdale, Spalding, and Walton counties. Augusta - Richmond County MSA: Burke, Columbia, McDuffie, and Richmond counties in Georgia and Aiken and Edgefield counties in South Carolina. Brunswick MSA: Brantley, Glynn, and McIntosh counties. Columbus MSA: Chattahoochee, Harris, Marion, and Muscogee counties in Georgia and Russell County in Alabama. Dalton MSA: Murray and Whitfield counties. Gainesville MSA: Hall County. Hinesville - Fort Stewart MSA: Liberty and Long counties. Macon MSA: Bibb, Crawford, Jones, Monroe, and Twiggs counties. Rome MSA: Floyd County. Savannah MSA: Bryan, Chatham, and Effingham counties. Valdosta MSA: Brooks, Echols, Lanier, and Lowndes counties. Warner Robins MSA: Houston County.
Source: Georgia Department of Labor, Workforce Statistics & Economic Research
14
Georgia Labor Force Estimates (not seasonally adjusted) Place of Residence - Persons 16 Years and Older
Hinesville-Ft. Stewart MSA Macon MSA
Rome MSA Savannah MSA
Valdosta MSA Warner Robins MSA
Employment Status
Civilian labor force Employed Unemployed Rate
Civilian labor force Employed Unemployed Rate
Civilian labor force Employed Unemployed Rate
Civilian labor force Employed Unemployed Rate
Civilian labor force Employed Unemployed Rate
Civilian labor force Employed Unemployed Rate
JAN 2012
33,360 30,272
3,088 9.3
112,657 101,498
11,159 9.9
47,218 41,998
5,220 11.1
174,823 159,337
15,486 8.9
66,283 60,338
5,945 9.0
70,696 65,303
5,393 7.6
DEC 2011
33,343 30,299
3,044 9.1
112,944 102,193
10,751 9.5
47,004 42,072
4,932 10.5
175,141 159,879
15,262 8.7
66,082 60,303
5,779 8.7
70,547 65,330
5,217 7.4
JAN 2011
33,529 30,529
3,000 8.9
112,189 100,365
11,824 10.5
48,262 42,878
5,384 11.2
175,006 158,563
16,443 9.4
66,194 59,876
6,318 9.5
70,574 64,905
5,669 8.0
Change From
DEC 2011
JAN 2011
17
-169
-27
-257
44
88
-287 -695 408
468 1,133 -665
214
-1,044
-74
-880
288
-164
-318 -542 224
-183 774 -957
201
89
35
462
166
-373
149
122
-27
398
176
-276
United States Labor Force Estimates Place of Residence - Persons 16 Years and Older
Area
United States
(Seasonally adjusted)
Employment Status
Civilian labor force Employed Unemployed Rate
JAN 2012
154,395,000 141,637,000
12,758,000 8.3
DEC 2011
153,887,000 140,790,000
13,097,000 8.5
JAN 2011
153,250,000 139,330,000
13,919,000 9.1
Change From
DEC 2011
JAN 2011
508,000 847,000 -339,000
1,145,000 2,307,000 -1,161,000
United States
(Not Seasonally adjusted)
Civilian labor force Employed Unemployed
Rate
153,485,000 139,944,000
13,541,000 8.8
153,373,000 140,681,000
12,692,000 8.3
152,536,000 137,599,000
14,937,000 9.8
112,000 -737,000 849,000
949,000 2,345,000 -1,396,000
Note: Employment includes nonagricultural wage and salary employment, self-employment, unpaid family and private household workers and agricultural
workers. Persons in labor disputes are counted as employed. The use of unrounded data does not imply that the numbers are exact. Georgia and Metropolitan Statistical Area data have not been seasonally adjusted. Seasonally adjusted data for Georgia available upon request.
Albany MSA: Baker, Dougherty, Lee, Terrell, and Worth counties. Athens - Clarke County MSA: Clarke, Madison, Oconee, and Oglethorpe counties. Atlanta MSA: Barrow, Bartow, Butts, Carroll, Cherokee, Clayton, Cobb, Coweta, Dawson, DeKalb, Douglas, Fayette, Forsyth, Fulton, Gwinnett, Haralson, Heard, Henry, Jasper, Lamar, Meriwether, Newton, Paulding, Pickens, Pike, Rockdale, Spalding, and Walton counties. Augusta - Richmond County MSA: Burke, Columbia, McDuffie, and Richmond counties in Georgia and Aiken and Edgefield counties in South Carolina. Brunswick MSA: Brantley, Glynn, and McIntosh counties. Columbus MSA: Chattahoochee, Harris, Marion, and Muscogee counties in Georgia and Russell County in Alabama. Dalton MSA: Murray and Whitfield counties. Gainesville MSA: Hall County. Hinesville - Fort Stewart MSA: Liberty and Long counties. Macon MSA: Bibb, Crawford, Jones, Monroe, and Twiggs counties. Rome MSA: Floyd County. Savannah MSA: Bryan, Chatham, and Effingham counties. Valdosta MSA: Brooks, Echols, Lanier, and Lowndes counties. Warner Robins MSA: Houston County.
Source: Georgia Department of Labor, Workforce Statistics & Economic Research
15
Georgia Labor Force Estimates by County (not seasonally adjusted)
Georgia
Place of Residence - Persons 16 Years and Older
January 2012
December 2011
Labor Force
Employment
Unemployment Number Rate
4,739,095 4,293,271 445,824 9.4
Labor Force
Employment
Unemployment Number Rate
4,749,657 4,314,451 435,206 9.2
Appling Atkinson Bacon Baker Baldwin
9,579 3,041 4,671 1,491 17,577
8,556 2,607 4,216 1,364 15,282
1,023 10.7 434 14.3 455 9.7 127 8.5
2,295 13.1
9,629 2,952 4,697 1,500 17,566
8,653 2,601 4,257 1,380 15,388
976 10.1 351 11.9 440 9.4 120 8.0 2,178 12.4
Banks Barrow Bartow Ben Hill Berrien
10,200 34,720 49,238
6,625 7,664
9,459 31,615 44,381
5,728 6,827
741 7.3 3,105 8.9 4,857 9.9
897 13.5 837 10.9
10,366 34,732 49,357
6,710 7,737
9,678 31,740 44,556
5,828 6,912
688 6.6 2,992 8.6 4,801 9.7
882 13.1 825 10.7
Bibb Bleckley Brantley Brooks Bryan
73,564 5,317 7,705 7,561
15,413
66,139 4,651 6,799 6,846
14,141
7,425 10.1 666 12.5 906 11.8 715 9.5
1,272 8.3
73,835 5,270 7,603 7,552
15,367
66,592 4,619 6,758 6,842
14,189
7,243 9.8 651 12.4 845 11.1 710 9.4
1,178 7.7
Bulloch Burke Butts Calhoun Camden
32,093 9,620
10,153 2,275
20,536
28,880 8,458 9,040 2,026
18,565
3,213 10.0 1,162 12.1 1,113 11.0
249 10.9 1,971 9.6
31,733 9,626
10,220 2,326
20,339
28,638 8,532 9,075 2,087
18,414
3,095 9.8 1,094 11.4 1,145 11.2
239 10.3 1,925 9.5
Candler Carroll Catoosa Charlton Chatham
4,397 3,949
448 10.2
52,682 47,192 5,490 10.4
33,845 31,582 2,263 6.7
4,518 4,008
510 11.3
132,375 120,275 12,100 9.1
4,322 3,901
421 9.7
52,345 47,378 4,967 9.5
34,165 32,009 2,156 6.3
4,547 4,054
493 10.8
132,686 120,684 12,002 9.0
Chattahoochee 2,162
Chattooga
10,233
Cherokee
113,223
Clarke
65,385
Clay
1,434
1,745 9,091 104,599 60,584 1,300
417 19.3 1,142 11.2 8,624 7.6 4,801 7.3
134 9.3
2,137 10,236 113,454 66,160
1,481
1,754 9,138 105,011 61,388 1,348
383 17.9 1,098 10.7 8,443 7.4 4,772 7.2
133 9.0
Clayton Clinch Cobb Coffee Colquitt
130,577 115,437 15,140 11.6
2,628 2,335
293 11.1
373,923 342,612 31,311 8.4
15,256 13,154 2,102 13.8
19,986 18,127 1,859 9.3
130,930 115,892 15,038 11.5
2,626 2,337
289 11.0
374,113 343,963 30,150 8.1
15,135 13,124 2,011 13.3
20,089 18,307 1,782 8.9
Columbia Cook Coweta Crawford Crisp
63,049 6,333
63,323 6,169 8,933
58,763 5,569
57,860 5,553 7,792
4,286 6.8 764 12.1
5,463 8.6 616 10.0
1,141 12.8
63,545 6,407
63,389 6,155 8,989
59,275 5,650
58,088 5,591 7,870
4,270 6.7 757 11.8
5,301 8.4 564 9.2
1,119 12.4
January 2011
Labor Force
Employment
Unemployment Number Rate
4,705,500 4,216,338 489,162 10.4
9,514 3,059 4,549 1,543 18,317
8,486 2,581 4,107 1,399 15,757
1,028 10.8 478 15.6 442 9.7 144 9.3
2,560 14.0
10,093 34,438 48,925
6,990 7,905
9,266 30,743 43,155
5,972 6,904
827 8.2 3,695 10.7 5,770 11.8 1,018 14.6 1,001 12.7
73,335 5,214 7,700 7,570
15,475
65,401 4,465 6,784 6,793
14,072
7,934 10.8 749 14.4 916 11.9 777 10.3
1,403 9.1
32,170 9,761
10,135 2,223
20,198
28,744 8,543 8,790 1,977
18,145
3,426 10.6 1,218 12.5 1,345 13.3
246 11.1 2,053 10.2
4,359 52,037 33,958
4,468 132,283
3,891 45,889 31,056
3,910 119,691
468 10.7 6,148 11.8 2,902 8.5
558 12.5 12,592 9.5
2,051 10,596 111,439 64,260
1,401
1,685 9,248 101,712 59,298 1,274
366 17.8 1,348 12.7 9,727 8.7 4,962 7.7
127 9.1
128,697 2,608
367,802 15,413 19,997
112,251 2,291
333,154 13,023 17,963
16,446 12.8 317 12.2
34,648 9.4 2,390 15.5 2,034 10.2
63,682 6,656
62,166 6,130 9,453
59,353 5,760
56,263 5,491 8,160
4,329 6.8 896 13.5
5,903 9.5 639 10.4
1,293 13.7
16
Georgia Labor Force Estimates by County (not seasonally adjusted)
Dade Dawson Decatur DeKalb Dodge
Place of Residence - Persons 16 Years and Older
January 2012
Labor Force
Employment
Unemployment Number Rate
8,079 7,509
570 7.1
11,396 10,481
915 8.0
10,536 9,205 1,331 12.6
367,175 331,903 35,272 9.6
8,791 7,805
986 11.2
December 2011
Labor Force
Employment
Unemployment Number Rate
8,139
7,611
528 6.5
11,393 10,523
870 7.6
10,630 9,320 1,310 12.3
367,785 333,211 34,574 9.4
8,839
7,881
958 10.8
Dooly Dougherty Douglas Early Echols
4,547 41,878 68,568
5,304 1,983
3,891 37,225 61,999
4,835 1,840
656 14.4 4,653 11.1 6,569 9.6
469 8.8 143 7.2
4,631 42,199 68,734
5,376 1,972
4,004 37,661 62,244
4,898 1,839
627 13.5 4,538 10.8 6,490 9.4
478 8.9 133 6.7
Effingham Elbert Emanuel Evans Fannin
27,036 9,126
10,109 4,909
10,744
24,921 7,905 8,998 4,475 9,612
2,115 7.8 1,221 13.4 1,111 11.0
434 8.8 1,132 10.5
27,087 9,193
10,177 4,916
10,826
25,006 8,008 9,040 4,495 9,757
2,081 7.7 1,185 12.9 1,137 11.2
421 8.6 1,069 9.9
Fayette Floyd Forsyth Franklin Fulton
53,069 48,766 4,303 8.1 47,218 41,998 5,220 11.1 91,252 84,908 6,344 7.0 10,107 9,004 1,103 10.9 452,248 407,253 44,995 9.9
53,161 48,958 4,203 7.9 47,004 42,072 4,932 10.5 91,507 85,243 6,264 6.8 10,189 9,120 1,069 10.5 453,003 408,858 44,145 9.7
Gilmer Glascock Glynn Gordon Grady
12,440 1,127
36,807 25,168 11,938
11,053 998
32,959 22,423 11,016
1,387 11.1 129 11.4
3,848 10.5 2,745 10.9
922 7.7
12,581 1,137
36,519 25,211 12,023
11,242 1,016 32,757 22,538 11,088
1,339 10.6 121 10.6
3,762 10.3 2,673 10.6
935 7.8
Greene Gwinnett Habersham Hall Hancock
7,268 6,539
729 10.0
430,175 395,692 34,483 8.0
19,319 17,465 1,854 9.6
91,320 84,357 6,963 7.6
2,827 2,345
482 17.0
7,348
6,630
718 9.8
431,106 397,252 33,854 7.9
19,356 17,606 1,750 9.0
91,280 84,392 6,888 7.5
2,910
2,361
549 18.9
Haralson Harris Hart Heard Henry
12,861 17,434 10,248
5,117 105,461
11,596 16,151
9,103 4,564 95,832
1,265 9.8 1,283 7.4 1,145 11.2
553 10.8 9,629 9.1
12,789 17,454 10,309
5,107 105,809
11,641 16,232
9,187 4,582 96,210
1,148 9.0 1,222 7.0 1,122 10.9
525 10.3 9,599 9.1
Houston Irwin Jackson Jasper Jeff Davis
70,696 3,497
27,387 6,543 5,458
65,303 3,032
24,863 5,881 4,694
5,393 7.6 465 13.3
2,524 9.2 662 10.1 764 14.0
70,547 3,556
27,561 6,579 5,483
65,330 3,085
25,104 5,904 4,748
5,217 7.4 471 13.2
2,457 8.9 675 10.3 735 13.4
January 2011
Labor Force
Employment
Unemployment Number Rate
8,124 11,430 11,202 360,774 9,095
7,384 10,192
9,693 322,740
8,028
740 9.1 1,238 10.8 1,509 13.5 38,034 10.5 1,067 11.7
4,638 43,088 67,845
5,357 1,964
3,955 38,174 60,288
4,865 1,826
683 14.7 4,914 11.4 7,557 11.1
492 9.2 138 7.0
27,249 9,765
10,471 4,918
10,652
24,800 8,045 9,244 4,481 9,379
2,449 9.0 1,720 17.6 1,227 11.7
437 8.9 1,273 12.0
51,827 48,262 89,457 10,068 444,660
47,420 42,878 82,564
8,855 396,011
4,407 8.5 5,384 11.2 6,893 7.7 1,213 12.0 48,649 10.9
12,854 1,161
36,882 25,723 11,868
11,362 997
32,884 22,489 10,796
1,492 11.6 164 14.1
3,998 10.8 3,234 12.6 1,072 9.0
7,138 422,572
19,378 88,408
3,178
6,331 384,769
17,324 80,442
2,418
807 11.3 37,803 8.9
2,054 10.6 7,966 9.0
760 23.9
12,921 16,828 10,417
5,040 103,922
11,276 15,596
9,097 4,438 93,187
1,645 12.7 1,232 7.3 1,320 12.7
602 11.9 10,735 10.3
70,574 3,666
26,979 6,568 5,431
64,905 3,162
24,078 5,718 4,638
5,669 8.0 504 13.7
2,901 10.8 850 12.9 793 14.6
17
Georgia Labor Force Estimates by County (not seasonally adjusted)
Jefferson Jenkins Johnson Jones Lamar
Place of Residence - Persons 16 Years and Older
January 2012
December 2011
Labor Force
6,835 2,359 3,521 14,709 8,648
Employment
Unemployment Number Rate
5,965 1,940 3,122 13,327 7,666
870 12.7 419 17.8 399 11.3 1,382 9.4 982 11.4
Labor Force
6,851 2,411 3,587 14,704 8,694
Employment
Unemployment Number Rate
6,000 2,015 3,171 13,418 7,696
851 12.4 396 16.4 416 11.6 1,286 8.7 998 11.5
Lanier Laurens Lee Liberty Lincoln
4,574 21,041 15,039 25,756
3,730
4,233 18,441 13,859 23,235
3,331
341 7.5 2,600 12.4 1,180 7.8 2,521 9.8
399 10.7
4,598 21,275 15,170 25,770
3,752
4,231 18,733 14,022 23,256
3,367
367 8.0 2,542 11.9 1,148 7.6 2,514 9.8
385 10.3
Long Lowndes Lumpkin McDuffie McIntosh
7,604 52,165 12,928 10,120
5,748
7,037 47,418 11,629
9,032 5,132
567 7.5 4,747 9.1 1,299 10.0 1,088 10.8
616 10.7
7,573 51,960 12,930 10,234
5,688
7,043 47,391 11,651
9,111 5,101
530 7.0 4,569 8.8 1,279 9.9 1,123 11.0
587 10.3
Macon Madison Marion Meriwether Miller
5,083 15,854
4,074 9,318 3,465
4,340 14,638
3,729 8,217 3,248
743 14.6 1,216 7.7
345 8.5 1,101 11.8
217 6.3
5,107 15,979
4,122 9,355 3,510
4,390 14,832
3,748 8,249 3,296
717 14.0 1,147 7.2
374 9.1 1,106 11.8
214 6.1
Mitchell Monroe Montgomery Morgan Murray
9,796 14,079
4,706 9,160 17,218
8,866 12,842
4,194 8,398 14,862
930 9.5 1,237 8.8
512 10.9 762 8.3 2,356 13.7
9,908 14,081
4,732 9,231 17,223
9,003 12,929
4,224 8,444 14,928
905 9.1 1,152 8.2
508 10.7 787 8.5 2,295 13.3
Muscogee Newton Oconee Oglethorpe Paulding
85,804 48,624 18,606
8,176 72,712
77,983 43,188 17,501
7,586 66,442
7,821 9.1 5,436 11.2 1,105 5.9
590 7.2 6,270 8.6
86,123 48,687 18,818
8,283 72,887
78,373 43,358 17,733
7,687 66,704
7,750 9.0 5,329 10.9 1,085 5.8
596 7.2 6,183 8.5
Peach Pickens Pierce Pike Polk
12,300 14,638
8,415 8,362 20,273
10,873 13,275
7,609 7,576 18,336
1,427 11.6 1,363 9.3
806 9.6 786 9.4 1,937 9.6
12,175 14,624
8,358 8,377 20,273
10,854 13,327
7,585 7,606 18,351
1,321 10.9 1,297 8.9
773 9.2 771 9.2 1,922 9.5
Pulaski Putnam Quitman Rabun Randolph
4,340 9,061
914 6,388 2,829
3,924 8,045
815 5,554 2,454
416 9.6 1,016 11.2
99 10.8 834 13.1 375 13.3
4,396 9,227
921 6,436 2,856
3,981 8,166
826 5,673 2,495
415 9.4 1,061 11.5
95 10.3 763 11.9 361 12.6
January 2011
Labor Force
Employment
Unemployment Number Rate
6,783 2,451 3,612 14,550 8,504
5,843 2,009 3,143 13,178 7,455
940 13.9 442 18.0 469 13.0 1,372 9.4 1,049 12.3
4,589 21,386 15,506 25,904
3,695
4,201 18,570 14,213 23,432
3,259
388 8.5 2,816 13.2 1,293 8.3 2,472 9.5
436 11.8
7,625 52,070 12,750 10,370
5,771
7,097 47,055 11,279
9,123 5,120
528 6.9 5,015 9.6 1,471 11.5 1,247 12.0
651 11.3
5,109 15,832
3,946 9,252 3,539
4,361 14,327
3,601 7,990 3,288
748 14.6 1,505 9.5
345 8.7 1,262 13.6
251 7.1
9,842 14,010
4,736 8,965 17,952
8,852 12,698
4,214 8,096 15,346
990 10.1 1,312 9.4
522 11.0 869 9.7 2,606 14.5
83,694 47,752 18,350
8,216 71,814
75,303 41,996 17,130
7,425 64,608
8,391 10.0 5,756 12.1 1,220 6.6
791 9.6 7,206 10.0
12,311 14,614
8,550 8,299 20,485
10,787 12,908
7,668 7,367 18,262
1,524 12.4 1,706 11.7
882 10.3 932 11.2 2,223 10.9
4,445 9,854
969 6,524 2,879
3,984 8,564
844 5,590 2,541
461 10.4 1,290 13.1
125 12.9 934 14.3 338 11.7
18
Georgia Labor Force Estimates by County (not seasonally adjusted)
Richmond Rockdale Schley Screven Seminole
Spalding Stephens Stewart Sumter Talbot
Taliaferro Tattnall Taylor Telfair Terrell
Thomas Tift Toombs Towns Treutlen
Troup Turner Twiggs Union Upson
Walker Walton Ware Warren Washington
Wayne Webster Wheeler White Whitfield
Wilcox Wilkes Wilkinson Worth
Place of Residence - Persons 16 Years and Older
January 2012
December 2011
Labor Force
Employment
Unemployment Number Rate
Labor Force
Employment
Unemployment Number Rate
86,921 41,854
1,913 6,958 3,745
77,751 37,560
1,682 6,152 3,365
9,170 10.5 4,294 10.3
231 12.1 806 11.6 380 10.1
87,300 41,832
1,918 7,006 3,741
78,429 37,708
1,685 6,206 3,372
8,871 10.2 4,124 9.9
233 12.1 800 11.4 369 9.9
29,056 13,106
2,266 12,892
3,198
25,653 11,810 2,022 11,195 2,888
3,403 11.7 1,296 9.9
244 10.8 1,697 13.2
310 9.7
29,270 13,139
2,295 12,906
3,215
25,754 11,896 2,042 11,218 2,905
3,516 12.0 1,243 9.5
253 11.0 1,688 13.1
310 9.6
726 9,744 3,423 4,520 4,060
646 8,741 2,992 3,832 3,592
80 11.0 1,003 10.3
431 12.6 688 15.2 468 11.5
747 9,795 3,469 4,433 4,087
655 8,886 3,004 3,751 3,634
92 12.3 909 9.3 465 13.4 682 15.4 453 11.1
21,963 18,289 13,800
5,594 2,981
20,181 16,294 12,272
5,087 2,548
1,782 8.1 1,995 10.9 1,528 11.1
507 9.1 433 14.5
22,216 18,476 13,795
5,605 2,926
20,454 16,532 12,361
5,109 2,559
1,762 7.9 1,944 10.5 1,434 10.4
496 8.8 367 12.5
33,833 4,223 4,136 10,819 11,682
30,256 3,765 3,637 9,908
10,357
3,577 10.6 458 10.8 499 12.1 911 8.4
1,325 11.3
33,575 4,305 4,168
10,932 11,707
30,170 3,873 3,662
10,039 10,420
3,405 10.1 432 10.0 506 12.1 893 8.2
1,287 11.0
32,870 41,142 14,567
2,489 7,430
30,291 37,252 12,863
2,074 6,540
2,579 7.8 3,890 9.5 1,704 11.7
415 16.7 890 12.0
33,104 41,260 14,426
2,528 7,497
30,701 37,399 12,822
2,115 6,602
2,403 7.3 3,861 9.4 1,604 11.1
413 16.3 895 11.9
11,911 1,284 3,010 12,310 42,683
10,466 1,185 2,712 11,090
37,405
1,445 12.1 99 7.7
298 9.9 1,220 9.9 5,278 12.4
11,977 1,306 2,997 12,520 42,616
10,538 1,191 2,711 11,359
37,571
1,439 12.0 115 8.8 286 9.5
1,161 9.3 5,045 11.8
3,025 4,370 4,438 10,247
2,637 3,878 3,993 9,325
388 12.8 492 11.3 445 10.0 922 9.0
3,097 4,424 4,320 10,380
2,710 3,941 3,901 9,435
387 12.5 483 10.9 419 9.7 945 9.1
January 2011
Labor Force
Employment
Unemployment Number Rate
87,973 41,428
2,005 7,109 3,862
78,532 36,523
1,738 6,164 3,449
9,441 10.7 4,905 11.8
267 13.3 945 13.3 413 10.7
28,891 13,305
2,279 13,331
3,158
24,945 11,801
2,011 11,566 2,854
3,946 13.7 1,504 11.3
268 11.8 1,765 13.2
304 9.6
742 9,562 3,522 4,637 4,138
625 8,569 3,042 3,873 3,684
117 15.8 993 10.4 480 13.6 764 16.5 454 11.0
21,742 18,625 13,912
5,720 2,883
19,816 16,346 12,333
5,148 2,494
1,926 8.9 2,279 12.2 1,579 11.3
572 10.0 389 13.5
32,661 4,325 4,164
10,721 11,768
28,891 3,772 3,597 9,676
10,354
3,770 11.5 553 12.8 567 13.6
1,045 9.7 1,414 12.0
33,111 40,682 14,688
2,537 7,767
29,786 36,224 12,963
2,050 6,637
3,325 10.0 4,458 11.0 1,725 11.7
487 19.2 1,130 14.5
12,040 1,245 2,963
12,222 44,479
10,473 1,113 2,651
10,856 38,623
1,567 13.0 132 10.6 312 10.5
1,366 11.2 5,856 13.2
3,101 4,500 4,531 10,737
2,698 3,958 4,034 9,563
403 13.0 542 12.0 497 11.0 1,174 10.9
19
New Developments
Kroger will celebrate the grand opening of a new supermarket in Cobb County. The 93,000 square foot store is located in Smyrna on South Cobb Drive and will add approximately 100 jobs to the local area. The new store will feature a fuel center, Starbucks, bistro and in store dining, a drive-thru pharmacy, and Fifth Third Bank.
A new entertainment venue will add to the employer totals in Houston County. Rigby's Family Fun Center will offer activities for all ages in one location in Warner Robins. The opening is scheduled for April of this year and will represent an approximate investment of $4 million. The 40,000 square foot facility will feature skating, bowling, laser tag, arcade games, and a food court. The owner expects that the fun center will hire between 65 and 100 employees.
A $350 million automotive parts plant in Jackson County will give a strong boost to the local employment totals. Toyota Industries Corporation will build a plant off I-85 in Pendergrass so as to be located near the company's TD Automotive Compressor, Georgia, a related assembly plant that opened in 2004. This facility will manufacture compressors for several automakers, including Toyota, Chrysler, Ford and General Motors. When fully operational the company plans to employ 320 people.
A German auto parts manufacturer, Erdrich Umformtechnik GmbH & Company, plans to build a $39 million plant in Laurens County and hire 178 employees. The plant that will be located in Dublin will produce brake pistons and metal stampings at their first facility in the U. S. The 130,000 square foot structure's construction is scheduled to begin in May or June of this year with a completion date in March 2013. It will be located in I-16 Industrial Park. The company's main automotive clients are BMW, Mercedes and Volkswagen.
Early in 2013 a ground breaking will begin the construction of a 152,000 square foot retail store in Richmond County. The new Wal-Mart on Wrightsboro Road in Augusta will be located in the Forest Hills Shopping Center. It will be smaller than the company's other stores in total area and will not have an auto care center or a gas station. The new location is expected to create 300 full time jobs.
Cobb County will have two expansions of the same company taking place during the first half of calendar year 2012. Fresenius Medicare Care, the world's
leading company specializing in kidney therapy, will open a new billing and insurance verification center in Kennesaw. The new location will be 15,000 square feet of leased space in the Barrett Summit Office Park. The center will open with 75 to 80 employees but will eventually increase to 120. The office is scheduled to open March 1st and early in the second quarter of 2012 the company will open their fifth clinic in the county in Acworth.
A company has announced a $26 million, 72,000 square foot expansion at their facility in Floyd County. Neaton Rome, which manufactures automotive parts for Nissan and Honda, will take on 113 new employees once the addition is complete. This will mark the company's third major expansion of the facility since it opened in May of 2001. This plant produces steering wheels, airbag modules, interior and exterior trim parts, vents and outlets.
Robins Air Force Base in Houston County is benefiting from a recent contract the country of Saudi Arabia has made with Boeing. The aircraft manufacturing concern has agreed to provide the Middle East nation with 84 new F-15SA fighters. The contract also calls for an upgrade of the country's 70 existing F-15s. This part of the agreement involves the military base in Warner Robins as they have been retained for the upgrade portion of the contract. This deal will result in about 85 new jobs for contractors and civil service workers through the year 2020.
An expansion in Tift County will locate a company's North American distribution operations there. American Textile Company has made the decision to move their distribution center from Duquesne, Pa to Tifton which will create an additional 100 jobs for the local area. The center will ship mattress pads, mattress protectors and pillow protectors to their clients throughout North America.
The Atlanta Metro area will benefit from a decision to increase employment nationally by used car retailer, CarMax. The company will hire about 70 new employees at their locations in the metro area to fill both part-time and full-time positions on the day and evening shift. Most of the jobs will be in the sales and service departments, but some will be available in the purchasing department and business offices.
20
Georgia Unemployment Rates by County
January 2012
Dade
Catoosa
Murray
Fannin
Towns
Union
Rabun
Whitfield Walker
Gilmer
White Habersham
Chattooga
Gordon
Pickens
Lumpkin
Stephens
Floyd
Dawson
Banks Franklin Hart
Bartow Cherokee Forsyth
Hall
14.0% or greater 12.0% to 13.9% 9.4% to 11.9%
Jackson Madison Elbert
Polk Haralson
Paulding Cobb
Barrow Gwinnett
DeKalb
Walton
Douglas Fulton
Rockdale
Clarke Oconee
Oglethorpe Wilkes
Lincoln
Carroll
Clayton
Newton Morgan Greene Taliaferro
Columbia
Fayette
Henry
McDuffie
Coweta Heard
Spalding
Butts Jasper Putnam
Warren Hancock Glascock
Richmond
Less than 9.4%
Troup
Meriwether Pike Lamar Monroe
Jones Baldwin
Jefferson Washington
Burke
Upson
Harris
Talbot
Muscogee
Bibb Crawford
Taylor
Peach
Wilkinson Twiggs
Johnson
Jenkins Emanuel
Screven
Marion Chattahoochee
Macon
Houston Bleckley
Laurens Treutlen
Candler Bulloch
Effingham
Schley Stewart Webster Sumter Quitman
Terrell Lee Randolph
Dooly Crisp
Pulaski Wilcox
Dodge
Montgomery
Wheeler
Toombs
Telfair
Evans Tattnall
Turner
Ben Hill
Jeff Davis Appling
Long
Bryan Liberty
Chatham
Clay Calhoun Dougherty
Early
Baker
Miller
Mitchell
Worth
Irwin Tift
Coffee
Colquitt
Berrien Atkinson Cook
Seminole Decatur
Grady
Thomas
Brooks
Lanier
Clinch
Lowndes Echols
Bacon
Wayne
Pierce
Ware
Brantley
McIntosh Glynn
Charlton
Camden
Georgia's Unemployment Rate: 9.4%
(Not Seasonally Adjusted)
21
Georgia Unemployment Insurance Claims by County
County
January Average Average Initial Weekly Duration
Claims Benefit Weeks
County
January Average Average Initial Weekly Duration
Claims Benefit Weeks
County
January Average Average Initial Weekly Duration
Claims Benefit Weeks
Georgia
77,756 ....... $258 ...... 13.5
Appling
250 ...... $219 ..... 14.7
Atkinson
242 ...... $220 ....... 8.4
Bacon
97 ...... $215 ..... 11.0
Baker
23 ...... $209 ..... 13.1
Baldwin
319 ...... $186 ..... 12.9
Banks
132 ...... $230 ..... 11.9
Barrow
475 ...... $244 ..... 15.1
Bartow
1,158 ...... $237 ..... 12.7
Ben Hill
274 ...... $219 ..... 13.9
Berrien
153 ...... $208 ..... 10.3
Bibb
1,160 ...... $191 ..... 14.9
Bleckley
116 ...... $197 ..... 14.5
Brantley
160 ...... $235 ..... 14.2
Brooks
116 ...... $209 ..... 14.2
Bryan
126 ...... $246 ..... 16.5
Bulloch
502 ...... $219 ..... 12.7
Burke
289 ...... $207 ..... 12.0
Butts
210 ...... $220 ..... 15.3
Calhoun
40 ...... $198 ..... 12.8
Camden
220 ...... $238 ..... 14.5
Candler
104 ...... $210 ..... 11.7
Carroll
1,192 ...... $216 ..... 12.6
Catoosa
523 ...... $233 ..... 10.3
Charlton
59 ...... $234 ..... 17.4
Chatham
1,362 ...... $214 ..... 15.7
Chattahoochee 22 ...... $232 ..... 14.4
Chattooga
107 ...... $239 ..... 16.0
Cherokee
929 ...... $264 ..... 15.9
Clarke
546 ...... $205 ..... 13.7
Clay
37 ...... $207 ..... 11.6
Clayton
2,121 ...... $217 ..... 15.5
Clinch
81 ...... $193 ....... 8.3
Cobb
3,187 ...... $251 ..... 16.4
Coffee
767 ...... $212 ..... 10.4
Colquitt
370 ...... $206 ..... 13.6
Columbia
525 ...... $253 ..... 13.9
Cook
154 ...... $221 ..... 11.9
Coweta
1,152 ...... $230 ..... 12.7
Crawford
85 ...... $239 ..... 12.9
Crisp
217 ...... $190 ..... 14.1
Dade
71 ...... $235 ....... 9.6
Dawson
145 ...... $258 ..... 15.3
Decatur
373 ...... $205 ..... 12.4
DeKalb
4,271 ...... $230 ..... 15.8
Dodge
174 ...... $213 ..... 10.8
Dooly
124 ...... $198 ..... 12.1
Dougherty
612 ...... $186 ..... 14.6
Douglas
759 ...... $239 ..... 15.6
Early
71 ...... $231 ..... 13.9
Echols
19 ...... $240 ..... 12.9
Effingham
230 ...... $253 ..... 15.4
Elbert Emanuel Evans Fannin Fayette Floyd Forsyth Franklin Fulton Gilmer Glascock Glynn Gordon Grady Greene Gwinnett Habersham Hall Hancock Haralson Harris Hart Heard Henry Houston Irwin Jackson Jasper Jeff Davis Jefferson Jenkins Johnson Jones Lamar Lanier Laurens Lee Liberty Lincoln Long Lowndes Lumpkin Macon Madison Marion McDuffie McIntosh Meriwether Miller Mitchell Monroe Montgomery Morgan Murray
552 ...... $210 ..... 14.4 313 ...... $203 ..... 12.5
75 ...... $226 ..... 12.6 219 ...... $217 ..... 14.2 396 ...... $249 ..... 15.7 1,502 ...... $230 ..... 12.7 544 ...... $273 ..... 15.9 306 ...... $221 ..... 11.5 4,905 ...... $226 ..... 16.1 264 ...... $231 ..... 14.0
47 ...... $254 ..... 11.4 720 ...... $197 ..... 14.4 1,319 ...... $238 ....... 9.9 353 ...... $221 ..... 11.3 166 ...... $193 ..... 12.8 3,803 ...... $256 ..... 15.8 520 ...... $215 ..... 11.0 1,129 ...... $236 ..... 13.5 112 ...... $182 ..... 13.5 290 ...... $223 ..... 12.4 292 ...... $227 ..... 11.3 406 ...... $209 ..... 11.7 158 ...... $225 ..... 11.2 1,165 ...... $243 ..... 15.9 820 ...... $217 ..... 12.5 116 ...... $212 ..... 14.3 387 ...... $234 ..... 14.1 149 ...... $227 ..... 13.7 204 ...... $218 ..... 14.6 279 ...... $204 ..... 11.3 167 ...... $198 ..... 11.5
96 ...... $197 ..... 14.6 213 ...... $240 ..... 13.6 208 ...... $204 ..... 14.3
60 ...... $201 ..... 11.3 554 ...... $204 ..... 15.6 236 ...... $236 ..... 12.2 233 ...... $237 ..... 15.9
71 ...... $206 ..... 11.3 60 ...... $232 ..... 15.9 810 ...... $191 ..... 13.6 204 ...... $223 ..... 14.3 96 ...... $204 ..... 10.5 241 ...... $219 ..... 12.8 117 ...... $214 ..... 12.3 415 ...... $196 ..... 11.7 95 ...... $248 ..... 13.5 575 ...... $216 ..... 10.4 58 ...... $216 ..... 12.5 165 ...... $190 ..... 13.9 175 ...... $231 ..... 14.0 145 ...... $214 ..... 13.5 116 ...... $218 ..... 13.7 1,235 ...... $239 ....... 9.6
Note: Initial claims include intrastate initial and additional claims, as well as agent state initial and additional claims for regular UI only.
Average duration of benefits is represented in weeks. Data does not include state or federal extended benefits for those unemployed for 27 weeks or more.
22
Muscogee Newton Oconee Oglethorpe Paulding Peach Pickens Pierce Pike Polk Pulaski Putnam Quitman Rabun Randolph Richmond Rockdale Schley Screven Seminole Spalding Stephens Stewart Sumter Talbot Taliaferro Tattnall Taylor Telfair Terrell Thomas Tift Toombs Towns Treutlen Troup Turner Twiggs Union Upson Walker Walton Ware Warren Washington Wayne Webster Wheeler White Whitfield Wilcox Wilkes Wilkinson Worth
1,783 ...... $204 ..... 12.9 789 ...... $231 ..... 15.5 96 ...... $257 ..... 15.0 120 ...... $219 ..... 12.8 689 ...... $255 ..... 15.9 208 ...... $200 ..... 11.1 215 ...... $244 ..... 15.3 158 ...... $207 ..... 13.0 247 ...... $213 ..... 12.4 573 ...... $238 ..... 10.9 31 ...... $219 ..... 11.1 393 ...... $209 ..... 13.1 5 ...... $233 ..... 16.3 140 ...... $217 ..... 13.1 123 ...... $210 ..... 10.9
1,493 ...... $211 ..... 14.0 574 ...... $236 ..... 15.7 56 ...... $208 ..... 13.6 262 ...... $216 ..... 11.0 84 ...... $210 ..... 13.7 950 ...... $197 ..... 13.4 478 ...... $211 ..... 10.7 67 ...... $163 ..... 13.6 351 ...... $171 ..... 13.3 107 ...... $220 ..... 11.0 27 ...... $169 ..... 13.2 130 ...... $222 ..... 12.8 100 ...... $228 ..... 11.0 96 ...... $204 ..... 10.6 86 ...... $185 ..... 13.0 389 ...... $207 ..... 13.1 351 ...... $208 ..... 15.7 411 ...... $210 ..... 13.7 73 ...... $202 ..... 14.0 181 ...... $211 ..... 11.8
1,353 ...... $213 ..... 10.4 92 ...... $205 ..... 16.9 90 ...... $211 ..... 13.7
145 ...... $211 ..... 13.8 537 ...... $210 ..... 11.4 730 ...... $229 ....... 9.6 545 ...... $237 ..... 15.9 385 ...... $188 ..... 13.0 192 ...... $190 ..... 13.0 141 ...... $197 ..... 13.9 154 ...... $221 ..... 14.6
26 ...... $215 ..... 11.8 67 ...... $216 ..... 12.3 218 ...... $221 ..... 14.0 3,614 ...... $235 ....... 8.7 55 ...... $205 ..... 12.5 133 ...... $210 ..... 11.7 86 ...... $212 ..... 13.4 171 ...... $217 ..... 13.9
Mark Butler, Commissioner
148 Andrew Young International Boulevard, N.E. Atlanta, Georgia 30303-1751
Return Service Requested