- Collection:
- Georgia Government Publications
- Title:
- Dimensions: measuring Georgia's workforce, Vol. 37, no. 2 (Feb. 2011)
- Creator:
- Georgia. Department of Labor
- Contributor to Resource:
- Georgia. Workforce Information and Analysis
- Publisher:
- Atlanta, Ga. : Georgia Dept. of Labor, 2011-02
- Date of Original:
- 2011-02
- Subject:
- Labor market--Georgia--Statistics
Wages--Georgia--Statistics
Hours of labor--Georgia--Statistics - Location:
- United States, Georgia, 32.75042, -83.50018
- Medium:
- state government records
- Type:
- Text
- Format:
- application/pdf
- External Identifiers:
- Call Number GA L200.E46 P1 T7 37/2
- Metadata URL:
- https://dlg.galileo.usg.edu/id:dlg_ggpd_i-ga-bl200-pe46-bp1-bt7-b37-s2-belec-p-btext
- Digital Object URL:
- https://dlg.galileo.usg.edu/do:dlg_ggpd_i-ga-bl200-pe46-bp1-bt7-b37-s2-belec-p-btext
- Language:
- eng
- Holding Institution:
- University of Georgia. Map and Government Information Library
- Rights:
-

February 2011 Data
February 2011 Employment Situation
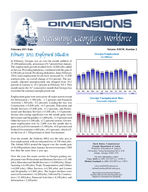
In February, Georgia saw an over the month addition of 25,100 nonfarm jobs, an increase of 0.7 percent from January. The employment growth resulted from 18,600 jobs added in Service-Providing Industries, combined with the gain of 6,500 jobs in Goods-Producing Industries. Since February 2010, total employment levels have increased by 13,400 nonfarm jobs, an overall change of 0.4 percent. The seasonally adjusted unemployment rate dropped from 10.3 percent in January to 10.2 percent in February 2011. This month marks the 41st consecutive month that Georgia has exceeded the national unemployment rate.
Employment gains were seen across all major sectors except for Information (-1,500 jobs, -1.5 percent) and Financial Activities (-300 jobs, -0.2 percent). Leading the way was Construction (+5,800 jobs, +4.5 percent), Education and Health Services (+5,800 jobs, +1.2 percent), and Professional and Business Services (+5,400 jobs, +1.0 percent). Sectors also seeing significant over the month gains were the Leisure and Hospitality (+3,600 jobs, +1.0 percent) and Other Services (+3,300 jobs, +2.2 percent) sectors. Government employment rose by 2,000 over the month due to gains in Local Government (+3,300 jobs, +0.8 percent) and Federal Government (+400 jobs, +0.4 percent), which offset the loss of 1,700 positions in State Government.
Over the month, the Valdosta MSA was the only area to lose employment with an estimated loss of 100 total jobs. The Atlanta MSA posted the largest over the month gain of 16,400 positions since January; however it remains 3,900 less than the same time a year ago.
Over the year, the major sectors in Georgia gaining employment were Professional and Business Services (+21,500 jobs), Education and Health Services (+11,800 jobs), Manufacturing (+6,100 jobs), Trade, Transportation, and Utilities (+4,800 jobs), Other Services (+4,300 jobs) and Leisure and Hospitality (+3,800 jobs). The largest declines were seen in Government (-16,200 jobs), followed by Construction (-12,400 jobs), Financial Activities (-8,100 jobs), and Information (-2,100 jobs).
Volume XXXVII, Number 2
Georgia Employment
(In Millions)
3.782
3.801
3.832
3.863
3.839
3.818
3.835
3.824
3.851
3.859
3.841
3.772
3.795
Feb Mar Apr May Jun Jul Aug Sep Oct Nov Dec Jan Feb
2010
2011
Georgia Unemployment Rate
(Seasonally Adjusted)
2010
2011
Mark Butler, Commissioner Georgia Department of Labor Workforce Information & Analysis 148 Andrew Young International Blvd., N.E.
Atlanta, Georgia 30303-1751
For more information, contact Corey Smith at (404) 232-3875 ext. 21299 or Michael Alzubaydi at (404) 232-3875 ext. 27671.
corey.smith@dol.state.ga.us michael.alzubaydi@dol.state.ga.us
Equal Opportunity Employer/Program Auxiliary Aids and Services Available upon
Request to Individuals with Disabilities
GEORGIA Nonagricultural Employment (000s)
Change in Jobs
Change in Jobs
Preliminary Revised
Revised
FEB 2011 JAN 2011 FEB 2010
from JAN 2011 Net %
from FEB 2010 Net %
Total Nonfarm
3,795.4
3,770.3
3,782.0
25.1 0.7
13.4 0.4
Total Private
3,125.7
3,102.6
3,096.1
23.1 0.7
29.6 1.0
Goods Producing
492.7
486.2
499.1
6.5 1.3
-6.4 -1.3
Service-Providing
3,302.7
3,284.1
3,282.9
18.6 0.6
19.8 0.6
Private Service-Providing
2,633.0
2,616.4
2,597.0
16.6 0.6
36.0 1.4
Mining and Logging
9.1
9.2
9.2
-0.1 -1.1
-0.1 -1.1
Construction
136.0
130.2
148.4
5.8 4.5
-12.4 -8.4
Construction of Buildings
30.3
29.5
32.0
0.8 2.7
-1.7 -5.3
Heavy and Civil Engineering Construction
20.5
19.5
22.7
1.0 5.1
-2.2 -9.7
Specialty Trade Contractors
85.2
81.2
93.7
4.0 4.9
-8.5 -9.1
Manufacturing
347.6
346.8
341.5
0.8 0.2
6.1 1.8
Durable Goods
159.6
158.6
152.4
1.0 0.6
7.2 4.7
Computer, Electrical Equip and Appliance Mfg
21.4
21.4
21.4
0.0 0.0
0.0 0.0
Transportation Equipment Manufacturing
38.3
38.1
36.0
0.2 0.5
2.3 6.4
Non-Durable Goods
188.0
188.2
189.1
-0.2 -0.1
-1.1 -0.6
Food Manufacturing
61.1
61.1
62.1
0.0 0.0
-1.0 -1.6
Textile Mills
18.8
18.8
18.7
0.0 0.0
0.1 0.5
Textile Product Mills
28.4
28.8
28.9
-0.4 -1.4
-0.5 -1.7
Trade, Transportation and Utilities
801.3
801.0
796.5
0.3 0.0
4.8 0.6
Wholesale Trade
193.6
194.1
194.5
-0.5 -0.3
-0.9 -0.5
Merchant Wholesalers, Durable Goods
96.8
96.7
96.4
0.1 0.1
0.4 0.4
Merchant Wholesalers, Non-durable Goods
56.8
56.8
58.2
0.0 0.0
-1.4 -2.4
Wholesale Electronic Markets and Agents and Brokers
40.0
40.6
39.9
-0.6 -1.5
0.1 0.3
Retail Trade
427.7
428.0
425.9
-0.3 -0.1
1.8 0.4
Food and Beverage Stores
80.2
79.8
78.6
0.4 0.5
1.6 2.0
General Merchandise Stores
98.3
98.7
96.0
-0.4 -0.4
2.3 2.4
Miscellaneous Store Retailers
19.4
19.6
19.7
-0.2 -1.0
-0.3 -1.5
Transportation, Warehousing, and Utilities
180.0
178.9
176.1
1.1 0.6
3.9 2.2
Utilities
20.1
20.1
20.2
0.0 0.0
-0.1 -0.5
Transportation and Warehousing
159.9
158.8
155.9
1.1 0.7
4.0 2.6
Air Transportation
40.0
39.2
38.6
0.8 2.0
1.4 3.6
Truck Transportation
43.4
43.3
41.6
0.1 0.2
1.8 4.3
Couriers and Messengers
18.3
18.2
18.3
0.1 0.6
0.0 0.0
Warehousing and Storage
25.9
25.8
25.9
0.1 0.4
0.0 0.0
Information
98.6
100.1
100.7
-1.5 -1.5
-2.1 -2.1
Telecommunications
49.6
49.7
50.2
-0.1 -0.2
-0.6 -1.2
Wired Telecommunications Carriers
28.1
28.2
28.4
-0.1 -0.4
-0.3 -1.1
Wireless Telecommunications Carriers
10.4
10.5
10.3
-0.1 -1.0
0.1 1.0
Internet Service Providers, Search Portals, and DP
5.0
5.0
5.9
0.0 0.0
-0.9 -15.3
Financial Activities
195.9
196.2
204.0
-0.3 -0.2
-8.1 -4.0
Finance and Insurance
143.2
142.9
149.1
0.3 0.2
-5.9 -4.0
Insurance Carriers and Related Activities
63.5
63.3
64.6
0.2 0.3
-1.1 -1.7
Real Estate, Rental and Leasing
52.7
53.3
54.9
-0.6 -1.1
-2.2 -4.0
Professional and Business Services
525.5
520.1
504.0
5.4 1.0
21.5 4.3
Professional, Scientific, and Technical Services
220.4
218.4
213.4
2.0 0.9
7.0 3.3
Accounting, Tax Preparation and Bookkeeping
39.5
38.3
37.5
1.2 3.1
2.0 5.3
Architectural, Engineering and Related Services
34.5
34.0
34.2
0.5 1.5
0.3 0.9
Computer Systems Design and Related Services
49.6
49.6
47.8
0.0 0.0
1.8 3.8
Management and Technical Consulting Services
31.1
30.4
29.9
0.7 2.3
1.2 4.0
Management of Companies and Enterprises
53.3
53.5
53.7
-0.2 -0.4
-0.4 -0.7
Admin and Support, Waste Mngmnt and Remediation
251.8
248.2
236.9
3.6 1.5
14.9 6.3
Employment Services
110.0
109.2
100.0
0.8 0.7
10.0 10.0
Educational and Health Services
494.0
488.2
482.2
5.8 1.2
11.8 2.5
Educational Services
92.7
90.1
89.6
2.6 2.9
3.1 3.5
Colleges, Universities, and Professional Schools
57.6
56.3
56.6
1.3 2.3
1.0 1.8
Health Care and Social Assistance
401.3
398.1
392.6
3.2 0.8
8.7 2.2
Ambulatory Health Care Services
152.8
151.4
149.4
1.4 0.9
3.4 2.3
Hospitals
133.2
132.0
130.2
1.2 0.9
3.0 2.3
Nursing and Residential Care Facilities
56.6
56.6
55.9
0.0 0.0
0.7 1.3
Social Assistance
58.7
58.1
57.1
0.6 1.0
1.6 2.8
Leisure and Hospitality
361.9
358.3
358.1
3.6 1.0
3.8 1.1
Arts, Entertainment, and Recreation
35.6
33.6
33.9
2.0 6.0
1.7 5.0
Amusement, Gambling, and Recreation
24.2
23.8
24.8
0.4 1.7
-0.6 -2.4
Accommodation and Food Services
326.3
324.7
324.2
1.6 0.5
2.1 0.7
Accommodation
38.1
37.8
38.8
0.3 0.8
-0.7 -1.8
Food Services and Drinking Places
288.2
286.9
285.4
1.3 0.5
2.8 1.0
Other Services
155.8
152.5
151.5
3.3 2.2
4.3 2.8
Repair and Maintenance
33.2
32.9
32.4
0.3 0.9
0.8 2.5
Personal and Laundry Services
33.9
33.6
32.4
0.3 0.9
1.5 4.6
Religious, Grantmaking, Civic, Professional and Similar
88.7
86.0
86.7
2.7 3.1
2.0 2.3
Government
669.7
667.7
685.9
2.0 0.3
-16.2 -2.4
Federal Government
102.4
102.0
103.8
0.4 0.4
-1.4 -1.4
Department of Defense
43.0
42.9
41.3
0.1 0.2
1.7 4.1
State Government
154.5
156.2
158.3
-1.7 -1.1
-3.8 -2.4
State Government Education
77.6
75.0
78.6
2.6 3.5
-1.0 -1.3
Local Government
412.8
409.5
423.8
3.3 0.8
-11.0 -2.6
Local Government Education
255.2
252.9
264.9
2.3 0.9
-9.7 -3.7
Note: These preliminary estimates were prepared in cooperation with the U.S. Department of Labor, Bureau of Labor Statistics, based upon monthly reports submitted by selected employers throughout
Georgia. The estimates include all full- and part-time wage and salary workers who were employed during or received pay for any part of the pay period that includes the twelfth of the month. Proprietors, domestic
workers, self-employed persons, unpaid family workers and personnel of the armed forces are excluded. Estimates based on 2010 benchmark.
2
Source: Georgia Department of Labor, Workforce Information & Analysis
ATLANTA MSA Nonagricultural Employment (000s)
Preliminary FEB 2011
Revised JAN 2011
Revised FEB 2010
Change in Jobs
from JAN 2011
Net
%
Change in Jobs from FEB 2010
Net %
Total Nonfarm Total Private Goods Producing Service-Providing Private Service-Providing
Mining and Logging Construction Construction of Buildings Specialty Trade Contractors Manufacturing Durable Goods Transportation Equipment Manufacturing Non-Durable Goods Food Manufacturing Trade, Transportation and Utilities Wholesale Trade Merchant Wholesalers, Durable Goods Merchant Wholesalers, Non-durable Goods Wholesale Electronic Markets andAgents and Brokers Retail Trade Food and Beverage Stores General Merchandise Stores Miscellaneous Store Retailers Transportation, Warehousing, and Utilities Utilities Transportation and Warehousing Air Transportation Truck Transportation Couriers and Messengers Information Telecommunications Wired Telecommunications Carriers Wireless Telecommunications Carriers Internet Service Providers, Search Portals, and DP Financial Activities Finance and Insurance Insurance Carriers and Related Activities Real Estate, Rental and Leasing Professional and Business Services Professional, Scientific, and Technical Services Accounting, Tax Preparation and Bookkeeping Architectural, Engineering and Related Services Computer Systems Design and Related Services Management and Technical Consulting Services Management of Companies and Enterprises Admin and Support, Waste Mngmnt and Remediation Employment Services Educational and Health Services Educational Services Health Care and Social Assistance Ambulatory Health Care Services Hospitals Social Assistance Leisure and Hospitality Arts, Entertainment, and Recreation Accommodation and Food Services Accommodation Food Services and Drinking Places Other Services Repair and Maintenance Personal and Laundry Services Government Federal Government State Government Local Government
2,228.2 1,906.4
227.9 2,000.3 1,678.5
1.3 82.0 18.7 51.9 144.6 71.8 13.6 72.8 23.6 509.1 144.2 72.6 39.0 32.6 241.0 47.4 51.8 12.3 123.9 10.6 113.3 39.0 26.0 13.8 74.3 36.8 23.4
9.0 4.7 134.5 97.4 43.3 37.1 376.4 167.3 26.4 24.0 41.2 27.5 40.3 168.8 74.3 277.9 62.1 215.8 83.6 70.7 36.7 212.7 22.9 189.8 21.2 168.6 93.6 18.4 22.2 321.8 47.8 66.5 207.5
2,211.8 1,893.3
223.9 1,987.9 1,669.4
1.3 79.3 18.5 49.9 143.3 71.4 13.7 71.9 23.7 510.0 144.2 72.6 39.0 32.6 242.4 47.5 52.4 12.4 123.4 10.6 112.8 38.7 25.9 13.9 75.8 36.9 23.4
8.9 4.7 134.5 97.0 43.4 37.5 373.1 166.4 25.6 23.9 41.4 27.3 40.3 166.4 73.4 274.3 61.1 213.2 82.5 71.0 36.4 209.8 22.1 187.7 21.0 166.7 91.9 18.2 22.1 318.5 47.5 65.3 205.7
2,232.1 1,901.9
233.5 1,998.6 1,668.4
1.3 91.4 19.4 58.0 140.8 69.7 13.2 71.1 23.1 504.7 143.4 72.3 39.0 32.1 240.0 46.8 50.6 12.8 121.3 11.1 110.2 37.9 24.6 14.5 77.2 36.4 23.3
8.4 5.5 140.8 101.2 43.8 39.6 369.6 165.4 25.4 25.0 39.5 26.5 40.1 164.1 69.6 273.5 60.2 213.3 82.9 70.8 34.9 210.6 22.5 188.1 21.9 166.2 92.0 18.6 21.7 330.2 48.3 66.2 215.7
16.4 0.7 13.1 0.7
4.0 1.8 12.4 0.6
9.1 0.6 0.0 0.0 2.7 3.4 0.2 1.1 2.0 4.0 1.3 0.9 0.4 0.6 -0.1 -0.7 0.9 1.3 -0.1 -0.4 -0.9 -0.2 0.0 0.0 0.0 0.0 0.0 0.0 0.0 0.0 -1.4 -0.6 -0.1 -0.2 -0.6 -1.2 -0.1 -0.8 0.5 0.4 0.0 0.0 0.5 0.4 0.3 0.8 0.1 0.4 -0.1 -0.7 -1.5 -2.0 -0.1 -0.3 0.0 0.0 0.1 1.1 0.0 0.0 0.0 0.0 0.4 0.4 -0.1 -0.2 -0.4 -1.1 3.3 0.9 0.9 0.5 0.8 3.1 0.1 0.4 -0.2 -0.5 0.2 0.7 0.0 0.0 2.4 1.4 0.9 1.2 3.6 1.3 1.0 1.6 2.6 1.2 1.1 1.3 -0.3 -0.4 0.3 0.8 2.9 1.4 0.8 3.6 2.1 1.1 0.2 1.0 1.9 1.1 1.7 1.9 0.2 1.1 0.1 0.5 3.3 1.0 0.3 0.6 1.2 1.8 1.8 0.9
-3.9 -0.2 4.5 0.2 -5.6 -2.4 1.7 0.1 10.1 0.6 0.0 0.0 -9.4 -10.3 -0.7 -3.6 -6.1 -10.5 3.8 2.7 2.1 3.0 0.4 3.0 1.7 2.4 0.5 2.2 4.4 0.9 0.8 0.6 0.3 0.4 0.0 0.0 0.5 1.6 1.0 0.4 0.6 1.3 1.2 2.4 -0.5 -3.9 2.6 2.1 -0.5 -4.5 3.1 2.8 1.1 2.9 1.4 5.7 -0.7 -4.8 -2.9 -3.8 0.4 1.1 0.1 0.4 0.6 7.1 -0.8 -14.6 -6.3 -4.5 -3.8 -3.8 -0.5 -1.1 -2.5 -6.3 6.8 1.8 1.9 1.2 1.0 3.9 -1.0 -4.0 1.7 4.3 1.0 3.8 0.2 0.5 4.7 2.9 4.7 6.8 4.4 1.6 1.9 3.2 2.5 1.2 0.7 0.8 -0.1 -0.1 1.8 5.2 2.1 1.0 0.4 1.8 1.7 0.9 -0.7 -3.2 2.4 1.4 1.6 1.7 -0.2 -1.1 0.5 2.3 -8.4 -2.5 -0.5 -1.0 0.3 0.5 -8.2 -3.8
Note: These preliminary estimates were prepared in cooperation with the U.S. Department of Labor, Bureau of Labor Statistics, based upon monthly reports submitted by selected employers in the Atlanta
Metropolitan Statistical Area, which includes Barrow, Bartow, Butts, Carroll, Cherokee, Clayton, Cobb, Coweta, Dawson, DeKalb, Douglas, Fayette, Forsyth, Fulton, Gwinnett, Haralson, Heard, Henry, Jasper, Lamar, Meriwether, Newton, Paulding, Pickens, Pike, Rockdale, Spalding and Walton counties. The estimates include all full- and part-time wage and salary workers who were employed during or received pay for any part of the pay period that includes the twelfth of the month. Proprietors, domestic workers, self-employed persons, unpaid family workers and personnel of the armed forces are excluded. Estimates based on 2010 benchmark.
Source: Georgia Department of Labor, Workforce Information & Analysis
3
ALBANY MSA Nonagricultural Employment (000s)
Preliminary
Revised
Revised
FEB 2011 JAN 2011 FEB 2010
Change in Jobs from JAN 2011
Net %
Change in Jobs
from FEB 2010
Net
%
Total Nonfarm Total Private
60.7
60.2
60.2
47.0
46.8
46.4
0.5 0.8 0.2 0.4
0.5 0.8 0.6 1.3
Goods Producing Service-Providing Private Service-Providing
6.7
6.7
6.9
54.0
53.5
53.3
40.3
40.1
39.5
0.0 0.0 0.5 0.9 0.2 0.5
-0.2 -2.9 0.7 1.3 0.8 2.0
Manufacturing Trade, Transportation and Utilities Retail Trade
4.3
4.4
4.3
-0.1 -2.3
11.7
11.7
12.1
0.0 0.0
7.3
7.3
7.4
0.0 0.0
0.0 0.0 -0.4 -3.3 -0.1 -1.4
Government Federal Government State Government
13.7
13.4
13.8
3.4
3.4
3.5
3.0
2.7
2.8
0.3 2.2 0.0 0.0 0.3 11.1
-0.1 -0.7 -0.1 -2.9 0.2 7.1
Local Government
7.3
7.3
7.5
0.0 0.0
-0.2 -2.7
Note: These preliminary estimates were prepared in cooperation with the U.S. Department of Labor, Bureau of Labor Statistics, based upon monthly reports submitted by selected employers in the Albany
Metropolitan Statistical Area, which includes Baker, Dougherty, Lee, Terrell and Worth counties. The estimates include all full- and part-time wage and salary workers who were employed during or received pay for any part of the pay period that includes the twelfth of the month. Proprietors, domestic workers, self-employed persons, unpaid family workers and personnel of the armed forces are excluded. Estimates
based on 2010 benchmark.
ATHENS - CLARKE MSA Nonagricultural Employment (000s)
Preliminary
Revised
Revised
FEB 2011 JAN 2011 FEB 2010
Change in Jobs
from JAN 2011
Net
%
Change in Jobs from FEB 2010
Net %
Total Nonfarm
79.8
79.3
78.9
0.5 0.6
0.9 1.1
Total Private
55.7
55.5
54.7
0.2 0.4
1.0 1.8
Goods Producing
9.1
9.2
9.3
-0.1 -1.1
-0.2 -2.2
Service-Providing
70.7
70.1
69.6
0.6 0.9
1.1 1.6
Private Service-Providing
46.6
46.3
45.4
0.3 0.7
1.2 2.6
Trade, Transportation and Utilities
12.8
12.8
12.9
0.0 0.0
-0.1 -0.8
Retail Trade
9.1
9.1
9.2
0.0 0.0
-0.1 -1.1
Professional and Business Services
6.5
6.4
6.2
0.1 1.6
0.3 4.8
Leisure and Hospitality
7.6
7.5
7.6
0.1 1.3
0.0 0.0
Government
24.1
23.8
24.2
0.3 1.3
-0.1 -0.4
Federal Government
1.5
1.5
1.6
0.0 0.0
-0.1 -6.3
State Government
14.6
14.4
14.4
0.2 1.4
0.2 1.4
Local Government
8.0
7.9
8.2
0.1 1.3
-0.2 -2.4
Note: These preliminary estimates were prepared in cooperation with the U.S. Department of Labor, Bureau of Labor Statistics, based upon monthly reports submitted by selected employers in the Athens - Clarke
County Metropolitan Statistical Area, which includes Clarke, Madison, Oconee and Oglethorpe counties. The estimates include all full- and part-time wage and salary workers who were employed during or received pay for any part of the pay period that includes the twelfth of the month. Proprietors, domestic workers, self-employed persons, unpaid family workers and personnel of the armed forces are excluded. Estimates based on 2010 benchmark.
Source: Georgia Department of Labor, Workforce Information & Analysis
4
AUGUSTA-RICHMOND MSA Nonagricultural Employment (000s)
Preliminary Revised Revised FEB 2011 JAN 2011 FEB 2010
Change in Jobs from JAN 2011
Net %
Change in Jobs from FEB 2010
Net %
Total Nonfarm Total Private Goods Producing Service-Providing Private Service-Providing Mining, Logging, and Construction Manufacturing Trade, Transportation and Utilities Wholesale Trade Retail Trade Transportation,Warehousing, and Utilities Information Financial Activitities Professional and Business Services Educational and Health Services Leisure and Hospitality Other Services Government Federal Government State Government Local Government
208.0 164.9
31.1 176.9 133.8
11.1 20.0 34.7
4.7 23.9
6.1 2.6 7.4 30.5 29.7 19.8 9.1 43.1 8.4 13.3 21.4
207.2 164.1
30.9 176.3 133.2
11.0 19.9 34.8
4.7 24.0
6.1 2.6 7.4 30.2 29.5 19.6 9.1 43.1 8.4 13.3 21.4
208.5 164.4
30.7 177.8 133.7
10.7 20.0 34.8
4.5 24.2
6.1 2.7 7.2 30.1 29.2 20.6 9.1 44.1 8.7 13.4 22.0
0.8 0.4 0.8 0.5 0.2 0.7 0.6 0.3 0.6 0.5 0.1 0.9 0.1 0.5 -0.1 -0.3 0.0 0.0 -0.1 -0.4 0.0 0.0 0.0 0.0 0.0 0.0 0.3 1.0 0.2 0.7 0.2 1.0 0.0 0.0 0.0 0.0 0.0 0.0 0.0 0.0 0.0 0.0
-0.5 -0.2 0.5 0.3 0.4 1.3 -0.9 -0.5 0.1 0.1 0.4 3.7 0.0 0.0 -0.1 -0.3 0.2 4.4 -0.3 -1.2 0.0 0.0 -0.1 -3.7 0.2 2.8 0.4 1.3 0.5 1.7 -0.8 -3.9 0.0 0.0 -1.0 -2.3 -0.3 -3.5 -0.1 -0.8 -0.6 -2.7
Note: ThesepreliminaryestimateswerepreparedincooperationwiththeU.S.DepartmentofLabor,BureauofLaborStatistics,baseduponmonthlyreportssubmittedbyselectedemployers intheAugusta- Richmond
County Metropolitan Statistical Area, which includes Burke, Columbia, McDuffie and Richmond counties in Georgia and Aiken and Edgefield counties in South Carolina. The estimates include all full- and part-time wage and salary workers who were employed during or received pay for any part of the pay period that includes the twelfth of the month. Proprietors, domestic workers, self-employed persons, unpaid family workers
and personnel of the armed forces are excluded. Estimates based on 2010 benchmark.
BRUNSWICK MSA Nonagricultural Employment (000s)
Preliminary Revised Revised FEB 2011 JAN 2011 FEB 2010
Change in Jobs from JAN 2011
Net %
Change in Jobs from FEB 2010
Net %
Total Nonfarm Total Private Goods Producing Service-Providing Private Service-Providing Trade, Transportation and Utilities Retail Trade Government Federal Government State Government Local Government
40.2
40.2
40.2
0.0 0.0
30.0
30.1
29.9
-0.1 -0.3
4.3
4.4
4.5
-0.1 -2.3
35.9
35.8
35.7
0.1 0.3
25.7
25.7
25.4
0.0 0.0
7.4
7.4
7.4
0.0 0.0
5.3
5.3
5.3
0.0 0.0
10.2
10.1
10.3
0.1 1.0
1.9
1.8
1.9
0.1 5.6
2.0
1.9
1.8
0.1 5.3
6.3
6.4
6.6
-0.1 -1.6
0.0 0.0 0.1 0.3 -0.2 -4.4 0.2 0.6 0.3 1.2 0.0 0.0 0.0 0.0 -0.1 -1.0 0.0 0.0 0.2 11.1 -0.3 -4.6
Note: These preliminary estimates were prepared in cooperation with the U.S. Department of Labor, Bureau of Labor Statistics, based upon monthly reports submitted by selected employers in the
Brunswick Metropolitan Statistical Area, which includes Brantley, Glynn and McIntosh counties. The estimates include all full- and part-time wage and salary workers who were employed during or received pay for any part of the pay period that includes the twelfth of the month. Proprietors, domestic workers, self-employed persons, unpaid family workers and personnel of the armed forces are excluded. Estimates based on 2010 benchmark.
Source: Georgia Department of Labor, Workforce Information & Analysis
5
COLUMBUS MSA Nonagricultural Employment (000s)
Preliminary Revised Revised FEB 2011 JAN 2011 FEB 2010
Change in Jobs from JAN 2011
Net %
Change in Jobs from FEB 2010
Net %
Total Nonfarm Total Private Goods Producing
116.7 93.3 14.8
115.9 92.7 14.8
115.7 91.8 14.1
0.8 0.7 0.6 0.7 0.0 0.0
1.0 0.9 1.5 1.6 0.7 5.0
Service-Providing Private Service-Providing Trade, Transportation and Utilities
101.9 78.5 18.1
101.1 77.9 18.2
101.6 77.7 17.7
0.8 0.8 0.6 0.8 -0.1 -0.6
0.3 0.3 0.8 1.0 0.4 2.3
Retail Trade Information Financial Activities
12.9
12.9
12.7
0.0 0.0
5.3
5.4
5.5
-0.1 -1.9
8.2
8.2
8.4
0.0 0.0
0.2 1.6 -0.2 -3.6 -0.2 -2.4
Finance and Insurance Insurance Carriers and Related Activities Professional and Business Services
6.4
6.4
6.8
4.4
4.4
4.5
13.6
13.5
12.7
0.0 0.0 0.0 0.0 0.1 0.7
-0.4 -5.9 -0.1 -2.2 0.9 7.1
Leisure and Hospitality Government Federal Government
12.9
12.8
12.8
23.4
23.2
23.9
5.7
5.7
6.2
0.1 0.8 0.2 0.9 0.0 0.0
0.1 0.8 -0.5 -2.1 -0.5 -8.1
State Government Local Government
4.3
4.2
4.1
13.4
13.3
13.6
0.1 2.4 0.1 0.8
0.2 4.9 -0.2 -1.5
Note: These preliminary estimates were prepared in cooperation with the U.S. Department of Labor, Bureau of Labor Statistics, based upon monthly reports submitted by selected employers in the
Columbus Metropolitan Statistical Area, which includes Chattahoochee, Harris, Marion and Muscogee counties in Georgia and Russell County in Alabama. The estimates include all full- and part-time wage and salary workers who were employed during or received pay for any part of the pay period that includes the twelfth of the month. Proprietors, domestic workers, self-employed persons, unpaid family workers and personnel of the armed forces are excluded. Estimates based on 2010 benchmark.
DALTON MSA Nonagricultural Employment (000s)
Preliminary Revised
Revised
FEB 2011 JAN 2011 FEB 2010
Change in Jobs from JAN 2011
Net %
Change in Jobs from FEB 2010
Net %
Total Nonfarm Total Private
65.8
65.0
65.3
58.7
58.0
58.2
0.8 1.2 0.7 1.2
0.5 0.8 0.5 0.9
Goods Producing
24.0
23.7
24.2
0.3 1.3
-0.2 -0.8
Service-Providing Private Service-Providing
41.8
41.3
41.1
34.7
34.3
34.0
0.5 1.2 0.4 1.2
0.7 1.7 0.7 2.1
Manufacturing
23.1
22.9
23.2
0.2 0.9
-0.1 -0.4
Textile Mills Textile Product Mills
2.6
2.6
2.7
0.0 0.0
16.1
16.2
16.3
-0.1 -0.6
-0.1 -3.7 -0.2 -1.2
Trade, Transportation and Utilities
16.0
16.0
15.5
0.0 0.0
0.5 3.2
Retail Trade Transportation, Warehouse, and Utilities
7.5
7.5
4.6
4.6
7.4
0.0 0.0
4.3
0.0 0.0
0.1 1.4 0.3 7.0
Professional and Business Services
6.8
6.7
6.2
0.1 1.5
0.6 9.7
Government Federal Government
7.1
7.0
0.3
0.3
7.1
0.1 1.4
0.3
0.0 0.0
0.0 0.0 0.0 0.0
State Government
1.3
1.2
1.1
0.1 8.3
0.2 18.2
Local Government
5.5
5.5
5.7
0.0 0.0
-0.2 -3.5
Note: These preliminary estimates were prepared in cooperation with the U.S. Department of Labor, Bureau of Labor Statistics, based upon monthly reports submitted by selected employers in the Dalton
Metropolitan Statistical Area, which includes Murray and Whitfield counties. The estimates include all full- and part-time wage and salary workers who were employed during or received pay for any part of the pay period that includes the twelfth of the month. Proprietors, domestic workers, self-employed persons, unpaid family workers and personnel of the armed forces are excluded. Estimates based on 2010 benchmark.
Source: Georgia Department of Labor, Workforce Information & Analysis
6
GAINESVILLE MSA Nonagricultural Employment (000s)
Preliminary Revised
Revised
FEB 2011 JAN 2011 FEB 2010
Change in Jobs from JAN 2011
Net %
Change in Jobs from FEB 2010
Net %
Total Nonfarm Total Private
72.3
72.0
70.6
61.8
61.6
60.0
0.3 0.4 0.2 0.3
1.7 2.4 1.8 3.0
Goods Producing
17.7
17.7
17.9
0.0 0.0
-0.2 -1.1
Service-Providing Private Service-Providing
54.6
54.3
52.7
44.1
43.9
42.1
0.3 0.6 0.2 0.5
1.9 3.6 2.0 4.8
Trade, Transportation and Utilities
13.4
13.5
13.3
-0.1 -0.7
0.1 0.8
Retail Trade Government
7.6
7.6
7.4
10.5
10.4
10.6
0.0 0.0 0.1 1.0
0.2 2.7 -0.1 -0.9
Federal Government
0.5
0.5
0.6
0.0 0.0
-0.1 -16.7
State Government Local Government
2.7
2.6
7.3
7.3
2.5
0.1 3.9
0.2 8.0
7.5
0.0 0.0
-0.2 -2.7
Note: These preliminary estimates were prepared in cooperation with the U.S. Department of Labor, Bureau of Labor Statistics, based upon monthly reports submitted by selected employers in the Gainesville
Metropolitan Statistical Area, which comprises Hall county. The estimates include all full- and part-time wage and salary workers who were employed during or received pay for any part of the pay period that includes the twelfth of the month. Proprietors, domestic workers, self-employed persons, unpaid family workers and personnel of the armed forces are excluded. Estimates based on 2010 benchmark.
HINESVILLE - FT. STEWART MSA Nonagricultural Employment (000s)
Preliminary Revised
Revised
FEB 2011 JAN 2011 FEB 2010
Change in Jobs from JAN 2011
Net %
Change in Jobs from FEB 2010
Net %
Total Nonfarm Total Private Goods Producing Service-Providing Private Service-Providing Government Federal Government State Government Local Government
19.6
19.4
19.7
11.7
11.6
11.7
2.2
2.2
2.2
17.4
17.2
17.5
9.5
9.4
9.5
7.9
7.8
8.0
4.1
4.0
4.2
0.4
0.4
0.3
3.4
3.4
3.5
0.2 1.0 0.1 0.9 0.0 0.0 0.2 1.2 0.1 1.1 0.1 1.3 0.1 2.5 0.0 0.0 0.0 0.0
-0.1 -0.5 0.0 0.0 0.0 0.0 -0.1 -0.6 0.0 0.0 -0.1 -1.3 -0.1 -2.4 0.1 33.3 -0.1 -2.9
Note: These preliminary estimates were prepared in cooperation with the U.S. Department of Labor, Bureau of Labor Statistics, based upon monthly reports submitted by selected employers in the
Hinesville - Ft. Stewart Metropolitan Statistical Area, which includes Liberty and Long counties. The estimates include all full- and part-time wage and salary workers who were employed during or received pay for any part of the pay period that includes the twelfth of the month. Proprietors, domestic workers, self-employed persons, unpaid family workers and personnel of the armed forces are excluded. Estimates based on 2010 benchmark.
Source: Georgia Department of Labor, Workforce Information & Analysis
7
MACON MSA Nonagricultural Employment (000s)
Preliminary Revised
Revised
FEB 2011 JAN 2011 FEB 2010
Change in Jobs from JAN 2011
Net %
Change in Jobs from FEB 2010
Net %
Total Nonfarm Total Private Goods Producing Service-Providing Private Service-Providing Trade Transportation and Utilities Retail Trade Transportation, Warehousing, and Utilities Financial Activities Professional and Business Services Educational and Health Services Leisure and Hospitality Government Federal Government State Government Local Government
95.3
94.9
80.7
80.4
9.3
9.3
86.0
85.6
71.4
71.1
18.6
18.7
12.0
12.1
3.2
3.2
8.4
8.4
11.6
11.3
19.2
19.1
8.1
8.1
14.6
14.5
1.2
1.2
3.4
3.3
10.0
10.0
93.8
0.4 0.4
79.0
0.3 0.4
9.8
0.0 0.0
84.0
0.4 0.5
69.2
0.3 0.4
18.6
-0.1 -0.5
12.0
-0.1 -0.8
3.2
0.0 0.0
8.3
0.0 0.0
10.4
0.3 2.7
18.9
0.1 0.5
8.4
0.0 0.0
14.8
0.1 0.7
1.3
0.0 0.0
3.4
0.1 3.0
10.1
0.0 0.0
1.5 1.6 1.7 2.2 -0.5 -5.1 2.0 2.4 2.2 3.2 0.0 0.0 0.0 0.0 0.0 0.0 0.1 1.2 1.2 11.5 0.3 1.6 -0.3 -3.6 -0.2 -1.4 -0.1 -7.7 0.0 0.0 -0.1 -1.0
Note: These preliminary estimates were prepared in cooperation with the U.S. Department of Labor, Bureau of Labor Statistics, based upon monthly reports submitted by selected employers in the Macon
Metropolitan Statistical Area, which includes Bibb, Crawford, Jones, Monroe and Twiggs counties. The estimates include all full- and part-time wage and salary workers who were employed during or received pay for any part of the pay period that includes the twelfth of the month. Proprietors, domestic workers, self-employed persons, unpaid family workers and personnel of the armed forces are excluded. Estimates based on 2010 benchmark.
ROME MSA Nonagricultural Employment (000s)
Preliminary Revised
Revised
FEB 2011 JAN 2011 FEB 2010
Change in Jobs from JAN 2011
Net %
Change in Jobs from FEB 2010
Net %
Total Nonfarm Total Private Goods Producing Service-Providing Private Service-Providing Manufacturing Trade, Transportation and Utilities Retail Trade Educational and Health Services Government Federal Government State Government Local Government
37.8
37.4
38.2
30.7
30.5
31.1
6.6
6.6
6.8
31.2
30.8
31.4
24.1
23.9
24.3
5.9
5.9
5.9
6.0
6.0
6.2
3.8
3.8
3.9
8.8
8.7
8.7
7.1
6.9
7.1
0.2
0.2
0.2
2.6
2.5
2.6
4.3
4.2
4.3
0.4 1.1 0.2 0.7 0.0 0.0 0.4 1.3 0.2 0.8 0.0 0.0 0.0 0.0 0.0 0.0 0.1 1.2 0.2 2.9 0.0 0.0 0.1 4.0 0.1 2.4
-0.4 -1.1 -0.4 -1.3 -0.2 -2.9 -0.2 -0.6 -0.2 -0.8 0.0 0.0 -0.2 -3.2 -0.1 -2.6 0.1 1.2 0.0 0.0 0.0 0.0 0.0 0.0 0.0 0.0
Note: These preliminary estimates were prepared in cooperation with the U.S. Department of Labor, Bureau of Labor Statistics, based upon monthly reports submitted by selected employers in the Rome
Metropolitan Statistical Area, which comprises Floyd county. The estimates include all full- and part-time wage and salary workers who were employed during or received pay for any part of the pay period that includes the twelfth of the month. Proprietors, domestic workers, self-employed persons, unpaid family workers and personnel of the armed forces are excluded. Estimates based on 2010 benchmark.
Source: Georgia Department of Labor, Workforce Information & Analysis
8
SAVANNAH MSA Nonagricultural Employment (000s)
Preliminary Revised
Revised
FEB 2011 JAN 2011 FEB 2010
Change in Jobs from JAN 2011
Net %
Change in Jobs from FEB 2010
Net %
Total Nonfarm Total Private
148.6 125.4
147.8 124.9
148.2 124.8
0.8 0.5 0.5 0.4
0.4 0.3 0.6 0.5
Goods Producing Service-Providing Private Service-Providing
19.5 129.1 105.9
19.4 128.4 105.5
20.0 128.2 104.8
0.1 0.5 0.7 0.6 0.4 0.4
-0.5 -2.5 0.9 0.7 1.1 1.1
Mining, Logging, and Construction Manufacturing Trade, Transportation and Utilities
5.8
5.7
13.7
13.7
32.3
32.5
6.4
0.1 1.8
13.6
0.0 0.0
31.6
-0.2 -0.6
-0.6 -9.4 0.1 0.7 0.7 2.2
Wholesale Trade Retail Trade Transportation, Warehousing, and Utilities
5.8
5.8
5.6
0.0 0.0
16.8
17.1
16.7
-0.3 -1.8
9.7
9.6
9.3
0.1 1.0
0.2 3.6 0.1 0.6 0.4 4.3
Information Financial Activities Professional and Business Services
1.5
1.5
1.9
5.3
5.3
5.6
17.5
17.4
16.6
0.0 0.0 0.0 0.0 0.1 0.6
-0.4 -21.1 -0.3 -5.4 0.9 5.4
Educational and Health Services Leisure and Hospitality Other Services
23.3
23.1
23.4
19.1
18.9
19.0
6.9
6.8
6.7
0.2 0.9 0.2 1.1 0.1 1.5
-0.1 -0.4 0.1 0.5 0.2 3.0
Government Federal Government State Government
23.2
22.9
2.9
3.0
5.8
5.5
23.4
0.3 1.3
3.1
-0.1 -3.3
5.3
0.3 5.5
-0.2 -0.9 -0.2 -6.5 0.5 9.4
Local Government
14.5
14.4
15.0
0.1 0.7
-0.5 -3.3
Note: These preliminary estimates were prepared in cooperation with the U.S. Department of Labor, Bureau of Labor Statistics, based upon monthly reports submitted by selected employers in the Savannah
Metropolitan Statistical Area, which includes Bryan, Chatham and Effingham counties. The estimates include all full- and part-time wage and salary workers who were employed during or received pay for any part of the pay period that includes the twelfth of the month. Proprietors, domestic workers, self-employed persons, unpaid family workers and personnel of the armed forces are excluded. Estimates based on 2010 benchmark.
VALDOSTA MSA Nonagricultural Employment (000s)
Preliminary Revised Revised FEB 2011 JAN 2011 FEB 2010
Change in Jobs from JAN 2011
Net %
Change in Jobs from FEB 2010
Net %
Total Nonfarm Total Private Goods Producing Service-Providing Private Service-Providing Trade, Transportation and Utilities Retail Trade Government Federal Government State Government Local Government
51.8
51.9
39.4
39.6
6.0
6.0
45.8
45.9
33.4
33.6
10.4
10.4
7.4
7.4
12.4
12.3
1.0
1.0
3.6
3.5
7.8
7.8
51.8
-0.1 -0.2
39.2
-0.2 -0.5
6.6
0.0 0.0
45.2
-0.1 -0.2
32.6
-0.2 -0.6
10.7
0.0 0.0
7.6
0.0 0.0
12.6
0.1 0.8
1.1
0.0 0.0
3.5
0.1 2.9
8.0
0.0 0.0
0.0 0.0 0.2 0.5 -0.6 -9.1 0.6 1.3 0.8 2.5 -0.3 -2.8 -0.2 -2.6 -0.2 -1.6 -0.1 -9.1 0.1 2.9 -0.2 -2.5
Note: These preliminary estimates were prepared in cooperation with the U.S. Department of Labor, Bureau of Labor Statistics, based upon monthly reports submitted by selected employers in the Valdosta
Metropolitan Statistical Area, which includes Brooks, Echols, Lanier and Lowndes counties. The estimates include all full- and part-time wage and salary workers who were employed during or received pay for any part of the pay period that includes the twelfth of the month. Proprietors, domestic workers, self-employed persons, unpaid family workers and personnel of the armed forces are excluded. Estimates based on 2010 benchmark.
Source: Georgia Department of Labor, Workforce Information & Analysis
9
WARNER ROBINS MSA Nonagricultural Employment (000s)
Preliminary Revised
Revised
FEB 2011 JAN 2011 FEB 2010
Change in Jobs from JAN 2011
Net %
Change in Jobs from FEB 2010
Net %
Total Nonfarm Total Private Goods Producing Service-Providing Private Service-Providing Trade, Transportation and Utilities Retail Trade Government Federal Government State Government Local Government
59.3
59.2
34.1
34.0
6.3
6.3
53.0
52.9
27.8
27.7
8.0
8.0
6.3
6.3
25.2
25.2
16.1
16.2
1.0
1.0
8.1
8.0
59.1
0.1 0.2
34.3
0.1 0.3
6.4
0.0 0.0
52.7
0.1 0.2
27.9
0.1 0.4
8.0
0.0 0.0
6.2
0.0 0.0
24.8
0.0 0.0
15.6
-0.1 -0.6
1.1
0.0 0.0
8.1
0.1 1.3
0.2 0.3 -0.2 -0.6 -0.1 -1.6 0.3 0.6 -0.1 -0.4 0.0 0.0 0.1 1.6 0.4 1.6 0.5 3.2 -0.1 -9.1 0.0 0.0
Note: These preliminary estimates were prepared in cooperation with the U.S. Department of Labor, Bureau of Labor Statistics, based upon monthly reports submitted by selected employers in the Warner
Robins Metropolitan Statistical Area, which comprises Houston county. The estimates include all full- and part-time wage and salary workers who were employed during or received pay for any part of the pay period that includes the twelfth of the month. Proprietors, domestic workers, self-employed persons, unpaid family workers and personnel of the armed forces are excluded. Estimates based on 2010 benchmark.
Source: Georgia Department of Labor, Workforce Information & Analysis
10
Georgia Statewide Hours and Earnings
All Employee
Average Weekly Earnings
Preliminary FEB 2011
Revised JAN 2011
Revised FEB 2010
Total Private ............................................................................................ $756.11 ........................ $750.40 ................... $728.46 Goods Producing ................................................................................ $830.88 ........................ $784.06 ................... $797.63 Private Service Providing .................................................................... $742.75 ........................ $745.08 ................... $716.02 Construction .................................................................................... $830.26 ........................ $757.86 ................... $775.80 Manufacturing ................................................................................... $811.33 ........................ $765.07 ................... $778.64 Trade, Transportation, and Utilities ................................................ $695.87 ........................ $680.40 ................... $662.45 Financial Activities ........................................................................... $858.55 ........................ $896.97 ................... $882.82 Professional and Business Services ............................................. $932.98 ........................ $942.89 ................... $943.78 Educational and Health Services ..................................................... $777.11 ........................ $788.74 ................... $775.89 Leisure and Hospitality ................................................................... $330.08 ........................ $313.72 ................... $317.42 Other Services ................................................................................. $603.41 ........................ $595.93 ................... $590.55
Average Weekly Hours
Preliminary FEB 2011
Revised JAN 2011
Revised FEB 2010
Total Private .................................................................................................. 34.7 .............................. 33.5 ......................... 34.2 Goods Producing ....................................................................................... 39.1 .............................. 35.9 ......................... 37.5 Private Service Providing ........................................................................... 33.9 .............................. 33.1 ......................... 33.6
Construction ...........................................................................................39.2 .............................. 34.0 ......................... 35.9 Manufacturing ......................................................................................... 39.5 .............................. 36.8 ......................... 38.7 Trade, Transportation, and Utilities .......................................................34.5 .............................. 33.7 ......................... 34.2 Financial Activities ..................................................................................35.0 .............................. 36.3 ......................... 35.2 Professional and Business Services ....................................................35.3 .............................. 34.2 ......................... 34.8 Educational and Health Services ........................................................... 35.1 .............................. 34.9 ......................... 34.7 Leisure and Hospitality .......................................................................... 27.1 .............................. 25.3 ......................... 26.9 Other Services ........................................................................................33.1 .............................. 31.8 ......................... 32.2
Average Hourly Earnings
Preliminary FEB 2011
Revised JAN 2011
Revised FEB 2010
Total Private ............................................................................................. $21.79 .......................... $22.40 ..................... $21.30 Goods Producing .................................................................................. $21.25 .......................... $21.84 ..................... $21.27 Private Service Providing ...................................................................... $21.91 .......................... $22.51 ..................... $21.31
Construction ...................................................................................... $21.18 .......................... $22.29 ..................... $21.61 Manufacturing .................................................................................... $20.54 .......................... $20.79 ..................... $20.12 Trade, Transportation, and Utilities .................................................. $20.17 .......................... $20.19 ..................... $19.37 Financial Activities ............................................................................. $24.53 .......................... $24.71 ..................... $25.08 Professional and Business Services ............................................... $26.43 .......................... $27.57 ..................... $27.12 Educational and Health Services ...................................................... $22.14 .......................... $22.60 ..................... $22.36 Leisure and Hospitality ..................................................................... $12.18 .......................... $12.40 ..................... $11.80 Other Services ................................................................................... $18.23 .......................... $18.74 ..................... $18.34
Read more about the hours and earnings series at http://www.bls.gov/sae/saeaepp.htm
Source: Georgia Department of Labor, Workforce Information & Analysis
11
Georgia MSA Hours and Earnings
All Employee Total Private
Average Weekly Earnings
Preliminary FEB 2011
Revised JAN 2011
Revised FEB 2010
Albany MSA ............................................................................................ $543.21 ........................ $533.81 ................... $560.63 Athens-Clarke County MSA ................................................................... $646.70 ........................ $666.88 ................... $673.38 Atlanta MSA ............................................................................................ $843.56 ........................ $833.79 ................... $824.16 Augusta-Richmond County MSA ........................................................... $746.98 ........................ $723.60 ................... $661.36 Brunswick MSA ...................................................................................... $476.01 ........................ $467.18 ................... $526.77 Columbus MSA ..................................................................................... $583.78 ........................ $586.20 ................... $591.08 Dalton MSA ............................................................................................ $557.90 ........................ $545.46 ................... $566.65 Gainesville MSA .................................................................................... $813.85 ........................ $827.64 ................... $782.98 Hinesville-Fort Stewart MSA .................................................................. $476.75 ........................ $461.65 ................... $535.09 Macon MSA ............................................................................................ $762.06 ........................ $752.92 ................... $816.35 Rome MSA ............................................................................................ $674.48 ........................ $684.05 ................... $659.18 Savannah MSA ...................................................................................... $654.36 ........................ $654.38 ................... $691.21 Valdosta MSA ......................................................................................... $513.00 ........................ $530.55 ................... $527.41 Warner Robins MSA .............................................................................. $596.49 ........................ $604.44 ................... $683.93
Average Weekly Hours
Preliminary FEB 2011
Revised JAN 2011
Revised FEB 2010
Albany MSA ................................................................................................... 34.1 .............................. 33.7 ......................... 35.8 Athens-Clarke County MSA .......................................................................... 32.4 .............................. 32.0 ......................... 32.8 Atlanta MSA ................................................................................................... 34.7 .............................. 33.1 ......................... 34.0 Augusta-Richmond County MSA .................................................................. 37.2 .............................. 36.0 ......................... 36.6 Brunswick MSA ............................................................................................. 29.9 .............................. 29.7 ......................... 32.8 Columbus MSA ............................................................................................34.0 .............................. 33.1 ......................... 33.3 Dalton MSA ................................................................................................... 35.0 .............................. 32.8 ......................... 35.0 Gainesville MSA ...........................................................................................36.3 .............................. 36.3 ......................... 35.9 Hinesville-Fort Stewart MSA .........................................................................32.3 .............................. 30.9 ......................... 36.7 Macon MSA ................................................................................................... 39.1 .............................. 38.2 ......................... 39.9 Rome MSA ................................................................................................... 34.5 .............................. 34.1 ......................... 35.1 Savannah MSA ............................................................................................. 32.8 .............................. 32.9 ......................... 34.1 Valdosta MSA ................................................................................................ 30.0 .............................. 30.3 ......................... 31.3 Warner Robins MSA .....................................................................................33.7 .............................. 33.9 ......................... 35.4
Average Hourly Earnings
Preliminary FEB 2011
Revised JAN 2011
Revised FEB 2010
Albany MSA .............................................................................................. $15.93 .......................... $15.84 ..................... $15.66 Athens-Clarke County MSA ..................................................................... $19.96 .......................... $20.84 ..................... $20.53 Atlanta MSA .............................................................................................. $24.31 .......................... $25.19 ..................... $24.24 Augusta-Richmond County MSA ............................................................. $20.08 .......................... $20.10 ..................... $18.07 Brunswick MSA ........................................................................................ $15.92 .......................... $15.73 ..................... $16.06 Columbus MSA ....................................................................................... $17.17 .......................... $17.71 ..................... $17.75 Dalton MSA .............................................................................................. $15.94 .......................... $16.63 ..................... $16.19 Gainesville MSA ...................................................................................... $22.42 .......................... $22.80 ..................... $21.81 Hinesville-Fort Stewart MSA .................................................................... $14.76 .......................... $14.94 ..................... $14.58 Macon MSA .............................................................................................. $19.49 .......................... $19.71 ..................... $20.46 Rome MSA .............................................................................................. $19.55 .......................... $20.06 ..................... $18.78 Savannah MSA ........................................................................................ $19.95 .......................... $19.89 ..................... $20.27 Valdosta MSA ........................................................................................... $17.10 .......................... $17.51 ..................... $16.85 Warner Robins MSA ................................................................................ $17.70 .......................... $17.83 ..................... $19.32
Read more about the hours and earnings series at http://www.bls.gov/sae/saeaepp.htm
Source: Georgia Department of Labor, Workforce Information & Analysis
12
Dimensions - Measuring Georgia's Labor Force
Unemployment rates -- Georgia and U.S.
11.0%
10.0%
9.0%
8.0%
7.0%
Ge orgia
U.S.
6.0%
Feb Mar Apr May Jun Jul Aug Sep Oct Nov Dec Jan Feb
2010
2011
WA 9.1
OR
10.2
ID
9.7
NV
13.6
UT
CA
7.7
12.2
AZ 9.6
AK 7.6
State unemployment rates
February 2011
National Unemployment Rate: 8.9% Rates are seasonally adjusted
MT 7.4
WY 6.2
CO 9.3
NM 8.7
ND 3.7
SD 4.8
NE 4.3
KS 6.8
MN 6.7
WI 7.4
IA 6.1
IL 8.9
MO 9.4
OK 6.5
TX 8.2
AR 7.8
MS 10.2
LA 7.9
NH
5.4 ME
VT
7.5
5.6
MI 10.4
OH
IN
9.2
8.8
KY 10.4
TN 9.6
PA 8.0
WV
9.4
VA
6.4
NC 9.7
SC 10.2
AL
GA
9.3
10.2
FL 11.5
MA 8.2 NY 8.2
RI 11.2 CT NJ 9.0 9.2 DE 8.5 DC 9.5
MD 7.1
Unemployment rate 10.0% or greater 7.0% to 9.9% 6.0% to 6.9% 5.0% to 5.9% 4.0% to 4.9% 3.0% to 3.9%
HI 6.3
13
Georgia Labor Force Estimates (not seasonally adjusted) Place of Residence - Persons 16 Years and Older
Georgia
(Seasonally adjusted)
Georgia
(Not Seasonally adjusted)
Albany MSA
Athens-Clarke County MSA
Atlanta MSA
Augusta-Richmond County MSA
Brunswick MSA
Columbus MSA
Dalton MSA
Gainesville MSA
Employment Status
Civilian labor force Employed Unemployed Rate
Civilian labor force Employed Unemployed Rate
Civilian labor force Employed Unemployed Rate
Civilian labor force Employed Unemployed Rate
Civilian labor force Employed Unemployed Rate
Civilian labor force Employed Unemployed Rate
Civilian labor force Employed Unemployed Rate
Civilian labor force Employed Unemployed Rate
Civilian labor force Employed Unemployed Rate
Civilian labor force Employed Unemployed Rate
FEB 2011
4,680,198 4,202,094
478,104 10.2
4,670,410 4,192,015
478,395 10.2
75,156 67,121
8,035 10.7
105,348 97,278 8,070 7.7
2,650,137 2,379,242
270,895 10.2
258,400 235,603
22,797 8.8
50,968 45,618
5,350 10.5
129,362 116,841 12,521
9.7
62,646 55,010
7,636 12.2
89,415 81,426
7,989 8.9
JAN 2011
4,681,475 4,197,602
483,873 10.3
4,665,370 4,178,294
487,076 10.4
75,144 67,040
8,104 10.8
105,138 96,704 8,434 8.0
2,638,760 2,364,141
274,619 10.4
258,848 235,585
23,263 9.0
51,188 45,822
5,366 10.5
128,669 116,147 12,522
9.7
62,637 54,500
8,137 13.0
89,084 81,108
7,976 9.0
FEB 2010
4,703,442 4,209,121
494,321 10.5
4,697,946 4,192,721
505,225 10.8
76,845 68,141
8,704 11.3
105,373 96,591 8,782 8.3
2,658,158 2,372,782
285,376 10.7
260,417 235,059
25,358 9.7
51,586 46,272
5,314 10.3
128,531 115,321 13,210
10.3
62,318 54,419
7,899 12.7
87,773 78,997
8,776 10.0
Change From
JAN 2011
FEB 2010
-1,277 4,492 -5,769
-23,244 -7,027
-16,217
5,040 13,721 -8,681
-27,536 -706
-26,830
12
-1,689
81
-1,020
-69
-669
210 574 -364
-25 687 -712
11,377 15,101 -3,724
-8,021 6,460 -14,481
-448 18
-466
-2,017 544
-2,561
-220 -204
-16
-618 -654
36
693
831
694
1,520
-1
-689
9 510 -501
328 591 -263
331
1,642
318
2,429
13
-787
Note: MSA data are not seasonally adjusted. Employment includes nonagricultural wage and salary employment, self-employment, unpaid family and private
household workers and agricultural workers. Persons in labor disputes are counted as employed. The use of unrounded data does not imply that the numbers are exact. Georgia and Metropolitan Statistical Area data have not been seasonally adjusted.
Albany MSA: Baker, Dougherty, Lee, Terrell, and Worth counties. Athens - Clarke County MSA: Clarke, Madison, Oconee, and Oglethorpe counties. Atlanta MSA: Barrow, Bartow, Butts, Carroll, Cherokee, Clayton, Cobb, Coweta, Dawson, DeKalb, Douglas, Fayette, Forsyth, Fulton, Gwinnett, Haralson, Heard, Henry, Jasper, Lamar, Meriwether, Newton, Paulding, Pickens, Pike, Rockdale, Spalding, and Walton counties. Augusta - Richmond County MSA: Burke, Columbia, McDuffie, and Richmond counties in Georgia and Aiken and Edgefield counties in South Carolina. Brunswick MSA: Brantley, Glynn, and McIntosh counties. Columbus MSA: Chattahoochee, Harris, Marion, and Muscogee counties in Georgia and Russell County in Alabama. Dalton MSA: Murray and Whitfield counties. Gainesville MSA: Hall County. Hinesville - Fort Stewart MSA: Liberty and Long counties. Macon MSA: Bibb, Crawford, Jones, Monroe, and Twiggs counties. Rome MSA: Floyd County. Savannah MSA: Bryan, Chatham, and Effingham counties. Valdosta MSA: Brooks, Echols, Lanier, and Lowndes counties. Warner Robins MSA: Houston County.
Source: Georgia Department of Labor, Workforce Information & Analysis
14
Georgia Labor Force Estimates (not seasonally adjusted) Place of Residence - Persons 16 Years and Older
Hinesville-Ft. Stewart MSA Macon MSA
Rome MSA Savannah MSA
Valdosta MSA Warner Robins MSA
Employment Status
Civilian labor force Employed Unemployed Rate
Civilian labor force Employed Unemployed Rate
Civilian labor force Employed Unemployed Rate
Civilian labor force Employed Unemployed Rate
Civilian labor force Employed Unemployed Rate
Civilian labor force Employed Unemployed Rate
FEB 2011
32,766 29,881
2,885 8.8
112,395 100,834
11,561 10.3
47,857 42,729
5,128 10.7
175,094 159,268
15,826 9.0
66,112 60,066
6,046 9.1
71,407 65,842
5,565 7.8
JAN 2011
32,813 29,874
2,939 9.0
112,450 100,729
11,721 10.4
47,702 42,401
5,301 11.1
174,655 158,537
16,118 9.2
66,552 60,442
6,110 9.2
71,408 65,831
5,577 7.8
FEB 2010
32,616 29,751
2,865 8.8
111,795 99,617 12,178
10.9
49,443 44,136
5,307 10.7
174,940 158,913
16,027 9.2
66,850 60,727
6,123 9.2
70,504 64,862
5,642 8.0
Change From
JAN 2011
FEB 2010
-47
150
7
130
-54
20
-55 105 -160
600 1,217 -617
155 328 -173
-1,586 -1,407
-179
439 731 -292
154 355 -201
-440 -376
-64
-738 -661
-77
-1
903
11
980
-12
-77
United States Labor Force Estimates Place of Residence - Persons 16 Years and Older
Area
United States
(Seasonally adjusted)
Employment Status
Civilian labor force Employed Unemployed Rate
FEB 2011
153,246,000 139,573,000
13,673,000 8.9
JAN 2011
153,186,000 139,323,000
13,863,000 9.0
FEB 2010
153,512,000 138,641,000
14,871,000 9.7
Change From
JAN 2011
FEB 2010
60,000 250,000 -190,000
-266,000 932,000 -1,198,000
United States
(Not Seasonally adjusted)
Civilian labor force Employed Unemployed
Rate
152,635,000 138,093,000
14,542,000 9.5
152,536,000 137,599,000
14,937,000 9.8
153,194,000 137,203,000
15,991,000 10.4
99,000 494,000 -395,000
-559,000 890,000 -1,449,000
Note: Employment includes nonagricultural wage and salary employment, self-employment, unpaid family and private household workers and agricultural
workers. Persons in labor disputes are counted as employed. The use of unrounded data does not imply that the numbers are exact. Georgia and Metropolitan Statistical Area data have not been seasonally adjusted. Seasonally adjusted data for Georgia available upon request.
Albany MSA: Baker, Dougherty, Lee, Terrell, and Worth counties. Athens - Clarke County MSA: Clarke, Madison, Oconee, and Oglethorpe counties. Atlanta MSA: Barrow, Bartow, Butts, Carroll, Cherokee, Clayton, Cobb, Coweta, Dawson, DeKalb, Douglas, Fayette, Forsyth, Fulton, Gwinnett, Haralson, Heard, Henry, Jasper, Lamar, Meriwether, Newton, Paulding, Pickens, Pike, Rockdale, Spalding, and Walton counties. Augusta - Richmond County MSA: Burke, Columbia, McDuffie, and Richmond counties in Georgia and Aiken and Edgefield counties in South Carolina. Brunswick MSA: Brantley, Glynn, and McIntosh counties. Columbus MSA: Chattahoochee, Harris, Marion, and Muscogee counties in Georgia and Russell County in Alabama. Dalton MSA: Murray and Whitfield counties. Gainesville MSA: Hall County. Hinesville - Fort Stewart MSA: Liberty and Long counties. Macon MSA: Bibb, Crawford, Jones, Monroe, and Twiggs counties. Rome MSA: Floyd County. Savannah MSA: Bryan, Chatham, and Effingham counties. Valdosta MSA: Brooks, Echols, Lanier, and Lowndes counties. Warner Robins MSA: Houston County.
Source: Georgia Department of Labor, Workforce Information & Analysis
15
Georgia Labor Force Estimates by County (not seasonally adjusted)
Georgia
Place of Residence - Persons 16 Years and Older
February 2011
January 2011
Labor Force
Employment
Unemployment Number Rate
4,670,410 4,192,015 478,395 10.2
Labor Force
Employment
Unemployment Number Rate
4,665,370 4,178,294 487,076 10.4
Appling Atkinson Bacon Baker Baldwin
9,159 2,932 4,324 1,542 18,007
8,183 2,465 3,876 1,395 15,464
976 10.7 467 15.9 448 10.4 147 9.5 2,543 14.1
9,310 2,974 4,407 1,548 17,997
8,294 2,506 3,977 1,394 15,404
1,016 10.9 468 15.7 430 9.8 154 9.9
2,593 14.4
Banks Barrow Bartow Ben Hill Berrien
9,728 34,118 44,933 6,794 7,746
8,992 30,650 39,734
5,828 6,804
736 7.6 3,468 10.2 5,199 11.6
966 14.2 942 12.2
9,853 34,166 45,081
6,904 7,866
9,074 30,455 39,482
5,896 6,921
779 7.9 3,711 10.9 5,599 12.4 1,008 14.6
945 12.0
Bibb Bleckley Brantley Brooks Bryan
74,027 5,354 7,168 7,787
16,878
66,204 4,655 6,328 7,050
15,414
7,823 10.6 699 13.1 840 11.7 737 9.5
1,464 8.7
74,006 5,440 7,222 7,853
16,773
66,136 4,704 6,356 7,095
15,343
7,870 10.6 736 13.5 866 12.0 758 9.7
1,430 8.5
Bulloch Burke Butts Calhoun Camden
31,476 9,815 9,952 2,194
20,024
28,239 8,681 8,687 1,959 18,114
3,237 10.3 1,134 11.6 1,265 12.7
235 10.7 1,910 9.5
31,457 9,864 9,971 2,232
20,089
28,047 8,663 8,632 2,001 18,115
3,410 10.8 1,201 12.2 1,339 13.4
231 10.3 1,974 9.8
Candler Carroll Catoosa Charlton Chatham
4,081 3,631
450 11.0
51,515 45,674 5,841 11.3
34,752 31,966 2,786 8.0
4,251 3,747
504 11.9
129,921 118,006 11,915 9.2
4,126 51,512 34,451
4,303 129,704
3,670 45,384 31,555
3,767 117,465
456 11.1 6,128 11.9 2,896 8.4
536 12.5 12,239 9.4
Chattahoochee 2,651
Chattooga
10,356
Cherokee
107,418
Clarke
63,494
Clay
1,371
2,212 9,118 97,819 58,656 1,245
439 16.6 1,238 12.0 9,599 8.9 4,838 7.6
126 9.2
2,655 10,494 106,819 63,252
1,384
2,200 9,137 97,198 58,310 1,260
455 17.1 1,357 12.9 9,621 9.0 4,942 7.8
124 9.0
Clayton Clinch Cobb Coffee Colquitt
130,546 114,364 16,182 12.4
2,627 2,321
306 11.6
366,174 331,655 34,519 9.4
14,481 12,206 2,275 15.7
19,339 17,346 1,993 10.3
130,196 113,638 16,558 12.7
2,682 2,364
318 11.9
364,365 329,550 34,815 9.6
14,747 12,412 2,335 15.8
19,756 17,755 2,001 10.1
Columbia Cook Coweta Crawford Crisp
60,427 6,551
59,496 6,000 9,078
56,172 5,670
53,838 5,370 7,855
4,255 7.0 881 13.4
5,658 9.5 630 10.5
1,223 13.5
60,161 6,618
59,338 5,990 9,176
56,055 5,744
53,496 5,364 7,915
4,106 6.8 874 13.2
5,842 9.8 626 10.5
1,261 13.7
16
February 2010
Labor Force
Employment
Unemployment Number Rate
4,697,946 4,192,721 505,225 10.8
9,191 3,220 4,449 1,668 20,439
8,202 2,576 3,918 1,488 17,144
989 10.8 644 20.0 531 11.9 180 10.8 3,295 16.1
10,337 34,017 45,288
6,793 7,637
9,509 30,236 39,817
5,672 6,612
828 8.0 3,781 11.1 5,471 12.1 1,121 16.5 1,025 13.4
73,300 5,484 7,302 8,067
16,585
65,283 4,842 6,427 7,292 15,111
8,017 10.9 642 11.7 875 12.0 775 9.6
1,474 8.9
33,969 9,929 10,112 2,254
20,928
30,625 8,749 8,836 1,971
18,887
3,344 9.8 1,180 11.9 1,276 12.6
283 12.6 2,041 9.8
4,141 52,100 33,702
4,338 130,039
3,709 45,956 30,726
3,841 118,067
432 10.4 6,144 11.8 2,976 8.8
497 11.5 11,972 9.2
2,592 10,551 107,710 63,663
1,362
2,135 9,102 97,263 58,340 1,231
457 17.6 1,449 13.7 10,447 9.7 5,323 8.4
131 9.6
131,904 2,755
365,914 15,552 19,757
115,309 2,419
329,112 12,727 17,657
16,595 12.6 336 12.2
36,802 10.1 2,825 18.2 2,100 10.6
60,065 6,709
59,564 6,149 9,493
55,598 5,731
52,888 5,440 8,210
4,467 7.4 978 14.6
6,676 11.2 709 11.5
1,283 13.5
Georgia Labor Force Estimates by County (not seasonally adjusted)
Dade Dawson Decatur DeKalb Dodge
Place of Residence - Persons 16 Years and Older
February 2011
January 2011
Labor Force
Employment
Unemployment Number Rate
Labor Force
Employment
Unemployment Number Rate
8,016 7,358
658 8.2
11,003 9,867 1,136 10.3
10,455 8,963 1,492 14.3
373,340 334,084 39,256 10.5
8,572 7,594
978 11.4
7,990 7,263
727 9.1
11,039 9,804 1,235 11.2
10,640 9,126 1,514 14.2
370,794 331,963 38,831 10.5
8,673 7,673 1,000 11.5
Dooly Dougherty Douglas Early Echols
4,554 41,413 63,881
5,211 2,132
3,946 36,638 56,603
4,719 1,966
608 13.4 4,775 11.5 7,278 11.4
492 9.4 166 7.8
4,675 41,487 63,675
5,296 2,119
4,062 36,594 56,243
4,796 1,978
613 13.1 4,893 11.8 7,432 11.7
500 9.4 141 6.7
Effingham Elbert Emanuel Evans Fannin
28,294 9,386 9,691 4,677
10,556
25,848 7,947 8,559 4,215 9,366
2,446 8.6 1,439 15.3 1,132 11.7
462 9.9 1,190 11.3
28,178 9,671 9,864 4,718
10,665
25,729 7,965 8,641 4,264 9,417
2,449 8.7 1,706 17.6 1,223 12.4
454 9.6 1,248 11.7
Fayette Floyd Forsyth Franklin Fulton
49,831 45,543 4,288 8.6 47,857 42,729 5,128 10.7 85,713 78,685 7,028 8.2
9,766 8,642 1,124 11.5 476,279 426,210 50,069 10.5
49,698 45,254 4,444 8.9 47,702 42,401 5,301 11.1 85,018 78,186 6,832 8.0
9,900 8,710 1,190 12.0 473,961 423,505 50,456 10.6
Gilmer Glascock Glynn Gordon Grady
12,885 1,109
38,773 24,933 11,078
11,468 957
34,827 21,989 10,047
1,417 11.0 152 13.7
3,946 10.2 2,944 11.8 1,031 9.3
13,006 1,118
38,903 25,133 11,238
11,519 962
34,983 22,002 10,174
1,487 11.4 156 14.0
3,920 10.1 3,131 12.5 1,064 9.5
Greene Gwinnett Habersham Hall Hancock
6,966 6,195
771 11.1
407,317 370,077 37,240 9.1
19,288 17,277 2,011 10.4
89,415 81,426 7,989 8.9
3,019 2,289
730 24.2
7,056 6,255
801 11.4
405,114 367,728 37,386 9.2
19,548 17,451 2,097 10.7
89,084 81,108 7,976 9.0
3,028 2,280
748 24.7
Haralson Harris Hart Heard Henry
12,296 16,277 10,026
4,700 95,870
10,848 1,448 11.8
15,073 1,204 7.4
8,776 1,250 12.5
4,143
557 11.9
85,568 10,302 10.7
12,409 16,184 10,163
4,708 95,470
10,779 1,630 13.1
14,996 1,188 7.3
8,873 1,290 12.7
4,117
591 12.6
85,025 10,445 10.9
Houston Irwin Jackson Jasper Jeff Davis
71,407 3,797
26,995 6,312 5,109
65,842 3,275
24,132 5,502 4,352
5,565 7.8 522 13.7
2,863 10.6 810 12.8 757 14.8
71,408 3,831
27,085 6,316 5,172
65,831 3,313
24,165 5,467 4,416
5,577 7.8 518 13.5
2,920 10.8 849 13.4 756 14.6
February 2010
Labor Force
Employment
Unemployment Number Rate
7,953 10,984 11,392 376,147
8,757
7,216 9,779 9,807 336,049 7,692
737 9.3 1,205 11.0 1,585 13.9 40,098 10.7 1,065 12.2
4,570 42,546 64,125
5,276 2,141
4,058 37,297 56,714
4,704 1,952
512 11.2 5,249 12.3 7,411 11.6
572 10.8 189 8.8
28,316 10,007 10,380
4,957 10,484
25,735 8,659 9,158 4,472 9,289
2,581 9.1 1,348 13.5 1,222 11.8
485 9.8 1,195 11.4
50,854 49,443 84,505
9,923 477,298
46,124 44,136 76,972
8,643 425,074
4,730 9.3 5,307 10.7 7,533 8.9 1,280 12.9 52,224 10.9
13,166 1,111
39,100 24,365 11,200
11,669 965
35,243 21,033 10,035
1,497 11.4 146 13.1
3,857 9.9 3,332 13.7 1,165 10.4
7,278 407,128
19,710 87,773
3,311
6,353 367,252
17,539 78,997
2,577
925 12.7 39,876 9.8
2,171 11.0 8,776 10.0
734 22.2
12,573 16,191 10,007
4,839 95,510
11,054 14,886
8,604 4,190 85,202
1,519 12.1 1,305 8.1 1,403 14.0
649 13.4 10,308 10.8
70,504 3,852
26,189 6,416 5,151
64,862 3,221
23,124 5,545 4,353
5,642 8.0 631 16.4
3,065 11.7 871 13.6 798 15.5
17
Georgia Labor Force Estimates by County (not seasonally adjusted)
Jefferson Jenkins Johnson Jones Lamar
Place of Residence - Persons 16 Years and Older
February 2011
January 2011
Labor Force
6,616 2,273 3,421 14,175 7,785
Employment
Unemployment Number Rate
5,703 1,809 2,959 12,866 6,846
913 13.8 464 20.4 462 13.5 1,309 9.2 939 12.1
Labor Force
6,694 2,305 3,430 14,203 7,799
Employment
Unemployment Number Rate
5,768 1,864 2,968 12,852 6,802
926 13.8 441 19.1 462 13.5 1,351 9.5 997 12.8
Lanier Laurens Lee Liberty Lincoln
3,958 21,407 17,782 26,090
3,665
3,619 18,705 16,363 23,689
3,238
339 8.6 2,702 12.6 1,419 8.0 2,401 9.2
427 11.7
3,996 21,539 17,772 26,129
3,702
3,642 18,756 16,343 23,683
3,267
354 8.9 2,783 12.9 1,429 8.0 2,446 9.4
435 11.8
Long Lowndes Lumpkin McDuffie McIntosh
6,676 52,234 12,794 10,601
5,027
6,192 47,430 11,400
9,476 4,463
484 7.2 4,804 9.2 1,394 10.9 1,125 10.6
564 11.2
6,684 52,584 12,756 10,697
5,063
6,191 47,727 11,354
9,456 4,483
493 7.4 4,857 9.2 1,402 11.0 1,241 11.6
580 11.5
Macon Madison Marion Meriwether Miller
4,866 15,571
3,237 9,158 3,288
4,177 14,273
2,959 7,933 3,033
689 14.2 1,298 8.3
278 8.6 1,225 13.4
255 7.8
5,004 15,676
3,252 9,152 3,364
4,294 14,189
2,944 7,883 3,108
710 14.2 1,487 9.5
308 9.5 1,269 13.9
256 7.6
Mitchell Monroe Montgomery Morgan Murray
9,548 13,554
4,412 8,723 19,305
8,551 12,327
3,868 7,860 16,967
997 10.4 1,227 9.1
544 12.3 863 9.9 2,338 12.1
9,749 13,600
4,439 8,801 19,403
8,755 12,315
3,925 7,920 16,810
994 10.2 1,285 9.4
514 11.6 881 10.0 2,593 13.4
Muscogee Newton Oconee Oglethorpe Paulding
85,736 45,787 18,508
7,774 66,428
77,546 40,244 17,264
7,085 59,456
8,190 9.6 5,543 12.1 1,244 6.7
689 8.9 6,972 10.5
85,441 45,688 18,394
7,816 66,086
77,151 39,989 17,162
7,043 59,079
8,290 9.7 5,699 12.5 1,232 6.7
773 9.9 7,007 10.6
Peach Pickens Pierce Pike Polk
11,858 14,732
8,557 7,870 20,204
10,449 13,142
7,673 7,002 18,064
1,409 11.9 1,590 10.8
884 10.3 868 11.0 2,140 10.6
11,918 14,783
8,612 7,873 20,252
10,471 13,059
7,740 6,958 18,051
1,447 12.1 1,724 11.7
872 10.1 915 11.6 2,201 10.9
Pulaski Putnam Quitman Rabun Randolph
4,354 9,507
968 6,528 2,588
3,929 8,308
824 5,599 2,236
425 9.8 1,199 12.6
144 14.9 929 14.2 352 13.6
4,399 9,659
961 6,537 2,639
3,982 8,385
833 5,608 2,307
417 9.5 1,274 13.2
128 13.3 929 14.2 332 12.6
February 2010
Labor Force
Employment
Unemployment Number Rate
6,970 2,567 3,579 14,240 7,754
5,890 2,019 3,069 12,664 6,735
1,080 15.5 548 21.3 510 14.2
1,576 11.1 1,019 13.1
4,032 21,321 17,922 26,003
3,826
3,663 18,715 16,360 23,610
3,379
369 9.2 2,606 12.2 1,562 8.7 2,393 9.2
447 11.7
6,613 52,609 13,005 10,739
5,183
6,141 47,820 11,470
9,531 4,602
472 7.1 4,789 9.1 1,535 11.8 1,208 11.2
581 11.2
4,978 15,832
3,329 9,526 3,425
4,270 14,379
2,978 8,079 3,093
708 14.2 1,453 9.2
351 10.5 1,447 15.2
332 9.7
10,020 13,442
4,387 9,015 19,149
8,906 12,139
3,865 8,063 16,677
1,114 11.1 1,303 9.7
522 11.9 952 10.6 2,472 12.9
85,423 46,297 18,102
7,777 66,084
76,969 40,309 16,837
7,035 58,841
8,454 9.9 5,988 12.9 1,265 7.0
742 9.5 7,243 11.0
12,291 14,911 8,222 8,053 20,736
10,890 13,313
7,368 7,052 18,382
1,401 11.4 1,598 10.7
854 10.4 1,001 12.4 2,354 11.4
4,166 10,144
971 6,985 2,597
3,795 8,911
838 6,070 2,230
371 8.9 1,233 12.2
133 13.7 915 13.1 367 14.1
18
Georgia Labor Force Estimates by County (not seasonally adjusted)
Richmond Rockdale Schley Screven Seminole
Spalding Stephens Stewart Sumter Talbot
Taliaferro Tattnall Taylor Telfair Terrell
Thomas Tift Toombs Towns Treutlen
Troup Turner Twiggs Union Upson
Walker Walton Ware Warren Washington
Wayne Webster Wheeler White Whitfield
Wilcox Wilkes Wilkinson Worth
Place of Residence - Persons 16 Years and Older
February 2011
January 2011
Labor Force
Employment
Unemployment Number Rate
Labor Force
Employment
Unemployment Number Rate
90,460 39,396
1,726 6,730 3,824
81,305 34,740
1,492 5,818 3,396
9,155 10.1 4,656 11.8
234 13.6 912 13.6 428 11.2
90,459 39,382
1,758 6,822 3,857
81,135 34,519
1,506 5,876 3,438
9,324 10.3 4,863 12.3
252 14.3 946 13.9 419 10.9
27,922 13,321
2,224 12,946
3,000
24,144 11,928 1,982 11,244 2,744
3,778 13.5 1,393 10.5
242 10.9 1,702 13.1
256 8.5
27,914 13,375
2,229 13,073
3,030
23,991 11,890 1,999 11,357 2,744
3,923 14.1 1,485 11.1
230 10.3 1,716 13.1
286 9.4
766 8,930 3,397 4,158 4,371
655 7,964 2,948 3,486 3,864
111 14.5 966 10.8 449 13.2 672 16.2 507 11.6
779 9,198 3,435 4,157 4,332
662 8,250 2,966 3,471 3,859
117 15.0 948 10.3 469 13.7 686 16.5 473 10.9
21,089 18,117 13,396 5,547 2,913
19,169 15,842 11,876
5,009 2,493
1,920 9.1 2,275 12.6 1,520 11.3
538 9.7 420 14.4
21,187 18,357 13,625
5,578 2,916
19,231 16,064 12,053
5,006 2,517
1,956 9.2 2,293 12.5 1,572 11.5
572 10.3 399 13.7
31,797 3,980 4,638 10,845 11,332
28,147 3,417 4,067 9,865 9,928
3,650 11.5 563 14.1 571 12.3 980 9.0
1,404 12.4
31,912 4,146 4,651
10,910 11,332
28,220 3,592 4,062 9,880 9,920
3,692 11.6 554 13.4 589 12.7
1,030 9.4 1,412 12.5
31,921 40,367 14,629
2,461 7,406
28,934 36,186 12,953
2,021 6,270
2,987 9.4 4,181 10.4 1,676 11.5
440 17.9 1,136 15.3
31,794 40,434 14,761
2,519 7,451
28,562 35,956 13,065
2,039 6,331
3,232 10.2 4,478 11.1 1,696 11.5
480 19.1 1,120 15.0
11,756 1,087 2,778 11,942 43,341
10,269 976
2,469 10,655 38,043
1,487 12.6 111 10.2 309 11.1
1,287 10.8 5,298 12.2
11,808 1,133 2,812 11,969 43,234
10,267 1,014 2,508
10,646 37,690
1,541 13.1 119 10.5 304 10.8
1,323 11.1 5,544 12.8
2,883 4,308 4,411 10,048
2,492 3,783 3,921 8,860
391 13.6 525 12.2 490 11.1 1,188 11.8
2,947 4,345 4,412 10,003
2,560 3,818 3,911 8,849
387 13.1 527 12.1 501 11.4 1,154 11.5
February 2010
Labor Force
Employment
Unemployment Number Rate
91,653 39,509
1,808 7,068 3,964
82,053 34,727
1,554 6,027 3,517
9,600 10.5 4,782 12.1
254 14.0 1,041 14.7
447 11.3
28,475 13,799
2,271 14,066
3,031
24,225 12,271
2,036 12,043
2,743
4,250 14.9 1,528 11.1
235 10.3 2,023 14.4
288 9.5
807 9,087 3,584 4,625 4,405
696 8,084 3,123 3,949 3,928
111 13.8 1,003 11.0
461 12.9 676 14.6 477 10.8
20,635 18,213 13,579
5,634 2,928
18,468 15,970 11,929
5,028 2,544
2,167 10.5 2,243 12.3 1,650 12.2
606 10.8 384 13.1
30,305 4,115 4,664
11,058 11,858
26,522 3,509 4,090 9,859
10,294
3,783 12.5 606 14.7 574 12.3
1,199 10.8 1,564 13.2
31,324 40,562 14,422
2,580 7,754
28,268 36,129 12,738
2,076 6,454
3,056 9.8 4,433 10.9 1,684 11.7
504 19.5 1,300 16.8
11,993 1,072 2,854 12,010 43,169
10,494 951
2,517 10,660 37,742
1,499 12.5 121 11.3 337 11.8
1,350 11.2 5,427 12.6
3,107 4,338 4,634 10,305
2,730 3,789 4,064 9,068
377 12.1 549 12.7 570 12.3 1,237 12.0
19
New Developments
Walmart will be opening a new store in Dougherty County and has already started the initial hiring process. The new East Albany location will result in approximately 200 new jobs for the local area. There will be an actual need for 250 to 300 people at the new store, but the company is expecting 70 of the jobs to be filled by employees from the Camilla store.
Gwinnett County will be the location for the new FedEx Ground distribution center that will be their fourth such center in metro Atlanta. The company will invest $55 million to build a 215,000 square foot facility on Atlantic Avenue near Jimmy Carter Boulevard in Norcross. Eventually this location will employ 550 people with an additional 175 independent contractors. The new center is slated to open in the fall of 2012.
The first U. S. venture of a German-based company will be in Hart County. SD Automotive Group, a designer and manufacturer of precision machine tools will locate their new facility in Hartwell. The company will employ 25 workers in a 50,000 square foot plant in the Hart County Industrial Park on Highway 29. The machine tools that the company produces are marketed in the automotive manufacturing sector along with the plastics manufacturing sector.
A new military uniform distribution center has opened in Jackson County and around 25 new jobs will be created. Lion-Vallen Industries opened the 265,000 square foot facility on Bonnie Valentine Way in Pendergrass. Eventually they plan to increase their staff up to 50 to 75 workers who will distribute uniforms and equipment to virtually all American troops. This center is the primary location for U. S. Army uniforms and clothing items under a contract with the Defense Logistics Agency Troop Support.
Ingles Markets, Inc. of North Carolina will build the largest supermarket in their chain of 200 plus stores in Madison County. The company plans to start construction of the 105,000 square foot store this summer. It is located on Highway 29 in Hull and is about one-third larger than the Ingles store it is replacing. The new store is expected to add 10 to 15 more employees and include a bank and a pharmacy.
An accounting and tax software firm that also provides training and research to more than 45,000 small professional firms throughout the U. S. is expanding in Cobb County. By means of consolidating some of their offices in Florida and Maine, CCH
Small Firm Services will increase the employment at their Kennesaw location by 200. The process is expected to take approximately 18 months to complete.
By 2013 a video game developer will hire 150 new employees after they move their North American headquarters from Gwinnett County to DeKalb County. CCP Games is based in Iceland and will move its 150 existing employees to Decatur to a 40,000 square foot office on East Ponce de Leon. After the move is completed the company will begin hiring their new employees. These white collar jobs will pay about $55,000 per year.
The new venture by ZF Industries is taking shape in Hall County. The automotive parts manufacturer is branching into the clean energy market with its new subsidiary, ZF Wind Power. The new business will manufacture gear shift boxes for the wind turbines in Gainesville. Georgia's Quick Start program will assist in hiring and training the 250 employees needed to operate the company's new $96 million facility. Due to the uniqueness of this product specialized training has to be developed which is the Quick Start program's forte. It will take massive equipment to produce the 15 ton gear boxes. So, during the eight month process of setting up the plant most of the equipment will be delivered at night so as not to disrupt traffic.
In Houston County Robins Air Force Base is in the process of hiring almost 500 new employees. They are looking for aircraft maintenance personnel for the 402nd Maintenance Wing. The new hires will be working on aircraft such as the F15, C-5, C-17 and C-130.
Pratt & Whitney is adding 180 new manufacturing jobs to its Muscogee County workforce. The company is expanding their engine center in Columbus to be able to service their F117 engines that are used on the C-17 Globemaster III military cargo aircraft.
In Richmond County Swedish appliance maker, Electrolux is expanding its customer call center. The Augusta economy will benefit with the addition of 225 full time jobs by the end of 2013. The company will relocate to an existing building in National Hills Shopping Center and spend $2.5 million to modify the structure to their specifications. The new facility is expected to be ready for business in September of this year.
20
Georgia Unemployment Rates by County
February 2011
Dade
Catoosa
Murray
Fannin
Towns
Union
Rabun
Whitfield Walker
Gilmer
White Habersham
Chattooga
Gordon
Pickens
Lumpkin
Stephens
Floyd
Dawson
Banks Franklin Hart
Bartow Cherokee Forsyth
Hall
14.0% or greater 12.0% to 13.9% 10.2% to 11.9%
Jackson Madison Elbert
Polk Haralson
Paulding Cobb
Barrow Gwinnett
DeKalb
Walton
Douglas Fulton
Rockdale
Clarke Oconee
Oglethorpe Wilkes
Lincoln
Carroll
Clayton
Newton Morgan Greene Taliaferro
Columbia
Fayette
Henry
McDuffie
Coweta Heard
Spalding Butts Jasper Putnam
Warren Hancock Glascock
Richmond
Less than 10.2%
Troup
Meriwether Pike Lamar Monroe
Jones Baldwin
Jefferson Washington
Burke
Upson
Harris
Talbot
Muscogee
Bibb Crawford
Taylor
Peach
Wilkinson Twiggs
Johnson
Jenkins Emanuel
Screven
Marion Chattahoochee
Macon
Houston Bleckley
Laurens Treutlen
Candler Bulloch
Effingham
Schley Stewart Webster Sumter Quitman
Terrell Lee Randolph
Dooly Crisp
Pulaski Wilcox
Dodge
Montgomery
Wheeler
Toombs
Telfair
Evans Tattnall
Turner
Ben Hill
Jeff Davis Appling
Long
Bryan Liberty
Chatham
Clay Calhoun Dougherty
Early
Baker
Miller
Mitchell
Worth
Irwin Tift
Coffee
Colquitt
Berrien Atkinson Cook
Seminole Decatur
Grady
Thomas
Brooks
Lanier
Clinch
Lowndes Echols
Bacon
Wayne
Pierce
Ware
Brantley
McIntosh Glynn
Charlton
Camden
Georgia's Unemployment Rate: 10.2%
(Not Seasonally Adjusted)
21
Georgia Unemployment Insurance Claims by County
County
February Average Average Initial Weekly Duration
Claims Benefit Weeks
County
February Average Average Initial Weekly Duration
Claims Benefit Weeks
County
February Average Average Initial Weekly Duration
Claims Benefit Weeks
Georgia
55,576 ...... $261 ..... 14.3
Appling
166 ...... $220 ..... 14.4
Atkinson
98 ...... $202 ..... 11.2
Bacon
70 ...... $211 ..... 13.2
Baker
13 ...... $206 ..... 15.4
Baldwin
239 ...... $206 ..... 19.0
Banks
95 ...... $225 ..... 13.2
Barrow
360 ...... $249 ..... 16.4
Bartow
625 ...... $245 ..... 15.6
Ben Hill
324 ...... $163 ..... 11.4
Berrien
107 ...... $225 ..... 13.0
Bibb
846 ...... $192 ..... 16.7
Bleckley
101 ...... $241 ..... 13.7
Brantley
117 ...... $224 ..... 14.1
Brooks
77 ...... $175 ..... 15.0
Bryan
141 ...... $249 ..... 13.8
Bulloch
344 ...... $209 ..... 13.9
Burke
187 ...... $204 ..... 12.7
Butts
149 ...... $215 ..... 15.0
Calhoun
27 ...... $200 ..... 14.2
Camden
160 ...... $215 ..... 15.5
Candler
115 ...... $219 ..... 12.0
Carroll
760 ...... $218 ..... 13.3
Catoosa
273 ...... $231 ..... 11.0
Charlton
38 ...... $201 ..... 12.4
Chatham
1,061 ...... $212 ..... 14.6
Chattahoochee 19 ...... $215 ..... 15.2
Chattooga
76 ...... $227 ..... 15.7
Cherokee
982 ...... $259 ..... 16.7
Clarke
420 ...... $203 ..... 15.5
Clay
15 ...... $244 ..... 15.3
Clayton
1,697 ...... $226 ..... 16.5
Clinch
22 ...... $172 ..... 15.5
Cobb
3,219 ...... $253 ..... 17.5
Coffee
395 ...... $222 ..... 11.7
Colquitt
344 ...... $202 ..... 13.7
Columbia
321 ...... $243 ..... 14.2
Cook
122 ...... $216 ..... 14.6
Coweta
703 ...... $235 ..... 15.4
Crawford
58 ...... $233 ..... 17.0
Crisp
160 ...... $204 ..... 16.4
Dade
39 ...... $232 ..... 12.3
Dawson
122 ...... $254 ..... 15.9
Decatur
158 ...... $212 ..... 14.2
DeKalb
3,541 ...... $232 ..... 17.0
Dodge
86 ...... $224 ..... 14.9
Dooly
52 ...... $226 ..... 14.9
Dougherty
511 ...... $180 ..... 16.6
Douglas
824 ...... $244 ..... 16.8
Early
36 ...... $193 ..... 14.6
Echols
18 ...... $193 ..... 11.8
Effingham
267 ...... $251 ..... 12.0
Elbert Emanuel Evans Fannin Fayette Floyd Forsyth Franklin Fulton Gilmer Glascock Glynn Gordon Grady Greene Gwinnett Habersham Hall Hancock Haralson Harris Hart Heard Henry Houston Irwin Jackson Jasper Jeff Davis Jefferson Jenkins Johnson Jones Lamar Lanier Laurens Lee Liberty Lincoln Long Lowndes Lumpkin Macon Madison Marion McDuffie McIntosh Meriwether Miller Mitchell Monroe Montgomery Morgan Murray
286 ...... $220 ..... 11.4 242 ...... $203 ..... 13.5
62 ...... $202 ..... 13.3 150 ...... $209 ..... 12.9 281 ...... $254 ..... 17.6 996 ...... $233 ..... 13.3 561 ...... $263 ..... 17.4 155 ...... $231 ..... 13.1 4,262 ...... $227 ..... 17.2 254 ...... $237 ..... 10.8
9 ...... $235 ..... 13.2 448 ...... $199 ..... 15.2 687 ...... $246 ....... 9.8 103 ...... $214 ..... 12.6 100 ...... $182 ..... 13.9 3,552 ...... $254 ..... 17.0 390 ...... $206 ..... 10.7 1,320 ...... $235 ..... 14.1
78 ...... $182 ..... 16.5 181 ...... $231 ..... 12.7 163 ...... $218 ..... 13.4 223 ...... $226 ..... 11.2
76 ...... $239 ..... 13.3 879 ...... $249 ..... 16.7 461 ...... $219 ..... 15.8 117 ...... $183 ..... 13.7 313 ...... $238 ..... 15.2 106 ...... $224 ..... 15.2 172 ...... $222 ..... 13.5 156 ...... $182 ..... 12.3
78 ...... $194 ..... 14.7 63 ...... $189 ..... 14.6 158 ...... $223 ..... 16.7 113 ...... $190 ..... 14.6 41 ...... $195 ..... 13.5 479 ...... $213 ..... 13.5 164 ...... $234 ..... 16.2 171 ...... $203 ..... 16.8 63 ...... $233 ..... 11.6 34 ...... $214 ..... 16.0 532 ...... $188 ..... 14.1 180 ...... $222 ..... 13.1 81 ...... $187 ..... 13.9 179 ...... $232 ..... 14.1 26 ...... $216 ..... 14.2 175 ...... $188 ..... 11.4 69 ...... $212 ..... 16.2 239 ...... $213 ..... 11.4 31 ...... $203 ..... 12.9 104 ...... $181 ..... 15.8 112 ...... $237 ..... 15.9 141 ...... $211 ..... 12.2 99 ...... $218 ..... 13.7 697 ...... $247 ....... 8.3
Note: Initial claims include intrastate initial and additional claims, as well as agent state initial and additional claims for regular UI only.
Average duration of benefits is represented in weeks. Data does not include state or federal extended benefits for those unemployed for 27 weeks or more.
22
Muscogee Newton Oconee Oglethorpe Paulding Peach Pickens Pierce Pike Polk Pulaski Putnam Quitman Rabun Randolph Richmond Rockdale Schley Screven Seminole Spalding Stephens Stewart Sumter Talbot Taliaferro Tattnall Taylor Telfair Terrell Thomas Tift Toombs Towns Treutlen Troup Turner Twiggs Union Upson Walker Walton Ware Warren Washington Wayne Webster Wheeler White Whitfield Wilcox Wilkes Wilkinson Worth
919 ...... $202 ..... 13.4 622 ...... $236 ..... 15.8
91 ...... $220 ..... 16.8 64 ...... $224 ..... 14.2 707 ...... $261 ..... 16.9 118 ...... $199 ..... 16.3 199 ...... $239 ..... 14.7 156 ...... $205 ..... 12.3 97 ...... $230 ..... 14.2 341 ...... $237 ..... 12.2 46 ...... $221 ..... 15.1 256 ...... $221 ..... 13.6
6 ...... $258 ..... 11.9 102 ...... $210 ..... 14.0
49 ...... $199 ..... 11.0 946 ...... $206 ..... 14.2 508 ...... $235 ..... 16.1
23 ...... $185 ..... 16.0 141 ...... $191 ..... 12.1
26 ...... $179 ..... 15.7 424 ...... $201 ..... 14.9 236 ...... $216 ..... 11.6
28 ...... $200 ..... 13.6 179 ...... $176 ..... 14.9
44 ...... $204 ....... 9.9 8 ...... $156 ..... 12.1
107 ...... $198 ..... 13.4 54 ...... $207 ..... 13.8 51 ...... $212 ..... 14.5 59 ...... $177 ..... 16.4
196 ...... $198 ..... 15.5 235 ...... $224 ..... 17.6 419 ...... $203 ..... 12.9
47 ...... $199 ..... 16.5 83 ...... $228 ..... 12.3 465 ...... $225 ..... 11.8 70 ...... $196 ..... 16.1 64 ...... $208 ..... 14.0 151 ...... $220 ..... 14.3 134 ...... $214 ..... 13.3 296 ...... $238 ..... 10.7 401 ...... $238 ..... 15.7 419 ...... $191 ..... 12.6 68 ...... $185 ..... 13.0 120 ...... $187 ..... 16.2 170 ...... $207 ..... 15.3 13 ...... $172 ..... 15.2 45 ...... $202 ..... 13.3 167 ...... $197 ..... 13.9 1,968 ...... $240 ....... 8.0 40 ...... $208 ..... 14.7 125 ...... $190 ..... 11.7 55 ...... $185 ..... 16.8 115 ...... $212 ..... 17.6
Georgia Department of Labor Workforce Information & Analysis 148 Andrew Young International Boulevard, N.E. Atlanta, Georgia 30303-1751
Return Service Requested