- Collection:
- Georgia Government Publications
- Title:
- Dimensions: measuring Georgia's workforce, Vol. 37, no. 1 (Jan. 2011)
- Creator:
- Georgia. Department of Labor
- Contributor to Resource:
- Georgia. Workforce Information and Analysis
- Publisher:
- Atlanta, Ga. : Georgia Dept. of Labor, 2011-01
- Date of Original:
- 2011-01
- Subject:
- Labor market--Georgia--Statistics
Wages--Georgia--Statistics
Hours of labor--Georgia--Statistics - Location:
- United States, Georgia, 32.75042, -83.50018
- Medium:
- state government records
- Type:
- Text
- Format:
- application/pdf
- External Identifiers:
- Call Number GA L200.E46 P1 T7 37/1
- Metadata URL:
- https://dlg.galileo.usg.edu/id:dlg_ggpd_i-ga-bl200-pe46-bp1-bt7-b37-s1-belec-p-btext
- Digital Object URL:
- https://dlg.galileo.usg.edu/do:dlg_ggpd_i-ga-bl200-pe46-bp1-bt7-b37-s1-belec-p-btext
- Language:
- eng
- Holding Institution:
- University of Georgia. Map and Government Information Library
- Rights:
-

January 2011 Data
January 2011 Employment Situation
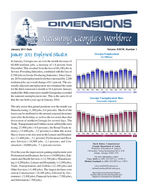
In January, Georgia saw an over the month decrease of 68,800 nonfarm jobs, a decrease of 1.8 percent from December. This resulted from the loss of 60,100 jobs in Service-Providing Industries, combined with the loss of 8,700 jobs in Goods-Producing Industries. Since January 2010, total employment levels have increased by 2,200 nonfarm jobs, an overall change of 0.1 percent. The seasonally adjusted unemployment rate remained the same for the third consecutive month at 10.4 percent. January marked the 40th consecutive month Georgia has exceeded the national unemployment rate. This is the same level that the rate held a year ago in January 2010.
The only sector that gained positions over the month was Manufacturing (1,300 jobs, 0.4 percent). Much of the losses can be attributed to the normal seasonal decreases seen after the holiday as well as the ice storm that shut down most of northern Georgia for several days. The Trade, Transportation and Utilities sector suffered the most losing 23,900 jobs (-0.8 percent), the Retail Trade industry (-15,600 jobs, -3.5 percent) is within this sector. Heavy losses were also seen in the Leisure and Hospitality (-11,600 jobs, -3.1 percent), Professional and Business Services (-10,900 jobs, -2.1 percent), and Construction (-10,000 jobs, -7.1 percent) sectors.
Over the year, the major sectors gaining employment were Professional and Business Services (+19,000 jobs), Education and Health Services (+12,700 jobs), Manufacturing (+4,200 jobs), Leisure and Hospitality (+2,300 jobs), Trade, Transportation, and Utilities (+2,100 jobs) and Other Services (+1,400 jobs). The largest declines were seen in Construction (-18,100 jobs), followed by Government (-13,100 jobs), Financial Activities (-7,500 jobs), and Information (-700 jobs).
Volume XXXVII, Number 1
Georgia Employment
(In Millions)
3.770
3.782
3.801
3.832
3.863
3.839
3.818
3.835
3.824
3.851
3.859
3.841
3.772
Jan Feb Mar Apr May Jun Jul Aug Sep Oct Nov Dec Jan
2010
2011
Georgia Unemployment Rate
(Seasonally Adjusted)
10.4%
10.4% 10.4% 10.4%
10.3%
10.3%
10.2%
10.2% 10.2%
10.1%
10.1%
10.0% 10.0%
Jan Feb Mar Apr May Jun Jul Aug Sep Oct Nov Dec Jan
2010
2011
Mark Butler, Commissioner Georgia Department of Labor Workforce Information & Analysis 148 Andrew Young International Blvd., N.E.
Atlanta, Georgia 30303-1751
For more information, contact Corey Smith at (404) 232-3875 ext. 21299 or Michael Alzubaydi at (404) 232-3875 ext. 27671.
corey.smith@dol.state.ga.us michael.alzubaydi@dol.state.ga.us
Equal Opportunity Employer/Program Auxiliary Aids and Services Available upon
Request to Individuals with Disabilities
GEORGIA Nonagricultural Employment (000s)
Change in Jobs
Change in Jobs
Preliminary Revised
Revised
JAN 2011 DEC 2010 JAN 2010
from DEC 2011 Net %
from JAN 2010 Net %
Total Nonfarm
3,772.1
3,840.9
3,769.9
-68.8 -1.8
2.2 0.1
Total Private
3,103.9
3,168.9
3,088.6
-65.0 -2.1
15.3 0.5
Goods Producing
486.0
494.7
500.0
-8.7 -1.8
-14.0 -2.8
Service-Providing
3,286.1
3,346.2
3,269.9
-60.1 -1.8
16.2 0.5
Private Service-Providing
2,617.9
2,674.2
2,588.6
-56.3 -2.1
29.3 1.1
Mining and Logging
9.2
9.2
9.3
0.0 0.0
-0.1 -1.1
Construction
130.0
140.0
148.1
-10.0 -7.1
-18.1 -12.2
Construction of Buildings
29.5
30.3
32.0
-0.8 -2.6
-2.5 -7.8
Heavy and Civil Engineering Construction
19.5
21.8
23.2
-2.3 -10.6
-3.7 -16.0
Specialty Trade Contractors
81.0
87.9
92.9
-6.9 -7.9
-11.9 -12.8
Manufacturing
346.8
345.5
342.6
1.3 0.4
4.2 1.2
Durable Goods
158.6
157.5
152.4
1.1 0.7
6.2 4.1
Computer, Electrical Equip and Appliance Mfg
21.4
21.4
21.5
0.0 0.0
-0.1 -0.5
Transportation Equipment Manufacturing
38.1
38.2
35.9
-0.1 -0.3
2.2 6.1
Non-Durable Goods
188.2
188.0
190.2
0.2 0.1
-2.0 -1.1
Food Manufacturing
61.1
62.1
62.3
-1.0 -1.6
-1.2 -1.9
Textile Mills
18.8
18.9
19.3
-0.1 -0.5
-0.5 -2.6
Textile Product Mills
28.8
28.6
29.0
0.2 0.7
-0.2 -0.7
Trade, Transportation and Utilities
801.1
825.0
799.0
-23.9 -2.9
2.1 0.3
Wholesale Trade
193.9
196.9
194.2
-3.0 -1.5
-0.3 -0.2
Merchant Wholesalers, Durable Goods
96.7
97.7
95.9
-1.0 -1.0
0.8 0.8
Merchant Wholesalers, Non-durable Goods
56.8
57.9
58.5
-1.1 -1.9
-1.7 -2.9
Wholesale Electronic Markets and Agents and Brokers
40.4
41.3
39.8
-0.9 -2.2
0.6 1.5
Retail Trade
428.0
443.6
428.6
-15.6 -3.5
-0.6 -0.1
Food and Beverage Stores
79.8
82.0
78.7
-2.2 -2.7
1.1 1.4
General Merchandise Stores
98.7
102.4
97.1
-3.7 -3.6
1.6 1.7
Miscellaneous Store Retailers
19.6
20.2
19.9
-0.6 -3.0
-0.3 -1.5
Transportation, Warehousing, and Utilities
179.2
184.5
176.2
-5.3 -2.9
3.0 1.7
Utilities
20.1
19.8
20.2
0.3 1.5
-0.1 -0.5
Transportation and Warehousing
159.1
164.7
156.0
-5.6 -3.4
3.1 2.0
Air Transportation
39.2
38.7
38.7
0.5 1.3
0.5 1.3
Truck Transportation
43.0
42.8
41.6
0.2 0.5
1.4 3.4
Couriers and Messengers
18.1
21.1
18.5
-3.0 -14.2
-0.4 -2.2
Warehousing and Storage
26.1
26.7
26.0
-0.6 -2.3
0.1 0.4
Information
100.2
101.5
100.9
-1.3 -1.3
-0.7 -0.7
Telecommunications
49.7
49.9
50.5
-0.2 -0.4
-0.8 -1.6
Wired Telecommunications Carriers
28.2
27.9
28.5
0.3 1.1
-0.3 -1.1
Wireless Telecommunications Carriers
10.5
10.6
10.5
-0.1 -0.9
0.0 0.0
Internet Service Providers, Search Portals, and DP
5.2
5.6
5.8
-0.4 -7.1
-0.6 -10.3
Financial Activities
196.8
202.1
204.3
-5.3 -2.6
-7.5 -3.7
Finance and Insurance
143.4
146.8
149.5
-3.4 -2.3
-6.1 -4.1
Insurance Carriers and Related Activities
63.3
64.4
64.8
-1.1 -1.7
-1.5 -2.3
Real Estate, Rental and Leasing
53.4
55.3
54.8
-1.9 -3.4
-1.4 -2.6
Professional and Business Services
519.2
530.1
500.2
-10.9 -2.1
19.0 3.8
Professional, Scientific, and Technical Services
218.4
215.4
211.9
3.0 1.4
6.5 3.1
Accounting, Tax Preparation and Bookkeeping
37.9
34.8
36.3
3.1 8.9
1.6 4.4
Architectural, Engineering and Related Services
34.0
34.2
34.2
-0.2 -0.6
-0.2 -0.6
Computer Systems Design and Related Services
49.5
50.3
47.5
-0.8 -1.6
2.0 4.2
Management and Technical Consulting Services
30.9
31.5
29.8
-0.6 -1.9
1.1 3.7
Management of Companies and Enterprises
53.4
53.5
53.7
-0.1 -0.2
-0.3 -0.6
Admin and Support, Waste Mngmnt and Remediation
247.4
261.2
234.6
-13.8 -5.3
12.8 5.5
Employment Services
113.4
120.0
97.3
-6.6 -5.5
16.1 16.6
Educational and Health Services
490.8
493.9
478.1
-3.1 -0.6
12.7 2.7
Educational Services
92.5
92.5
87.5
0.0 0.0
5.0 5.7
Colleges, Universities, and Professional Schools
57.4
58.6
55.5
-1.2 -2.1
1.9 3.4
Health Care and Social Assistance
398.3
401.4
390.6
-3.1 -0.8
7.7 2.0
Ambulatory Health Care Services
151.2
151.4
148.7
-0.2 -0.1
2.5 1.7
Hospitals
132.0
133.4
129.5
-1.4 -1.1
2.5 1.9
Nursing and Residential Care Facilities
57.1
57.5
56.1
-0.4 -0.7
1.0 1.8
Social Assistance
58.0
59.1
56.3
-1.1 -1.9
1.7 3.0
Leisure and Hospitality
357.5
369.1
355.2
-11.6 -3.1
2.3 0.7
Arts, Entertainment, and Recreation
33.6
35.8
33.4
-2.2 -6.2
0.2 0.6
Amusement, Gambling, and Recreation
23.8
25.2
24.8
-1.4 -5.6
-1.0 -4.0
Accommodation and Food Services
323.9
333.3
321.8
-9.4 -2.8
2.1 0.7
Accommodation
37.6
39.7
38.4
-2.1 -5.3
-0.8 -2.1
Food Services and Drinking Places
286.3
293.6
283.4
-7.3 -2.5
2.9 1.0
Other Services
152.3
152.5
150.9
-0.2 -0.1
1.4 0.9
Repair and Maintenance
33.0
33.3
32.3
-0.3 -0.9
0.7 2.2
Personal and Laundry Services
32.7
32.8
32.2
-0.1 -0.3
0.5 1.6
Religious, Grantmaking, Civic, Professional and Similar
86.6
86.4
86.4
0.2 0.2
0.2 0.2
Government
668.2
672.0
681.3
-3.8 -0.6
-13.1 -1.9
Federal Government
102.0
102.2
103.6
-0.2 -0.2
-1.6 -1.5
Department of Defense
42.9
43.0
41.2
-0.1 -0.2
1.7 4.1
State Government
156.7
157.4
155.3
-0.7 -0.4
1.4 0.9
State Government Education
76.5
79.8
75.3
-3.3 -4.1
1.2 1.6
Local Government
409.5
412.4
422.4
-2.9 -0.7
-12.9 -3.1
Local Government Education
252.9
254.5
263.2
-1.6 -0.6
-10.3 -3.9
Note: These preliminary estimates were prepared in cooperation with the U.S. Department of Labor, Bureau of Labor Statistics, based upon monthly reports submitted by selected employers throughout
Georgia. The estimates include all full- and part-time wage and salary workers who were employed during or received pay for any part of the pay period that includes the twelfth of the month. Proprietors, domestic
workers, self-employed persons, unpaid family workers and personnel of the armed forces are excluded. Estimates based on 2010 benchmark.
2
Source: Georgia Department of Labor, Workforce Information & Analysis
ATLANTA MSA Nonagricultural Employment (000s)
Preliminary JAN 2011
Revised DEC 2010
Revised JAN 2010
Change in Jobs
from DEC 2011
Net
%
Change in Jobs from JAN 2010
Net %
Total Nonfarm Total Private Goods Producing Service-Providing Private Service-Providing
Mining and Logging Construction Construction of Buildings Specialty Trade Contractors Manufacturing Durable Goods Transportation Equipment Manufacturing Non-Durable Goods Food Manufacturing Trade, Transportation and Utilities Wholesale Trade Merchant Wholesalers, Durable Goods Merchant Wholesalers, Non-durable Goods Wholesale Electronic Markets and Agents and Brokers Retail Trade Food and Beverage Stores General Merchandise Stores Miscellaneous Store Retailers Transportation, Warehousing, and Utilities Utilities Transportation and Warehousing Air Transportation Truck Transportation Couriers and Messengers Information Telecommunications Wired Telecommunications Carriers Wireless Telecommunications Carriers Internet Service Providers, Search Portals, and DP Financial Activities Finance and Insurance Insurance Carriers and Related Activities Real Estate, Rental and Leasing Professional and Business Services Professional, Scientific, and Technical Services Accounting, Tax Preparation and Bookkeeping Architectural, Engineering and Related Services Computer Systems Design and Related Services Management and Technical Consulting Services Management of Companies and Enterprises Admin and Support, Waste Mngmnt and Remediation Employment Services Educational and Health Services Educational Services Health Care and Social Assistance Ambulatory Health Care Services Hospitals Social Assistance Leisure and Hospitality Arts, Entertainment, and Recreation Accommodation and Food Services Accommodation Food Services and Drinking Places Other Services Repair and Maintenance Personal and Laundry Services Government Federal Government State Government Local Government
2,212.9 1,893.9
223.9 1,989.0 1,670.0
1.3 79.3 18.5 49.9 143.3 71.4 13.7 71.9 23.7 509.4 144.0 72.7 39.0 32.3 242.0 47.5 52.4 12.4 123.4 10.6 112.8 38.8 26.0 14.0 75.7 36.9 23.4
8.9 4.8 134.5 96.5 43.4 38.0 373.3 166.2 25.4 23.9 41.4 27.3 40.3 166.8 73.4 274.4 61.0 213.4 82.4 71.5 36.7 209.6 22.1 187.5 21.0 166.5 93.1 18.3 22.0 319.0 47.5 65.8 205.7
2,259.4 1,939.2
231.1 2,028.3 1,708.1
1.3 85.9 18.4 54.4 143.9 71.4 13.7 72.5 24.0 524.8 145.1 72.9 39.3 32.9 253.1 49.0 54.6 12.9 126.6 10.6 116.0 38.2 26.2 16.1 78.4 37.0 23.4
8.9 5.2 138.5 99.2 44.0 39.3 379.4 164.9 23.7 24.2 41.6 28.0 40.4 174.1 80.0 278.4 61.7 216.7 83.0 71.9 37.2 216.7 23.3 193.4 21.8 171.6 91.9 18.4 22.3 320.2 47.4 65.5 207.3
2,225.2 1,897.1
233.6 1,991.6 1,663.5
1.3 91.1 19.6 57.3 141.2 69.7 13.1 71.5 23.1 506.6 143.0 71.8 39.2 32.0 242.0 46.8 51.5 12.9 121.6 11.1 110.5 38.0 24.6 14.6 77.4 36.6 23.3
8.6 5.4 141.0 101.4 43.9 39.6 367.5 164.5 24.6 25.1 39.3 26.5 40.1 162.9 68.3 270.5 58.9 211.6 82.5 70.4 34.2 208.9 22.2 186.7 21.5 165.2 91.6 18.4 21.6 328.1 48.2 65.2 214.7
-46.5 -45.3
-7.2 -39.3 -38.1
0.0 -6.6 0.1 -4.5 -0.6 0.0 0.0 -0.6 -0.3 -15.4 -1.1 -0.2 -0.3 -0.6 -11.1 -1.5 -2.2 -0.5 -3.2 0.0 -3.2 0.6 -0.2 -2.1 -2.7 -0.1 0.0 0.0 -0.4 -4.0 -2.7 -0.6 -1.3 -6.1 1.3 1.7 -0.3 -0.2 -0.7 -0.1 -7.3 -6.6 -4.0 -0.7 -3.3 -0.6 -0.4 -0.5 -7.1 -1.2 -5.9 -0.8 -5.1 1.2 -0.1 -0.3 -1.2 0.1 0.3 -1.6
-2.1 -2.3 -3.1 -1.9 -2.2 0.0 -7.7 0.5 -8.3 -0.4 0.0 0.0 -0.8 -1.3 -2.9 -0.8 -0.3 -0.8 -1.8 -4.4 -3.1 -4.0 -3.9 -2.5 0.0 -2.8 1.6 -0.8 -13.0 -3.4 -0.3 0.0 0.0 -7.7 -2.9 -2.7 -1.4 -3.3 -1.6 0.8 7.2 -1.2 -0.5 -2.5 -0.3 -4.2 -8.3 -1.4 -1.1 -1.5 -0.7 -0.6 -1.3 -3.3 -5.2 -3.1 -3.7 -3.0 1.3 -0.5 -1.4 -0.4 0.2 0.5 -0.8
-12.3 -3.2 -9.7 -2.6 6.5 0.0 -11.8 -1.1 -7.4 2.1 1.7 0.6 0.4 0.6 2.8 1.0 0.9 -0.2 0.3 0.0 0.7 0.9 -0.5 1.8 -0.5 2.3 0.8 1.4 -0.6 -1.7 0.3 0.1 0.3 -0.6 -6.5 -4.9 -0.5 -1.6 5.8 1.7 0.8 -1.2 2.1 0.8 0.2 3.9 5.1 3.9 2.1 1.8 -0.1 1.1 2.5 0.7 -0.1 0.8 -0.5 1.3 1.5 -0.1 0.4 -9.1 -0.7 0.6 -9.0
-0.6 -0.2 -4.2 -0.1 0.4 0.0 -13.0 -5.6 -12.9 1.5 2.4 4.6 0.6 2.6 0.6 0.7 1.3 -0.5 0.9 0.0 1.5 1.8 -3.9 1.5 -4.5 2.1 2.1 5.7 -4.1 -2.2 0.8 0.4 3.5 -11.1 -4.6 -4.8 -1.1 -4.0 1.6 1.0 3.3 -4.8 5.3 3.0 0.5 2.4 7.5 1.4 3.6 0.9 -0.1 1.6 7.3 0.3 -0.5 0.4 -2.3 0.8 1.6 -0.5 1.9 -2.8 -1.5 0.9 -4.2
Note: These preliminary estimates were prepared in cooperation with the U.S. Department of Labor, Bureau of Labor Statistics, based upon monthly reports submitted by selected employers in the Atlanta
Metropolitan Statistical Area, which includes Barrow, Bartow, Butts, Carroll, Cherokee, Clayton, Cobb, Coweta, Dawson, DeKalb, Douglas, Fayette, Forsyth, Fulton, Gwinnett, Haralson, Heard, Henry, Jasper, Lamar, Meriwether, Newton, Paulding, Pickens, Pike, Rockdale, Spalding and Walton counties. The estimates include all full- and part-time wage and salary workers who were employed during or received pay for any part of the pay period that includes the twelfth of the month. Proprietors, domestic workers, self-employed persons, unpaid family workers and personnel of the armed forces are excluded. Estimates based on 2010 benchmark.
Source: Georgia Department of Labor, Workforce Information & Analysis
3
ALBANY MSA Nonagricultural Employment (000s)
Preliminary
Revised
Revised
JAN 2011 DEC 2010 JAN 2010
Change in Jobs from DEC 2011
Net %
Change in Jobs
from JAN 2010
Net
%
Total Nonfarm Total Private
60.4
61.4
60.3
-1.0 -1.6
47.0
47.7
46.4
-0.7 -1.5
0.1 0.2 0.6 1.3
Goods Producing Service-Providing Private Service-Providing
6.7
6.8
7.0
-0.1 -1.5
53.7
54.6
53.3
-0.9 -1.7
40.3
40.9
39.4
-0.6 -1.5
-0.3 -4.3 0.4 0.8 0.9 2.3
Manufacturing Trade, Transportation and Utilities Retail Trade
4.4
4.3
4.4
0.1 2.3
11.7
12.1
12.2
-0.4 -3.3
7.3
7.5
7.5
-0.2 -2.7
0.0 0.0 -0.5 -4.1 -0.2 -2.7
Government Federal Government State Government
13.4
13.7
13.9
-0.3 -2.2
3.4
3.5
3.5
-0.1 -2.9
2.7
2.9
2.6
-0.2 -6.9
-0.5 -3.6 -0.1 -2.9 0.1 3.9
Local Government
7.3
7.3
7.8
0.0 0.0
-0.5 -6.4
Note: These preliminary estimates were prepared in cooperation with the U.S. Department of Labor, Bureau of Labor Statistics, based upon monthly reports submitted by selected employers in the Albany
Metropolitan Statistical Area, which includes Baker, Dougherty, Lee, Terrell and Worth counties. The estimates include all full- and part-time wage and salary workers who were employed during or received pay for any part of the pay period that includes the twelfth of the month. Proprietors, domestic workers, self-employed persons, unpaid family workers and personnel of the armed forces are excluded. Estimates
based on 2010 benchmark.
ATHENS - CLARKE MSA Nonagricultural Employment (000s)
Preliminary
Revised
Revised
JAN 2011 DEC 2010 JAN 2010
Change in Jobs
from DEC 2011
Net
%
Change in Jobs from JAN 2010
Net %
Total Nonfarm
79.3
81.9
78.2
-2.6 -3.2
1.1 1.4
Total Private
55.5
57.3
54.4
-1.8 -3.1
1.1 2.0
Goods Producing
9.2
9.3
9.3
-0.1 -1.1
-0.1 -1.1
Service-Providing
70.1
72.6
68.9
-2.5 -3.4
1.2 1.7
Private Service-Providing
46.3
48.0
45.1
-1.7 -3.5
1.2 2.7
Trade, Transportation and Utilities
12.8
13.2
13.1
-0.4 -3.0
-0.3 -2.3
Retail Trade
9.1
9.5
9.3
-0.4 -4.2
-0.2 -2.2
Professional and Business Services
6.4
6.9
5.9
-0.5 -7.3
0.5 8.5
Leisure and Hospitality
7.5
7.8
7.6
-0.3 -3.9
-0.1 -1.3
Government
23.8
24.6
23.8
-0.8 -3.3
0.0 0.0
Federal Government
1.5
1.5
1.7
0.0 0.0
-0.2 -11.8
State Government
14.4
15.1
13.9
-0.7 -4.6
0.5 3.6
Local Government
7.9
8.0
8.2
-0.1 -1.3
-0.3 -3.7
Note: These preliminary estimates were prepared in cooperation with the U.S. Department of Labor, Bureau of Labor Statistics, based upon monthly reports submitted by selected employers in the Athens - Clarke
County Metropolitan Statistical Area, which includes Clarke, Madison, Oconee and Oglethorpe counties. The estimates include all full- and part-time wage and salary workers who were employed during or received pay for any part of the pay period that includes the twelfth of the month. Proprietors, domestic workers, self-employed persons, unpaid family workers and personnel of the armed forces are excluded. Estimates based on 2010 benchmark.
Source: Georgia Department of Labor, Workforce Information & Analysis
4
AUGUSTA-RICHMOND MSA Nonagricultural Employment (000s)
Preliminary Revised Revised JAN 2011 DEC 2010 JAN 2010
Change in Jobs from DEC 2011
Net %
Change in Jobs from JAN 2010
Net %
Total Nonfarm Total Private Goods Producing Service-Providing Private Service-Providing Mining, Logging, and Construction Manufacturing Trade, Transportation and Utilities Wholesale Trade Retail Trade Transportation,Warehousing, and Utilities Information Financial Activitities Professional and Business Services Educational and Health Services Leisure and Hospitality Other Services Government Federal Government State Government Local Government
207.3 164.2
30.9 176.4 133.3
11.0 19.9 34.8
4.7 24.0
6.1 2.6 7.4 30.3 29.5 19.6 9.1 43.1 8.4 13.3 21.4
210.6 167.1
31.3 179.3 135.8
11.4 19.9 36.0
4.8 24.9
6.3 2.6 7.4 30.8 29.7 20.1 9.2 43.5 8.5 13.6 21.4
207.9 164.1
30.7 177.2 133.4
10.7 20.0 34.8
4.4 24.3
6.1 2.7 7.2 30.1 29.1 20.4 9.1 43.8 8.7 13.4 21.7
-3.3 -1.6 -2.9 -1.7 -0.4 -1.3 -2.9 -1.6 -2.5 -1.8 -0.4 -3.5 0.0 0.0 -1.2 -3.3 -0.1 -2.1 -0.9 -3.6 -0.2 -3.2 0.0 0.0 0.0 0.0 -0.5 -1.6 -0.2 -0.7 -0.5 -2.5 -0.1 -1.1 -0.4 -0.9 -0.1 -1.2 -0.3 -2.2 0.0 0.0
-0.6 -0.3 0.1 0.1 0.2 0.7 -0.8 -0.5 -0.1 -0.1 0.3 2.8 -0.1 -0.5 0.0 0.0 0.3 6.8 -0.3 -1.2 0.0 0.0 -0.1 -3.7 0.2 2.8 0.2 0.7 0.4 1.4 -0.8 -3.9 0.0 0.0 -0.7 -1.6 -0.3 -3.5 -0.1 -0.8 -0.3 -1.4
Note: ThesepreliminaryestimateswerepreparedincooperationwiththeU.S.DepartmentofLabor,BureauofLaborStatistics,baseduponmonthlyreportssubmittedbyselectedemployers intheAugusta- Richmond
County Metropolitan Statistical Area, which includes Burke, Columbia, McDuffie and Richmond counties in Georgia and Aiken and Edgefield counties in South Carolina. The estimates include all full- and part-time wage and salary workers who were employed during or received pay for any part of the pay period that includes the twelfth of the month. Proprietors, domestic workers, self-employed persons, unpaid family workers
and personnel of the armed forces are excluded. Estimates based on 2010 benchmark.
BRUNSWICK MSA Nonagricultural Employment (000s)
Preliminary Revised Revised JAN 2011 DEC 2010 JAN 2010
Change in Jobs from DEC 2011
Net %
Change in Jobs from JAN 2010
Net %
Total Nonfarm Total Private Goods Producing Service-Providing Private Service-Providing Trade, Transportation and Utilities
Retail Trade Government
Federal Government State Government Local Government
40.0
40.3
40.1
-0.3 -0.7
29.9
30.1
29.8
-0.2 -0.7
4.4
4.4
4.5
0.0 0.0
35.6
35.9
35.6
-0.3 -0.8
25.5
25.7
25.3
-0.2 -0.8
7.2
7.7
7.4
-0.5 -6.5
5.1
5.6
5.4
-0.5 -8.9
10.1
10.2
10.3
-0.1 -1.0
1.8
1.9
1.9
-0.1 -5.3
1.9
1.9
1.8
0.0 0.0
6.4
6.4
6.6
0.0 0.0
-0.1 -0.3 0.1 0.3 -0.1 -2.2 0.0 0.0 0.2 0.8 -0.2 -2.7 -0.3 -5.6 -0.2 -1.9 -0.1 -5.3 0.1 5.6 -0.2 -3.0
Note: These preliminary estimates were prepared in cooperation with the U.S. Department of Labor, Bureau of Labor Statistics, based upon monthly reports submitted by selected employers in the
Brunswick Metropolitan Statistical Area, which includes Brantley, Glynn and McIntosh counties. The estimates include all full- and part-time wage and salary workers who were employed during or received pay for any part of the pay period that includes the twelfth of the month. Proprietors, domestic workers, self-employed persons, unpaid family workers and personnel of the armed forces are excluded. Estimates based on 2010 benchmark.
Source: Georgia Department of Labor, Workforce Information & Analysis
5
COLUMBUS MSA Nonagricultural Employment (000s)
Preliminary Revised Revised JAN 2011 DEC 2010 JAN 2010
Change in Jobs from DEC 2011
Net %
Change in Jobs from JAN 2010
Net %
Total Nonfarm Total Private Goods Producing
115.8 92.8 14.8
117.7 94.4 14.9
115.4 91.8 14.1
-1.9 -1.6 -1.6 -1.7 -0.1 -0.7
0.4 0.4 1.0 1.1 0.7 5.0
Service-Providing Private Service-Providing Trade, Transportation and Utilities
101.0 78.0 18.2
102.8 79.5 18.5
101.3 77.7 17.8
-1.8 -1.8 -1.5 -1.9 -0.3 -1.6
-0.3 -0.3 0.3 0.4 0.4 2.3
Retail Trade Information Financial Activities
12.9
13.3
12.7
-0.4 -3.0
5.5
5.5
5.5
0.0 0.0
8.2
8.3
8.4
-0.1 -1.2
0.2 1.6 0.0 0.0 -0.2 -2.4
Finance and Insurance Insurance Carriers and Related Activities Professional and Business Services
6.5
6.5
6.8
0.0 0.0
4.4
4.4
4.6
0.0 0.0
13.5
13.7
12.8
-0.2 -1.5
-0.3 -4.4 -0.2 -4.4 0.7 5.5
Leisure and Hospitality Government Federal Government
12.8
13.2
12.7
-0.4 -3.0
23.0
23.3
23.6
-0.3 -1.3
5.7
5.6
6.2
0.1 1.8
0.1 0.8 -0.6 -2.5 -0.5 -8.1
State Government Local Government
4.0
4.3
3.9
-0.3 -7.0
13.3
13.4
13.5
-0.1 -0.8
0.1 2.6 -0.2 -1.5
Note: These preliminary estimates were prepared in cooperation with the U.S. Department of Labor, Bureau of Labor Statistics, based upon monthly reports submitted by selected employers in the
Columbus Metropolitan Statistical Area, which includes Chattahoochee, Harris, Marion and Muscogee counties in Georgia and Russell County in Alabama. The estimates include all full- and part-time wage and salary workers who were employed during or received pay for any part of the pay period that includes the twelfth of the month. Proprietors, domestic workers, self-employed persons, unpaid family workers and personnel of the armed forces are excluded. Estimates based on 2010 benchmark.
DALTON MSA Nonagricultural Employment (000s)
Preliminary Revised
Revised
JAN 2011 DEC 2010 JAN 2010
Change in Jobs from DEC 2011
Net %
Change in Jobs from JAN 2010
Net %
Total Nonfarm Total Private
65.0
65.7
65.2
-0.7 -1.1
58.0
58.7
58.2
-0.7 -1.2
-0.2 -0.3 -0.2 -0.3
Goods Producing
23.7
23.7
24.1
0.0 0.0
-0.4 -1.7
Service-Providing Private Service-Providing
41.3
42.0
41.1
-0.7 -1.7
34.3
35.0
34.1
-0.7 -2.0
0.2 0.5 0.2 0.6
Manufacturing
22.9
22.9
23.1
0.0 0.0
-0.2 -0.9
Textile Mills Textile Product Mills
2.6
2.6
2.7
15.9
15.9
16.3
0.0 0.0 0.0 0.0
-0.1 -3.7 -0.4 -2.5
Trade, Transportation and Utilities
16.0
16.5
15.5
-0.5 -3.0
0.5 3.2
Retail Trade Transportation, Warehouse, and Utilities
7.5
7.8
4.6
4.8
7.5
-0.3 -3.9
4.3
-0.2 -4.2
0.0 0.0 0.3 7.0
Professional and Business Services
6.7
6.8
6.3
-0.1 -1.5
0.4 6.4
Government Federal Government
7.0
7.0
0.3
0.3
7.0
0.0 0.0
0.3
0.0 0.0
0.0 0.0 0.0 0.0
State Government
1.2
1.2
1.0
0.0 0.0
0.2 20.0
Local Government
5.5
5.5
5.7
0.0 0.0
-0.2 -3.5
Note: These preliminary estimates were prepared in cooperation with the U.S. Department of Labor, Bureau of Labor Statistics, based upon monthly reports submitted by selected employers in the Dalton
Metropolitan Statistical Area, which includes Murray and Whitfield counties. The estimates include all full- and part-time wage and salary workers who were employed during or received pay for any part of the pay period that includes the twelfth of the month. Proprietors, domestic workers, self-employed persons, unpaid family workers and personnel of the armed forces are excluded. Estimates based on 2010 benchmark.
Source: Georgia Department of Labor, Workforce Information & Analysis
6
GAINESVILLE MSA Nonagricultural Employment (000s)
Preliminary Revised
Revised
JAN 2011 DEC 2010 JAN 2010
Change in Jobs from DEC 2011
Net %
Change in Jobs from JAN 2010
Net %
Total Nonfarm Total Private
72.0
73.3
69.9
-1.3 -1.8
61.6
62.9
59.7
-1.3 -2.1
2.1 3.0 1.9 3.2
Goods Producing
17.7
17.8
18.0
-0.1 -0.6
-0.3 -1.7
Service-Providing Private Service-Providing
54.3
55.5
51.9
-1.2 -2.2
43.9
45.1
41.7
-1.2 -2.7
2.4 4.6 2.2 5.3
Trade, Transportation and Utilities
13.5
14.0
13.3
-0.5 -3.6
0.2 1.5
Retail Trade Government
7.6
7.8
7.4
-0.2 -2.6
10.4
10.4
10.2
0.0 0.0
0.2 2.7 0.2 2.0
Federal Government
0.5
0.5
0.5
0.0 0.0
0.0 0.0
State Government Local Government
2.6
2.6
7.3
7.3
2.3
0.0 0.0
0.3 13.0
7.4
0.0 0.0
-0.1 -1.4
Note: These preliminary estimates were prepared in cooperation with the U.S. Department of Labor, Bureau of Labor Statistics, based upon monthly reports submitted by selected employers in the Gainesville
Metropolitan Statistical Area, which comprises Hall county. The estimates include all full- and part-time wage and salary workers who were employed during or received pay for any part of the pay period that includes the twelfth of the month. Proprietors, domestic workers, self-employed persons, unpaid family workers and personnel of the armed forces are excluded. Estimates based on 2010 benchmark.
HINESVILLE - FT. STEWART MSA Nonagricultural Employment (000s)
Preliminary Revised
Revised
JAN 2011 DEC 2010 JAN 2010
Change in Jobs from DEC 2011
Net %
Change in Jobs from JAN 2010
Net %
Total Nonfarm Total Private Goods Producing Service-Providing Private Service-Providing Government
Federal Government State Government Local Government
19.4
19.6
19.5
-0.2 -1.0
11.6
11.8
11.7
-0.2 -1.7
2.2
2.2
2.2
0.0 0.0
17.2
17.4
17.3
-0.2 -1.2
9.4
9.6
9.5
-0.2 -2.1
7.8
7.8
7.8
0.0 0.0
4.0
4.0
4.1
0.0 0.0
0.4
0.4
0.3
0.0 0.0
3.4
3.4
3.4
0.0 0.0
-0.1 -0.5 -0.1 -0.9 0.0 0.0 -0.1 -0.6 -0.1 -1.1 0.0 0.0 -0.1 -2.4 0.1 33.3 0.0 0.0
Note: These preliminary estimates were prepared in cooperation with the U.S. Department of Labor, Bureau of Labor Statistics, based upon monthly reports submitted by selected employers in the
Hinesville - Ft. Stewart Metropolitan Statistical Area, which includes Liberty and Long counties. The estimates include all full- and part-time wage and salary workers who were employed during or received pay for any part of the pay period that includes the twelfth of the month. Proprietors, domestic workers, self-employed persons, unpaid family workers and personnel of the armed forces are excluded. Estimates based on 2010 benchmark.
Source: Georgia Department of Labor, Workforce Information & Analysis
7
MACON MSA Nonagricultural Employment (000s)
Preliminary Revised
Revised
JAN 2011 DEC 2010 JAN 2010
Change in Jobs from DEC 2011
Net %
Change in Jobs from JAN 2010
Net %
Total Nonfarm Total Private Goods Producing Service-Providing Private Service-Providing Trade Transportation and Utilities Retail Trade Transportation, Warehousing, and Utilities Financial Activities Professional and Business Services Educational and Health Services Leisure and Hospitality Government Federal Government State Government Local Government
94.9
96.5
80.4
81.8
9.3
9.3
85.6
87.2
71.1
72.5
18.7
19.6
11.9
12.5
3.2
3.3
8.4
8.5
11.3
11.5
19.1
19.3
8.1
8.3
14.5
14.7
1.2
1.3
3.3
3.3
10.0
10.1
93.3
-1.6 -1.7
78.6
-1.4 -1.7
9.7
0.0 0.0
83.6
-1.6 -1.8
68.9
-1.4 -1.9
18.7
-0.9 -4.6
12.1
-0.6 -4.8
3.2
-0.1 -3.0
8.3
-0.1 -1.2
10.1
-0.2 -1.7
18.8
-0.2 -1.0
8.3
-0.2 -2.4
14.7
-0.2 -1.4
1.3
-0.1 -7.7
3.3
0.0 0.0
10.1
-0.1 -1.0
1.6 1.7 1.8 2.3 -0.4 -4.1 2.0 2.4 2.2 3.2 0.0 0.0 -0.2 -1.7 0.0 0.0 0.1 1.2 1.2 11.9 0.3 1.6 -0.2 -2.4 -0.2 -1.4 -0.1 -7.7 0.0 0.0 -0.1 -1.0
Note: These preliminary estimates were prepared in cooperation with the U.S. Department of Labor, Bureau of Labor Statistics, based upon monthly reports submitted by selected employers in the Macon
Metropolitan Statistical Area, which includes Bibb, Crawford, Jones, Monroe and Twiggs counties. The estimates include all full- and part-time wage and salary workers who were employed during or received pay for any part of the pay period that includes the twelfth of the month. Proprietors, domestic workers, self-employed persons, unpaid family workers and personnel of the armed forces are excluded. Estimates based on 2010 benchmark.
ROME MSA Nonagricultural Employment (000s)
Preliminary Revised
Revised
JAN 2011 DEC 2010 JAN 2010
Change in Jobs from DEC 2011
Net %
Change in Jobs from JAN 2010
Net %
Total Nonfarm Total Private Goods Producing Service-Providing Private Service-Providing Manufacturing Trade, Transportation and Utilities
Retail Trade Educational and Health Services Government Federal Government State Government Local Government
37.4
38.2
30.5
31.3
6.6
6.7
30.8
31.5
23.9
24.6
5.9
5.9
6.0
6.2
3.8
4.0
8.7
8.8
6.9
6.9
0.2
0.2
2.5
2.5
4.2
4.2
37.9
-0.8 -2.1
31.0
-0.8 -2.6
6.8
-0.1 -1.5
31.1
-0.7 -2.2
24.2
-0.7 -2.9
5.9
0.0 0.0
6.1
-0.2 -3.2
3.9
-0.2 -5.0
8.7
-0.1 -1.1
6.9
0.0 0.0
0.2
0.0 0.0
2.5
0.0 0.0
4.2
0.0 0.0
-0.5 -1.3 -0.5 -1.6 -0.2 -2.9 -0.3 -1.0 -0.3 -1.2 0.0 0.0 -0.1 -1.6 -0.1 -2.6 0.0 0.0 0.0 0.0 0.0 0.0 0.0 0.0 0.0 0.0
Note: These preliminary estimates were prepared in cooperation with the U.S. Department of Labor, Bureau of Labor Statistics, based upon monthly reports submitted by selected employers in the Rome
Metropolitan Statistical Area, which comprises Floyd county. The estimates include all full- and part-time wage and salary workers who were employed during or received pay for any part of the pay period that includes the twelfth of the month. Proprietors, domestic workers, self-employed persons, unpaid family workers and personnel of the armed forces are excluded. Estimates based on 2010 benchmark.
Source: Georgia Department of Labor, Workforce Information & Analysis
8
SAVANNAH MSA Nonagricultural Employment (000s)
Preliminary Revised
Revised
JAN 2011 DEC 2010 JAN 2010
Change in Jobs from DEC 2011
Net %
Change in Jobs from JAN 2010
Net %
Total Nonfarm Total Private
147.8 124.9
150.3 127.2
146.6 123.7
-2.5 -1.7 -2.3 -1.8
1.2 0.8 1.2 1.0
Goods Producing Service-Providing Private Service-Providing
19.4 128.4 105.5
19.5 130.8 107.7
20.0 126.6 103.7
-0.1 -0.5 -2.4 -1.8 -2.2 -2.0
-0.6 -3.0 1.8 1.4 1.8 1.7
Mining, Logging, and Construction Manufacturing Trade, Transportation and Utilities
5.7
5.8
13.7
13.7
32.5
33.8
6.4
-0.1 -1.7
13.6
0.0 0.0
31.4
-1.3 -3.9
-0.7 -10.9 0.1 0.7 1.1 3.5
Wholesale Trade Retail Trade Transportation, Warehousing, and Utilities
5.8
5.9
5.5
-0.1 -1.7
17.1
18.0
16.9
-0.9 -5.0
9.6
9.9
9.0
-0.3 -3.0
0.3 5.5 0.2 1.2 0.6 6.7
Information Financial Activities Professional and Business Services
1.5
1.5
5.3
5.4
17.3
17.6
1.8
0.0 0.0
5.6
-0.1 -1.9
16.2
-0.3 -1.7
-0.3 -16.7 -0.3 -5.4 1.1 6.8
Educational and Health Services Leisure and Hospitality Other Services
23.2
23.2
23.2
0.0 0.0
18.9
19.4
18.8
-0.5 -2.6
6.8
6.8
6.7
0.0 0.0
0.0 0.0 0.1 0.5 0.1 1.5
Government Federal Government State Government
22.9
23.1
3.0
3.0
5.5
5.5
22.9
-0.2 -0.9
3.1
0.0 0.0
4.9
0.0 0.0
0.0 0.0 -0.1 -3.2 0.6 12.2
Local Government
14.4
14.6
14.9
-0.2 -1.4
-0.5 -3.4
Note: These preliminary estimates were prepared in cooperation with the U.S. Department of Labor, Bureau of Labor Statistics, based upon monthly reports submitted by selected employers in the Savannah
Metropolitan Statistical Area, which includes Bryan, Chatham and Effingham counties. The estimates include all full- and part-time wage and salary workers who were employed during or received pay for any part of the pay period that includes the twelfth of the month. Proprietors, domestic workers, self-employed persons, unpaid family workers and personnel of the armed forces are excluded. Estimates based on 2010 benchmark.
VALDOSTA MSA Nonagricultural Employment (000s)
Preliminary Revised Revised JAN 2011 DEC 2010 JAN 2010
Change in Jobs from DEC 2011
Net %
Change in Jobs from JAN 2010
Net %
Total Nonfarm Total Private Goods Producing Service-Providing Private Service-Providing Trade, Transportation and Utilities Retail Trade Government Federal Government State Government Local Government
52.0
52.5
39.7
40.0
5.9
6.0
46.1
46.5
33.8
34.0
10.4
10.7
7.4
7.7
12.3
12.5
1.0
1.0
3.5
3.6
7.8
7.9
51.5
-0.5 -1.0
39.0
-0.3 -0.8
6.7
-0.1 -1.7
44.8
-0.4 -0.9
32.3
-0.2 -0.6
10.6
-0.3 -2.8
7.5
-0.3 -3.9
12.5
-0.2 -1.6
1.1
0.0 0.0
3.4
-0.1 -2.8
8.0
-0.1 -1.3
0.5 1.0 0.7 1.8 -0.8 -11.9 1.3 2.9 1.5 4.6 -0.2 -1.9 -0.1 -1.3 -0.2 -1.6 -0.1 -9.1 0.1 2.9 -0.2 -2.5
Note: These preliminary estimates were prepared in cooperation with the U.S. Department of Labor, Bureau of Labor Statistics, based upon monthly reports submitted by selected employers in the Valdosta
Metropolitan Statistical Area, which includes Brooks, Echols, Lanier and Lowndes counties. The estimates include all full- and part-time wage and salary workers who were employed during or received pay for any part of the pay period that includes the twelfth of the month. Proprietors, domestic workers, self-employed persons, unpaid family workers and personnel of the armed forces are excluded. Estimates based on 2010 benchmark.
Source: Georgia Department of Labor, Workforce Information & Analysis
9
WARNER ROBINS MSA Nonagricultural Employment (000s)
Preliminary Revised
Revised
JAN 2011 DEC 2010 JAN 2010
Change in Jobs from DEC 2011
Net %
Change in Jobs from JAN 2010
Net %
Total Nonfarm Total Private Goods Producing Service-Providing Private Service-Providing Trade, Transportation and Utilities Retail Trade Government Federal Government State Government Local Government
59.2
59.8
34.0
34.5
6.3
6.4
52.9
53.4
27.7
28.1
8.0
8.2
6.3
6.5
25.2
25.3
16.2
16.3
1.0
1.0
8.0
8.0
59.1
-0.6 -1.0
34.3
-0.5 -1.5
6.5
-0.1 -1.6
52.6
-0.5 -0.9
27.8
-0.4 -1.4
7.9
-0.2 -2.4
6.2
-0.2 -3.1
24.8
-0.1 -0.4
15.5
-0.1 -0.6
1.2
0.0 0.0
8.1
0.0 0.0
0.1 0.2 -0.3 -0.9 -0.2 -3.1 0.3 0.6 -0.1 -0.4 0.1 1.3 0.1 1.6 0.4 1.6 0.7 4.5 -0.2 -16.7 -0.1 -1.2
Note: These preliminary estimates were prepared in cooperation with the U.S. Department of Labor, Bureau of Labor Statistics, based upon monthly reports submitted by selected employers in the Warner
Robins Metropolitan Statistical Area, which comprises Houston county. The estimates include all full- and part-time wage and salary workers who were employed during or received pay for any part of the pay period that includes the twelfth of the month. Proprietors, domestic workers, self-employed persons, unpaid family workers and personnel of the armed forces are excluded. Estimates based on 2010 benchmark.
Source: Georgia Department of Labor, Workforce Information & Analysis
10
Georgia Statewide Hours and Earnings
All Employee
Average Weekly Earnings
Preliminary JAN 2011
Revised DEC 2010
Revised JAN 2010
Total Private ........................................................................................... $752.98 ........................ $761.08 ................... $727.16 Goods Producing ................................................................................ $789.03 ........................ $844.95 ................... $814.46 Private Service Providing .................................................................... $746.34 ........................ $745.62 ................... $710.20 Construction .................................................................................... $783.96 ........................ $816.17 ................... $798.89 Manufacturing .................................................................................. $761.03 ........................ $821.60 ................... $786.46 Trade, Transportation, and Utilities ................................................ $681.41 ........................ $695.80 ................... $654.25 Financial Activities ........................................................................... $896.61 ........................ $860.65 ................... $866.62 Professional and Business Services ............................................. $939.46 ........................ $923.13 ................... $917.29 Educational and Health Services .................................................... $788.39 ........................ $780.62 ................... $769.78 Leisure and Hospitality ................................................................... $313.97 ........................ $324.68 ................... $315.90 Other Services ................................................................................. $594.98 ........................ $605.14 ................... $575.36
Average Weekly Hours
Preliminary JAN 2011
Revised DEC 2010
Revised JAN 2010
Total Private .................................................................................................. 33.6 .............................. 34.8 ......................... 34.3 Goods Producing ....................................................................................... 35.8 .............................. 39.1 ......................... 38.4 Private Service Providing ........................................................................... 33.2 .............................. 34.0 ......................... 33.5
Construction ...........................................................................................34.1 .............................. 38.3 ......................... 36.9 Manufacturing ......................................................................................... 36.5 .............................. 39.5 ......................... 39.6 Trade, Transportation, and Utilities .......................................................33.8 .............................. 35.0 ......................... 34.2 Financial Activities ..................................................................................36.3 .............................. 35.0 ......................... 35.1 Professional and Business Services ....................................................34.1 .............................. 35.1 ......................... 34.1 Educational and Health Services ........................................................... 34.9 .............................. 35.1 ......................... 34.8 Leisure and Hospitality .......................................................................... 25.3 .............................. 26.9 ......................... 27.0 Other Services ........................................................................................31.8 .............................. 33.6 ......................... 31.7
Average Hourly Earnings
Preliminary JAN 2011
Revised DEC 2010
Revised JAN 2010
Total Private ............................................................................................. $22.41 .......................... $21.87 ..................... $21.20 Goods Producing .................................................................................. $22.04 .......................... $21.61 ..................... $21.21 Private Service Providing ...................................................................... $22.48 .......................... $21.93 ..................... $21.20
Construction ...................................................................................... $22.99 .......................... $21.31 ..................... $21.65 Manufacturing .................................................................................... $20.85 .......................... $20.80 ..................... $19.86 Trade, Transportation, and Utilities .................................................. $20.16 .......................... $19.88 ..................... $19.13 Financial Activities ............................................................................. $24.70 .......................... $24.59 ..................... $24.69 Professional and Business Services ............................................... $27.55 .......................... $26.30 ..................... $26.90 Educational and Health Services ...................................................... $22.59 .......................... $22.24 ..................... $22.12 Leisure and Hospitality ..................................................................... $12.41 .......................... $12.07 ..................... $11.70 Other Services ................................................................................... $18.71 .......................... $18.01 ..................... $18.15
Read more about the hours and earnings series at http://www.bls.gov/sae/saeaepp.htm
Source: Georgia Department of Labor, Workforce Information & Analysis
11
Georgia MSA Hours and Earnings
All Employee Total Private
Average Weekly Earnings
Preliminary JAN 2011
Revised DEC 2010
Revised JAN 2010
Albany MSA ............................................................................................ $533.81 ........................ $519.69 ................... $557.76 Athens-Clarke County MSA ................................................................... $666.88 ........................ $668.00 ................... $676.28 Atlanta MSA ............................................................................................ $832.47 ........................ $838.65 ................... $819.36 Augusta-Richmond County MSA ........................................................... $730.08 ........................ $710.15 ................... $785.61 Brunswick MSA ...................................................................................... $471.73 ........................ $465.12 ................... $516.17 Columbus MSA ..................................................................................... $588.64 ........................ $570.18 ................... $590.73 Dalton MSA ............................................................................................ $545.46 ........................ $585.89 ................... $585.52 Gainesville MSA .................................................................................... $826.08 ........................ $839.63 ................... $758.60 Hinesville-Fort Stewart MSA .................................................................. $461.65 ........................ $477.92 ................... $542.05 Macon MSA ............................................................................................ $752.92 ........................ $774.97 ................... $785.10 Rome MSA ............................................................................................ $684.05 ........................ $734.97 ................... $652.95 Savannah MSA ...................................................................................... $654.38 ........................ $678.72 ................... $669.62 Valdosta MSA ......................................................................................... $532.00 ........................ $514.31 ................... $542.43 Warner Robins MSA .............................................................................. $604.44 ........................ $658.09 ................... $674.11
Average Weekly Hours
Preliminary JAN 2011
Revised DEC 2010
Revised JAN 2010
Albany MSA ................................................................................................... 33.7 .............................. 34.6 ......................... 35.8 Athens-Clarke County MSA .......................................................................... 32.0 .............................. 33.3 ......................... 33.2 Atlanta MSA ................................................................................................... 33.1 .............................. 34.9 ......................... 33.9 Augusta-Richmond County MSA .................................................................. 36.0 .............................. 37.2 ......................... 38.7 Brunswick MSA ............................................................................................. 29.8 .............................. 30.4 ......................... 32.1 Columbus MSA ............................................................................................33.2 .............................. 34.0 ......................... 32.8 Dalton MSA ................................................................................................... 32.8 .............................. 35.9 ......................... 36.3 Gainesville MSA ...........................................................................................36.2 .............................. 37.4 ......................... 35.3 Hinesville-Fort Stewart MSA .........................................................................30.9 .............................. 32.6 ......................... 37.0 Macon MSA ................................................................................................... 38.2 .............................. 39.6 ......................... 40.7 Rome MSA ................................................................................................... 34.1 .............................. 35.8 ......................... 35.7 Savannah MSA ............................................................................................. 32.9 .............................. 33.7 ......................... 33.7 Valdosta MSA ................................................................................................ 30.4 .............................. 30.2 ......................... 31.5 Warner Robins MSA .....................................................................................33.9 .............................. 34.6 ......................... 35.8
Average Hourly Earnings
Preliminary JAN 2011
Revised DEC 2010
Revised JAN 2010
Albany MSA .............................................................................................. $15.84 .......................... $15.02 ..................... $15.58 Athens-Clarke County MSA ..................................................................... $20.84 .......................... $20.06 ..................... $20.37 Atlanta MSA .............................................................................................. $25.15 .......................... $24.03 ..................... $24.17 Augusta-Richmond County MSA ............................................................. $20.28 .......................... $19.09 ..................... $20.30 Brunswick MSA ........................................................................................ $15.83 .......................... $15.30 ..................... $16.08 Columbus MSA ....................................................................................... $17.73 .......................... $16.77 ..................... $18.01 Dalton MSA .............................................................................................. $16.63 .......................... $16.32 ..................... $16.13 Gainesville MSA ...................................................................................... $22.82 .......................... $22.45 ..................... $21.49 Hinesville-Fort Stewart MSA .................................................................... $14.94 .......................... $14.66 ..................... $14.65 Macon MSA .............................................................................................. $19.71 .......................... $19.57 ..................... $19.29 Rome MSA .............................................................................................. $20.06 .......................... $20.53 ..................... $18.29 Savannah MSA ........................................................................................ $19.89 .......................... $20.14 ..................... $19.87 Valdosta MSA ........................................................................................... $17.50 .......................... $17.03 ..................... $17.22 Warner Robins MSA ................................................................................ $17.83 .......................... $19.02 ..................... $18.83
Read more about the hours and earnings series at http://www.bls.gov/sae/saeaepp.htm
Source: Georgia Department of Labor, Workforce Information & Analysis
12
Dimensions - Measuring Georgia's Labor Force
Unemployment rates -- Georgia and U.S.
11.0%
10.0%
9.0%
8.0%
7.0%
Ge orgia
U.S.
6.0%
Jan Feb Mar Apr May Jun Jul Aug Sep Oct Nov Dec Jan
2010
2011
WA 9.1
OR
10.4
ID
9.7
NV
14.2
UT
CA
7.6
12.4
AZ 9.6
AK 7.7
State unemployment rates
January 2011
National Unemployment Rate: 9.0% Rates are seasonally adjusted
MT 7.5
WY 6.3
CO 9.1
NM 8.7
ND 3.8
SD 4.7
NE 4.2
KS 6.8
MN 6.7
WI 7.4
IA 6.1
IL 9.0
MO 9.6
OK 6.6
TX 8.3
AR 7.8
MS 10.1
LA 7.8
NH
5.6 ME
VT
7.5
5.7
MI 10.7
OH
IN
9.4
9.1
KY 10.4
TN 9.5
PA 8.2
WV
9.6
VA
6.5
NC 9.9
SC 10.5
AL
GA
9.3
10.4
FL 11.9
MA 8.3 NY 8.3
RI 11.3 CT NJ 9.0 9.1 DE 8.5 DC 9.6
MD 7.2
Unemployment rate 10.0% or greater 7.0% to 9.9% 6.0% to 6.9% 5.0% to 5.9% 4.0% to 4.9% 3.0% to 3.9%
HI 6.3
13
Georgia Labor Force Estimates (not seasonally adjusted) Place of Residence - Persons 16 Years and Older
Georgia
(Seasonally adjusted)
Georgia
(Not Seasonally adjusted)
Albany MSA
Athens-Clarke County MSA
Atlanta MSA
Augusta-Richmond County MSA
Brunswick MSA
Columbus MSA
Dalton MSA
Gainesville MSA
Employment Status
Civilian labor force Employed Unemployed Rate
Civilian labor force Employed Unemployed Rate
Civilian labor force Employed Unemployed Rate
Civilian labor force Employed Unemployed Rate
Civilian labor force Employed Unemployed Rate
Civilian labor force Employed Unemployed Rate
Civilian labor force Employed Unemployed Rate
Civilian labor force Employed Unemployed Rate
Civilian labor force Employed Unemployed Rate
Civilian labor force Employed Unemployed Rate
JAN 2011
4,682,417 4,197,749
484,668 10.4
4,667,659 4,178,634
489,025 10.5
75,381 67,240
8,141 10.8
105,216 96,751 8,465 8.0
2,640,399 2,364,721
275,678 10.4
258,848 235,602
23,246 9.0
51,055 45,666
5,389 10.6
128,578 116,024 12,554
9.8
62,571 54,441
8,130 13.0
89,090 81,093
7,997 9.0
DEC 2010
4,685,727 4,197,864
487,863 10.4
4,693,966 4,217,116
476,850 10.2
75,611 67,649
7,962 10.5
106,742 98,651 8,091 7.6
2,661,877 2,391,846
270,031 10.1
259,246 236,369
22,877 8.8
50,707 45,609
5,098 10.1
129,371 117,153 12,218
9.4
62,169 54,474
7,695 12.4
89,478 81,618
7,860 8.8
JAN 2010
4,719,230 4,229,324
489,906 10.4
4,713,366 4,207,317
506,049 10.7
75,969 67,202
8,767 11.5
104,581 95,869 8,712 8.3
2,676,861 2,390,234
286,627 10.7
261,876 236,808
25,068 9.6
51,314 45,997
5,317 10.4
129,442 116,287 13,155
10.2
62,838 54,778
8,060 12.8
88,375 79,642
8,733 9.9
Change From
DEC 2011
JAN 2010
-3,310 -115
-3,195
-36,813 -31,575
-5,238
-26,307 -38,482 12,175
-45,707 -28,683 -17,024
-230 -409 179
-588 38
-626
-1,526 -1,900
374
635 882 -247
-21,478 -27,125
5,647
-36,462 -25,513 -10,949
-398 -767 369
-3,028 -1,206 -1,822
348
-259
57
-331
291
72
-793 -1,129
336
-864 -263 -601
402
-267
-33
-337
435
70
-388 -525 137
715 1,451 -736
Note: MSA data are not seasonally adjusted. Employment includes nonagricultural wage and salary employment, self-employment, unpaid family and private
household workers and agricultural workers. Persons in labor disputes are counted as employed. The use of unrounded data does not imply that the numbers are exact. Georgia and Metropolitan Statistical Area data have not been seasonally adjusted.
Albany MSA: Baker, Dougherty, Lee, Terrell, and Worth counties. Athens - Clarke County MSA: Clarke, Madison, Oconee, and Oglethorpe counties. Atlanta MSA: Barrow, Bartow, Butts, Carroll, Cherokee, Clayton, Cobb, Coweta, Dawson, DeKalb, Douglas, Fayette, Forsyth, Fulton, Gwinnett, Haralson, Heard, Henry, Jasper, Lamar, Meriwether, Newton, Paulding, Pickens, Pike, Rockdale, Spalding, and Walton counties. Augusta - Richmond County MSA: Burke, Columbia, McDuffie, and Richmond counties in Georgia and Aiken and Edgefield counties in South Carolina. Brunswick MSA: Brantley, Glynn, and McIntosh counties. Columbus MSA: Chattahoochee, Harris, Marion, and Muscogee counties in Georgia and Russell County in Alabama. Dalton MSA: Murray and Whitfield counties. Gainesville MSA: Hall County. Hinesville - Fort Stewart MSA: Liberty and Long counties. Macon MSA: Bibb, Crawford, Jones, Monroe, and Twiggs counties. Rome MSA: Floyd County. Savannah MSA: Bryan, Chatham, and Effingham counties. Valdosta MSA: Brooks, Echols, Lanier, and Lowndes counties. Warner Robins MSA: Houston County.
Source: Georgia Department of Labor, Workforce Information & Analysis
14
Georgia Labor Force Estimates (not seasonally adjusted) Place of Residence - Persons 16 Years and Older
Hinesville-Ft. Stewart MSA Macon MSA
Rome MSA Savannah MSA
Valdosta MSA Warner Robins MSA
Employment Status
Civilian labor force Employed Unemployed Rate
Civilian labor force Employed Unemployed Rate
Civilian labor force Employed Unemployed Rate
Civilian labor force Employed Unemployed Rate
Civilian labor force Employed Unemployed Rate
Civilian labor force Employed Unemployed Rate
JAN 2011
32,831 29,876
2,955 9.0
112,465 100,697
11,768 10.5
47,700 42,391
5,309 11.1
174,698 158,509
16,189 9.3
66,610 60,469
6,141 9.2
71,406 65,809
5,597 7.8
DEC 2010
32,878 29,969
2,909 8.8
112,932 101,465
11,467 10.2
48,121 43,005
5,116 10.6
175,499 159,717
15,782 9.0
66,301 60,431
5,870 8.9
71,209 65,684
5,525 7.8
JAN 2010
33,201 30,235
2,966 8.9
111,925 99,778 12,147
10.9
48,536 43,235
5,301 10.9
174,245 158,103
16,142 9.3
66,257 59,965
6,292 9.5
71,568 65,944
5,624 7.9
Change From
DEC 2011
JAN 2010
-47
-370
-93
-359
46
-11
-467 -768 301
540 919 -379
-421 -614 193
-836 -844
8
-801
453
-1,208
406
407
47
309
353
38
504
271
-151
197
-162
125
-135
72
-27
United States Labor Force Estimates Place of Residence - Persons 16 Years and Older
Area
United States
(Seasonally adjusted)
Employment Status
Civilian labor force Employed Unemployed Rate
JAN 2011
153,186,000 139,323,000
13,863,000 9.0
DEC 2010
153,690,000 139,206,000
14,485,000 9.4
JAN 2010
153,353,000 138,511,000 14,842,000
9.7
Change From
DEC 2011
JAN 2010
-504,000 117,000 -622,000
-167,000 812,000 -979,000
United States
(Not Seasonally adjusted)
Civilian labor force Employed Unemployed
Rate
152,536,000 137,599,000
14,937,000 9.8
153,156,000 139,159,000
13,997,000 9.1
152,957,000 136,809,000
16,147,000 10.6
-620,000 -1,560,000
940,000
-421,000 790,000 -1,210,000
Note: Employment includes nonagricultural wage and salary employment, self-employment, unpaid family and private household workers and agricultural
workers. Persons in labor disputes are counted as employed. The use of unrounded data does not imply that the numbers are exact. Georgia and Metropolitan Statistical Area data have not been seasonally adjusted. Seasonally adjusted data for Georgia available upon request.
Albany MSA: Baker, Dougherty, Lee, Terrell, and Worth counties. Athens - Clarke County MSA: Clarke, Madison, Oconee, and Oglethorpe counties. Atlanta MSA: Barrow, Bartow, Butts, Carroll, Cherokee, Clayton, Cobb, Coweta, Dawson, DeKalb, Douglas, Fayette, Forsyth, Fulton, Gwinnett, Haralson, Heard, Henry, Jasper, Lamar, Meriwether, Newton, Paulding, Pickens, Pike, Rockdale, Spalding, and Walton counties. Augusta - Richmond County MSA: Burke, Columbia, McDuffie, and Richmond counties in Georgia and Aiken and Edgefield counties in South Carolina. Brunswick MSA: Brantley, Glynn, and McIntosh counties. Columbus MSA: Chattahoochee, Harris, Marion, and Muscogee counties in Georgia and Russell County in Alabama. Dalton MSA: Murray and Whitfield counties. Gainesville MSA: Hall County. Hinesville - Fort Stewart MSA: Liberty and Long counties. Macon MSA: Bibb, Crawford, Jones, Monroe, and Twiggs counties. Rome MSA: Floyd County. Savannah MSA: Bryan, Chatham, and Effingham counties. Valdosta MSA: Brooks, Echols, Lanier, and Lowndes counties. Warner Robins MSA: Houston County.
Source: Georgia Department of Labor, Workforce Information & Analysis
15
Georgia Labor Force Estimates by County (not seasonally adjusted)
Georgia
Place of Residence - Persons 16 Years and Older
January 2011
December 2010
Labor Force
Employment
Unemployment Number Rate
4,667,659 4,178,634 489,025 10.5
Labor Force
Employment
Unemployment Number Rate
4,693,966 4,217,116 476,850 10.2
Appling Atkinson Bacon Baker Baldwin
9,315 2,968 4,408 1,553 17,997
8,292 2,505 3,976 1,398 15,399
1,023 11.0 463 15.6 432 9.8 155 10.0
2,598 14.4
9,361 2,965 4,424 1,558 18,233
8,351 2,519 3,998 1,406 15,516
1,010 10.8 446 15.0 426 9.6 152 9.8
2,717 14.9
Banks Barrow Bartow Ben Hill Berrien
9,855 34,180 45,111
6,904 7,867
9,072 30,463 39,492
5,894 6,920
783 7.9 3,717 10.9 5,619 12.5 1,010 14.6
947 12.0
10,146 34,223 45,212
6,997 7,894
9,428 30,812 39,945
5,982 6,942
718 7.1 3,411 10.0 5,267 11.6 1,015 14.5
952 12.1
Bibb Bleckley Brantley Brooks Bryan
74,017 5,439 7,201 7,858
16,780
66,115 4,702 6,335 7,098 15,341
7,902 10.7 737 13.6 866 12.0 760 9.7
1,439 8.6
74,326 5,409 7,207 7,786
16,850
66,619 4,703 6,327 7,093
15,458
7,707 10.4 706 13.1 880 12.2 693 8.9
1,392 8.3
Bulloch Burke Butts Calhoun Camden
31,459 9,887 9,978 2,236
20,088
28,038 8,666 8,634 2,002
18,104
3,421 10.9 1,221 12.3 1,344 13.5
234 10.5 1,984 9.9
31,142 9,811 9,976 2,262
19,915
27,863 8,721 8,733 2,033
17,949
3,279 10.5 1,090 11.1 1,243 12.5
229 10.1 1,966 9.9
Candler Carroll Catoosa Charlton Chatham
4,119 3,669
450 10.9
51,519 45,395 6,124 11.9
34,497 31,593 2,904 8.4
4,305 3,766
539 12.5
129,733 117,444 12,289 9.5
4,031 51,442 34,754
4,299 130,342
3,600 45,916 31,945
3,785 118,339
431 10.7 5,526 10.7 2,809 8.1
514 12.0 12,003 9.2
Chattahoochee 2,657
Chattooga
10,490
Cherokee
106,903
Clarke
63,298
Clay
1,391
2,198 9,138 97,222 58,338 1,260
459 17.3 1,352 12.9 9,681 9.1 4,960 7.8
131 9.4
2,658 10,717 107,703 64,414
1,428
2,216 9,185 98,337 59,484 1,300
442 16.6 1,532 14.3 9,366 8.7 4,930 7.7
128 9.0
Clayton Clinch Cobb Coffee Colquitt
130,235 113,666 16,569 12.7
2,682 2,364
318 11.9
364,583 329,631 34,952 9.6
14,759 12,408 2,351 15.9
19,760 17,752 2,008 10.2
131,570 114,970 16,600 12.6
2,668 2,337
331 12.4
367,933 333,412 34,521 9.4
14,941 12,475 2,466 16.5
19,747 17,799 1,948 9.9
Columbia Cook Coweta Crawford Crisp
60,245 6,619
59,381 5,987 9,180
56,069 5,742
53,509 5,363 7,913
4,176 6.9 877 13.2
5,872 9.9 624 10.4
1,267 13.8
60,606 6,624
59,845 6,031 9,225
56,430 5,764
54,123 5,403 7,974
4,176 6.9 860 13.0
5,722 9.6 628 10.4
1,251 13.6
January 2010
Labor Force
Employment
Unemployment Number Rate
4,713,366 4,207,317 506,049 10.7
9,016 3,173 4,505 1,566 19,586
8,033 2,502 4,028 1,397 16,353
983 10.9 671 21.1 477 10.6 169 10.8 3,233 16.5
10,087 34,561 45,709
6,889 7,876
9,267 30,791 39,918
5,779 6,804
820 8.1 3,770 10.9 5,791 12.7 1,110 16.1 1,072 13.6
73,592 5,417 7,269 7,756
16,718
65,511 4,802 6,381 7,039 15,301
8,081 11.0 615 11.4 888 12.2 717 9.2
1,417 8.5
32,456 9,829
10,053 2,249
19,863
29,089 8,731 8,727 1,971
17,857
3,367 10.4 1,098 11.2 1,326 13.2
278 12.4 2,006 10.1
4,189 51,903 34,433
4,274 129,269
3,766 45,885 31,426
3,788 117,143
423 10.1 6,018 11.6 3,007 8.7
486 11.4 12,126 9.4
2,665 10,466 108,553 63,018
1,353
2,203 9,188 98,270 57,806 1,234
462 17.3 1,278 12.2 10,283 9.5 5,212 8.3
119 8.8
131,720 2,714
369,980 15,179 19,861
114,892 2,375
333,187 12,390 17,751
16,828 12.8 339 12.5
36,793 9.9 2,789 18.4 2,110 10.6
60,831 6,679
60,603 6,017 9,305
56,490 5,719
54,086 5,314 7,966
4,341 7.1 960 14.4
6,517 10.8 703 11.7
1,339 14.4
16
Georgia Labor Force Estimates by County (not seasonally adjusted)
Dade Dawson Decatur DeKalb Dodge
Place of Residence - Persons 16 Years and Older
January 2011
December 2010
Labor Force
Employment
Unemployment Number Rate
Labor Force
Employment
Unemployment Number Rate
7,986 7,272
714 8.9
11,049 9,807 1,242 11.2
10,644 9,123 1,521 14.3
371,066 332,045 39,021 10.5
8,676 7,670 1,006 11.6
8,000 7,353
647 8.1
11,074 9,919 1,155 10.4
10,673 9,205 1,468 13.8
374,768 335,853 38,915 10.4
8,755 7,729 1,026 11.7
Dooly Dougherty Douglas Early Echols
4,676 41,622 63,705
5,297 2,118
4,060 36,703 56,257
4,795 1,979
616 13.2 4,919 11.8 7,448 11.7
502 9.5 139 6.6
4,742 41,823 64,189
5,354 2,122
4,140 36,927 56,903
4,843 1,978
602 12.7 4,896 11.7 7,286 11.4
511 9.5 144 6.8
Effingham Elbert Emanuel Evans Fannin
28,185 9,668 9,861 4,718
10,671
25,724 7,962 8,638 4,262 9,415
2,461 8.7 1,706 17.6 1,223 12.4
456 9.7 1,256 11.8
28,308 9,395 9,724 4,711
10,619
25,921 8,044 8,619 4,272 9,528
2,387 8.4 1,351 14.4 1,105 11.4
439 9.3 1,091 10.3
Fayette Floyd Forsyth Franklin Fulton
49,729 45,265 4,464 9.0 47,700 42,391 5,309 11.1 85,064 78,205 6,859 8.1
9,904 8,708 1,196 12.1 474,324 423,609 50,715 10.7
50,227 45,784 4,443 8.8 48,121 43,005 5,116 10.6 85,912 79,102 6,810 7.9
9,891 8,735 1,156 11.7 478,953 428,468 50,485 10.5
Gilmer Glascock Glynn Gordon Grady
13,009 1,119
38,803 25,132 11,242
11,516 962
34,864 21,992 10,171
1,493 11.5 157 14.0
3,939 10.2 3,140 12.5 1,071 9.5
13,117 1,119
38,456 25,093 11,340
11,678 973
34,821 22,106 10,301
1,439 11.0 146 13.0
3,635 9.5 2,987 11.9 1,039 9.2
Greene Gwinnett Habersham Hall Hancock
7,050 6,253
797 11.3
405,316 367,818 37,498 9.3
19,547 17,445 2,102 10.8
89,090 81,093 7,997 9.0
3,036 2,279
757 24.9
7,082 6,316
766 10.8
408,990 372,037 36,953 9.0
19,366 17,474 1,892 9.8
89,478 81,618 7,860 8.8
2,953 2,297
656 22.2
Haralson Harris Hart Heard Henry
12,414 16,164 10,162
4,709 95,532
10,782 1,632 13.1
14,978 1,186 7.3
8,870 1,292 12.7
4,118
591 12.6
85,046 10,486 11.0
12,310 16,259 10,139
4,704 96,168
10,906 1,404 11.4
15,105 1,154 7.1
8,931 1,208 11.9
4,165
539 11.5
86,021 10,147 10.6
Houston Irwin Jackson Jasper Jeff Davis
71,406 3,837
27,095 6,325 5,172
65,809 3,312
24,162 5,468 4,415
5,597 7.8 525 13.7
2,933 10.8 857 13.5 757 14.6
71,209 3,869
27,350 6,370 5,211
65,684 3,361
24,520 5,531 4,458
5,525 7.8 508 13.1
2,830 10.3 839 13.2 753 14.5
January 2010
Labor Force
Employment
Unemployment Number Rate
8,008 11,103 11,382 375,936 8,858
7,234 9,913 9,781 335,627 7,819
774 9.7 1,190 10.7 1,601 14.1 40,309 10.7 1,039 11.7
4,689 41,858 64,270
5,391 2,150
4,164 36,683 56,864
4,834 1,963
525 11.2 5,175 12.4 7,406 11.5
557 10.3 187 8.7
28,258 9,632
10,189 4,849
10,481
25,659 8,330 9,081 4,370 9,221
2,599 9.2 1,302 13.5 1,108 10.9
479 9.9 1,260 12.0
50,413 48,536 86,577 10,140 480,814
45,753 43,235 79,049
8,868 428,179
4,660 9.2 5,301 10.9 7,528 8.7 1,272 12.5 52,635 10.9
13,307 1,128
38,988 25,433 11,389
11,782 984
35,117 21,982 10,228
1,525 11.5 144 12.8
3,871 9.9 3,451 13.6 1,161 10.2
7,109 411,420 19,625 88,375
3,205
6,215 371,786
17,507 79,642
2,421
894 12.6 39,634 9.6
2,118 10.8 8,733 9.9
784 24.5
12,391 16,356 10,147
4,833 96,390
10,898 15,015
8,787 4,162 85,963
1,493 12.0 1,341 8.2 1,360 13.4
671 13.9 10,427 10.8
71,568 3,871
27,087 6,401 5,133
65,944 3,247
23,947 5,527 4,379
5,624 7.9 624 16.1
3,140 11.6 874 13.7 754 14.7
17
Georgia Labor Force Estimates by County (not seasonally adjusted)
Jefferson Jenkins Johnson Jones Lamar
Place of Residence - Persons 16 Years and Older
January 2011
December 2010
Labor Force
6,697 2,305 3,431 14,209 7,805
Employment
Unemployment Number Rate
5,767 1,863 2,967 12,848 6,804
930 13.9 442 19.2 464 13.5 1,361 9.6 1,001 12.8
Labor Force
6,663 2,345 3,381 14,274 7,823
Employment
Unemployment Number Rate
5,770 1,927 2,998 12,946 6,882
893 13.4 418 17.8 383 11.3 1,328 9.3 941 12.0
Lanier Laurens Lee Liberty Lincoln
4,001 21,543 17,825 26,146
3,704
3,644 18,750 16,392 23,685
3,268
357 8.9 2,793 13.0 1,433 8.0 2,461 9.4
436 11.8
4,007 21,824 17,959 26,201
3,709
3,641 18,951 16,492 23,759
3,296
366 9.1 2,873 13.2 1,467 8.2 2,442 9.3
413 11.1
Long Lowndes Lumpkin McDuffie McIntosh
6,685 52,633 12,761 10,713
5,051
6,191 47,748 11,352
9,459 4,467
494 7.4 4,885 9.3 1,409 11.0 1,254 11.7
584 11.6
6,677 52,384 12,788 10,591
5,045
6,210 47,718 11,448
9,519 4,462
467 7.0 4,666 8.9 1,340 10.5 1,072 10.1
583 11.6
Macon Madison Marion Meriwether Miller
5,003 15,685
3,249 9,150 3,363
4,293 14,196
2,941 7,885 3,107
710 14.2 1,489 9.5
308 9.5 1,265 13.8
256 7.6
5,026 15,729
3,300 9,146 3,402
4,335 14,475
2,966 7,975 3,150
691 13.7 1,254 8.0
334 10.1 1,171 12.8
252 7.4
Mitchell Monroe Montgomery Morgan Murray
9,760 13,603
4,428 8,805 19,386
8,759 12,311 3,924 7,919 16,792
1,001 10.3 1,292 9.5
504 11.4 886 10.1 2,594 13.4
9,825 13,646
4,389 8,786 19,204
8,831 12,405
3,914 7,962 16,802
994 10.1 1,241 9.1
475 10.8 824 9.4 2,402 12.5
Muscogee Newton Oconee Oglethorpe Paulding
85,373 45,730 18,410
7,822 66,140
77,060 39,998 17,170
7,047 59,093
8,313 9.7 5,732 12.5 1,240 6.7
775 9.9 7,047 10.7
85,982 45,934 18,755
7,844 66,572
77,711 40,457 17,507
7,185 59,771
8,271 9.6 5,477 11.9 1,248 6.7
659 8.4 6,801 10.2
Peach Pickens Pierce Pike Polk
11,922 14,797
8,612 7,878 20,259
10,467 13,062
7,736 6,960 18,048
1,455 12.2 1,735 11.7
876 10.2 918 11.7 2,211 10.9
11,889 14,706
8,498 7,880 20,132
10,471 13,212
7,662 7,039 18,026
1,418 11.9 1,494 10.2
836 9.8 841 10.7 2,106 10.5
Pulaski Putnam Quitman Rabun Randolph
4,399 9,658
981 6,535 2,666
3,980 8,383
832 5,606 2,308
419 9.5 1,275 13.2
149 15.2 929 14.2 358 13.4
4,428 9,693
978 6,527 2,684
4,015 8,529
839 5,720 2,328
413 9.3 1,164 12.0
139 14.2 807 12.4 356 13.3
January 2010
Labor Force
Employment
Unemployment Number Rate
6,936 2,541 3,426 14,238 7,932
5,888 1,995 2,990 12,731 6,877
1,048 15.1 546 21.5 436 12.7
1,507 10.6 1,055 13.3
3,976 21,518 17,989 26,448
3,762
3,613 18,899 16,383 23,969
3,345
363 9.1 2,619 12.2 1,606 8.9 2,479 9.4
417 11.1
6,753 52,377 12,738 10,817
5,058
6,266 47,351 11,185
9,529 4,500
487 7.2 5,026 9.6 1,553 12.2 1,288 11.9
558 11.0
5,054 15,524
3,321 9,309 3,492
4,367 14,067
2,948 7,970 3,157
687 13.6 1,457 9.4
373 11.2 1,339 14.4
335 9.6
10,007 13,520
4,419 9,002 19,355
8,891 12,198
3,956 8,027 16,896
1,116 11.2 1,322 9.8
463 10.5 975 10.8 2,459 12.7
85,700 46,665 18,291
7,749 67,193
77,249 40,430 17,014
6,983 59,731
8,451 9.9 6,235 13.4 1,277 7.0
766 9.9 7,462 11.1
12,182 14,847
8,557 7,996 20,628
10,764 13,203
7,712 7,035 18,299
1,418 11.6 1,644 11.1
845 9.9 961 12.0 2,329 11.3
4,338 9,894
970 6,597 2,631
3,972 8,666
820 5,697 2,261
366 8.4 1,228 12.4
150 15.5 900 13.6 370 14.1
18
Georgia Labor Force Estimates by County (not seasonally adjusted)
Richmond Rockdale Schley Screven Seminole
Spalding Stephens Stewart Sumter Talbot
Taliaferro Tattnall Taylor Telfair Terrell
Thomas Tift Toombs Towns Treutlen
Troup Turner Twiggs Union Upson
Walker Walton Ware Warren Washington
Wayne Webster Wheeler White Whitfield
Wilcox Wilkes Wilkinson Worth
Place of Residence - Persons 16 Years and Older
January 2011
December 2010
Labor Force
Employment
Unemployment Number Rate
Labor Force
Employment
Unemployment Number Rate
90,620 39,394
1,760 6,822 3,858
81,156 34,527
1,506 5,874 3,437
9,464 10.4 4,867 12.4
254 14.4 948 13.9 421 10.9
90,837 39,634
1,785 6,815 3,823
81,678 34,924
1,516 5,936 3,409
9,159 10.1 4,710 11.9
269 15.1 879 12.9 414 10.8
27,918 13,376
2,228 13,081
3,030
23,997 11,886 1,998 11,354 2,743
3,921 14.0 1,490 11.1
230 10.3 1,727 13.2
287 9.5
27,979 13,236
2,250 13,124
3,022
24,272 11,853 2,005 11,431 2,773
3,707 13.2 1,383 10.4
245 10.9 1,693 12.9
249 8.2
780 9,198 3,437 4,160 4,345
661 8,247 2,965 3,470 3,871
119 15.3 951 10.3 472 13.7 690 16.6 474 10.9
783 9,158 3,392 4,078 4,336
668 8,295 2,952 3,392 3,894
115 14.7 863 9.4 440 13.0 686 16.8 442 10.2
21,191 18,366 13,579
5,577 2,913
19,225 16,061 12,048
5,004 2,516
1,966 9.3 2,305 12.6 1,531 11.3
573 10.3 397 13.6
21,368 18,397 13,449
5,522 2,896
19,415 16,178 12,018
5,016 2,518
1,953 9.1 2,219 12.1 1,431 10.6
506 9.2 378 13.1
31,919 4,146 4,650 10,906 11,337
28,210 3,591 4,061 9,877 9,918
3,709 11.6 555 13.4 589 12.7
1,029 9.4 1,419 12.5
31,693 4,269 4,655
10,845 11,343
28,081 3,707 4,092 9,905 9,964
3,612 11.4 562 13.2 563 12.1 940 8.7
1,379 12.2
31,839 40,465 14,764
2,518 7,455
28,596 35,965 13,059
2,039 6,329
3,243 10.2 4,500 11.1 1,705 11.5
479 19.0 1,126 15.1
32,611 40,634 14,590
2,453 7,486
28,915 36,378 12,934
2,063 6,387
3,696 11.3 4,256 10.5 1,656 11.4
390 15.9 1,099 14.7
11,807 1,130 2,810 11,971 43,185
10,261 1,014 2,507
10,644 37,649
1,546 13.1 116 10.3 303 10.8
1,327 11.1 5,536 12.8
11,837 1,136 2,793 12,023 42,965
10,322 1,018 2,496
10,814 37,672
1,515 12.8 118 10.4 297 10.6
1,209 10.1 5,293 12.3
2,947 4,342 4,413 10,035
2,559 3,816 3,910 8,876
388 13.2 526 12.1 503 11.4 1,159 11.5
2,989 4,408 4,170 9,936
2,610 3,882 3,674 8,930
379 12.7 526 11.9 496 11.9 1,006 10.1
January 2010
Labor Force
Employment
Unemployment Number Rate
91,049 39,923
1,791 7,003 3,990
81,764 34,900
1,532 5,931 3,549
9,285 10.2 5,023 12.6
259 14.5 1,072 15.3
441 11.1
28,489 13,438
2,218 13,563
3,038
24,256 11,904 1,969 11,546 2,752
4,233 14.9 1,534 11.4
249 11.2 2,017 14.9
286 9.4
789 9,117 3,547 4,349 4,396
657 8,123 3,059 3,689 3,869
132 16.7 994 10.9 488 13.8 660 15.2 527 12.0
20,808 17,637 13,557
5,573 2,885
18,690 15,347 12,147
4,969 2,501
2,118 10.2 2,290 13.0 1,410 10.4
604 10.8 384 13.3
31,380 4,225 4,558
10,848 11,626
27,495 3,590 4,024 9,687
10,073
3,885 12.4 635 15.0 534 11.7
1,161 10.7 1,553 13.4
31,514 40,874 14,765
2,582 7,876
28,446 36,353 13,019
2,068 6,578
3,068 9.7 4,521 11.1 1,746 11.8
514 19.9 1,298 16.5
11,916 1,142 2,806 11,919 43,483
10,377 1,013 2,526
10,582 37,882
1,539 12.9 129 11.3 280 10.0
1,337 11.2 5,601 12.9
3,046 4,318 4,543 10,160
2,660 3,791 3,972 8,871
386 12.7 527 12.2 571 12.6 1,289 12.7
19
New Developments
Beachview Tent Rental, Inc., a company that provides temporary structures, tents, catering and equipment for weddings, sporting events, corporate functions and disaster relief, is moving its corporate headquarters to Camden County. The company has leased 30,000 square feet of an existing building in Camden County Industrial Park in Kingsland. The consolidation of their Jacksonville, FL and Brunswick offices will bring 45 new jobs to the local area. They will also add about 30 additional temporary employees to accommodate seasonal demands.
Forsyth County's shopping center, The Avenue Forsyth, will soon add a sporting goods store to their list of offerings. Academy Sports & Outdoors will bring 150 new jobs to the Cumming shopping center. The company plans to build a retail structure of 71,796 square feet.
The IT Headquarters of a German-based company is moving to Fulton County. ThyssenKrupp IT Services North America will locate their new facility in Alpharetta and are planning to fill 110 new positions. The company already has five divisions in Georgia, including an elevator products manufacturing operation that is also located in Alpharetta. They plan to invest $30 million in the new addition. Jobs will include help desk support, network engineers, project managers, telecom engineers, data center managers and Microsoft Windows support.
A new distillery will soon begin production in Jones County. Georgia Distilling Company, located near Haddock, plans to eventually offer a wide variety of alcoholic beverages. They will start out with ten employees, but expect to have between 50 and 100 working at their facility within three to five years.
The Salvation Army's Ray and Joan Kroc Corps Community Center is moving closer to opening its doors in the historic Harrisburg section of Augusta. The $100 million Richmond County structure could be completed as early as June of this year with a scheduled dedication in mid July and doors opening to the public in mid August. Located along the Augusta Canal, the campus will have one main building that includes a 400-seat performing arts theater and worship hall. The facility will also contain a 270-seat community hall with a stage for a dinner theater, an indoor aquatics center with water slide, a basket-
ball court, exercise facilities and classrooms for art, music, educational and recreational programs. Once operational the center plans to hire 110 workers.
A major pet food manufacturer is coming to Toombs County. U. S. Pet, a subsidiary of Thai Union Frozen Products, has signed a contract to locate their new gourmet pet food operation in the Toombs Corporate Center in Lyons. Initially the new operation will begin in the same building as Chicken of the Sea and either expand the existing building or build another facility as the need arises. The company will hire 150 people and invest $25 million into the project.
By the year 2014 Dollar Tree plans to nearly double the amount of merchandise that it imports through Savannah. The company plans to grow its center in Chatham County from 600,000 square feet to one million square feet to accommodate the increase in the flow of goods. This $18 million investment will result in 68 new jobs for the coastal community.
The expansion of Chase Bank in the metro Atlanta market will continue at a rapid pace and will add new locations designated initially in Cherokee, Forsyth, Fulton and Gwinnett Counties. The company is investing $24 million in order to open a dozen new branch offices. These new locations will add 170 new jobs and raise the total of branches in metro Atlanta to 74 by the end of 2011. Additionally, they plan to open about ten branches per year for the next several years. Five of this year's new branches will be located in Buckhead, Canton, Cumming, Lawrenceville and Roswell.
Another financial newcomer is attempting to gain a larger foothold in metro Atlanta. Fifth Third Bank plans to increase its local presence by raising their branch numbers from 22 to 130 by 2014. Their emphasis will be on locations inside Kroger stores.
In Gwinnett County a German company that makes hardware for kitchen cabinets, residential furniture and appliances is expanded their U. S. operations. Hettich America LP will add 100 new jobs in their recently opened 150,000 square foot facility in Buford. They expect to add additional positions in the coming years.
20
Georgia Unemployment Rates by County
January 2011
Dade
Catoosa
Murray
Fannin
Towns
Union
Rabun
Whitfield Walker
Gilmer
White Habersham
Chattooga
Gordon
Pickens
Lumpkin
Stephens
Floyd
Dawson
Banks Franklin Hart
Bartow Cherokee Forsyth
Hall
14.0% or greater 12.0% to 13.9% 10.5% to 11.9%
Jackson Madison Elbert
Polk Haralson
Paulding Cobb
Barrow Gwinnett
DeKalb
Walton
Douglas Fulton
Rockdale
Clarke Oconee
Oglethorpe Wilkes
Lincoln
Carroll
Clayton
Newton Morgan Greene Taliaferro
Columbia
Fayette
Henry
McDuffie
Coweta Heard
Spalding Butts Jasper Putnam
Warren Hancock Glascock
Richmond
Less than 10.5%
Troup
Meriwether Pike Lamar Monroe
Jones Baldwin
Jefferson Washington
Burke
Upson
Harris
Talbot
Muscogee
Bibb Crawford
Taylor
Peach
Wilkinson Twiggs
Johnson
Jenkins Emanuel
Screven
Marion Chattahoochee
Macon
Houston Bleckley
Laurens Treutlen
Candler Bulloch
Effingham
Schley Stewart Webster Sumter Quitman
Terrell Lee Randolph
Dooly Crisp
Pulaski Wilcox
Dodge
Montgomery
Wheeler
Toombs
Telfair
Evans Tattnall
Turner
Ben Hill
Jeff Davis Appling
Long
Bryan Liberty
Chatham
Clay Calhoun Dougherty
Early
Baker
Miller
Mitchell
Worth
Irwin Tift
Coffee
Colquitt
Berrien Atkinson Cook
Seminole Decatur
Grady
Thomas
Brooks
Lanier
Clinch
Lowndes Echols
Bacon
Wayne
Pierce
Ware
Brantley
McIntosh Glynn
Charlton
Camden
Georgia's Unemployment Rate: 10.5%
(Not Seasonally Adjusted)
21
Georgia Unemployment Insurance Claims by County
County
January Average Average Initial Weekly Duration
Claims Benefit Weeks
County
January Average Average Initial Weekly Duration
Claims Benefit Weeks
Georgia
89,659 ...... $258 ..... 14.5
Appling
241 ...... $227 ..... 14.3
Atkinson
194 ...... $209 ..... 12.1
Bacon
114 ...... $210 ..... 12.4
Baker
17 ...... $179 ..... 16.0
Baldwin
404 ...... $196 ..... 20.5
Banks
200 ...... $218 ..... 13.7
Barrow
598 ...... $245 ..... 16.5
Bartow
1,196 ...... $246 ..... 15.6
Ben Hill
601 ...... $192 ..... 11.6
Berrien
481 ...... $229 ..... 13.5
Bibb
1,372 ...... $193 ..... 17.0
Bleckley
162 ...... $212 ..... 13.4
Brantley
183 ...... $220 ..... 14.4
Brooks
164 ...... $183 ..... 14.6
Bryan
184 ...... $250 ..... 13.8
Bulloch
572 ...... $216 ..... 13.9
Burke
404 ...... $194 ..... 12.7
Butts
220 ...... $216 ..... 15.4
Calhoun
42 ...... $185 ..... 13.3
Camden
220 ...... $217 ..... 15.3
Candler
134 ...... $216 ..... 12.1
Carroll
1,716 ...... $226 ..... 13.6
Catoosa
527 ...... $227 ..... 11.5
Charlton
82 ...... $201 ..... 11.9
Chatham
1,725 ...... $213 ..... 14.6
Chattahoochee 15 ...... $178 ..... 15.4
Chattooga
108 ...... $235 ..... 15.7
Cherokee 1,121 ...... $259 ..... 16.8
Clarke
644 ...... $207 ..... 15.8
Clay
40 ...... $219 ..... 16.0
Clayton
2,298 ...... $225 ..... 16.8
Clinch
38 ...... $205 ..... 14.6
Cobb
3,232 ...... $252 ..... 17.5
Coffee
709 ...... $221 ..... 11.9
Colquitt
523 ...... $211 ..... 13.9
Columbia
507 ...... $239 ..... 14.4
Cook
252 ...... $216 ..... 15.4
Coweta
940 ...... $227 ..... 15.6
Crawford
84 ...... $241 ..... 17.5
Crisp
260 ...... $208 ..... 16.4
Dade
97 ...... $225 ..... 12.5
Dawson
221 ...... $259 ..... 16.1
Decatur
360 ...... $202 ..... 14.8
DeKalb
4,597 ...... $232 ..... 17.3
Dodge
157 ...... $217 ..... 15.4
Dooly
62 ...... $233 ..... 14.6
Dougherty
755 ...... $182 ..... 17.3
Douglas
945 ...... $245 ..... 16.9
Early
59 ...... $188 ..... 16.0
Echols
24 ...... $182 ..... 12.2
Effingham
333 ...... $251 ..... 12.2
Elbert Emanuel Evans Fannin Fayette Floyd Forsyth Franklin Fulton Gilmer Glascock Glynn Gordon Grady Greene Gwinnett Habersham Hall Hancock Haralson Harris Hart Heard Henry Houston Irwin Jackson Jasper Jeff Davis Jefferson Jenkins Johnson Jones Lamar Lanier Laurens Lee Liberty Lincoln Long Lowndes Lumpkin Macon Madison Marion McDuffie McIntosh Meriwether Miller Mitchell Monroe Montgomery Morgan Murray
897 ...... $229 ..... 11.0 488 ...... $199 ..... 13.5
86 ...... $202 ..... 13.4 358 ...... $209 ..... 13.3 390 ...... $250 ..... 17.7 1,404 ...... $226 ..... 13.1 739 ...... $264 ..... 17.9 336 ...... $222 ..... 13.1 4,976 ...... $224 ..... 17.4 433 ...... $239 ..... 11.0
44 ...... $233 ..... 12.8 731 ...... $204 ..... 15.4 1,644 ...... $238 ..... 10.2 358 ...... $225 ..... 12.6 229 ...... $200 ..... 13.9 3,890 ...... $255 ..... 17.2 814 ...... $194 ..... 11.1 1,996 ...... $238 ..... 14.5 212 ...... $190 ..... 17.8 400 ...... $236 ..... 12.8 228 ...... $218 ..... 13.4 505 ...... $219 ..... 11.1 179 ...... $221 ..... 13.8 1,337 ...... $246 ..... 16.9 781 ...... $219 ..... 15.9 210 ...... $196 ..... 14.3 552 ...... $233 ..... 15.5 187 ...... $227 ..... 15.5 270 ...... $227 ..... 13.6 389 ...... $183 ..... 13.0 205 ...... $197 ..... 16.2 163 ...... $199 ..... 14.8 210 ...... $228 ..... 17.5 218 ...... $191 ..... 15.3 108 ...... $200 ..... 13.7 886 ...... $209 ..... 13.5 255 ...... $228 ..... 16.5 253 ...... $210 ..... 16.5 123 ...... $232 ..... 11.6
47 ...... $228 ..... 15.5 934 ...... $185 ..... 14.4 414 ...... $233 ..... 13.5 131 ...... $185 ..... 13.6 397 ...... $224 ..... 14.1
80 ...... $208 ..... 14.8 577 ...... $187 ..... 11.7 107 ...... $222 ..... 15.9 465 ...... $202 ..... 11.5
50 ...... $201 ..... 13.3 143 ...... $190 ..... 16.2 151 ...... $241 ..... 16.1 189 ...... $213 ..... 12.1 199 ...... $227 ..... 14.0 1,629 ...... $241 ....... 8.3
Initial claims include intrastate initial and additional claims, as well as agent state initial and additional claims for regular UI only. Average duration of benefits is represented in weeks.
22
County
January Average Average Initial Weekly Duration
Claims Benefit Weeks
Muscogee Newton Oconee Oglethorpe Paulding Peach Pickens Pierce Pike Polk Pulaski Putnam Quitman Rabun Randolph Richmond Rockdale Schley Screven Seminole Spalding Stephens Stewart Sumter Talbot Taliaferro Tattnall Taylor Telfair Terrell Thomas Tift Toombs Towns Treutlen Troup Turner Twiggs Union Upson Walker Walton Ware Warren Washington Wayne Webster Wheeler White Whitfield Wilcox Wilkes Wilkinson Worth
1,771 ...... $199 ..... 13.7 1,037 ...... $229 ..... 16.1
154 ...... $226 ..... 17.1 174 ...... $235 ..... 14.6 879 ...... $260 ..... 17.2 211 ...... $198 ..... 16.4 338 ...... $243 ..... 14.8 256 ...... $210 ..... 12.5 217 ...... $230 ..... 15.1 649 ...... $237 ..... 11.8
66 ...... $212 ..... 14.6 562 ...... $229 ..... 14.0
2 ...... $189 ..... 12.9 222 ...... $218 ..... 13.7 186 ...... $238 ..... 11.6 1,532 ...... $204 ..... 14.0 715 ...... $235 ..... 16.4
68 ...... $206 ..... 15.9 329 ...... $206 ..... 12.8
63 ...... $203 ..... 15.7 1,033 ...... $199 ..... 15.7
515 ...... $215 ..... 11.5 54 ...... $205 ..... 14.5
371 ...... $172 ..... 15.8 116 ...... $206 ....... 9.9 31 ...... $161 ..... 13.3 156 ...... $212 ..... 13.6 134 ...... $194 ..... 14.8 121 ...... $203 ..... 14.4 106 ...... $178 ..... 17.1 378 ...... $204 ..... 15.7 479 ...... $211 ..... 18.0 489 ...... $213 ..... 12.5 97 ...... $207 ..... 16.9 131 ...... $226 ..... 12.9 1,048 ...... $216 ..... 12.1 167 ...... $187 ..... 16.2 109 ...... $203 ..... 14.1 282 ...... $222 ..... 14.5 323 ...... $203 ..... 13.7 639 ...... $239 ..... 10.8 674 ...... $235 ..... 16.0 534 ...... $192 ..... 12.7 284 ...... $181 ..... 13.0 196 ...... $186 ..... 17.7 259 ...... $213 ..... 15.0
20 ...... $196 ..... 17.0 70 ...... $200 ..... 13.1 335 ...... $198 ..... 14.0 4,183 ...... $233 ....... 8.1 71 ...... $211 ..... 15.1 204 ...... $208 ..... 12.0 110 ...... $205 ..... 17.0 197 ...... $203 ..... 18.2
Georgia Department of Labor Workforce Information & Analysis 148 Andrew Young International Boulevard, N.E. Atlanta, Georgia 30303-1751
Return Service Requested