- Collection:
- Georgia Government Publications
- Title:
- Dimensions: measuring Georgia's workforce, Vol. 36, no. 8 (Aug. 2010)
- Creator:
- Georgia. Department of Labor
- Contributor to Resource:
- Georgia. Workforce Information and Analysis
- Publisher:
- Atlanta, Ga. : Georgia Dept. of Labor, 2010-08
- Date of Original:
- 2010-08
- Subject:
- Labor market--Georgia--Statistics
Wages--Georgia--Statistics
Hours of labor--Georgia--Statistics - Location:
- United States, Georgia, 32.75042, -83.50018
- Medium:
- state government records
- Type:
- Text
- Format:
- application/pdf
- External Identifiers:
- Call Number GA L200.E46 P1 T7 36/8
- Metadata URL:
- https://dlg.galileo.usg.edu/id:dlg_ggpd_i-ga-bl200-pe46-bp1-bt7-b36-s8-belec-p-btext
- Digital Object URL:
- https://dlg.galileo.usg.edu/do:dlg_ggpd_i-ga-bl200-pe46-bp1-bt7-b36-s8-belec-p-btext
- Language:
- eng
- Holding Institution:
- University of Georgia. Map and Government Information Library
- Rights:
-

August 2010 Data
August 2010 Employment Situation
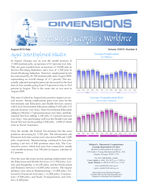
In August, Georgia saw an over the month increase of 17,800 nonfarm jobs, an increase of 0.5 percent over July. This net gain resulted from an increase of 19,000 jobs in Service-Providing Industries and a loss of 1,200 jobs in Goods-Producing Industries. However, employment levels have decreased by 26,700 nonfarm jobs since August 2009, representing an overall change of -0.7 percent. The seasonally adjusted unemployment rate increased for the first time in four months going from 9.9 percent in July to 10.0 percent in August. This is the same rate as was seen in August 2009.
The start of school in August had a positive impact on several sectors. Strong employment gains were seen for the Government and Education and Health Services sectors with Local Government Education adding 9,100 jobs (3.8 percent increase over July), State Government Education adding 6,100 jobs (7.5 percent increase over July), and Educational Services adding 2,100 jobs (2.3 percent increase over July). Also performing well was the Health Care and Social Services sector gaining 5,800 jobs 4,000 of which were in Social Assistance.
Over the month, the Federal Government lost the most positions decreasing by 3,700 jobs. The Information and Financial Activities sectors were also down 900 and 1,000 jobs, respectively. Manufacturing continued to lose jobs posting a net loss of 800 positions since July. The Construction sector, which had seen four consecutive month over month increases, lost 700 jobs in August, a decline of 0.5 percent.
Over the year, the major sectors gaining employment were the Education and Health Services (+11,500 jobs), Leisure and Hospitality (+10,100 jobs), and the Professional and Business Services (+4,000 jobs) sectors. The largest declines were seen in Manufacturing (-15,800 jobs), followed by Financial Activities (-14,900 jobs), Construction (-9,000 jobs), and Trade, Transportation, and Utilities (-8,400 jobs).
Volume XXXVI, Number 8
Georgia Employment
(In Millions)
3.847
3.836
3.845
3.855
3.835
3.778
3.785
3.795
3.819
3.838
3.827
3.803
3.802
Aug Sep Oct Nov Dec Jan Feb Mar Apr May Jun Jul Aug
2009
2010
Georgia Unemployment Rate
(Seasonally Adjusted)
10.5% 10.5%
10.4%
10.3%
10.3%
10.2% 10.2%
10.1%
10.1%
10.0%
10.0%
9.9%
10.0%
Aug Sep Oct Nov Dec Jan Feb Mar Apr May Jun Jul Aug
2009
2010
Michael L. Thurmond, Commissioner Georgia Department of Labor
Workforce Information & Analysis 148 Andrew Young International Blvd., N.E.
Atlanta, Georgia 30303-1751
For more information, contact Corey Smith at (404) 232-3875 ext. 21299 or Agata Wardak at (404)232-3875 ext. 21310
corey.smith@dol.state.ga.us agata.wardak@dol.state.ga.us
Equal Opportunity Employer/Program Auxiliary Aids and Services Available upon
Request to Individuals with Disabilities
GEORGIA Nonagricultural Employment (000s)
Change in Jobs
Change in Jobs
Preliminary Revised
Revised
AUG 2010 JUL 2010 AUG 2009
from JUL 2010 Net %
from AUG 2009 Net %
Total Nonfarm
3,820.3
3,802.5
3,847.0
17.8 0.5
-26.7 -0.7
Total Private
3,149.1
3,140.1
3,174.8
9.0 0.3
-25.7 -0.8
Goods Producing
498.4
499.6
523.3
-1.2 -0.2
-24.9 -4.8
Service-Providing
3,321.9
3,302.9
3,323.7
19.0 0.6
-1.8 -0.1
Private Service-Providing
2,650.7
2,640.5
2,651.5
10.2 0.4
-0.8 0.0
Mining and Logging
9.2
8.9
9.3
0.3 3.4
-0.1 -1.1
Construction
153.0
153.7
162.0
-0.7 -0.5
-9.0 -5.6
Construction of Buildings
31.7
31.2
34.0
0.5 1.6
-2.3 -6.8
Heavy and Civil Engineering Construction
25.7
25.6
25.6
0.1 0.4
0.1 0.4
Specialty Trade Contractors
95.6
96.9
102.4
-1.3 -1.3
-6.8 -6.6
Manufacturing
336.2
337.0
352.0
-0.8 -0.2
-15.8 -4.5
Durable Goods
148.0
148.3
157.4
-0.3 -0.2
-9.4 -6.0
Computer, Electrical Equip and Appliance Mfg
19.7
19.9
21.2
-0.2 -1.0
-1.5 -7.1
Transportation Equipment Manufacturing
34.8
34.8
35.9
0.0 0.0
-1.1 -3.1
Non-Durable Goods
188.2
188.7
194.6
-0.5 -0.3
-6.4 -3.3
Food Manufacturing
61.2
61.3
62.8
-0.1 -0.2
-1.6 -2.6
Textile Mills
17.9
17.9
18.6
0.0 0.0
-0.7 -3.8
Textile Product Mills
30.8
31.1
31.4
-0.3 -1.0
-0.6 -1.9
Trade, Transportation and Utilities
805.9
804.6
814.3
1.3 0.2
-8.4 -1.0
Wholesale Trade
192.8
192.0
197.4
0.8 0.4
-4.6 -2.3
Merchant Wholesalers, Durable Goods
92.7
92.2
97.3
0.5 0.5
-4.6 -4.7
Merchant Wholesalers, Non-durable Goods
57.8
57.9
58.9
-0.1 -0.2
-1.1 -1.9
Wholesale Electronic Markets and Agents and Brokers
42.3
41.9
41.2
0.4 1.0
1.1 2.7
Retail Trade
431.4
432.2
436.7
-0.8 -0.2
-5.3 -1.2
Food and Beverage Stores
78.7
78.5
79.2
0.2 0.3
-0.5 -0.6
General Merchandise Stores
95.2
95.7
97.9
-0.5 -0.5
-2.7 -2.8
Miscellaneous Store Retailers
19.1
19.2
20.5
-0.1 -0.5
-1.4 -6.8
Transportation, Warehousing, and Utilities
181.7
180.4
180.2
1.3 0.7
1.5 0.8
Utilities
20.2
20.3
20.1
-0.1 -0.5
0.1 0.5
Transportation and Warehousing
161.5
160.1
160.1
1.4 0.9
1.4 0.9
Air Transportation
40.5
40.3
40.2
0.2 0.5
0.3 0.8
Truck Transportation
42.0
41.6
43.0
0.4 1.0
-1.0 -2.3
Couriers and Messengers
17.4
17.3
18.4
0.1 0.6
-1.0 -5.4
Warehousing and Storage
26.9
26.6
26.6
0.3 1.1
0.3 1.1
Information
100.9
101.8
103.9
-0.9 -0.9
-3.0 -2.9
Telecommunications
50.4
50.4
50.9
0.0 0.0
-0.5 -1.0
Wired Telecommunications Carriers
28.6
28.6
28.9
0.0 0.0
-0.3 -1.0
Wireless Telecommunications Carriers
11.0
10.9
10.5
0.1 0.9
0.5 4.8
Internet Service Providers, Search Portals, and DP
6.2
6.3
6.6
-0.1 -1.6
-0.4 -6.1
Financial Activities
196.2
197.2
211.1
-1.0 -0.5
-14.9 -7.1
Finance and Insurance
142.9
143.8
154.0
-0.9 -0.6
-11.1 -7.2
Insurance Carriers and Related Activities
63.6
63.6
66.1
0.0 0.0
-2.5 -3.8
Real Estate, Rental and Leasing
53.3
53.4
57.1
-0.1 -0.2
-3.8 -6.7
Professional and Business Services
505.6
503.8
501.6
1.8 0.4
4.0 0.8
Professional, Scientific, and Technical Services
206.9
206.0
209.5
0.9 0.4
-2.6 -1.2
Accounting, Tax Preparation and Bookkeeping
31.4
31.1
31.1
0.3 1.0
0.3 1.0
Architectural, Engineering and Related Services
31.9
32.0
35.3
-0.1 -0.3
-3.4 -9.6
Computer Systems Design and Related Services
44.9
44.8
46.3
0.1 0.2
-1.4 -3.0
Management and Technical Consulting Services
31.2
31.4
30.1
-0.2 -0.6
1.1 3.7
Management of Companies and Enterprises
49.3
49.2
49.5
0.1 0.2
-0.2 -0.4
Admin and Support, Waste Mngmnt and Remediation
249.4
248.6
242.6
0.8 0.3
6.8 2.8
Employment Services
111.6
111.6
99.6
0.0 0.0
12.0 12.1
Educational and Health Services
487.9
480.0
476.4
7.9 1.7
11.5 2.4
Educational Services
93.4
91.3
85.8
2.1 2.3
7.6 8.9
Colleges, Universities, and Professional Schools
57.1
57.6
54.2
-0.5 -0.9
2.9 5.4
Health Care and Social Assistance
394.5
388.7
390.6
5.8 1.5
3.9 1.0
Ambulatory Health Care Services
146.2
144.5
148.8
1.7 1.2
-2.6 -1.8
Hospitals
132.7
132.2
129.9
0.5 0.4
2.8 2.2
Nursing and Residential Care Facilities
55.2
55.6
56.1
-0.4 -0.7
-0.9 -1.6
Social Assistance
60.4
56.4
55.8
4.0 7.1
4.6 8.2
Leisure and Hospitality
395.9
394.7
385.8
1.2 0.3
10.1 2.6
Arts, Entertainment, and Recreation
46.8
48.1
43.5
-1.3 -2.7
3.3 7.6
Amusement, Gambling, and Recreation
31.7
33.9
32.5
-2.2 -6.5
-0.8 -2.5
Accommodation and Food Services
349.1
346.6
342.3
2.5 0.7
6.8 2.0
Accommodation
39.6
39.7
40.7
-0.1 -0.3
-1.1 -2.7
Food Services and Drinking Places
309.5
306.9
301.6
2.6 0.9
7.9 2.6
Other Services
158.3
158.4
158.4
-0.1 -0.1
-0.1 -0.1
Repair and Maintenance
34.3
34.3
34.4
0.0 0.0
-0.1 -0.3
Personal and Laundry Services
32.8
32.4
33.8
0.4 1.2
-1.0 -3.0
Religious, Grantmaking, Civic, Professional and Similar
91.2
91.7
90.2
-0.5 -0.6
1.0 1.1
Government
671.2
662.4
672.2
8.8 1.3
-1.0 -0.2
Federal Government
102.6
106.3
99.0
-3.7 -3.5
3.6 3.6
Department of Defense
40.1
40.3
38.4
-0.2 -0.5
1.7 4.4
State Government
161.0
157.8
159.8
3.2 2.0
1.2 0.8
State Government Education
87.9
81.8
78.1
6.1 7.5
9.8 12.6
Local Government
407.6
398.3
413.4
9.3 2.3
-5.8 -1.4
Local Government Education
247.1
238.0
251.9
9.1 3.8
-4.8 -1.9
Note: These preliminary estimates were prepared in cooperation with the U.S. Department of Labor, Bureau of Labor Statistics, based upon monthly reports submitted by selected employers
throughout Georgia. The estimates include all full- and part-time wage and salary workers who were employed during or received pay for any part of the pay period that includes the twelfth of the
month. Proprietors, domestic workers, self-employed persons, unpaid family workers and personnel of the armed forces are excluded. Estimates based on 2009 benchmark.
2
Source: Georgia Department of Labor, Workforce Information & Analysis
ATLANTA MSA Nonagricultural Employment (000s)
Preliminary AUG 2010
Revised
Revised
JUL 2010 AUG 2009
Change in Jobs
from JUL 2010
Net
%
Change in Jobs from AUG 2009
Net %
Total Nonfarm Total Private Goods Producing Service-Providing Private Service-Providing
Mining and Logging Construction Construction of Buildings Specialty Trade Contractors Manufacturing Durable Goods Transportation Equipment Manufacturing Non-Durable Goods Food Manufacturing Trade, Transportation and Utilities Wholesale Trade Merchant Wholesalers, Durable Goods Merchant Wholesalers, Non-durable Goods Wholesale Electronic Markets and Agents and Brokers Retail Trade Food and Beverage Stores General Merchandise Stores Miscellaneous Store Retailers Transportation, Warehousing, and Utilities Utilities Transportation and Warehousing Air Transportation Truck Transportation Couriers and Messengers Information Telecommunications Wired Telecommunications Carriers Wireless Telecommunications Carriers Internet Service Providers, Search Portals, and DP Financial Activities Finance and Insurance Insurance Carriers and Related Activities Real Estate, Rental and Leasing Professional and Business Services Professional, Scientific, and Technical Services Accounting, Tax Preparation and Bookkeeping Architectural, Engineering and Related Services Computer Systems Design and Related Services Management and Technical Consulting Services Management of Companies and Enterprises Admin and Support, Waste Mngmnt and Remediation Employment Services Educational and Health Services Educational Services Health Care and Social Assistance Ambulatory Health Care Services Hospitals Social Assistance Leisure and Hospitality Arts, Entertainment, and Recreation Accommodation and Food Services Accommodation Food Services and Drinking Places Other Services Repair and Maintenance Personal and Laundry Services Government Federal Government State Government Local Government
2,268.5 1,946.5
233.1 2,035.4 1,713.4
1.2 92.5 17.3 59.3 139.4 66.1 13.1 73.3 22.7 514.1 140.5 69.4 37.7 33.4 249.0 47.4 51.8 12.6 124.6 10.9 113.7 39.6 24.5 13.8 75.4 36.8 23.3
9.2 5.8 134.6 95.6 43.3 39.0 376.2 162.5 22.3 23.8 36.6 27.3 37.6 176.1 77.2 280.1 60.8 219.3 83.4 72.8 34.1 229.3 29.7 199.6 21.9 177.7 103.7 18.5 22.0 322.0 47.6 67.1 207.3
2,253.7 1,938.6
234.5 2,019.2 1,704.1
1.2 93.9 17.4 59.8 139.4 66.2 13.1 73.2 22.8 511.3 139.6 68.9 37.9 32.8 247.9 47.2 52.0 12.6 123.8 10.9 112.9 39.4 24.4 13.8 76.1 36.8 23.3
9.2 5.9 135.5 96.2 43.3 39.3 374.4 161.9 22.1 23.7 36.2 27.3 37.5 175.0 77.8 274.7 59.7 215.0 82.1 72.5 31.6 229.2 31.5 197.7 21.9 175.8 102.9 18.5 21.9 315.1 49.3 64.0 201.8
2,268.3 1,946.7
242.1 2,026.2 1,704.6
1.3 97.8 20.0 62.7 143.0 70.0 12.8 73.0 23.3 514.2 144.6 72.8 39.0 32.8 246.7 47.0 51.9 13.3 122.9 11.0 111.9 38.9 25.3 14.5 79.9 36.9 23.5
8.5 6.2 145.4 104.4 44.7 41.0 368.5 164.4 22.0 26.4 38.5 26.7 37.0 167.1 69.0 268.0 57.2 210.8 82.6 70.1 33.8 227.2 29.3 197.9 22.0 175.9 101.4 19.4 22.7 321.6 46.7 65.4 209.5
14.8 0.7 7.9 0.4 -1.4 -0.6
16.2 0.8 9.3 0.6 0.0 0.0 -1.4 -1.5 -0.1 -0.6 -0.5 -0.8 0.0 0.0 -0.1 -0.2 0.0 0.0 0.1 0.1 -0.1 -0.4 2.8 0.6 0.9 0.6 0.5 0.7 -0.2 -0.5 0.6 1.8 1.1 0.4 0.2 0.4 -0.2 -0.4 0.0 0.0 0.8 0.7 0.0 0.0 0.8 0.7 0.2 0.5 0.1 0.4 0.0 0.0 -0.7 -0.9 0.0 0.0 0.0 0.0 0.0 0.0 -0.1 -1.7 -0.9 -0.7 -0.6 -0.6 0.0 0.0 -0.3 -0.8 1.8 0.5 0.6 0.4 0.2 0.9 0.1 0.4 0.4 1.1 0.0 0.0 0.1 0.3 1.1 0.6 -0.6 -0.8 5.4 2.0 1.1 1.8 4.3 2.0 1.3 1.6 0.3 0.4 2.5 7.9 0.1 0.0 -1.8 -5.7 1.9 1.0 0.0 0.0 1.9 1.1 0.8 0.8 0.0 0.0 0.1 0.5 6.9 2.2 -1.7 -3.5 3.1 4.8 5.5 2.7
0.2 -0.2 -9.0 9.2 8.8 -0.1 -5.3 -2.7 -3.4 -3.6 -3.9 0.3 0.3 -0.6 -0.1 -4.1 -3.4 -1.3 0.6 2.3 0.4 -0.1 -0.7 1.7 -0.1 1.8 0.7 -0.8 -0.7 -4.5 -0.1 -0.2 0.7 -0.4 -10.8 -8.8 -1.4 -2.0 7.7 -1.9 0.3 -2.6 -1.9 0.6 0.6 9.0 8.2 12.1 3.6 8.5 0.8 2.7 0.3 2.1 0.4 1.7 -0.1 1.8 2.3 -0.9 -0.7 0.4 0.9 1.7 -2.2
0.0 0.0 -3.7 0.5 0.5 -7.7 -5.4 -13.5 -5.4 -2.5 -5.6 2.3 0.4 -2.6 0.0 -2.8 -4.7 -3.3 1.8 0.9 0.9 -0.2 -5.3 1.4 -0.9 1.6 1.8 -3.2 -4.8 -5.6 -0.3 -0.9 8.2 -6.5 -7.4 -8.4 -3.1 -4.9 2.1 -1.2 1.4 -9.9 -4.9 2.3 1.6 5.4 11.9 4.5 6.3 4.0 1.0 3.9 0.9 0.9 1.4 0.9 -0.5 1.0 2.3 -4.6 -3.1 0.1 1.9 2.6 -1.1
Note: These preliminary estimates were prepared in cooperation with the U.S. Department of Labor, Bureau of Labor Statistics, based upon monthly reports submitted by selected employers
in the Atlanta Metropolitan Statistical Area, which includes Barrow, Bartow, Butts, Carroll, Cherokee, Clayton, Cobb, Coweta, Dawson, DeKalb, Douglas, Fayette, Forsyth, Fulton, Gwinnett, Haralson, Heard, Henry, Jasper, Lamar, Meriwether, Newton, Paulding, Pickens, Pike, Rockdale, Spalding and Walton counties. The estimates include all full- and part-time wage and salary workers who were employed during or received pay for any part of the pay period that includes the twelfth of the month. Proprietors, domestic workers, self-employed persons, unpaid family workers and personnel of the armed forces are excluded. Estimates based on 2009 benchmark.
Source: Georgia Department of Labor, Workforce Information & Analysis
3
ALBANY MSA Nonagricultural Employment (000s)
Preliminary AUG 2010
Revised Revised JUL 2010 AUG 2009
Change in Jobs from JUL 2010
Net %
Change in Jobs
from AUG 2009
Net
%
Total Nonfarm Total Private
61.8
61.7
61.3
48.2
48.1
47.8
0.1 0.2 0.1 0.2
0.5 0.8 0.4 0.8
Goods Producing Service-Providing Private Service-Providing
7.4
7.4
8.1
54.4
54.3
53.2
40.8
40.7
39.7
0.0 0.0 0.1 0.2 0.1 0.3
-0.7 -8.6 1.2 2.3 1.1 2.8
Manufacturing Trade, Transportation and Utilities Retail Trade
4.9
4.8
5.3
0.1 2.1
12.6
12.7
12.3
-0.1 -0.8
7.5
7.5
7.5
0.0 0.0
-0.4 -7.6 0.3 2.4 0.0 0.0
Government Federal Government State Government
13.6
13.6
13.5
0.0 0.0
3.5
3.7
3.4
-0.2 -5.4
2.8
2.8
2.7
0.0 0.0
0.1 0.7 0.1 2.9 0.1 3.7
Local Government
7.3
7.1
7.4
0.2 2.8
-0.1 -1.4
Note: These preliminary estimates were prepared in cooperation with the U.S. Department of Labor, Bureau of Labor Statistics, based upon monthly reports submitted by selected employers
in the Albany Metropolitan Statistical Area, which includes Baker, Dougherty, Lee, Terrell and Worth counties. The estimates include all full- and part-time wage and salary workers who were employed during or received pay for any part of the pay period that includes the twelfth of the month. Proprietors, domestic workers, self-employed persons, unpaid family workers and personnel
of the armed forces are excluded. Estimates based on 2009 benchmark.
ATHENS - CLARKE MSA Nonagricultural Employment (000s)
Preliminary AUG 2010
Revised Revised JUL 2010 AUG 2009
Change in Jobs
from JUL 2010
Net
%
Change in Jobs from AUG 2009
Net %
Total Nonfarm
80.4
79.5
79.9
0.9 1.1
0.5 0.6
Total Private
56.0
55.5
56.3
0.5 0.9
-0.3 -0.5
Goods Producing
9.7
9.7
10.2
0.0 0.0
-0.5 -4.9
Service-Providing
70.7
69.8
69.7
0.9 1.3
1.0 1.4
Private Service-Providing
46.3
45.8
46.1
0.5 1.1
0.2 0.4
Trade, Transportation and Utilities
13.0
13.0
13.2
0.0 0.0
-0.2 -1.5
Retail Trade
9.4
9.4
9.5
0.0 0.0
-0.1 -1.1
Professional and Business Services
6.9
6.8
6.2
0.1 1.5
0.7 11.3
Leisure and Hospitality
8.4
8.3
8.2
0.1 1.2
0.2 2.4
Government
24.4
24.0
23.6
0.4 1.7
0.8 3.4
Federal Government
1.7
1.7
1.6
0.0 0.0
0.1 6.3
State Government
14.7
14.7
14.0
0.0 0.0
0.7 5.0
Local Government
8.0
7.6
8.0
0.4 5.3
0.0 0.0
Note: These preliminary estimates were prepared in cooperation with the U.S. Department of Labor, Bureau of Labor Statistics, based upon monthly reports submitted by selected employers in
the Athens - Clarke County Metropolitan Statistical Area, which includes Clarke, Madison, Oconee and Oglethorpe counties. The estimates include all full- and part-time wage and salary workers who were employed during or received pay for any part of the pay period that includes the twelfth of the month. Proprietors, domestic workers, self-employed persons, unpaid family workers and personnel of the armed forces are excluded. Estimates based on 2009 benchmark.
Source: Georgia Department of Labor, Workforce Information & Analysis
4
AUGUSTA-RICHMOND MSA Nonagricultural Employment (000s)
Preliminary Revised Revised AUG 2010 JUL 2010 AUG 2009
Change in Jobs from JUL 2010
Net %
Change in Jobs from AUG 2009
Net %
Total Nonfarm Total Private Goods Producing Service-Providing Private Service-Providing Mining, Logging, and Construction Manufacturing Trade, Transportation and Utilities Wholesale Trade Retail Trade Transportation,Warehousing, and Utilities Information Financial Activitities Professional and Business Services Educational and Health Services Leisure and Hospitality Other Services Government Federal Government State Government Local Government
210.7 168.0
30.1 180.6 137.9
10.7 19.4 36.2
4.5 25.2
6.5 2.8 7.2 30.9 29.0 21.8 10.0 42.7 8.9 13.3 20.5
210.8 168.0
30.1 180.7 137.9
10.7 19.4 36.1
4.4 25.2
6.5 2.8 7.2 31.5 28.6 21.8 9.9 42.8 9.1 13.3 20.4
206.9 164.4
31.1 175.8 133.3
10.9 20.2 34.9
4.5 24.1
6.3 2.8 7.6 28.7 28.6 21.2 9.5 42.5 8.4 13.4 20.7
-0.1 -0.1 0.0 0.0 0.0 0.0 -0.1 -0.1 0.0 0.0 0.0 0.0 0.0 0.0 0.1 0.3 0.1 2.3 0.0 0.0 0.0 0.0 0.0 0.0 0.0 0.0 -0.6 -1.9 0.4 1.4 0.0 0.0 0.1 1.0 -0.1 -0.2 -0.2 -2.2 0.0 0.0 0.1 0.5
3.8 1.8 3.6 2.2 -1.0 -3.2 4.8 2.7 4.6 3.5 -0.2 -1.8 -0.8 -4.0 1.3 3.7 0.0 0.0 1.1 4.6 0.2 3.2 0.0 0.0 -0.4 -5.3 2.2 7.7 0.4 1.4 0.6 2.8 0.5 5.3 0.2 0.5 0.5 6.0 -0.1 -0.8 -0.2 -1.0
Note: These preliminary estimates were prepared in cooperation with the U.S. Department of Labor, Bureau of Labor Statistics, based upon monthly reports submitted by selected employers in the
Augusta - Richmond County Metropolitan Statistical Area, which includes Burke, Columbia, McDuffie and Richmond counties in Georgia and Aiken and Edgefield counties in South Carolina. The estimates include all full- and part-time wage and salary workers who were employed during or received pay for any part of the pay period that includes the twelfth of the month. Proprietors, domestic
workers, self-employed persons, unpaid family workers and personnel of the armed forces are excluded. Estimates based on 2009 benchmark.
BRUNSWICK MSA Nonagricultural Employment (000s)
Preliminary Revised Revised AUG 2010 JUL 2010 AUG 2009
Change in Jobs from JUL 2010
Net %
Change in Jobs from AUG 2009
Net %
Total Nonfarm Total Private Goods Producing Service-Providing Private Service-Providing Trade, Transportation and Utilities
Retail Trade Government
Federal Government State Government Local Government
41.5
41.7
42.5
-0.2 -0.5
31.4
31.8
32.1
-0.4 -1.3
4.5
4.5
4.8
0.0 0.0
37.0
37.2
37.7
-0.2 -0.5
26.9
27.3
27.3
-0.4 -1.5
7.7
7.6
7.9
0.1 1.3
5.5
5.5
5.6
0.0 0.0
10.1
9.9
10.4
0.2 2.0
1.9
2.0
2.0
-0.1 -5.0
1.6
1.5
1.9
0.1 6.7
6.6
6.4
6.5
0.2 3.1
-1.0 -2.4 -0.7 -2.2 -0.3 -6.3 -0.7 -1.9 -0.4 -1.5 -0.2 -2.5 -0.1 -1.8 -0.3 -2.9 -0.1 -5.0 -0.3 -15.8 0.1 1.5
Note: These preliminary estimates were prepared in cooperation with the U.S. Department of Labor, Bureau of Labor Statistics, based upon monthly reports submitted by selected
employers in the Brunswick Metropolitan Statistical Area, which includes Brantley, Glynn and McIntosh counties. The estimates include all full- and part-time wage and salary workers who were employed during or received pay for any part of the pay period that includes the twelfth of the month. Proprietors, domestic workers, self-employed persons, unpaid family workers and personnel of the armed forces are excluded. Estimates based on 2009 benchmark.
Source: Georgia Department of Labor, Workforce Information & Analysis
5
COLUMBUS MSA Nonagricultural Employment (000s)
Preliminary AUG 2010
Revised Revised JUL 2010 AUG 2009
Change in Jobs from JUL 2010
Net %
Change in Jobs from AUG 2009
Net %
Total Nonfarm Total Private Goods Producing
116.5 93.4 13.4
116.4 93.4 13.4
117.0 94.1 14.3
0.1 0.1 0.0 0.0 0.0 0.0
-0.5 -0.4 -0.7 -0.7 -0.9 -6.3
Service-Providing Private Service-Providing Trade, Transportation and Utilities
103.1 80.0 17.8
103.0 80.0 17.7
102.7 79.8 17.9
0.1 0.1 0.0 0.0 0.1 0.6
0.4 0.4 0.2 0.3 -0.1 -0.6
Retail Trade Information Financial Activities
12.5
12.5
12.7
0.0 0.0
5.5
5.6
5.6
-0.1 -1.8
8.3
8.3
8.6
0.0 0.0
-0.2 -1.6 -0.1 -1.8 -0.3 -3.5
Finance and Insurance Insurance Carriers and Related Activities Professional and Business Services
6.8
6.9
6.9
-0.1 -1.5
4.5
4.5
4.7
0.0 0.0
13.2
13.1
13.6
0.1 0.8
-0.1 -1.5 -0.2 -4.3 -0.4 -2.9
Leisure and Hospitality Government Federal Government
13.6
13.6
13.5
0.0 0.0
23.1
23.0
22.9
0.1 0.4
6.1
6.4
5.8
-0.3 -4.7
0.1 0.7 0.2 0.9 0.3 5.2
State Government Local Government
4.1
4.1
4.0
12.9
12.5
13.1
0.0 0.0 0.4 3.2
0.1 2.5 -0.2 -1.5
Note: These preliminary estimates were prepared in cooperation with the U.S. Department of Labor, Bureau of Labor Statistics, based upon monthly reports submitted by selected
employers in the Columbus Metropolitan Statistical Area, which includes Chattahoochee, Harris, Marion and Muscogee counties in Georgia and Russell County in Alabama. The estimates include all full- and part-time wage and salary workers who were employed during or received pay for any part of the pay period that includes the twelfth of the month. Proprietors, domestic workers, self-employed persons, unpaid family workers and personnel of the armed forces are excluded. Estimates based on 2009 benchmark.
DALTON MSA Nonagricultural Employment (000s)
Preliminary Revised
Revised
AUG 2010 JUL 2010 AUG 2009
Change in Jobs from JUL 2010
Net %
Change in Jobs from AUG 2009
Net %
Total Nonfarm Total Private
64.8
65.0
65.6
-0.2 -0.3
57.8
57.9
58.6
-0.1 -0.2
-0.8 -1.2 -0.8 -1.4
Goods Producing
24.5
24.7
25.7
-0.2 -0.8
-1.2 -4.7
Service-Providing Private Service-Providing
40.3
40.3
39.9
0.0 0.0
33.3
33.2
32.9
0.1 0.3
0.4 1.0 0.4 1.2
Manufacturing
23.5
23.6
24.5
-0.1 -0.4
-1.0 -4.1
Textile Mills Textile Product Mills
2.3
2.3
2.3
0.0 0.0
17.6
17.7
17.9
-0.1 -0.6
0.0 0.0 -0.3 -1.7
Trade, Transportation and Utilities
14.3
14.3
14.4
0.0 0.0
-0.1 -0.7
Retail Trade Transportation, Warehouse, and Utilities
7.3
7.3
3.4
3.4
7.4
0.0 0.0
-0.1 -1.4
3.4
0.0 0.0
0.0 0.0
Professional and Business Services
5.4
5.4
5.9
0.0 0.0
-0.5 -8.5
Government Federal Government
7.0
7.1
0.3
0.4
7.0
-0.1 -1.4
0.3
-0.1 -25.0
0.0 0.0 0.0 0.0
State Government
1.1
1.0
1.1
0.1 10.0
0.0 0.0
Local Government
5.6
5.7
5.6
-0.1 -1.8
0.0 0.0
Note: These preliminary estimates were prepared in cooperation with the U.S. Department of Labor, Bureau of Labor Statistics, based upon monthly reports submitted by selected employers
in the Dalton Metropolitan Statistical Area, which includes Murray and Whitfield counties. The estimates include all full- and part-time wage and salary workers who were employed during or received pay for any part of the pay period that includes the twelfth of the month. Proprietors, domestic workers, self-employed persons, unpaid family workers and personnel of the armed forces are excluded. Estimates based on 2009 benchmark.
Source: Georgia Department of Labor, Workforce Information & Analysis
6
GAINESVILLE MSA Nonagricultural Employment (000s)
Preliminary Revised Revised AUG 2010 JUL 2010 AUG 2009
Change in Jobs from JUL 2010
Net %
Change in Jobs from AUG 2009
Net %
Total Nonfarm Total Private Goods Producing Service-Providing Private Service-Providing Trade, Transportation and Utilities Retail Trade Government Federal Government State Government Local Government
70.6
70.3
60.4
60.2
18.0
18.0
52.6
52.3
42.4
42.2
13.8
13.8
7.2
7.3
10.2
10.1
0.6
0.6
2.6
2.7
7.0
6.8
71.2
0.3 0.4
61.1
0.2 0.3
19.0
0.0 0.0
52.2
0.3 0.6
42.1
0.2 0.5
13.5
0.0 0.0
7.5
-0.1 -1.4
10.1
0.1 1.0
0.5
0.0 0.0
2.4
-0.1 -3.7
7.2
0.2 2.9
-0.6 -0.8 -0.7 -1.2 -1.0 -5.3 0.4 0.8 0.3 0.7 0.3 2.2 -0.3 -4.0 0.1 1.0 0.1 20.0 0.2 8.3 -0.2 -2.8
Note: These preliminary estimates were prepared in cooperation with the U.S. Department of Labor, Bureau of Labor Statistics, based upon monthly reports submitted by selected employers
in the Gainesville Metropolitan Statistical Area, which comprises Hall county. The estimates include all full- and part-time wage and salary workers who were employed during or received pay for any part of the pay period that includes the twelfth of the month. Proprietors, domestic workers, self-employed persons, unpaid family workers and personnel of the armed forces are excluded. Estimates based on 2009 benchmark.
HINESVILLE - FT. STEWART MSA Nonagricultural Employment (000s)
Preliminary Revised Revised AUG 2010 JUL 2010 AUG 2009
Change in Jobs from JUL 2010
Net %
Change in Jobs from AUG 2009
Net %
Total Nonfarm Total Private Goods Producing Service-Providing Private Service-Providing Government
Federal Government State Government Local Government
19.8
19.3
19.6
11.7
11.7
11.9
1.7
1.7
1.8
18.1
17.6
17.8
10.0
10.0
10.1
8.1
7.6
7.7
4.4
4.2
3.9
0.3
0.3
0.3
3.4
3.1
3.5
0.5 2.6 0.0 0.0 0.0 0.0 0.5 2.8 0.0 0.0 0.5 6.6 0.2 4.8 0.0 0.0 0.3 9.7
0.2 1.0 -0.2 -1.7 -0.1 -5.6 0.3 1.7 -0.1 -1.0 0.4 5.2 0.5 12.8 0.0 0.0 -0.1 -2.9
Note: These preliminary estimates were prepared in cooperation with the U.S. Department of Labor, Bureau of Labor Statistics, based upon monthly reports submitted by selected
employers in the Hinesville - Ft. Stewart Metropolitan Statistical Area, which includes Liberty and Long counties. The estimates include all full- and part-time wage and salary workers who were employed during or received pay for any part of the pay period that includes the twelfth of the month. Proprietors, domestic workers, self-employed persons, unpaid family workers and personnel of the armed forces are excluded. Estimates based on 2009 benchmark.
Source: Georgia Department of Labor, Workforce Information & Analysis
7
MACON MSA Nonagricultural Employment (000s)
Preliminary Revised
Revised
AUG 2010 JUL 2010 AUG 2009
Change in Jobs from JUL 2010
Net %
Change in Jobs from AUG 2009
Net %
Total Nonfarm Total Private Goods Producing Service-Providing Private Service-Providing Trade Transportation and Utilities Retail Trade Transportation, Warehousing, and Utilities Financial Activities Professional and Business Services Educational and Health Services Leisure and Hospitality Government Federal Government State Government Local Government
95.6
95.8
80.8
81.3
9.9
9.9
85.7
85.9
70.9
71.4
18.5
18.8
11.5
11.6
4.1
4.1
8.2
8.2
11.5
11.3
19.1
18.8
8.9
8.9
14.8
14.5
1.5
1.6
3.3
3.3
10.0
9.6
96.6
-0.2 -0.2
81.9
-0.5 -0.6
10.3
0.0 0.0
86.3
-0.2 -0.2
71.6
-0.5 -0.7
19.4
-0.3 -1.6
11.7
-0.1 -0.9
4.1
0.0 0.0
8.5
0.0 0.0
11.1
0.2 1.8
19.0
0.3 1.6
8.6
0.0 0.0
14.7
0.3 2.1
1.3
-0.1 -6.3
3.3
0.0 0.0
10.1
0.4 4.2
-1.0 -1.0 -1.1 -1.3 -0.4 -3.9 -0.6 -0.7 -0.7 -1.0 -0.9 -4.6 -0.2 -1.7 0.0 0.0 -0.3 -3.5 0.4 3.6 0.1 0.5 0.3 3.5 0.1 0.7 0.2 15.4 0.0 0.0 -0.1 -1.0
Note: These preliminary estimates were prepared in cooperation with the U.S. Department of Labor, Bureau of Labor Statistics, based upon monthly reports submitted by selected employers
in the Macon Metropolitan Statistical Area, which includes Bibb, Crawford, Jones, Monroe and Twiggs counties. The estimates include all full- and part-time wage and salary workers who were employed during or received pay for any part of the pay period that includes the twelfth of the month. Proprietors, domestic workers, self-employed persons, unpaid family workers and personnel of the armed forces are excluded. Estimates based on 2009 benchmark.
ROME MSA Nonagricultural Employment (000s)
Preliminary Revised
Revised
AUG 2010 JUL 2010 AUG 2009
Change in Jobs from JUL 2010
Net %
Change in Jobs from AUG 2009
Net %
Total Nonfarm Total Private Goods Producing Service-Providing Private Service-Providing Manufacturing Trade, Transportation and Utilities
Retail Trade Educational and Health Services Government Federal Government State Government Local Government
39.6
39.6
38.7
0.0 0.0
32.7
32.7
31.9
0.0 0.0
7.1
7.1
7.5
0.0 0.0
32.5
32.5
31.2
0.0 0.0
25.6
25.6
24.4
0.0 0.0
6.1
6.1
6.3
0.0 0.0
6.1
6.1
6.2
0.0 0.0
4.0
4.0
4.1
0.0 0.0
8.7
8.6
8.6
0.1 1.2
6.9
6.9
6.8
0.0 0.0
0.2
0.3
0.2
-0.1 -33.3
2.6
2.7
2.5
-0.1 -3.7
4.1
3.9
4.1
0.2 5.1
0.9 2.3 0.8 2.5 -0.4 -5.3 1.3 4.2 1.2 4.9 -0.2 -3.2 -0.1 -1.6 -0.1 -2.4 0.1 1.2 0.1 1.5 0.0 0.0 0.1 4.0 0.0 0.0
Note: These preliminary estimates were prepared in cooperation with the U.S. Department of Labor, Bureau of Labor Statistics, based upon monthly reports submitted by selected employers
in the Rome Metropolitan Statistical Area, which comprises Floyd county. The estimates include all full- and part-time wage and salary workers who were employed during or received pay for any part of the pay period that includes the twelfth of the month. Proprietors, domestic workers, self-employed persons, unpaid family workers and personnel of the armed forces are excluded. Estimates based on 2009 benchmark.
Source: Georgia Department of Labor, Workforce Information & Analysis
8
SAVANNAH MSA Nonagricultural Employment (000s)
Preliminary Revised
Revised
AUG 2010 JUL 2010 AUG 2009
Change in Jobs from JUL 2010
Net %
Change in Jobs from AUG 2009
Net %
Total Nonfarm Total Private
151.1 127.9
151.1 127.7
150.5 127.6
0.0 0.0 0.2 0.2
0.6 0.4 0.3 0.2
Goods Producing Service-Providing Private Service-Providing
20.5 130.6 107.4
20.5 130.6 107.2
21.2 129.3 106.4
0.0 0.0 0.0 0.0 0.2 0.2
-0.7 -3.3 1.3 1.0 1.0 0.9
Mining, Logging, and Construction Manufacturing Trade, Transportation and Utilities
7.2
7.2
13.3
13.3
32.2
32.4
7.5
0.0 0.0
13.7
0.0 0.0
32.3
-0.2 -0.6
-0.3 -4.0 -0.4 -2.9 -0.1 -0.3
Wholesale Trade Retail Trade Transportation, Warehousing, and Utilities
5.5
5.5
16.7
17.0
10.0
9.9
5.6
0.0 0.0
16.8
-0.3 -1.8
9.9
0.1 1.0
-0.1 -1.8 -0.1 -0.6 0.1 1.0
Information Financial Activities Professional and Business Services
1.7
1.7
1.8
5.4
5.4
5.7
16.3
16.2
15.9
0.0 0.0 0.0 0.0 0.1 0.6
-0.1 -5.6 -0.3 -5.3 0.4 2.5
Educational and Health Services Leisure and Hospitality Other Services
24.0
23.7
23.3
20.5
20.5
20.1
7.3
7.3
7.3
0.3 1.3 0.0 0.0 0.0 0.0
0.7 3.0 0.4 2.0 0.0 0.0
Government Federal Government State Government
23.2
23.4
22.9
-0.2 -0.9
3.2
3.3
3.0
-0.1 -3.0
5.4
5.4
5.4
0.0 0.0
0.3 1.3 0.2 6.7 0.0 0.0
Local Government
14.6
14.7
14.5
-0.1 -0.7
0.1 0.7
Note: These preliminary estimates were prepared in cooperation with the U.S. Department of Labor, Bureau of Labor Statistics, based upon monthly reports submitted by selected employers
in the Savannah Metropolitan Statistical Area, which includes Bryan, Chatham and Effingham counties. The estimates include all full- and part-time wage and salary workers who were employed during or received pay for any part of the pay period that includes the twelfth of the month. Proprietors, domestic workers, self-employed persons, unpaid family workers and personnel of the armed forces are excluded. Estimates based on 2009 benchmark.
VALDOSTA MSA Nonagricultural Employment (000s)
Preliminary Revised
Revised
AUG 2010 JUL 2010 AUG 2009
Change in Jobs from JUL 2010
Net %
Change in Jobs from AUG 2009
Net %
Total Nonfarm Total Private Goods Producing Service-Providing Private Service-Providing Trade, Transportation and Utilities Retail Trade Government Federal Government State Government Local Government
53.7
53.2
40.8
40.5
6.8
6.8
46.9
46.4
34.0
33.7
10.9
10.8
7.7
7.7
12.9
12.7
1.0
1.1
4.1
3.9
7.8
7.7
53.5
0.5 0.9
40.7
0.3 0.7
7.1
0.0 0.0
46.4
0.5 1.1
33.6
0.3 0.9
11.1
0.1 0.9
7.8
0.0 0.0
12.8
0.2 1.6
0.9
-0.1 -9.1
4.3
0.2 5.1
7.6
0.1 1.3
0.2 0.4 0.1 0.3 -0.3 -4.2 0.5 1.1 0.4 1.2 -0.2 -1.8 -0.1 -1.3 0.1 0.8 0.1 11.1 -0.2 -4.7 0.2 2.6
Note: These preliminary estimates were prepared in cooperation with the U.S. Department of Labor, Bureau of Labor Statistics, based upon monthly reports submitted by selected employers
in the Valdosta Metropolitan Statistical Area, which includes Brooks, Echols, Lanier and Lowndes counties. The estimates include all full- and part-time wage and salary workers who were employed during or received pay for any part of the pay period that includes the twelfth of the month. Proprietors, domestic workers, self-employed persons, unpaid family workers and personnel of the armed forces are excluded. Estimates based on 2009 benchmark.
Source: Georgia Department of Labor, Workforce Information & Analysis
9
WARNER ROBINS MSA Nonagricultural Employment (000s)
Preliminary Revised
Revised
AUG 2010 JUL 2010 AUG 2009
Change in Jobs from JUL 2010
Net %
Change in Jobs from AUG 2009
Net %
Total Nonfarm Total Private Goods Producing Service-Providing Private Service-Providing Trade, Transportation and Utilities Retail Trade Government Federal Government State Government Local Government
59.4
59.4
34.8
34.9
6.6
6.6
52.8
52.8
28.2
28.3
7.7
7.7
6.0
6.0
24.6
24.5
15.6
15.7
1.2
1.1
7.8
7.7
59.2
0.0 0.0
35.6
-0.1 -0.3
6.9
0.0 0.0
52.3
0.0 0.0
28.7
-0.1 -0.4
7.8
0.0 0.0
6.0
0.0 0.0
23.6
0.1 0.4
14.7
-0.1 -0.6
1.2
0.1 9.1
7.7
0.1 1.3
0.2 0.3 -0.8 -2.3 -0.3 -4.4 0.5 1.0 -0.5 -1.7 -0.1 -1.3 0.0 0.0 1.0 4.2 0.9 6.1 0.0 0.0 0.1 1.3
Note: These preliminary estimates were prepared in cooperation with the U.S. Department of Labor, Bureau of Labor Statistics, based upon monthly reports submitted by selected employers
in the Warner Robins Metropolitan Statistical Area, which comprises Houston county. The estimates include all full- and part-time wage and salary workers who were employed during or received pay for any part of the pay period that includes the twelfth of the month. Proprietors, domestic workers, self-employed persons, unpaid family workers and personnel of the armed forces are excluded. Estimates based on 2009 benchmark.
Source: Georgia Department of Labor, Workforce Information & Analysis
10
Georgia Statewide Hours and Earnings
All Employee
Average Weekly Earnings
Preliminary AUG 2010
Revised JUL 2010
Revised AUG 2009
Total Private ........................................................................................... $765.18 ........................ $749.87 ................... $730.44 Goods Producing ................................................................................ $834.34 ........................ $818.61 ................... $782.08 Private Service Providing .................................................................... $751.86 ........................ $737.33 ................... $719.85
Construction .................................................................................... $806.40 ........................ $793.88 ................... $784.81 Manufacturing .................................................................................. $820.91 ........................ $806.91 ................... $771.16 Trade, Transportation, and Utilities ................................................ $706.82 ........................ $695.65 ................... $696.60 Financial Activities ........................................................................... $898.66 ........................ $879.75 ................... $937.22 Professional and Business Services ............................................. $924.78 ........................ $920.32 ................... $923.10 Educational and Health Services .................................................... $779.68 ........................ $783.43 ................... $779.94 Leisure and Hospitality ................................................................... $323.85 ........................ $320.14 ................... $321.65 Other Services ................................................................................. $612.19 ........................ $599.26 ................... $534.61
Average Weekly Hours
Preliminary AUG 2010
Revised JUL 2010
Revised AUG 2009
Total Private ..................................................................................................35.1 .............................. 34.7 ......................... 34.7 Goods Producing ....................................................................................... 39.3 ................................. 39 ......................... 37.6 Private Service Providing ........................................................................... 34.3 .............................. 33.9 ......................... 34.1
Construction ........................................................................................... 37.7 .............................. 37.5 ......................... 36.3 Manufacturing ......................................................................................... 39.6 .............................. 39.4 ......................... 38.5 Trade, Transportation, and Utilities ....................................................... 35.2 .............................. 34.8 ......................... 34.9 Financial Activities .................................................................................. 35.2 .............................. 34.5 ......................... 36.2 Professional and Business Services .................................................... 35.5 .............................. 35.1 ......................... 35.3 Educational and Health Services ........................................................... 35.2 .............................. 35.1 ......................... 35.5 Leisure and Hospitality ..........................................................................27.1 .............................. 27.2 ......................... 27.8 Other Services ........................................................................................ 33.6 .............................. 33.2 ......................... 31.1
Average Hourly Earnings
Preliminary AUG 2010
Revised JUL 2010
Revised AUG 2009
Total Private ............................................................................................. $21.80 .......................... $21.61 ..................... $21.05 Goods Producing .................................................................................. $21.23 .......................... $20.99 ..................... $20.80 Private Service Providing ...................................................................... $21.92 .......................... $21.75 ..................... $21.11 Construction ...................................................................................... $21.39 .......................... $21.17 ..................... $21.62 Manufacturing .................................................................................... $20.73 .......................... $20.48 ..................... $20.03 Trade, Transportation, and Utilities .................................................. $20.08 .......................... $19.99 ..................... $19.96 Financial Activities ............................................................................. $25.53 .......................... $25.50 ..................... $25.89 Professional and Business Services ............................................... $26.05 .......................... $26.22 ..................... $26.15 Educational and Health Services ...................................................... $22.15 .......................... $22.32 ..................... $21.97 Leisure and Hospitality ...................................................................... $11.95 .......................... $11.77 ..................... $11.57 Other Services ................................................................................... $18.22 .......................... $18.05 ..................... $17.19
Read more about the hours and earnings series at http://www.bls.gov/sae/saeaepp.htm
Source: Georgia Department of Labor, Workforce Information & Analysis
11
Georgia MSA Hours and Earnings
All Employee Total Private
Average Weekly Earnings
Preliminary AUG 2010
Revised JUL 2010
Revised AUG 2009
Albany MSA ............................................................................................ $517.45 ........................ $493.48 ................... $540.25 Athens-Clarke County MSA ................................................................... $676.00 ........................ $698.63 ................... $727.56 Atlanta MSA ............................................................................................ $846.30 ........................ $834.46 ................... $837.64 Augusta-Richmond County MSA ........................................................... $713.28 ........................ $702.88 ................... $720.76 Brunswick MSA ...................................................................................... $503.37 ........................ $478.33 ................... $545.15 Columbus MSA ..................................................................................... $574.53 ........................ $580.72 ................... $583.39 Dalton MSA ............................................................................................ $552.84 ........................ $553.39 ................... $605.39 Gainesville MSA .................................................................................... $834.30 ........................ $834.68 ................... $750.93 Hinesville-Fort Stewart MSA .................................................................. $515.49 ........................ $488.24 ................... $533.90 Macon MSA ............................................................................................ $774.80 ........................ $761.21 ................... $828.32 Rome MSA ............................................................................................ $785.52 ........................ $717.10 ................... $775.72 Savannah MSA ...................................................................................... $695.29 ........................ $688.85 ................... $677.43 Valdosta MSA ......................................................................................... $508.20 ........................ $488.14 ................... $528.57 Warner Robins MSA .............................................................................. $689.40 ........................ $700.25 ................... $651.32
Average Weekly Hours
Preliminary AUG 2010
Revised JUL 2010
Revised AUG 2009
Albany MSA ................................................................................................... 34.2 .............................. 33.8 ......................... 34.9 Athens-Clarke County MSA ..........................................................................33.8 .............................. 33.3 ......................... 34.4 Atlanta MSA ................................................................................................... 35.0 .............................. 34.9 ......................... 34.4 Augusta-Richmond County MSA .................................................................. 37.7 .............................. 36.8 ......................... 37.0 Brunswick MSA ............................................................................................. 31.5 .............................. 31.0 ......................... 32.9 Columbus MSA ............................................................................................33.5 .............................. 34.1 ......................... 33.8 Dalton MSA ................................................................................................... 34.0 .............................. 33.6 ......................... 33.3 Gainesville MSA ........................................................................................... 37.7 .............................. 37.7 ......................... 36.4 Hinesville-Fort Stewart MSA ......................................................................... 35.6 .............................. 34.0 ......................... 39.2 Macon MSA ................................................................................................... 40.0 .............................. 39.4 ......................... 39.9 Rome MSA ................................................................................................... 36.0 .............................. 35.5 ......................... 38.1 Savannah MSA ............................................................................................. 34.2 .............................. 33.9 ......................... 34.3 Valdosta MSA ................................................................................................ 30.8 .............................. 29.3 ......................... 29.3 Warner Robins MSA ..................................................................................... 36.0 .............................. 35.8 ......................... 34.7
Average Hourly Earnings
Preliminary AUG 2010
Revised JUL 2010
Revised AUG 2009
Albany MSA .............................................................................................. $15.13 .......................... $14.60 ..................... $15.48 Athens-Clarke County MSA ..................................................................... $20.00 .......................... $20.98 ..................... $21.15 Atlanta MSA .............................................................................................. $24.18 .......................... $23.91 ..................... $24.35 Augusta-Richmond County MSA ............................................................. $18.92 .......................... $19.10 ..................... $19.48 Brunswick MSA ........................................................................................ $15.98 .......................... $15.43 ..................... $16.57 Columbus MSA ....................................................................................... $17.15 .......................... $17.03 ..................... $17.26 Dalton MSA .............................................................................................. $16.26 .......................... $16.47 ..................... $18.18 Gainesville MSA ...................................................................................... $22.13 .......................... $22.14 ..................... $20.63 Hinesville-Fort Stewart MSA .................................................................... $14.48 .......................... $14.36 ..................... $13.62 Macon MSA .............................................................................................. $19.37 .......................... $19.32 ..................... $20.76 Rome MSA .............................................................................................. $21.82 .......................... $20.20 ..................... $20.36 Savannah MSA ........................................................................................ $20.33 .......................... $20.32 ..................... $19.75 Valdosta MSA ........................................................................................... $16.50 .......................... $16.66 ..................... $18.04 Warner Robins MSA ................................................................................ $19.15 .......................... $19.56 ..................... $18.77
Read more about the hours and earnings series at http://www.bls.gov/sae/saeaepp.htm
Source: Georgia Department of Labor, Workforce Information & Analysis
12
Dimensions - Measuring Georgia's Labor Force
Unemployment rates -- Georgia and U.S.
11.0%
10.0%
9.0%
8.0%
7.0%
Ge orgia
U.S.
6.0%
Aug Sep Oct Nov Dec Jan Feb Mar Apr May Jun Jul Aug
2009
2010
WA 8.9
OR
10.6
ID
8.9
NV
14.4
UT
CA
7.4
12.4
AZ 9.7
AK 7.7
State unemployment rates
August 2010
National Unemployment Rate: 9.6% Rates are seasonally adjusted
MT 7.4
WY 6.8
CO 8.2
NM 8.3
ND 3.7
SD 4.5
NE 4.6
KS 6.6
OK 7.0
TX 8.3
MN 7.0
WI 7.9
IA 6.8
IL 10.1
MO 9.3
AR 7.5
MS 10.0
LA 7.6
NH
5.7
ME
VT
8.0
6.0
MI 13.1
OH
IN
10.1
10.2
KY 10.0
TN 9.6
PA 9.2
WV
8.8
VA
7.0
NC 9.7
SC 11.0
AL
GA
9.2
10.0
FL 11.7
MA 8.8 NY 8.3
RI 11.8 CT NJ 9.1 9.6 DE 8.4 DC 9.9
MD 7.3
Unemployment rate 10.0% or greater 7.0% to 9.9% 6.0% to 6.9% 5.0% to 5.9% 4.0% to 4.9% 3.0% to 3.9%
HI 6.4
13
Georgia Labor Force Estimates (not seasonally adjusted) Place of Residence - Persons 16 Years and Older
Georgia
(Seasonally adjusted)
Georgia
(Not Seasonally adjusted)
Albany MSA
Athens-Clarke County MSA
Atlanta MSA
Augusta-Richmond County MSA
Brunswick MSA
Columbus MSA
Dalton MSA
Gainesville MSA
Employment Status
Civilian labor force Employed Unemployed Rate
Civilian labor force Employed Unemployed Rate
Civilian labor force Employed Unemployed Rate
Civilian labor force Employed Unemployed Rate
Civilian labor force Employed Unemployed Rate
Civilian labor force Employed Unemployed Rate
Civilian labor force Employed Unemployed Rate
Civilian labor force Employed Unemployed Rate
Civilian labor force Employed Unemployed Rate
Civilian labor force Employed Unemployed Rate
AUG 2010
4,668,408 4,201,478
466,930 10.0
4,686,423 4,201,647
484,776 10.3
76,438 68,082
8,356 10.9
104,581 96,443 8,138 7.8
2,654,713 2,379,498
275,215 10.4
259,837 235,566
24,271 9.3
51,764 46,647
5,117 9.9
127,519 115,200 12,319
9.7
60,851 53,534
7,317 12.0
86,974 78,943
8,031 9.2
JUL 2010
4,674,857 4,213,991
460,866 9.9
4,694,315 4,217,534
476,781 10.2
76,697 68,421
8,276 10.8
104,750 96,697 8,053 7.7
2,655,672 2,386,620
269,052 10.1
262,019 237,916
24,103 9.2
52,357 47,301
5,056 9.7
127,771 115,779
11,992 9.4
61,338 54,225
7,113 11.6
87,469 79,581
7,888 9.0
AUG 2009
4,753,592 4,278,843
474,749 10.0
4,761,058 4,283,981
477,077 10.0
76,166 68,618
7,548 9.9
105,295 97,375 7,920 7.5
2,695,090 2,422,149
272,941 10.1
260,044 234,807
25,237 9.7
53,251 48,544
4,707 8.8
129,274 116,891 12,383
9.6
62,544 54,803
7,741 12.4
89,028 80,835
8,193 9.2
Change From
JUL 2010
AUG 2009
-6,449 -12,513
6,064
-85,184 -77,365
-7,819
-7,892 -15,887
7,995
-74,635 -82,334
7,699
-259 -339
80
272 -536 808
-169 -254
85
-714 -932 218
-959 -7,122 6,163
-40,377 -42,651
2,274
-2,182 -2,350
168
-207 759 -966
-593 -654
61
-1,487 -1,897
410
-252 -579 327
-1,755 -1,691
-64
-487 -691 204
-1,693 -1,269
-424
-495 -638 143
-2,054 -1,892
-162
Note: MSA data are not seasonally adjusted. Employment includes nonagricultural wage and salary employment, self-employment, unpaid family and private
household workers and agricultural workers. Persons in labor disputes are counted as employed. The use of unrounded data does not imply that the numbers are exact. Georgia and Metropolitan Statistical Area data have not been seasonally adjusted.
Albany MSA: Baker, Dougherty, Lee, Terrell, and Worth counties. Athens - Clarke County MSA: Clarke, Madison, Oconee, and Oglethorpe counties. Atlanta MSA: Barrow, Bartow, Butts, Carroll, Cherokee, Clayton, Cobb, Coweta, Dawson, DeKalb, Douglas, Fayette, Forsyth, Fulton, Gwinnett, Haralson, Heard, Henry, Jasper, Lamar, Meriwether, Newton, Paulding, Pickens, Pike, Rockdale, Spalding, and Walton counties. Augusta - Richmond County MSA: Burke, Columbia, McDuffie, and Richmond counties in Georgia and Aiken and Edgefield counties in South Carolina. Brunswick MSA: Brantley, Glynn, and McIntosh counties. Columbus MSA: Chattahoochee, Harris, Marion, and Muscogee counties in Georgia and Russell County in Alabama. Dalton MSA: Murray and Whitfield counties. Gainesville MSA: Hall County. Hinesville - Fort Stewart MSA: Liberty and Long counties. Macon MSA: Bibb, Crawford, Jones, Monroe, and Twiggs counties. Rome MSA: Floyd County. Savannah MSA: Bryan, Chatham, and Effingham counties. Valdosta MSA: Brooks, Echols, Lanier, and Lowndes counties. Warner Robins MSA: Houston County.
Source: Georgia Department of Labor, Workforce Information & Analysis
14
Georgia Labor Force Estimates (not seasonally adjusted) Place of Residence - Persons 16 Years and Older
Hinesville-Ft. Stewart MSA Macon MSA
Rome MSA Savannah MSA
Valdosta MSA Warner Robins MSA
Employment Status
Civilian labor force Employed Unemployed Rate
Civilian labor force Employed Unemployed Rate
Civilian labor force Employed Unemployed Rate
Civilian labor force Employed Unemployed Rate
Civilian labor force Employed Unemployed Rate
Civilian labor force Employed Unemployed Rate
AUG 2010
32,958 30,109
2,849 8.6
111,711 100,057
11,654 10.4
49,191 43,869
5,322 10.8
175,208 159,220
15,988 9.1
67,376 61,573
5,803 8.6
70,264 64,858
5,406 7.7
JUL 2010
32,610 29,796
2,814 8.6
112,562 101,160
11,402 10.1
49,387 44,208
5,179 10.5
178,033 160,738
17,295 9.7
67,475 61,819
5,656 8.4
71,022 65,630
5,392 7.6
AUG 2009
32,770 30,306
2,464 7.5
113,655 102,703
10,952 9.6
49,241 43,882
5,359 10.9
176,309 161,366
14,943 8.5
68,097 62,449
5,648 8.3
70,798 65,817
4,981 7.0
Change From
JUL 2010
AUG 2009
348
188
313
-197
35
385
-851 -1,103
252
-1,944 -2,646
702
-196
-50
-339
-13
143
-37
-2,825 -1,518 -1,307
-1,101 -2,146 1,045
-99 -246 147
-721 -876 155
-758 -772
14
-534 -959 425
United States Labor Force Estimates Place of Residence - Persons 16 Years and Older
Area
United States
(Seasonally adjusted)
Employment Status
Civilian labor force Employed Unemployed Rate
AUG 2010
154,110,000 139,250,000
14,860,000 9.6
JUL 2010
153,560,000 138,960,000
14,599,000 9.5
AUG 2009
154,426,000 139,433,000
14,993,000 9.7
Change From
JUL 2010
AUG 2009
550,000 290,000 261,000
-316,000 -183,000 -133,000
United States
(Not Seasonally adjusted)
Civilian labor force Employed Unemployed
Rate
154,678,000 139,919,000
14,759,000 9.5
155,270,000 140,134,000
15,137,000 9.7
154,897,000 140,074,000
14,823,000 9.6
-592,000 -215,000 -378,000
-219,000 -155,000
-64,000
Note: Employment includes nonagricultural wage and salary employment, self-employment, unpaid family and private household workers and agricultural
workers. Persons in labor disputes are counted as employed. The use of unrounded data does not imply that the numbers are exact. Georgia and Metropolitan Statistical Area data have not been seasonally adjusted. Seasonally adjusted data for Georgia available upon request.
Albany MSA: Baker, Dougherty, Lee, Terrell, and Worth counties. Athens - Clarke County MSA: Clarke, Madison, Oconee, and Oglethorpe counties. Atlanta MSA: Barrow, Bartow, Butts, Carroll, Cherokee, Clayton, Cobb, Coweta, Dawson, DeKalb, Douglas, Fayette, Forsyth, Fulton, Gwinnett, Haralson, Heard, Henry, Jasper, Lamar, Meriwether, Newton, Paulding, Pickens, Pike, Rockdale, Spalding, and Walton counties. Augusta - Richmond County MSA: Burke, Columbia, McDuffie, and Richmond counties in Georgia and Aiken and Edgefield counties in South Carolina. Brunswick MSA: Brantley, Glynn, and McIntosh counties. Columbus MSA: Chattahoochee, Harris, Marion, and Muscogee counties in Georgia and Russell County in Alabama. Dalton MSA: Murray and Whitfield counties. Gainesville MSA: Hall County. Hinesville - Fort Stewart MSA: Liberty and Long counties. Macon MSA: Bibb, Crawford, Jones, Monroe, and Twiggs counties. Rome MSA: Floyd County. Savannah MSA: Bryan, Chatham, and Effingham counties. Valdosta MSA: Brooks, Echols, Lanier, and Lowndes counties. Warner Robins MSA: Houston County.
Source: Georgia Department of Labor, Workforce Information & Analysis
15
Georgia Labor Force Estimates by County (not seasonally adjusted)
Georgia
Place of Residence - Persons 16 Years and Older
August 2010
July 2010
Labor Force
Employment
Unemployment Number Rate
4,686,423 4,201,647 484,776 10.3
Labor Force
Employment
Unemployment Number Rate
4,694,315 4,217,534 476,781 10.2
Appling Atkinson Bacon Baker Baldwin
9,397 2,987 4,613 1,649 19,225
8,312 2,575 4,127 1,487 16,327
1,085 11.5 412 13.8 486 10.5 162 9.8
2,898 15.1
9,363 2,998 4,536 1,656 19,426
8,279 2,561 4,093 1,494 16,418
1,084 11.6 437 14.6 443 9.8 162 9.8
3,008 15.5
Banks Barrow Bartow Ben Hill Berrien
10,405 33,821 44,934
6,924 7,780
9,651 30,321 39,929
5,910 6,828
754 7.2 3,500 10.3 5,005 11.1 1,014 14.6
952 12.2
10,403 33,762 45,002
6,886 7,763
9,677 30,412 40,049
5,909 6,842
726 7.0 3,350 9.9 4,953 11.0
977 14.2 921 11.9
Bibb Bleckley Brantley Brooks Bryan
73,582 5,420 7,357 8,109
16,572
65,572 4,727 6,479 7,394
15,141
8,010 10.9 693 12.8 878 11.9 715 8.8
1,431 8.6
74,067 5,393 7,426 8,130
16,785
66,294 4,701 6,570 7,423
15,285
7,773 10.5 692 12.8 856 11.5 707 8.7
1,500 8.9
Bulloch Burke Butts Calhoun Camden
32,134 9,779 9,991 2,282
20,087
28,971 8,726 8,861 2,045
18,105
3,163 9.8 1,053 10.8 1,130 11.3
237 10.4 1,982 9.9
31,966 9,955
10,014 2,274
20,059
28,770 8,813 8,887 2,034
18,125
3,196 10.0 1,142 11.5 1,127 11.3
240 10.6 1,934 9.6
Candler Carroll Catoosa Charlton Chatham
4,296 3,878
418 9.7
51,720 46,086 5,634 10.9
33,426 30,760 2,666 8.0
4,436 3,903
533 12.0
130,618 118,295 12,323 9.4
4,273 51,861 33,572
4,449 132,121
3,871 46,224 30,886
3,921 119,423
402 9.4 5,637 10.9 2,686 8.0
528 11.9 12,698 9.6
Chattahoochee 2,535
Chattooga
10,409
Cherokee
107,092
Clarke
63,235
Clay
1,405
2,112 9,019 97,539 58,250 1,277
423 16.7 1,390 13.4 9,553 8.9 4,985 7.9
128 9.1
2,533 10,193 107,263 63,433
1,422
2,129 8,996 97,831 58,404 1,287
404 15.9 1,197 11.7 9,432 8.8 5,029 7.9
135 9.5
Clayton Clinch Cobb Coffee Colquitt
132,173 115,636 16,537 12.5
2,685 2,362
323 12.0
366,376 330,044 36,332 9.9
15,413 12,724 2,689 17.4
20,304 18,293 2,011 9.9
132,251 115,982 16,269 12.3
2,585 2,283
302 11.7
367,071 331,032 36,039 9.8
15,125 12,652 2,473 16.4
20,164 18,221 1,943 9.6
Columbia Cook Coweta Crawford Crisp
59,901 6,756
58,561 6,071 9,323
55,452 5,872
53,038 5,465 8,053
4,449 7.4 884 13.1
5,523 9.4 606 10.0
1,270 13.6
60,343 6,709
58,578 6,140 9,356
56,009 5,848
53,197 5,525 8,097
4,334 7.2 861 12.8
5,381 9.2 615 10.0
1,259 13.5
August 2009
Labor Force
Employment
Unemployment Number Rate
4,761,058 4,283,981 477,077 10.0
9,324 3,249 4,657 1,639 20,274
8,354 2,797 4,250 1,498 17,884
970 10.4 452 13.9 407 8.7 141 8.6 2,390 11.8
10,506 34,464 46,450
7,185 8,045
9,751 30,865 40,645
6,073 7,035
755 7.2 3,599 10.4 5,805 12.5 1,112 15.5 1,010 12.6
74,638 5,280 7,621 8,225
16,610
67,306 4,743 6,743 7,499
15,345
7,332 9.8 537 10.2 878 11.5 726 8.8
1,265 7.6
33,174 9,949
10,280 2,364
20,247
30,167 8,722 9,020 2,088
18,442
3,007 9.1 1,227 12.3 1,260 12.3
276 11.7 1,805 8.9
4,377 52,527 33,910
4,437 131,397
3,982 46,912 30,984
3,964 119,890
395 9.0 5,615 10.7 2,926 8.6
473 10.7 11,507 8.8
2,549 10,435 109,123 63,574
1,418
2,161 9,183 99,287 58,813 1,298
388 15.2 1,252 12.0 9,836 9.0 4,761 7.5
120 8.5
133,686 2,892
370,309 16,598 20,496
117,709 2,582
335,960 13,818 18,631
15,977 12.0 310 10.7
34,349 9.3 2,780 16.7 1,865 9.1
59,631 6,910
59,727 6,173 9,751
55,431 6,066
53,989 5,609 8,579
4,200 7.0 844 12.2
5,738 9.6 564 9.1
1,172 12.0
16
Georgia Labor Force Estimates by County (not seasonally adjusted)
Dade Dawson Decatur DeKalb Dodge
Place of Residence - Persons 16 Years and Older
August 2010
Labor Force
Employment
Unemployment Number Rate
7,890 7,224
666 8.4
10,872 9,807 1,065 9.8
11,420 9,818 1,602 14.0
377,233 337,000 40,233 10.7
8,729 7,613 1,116 12.8
July 2010
Labor Force
Employment
Unemployment Number Rate
7,985 7,253
732 9.2
10,878 9,836 1,042 9.6
11,386 9,847 1,539 13.5
377,625 338,009 39,616 10.5
8,692 7,633 1,059 12.2
Dooly Dougherty Douglas Early Echols
4,808 42,354 63,868
5,370 2,122
4,288 37,264 56,874
4,842 1,980
520 10.8 5,090 12.0 6,994 11.0
528 9.8 142 6.7
4,779 42,463 63,991
5,350 2,122
4,264 37,450 57,045
4,813 1,988
515 10.8 5,013 11.8 6,946 10.9
537 10.0 134 6.3
Effingham Elbert Emanuel Evans Fannin
28,018 9,498
10,417 4,878
10,640
25,784 8,250 9,170 4,426 9,528
2,234 8.0 1,248 13.1 1,247 12.0
452 9.3 1,112 10.5
29,127 9,519
10,337 4,807
10,670
26,030 8,263 9,186 4,370 9,529
3,097 10.6 1,256 13.2 1,151 11.1
437 9.1 1,141 10.7
Fayette Floyd Forsyth Franklin Fulton
50,607 46,254 4,353 8.6 49,191 43,869 5,322 10.8 84,211 77,189 7,022 8.3
9,895 8,725 1,170 11.8 478,423 426,277 52,146 10.9
50,534 46,393 4,141 8.2 49,387 44,208 5,179 10.5 84,199 77,420 6,779 8.1
9,857 8,714 1,143 11.6 478,274 427,553 50,721 10.6
Gilmer Glascock Glynn Gordon Grady
13,321 1,111
39,167 24,603 11,424
11,982 976
35,528 21,524 10,379
1,339 10.1 135 12.2
3,639 9.3 3,079 12.5 1,045 9.1
13,280 1,100
39,657 24,608 11,358
11,970 971
36,027 21,560 10,349
1,310 9.9 129 11.7
3,630 9.2 3,048 12.4 1,009 8.9
Greene Gwinnett Habersham Hall Hancock
7,331 6,518
813 11.1
406,493 368,292 38,201 9.4
19,423 17,503 1,920 9.9
86,974 78,943 8,031 9.2
3,101 2,454
647 20.9
7,317
6,527
790 10.8
406,392 369,394 36,998 9.1
19,358 17,441 1,917 9.9
87,469 79,581 7,888 9.0
3,069
2,468
601 19.6
Haralson Harris Hart Heard Henry
12,619 15,889
9,935 4,800 95,266
11,085 14,727
8,735 4,202 85,443
1,534 12.2 1,162 7.3 1,200 12.1
598 12.5 9,823 10.3
12,541 16,025
9,925 4,804 95,192
11,118 14,845
8,740 4,215 85,699
1,423 11.3 1,180 7.4 1,185 11.9
589 12.3 9,493 10.0
Houston Irwin Jackson Jasper Jeff Davis
70,264 3,911 26,111 6,273 5,297
64,858 3,356
23,239 5,560 4,495
5,406 7.7 555 14.2
2,872 11.0 713 11.4 802 15.1
71,022 3,869
26,129 6,140 5,289
65,630 3,355
23,244 5,577 4,515
5,392 7.6 514 13.3
2,885 11.0 563 9.2 774 14.6
August 2009
Labor Force
Employment
Unemployment Number Rate
8,087 11,046 12,159 383,190 9,167
7,277 9,983 10,674 343,040 8,121
810 10.0 1,063 9.6 1,485 12.2 40,150 10.5 1,046 11.4
4,825 42,143 64,999
5,617 2,158
4,363 37,558 57,894
5,027 2,008
462 9.6 4,585 10.9 7,105 10.9
590 10.5 150 7.0
28,303 10,159 10,496
4,942 10,786
26,132 9,054 9,357 4,516 9,690
2,171 7.7 1,105 10.9 1,139 10.9
426 8.6 1,096 10.2
51,484 49,241 85,627 10,132 484,561
47,084 43,882 78,573
8,918 433,918
4,400 8.5 5,359 10.9 7,054 8.2 1,214 12.0 50,643 10.5
13,541 1,131
40,287 25,093 11,583
12,211 1,006 36,973 21,811 10,470
1,330 9.8 125 11.1
3,314 8.2 3,282 13.1 1,113 9.6
7,660 412,332
20,079 89,028
3,265
6,780 374,893
18,197 80,835
2,688
880 11.5 37,439 9.1
1,882 9.4 8,193 9.2
577 17.7
12,791 16,218 10,481
4,865 96,485
11,284 15,065
9,112 4,277 86,974
1,507 11.8 1,153 7.1 1,369 13.1
588 12.1 9,511 9.9
70,798 4,043
27,018 6,413 5,366
65,817 3,449
24,091 5,660 4,642
4,981 7.0 594 14.7
2,927 10.8 753 11.7 724 13.5
17
Georgia Labor Force Estimates by County (not seasonally adjusted)
Jefferson Jenkins Johnson Jones Lamar
Place of Residence - Persons 16 Years and Older
August 2010
July 2010
Labor Force
6,859 2,470 3,466 13,939 7,796
Employment
Unemployment Number Rate
5,880 1,994 3,043 12,720 6,755
979 14.3 476 19.3 423 12.2 1,219 8.7 1,041 13.4
Labor Force
6,862 2,472 3,456 14,066 7,723
Employment
Unemployment Number Rate
5,875 1,986 3,049 12,860 6,775
987 14.4 486 19.7 407 11.8 1,206 8.6 948 12.3
Lanier Laurens Lee Liberty Lincoln
4,085 21,280 17,742 26,261
3,824
3,714 18,556 16,346 23,894
3,406
371 9.1 2,724 12.8 1,396 7.9 2,367 9.0
418 10.9
4,126 21,262 17,856 26,002
3,822
3,729 18,596 16,428 23,646
3,413
397 9.6 2,666 12.5 1,428 8.0 2,356 9.1
409 10.7
Long Lowndes Lumpkin McDuffie McIntosh
6,697 53,061 12,866 10,615
5,239
6,215 48,486 11,527
9,506 4,639
482 7.2 4,575 8.6 1,339 10.4 1,109 10.4
600 11.5
6,608 53,099 12,665 10,736
5,274
6,150 48,680 11,316
9,601 4,704
458 6.9 4,419 8.3 1,349 10.7 1,135 10.6
570 10.8
Macon Madison Marion Meriwether Miller
5,086 15,636
3,284 9,256 3,463
4,391 14,357
2,946 8,101 3,177
695 13.7 1,279 8.2
338 10.3 1,155 12.5
286 8.3
5,079 15,627
3,272 9,249 3,430
4,394 14,395
2,970 8,126 3,157
685 13.5 1,232 7.9
302 9.2 1,123 12.1
273 8.0
Mitchell Monroe Montgomery Morgan Murray
10,213 13,465
4,498 9,079 18,691
9,111 12,192
4,011 8,195 16,406
1,102 10.8 1,273 9.5
487 10.8 884 9.7 2,285 12.2
10,180 13,605
4,510 9,122 18,819
9,097 12,327
4,012 8,245 16,617
1,083 10.6 1,278 9.4
498 11.0 877 9.6 2,202 11.7
Muscogee Newton Oconee Oglethorpe Paulding
84,240 46,241 17,989
7,721 65,954
76,147 40,423 16,811
7,025 59,008
8,093 9.6 5,818 12.6 1,178 6.5
696 9.0 6,946 10.5
84,746 46,019 18,023
7,667 66,465
76,754 40,544 16,855
7,043 59,184
7,992 9.4 5,475 11.9 1,168 6.5
624 8.1 7,281 11.0
Peach Pickens Pierce Pike Polk
12,146 14,627
8,391 7,837 20,429
10,695 13,350
7,518 7,072 18,280
1,451 11.9 1,277 8.7
873 10.4 765 9.8 2,149 10.5
12,228 14,673
8,331 7,833 20,492
10,749 13,390
7,508 7,093 18,386
1,479 12.1 1,283 8.7
823 9.9 740 9.4 2,106 10.3
Pulaski Putnam Quitman Rabun Randolph
4,266 10,037
956 6,654 2,670
3,854 8,955
845 5,872 2,332
412 9.7 1,082 10.8
111 11.6 782 11.8 338 12.7
4,268 10,061
982 6,769 2,677
3,885 9,039
848 5,964 2,321
383 9.0 1,022 10.2
134 13.6 805 11.9 356 13.3
August 2009
Labor Force
Employment
Unemployment Number Rate
7,045 2,732 3,639 14,252 8,042
6,003 2,214 3,211 13,057 6,876
1,042 14.8 518 19.0 428 11.8
1,195 8.4 1,166 14.5
4,127 22,299 17,793 26,105
3,908
3,767 19,578 16,475 24,050
3,497
360 8.7 2,721 12.2 1,318 7.4 2,055 7.9
411 10.5
6,665 53,589 13,399 10,825
5,342
6,256 49,176 11,909
9,502 4,828
409 6.1 4,413 8.2 1,490 11.1 1,323 12.2
514 9.6
5,229 15,850
3,352 9,459 3,704
4,561 14,496
3,014 8,247 3,385
668 12.8 1,354 8.5
338 10.1 1,212 12.8
319 8.6
10,394 13,826
4,502 9,263 19,149
9,326 12,515
4,099 8,353 16,794
1,068 10.3 1,311 9.5
403 9.0 910 9.8 2,355 12.3
85,686 46,804 18,119
7,751 66,832
77,892 41,147 16,973
7,092 60,065
7,794 9.1 5,657 12.1 1,146 6.3
659 8.5 6,767 10.1
12,169 15,160
8,502 8,121 21,144
10,927 13,590
7,669 7,199 18,871
1,242 10.2 1,570 10.4
833 9.8 922 11.4 2,273 10.8
4,416 10,243
983 7,195 2,807
4,076 9,158
866 6,464 2,449
340 7.7 1,085 10.6
117 11.9 731 10.2 358 12.8
18
Georgia Labor Force Estimates by County (not seasonally adjusted)
Richmond Rockdale Schley Screven Seminole
Spalding Stephens Stewart Sumter Talbot
Taliaferro Tattnall Taylor Telfair Terrell
Thomas Tift Toombs Towns Treutlen
Troup Turner Twiggs Union Upson
Walker Walton Ware Warren Washington
Wayne Webster Wheeler White Whitfield
Wilcox Wilkes Wilkinson Worth
Place of Residence - Persons 16 Years and Older
August 2010
July 2010
Labor Force
Employment
Unemployment Number Rate
Labor Force
Employment
Unemployment Number Rate
91,746 39,415
1,796 6,976 4,018
81,838 34,826
1,551 6,013 3,589
9,908 10.8 4,589 11.6
245 13.6 963 13.8 429 10.7
92,676 39,315
1,815 7,008 4,026
82,660 10,016 10.8
34,930 4,385 11.2
1,552
263 14.5
5,963 1,045 14.9
3,609
417 10.4
27,817 13,245
2,302 13,852
3,041
24,294 11,852 2,057 12,024 2,761
3,523 12.7 1,393 10.5
245 10.6 1,828 13.2
280 9.2
27,666 13,346
2,301 13,820
3,041
24,367 11,960 2,058 12,032 2,767
3,299 11.9 1,386 10.4
243 10.6 1,788 12.9
274 9.0
808 9,546 3,554 4,682 4,442
714 8,619 3,100 3,698 3,924
94 11.6 927 9.7 454 12.8 984 21.0 518 11.7
812 9,464 3,571 4,429 4,420
715 8,579 3,115 3,705 3,944
97 11.9 885 9.4 456 12.8 724 16.3 476 10.8
20,530 18,775 13,885
5,870 2,936
18,530 16,454 12,379
5,362 2,550
2,000 9.7 2,321 12.4 1,506 10.8
508 8.7 386 13.1
20,530 18,703 13,784
5,796 2,923
18,614 16,451 12,380
5,282 2,536
1,916 9.3 2,252 12.0 1,404 10.2
514 8.9 387 13.2
30,216 4,319 4,654 11,130 11,411
26,671 3,753 4,108
10,134 10,013
3,545 11.7 566 13.1 546 11.7 996 8.9
1,398 12.3
30,278 4,293 4,684 11,084 11,399
26,721 3,731 4,154
10,134 10,052
3,557 11.7 562 13.1 530 11.3 950 8.6
1,347 11.8
31,280 40,435 14,617
2,564 7,634
28,299 36,231 12,995
2,101 6,463
2,981 9.5 4,204 10.4 1,622 11.1
463 18.1 1,171 15.3
31,349 40,357 14,649
2,543 7,628
28,415 36,339 12,980
2,098 6,477
2,934 9.4 4,018 10.0 1,669 11.4
445 17.5 1,151 15.1
12,126 1,129 2,934
12,187 42,160
10,603 1,022 2,576
10,961 37,128
1,523 12.6 107 9.5 358 12.2
1,226 10.1 5,032 11.9
12,033 1,107 2,876
12,260 42,519
10,553 1,002 2,558 11,078
37,608
1,480 12.3 105 9.5 318 11.1
1,182 9.6 4,911 11.6
3,167 4,321 4,086 10,250
2,759 3,799 3,552 9,060
408 12.9 522 12.1 534 13.1 1,190 11.6
3,134 4,300 4,091 10,303
2,751 3,807 3,558 9,106
383 12.2 493 11.5 533 13.0 1,197 11.6
August 2009
Labor Force
Employment
Unemployment Number Rate
91,090 40,033
1,867 7,239 4,090
81,807 35,450
1,623 6,243 3,674
9,283 10.2 4,583 11.4
244 13.1 996 13.8 416 10.2
29,024 13,318
2,363 14,491
3,150
24,729 11,819 2,105 12,583 2,848
4,295 14.8 1,499 11.3
258 10.9 1,908 13.2
302 9.6
853 9,370 3,530 4,462 4,446
743 8,560 3,124 3,754 3,955
110 12.9 810 8.6 406 11.5 708 15.9 491 11.0
21,577 18,642 14,033
5,903 2,987
19,596 16,640 12,651
5,424 2,645
1,981 9.2 2,002 10.7 1,382 9.8
479 8.1 342 11.4
30,053 4,710 4,767 11,063
12,502
26,139 4,069 4,217
10,023 10,939
3,914 13.0 641 13.6 550 11.5
1,040 9.4 1,563 12.5
31,913 41,255 14,822
2,674 8,007
28,506 36,880 13,257
2,160 6,891
3,407 10.7 4,375 10.6 1,565 10.6
514 19.2 1,116 13.9
12,187 1,220 2,914
12,361 43,395
10,764 1,094 2,625 11,203
38,009
1,423 11.7 126 10.3 289 9.9
1,158 9.4 5,386 12.4
3,278 4,539 4,667 10,144
2,893 4,026 4,178 9,132
385 11.7 513 11.3 489 10.5 1,012 10.0
19
New Developments
Great Dane Limited Partnership has announced plans to build a new refrigerated trailer plant in Bulloch County. The Statesboro plant, in its first phase, will encompass 450,000 square feet, including office and show room space and will have the capacity to produce 5,000 plus trailers annually. At that level of production, the facility will employ more than 400 people. The new facility will serve the traditional Great Dane customer base. The manufacturing processes will feature the latest technology in its foaming methods and automation of key production operations making this the most modern, efficient plant in the world. Construction for the new plant is slated to begin in 2011 with a projected completion in 2012.
Floyd County has received confirmation that a Californiabased tax software firm, Petz Enterprises, will locate a southeastern regional office in Rome. The company has not announced publicly how many people it will hire initially, but in a similar move into the state of Washington they started with 25 new employees. Their initial location will be small, but they will try to find a larger facility before tax season starts. The business was founded in 1964 and started off in the accounting business but began to specialize in processing tax information in the 1980's. Crosslink is the company's professional tax software product.
A new restaurant will open in Floyd County in September and employee training is already taking place at other locations. The new Steak N' Shake on Turner-McCall Boulevard will hire around 110 people for its opening. The franchise owners also own the franchise rights to open a store in Athens, but they don't plan to move forward with that location until the Rome store is up and running.
An Israeli software company is relocating its headquarters to Fulton County. The region's low cost of doing business and its reputation as a travel industry hub swayed Truvle Ltd to choose Atlanta. The company uses technology to help brick and mortar travel agencies, hotel chains, and airlines better compete with online booking sites, such as Orbitz and Travelocity. Over the next two years they expect the employee total to reach 30. The company makes flight itineraries more functional for example by populating a hotel reservation confirmation email with current weather updates, a list of local restaurants and embedded links for making reservations along with other pertinent information.
In Bibb County a company's expansion plans are actually a two-fold benefit. First Quality Baby Products had decided they need to look for additional manufacturing square footage, but local officials in the Macon area
worked for almost a year to convince the company to expand locally instead of moving. The result is a $200 million expansion investment by the diaper manufacturer over the next eight years that will not only create 150 new jobs but will also save the jobs of the company's existing 222 employees. The construction on the new $35 million building will begin almost immediately.
The northern Metro Atlanta area will benefit from JPMorgan Chase & Company's plans to open ten new bank branches across the area. Eight of the ten branches are already under construction. Additionally, the company plans to open another 35 branches through 2012 which will mean 350 new jobs in the next two years. The company is making an effort to have a stronger presence in the Atlanta market that it entered in 2008 when it acquired the failed bank Washington Mutual.
The new Wal-Mart Supercenter on the east side of Albany on Clark Avenue will be opening in 2011. This will add some 400 new jobs in Dougherty County. The new retail establishment will also generate about $2.2 million annually in sales tax.
An expansion of a Gwinnett County warehouse facility will create 15 to 20 new jobs. Prime Distribution Services, Inc. is a leading provider of warehousing, multi-vendor pool consolidation and transportation management services that handles more than 800 million pounds of freight per year. The company's expanding Norcross location restructures the supply chain for customers by offering consolidation alternatives versus less-than-truckload shipping.
In Whitfield County new jobs are being created directly by the Georgia Department of Labor. The state agency will open an office of Disability Adjudication Services in Dalton at 500 Walnut Avenue employing up to 45 people including supervisors, hearing officers, adjudicators and their associates, help-desk specialists, program associates and assistants. The funding for these positions has been provided by the federal government.
In the month of October the Wachovia Bank branches and the company's tower at Atlantic Station will be rebranded under its corporate parent, Wells Fargo & Company. Unlike most consolidations that produce job losses this merger is creating new jobs. The company plans to add 500 employees in Georgia and 300 of those will be placed in the branch network in an effort to gain a larger market share.
20
Georgia Unemployment Rates by County
August 2010
Dade
Catoosa
Murray
Fannin
Towns
Union
Rabun
Whitfield Walker
Gilmer
White Habersham
Chattooga
Gordon
Pickens
Lumpkin
Stephens
Floyd
Dawson
Banks Franklin Hart
Bartow Cherokee Forsyth Hall
14.0% or greater 12.0% to 13.9% 10.3% to 11.9%
Jackson Madison Elbert
Polk Haralson
Paulding Cobb
Barrow Gwinnett
DeKalb
Walton
Douglas Fulton
Rockdale
Clarke Oconee
Oglethorpe
Wilkes
Lincoln
Carroll
Clayton
Newton Morgan Greene Taliaferro
Columbia
Heard
Fayette
Henry
Coweta
Spalding Butts
Jasper
Putnam
McDuffie Warren
Hancock Glascock
Richmond
Less than 10.3%
Troup
Meriwether Pike Lamar Monroe
Jones Baldwin
Jefferson Washington
Burke
Upson
Harris
Talbot
Muscogee
Bibb Crawford
Taylor
Peach
Wilkinson Twiggs
Johnson
Jenkins Emanuel
Screven
Marion Chattahoochee
Macon
Schley
Stewart Webster Sumter
Quit-
man
Terrell Lee
Randolph
Houston Bleckley
Laurens Treutlen
Candler Bulloch
Effingham
Dooly Crisp
Pulaski Wilcox
Dodge
Montgomery
Wheeler
Toombs
Evans
Telfair
Tattnall
Bryan
Chatham
Turner
Ben Hill
Jeff Davis Appling
Liberty Long
Clay Calhoun Dougherty
Early
Baker
Miller
Mitchell
Worth
Irwin Tift
Coffee
Colquitt
Berrien Atkinson Cook
Seminole Decatur
Grady
Thomas
Brooks
Lanier
Clinch
Lowndes Echols
Bacon
Wayne
Pierce
Ware
Brantley
McIntosh Glynn
Charlton
Camden
Georgia's Unemployment Rate: 10.3%
(Not Seasonally Adjusted)
21
Georgia Unemployment Insurance Claims by County
County
August Average Average Initial Weekly Duration
Claims Benefit Weeks
County
August Average Average Initial Weekly Duration
Claims Benefit Weeks
Georgia
70,264 ...... $261 ...... 15.5
Appling
178 ...... $233 ..... 14.6
Atkinson
101 ...... $178 ..... 12.1
Bacon
97 ...... $232 ..... 12.5
Baker
21 ...... $208 ..... 16.4
Baldwin
278 ...... $190 ..... 18.1
Banks
121 ...... $235 ..... 15.5
Barrow
522 ...... $244 ..... 18.1
Bartow
930 ...... $236 ..... 15.7
Ben Hill
221 ...... $180 ..... 13.5
Berrien
149 ...... $199 ..... 11.5
Bibb
1,006 ...... $189 ..... 17.2
Bleckley
122 ...... $230 ..... 13.9
Brantley
127 ...... $243 ..... 15.6
Brooks
114 ...... $198 ..... 13.7
Bryan
148 ...... $240 ..... 14.5
Bulloch
347 ...... $210 ..... 13.5
Burke
199 ...... $203 ..... 13.6
Butts
162 ...... $218 ..... 16.9
Calhoun
26 ...... $220 ..... 16.0
Camden
248 ...... $231 ..... 16.4
Candler
65 ...... $220 ..... 12.0
Carroll
780 ...... $235 ..... 14.9
Catoosa
254 ...... $238 ..... 13.0
Charlton
92 ...... $237 ..... 12.5
Chatham
1,836 ...... $219 ..... 15.7
Chattahoochee 16 ...... $187 ..... 17.0
Chattooga
111 ...... $240 ..... 16.7
Cherokee 1,176 ...... $262 ..... 18.2
Clarke
655 ...... $200 ..... 16.3
Clay
28 ...... $187 ..... 13.3
Clayton
2,288 ...... $232 ..... 17.8
Clinch
65 ...... $163 ....... 7.3
Cobb
3,963 ...... $255 ..... 18.2
Coffee
572 ...... $209 ..... 15.3
Colquitt
318 ...... $206 ..... 14.9
Columbia
459 ...... $241 ..... 15.3
Cook
116 ...... $212 ..... 14.0
Coweta
734 ...... $245 ..... 17.8
Crawford
82 ...... $215 ..... 16.0
Crisp
244 ...... $206 ..... 16.3
Dade
51 ...... $203 ..... 13.8
Dawson
136 ...... $245 ..... 18.5
Decatur
221 ...... $199 ..... 16.6
DeKalb
4,988 ...... $236 ..... 18.2
Dodge
233 ...... $200 ..... 15.3
Dooly
133 ...... $224 ..... 12.9
Dougherty
755 ...... $195 ..... 18.1
Douglas
873 ...... $250 ..... 18.0
Early
60 ...... $185 ..... 17.1
Echols
15 ...... $215 ..... 14.1
Effingham
303 ...... $255 ..... 13.7
Elbert Emanuel Evans Fannin Fayette Floyd Forsyth Franklin Fulton Gilmer Glascock Glynn Gordon Grady Greene Gwinnett Habersham Hall Hancock Haralson Harris Hart Heard Henry Houston Irwin Jackson Jasper Jeff Davis Jefferson Jenkins Johnson Jones Lamar Lanier Laurens Lee Liberty Lincoln Long Lowndes Lumpkin Macon Madison Marion McDuffie McIntosh Meriwether Miller Mitchell Monroe Montgomery Morgan Murray
231 ...... $204 ..... 12.9 340 ...... $192 ..... 12.8
42 ...... $230 ..... 14.4 152 ...... $218 ..... 14.5 384 ...... $265 ..... 19.0 1,283 ...... $230 ..... 14.6 618 ...... $270 ..... 19.0 226 ...... $230 ..... 13.4 6,009 ...... $235 ..... 18.2 258 ...... $237 ..... 13.7
22 ...... $192 ..... 13.1 505 ...... $214 ..... 16.3 841 ...... $243 ..... 12.6 164 ...... $197 ..... 14.0 204 ...... $200 ..... 14.7 4,154 ...... $258 ..... 18.5 327 ...... $224 ..... 15.1 965 ...... $238 ..... 15.8 146 ...... $181 ..... 16.7 213 ...... $230 ..... 14.1 157 ...... $239 ..... 13.5 238 ...... $205 ..... 12.7
76 ...... $224 ..... 15.3 1,256 ...... $244 ..... 17.7
592 ...... $213 ..... 15.6 81 ...... $211 ..... 14.4
383 ...... $234 ..... 17.9 164 ...... $220 ..... 16.0 260 ...... $212 ..... 11.9 220 ...... $180 ..... 15.6
56 ...... $184 ..... 17.0 87 ...... $209 ..... 14.6 131 ...... $234 ..... 16.5 163 ...... $202 ..... 17.3 63 ...... $194 ..... 12.5 540 ...... $211 ..... 13.5 187 ...... $241 ..... 16.3 229 ...... $197 ..... 16.6 85 ...... $217 ..... 13.0 51 ...... $213 ..... 15.5 883 ...... $191 ..... 14.8 169 ...... $218 ..... 17.2 133 ...... $183 ..... 13.6 243 ...... $235 ..... 15.8 66 ...... $228 ..... 15.9 278 ...... $196 ..... 14.1 81 ...... $211 ..... 16.3 234 ...... $226 ..... 13.5 31 ...... $206 ..... 16.2 187 ...... $191 ..... 16.0 187 ...... $245 ..... 16.9 86 ...... $220 ..... 12.1 149 ...... $218 ..... 16.9 744 ...... $240 ....... 8.9
Initial claims include intrastate initial and additional claims, as well as agent state initial and additional claims for regular UI only. Average duration of benefits is represented in weeks.
22
County
August Average Average Initial Weekly Duration
Claims Benefit Weeks
Muscogee Newton Oconee Oglethorpe Paulding Peach Pickens Pierce Pike Polk Pulaski Putnam Quitman Rabun Randolph Richmond Rockdale Schley Screven Seminole Spalding Stephens Stewart Sumter Talbot Taliaferro Tattnall Taylor Telfair Terrell Thomas Tift Toombs Towns Treutlen Troup Turner Twiggs Union Upson Walker Walton Ware Warren Washington Wayne Webster Wheeler White Whitfield Wilcox Wilkes Wilkinson Worth
1,104 ...... $212 ..... 13.9 818 ...... $234 ..... 17.4 117 ...... $242 ..... 17.8 95 ...... $215 ..... 16.9 824 ...... $255 ..... 17.9 197 ...... $198 ..... 14.7 214 ...... $240 ..... 16.7 158 ...... $212 ..... 14.7 147 ...... $237 ..... 15.5 411 ...... $227 ..... 13.3 65 ...... $252 ..... 14.1 422 ...... $183 ..... 14.7 4 ...... $205 ..... 16.4 77 ...... $228 ..... 15.9 31 ...... $201 ..... 12.5
1,337 ...... $199 ..... 15.0 598 ...... $241 ..... 17.3 36 ...... $196 ..... 16.6 125 ...... $205 ..... 15.9 39 ...... $213 ..... 16.4 761 ...... $204 ..... 16.8 252 ...... $229 ..... 13.2 33 ...... $221 ..... 14.6 229 ...... $180 ..... 16.5 40 ...... $227 ..... 10.3 24 ...... $252 ..... 15.8 82 ...... $222 ..... 14.6 75 ...... $211 ..... 15.0 408 ...... $189 ..... 12.2 54 ...... $199 ..... 20.0 267 ...... $197 ..... 14.5 318 ...... $206 ..... 14.8 248 ...... $220 ..... 12.9 54 ...... $205 ..... 16.1 68 ...... $229 ..... 13.0 594 ...... $223 ..... 14.1 98 ...... $209 ..... 15.2 89 ...... $232 ..... 15.7 189 ...... $214 ..... 16.1 179 ...... $210 ..... 15.0 400 ...... $220 ..... 11.4 567 ...... $242 ..... 17.3 321 ...... $195 ..... 13.7 136 ...... $149 ..... 12.8 204 ...... $179 ..... 17.3 273 ...... $217 ..... 15.5 18 ...... $231 ..... 17.2 95 ...... $200 ..... 12.5 179 ...... $216 ..... 15.6
2,020 ...... $229 ....... 9.3 73 ...... $222 ..... 14.4
143 ...... $188 ..... 13.0 70 ...... $229 ..... 18.2
168 ...... $220 ..... 16.4
Georgia Department of Labor Workforce Information & Analysis 148 Andrew Young International Boulevard, N.E. Atlanta, Georgia 30303-1751
Return Service Requested