- Collection:
- Georgia Government Publications
- Title:
- Dimensions: measuring Georgia's workforce, Vol. 36, no. 2 (Feb. 2010)
- Creator:
- Georgia. Department of Labor
- Contributor to Resource:
- Georgia. Workforce Information and Analysis
- Publisher:
- Atlanta, Ga. : Georgia Dept. of Labor, 2010-02
- Date of Original:
- 2010-02
- Subject:
- Labor market--Georgia--Statistics
Wages--Georgia--Statistics
Hours of labor--Georgia--Statistics - Location:
- United States, Georgia, 32.75042, -83.50018
- Medium:
- state government records
- Type:
- Text
- Format:
- application/pdf
- External Identifiers:
- Call Number GA L200.E46 P1 T7 36/2
- Metadata URL:
- https://dlg.galileo.usg.edu/id:dlg_ggpd_i-ga-bl200-pe46-bp1-bt7-b36-s2-belec-p-btext
- Digital Object URL:
- https://dlg.galileo.usg.edu/do:dlg_ggpd_i-ga-bl200-pe46-bp1-bt7-b36-s2-belec-p-btext
- Language:
- eng
- Holding Institution:
- University of Georgia. Map and Government Information Library
- Rights:
-

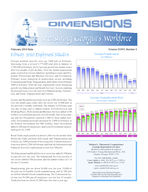
February 2010 Data
February 2010 Employment Situation
Georgia nonfarm payrolls were up 7,600 jobs in February. Increasing from a revised 3,777,600 total jobs in January to 3,785,200 in February, the 0.2 percent growth this month comes after two months of job declines. Over the month employment gains occurred in several industries including Leisure and Hospitality, Professional and Business Services, and Government. February losses transpired in employment sectors including Construction and Trade, Transportation, and Utilities. From February 2009 to February 2010, the lone employment sector displaying growth was Educational and Health Services. Sectors enduring the most job losses over the year were Manufacturing, Construction, and Trade, Transportation and Utilities.
Leisure and Hospitality positions were up 4,200 in February. The over-the-month gain comes after the sector lost 13,000 jobs in the previous 3 months combined. The January to February gain was due in large part to added workers in Food Services and Drinking Places. Professional and Business Services added 4,100 workers to its nonfarm payrolls over the month. Jobs in Accounting and Tax Preparation represent 1,900 of those added positions. Government positions increased by 3,800 in February as the Federal Government lost 900 workers, State Government added 2,300 payroll employees, and Local Government employment grew by 2,400.
Retail Trade employment was down 4,100 over the month while Wholesale Trade positions held steady and Transportation and Utilities cut 2,000 positions from its payrolls. Construction positions were down 2,200 in February and both the Information and Financial Activities employment sectors lost 700 jobs.
The Educational and Health Services sector has added 5,700 jobs to payrolls over the year. The Educational Services portion of this sector added 6,100 positions and has added workers in 7 of the last 12 months.
Manufacturing jobs are down 36,600 over the year. 24,900 of the jobs are in Durable Goods manufacturing and 11,700 jobs are in Non-Durable Goods manufacturing. The Construction sector has lost 29,200 payroll employees over the last 12 months. Trade positions are down 25,500 since this time a year ago.
Volume XXXVI, Number 2
Georgia Employment
(In Millions)
3.923 3.908 3.913 3.911
3.879
3.836
3.847
3.836
3.845
3.855
3.835
3.778 3.785
Feb Mar Apr May Jun Jul Aug Sep Oct Nov Dec Jan Feb
2009
2010
Georgia Unemployment Rate
(Seasonally Adjusted)
GA
8.7%
US
9.5% 9.7% 9.9% 10.0% 10.1% 10.2% 10.2% 10.3% 10.4% 10.5%
9.0% 9.2%
9.4%
9.5%
9.7% 9.4%
9.8%
10.1% 10.0% 10.0% 9.7%
9.7%
8.9%
8.6%
8.2%
Feb Mar Apr May Jun Jul Aug Sep Oct Nov Dec Jan Feb
2009
2010
Michael L. Thurmond, Commissioner Georgia Department of Labor
Workforce Information & Analysis 148 Andrew Young International Blvd., N.E.
Atlanta, Georgia 30303-1751
For more information, contact Corey Smith at (404) 232-3875 ext. 21299 or Agata Wardak at (404)232-3875 ext. 21310
corey.smith@dol.state.ga.us agata.wardak@dol.state.ga.us
Equal Opportunity Employer/Program Auxiliary Aids and Services Available upon
Request to Individuals with Disabilities
GEORGIA Nonagricultural Employment (000s)
Change in Jobs
Change in Jobs
Preliminary Revised
Revised
FEB 2010 JAN 2010 FEB 2009
from JAN 2010 Net %
from FEB 2009 Net %
Total Nonfarm
3,785.2
3,777.6
3,922.7
7.6 0.2
-137.5 -3.5
Total Private
3,095.1
3,091.3
3,221.1
3.8 0.1
-126.0 -3.9
Goods Producing
492.2
492.5
558.6
-0.3 -0.1
-66.4 -11.9
Service-Providing
3,293.0
3,285.1
3,364.1
7.9 0.2
-71.1 -2.1
Private Service-Providing
2,602.9
2,598.8
2,662.5
4.1 0.2
-59.6 -2.2
Mining and Logging
8.9
8.9
9.5
0.0 0.0
-0.6 -6.3
Construction
146.7
148.9
175.9
-2.2 -1.5
-29.2 -16.6
Construction of Buildings
31.4
32.6
38.6
-1.2 -3.7
-7.2 -18.7
Heavy and Civil Engineering Construction
24.1
24.3
25.1
-0.2 -0.8
-1.0 -4.0
Specialty Trade Contractors
91.2
92.0
112.2
-0.8 -0.9
-21.0 -18.7
Manufacturing
336.6
334.7
373.2
1.9 0.6
-36.6 -9.8
Durable Goods
144.7
143.9
169.6
0.8 0.6
-24.9 -14.7
Computer, Electrical Equip and Appliance Mfg
20.0
20.0
24.6
0.0 0.0
-4.6 -18.7
Transportation Equipment Manufacturing
34.5
35.0
36.7
-0.5 -1.4
-2.2 -6.0
Non-Durable Goods
191.9
190.8
203.6
1.1 0.6
-11.7 -5.8
Food Manufacturing
61.7
62.0
64.4
-0.3 -0.5
-2.7 -4.2
Textile Mills
18.2
18.4
20.0
-0.2 -1.1
-1.8 -9.0
Textile Product Mills
31.6
31.6
32.5
0.0 0.0
-0.9 -2.8
Trade, Transportation and Utilities
798.5
804.6
824.0
-6.1 -0.8
-25.5 -3.1
Wholesale Trade
188.8
188.8
204.8
0.0 0.0
-16.0 -7.8
Merchant Wholesalers, Durable Goods
92.4
92.3
103.3
0.1 0.1
-10.9 -10.6
Merchant Wholesalers, Non-durable Goods
56.6
56.9
59.7
-0.3 -0.5
-3.1 -5.2
Wholesale Electronic Markets and Agents and Brokers
39.8
39.6
41.8
0.2 0.5
-2.0 -4.8
Retail Trade
433.5
437.6
436.3
-4.1 -0.9
-2.8 -0.6
Food and Beverage Stores
79.1
79.8
77.8
-0.7 -0.9
1.3 1.7
General Merchandise Stores
96.7
99.1
96.8
-2.4 -2.4
-0.1 -0.1
Miscellaneous Store Retailers
19.2
19.3
20.5
-0.1 -0.5
-1.3 -6.3
Transportation, Warehousing, and Utilities
176.2
178.2
182.9
-2.0 -1.1
-6.7 -3.7
Utilities
20.1
20.2
20.7
-0.1 -0.5
-0.6 -2.9
Transportation and Warehousing
156.1
158.0
162.2
-1.9 -1.2
-6.1 -3.8
Air Transportation
40.3
40.2
38.5
0.1 0.3
1.8 4.7
Truck Transportation
40.5
40.9
43.8
-0.4 -1.0
-3.3 -7.5
Couriers and Messengers
17.9
18.1
19.4
-0.2 -1.1
-1.5 -7.7
Warehousing and Storage
26.1
26.1
27.3
0.0 0.0
-1.2 -4.4
Information
102.0
102.7
106.7
-0.7 -0.7
-4.7 -4.4
Telecommunications
50.8
50.8
51.2
0.0 0.0
-0.4 -0.8
Wired Telecommunications Carriers
28.8
28.8
29.3
0.0 0.0
-0.5 -1.7
Wireless Telecommunications Carriers
10.9
10.9
10.3
0.0 0.0
0.6 5.8
Internet Service Providers, Search Portals, and DP
6.4
6.3
6.8
0.1 1.6
-0.4 -5.9
Financial Activities
200.4
201.1
213.1
-0.7 -0.4
-12.7 -6.0
Finance and Insurance
145.5
146.3
155.1
-0.8 -0.6
-9.6 -6.2
Insurance Carriers and Related Activities
64.5
64.8
66.2
-0.3 -0.5
-1.7 -2.6
Real Estate, Rental and Leasing
54.9
54.8
58.0
0.1 0.2
-3.1 -5.3
Professional and Business Services
494.4
490.3
514.3
4.1 0.8
-19.9 -3.9
Professional, Scientific, and Technical Services
211.3
208.1
225.5
3.2 1.5
-14.2 -6.3
Accounting, Tax Preparation and Bookkeeping
35.7
33.8
39.0
1.9 5.6
-3.3 -8.5
Architectural, Engineering and Related Services
32.9
33.1
37.3
-0.2 -0.6
-4.4 -11.8
Computer Systems Design and Related Services
45.6
45.7
48.4
-0.1 -0.2
-2.8 -5.8
Management and Technical Consulting Services
30.8
30.2
32.5
0.6 2.0
-1.7 -5.2
Management of Companies and Enterprises
48.6
48.9
53.5
-0.3 -0.6
-4.9 -9.2
Admin and Support, Waste Mngmnt and Remediation
234.5
233.3
235.3
1.2 0.5
-0.8 -0.3
Employment Services
99.9
98.4
96.9
1.5 1.5
3.0 3.1
Educational and Health Services
481.6
479.9
475.9
1.7 0.4
5.7 1.2
Educational Services
94.6
92.5
88.5
2.1 2.3
6.1 6.9
Colleges, Universities, and Professional Schools
60.5
58.6
55.1
1.9 3.2
5.4 9.8
Health Care and Social Assistance
387.0
387.4
387.4
-0.4 -0.1
-0.4 -0.1
Ambulatory Health Care Services
143.2
144.4
146.0
-1.2 -0.8
-2.8 -1.9
Hospitals
130.3
130.0
130.4
0.3 0.2
-0.1 -0.1
Nursing and Residential Care Facilities
55.1
55.0
55.1
0.1 0.2
0.0 0.0
Social Assistance
58.4
58.0
55.9
0.4 0.7
2.5 4.5
Leisure and Hospitality
370.6
366.4
370.9
4.2 1.2
-0.3 -0.1
Arts, Entertainment, and Recreation
37.3
36.1
36.4
1.2 3.3
0.9 2.5
Amusement, Gambling, and Recreation
25.9
25.3
26.5
0.6 2.4
-0.6 -2.3
Accommodation and Food Services
333.3
330.3
334.5
3.0 0.9
-1.2 -0.4
Accommodation
36.5
36.7
39.3
-0.2 -0.5
-2.8 -7.1
Food Services and Drinking Places
296.8
293.6
295.2
3.2 1.1
1.6 0.5
Other Services
155.4
153.8
157.6
1.6 1.0
-2.2 -1.4
Repair and Maintenance
33.4
33.0
34.5
0.4 1.2
-1.1 -3.2
Personal and Laundry Services
32.9
32.4
33.1
0.5 1.5
-0.2 -0.6
Religious, Grantmaking, Civic, Professional and Similar
89.1
88.4
90.0
0.7 0.8
-0.9 -1.0
Government
690.1
686.3
701.6
3.8 0.6
-11.5 -1.6
Federal Government
99.9
100.8
100.4
-0.9 -0.9
-0.5 -0.5
Department of Defense
39.5
39.4
38.3
0.1 0.3
1.2 3.1
State Government
163.2
160.9
166.9
2.3 1.4
-3.7 -2.2
State Government Education
88.1
83.4
83.3
4.7 5.6
4.8 5.8
Local Government
427.0
424.6
434.3
2.4 0.6
-7.3 -1.7
Local Government Education
266.5
264.2
272.3
2.3 0.9
-5.8 -2.1
Note: These preliminary estimates were prepared in cooperation with the U.S. Department of Labor, Bureau of Labor Statistics, based upon monthly reports submitted by selected employers
throughout Georgia. The estimates include all full- and part-time wage and salary workers who were employed during or received pay for any part of the pay period that includes the twelfth of the
month. Proprietors, domestic workers, self-employed persons, unpaid family workers and personnel of the armed forces are excluded. Estimates based on 2009 benchmark.
2
Source: Georgia Department of Labor, Workforce Information & Analysis
ATLANTA MSA Nonagricultural Employment (000s)
Preliminary FEB 2010
Revised JAN 2010
Revised FEB 2009
Change in Jobs
from JAN 2010
Net
%
Change in Jobs from FEB 2009
Net %
Total Nonfarm Total Private Goods Producing Service-Providing Private Service-Providing
Mining and Logging Construction Construction of Buildings Specialty Trade Contractors Manufacturing Durable Goods Transportation Equipment Manufacturing Non-Durable Goods Food Manufacturing Trade, Transportation and Utilities Wholesale Trade Merchant Wholesalers, Durable Goods Merchant Wholesalers, Non-durable Goods Wholesale Electronic Markets and Agents and Brokers Retail Trade Food and Beverage Stores General Merchandise Stores Miscellaneous Store Retailers Transportation, Warehousing, and Utilities Utilities Transportation and Warehousing Air Transportation Truck Transportation Couriers and Messengers Information Telecommunications Wired Telecommunications Carriers Wireless Telecommunications Carriers Internet Service Providers, Search Portals, and DP Financial Activities Finance and Insurance Insurance Carriers and Related Activities Real Estate, Rental and Leasing Professional and Business Services Professional, Scientific, and Technical Services Accounting, Tax Preparation and Bookkeeping Architectural, Engineering and Related Services Computer Systems Design and Related Services Management and Technical Consulting Services Management of Companies and Enterprises Admin and Support, Waste Mngmnt and Remediation Employment Services Educational and Health Services Educational Services Health Care and Social Assistance Ambulatory Health Care Services Hospitals Social Assistance Leisure and Hospitality Arts, Entertainment, and Recreation Accommodation and Food Services Accommodation Food Services and Drinking Places Other Services Repair and Maintenance Personal and Laundry Services Government Federal Government State Government Local Government
2,238.9 1,906.4
227.8 2,011.1 1,678.6
1.2 89.2 17.6 56.4 137.4 64.1 12.8 73.3 23.1 508.0 138.6 69.6 37.8 31.2 246.9 47.6 51.4 12.9 122.5 10.9 111.6 39.1 24.0 14.1 77.2 37.1 23.3
8.9 6.0 138.6 98.2 43.8 40.4 363.8 164.7 25.5 24.7 36.2 27.0 36.9 162.2 68.4 273.0 60.4 212.6 81.1 71.0 33.9 217.8 24.6 193.2 20.5 172.7 100.2 18.8 22.0 332.5 46.6 67.2 218.7
2,232.6 1,903.0
228.9 2,003.7 1,674.1
1.2 90.8 18.7 56.8 136.9 64.1 13.0 72.8 23.1 512.2 139.1 69.6 38.3 31.2 250.0 47.8 53.7 12.9 123.1 11.0 112.1 39.0 24.0 14.3 77.9 37.0 23.2
8.9 5.9 139.2 98.8 44.5 40.4 358.4 162.1 24.1 25.0 36.6 26.4 37.3 159.0 67.6 272.5 60.3 212.2 82.2 70.7 33.6 215.3 23.8 191.5 20.8 170.7 98.6 18.6 21.8 329.6 47.1 65.7 216.8
2,324.4 1,983.4
263.7 2,060.7 1,719.7
1.4 109.3
23.3 71.0 153.0 76.9 13.3 76.1 23.7 523.8 150.7 77.7 39.6 33.4 248.6 47.7 51.5 13.2 124.5 11.4 113.1 37.1 26.1 15.4 82.2 37.0 23.9
8.3 6.4 147.7 105.8 45.0 41.9 378.4 177.1 26.5 28.5 40.6 29.0 40.8 160.5 66.1 269.7 59.0 210.7 81.7 70.9 34.0 219.0 24.2 194.8 22.1 172.7 98.9 19.3 21.9 341.0 48.2 71.0 221.8
6.3 0.3 3.4 0.2 -1.1 -0.5 7.4 0.4 4.5 0.3 0.0 0.0 -1.6 -1.8 -1.1 -5.9 -0.4 -0.7 0.5 0.4 0.0 0.0 -0.2 -1.5 0.5 0.7 0.0 0.0 -4.2 -0.8 -0.5 -0.4 0.0 0.0 -0.5 -1.3 0.0 0.0 -3.1 -1.2 -0.2 -0.4 -2.3 -4.3 0.0 0.0 -0.6 -0.5 -0.1 -0.9 -0.5 -0.5 0.1 0.3 0.0 0.0 -0.2 -1.4 -0.7 -0.9 0.1 0.3 0.1 0.4 0.0 0.0 0.1 1.7 -0.6 -0.4 -0.6 -0.6 -0.7 -1.6 0.0 0.0 5.4 1.5 2.6 1.6 1.4 5.8 -0.3 -1.2 -0.4 -1.1 0.6 2.3 -0.4 -1.1 3.2 2.0 0.8 1.2 0.5 0.2 0.1 0.2 0.4 0.2 -1.1 -1.3 0.3 0.4 0.3 0.9 2.5 1.2 0.8 3.4 1.7 0.9 -0.3 -1.4 2.0 1.2 1.6 1.6 0.2 1.1 0.2 0.9 2.9 0.9 -0.5 -1.1 1.5 2.3 1.9 0.9
-85.5 -77.0 -35.9 -49.6 -41.1
-0.2 -20.1
-5.7 -14.6 -15.6 -12.8
-0.5 -2.8 -0.6 -15.8 -12.1 -8.1 -1.8 -2.2 -1.7 -0.1 -0.1 -0.3 -2.0 -0.5 -1.5 2.0 -2.1 -1.3 -5.0 0.1 -0.6 0.6 -0.4 -9.1 -7.6 -1.2 -1.5 -14.6 -12.4 -1.0 -3.8 -4.4 -2.0 -3.9 1.7 2.3 3.3 1.4 1.9 -0.6 0.1 -0.1 -1.2 0.4 -1.6 -1.6 0.0 1.3 -0.5 0.1 -8.5 -1.6 -3.8 -3.1
-3.7 -3.9 -13.6 -2.4 -2.4 -14.3 -18.4 -24.5 -20.6 -10.2 -16.6 -3.8 -3.7 -2.5 -3.0 -8.0 -10.4 -4.6 -6.6 -0.7 -0.2 -0.2 -2.3 -1.6 -4.4 -1.3 5.4 -8.1 -8.4 -6.1 0.3 -2.5 7.2 -6.3 -6.2 -7.2 -2.7 -3.6 -3.9 -7.0 -3.8 -13.3 -10.8 -6.9 -9.6 1.1 3.5 1.2 2.4 0.9 -0.7 0.1 -0.3 -0.6 1.7 -0.8 -7.2 0.0 1.3 -2.6 0.5 -2.5 -3.3 -5.4 -1.4
Note: These preliminary estimates were prepared in cooperation with the U.S. Department of Labor, Bureau of Labor Statistics, based upon monthly reports submitted by selected employers
in the Atlanta Metropolitan Statistical Area, which includes Barrow, Bartow, Butts, Carroll, Cherokee, Clayton, Cobb, Coweta, Dawson, DeKalb, Douglas, Fayette, Forsyth, Fulton, Gwinnett, Haralson, Heard, Henry, Jasper, Lamar, Meriwether, Newton, Paulding, Pickens, Pike, Rockdale, Spalding and Walton counties. The estimates include all full- and part-time wage and salary workers who were employed during or received pay for any part of the pay period that includes the twelfth of the month. Proprietors, domestic workers, self-employed persons, unpaid family workers and personnel of the armed forces are excluded. Estimates based on 2009 benchmark.
Source: Georgia Department of Labor, Workforce Information & Analysis
3
ALBANY MSA Nonagricultural Employment (000s)
Preliminary
Revised Revised
FEB 2010 JAN 2010 FEB 2009
Change in Jobs from JAN 2010
Net %
Change in Jobs
from FEB 2009
Net
%
Total Nonfarm Total Private
61.6
61.2
62.8
47.7
47.3
48.8
0.4 0.7 0.4 0.9
-1.2 -1.9 -1.1 -2.3
Goods Producing Service-Providing Private Service-Providing
7.3
7.3
9.1
54.3
53.9
53.7
40.4
40.0
39.7
0.0 0.0 0.4 0.7 0.4 1.0
-1.8 -19.8 0.6 1.1 0.7 1.8
Manufacturing Trade, Transportation and Utilities Retail Trade
4.8
4.8
6.3
0.0 0.0
12.7
12.6
12.3
0.1 0.8
7.5
7.6
7.4
-0.1 -1.3
-1.5 -23.8 0.4 3.3 0.1 1.4
Government Federal Government State Government
13.9
13.9
14.0
0.0 0.0
3.4
3.5
3.4
-0.1 -2.9
3.0
3.0
2.9
0.0 0.0
-0.1 -0.7 0.0 0.0 0.1 3.5
Local Government
7.5
7.4
7.7
0.1 1.4
-0.2 -2.6
Note: These preliminary estimates were prepared in cooperation with the U.S. Department of Labor, Bureau of Labor Statistics, based upon monthly reports submitted by selected employers
in the Albany Metropolitan Statistical Area, which includes Baker, Dougherty, Lee, Terrell and Worth counties. The estimates include all full- and part-time wage and salary workers who were employed during or received pay for any part of the pay period that includes the twelfth of the month. Proprietors, domestic workers, self-employed persons, unpaid family workers and personnel
of the armed forces are excluded. Estimates based on 2009 benchmark.
ATHENS - CLARKE MSA Nonagricultural Employment (000s)
Preliminary
Revised
Revised
FEB 2010 JAN 2010 FEB 2009
Change in Jobs
from JAN 2010
Net
%
Change in Jobs from FEB 2009
Net %
Total Nonfarm
79.8
79.7
80.8
0.1 0.1
-1.0 -1.2
Total Private
55.4
55.3
56.9
0.1 0.2
-1.5 -2.6
Goods Producing
9.6
9.7
10.7
-0.1 -1.0
-1.1 -10.3
Service-Providing
70.2
70.0
70.1
0.2 0.3
0.1 0.1
Private Service-Providing
45.8
45.6
46.2
0.2 0.4
-0.4 -0.9
Trade, Transportation and Utilities
12.9
13.0
12.8
-0.1 -0.8
0.1 0.8
Retail Trade
9.4
9.5
9.0
-0.1 -1.1
0.4 4.4
Professional and Business Services
6.8
6.7
6.6
0.1 1.5
0.2 3.0
Leisure and Hospitality
8.1
8.0
8.0
0.1 1.3
0.1 1.3
Government
24.4
24.4
23.9
0.0 0.0
0.5 2.1
Federal Government
1.5
1.6
1.5
-0.1 -6.3
0.0 0.0
State Government
14.9
14.8
14.3
0.1 0.7
0.6 4.2
Local Government
8.0
8.0
8.1
0.0 0.0
-0.1 -1.2
Note: These preliminary estimates were prepared in cooperation with the U.S. Department of Labor, Bureau of Labor Statistics, based upon monthly reports submitted by selected employers in
the Athens - Clarke County Metropolitan Statistical Area, which includes Clarke, Madison, Oconee and Oglethorpe counties. The estimates include all full- and part-time wage and salary workers who were employed during or received pay for any part of the pay period that includes the twelfth of the month. Proprietors, domestic workers, self-employed persons, unpaid family workers and personnel of the armed forces are excluded. Estimates based on 2009 benchmark.
Source: Georgia Department of Labor, Workforce Information & Analysis
4
AUGUSTA-RICHMOND MSA Nonagricultural Employment (000s)
Preliminary
Revised
Revised
FEB 2010 JAN 2010 FEB 2009
Change in Jobs from JAN 2010
Net %
Change in Jobs from FEB 2009
Net %
Total Nonfarm Total Private Goods Producing Service-Providing Private Service-Providing Mining, Logging, and Construction Manufacturing Trade, Transportation and Utilities Wholesale Trade Retail Trade Transportation,Warehousing, and Utilities Information Financial Activitities Professional and Business Services Educational and Health Services Leisure and Hospitality Other Services Government Federal Government State Government Local Government
209.2 165.2
29.5 179.7 135.7
10.2 19.3 35.7
4.4 24.9
6.4 2.7 7.3 31.3 28.7 20.6 9.4 44.0 8.6 13.8 21.6
208.6 164.5
29.6 179.0 134.9
10.3 19.3 35.5
4.4 24.9
6.2 2.7 7.3 31.1 28.6 20.4 9.3 44.1 8.7 13.8 21.6
209.7 165.8
33.0 176.7 132.8
11.4 21.6 35.0
4.7 23.9
6.4 2.8 7.5 28.4 28.6 20.9 9.6 43.9 7.9 13.5 22.5
0.6 0.3 0.7 0.4 -0.1 -0.3 0.7 0.4 0.8 0.6 -0.1 -1.0 0.0 0.0 0.2 0.6 0.0 0.0 0.0 0.0 0.2 3.2 0.0 0.0 0.0 0.0 0.2 0.6 0.1 0.4 0.2 1.0 0.1 1.1 -0.1 -0.2 -0.1 -1.2 0.0 0.0 0.0 0.0
-0.5 -0.2 -0.6 -0.4 -3.5 -10.6 3.0 1.7 2.9 2.2 -1.2 -10.5 -2.3 -10.7 0.7 2.0 -0.3 -6.4 1.0 4.2 0.0 0.0 -0.1 -3.6 -0.2 -2.7 2.9 10.2 0.1 0.4 -0.3 -1.4 -0.2 -2.1 0.1 0.2 0.7 8.9 0.3 2.2 -0.9 -4.0
Note: These preliminary estimates were prepared in cooperation with the U.S. Department of Labor, Bureau of Labor Statistics, based upon monthly reports submitted by selected employers in the
Augusta - Richmond County Metropolitan Statistical Area, which includes Burke, Columbia, McDuffie and Richmond counties in Georgia and Aiken and Edgefield counties in South Carolina. The estimates include all full- and part-time wage and salary workers who were employed during or received pay for any part of the pay period that includes the twelfth of the month. Proprietors, domestic
workers, self-employed persons, unpaid family workers and personnel of the armed forces are excluded. Estimates based on 2009 benchmark.
COLUMBUS MSA Nonagricultural Employment (000s)
Preliminary Revised Revised FEB 2010 JAN 2010 FEB 2009
Change in Jobs from JAN 2010
Net %
Change in Jobs from FEB 2009
Net %
Total Nonfarm Total Private
116.6 92.7
116.8 93.0
117.7 94.0
-0.2 -0.2 -0.3 -0.3
-1.1 -0.9 -1.3 -1.4
Goods Producing
13.5
13.6
15.1
-0.1 -0.7
-1.6 -10.6
Service-Providing Private Service-Providing
103.1 79.2
103.2 79.4
102.6 78.9
-0.1 -0.1 -0.2 -0.3
0.5 0.5 0.3 0.4
Trade, Transportation and Utilities
17.8
17.8
17.9
0.0 0.0
-0.1 -0.6
Retail Trade Information
12.7 5.7
12.7 5.7
12.7 5.8
0.0 0.0 0.0 0.0
0.0 0.0 -0.1 -1.7
Financial Activities
8.4
8.3
8.7
0.1 1.2
-0.3 -3.5
Finance and Insurance Insurance Carriers and Related Activities
6.7
6.8
7.0
-0.1 -1.5
4.6
4.6
4.8
0.0 0.0
-0.3 -4.3 -0.2 -4.2
Professional and Business Services
13.0
12.9
13.0
0.1 0.8
0.0 0.0
Leisure and Hospitality Government
12.8 23.9
12.7 23.8
12.9 23.7
0.1 0.8 0.1 0.4
-0.1 -0.8 0.2 0.8
Federal Government
6.0
6.0
5.8
0.0 0.0
0.2 3.5
State Government Local Government
4.3
4.3
4.2
13.6
13.5
13.7
0.0 0.0 0.1 0.7
0.1 2.4 -0.1 -0.7
Note: These preliminary estimates were prepared in cooperation with the U.S. Department of Labor, Bureau of Labor Statistics, based upon monthly reports submitted by selected
employers in the Columbus Metropolitan Statistical Area, which includes Chattahoochee, Harris, Marion and Muscogee counties in Georgia and Russell County in Alabama. The estimates include all full- and part-time wage and salary workers who were employed during or received pay for any part of the pay period that includes the twelfth of the month. Proprietors, domestic workers, self-employed persons, unpaid family workers and personnel of the armed forces are excluded. Estimates based on 2009 benchmark.
Source: Georgia Department of Labor, Workforce Information & Analysis
5
DALTON MSA Nonagricultural Employment (000s)
Preliminary Revised
Revised
FEB 2010 JAN 2010 FEB 2009
Change in Jobs from JAN 2010
Net %
Change in Jobs from FEB 2009
Net %
Total Nonfarm
65.7
65.2
67.3
0.5 0.8
-1.6 -2.4
Total Private Goods Producing
58.5
58.0
24.3
24.4
59.9 26.3
0.5 0.9 -0.1 -0.4
-1.4 -2.3 -2.0 -7.6
Service-Providing
41.4
40.8
41.0
0.6 1.5
0.4 1.0
Private Service-Providing Manufacturing
34.2
33.6
33.6
23.4
23.4
25.0
0.6 1.8 0.0 0.0
0.6 1.8 -1.6 -6.4
Textile Mills
2.2
2.2
2.2
0.0 0.0
0.0 0.0
Textile Product Mills Trade, Transportation and Utilities
18.0
18.0
14.2
14.3
18.0 14.3
0.0 0.0 -0.1 -0.7
0.0 0.0 -0.1 -0.7
Retail Trade
7.3
7.4
7.2
-0.1 -1.4
0.1 1.4
Transportation, Warehouse, and Utilities Professional and Business Services
3.3
3.3
5.4
5.4
3.3
0.0 0.0
0.0 0.0
6.6
0.0 0.0
-1.2 -18.2
Government
7.2
7.2
7.4
0.0 0.0
-0.2 -2.7
Federal Government State Government
0.3
0.3
1.2
1.2
0.3
0.0 0.0
1.2
0.0 0.0
0.0 0.0 0.0 0.0
Local Government
5.7
5.7
5.9
0.0 0.0
-0.2 -3.4
Note: These preliminary estimates were prepared in cooperation with the U.S. Department of Labor, Bureau of Labor Statistics, based upon monthly reports submitted by selected employers
in the Dalton Metropolitan Statistical Area, which includes Murray and Whitfield counties. The estimates include all full- and part-time wage and salary workers who were employed during or received pay for any part of the pay period that includes the twelfth of the month. Proprietors, domestic workers, self-employed persons, unpaid family workers and personnel of the armed forces are excluded. Estimates based on 2009 benchmark.
GAINESVILLE MSA Nonagricultural Employment (000s)
Preliminary Revised
Revised
FEB 2010 JAN 2010 FEB 2009
Change in Jobs from JAN 2010
Net %
Change in Jobs from FEB 2009
Net %
Total Nonfarm Total Private Goods Producing Service-Providing Private Service-Providing Trade, Transportation and Utilities Retail Trade Government Federal Government State Government Local Government
70.2
70.3
59.3
59.5
17.9
18.1
52.3
52.2
41.4
41.4
13.3
13.0
7.1
7.3
10.9
10.8
0.5
0.5
2.9
2.9
7.5
7.4
72.0
-0.1 -0.1
61.4
-0.2 -0.3
19.7
-0.2 -1.1
52.3
0.1 0.2
41.7
0.0 0.0
13.7
0.3 2.3
7.5
-0.2 -2.7
10.6
0.1 0.9
0.5
0.0 0.0
2.4
0.0 0.0
7.7
0.1 1.4
-1.8 -2.5 -2.1 -3.4 -1.8 -9.1 0.0 0.0 -0.3 -0.7 -0.4 -2.9 -0.4 -5.3 0.3 2.8 0.0 0.0 0.5 20.8 -0.2 -2.6
Note: These preliminary estimates were prepared in cooperation with the U.S. Department of Labor, Bureau of Labor Statistics, based upon monthly reports submitted by selected employers
in the Gainesville Metropolitan Statistical Area, which comprises Hall county. The estimates include all full- and part-time wage and salary workers who were employed during or received pay for any part of the pay period that includes the twelfth of the month. Proprietors, domestic workers, self-employed persons, unpaid family workers and personnel of the armed forces are excluded. Estimates based on 2009 benchmark.
Source: Georgia Department of Labor, Workforce Information & Analysis
6
HINESVILLE - FT. STEWART MSA Nonagricultural Employment (000s)
Preliminary Revised
Revised
FEB 2010 JAN 2010 FEB 2009
Change in Jobs from JAN 2010
Net %
Change in Jobs from FEB 2009
Net %
Total Nonfarm Total Private Goods Producing Service-Providing Private Service-Providing Government
Federal Government State Government Local Government
19.5
19.3
19.5
11.5
11.5
11.9
1.6
1.6
1.8
17.9
17.7
17.7
9.9
9.9
10.1
8.0
7.8
7.6
4.3
4.1
3.8
0.3
0.3
0.3
3.4
3.4
3.5
0.2 1.0 0.0 0.0 0.0 0.0 0.2 1.1 0.0 0.0 0.2 2.6 0.2 4.9 0.0 0.0 0.0 0.0
0.0 0.0 -0.4 -3.4 -0.2 -11.1 0.2 1.1 -0.2 -2.0 0.4 5.3 0.5 13.2 0.0 0.0 -0.1 -2.9
Note: These preliminary estimates were prepared in cooperation with the U.S. Department of Labor, Bureau of Labor Statistics, based upon monthly reports submitted by selected
employers in the Hinesville - Ft. Stewart Metropolitan Statistical Area, which includes Liberty and Long counties. The estimates include all full- and part-time wage and salary workers who were employed during or received pay for any part of the pay period that includes the twelfth of the month. Proprietors, domestic workers, self-employed persons, unpaid family workers and personnel of the armed forces are excluded. Estimates based on 2009 benchmark.
MACON MSA Nonagricultural Employment (000s)
Preliminary Revised
Revised
FEB 2010 JAN 2010 FEB 2009
Change in Jobs from JAN 2010
Net %
Change in Jobs from FEB 2009
Net %
Total Nonfarm Total Private Goods Producing Service-Providing Private Service-Providing Trade Transportation and Utilities Retail Trade Transportation, Warehousing, and Utilities Financial Activities Professional and Business Services Educational and Health Services Leisure and Hospitality Government Federal Government State Government Local Government
94.6
95.2
79.9
80.3
9.7
9.8
84.9
85.4
70.2
70.5
18.3
18.6
11.6
11.7
4.0
4.0
8.3
8.3
11.3
11.2
19.0
18.9
8.3
8.2
14.7
14.9
1.4
1.4
3.3
3.4
10.0
10.1
97.0 81.8 10.5 86.5 71.3 19.9 11.7
4.3 8.2 10.7 18.9 8.6 15.2 1.4 3.4 10.4
-0.6 -0.6 -0.4 -0.5 -0.1 -1.0 -0.5 -0.6 -0.3 -0.4 -0.3 -1.6 -0.1 -0.9 0.0 0.0 0.0 0.0 0.1 0.9 0.1 0.5 0.1 1.2 -0.2 -1.3 0.0 0.0 -0.1 -2.9 -0.1 -1.0
-2.4 -2.5 -1.9 -2.3 -0.8 -7.6 -1.6 -1.9 -1.1 -1.5 -1.6 -8.0 -0.1 -0.9 -0.3 -7.0 0.1 1.2 0.6 5.6 0.1 0.5 -0.3 -3.5 -0.5 -3.3 0.0 0.0 -0.1 -2.9 -0.4 -3.9
Note: These preliminary estimates were prepared in cooperation with the U.S. Department of Labor, Bureau of Labor Statistics, based upon monthly reports submitted by selected employers
in the Macon Metropolitan Statistical Area, which includes Bibb, Crawford, Jones, Monroe and Twiggs counties. The estimates include all full- and part-time wage and salary workers who were employed during or received pay for any part of the pay period that includes the twelfth of the month. Proprietors, domestic workers, self-employed persons, unpaid family workers and personnel of the armed forces are excluded. Estimates based on 2009 benchmark.
Source: Georgia Department of Labor, Workforce Information & Analysis
7
ROME MSA Nonagricultural Employment (000s)
Preliminary Revised
Revised
FEB 2010 JAN 2010 FEB 2009
Change in Jobs from JAN 2010
Net %
Change in Jobs from FEB 2009
Net %
Total Nonfarm Total Private Goods Producing Service-Providing Private Service-Providing Manufacturing Trade, Transportation and Utilities
Retail Trade Educational and Health Services Government Federal Government State Government Local Government
39.3
39.4
32.4
32.5
7.0
7.0
32.3
32.4
25.4
25.5
6.0
6.0
6.0
6.1
4.0
4.1
8.7
8.7
6.9
6.9
0.2
0.2
2.7
2.7
4.0
4.0
40.1
-0.1 -0.3
32.9
-0.1 -0.3
7.7
0.0 0.0
32.4
-0.1 -0.3
25.2
-0.1 -0.4
6.6
0.0 0.0
6.5
-0.1 -1.6
4.2
-0.1 -2.4
8.6
0.0 0.0
7.2
0.0 0.0
0.2
0.0 0.0
2.6
0.0 0.0
4.4
0.0 0.0
-0.8 -2.0 -0.5 -1.5 -0.7 -9.1 -0.1 -0.3 0.2 0.8 -0.6 -9.1 -0.5 -7.7 -0.2 -4.8 0.1 1.2 -0.3 -4.2 0.0 0.0 0.1 3.9 -0.4 -9.1
Note: These preliminary estimates were prepared in cooperation with the U.S. Department of Labor, Bureau of Labor Statistics, based upon monthly reports submitted by selected employers
in the Rome Metropolitan Statistical Area, which comprises Floyd county. The estimates include all full- and part-time wage and salary workers who were employed during or received pay for any part of the pay period that includes the twelfth of the month. Proprietors, domestic workers, self-employed persons, unpaid family workers and personnel of the armed forces are excluded. Estimates based on 2009 benchmark.
SAVANNAH MSA Nonagricultural Employment (000s)
Preliminary Revised
Revised
FEB 2010 JAN 2010 FEB 2009
Change in Jobs from JAN 2010
Net %
Change in Jobs from FEB 2009
Net %
Total Nonfarm
148.7
148.8
152.1
-0.1 -0.1
-3.4 -2.2
Total Private
124.8
125.0
128.6
-0.2 -0.2
-3.8 -3.0
Goods Producing Service-Providing
20.2 128.5
20.3 128.5
22.3 129.8
-0.1 -0.5 0.0 0.0
-2.1 -9.4 -1.3 -1.0
Private Service-Providing
104.6
104.7
106.3
-0.1 -0.1
-1.7 -1.6
Mining, Logging, and Construction Manufacturing
7.0
7.1
7.9
-0.1 -1.4
13.2
13.2
14.4
0.0 0.0
-0.9 -11.4 -1.2 -8.3
Trade, Transportation and Utilities
31.4
31.7
33.4
-0.3 -1.0
-2.0 -6.0
Wholesale Trade Retail Trade
5.4
5.4
5.7
0.0 0.0
16.2
16.5
17.0
-0.3 -1.8
-0.3 -5.3 -0.8 -4.7
Transportation, Warehousing, and Utilities
9.8
9.8
10.7
0.0 0.0
-0.9 -8.4
Information Financial Activities
1.7
1.7
5.5
5.5
1.9
0.0 0.0
-0.2 -10.5
5.7
0.0 0.0
-0.2 -3.5
Professional and Business Services
15.8
15.9
16.6
-0.1 -0.6
-0.8 -4.8
Educational and Health Services Leisure and Hospitality
23.8
23.7
22.0
19.2
19.1
19.3
0.1 0.4 0.1 0.5
1.8 8.2 -0.1 -0.5
Other Services
7.2
7.1
7.4
0.1 1.4
-0.2 -2.7
Government Federal Government
23.9
23.8
23.5
3.0
3.0
2.9
0.1 0.4 0.0 0.0
0.4 1.7 0.1 3.5
State Government
5.6
5.6
5.5
0.0 0.0
0.1 1.8
Local Government
15.3
15.2
15.1
0.1 0.7
0.2 1.3
Note: These preliminary estimates were prepared in cooperation with the U.S. Department of Labor, Bureau of Labor Statistics, based upon monthly reports submitted by selected employers
in the Savannah Metropolitan Statistical Area, which includes Bryan, Chatham and Effingham counties. The estimates include all full- and part-time wage and salary workers who were employed during or received pay for any part of the pay period that includes the twelfth of the month. Proprietors, domestic workers, self-employed persons, unpaid family workers and personnel of the armed forces are excluded. Estimates based on 2009 benchmark.
Source: Georgia Department of Labor, Workforce Information & Analysis
8
VALDOSTA MSA Nonagricultural Employment (000s)
Preliminary Revised
Revised
FEB 2010 JAN 2010 FEB 2009
Change in Jobs from JAN 2010
Net %
Change in Jobs from FEB 2009
Net %
Total Nonfarm Total Private Goods Producing Service-Providing Private Service-Providing Trade, Transportation and Utilities Retail Trade Government Federal Government State Government Local Government
52.6
51.9
54.3
39.4
38.9
41.0
6.7
6.7
7.7
45.9
45.2
46.6
32.7
32.2
33.3
10.8
10.8
11.2
7.8
7.8
7.7
13.2
13.0
13.3
1.0
1.0
0.8
4.3
4.1
4.5
7.9
7.9
8.0
0.7 1.4 0.5 1.3 0.0 0.0 0.7 1.6 0.5 1.6 0.0 0.0 0.0 0.0 0.2 1.5 0.0 0.0 0.2 4.9 0.0 0.0
-1.7 -3.1 -1.6 -3.9 -1.0 -13.0 -0.7 -1.5 -0.6 -1.8 -0.4 -3.6 0.1 1.3 -0.1 -0.8 0.2 25.0 -0.2 -4.4 -0.1 -1.3
Note: These preliminary estimates were prepared in cooperation with the U.S. Department of Labor, Bureau of Labor Statistics, based upon monthly reports submitted by selected employers
in the Valdosta Metropolitan Statistical Area, which includes Brooks, Echols, Lanier and Lowndes counties. The estimates include all full- and part-time wage and salary workers who were employed during or received pay for any part of the pay period that includes the twelfth of the month. Proprietors, domestic workers, self-employed persons, unpaid family workers and personnel of the armed forces are excluded. Estimates based on 2009 benchmark.
WARNER ROBINS MSA Nonagricultural Employment (000s)
Preliminary Revised
Revised
FEB 2010 JAN 2010 FEB 2009
Change in Jobs from JAN 2010
Net %
Change in Jobs from FEB 2009
Net %
Total Nonfarm Total Private Goods Producing Service-Providing Private Service-Providing Trade, Transportation and Utilities Retail Trade Government Federal Government State Government Local Government
58.3
58.2
58.0
0.1 0.2
34.0
33.8
34.5
0.2 0.6
6.4
6.5
6.6
-0.1 -1.5
51.9
51.7
51.4
0.2 0.4
27.6
27.3
27.9
0.3 1.1
7.6
7.7
7.7
-0.1 -1.3
6.0
6.0
6.0
0.0 0.0
24.3
24.4
23.5
-0.1 -0.4
14.9
15.1
14.3
-0.2 -1.3
1.2
1.1
1.1
0.1 9.1
8.2
8.2
8.1
0.0 0.0
0.3 0.5 -0.5 -1.5 -0.2 -3.0 0.5 1.0 -0.3 -1.1 -0.1 -1.3 0.0 0.0 0.8 3.4 0.6 4.2 0.1 9.1 0.1 1.2
Note: These preliminary estimates were prepared in cooperation with the U.S. Department of Labor, Bureau of Labor Statistics, based upon monthly reports submitted by selected employers
in the Warner Robins Metropolitan Statistical Area, which comprises Houston county. The estimates include all full- and part-time wage and salary workers who were employed during or received pay for any part of the pay period that includes the twelfth of the month. Proprietors, domestic workers, self-employed persons, unpaid family workers and personnel of the armed forces are excluded. Estimates based on 2009 benchmark.
Source: Georgia Department of Labor, Workforce Information & Analysis
9
Georgia Statewide Hours and Earnings
All Employee
Average Weekly Earnings
Preliminary FEB 2010
Revised JAN 2010
Revised FEB 2009
Total Private ............................................................................................ $728.12 ........................ $727.16 ................... $754.30 Goods Producing .................................................................................. $796.37 ........................ $814.46 ................... $746.23 Private Service Providing ...................................................................... $716.02 ........................ $710.20 ................... $756.81
Construction ........................................................................................ $782.99 ........................ $798.89 .................... $749.11 Manufacturing ..................................................................................... $781.04 ........................ $786.46 ................... $720.39 Trade, Transportation, and Utilities ..................................................... $661.09 ........................ $654.25 ................... $708.75 Financial Activities .............................................................................. $891.26 ........................ $866.62 ................... $955.99 Professional and Business Services .................................................. $925.11 ........................ $917.29 ................... $967.13 Educational and Health Services ....................................................... $775.13 ........................ $769.78 ................... $783.30 Leisure and Hospitality ....................................................................... $319.68 ........................ $315.90 ................... $335.53 Other Services .................................................................................... $584.32 ........................ $575.36 ................... $544.50
Average Weekly Hours
Preliminary FEB 2010
Revised JAN 2010
Revised FEB 2009
Total Private .................................................................................................. 34.2 .............................. 34.3 ......................... 35.1 Goods Producing ........................................................................................ 37.6 .............................. 38.4 ......................... 37.2 Private Service Providing ............................................................................ 33.6 .............................. 33.5 ......................... 34.7
Construction .............................................................................................. 36.3 .............................. 36.9 ......................... 36.4 Manufacturing ........................................................................................... 38.8 .............................. 39.6 ......................... 37.0 Trade, Transportation, and Utilities ........................................................... 34.2 .............................. 34.2 ......................... 35.0 Financial Activities .................................................................................... 35.2 .............................. 35.1 ......................... 36.6 Professional and Business Services ........................................................ 34.2 .............................. 34.1 ......................... 35.4 Educational and Health Services ............................................................. 34.9 .............................. 34.8 ......................... 35.8 Leisure and Hospitality ............................................................................. 27.0 .............................. 27.0 ......................... 29.0 Other Services .......................................................................................... 32.0 .............................. 31.7 ......................... 32.2
Average Hourly Earnings
Preliminary FEB 2010
Revised JAN 2010
Revised FEB 2009
Total Private .............................................................................................. $21.29 .......................... $21.20 ..................... $21.49 Goods Producing .................................................................................... $21.18 .......................... $21.21 ..................... $20.06 Private Service Providing ........................................................................ $21.31 .......................... $21.20 ..................... $21.81
Construction .......................................................................................... $21.57 .......................... $21.65 ..................... $20.58 Manufacturing ....................................................................................... $20.13 .......................... $19.86 ..................... $19.47 Trade, Transportation, and Utilities ....................................................... $19.33 .......................... $19.13 ..................... $20.25 Financial Activities ................................................................................ $25.32 .......................... $24.69 ..................... $26.12 Professional and Business Services .................................................... $27.05 .......................... $26.90 ..................... $27.32 Educational and Health Services ......................................................... $22.21 .......................... $22.12 ..................... $21.88 Leisure and Hospitality ......................................................................... $11.84 .......................... $11.70 ...................... $11.57 Other Services ...................................................................................... $18.26 .......................... $18.15 ..................... $16.91
Read more about the hours and earnings series at http://www.bls.gov/sae/saeaepp.htm
Source: Georgia Department of Labor, Workforce Information & Analysis
10
Georgia MSA Hours and Earnings
All Employee Total Private
Average Weekly Earnings
Preliminary FEB 2010
Revised JAN 2010
Revised FEB 2009
Albany MSA ............................................................................................ $535.22 ........................ $557.76 ................... $491.01 Athens-Clarke County MSA .................................................................... $669.94 ........................ $676.28 ................... $717.78 Atlanta MSA ............................................................................................ $813.86 ........................ $819.36 ................... $870.00 Augusta-Richmond County MSA ............................................................ $776.95 ........................ $785.61 ................... $712.01 Brunswick MSA ....................................................................................... $530.38 ........................ $516.17 ................... $592.28 Columbus MSA ....................................................................................... $585.21 ........................ $590.73 ................... $591.79 Dalton MSA ............................................................................................ $572.55 ........................ $585.52 ................... $634.37 Gainesville MSA ..................................................................................... $784.45 ........................ $758.60 ................... $782.08 Hinesville-Fort Stewart MSA ................................................................... $535.09 ........................ $542.05 ................... $534.50 Macon MSA ............................................................................................ $811.83 ........................ $785.10 ................... $824.10 Rome MSA ............................................................................................. $659.59 ........................ $652.95 ................... $713.05 Savannah MSA ....................................................................................... $686.77 ........................ $669.62 ................... $668.34 Valdosta MSA ......................................................................................... $528.34 ........................ $542.43 ................... $555.04 Warner Robins MSA ............................................................................... $705.98 ........................ $674.11 ................... $715.92
Average Weekly Hours
Preliminary FEB 2010
Revised JAN 2010
Revised FEB 2009
Albany MSA .................................................................................................. 34.8 .............................. 35.8 ......................... 33.7 Athens-Clarke County MSA .......................................................................... 33.1 .............................. 33.2 ......................... 33.2 Atlanta MSA .................................................................................................. 33.7 .............................. 33.9 ......................... 34.8 Augusta-Richmond County MSA .................................................................. 37.9 .............................. 38.7 ......................... 37.2 Brunswick MSA ............................................................................................. 32.8 .............................. 32.1 ......................... 34.0 Columbus MSA ............................................................................................. 33.1 .............................. 32.8 ......................... 35.1 Dalton MSA .................................................................................................. 36.1 .............................. 36.3 ......................... 33.6 Gainesville MSA ........................................................................................... 36.1 .............................. 35.3 ......................... 37.6 Hinesville-Fort Stewart MSA ......................................................................... 36.7 .............................. 37.0 ......................... 39.1 Macon MSA .................................................................................................. 39.2 .............................. 40.7 ......................... 40.2 Rome MSA ................................................................................................... 35.5 .............................. 35.7 ......................... 34.8 Savannah MSA ............................................................................................. 34.1 .............................. 33.7 ......................... 34.9 Valdosta MSA ............................................................................................... 31.3 .............................. 31.5 ......................... 33.7 Warner Robins MSA ..................................................................................... 35.8 .............................. 35.8 ......................... 39.1
Average Hourly Earnings
Preliminary FEB 2010
Revised JAN 2010
Revised FEB 2009
Albany MSA .............................................................................................. $15.38 .......................... $15.58 ..................... $14.57 Athens-Clarke County MSA ...................................................................... $20.24 .......................... $20.37 ..................... $21.62 Atlanta MSA .............................................................................................. $24.15 .......................... $24.17 ..................... $25.00 Augusta-Richmond County MSA .............................................................. $20.50 .......................... $20.30 ..................... $19.14 Brunswick MSA ......................................................................................... $16.17 .......................... $16.08 ..................... $17.42 Columbus MSA ......................................................................................... $17.68 .......................... $18.01 ..................... $16.86 Dalton MSA .............................................................................................. $15.86 .......................... $16.13 ..................... $18.88 Gainesville MSA ....................................................................................... $21.73 .......................... $21.49 ..................... $20.80 Hinesville-Fort Stewart MSA ..................................................................... $14.58 .......................... $14.65 ..................... $13.67 Macon MSA .............................................................................................. $20.71 .......................... $19.29 ..................... $20.50 Rome MSA ............................................................................................... $18.58 .......................... $18.29 ..................... $20.49 Savannah MSA ......................................................................................... $20.14 .......................... $19.87 ..................... $19.15 Valdosta MSA ........................................................................................... $16.88 .......................... $17.22 ..................... $16.47 Warner Robins MSA ................................................................................. $19.72 .......................... $18.83 ..................... $18.31
Read more about the hours and earnings series at http://www.bls.gov/sae/saeaepp.htm
Source: Georgia Department of Labor, Workforce Information & Analysis
11
Dimensions - Measuring Georgia's Labor Force
11.0% 10.0%
Unemployment rates -- Georgia and U.S.
Ge orgia
U.S.
9.0%
8.0%
7.0%
6.0%
Feb Mar Apr May Jun Jul Aug Sep Oct Nov Dec Jan Feb
2009
2010
WA 9.5
OR
10.5
ID
9.5
NV
13.2
UT
CA
7.1
12.5
AZ 9.5
AK 8.5
State unemployment rates
February 2010
National Unemployment Rate: 9.7% Rates are seasonally adjusted
MT 6.9
WY 7.5
CO 7.7
NM 8.7
ND 4.1
SD 4.8
NE 4.8
KS 6.5
MN 7.3
WI 8.7
IA 6.7
IL 11.4
MO 9.4
OK 6.7
TX 8.2
AR 7.7
MS 11.4
LA 7.3
NH
7.1 ME
VT
8.3
6.6
MI 14.1
OH
IN
10.9
9.8
KY 10.9
TN 10.7
PA 8.9
WV
9.5
VA
7.2
NC 11.2
SC 12.5
AL
GA
11.1
10.5
FL 12.2
MA 9.5 NY 8.8
RI 12.7 CT NJ 9.1 9.8 DE 9.2 DC 11.9
MD 7.7
Unemployment rate 10.0% or greater 7.0% to 9.9% 6.0% to 6.9% 5.0% to 5.9% 4.0% to 4.9%
HI 6.9
12
Georgia Labor Force Estimates (not seasonally adjusted) Place of Residence - Persons 16 Years and Older
Georgia
(Seasonally adjusted)
Georgia
(Not Seasonally adjusted)
Albany MSA
Athens-Clarke County MSA
Atlanta MSA
Augusta-Richmond County MSA
Brunswick MSA
Columbus MSA
Dalton MSA
Gainesville MSA
Employment Status
Civilian labor force Employed Unemployed Rate
Civilian labor force Employed Unemployed Rate
Civilian labor force Employed Unemployed Rate
Civilian labor force Employed Unemployed Rate
Civilian labor force Employed Unemployed Rate
Civilian labor force Employed Unemployed Rate
Civilian labor force Employed Unemployed Rate
Civilian labor force Employed Unemployed Rate
Civilian labor force Employed Unemployed Rate
Civilian labor force Employed Unemployed Rate
FEB 2010
4,705,259 4,209,229
496,030 10.5
4,702,330 4,192,977
509,353 10.8
76,756 67,974
8,782 11.4
105,314 96,458 8,856 8.4
2,661,383 2,373,767
287,616 10.8
260,204 234,626
25,578 9.8
51,196 45,840
5,356 10.5
128,407 115,108 13,299
10.4
62,304 54,345
7,959 12.8
87,979 79,122
8,857 10.1
JAN 2010
4,700,613 4,212,450
488,163 10.4
4,708,592 4,200,606
507,986 10.8
76,622 67,755
8,867 11.6
105,227 96,530 8,697 8.3
2,664,311 2,376,996
287,315 10.8
260,666 234,788
25,878 9.9
51,961 46,618
5,343 10.3
129,011 115,717 13,294
10.3
62,435 54,323
8,112 13.0
88,101 79,365
8,736 9.9
FEB 2009
4,823,110 4,402,896
420,214 8.7
4,815,799 4,379,920
435,879 9.1
76,653 70,260
6,393 8.3
106,684 98,948 7,736 7.3
2,733,575 2,492,164
241,411 8.8
260,924 237,772
23,152 8.9
53,271 48,829
4,442 8.3
129,445 118,119 11,326
8.7
64,467 56,466
8,001 12.4
90,041 82,110
7,931 8.8
Change From
JAN 2010
FEB 2009
4,646 -3,221 7,867
-117,851 -193,667
75,816
-6,262 -7,629 1,367
-113,469 -186,943
73,474
134
103
219
-2,286
-85
2,389
87
-1,370
-72
-2,490
159
1,120
-2,928 -3,229
301
-72,192 -118,397
46,205
-462 -162 -300
-720 -3,146 2,426
-765 -778
13
-2,075 -2,989
914
-604 -609
5
-1,038 -3,011 1,973
-131 22
-153
-2,163 -2,121
-42
-122 -243 121
-2,062 -2,988
926
Note: MSA data are not seasonally adjusted. Employment includes nonagricultural wage and salary employment, self-employment, unpaid family and private
household workers and agricultural workers. Persons in labor disputes are counted as employed. The use of unrounded data does not imply that the numbers are exact. Georgia and Metropolitan Statistical Area data have not been seasonally adjusted.
Albany MSA: Baker, Dougherty, Lee, Terrell, and Worth counties. Athens - Clarke County MSA: Clarke, Madison, Oconee, and Oglethorpe counties. Atlanta MSA: Barrow, Bartow, Butts, Carroll, Cherokee, Clayton, Cobb, Coweta, Dawson, DeKalb, Douglas, Fayette, Forsyth, Fulton, Gwinnett, Haralson, Heard, Henry, Jasper, Lamar, Meriwether, Newton, Paulding, Pickens, Pike, Rockdale, Spalding, and Walton counties. Augusta - Richmond County MSA: Burke, Columbia, McDuffie, and Richmond counties in Georgia and Aiken and Edgefield counties in South Carolina. Brunswick MSA: Brantley, Glynn, and McIntosh counties. Columbus MSA: Chattahoochee, Harris, Marion, and Muscogee counties in Georgia and Russell County in Alabama. Dalton MSA: Murray and Whitfield counties. Gainesville MSA: Hall County. Hinesville - Fort Stewart MSA: Liberty and Long counties. Macon MSA: Bibb, Crawford, Jones, Monroe, and Twiggs counties. Rome MSA: Floyd County. Savannah MSA: Bryan, Chatham, and Effingham counties. Valdosta MSA: Brooks, Echols, Lanier, and Lowndes counties. Warner Robins MSA: Houston County.
Source: Georgia Department of Labor, Workforce Information & Analysis
13
Georgia Labor Force Estimates (not seasonally adjusted) Place of Residence - Persons 16 Years and Older
Hinesville-Ft. Stewart MSA Macon MSA
Rome MSA Savannah MSA
Valdosta MSA Warner Robins MSA
Employment Status
Civilian labor force Employed Unemployed Rate
Civilian labor force Employed Unemployed Rate
Civilian labor force Employed Unemployed Rate
Civilian labor force Employed Unemployed Rate
Civilian labor force Employed Unemployed Rate
Civilian labor force Employed Unemployed Rate
FEB 2010
32,722 29,832
2,890 8.8
112,185 99,896 12,289
11.0
49,320 43,964
5,356 10.9
174,516 158,354
16,162 9.3
66,634 60,458
6,176 9.3
70,276 64,585
5,691 8.1
JAN 2010
32,566 29,710
2,856 8.8
113,089 100,829
12,260 10.8
49,591 44,224
5,367 10.8
175,288 159,127
16,161 9.2
66,265 60,011 6,254
9.4
70,291 64,651
5,640 8.0
FEB 2009
32,812 30,306
2,506 7.6
113,441 103,512
9,929 8.8
50,114 45,444
4,670 9.3
177,369 163,544
13,825 7.8
69,009 63,355
5,654 8.2
70,135 65,230
4,905 7.0
Change From
JAN 2010
FEB 2009
156
-90
122
-474
34
384
-904 -933
29
-1,256 -3,616 2,360
-271 -260
-11
-794 -1,480
686
-772 -773
1
-2,853 -5,190 2,337
369
-2,375
447
-2,897
-78
522
-15
141
-66
-645
51
786
United States Labor Force Estimates Place of Residence - Persons 16 Years and Older
Area
United States
(Seasonally adjusted)
Employment Status
Civilian labor force Employed Unemployed Rate
FEB 2010
153,512,000 138,641,000
14,871,000 9.7
JAN 2010
153,170,000 138,333,000
14,837,000 9.7
FEB 2009
154,401,000 141,687,000
12,714,000 8.2
Change From
JAN 2010
FEB 2009
342,000 308,000
34,000
-889,000 -3,046,000 2,157,000
United States
(Not Seasonally adjusted)
Civilian labor force Employed Unemployed
Rate
153,194,000 137,203,000
15,991,000 10.4
152,957,000 136,809,000
16,147,000 10.6
153,804,000 140,105,000
13,699,000 8.9
237,000 394,000 -156,000
-610,000 -2,902,000 2,292,000
Note: Employment includes nonagricultural wage and salary employment, self-employment, unpaid family and private household workers and agricultural
workers. Persons in labor disputes are counted as employed. The use of unrounded data does not imply that the numbers are exact. Georgia and Metropolitan Statistical Area data have not been seasonally adjusted. Seasonally adjusted data for Georgia available upon request.
Albany MSA: Baker, Dougherty, Lee, Terrell, and Worth counties. Athens - Clarke County MSA: Clarke, Madison, Oconee, and Oglethorpe counties. Atlanta MSA: Barrow, Bartow, Butts, Carroll, Cherokee, Clayton, Cobb, Coweta, Dawson, DeKalb, Douglas, Fayette, Forsyth, Fulton, Gwinnett, Haralson, Heard, Henry, Jasper, Lamar, Meriwether, Newton, Paulding, Pickens, Pike, Rockdale, Spalding, and Walton counties. Augusta - Richmond County MSA: Burke, Columbia, McDuffie, and Richmond counties in Georgia and Aiken and Edgefield counties in South Carolina. Brunswick MSA: Brantley, Glynn, and McIntosh counties. Columbus MSA: Chattahoochee, Harris, Marion, and Muscogee counties in Georgia and Russell County in Alabama. Dalton MSA: Murray and Whitfield counties. Gainesville MSA: Hall County. Hinesville - Fort Stewart MSA: Liberty and Long counties. Macon MSA: Bibb, Crawford, Jones, Monroe, and Twiggs counties. Rome MSA: Floyd County. Savannah MSA: Bryan, Chatham, and Effingham counties. Valdosta MSA: Brooks, Echols, Lanier, and Lowndes counties. Warner Robins MSA: Houston County.
Source: Georgia Department of Labor, Workforce Information & Analysis
14
Georgia Labor Force Estimates by County (not seasonally adjusted)
Georgia
Place of Residence - Persons 16 Years and Older
February 2010
January 2010
Labor Force
Employment
Unemployment Number Rate
4,702,330 4,192,977 509,353 10.8
Labor Force
Employment
Unemployment Number Rate
4,708,592 4,200,606 507,986 10.8
Appling Atkinson Bacon Baker Baldwin
9,071 3,282 4,548 1,666 20,818
8,073 2,631 4,012 1,484 17,492
998 11.0 651 19.8 536 11.8 182 10.9 3,326 16.0
9,074 3,304 4,480 1,653 20,681
8,083 2,634 3,999 1,480 17,422
991 10.9 670 20.3 481 10.7 173 10.5 3,259 15.8
Banks Barrow Bartow Ben Hill Berrien
10,427 34,050 45,350
6,823 7,624
9,591 30,248 39,833
5,686 6,592
836 8.0 3,802 11.2 5,517 12.2 1,137 16.7 1,032 13.5
10,470 34,040 45,680
6,802 7,767
9,646 30,289 39,887
5,677 6,685
824 7.9 3,751 11.0 5,793 12.7 1,125 16.5 1,082 13.9
Bibb Bleckley Brantley Brooks Bryan
73,554 5,350 7,250 8,044
16,545
65,466 4,704 6,367 7,260
15,058
8,088 11.0 646 12.1 883 12.2 784 9.7
1,487 9.0
74,233 5,341 7,365 7,942
16,538
66,078 4,706 6,475 7,206
15,132
8,155 11.0 635 11.9 890 12.1 736 9.3
1,406 8.5
Bulloch Burke Butts Calhoun Camden
32,919 9,928
10,131 2,274
20,467
29,545 8,735 8,840 1,989
18,407
3,374 10.2 1,193 12.0 1,291 12.7
285 12.5 2,060 10.1
32,696 9,851
10,185 2,276
20,471
29,347 8,744 8,852 1,989
18,465
3,349 10.2 1,107 11.2 1,333 13.1
287 12.6 2,006 9.8
Candler Carroll Catoosa Charlton Chatham
4,171 3,735
436 10.5
52,162 45,975 6,187 11.9
33,655 30,651 3,004 8.9
4,401 3,900
501 11.4
129,721 117,652 12,069 9.3
4,148 3,727 421 10.1 52,085 46,038 6,047 11.6 33,768 30,742 3,026 9.0
4,390 3,895 495 11.3 130,394 118,226 12,168 9.3
Chattahoochee 2,593
Chattooga 10,463
Cherokee 107,833
Clarke
63,618
Clay
1,369
2,131
462 17.8
9,000 1,463 14.0
97,304 10,529 9.8
58,259 5,359 8.4
1,236
133 9.7
2,620 10,345 107,737 63,493
1,351
2,143 477 18.2 9,059 1,286 12.4 97,436 10,301 9.6 58,303 5,190 8.2 1,227 124 9.2
Clayton Clinch Cobb Coffee Colquitt
132,069 115,357 16,712 12.7 2,851 2,512 339 11.9
366,248 329,249 36,999 10.1 15,852 13,003 2,849 18.0 19,680 17,570 2,110 10.7
132,531 115,514 17,017 12.8 2,856 2,510 346 12.1
366,546 329,697 36,849 10.1 15,828 13,016 2,812 17.8 19,800 17,661 2,139 10.8
Columbia Cook Coweta Crawford Crisp
60,024 6,736
59,656 6,169 9,605
55,511 5,750 52,910 5,456 8,309
4,513 7.5 986 14.6
6,746 11.3 713 11.6
1,296 13.5
59,949 6,743
59,439 6,224 9,671
55,570 5,769
52,982 5,507 8,326
4,379 7.3 974 14.4
6,457 10.9 717 11.5
1,345 13.9
February 2009
Labor Force
Employment
Unemployment Number Rate
4,815,799 4,379,920 435,879 9.1
9,378 3,377 4,746 1,672 21,049
8,509 2,919 4,263 1,534 18,313
869 9.3 458 13.6 483 10.2 138 8.3 2,736 13.0
10,628 35,364 46,835
7,243 8,277
9,820 31,757 41,820
6,119 7,132
808 7.6 3,607 10.2 5,015 10.7 1,124 15.5 1,145 13.8
74,493 5,497 7,524 8,284
16,756
67,836 4,997 6,782 7,608
15,552
6,657 8.9 500 9.1 742 9.9 676 8.2
1,204 7.2
33,321 9,985
10,333 2,348
21,359
30,388 8,872 9,280 2,090
19,558
2,933 8.8 1,113 11.1 1,053 10.2
258 11.0 1,801 8.4
4,362 53,657 34,783
4,608 132,041
3,977 48,268 31,940
4,095 121,508
385 8.8 5,389 10.0 2,843 8.2
513 11.1 10,533 8.0
2,566 11,037 111,075 64,451 1,398
2,180 9,528 102,157 59,763 1,272
386 15.0 1,509 13.7 8,918 8.0 4,688 7.3
126 9.0
135,102 2,790
376,156 16,381 20,305
121,111 2,507
345,671 14,424 18,469
13,991 10.4 283 10.1
30,485 8.1 1,957 11.9 1,836 9.0
60,378 7,110
60,776 6,249 9,934
56,382 6,141
55,549 5,653 8,807
3,996 6.6 969 13.6
5,227 8.6 596 9.5
1,127 11.3
15
Georgia Labor Force Estimates by County (not seasonally adjusted)
Dade Dawson Decatur DeKalb Dodge
Place of Residence - Persons 16 Years and Older
February 2010
Labor Force
Employment
Unemployment Number Rate
7,941 7,198 743 9.4 11,000 9,784 1,216 11.1 11,657 10,057 1,600 13.7 376,544 336,188 40,356 10.7 8,943 7,870 1,073 12.0
January 2010
Labor Force
Employment
Unemployment Number Rate
8,002 7,220
782 9.8
10,981 9,797 1,184 10.8
11,723 10,101 1,622 13.8
377,286 336,646 40,640 10.8
8,954 7,892 1,062 11.9
Dooly Dougherty Douglas Early Echols
4,666 42,499 64,219
5,344 2,135
4,149 37,205 56,737
4,767 1,944
517 11.1 5,294 12.5 7,482 11.7
577 10.8 191 8.9
4,703 42,326 64,259
5,347 2,115
4,174 37,085 56,814
4,784 1,929
529 11.2 5,241 12.4 7,445 11.6
563 10.5 186 8.8
Effingham Elbert Emanuel Evans Fannin
28,250 10,166 10,428
4,837 10,587
25,644 8,806 9,195 4,348 9,387
2,606 9.2 1,360 13.4 1,233 11.8
489 10.1 1,200 11.3
28,356 10,102 10,302
4,830 10,707
25,769 8,787 9,186 4,349 9,451
2,587 9.1 1,315 13.0 1,116 10.8
481 10.0 1,256 11.7
Fayette Floyd Forsyth Franklin Fulton
50,913 46,143 4,770 9.4 49,320 43,964 5,356 10.9 84,624 77,004 7,620 9.0
9,832 8,540 1,292 13.1 477,928 425,251 52,677 11.0
50,914 46,206 4,708 9.2 49,591 44,224 5,367 10.8 84,596 77,108 7,488 8.9
9,828 8,542 1,286 13.1 478,643 425,829 52,814 11.0
Gilmer Glascock Glynn Gordon Grady
13,259 1,121
38,801 24,330 11,194
11,749 973
34,914 20,971 10,019
1,510 11.4 148 13.2
3,887 10.0 3,359 13.8 1,175 10.5
13,291 1,122
39,394 24,511 11,124
11,773 976
35,506 21,057
9,950
1,518 11.4 146 13.0
3,888 9.9 3,454 14.1 1,174 10.6
Greene Gwinnett Habersham Hall Hancock
7,412 6,478 934 12.6 407,608 367,405 40,203 9.9
19,750 17,558 2,192 11.1 87,979 79,122 8,857 10.1
3,371 2,630 741 22.0
7,375 6,481
894 12.1
407,523 367,905 39,618 9.7
19,757 17,647 2,110 10.7
88,101 79,365 8,736 9.9
3,415 2,619
796 23.3
Haralson Harris Hart Heard Henry
12,595 16,175 10,131
4,848 95,619
11,058 1,537 12.2 14,857 1,318 8.1
8,717 1,414 14.0 4,192 656 13.5 85,237 10,382 10.9
12,585 16,270 10,122
4,866 95,698
11,073 1,512 12.0
14,938 1,332 8.2
8,741 1,381 13.6
4,198
668 13.7
85,353 10,345 10.8
Houston Irwin Jackson Jasper Jeff Davis
70,276 3,856
26,400 6,428 5,189
64,585 3,228
23,305 5,547 4,384
5,691 8.1 628 16.3
3,095 11.7 881 13.7 805 15.5
70,291 3,865
26,460 6,430 5,148
64,651 3,224
23,351 5,555 4,386
5,640 8.0 641 16.6
3,109 11.7 875 13.6 762 14.8
February 2009
Labor Force
Employment
Unemployment Number Rate
8,356 11,328 12,001 386,558 8,998
7,501 10,271 10,516 352,956
8,185
855 10.2 1,057 9.3 1,485 12.4 33,602 8.7
813 9.0
4,819 42,239 65,967
5,515 2,194
4,361 38,457 59,567
4,933 2,037
458 9.5 3,782 9.0 6,400 9.7
582 10.6 157 7.2
28,573 10,259 10,581
4,936 10,787
26,485 9,019 9,434 4,504 9,673
2,088 7.3 1,240 12.1 1,147 10.8
432 8.8 1,114 10.3
52,488 48,445 4,043 7.7 50,114 45,444 4,670 9.3 87,396 80,844 6,552 7.5 10,325 9,185 1,140 11.0 490,170 446,461 43,709 8.9
13,551 1,134
40,401 25,745 11,786
12,236 1,019
37,190 22,694 10,686
1,315 9.7 115 10.1
3,211 7.9 3,051 11.9 1,100 9.3
7,518 419,735
20,363 90,041
3,395
6,779 385,730
18,478 82,110 2,753
739 9.8 34,005 8.1
1,885 9.3 7,931 8.8
642 18.9
13,053 16,306 10,480
5,051 97,903
11,610 15,197
9,062 4,401 89,488
1,443 11.1 1,109 6.8 1,418 13.5
650 12.9 8,415 8.6
70,135 4,086
27,147 6,591 5,295
65,230 3,474
24,335 5,824 4,615
4,905 7.0 612 15.0
2,812 10.4 767 11.6 680 12.8
16
Georgia Labor Force Estimates by County (not seasonally adjusted)
Jefferson Jenkins Johnson Jones Lamar
Place of Residence - Persons 16 Years and Older
February 2010
January 2010
Labor Force
Employment
Unemployment Number Rate
6,962 2,556 3,659 14,292 7,769
5,874 2,003 3,144 12,700 6,738
1,088 15.6 553 21.6 515 14.1
1,592 11.1 1,031 13.3
Labor Force
6,950 2,565 3,600 14,338 7,790
Employment
5,895 2,011 3,154 12,818 6,747
Unemployment Number Rate
1,055 15.2 554 21.6 446 12.4
1,520 10.6 1,043 13.4
Lanier Laurens Lee Liberty Lincoln
4,019 21,803 17,898 26,087
3,857
3,646 19,173 16,320 23,674
3,406
373 9.3 2,630 12.1 1,578 8.8 2,413 9.2
451 11.7
3,981 21,865 17,877 25,974
3,841
3,620 19,231 16,268 23,577
3,416
361 9.1 2,634 12.0 1,609 9.0 2,397 9.2
425 11.1
Long Lowndes Lumpkin McDuffie McIntosh
6,635 52,436 13,166 10,735
5,145
6,158 47,608 11,619
9,516 4,559
477 7.2 4,828 9.2 1,547 11.7 1,219 11.4
586 11.4
6,592 52,227 13,127 10,828
5,201
6,133 47,256 11,572
9,526 4,636
459 7.0 4,971 9.5 1,555 11.8 1,302 12.0
565 10.9
Macon Madison Marion Meriwether Miller
5,036 15,828
3,327 9,546 3,575
4,321 14,359
2,972 8,082 3,240
715 14.2 1,469 9.3
355 10.7 1,464 15.3
335 9.4
5,070 15,836
3,366 9,449 3,606
4,371 14,370
2,989 8,093 3,269
699 13.8 1,466 9.3
377 11.2 1,356 14.4
337 9.3
Mitchell Monroe Montgomery Morgan Murray
10,073 13,489
4,484 9,028 19,142
8,948 12,173
3,960 8,069 16,654
1,125 11.2 1,316 9.8
524 11.7 959 10.6 2,488 13.0
10,098 13,620
4,434 9,075 19,107
8,968 12,287
3,965 8,097 16,647
1,130 11.2 1,333 9.8
469 10.6 978 10.8 2,460 12.9
Muscogee Newton Oconee Oglethorpe Paulding
85,342 46,381 18,091
7,776 66,158
76,819 40,325 16,813
7,026 58,866
8,523 10.0 6,056 13.1 1,278 7.1
750 9.6 7,292 11.0
85,718 46,600 18,102
7,795 66,355
77,239 40,380 16,826
7,031 58,946
8,479 9.9 6,220 13.3 1,276 7.0
764 9.8 7,409 11.2
Peach Pickens Pierce Pike Polk
12,135 14,934
8,228 8,065 20,996
10,721 13,318
7,366 7,055 18,623
1,414 11.7 1,616 10.8
862 10.5 1,010 12.5 2,373 11.3
12,167 14,990
8,241 8,038 21,039
10,750 13,336
7,405 7,065 18,679
1,417 11.6 1,654 11.0
836 10.1 973 12.1 2,360 11.2
Pulaski Putnam Quitman Rabun Randolph
4,234 10,167
971 6,944 2,683
3,861 8,922
837 6,021 2,312
373 8.8 1,245 12.2
134 13.8 923 13.3 371 13.8
4,235 10,171
990 6,933 2,689
3,865 8,941
838 6,028 2,315
370 8.7 1,230 12.1
152 15.4 905 13.1 374 13.9
February 2009
Labor Force
Employment
Unemployment Number Rate
7,176 2,735 3,678 14,308 7,919
6,204 2,184 3,241 13,159 7,074
972 13.5 551 20.1 437 11.9 1,149 8.0 845 10.7
4,234 21,908 18,036 26,146
3,980
3,821 19,761 16,869 24,050
3,508
413 9.8 2,147 9.8 1,167 6.5 2,096 8.0
472 11.9
6,666 54,297 13,464 10,721
5,345
6,256 49,889 11,893
9,665 4,856
410 6.2 4,408 8.1 1,571 11.7 1,056 9.8
489 9.1
5,150 16,049
3,337 9,722 3,575
4,540 14,730
3,040 8,485 3,268
610 11.8 1,319 8.2
297 8.9 1,237 12.7
307 8.6
10,386 13,703
4,487 9,453 19,765
9,450 12,613
4,059 8,567 17,304
936 9.0 1,090 8.0
428 9.5 886 9.4 2,461 12.5
85,800 47,650 18,342
7,842 68,003
78,578 42,337 17,248
7,207 61,802
7,222 8.4 5,313 11.2 1,094 6.0
635 8.1 6,201 9.1
12,342 15,500
8,604 8,134 21,468
11,198 13,982
7,875 7,407 19,347
1,144 9.3 1,518 9.8
729 8.5 727 8.9 2,121 9.9
4,337 10,293
986 6,800 2,738
4,009 9,239
892 6,065 2,419
328 7.6 1,054 10.2
94 9.5 735 10.8 319 11.7
17
Georgia Labor Force Estimates by County (not seasonally adjusted)
Richmond Rockdale Schley Screven Seminole
Place of Residence - Persons 16 Years and Older
February 2010
January 2010
Labor Force
Employment
Unemployment Number Rate
Labor Force
Employment
Unemployment Number Rate
91,602 39,556
1,816 7,106 3,976
81,926 34,742
1,560 6,055 3,525
9,676 10.6 4,814 12.2
256 14.1 1,051 14.8
451 11.3
91,436 39,838
1,818 7,151 3,972
82,013 34,789
1,561 6,066 3,528
9,423 10.3 5,049 12.7
257 14.1 1,085 15.2
444 11.2
Spalding Stephens Stewart Sumter Talbot
28,528 13,140
2,289 14,133
3,059
24,235 11,597 2,052 12,094 2,768
4,293 15.0 1,543 11.7
237 10.4 2,039 14.4
291 9.5
28,521 13,141
2,319 14,156
3,057
24,268 11,593 2,063 12,104 2,769
4,253 14.9 1,548 11.8
256 11.0 2,052 14.5
288 9.4
Taliaferro Tattnall Taylor Telfair Terrell
822 9,073 3,562 4,674 4,398
710 8,061 3,097 3,992 3,918
112 13.6 1,012 11.2
465 13.1 682 14.6 480 10.9
843 9,066 3,587 4,561 4,436
710 8,074 3,093 3,884 3,905
133 15.8 992 10.9 494 13.8 677 14.8 531 12.0
Thomas Tift Toombs Towns Treutlen
21,094 17,989 13,888
5,725 2,977
18,909 15,729 12,223
5,131 2,590
2,185 10.4 2,260 12.6 1,665 12.0
594 10.4 387 13.0
21,023 18,064 13,675
5,738 3,003
18,899 15,741 12,238
5,134 2,611
2,124 10.1 2,323 12.9 1,437 10.5
604 10.5 392 13.1
Troup Turner Twiggs Union Upson
29,219 4,272 4,681
10,975 12,328
25,403 3,660 4,102 9,777
10,754
3,816 13.1 612 14.3 579 12.4
1,198 10.9 1,574 12.8
29,474 4,456 4,675
10,931 12,325
25,570 3,819 4,140 9,757
10,768
3,904 13.2 637 14.3 535 11.4
1,174 10.7 1,557 12.6
Walker Walton Ware Warren Washington
31,283 40,621 14,434
2,599 7,956
28,199 36,144 12,734
2,092 6,642
3,084 9.9 4,477 11.0 1,700 11.8
507 19.5 1,314 16.5
31,373 40,706 14,563
2,613 7,987
28,283 36,193 12,802
2,092 6,670
3,090 9.8 4,513 11.1 1,761 12.1
521 19.9 1,317 16.5
Wayne Webster Wheeler White Whitfield
12,010 1,143 2,926 11,902
43,162
10,499 1,021 2,586
10,539 37,691
1,511 12.6 122 10.7 340 11.6
1,363 11.5 5,471 12.7
12,053 1,180 2,857 11,886
43,328
10,487 1,051 2,574
10,538 37,676
1,566 13.0 129 10.9 283 9.9
1,348 11.3 5,652 13.0
Wilcox Wilkes Wilkinson Worth
3,153 4,445 4,692 10,295
2,772 3,891 4,116 9,046
381 12.1 554 12.5 576 12.3 1,249 12.1
3,159 4,437 4,694 10,331
2,770 3,898 4,114 9,017
389 12.3 539 12.1 580 12.4 1,314 12.7
February 2009
Labor Force
Employment
Unemployment Number Rate
91,751 40,430
1,868 7,472 4,121
83,210 36,474
1,647 6,442 3,657
8,541 9.3 3,956 9.8
221 11.8 1,030 13.8
464 11.3
28,748 14,095
2,321 14,490
3,133
25,444 12,725
2,060 12,772
2,853
3,304 11.5 1,370 9.7
261 11.2 1,718 11.9
280 8.9
837 9,187 3,512 4,906 4,434
743 8,356 3,131 4,381 4,050
94 11.2 831 9.0 381 10.8 525 10.7 384 8.7
21,749 18,722 13,881
5,738 2,869
19,900 16,803 12,526
5,235 2,560
1,849 8.5 1,919 10.2 1,355 9.8
503 8.8 309 10.8
30,647 4,599 4,688
10,920 11,904
26,939 3,943 4,250 9,899
10,586
3,708 12.1 656 14.3 438 9.3
1,021 9.3 1,318 11.1
32,957 41,929 15,088
2,549 8,104
29,386 37,946 13,614
2,143 7,128
3,571 10.8 3,983 9.5 1,474 9.8
406 15.9 976 12.0
12,083 1,203 2,998
12,270 44,702
10,747 1,095 2,719 11,073
39,162
1,336 11.1 108 9.0 279 9.3
1,197 9.8 5,540 12.4
3,200 4,527 4,872 10,271
2,823 3,968 4,348 9,350
377 11.8 559 12.3 524 10.8 921 9.0
18
New Developments
Bombardier Aerospace has opened a third aircraft service
center in Bibb County. The new Macon facility will perform heavy maintenance mostly for Atlantic Southeast Airlines. The company signed an exclusive contract with the airline to provide services necessary for their fleet of 150 aircraft. The new operation is expected to create 180 additional jobs within the next year.
In Catoosa County a new business has announced it will be
opening in Fort Oglethorpe. Costco Wholesale will be located on Scruggs Road and is projecting an August opening for this year. The company expects to hire between 125 and 150 people and the pay will be between $11 and $21 an hour with benefits available.
In DeKalb County, a joint venture between a pediatric hos-
pital and a local institution of higher learning will result in a new $90 million research center. Children's Healthcare of Atlanta and Emory University will build a 200,000 square foot building at Emory's Clifton Road campus that will focus on pediatric research. The focus at the facility will be on cancer and blood disorder treatment with an additional seven new areas of concentration: immunology and vaccines, transplant immunology and immune therapeutics, pediatric healthcare technology innovation, cystic fibrosis, developmental lung biology, endothelial cell biology and cardiovascular biology. The new center will create some 250 new jobs.
In Fulton County, Enfinity Corporation is relocating its
American headquarters from Sacramento to Atlanta. Initially the company will employ about 30 people but may expand quickly. The company was founded in 2005 but has grown to one of the 10-largest photovoltaic development concerns. Photovoltaic, or PV, converts solar radiation into direct-current electricity.
Novelis, Inc., a global leader in aluminum can recycling, is
relocating its North American headquarters from Cleveland to Atlanta. The transfer will bring 80 new jobs to Fulton County for the company that is a major supplier of flat-rolled aluminum for Coca-Cola, Anheuser-Busch, and Ford.
Also, in Fulton County, a cell phone manufacturer is moving
their American headquarters to Atlanta. Sony Ericsson will be moving as many as 175 jobs from Research Triangle Park, NC in an effort to consolidate operations from other sites in Seattle, Miami, San Diego, Sweden and India.
QualTex Laboratories is investing $12 million and hiring
125 scientists, technicians, and support staff within the next three years for their new blood testing center in Gwinnett County. The new Norcross center will conduct infectious disease testing for blood banks and plasma centers across the U.S.
Utah-based Simon Transport, LLC is coming to Henry
County and will create some 70 jobs over the next two years. The new McDonough office will help expand operations for the firm that is a logistics management services company that provides brokerage, long-haul and semi-tractor services to customers in the contiguous 48 states.
In Richmond County, South Georgia Tissue is coming to
the area mainly due to the availability of skilled labor in the
Augusta area. The company produces bulk rolls of recycled paper and sells it to other companies that convert it into tissue paper. When the plant is fully operational they expect to hire 200 people.
The Baxley Group has received a new government con-
tract that will create 25 to 30 new jobs in Appling County. The Baxley firm's contract is with The Department of Justice and is to produce sweatshirts that go to federal prisons to be screen printed for the U. S. Army.
Kroger is opening a new store in Baldwin County that is
rumored to be one of the largest in the state. This new location on Log Cabin Road in Milledgeville will not only give the company more retail floor space but will add hot food, gas pumps and other amenities along with 55 new jobs.
In northern Clarke County, an industrial contractor has
begun a major expansion that will create about 30 new jobs. Reinicke Athens, Inc. has broken ground on an $8 million steel manufacturing facility. The 14 year old Athens firm does industrial construction work for Fortune 500 companies like Noramco, Lockheed, Caterpillar, and General Mills. They handle all aspects of industrial construction, including the installation of electrical and mechanical systems, relocation of industrial manufacturing equipment, general construction and erecting steel beam structures. The new plant will enable the company to produce the steel they need at a faster rate.
A countertop manufacturer located in southern Gordon
County is expanding their operation with an investment of $50 million. LG Hausys America, Inc. will manufacture engineered stone countertops in their expanded plant. The new 95,000 square foot facility will be able to accommodate 80 new jobs
Spectral Response LLC is located in Gwinnett County
and manufactures electronic components used in printed circuit boards. They serve the military, satellite, medical and video production markets. The growing demand for their output has resulted in an expansion to a 72,000 square foot facility in Lawrenceville. This increased demand will create some 150 jobs over the next several years.
In Gwinnett County Web Industries, Inc. is increasing
their production capacity to be able to process carbon fiber panels that will be used in the production of Boeing's 787 "Dreamliner." The plant in Suwanee will use a proprietary technology developed in Atlanta for cutting carbon fiber sheets into strips that help form the skin of the fuselage of the revolutionary new airliner. The company will hire 250 new people to be able to provide their product for Boeing's final assembly plant in South Carolina.
A Thomas County industry broke ground on a multi-
million dollar expansion that will add as many as 50 jobs to the local economy. Cleaver-Brooks manufactures boiler room products and systems. The company is positioning itself for the economic recovery by giving itself 200,000 square feet in their Thomasville plant.
19
Georgia Unemployment Rates by County
February 2010
Dade
Catoosa
Murray
Fannin
Towns
Union
Rabun
Whitfield Walker
Gilmer
White Habersham
Chattooga
Gordon
Pickens
Lumpkin
Stephens
Floyd
Dawson
Banks Franklin Hart
Bartow Cherokee Forsyth Hall
14.0% or greater 12.0% to 13.9% 10.8% to 11.9%
Jackson Madison Elbert
Polk Haralson
Paulding Cobb
Barrow Gwinnett
DeKalb
Walton
Douglas Fulton
Rockdale
Clarke Oconee
Oglethorpe Wilkes
Lincoln
Carroll
Clayton
Newton Morgan Greene Taliaferro
Columbia
Heard
Fayette
Henry
Coweta
Spalding Butts
Jasper
Putnam
McDuffie Warren
Hancock Glascock
Richmond
Less than 10.8%
Troup
Meriwether Pike Lamar Monroe
Jones Baldwin
Jefferson Washington
Burke
Upson
Harris
Talbot
Muscogee
Bibb Crawford
Taylor
Peach
Wilkinson Twiggs
Johnson
Jenkins
Emanuel
Screven
Marion Chattahoochee
Macon
Schley
Stewart Webster Sumter
Houston Bleckley
Laurens Treutlen
Candler Bulloch
Effingham
Dooly Crisp
Pulaski Wilcox
Dodge
Montgomery
Wheeler
Toombs
Evans
Telfair
Tattnall
Bryan
Chatham
Quitman
Terrell Lee
Randolph
Turner
Ben Hill
Jeff Davis Appling
Liberty Long
Clay Calhoun Dougherty
Early
Baker
Miller
Mitchell
Worth
Irwin Tift
Coffee
Colquitt
Berrien Atkinson Cook
Seminole Decatur
Grady
Thomas
Brooks
Lanier
Clinch
Lowndes Echols
Bacon
Wayne
Pierce
Ware
Brantley
McIntosh Glynn
Charlton
Camden
Georgia's Unemployment Rate: 10.8%
(Not Seasonally Adjusted)
20
Georgia Unemployment Insurance Claims by County
County
February Average Average Initial Weekly Duration
Claims Benefit Weeks
County
February Average Average Initial Weekly Duration
Claims Benefit Weeks
Georgia
66,069 ....... $269 ...... 16.0
Appling
173 ....... $216 ...... 15.2
Atkinson
112 ....... $215 ...... 13.5
Bacon
169 ....... $216 ...... 14.0
Baker
16 ....... $221 ...... 16.6
Baldwin
301 ....... $240 ...... 17.6
Banks
117 ....... $249 ...... 15.5
Barrow
494 ....... $244 ...... 18.5
Bartow
790 ....... $245 ...... 16.5
Ben Hill
269 ....... $196 ...... 14.6
Berrien
159 ....... $215 ...... 16.1
Bibb
879 ....... $202 ...... 17.1
Bleckley
118 ....... $238 ...... 13.6
Brantley
109 ....... $221 ...... 16.8
Brooks
114 ....... $179 ...... 15.5
Bryan
184 ....... $243 ...... 14.2
Bulloch
342 ....... $216 ...... 13.0
Burke
179 ....... $202 ...... 13.7
Butts
156 ....... $220 ...... 17.2
Calhoun
54 ....... $213 ...... 16.9
Camden
190 ....... $234 ...... 16.8
Candler
80 ....... $225 ...... 12.6
Carroll
943 ....... $236 ...... 15.2
Catoosa
280 ....... $234 ...... 14.6
Charlton
56 ....... $211 ...... 23.4
Chatham
1,389 ....... $214 ...... 15.9
Chattahoochee 11 ....... $219 ...... 18.0
Chattooga
115 ....... $237 ...... 18.9
Cherokee
1,235 ....... $264 ...... 18.4
Clarke
515 ....... $205 ...... 16.4
Clay
29 ....... $189 ...... 12.6
Clayton
2,032 ....... $235 ...... 18.3
Clinch
37 ....... $181 ........ 9.0
Cobb
3,979 ....... $258 ...... 18.8
Coffee
501 ....... $213 ...... 15.0
Colquitt
366 ....... $218 ...... 16.0
Columbia
404 ....... $241 ...... 14.3
Cook
229 ....... $208 ...... 15.2
Coweta
882 ....... $253 ...... 17.1
Crawford
64 ....... $237 ...... 16.5
Crisp
193 ....... $198 ...... 16.5
Dade
40 ....... $232 ...... 15.0
Dawson
172 ....... $254 ...... 19.1
Decatur
238 ....... $200 ...... 16.7
DeKalb
4,268 ....... $241 ...... 18.2
Dodge
120 ....... $220 ...... 16.0
Dooly
73 ....... $202 ...... 15.1
Dougherty
520 ....... $206 ...... 17.7
Douglas
979 ....... $250 ...... 18.7
Early
69 ....... $192 ...... 21.1
Echols
16 ....... $224 ...... 16.8
Effingham
297 ....... $245 ...... 13.3
Elbert Emanuel Evans Fannin Fayette Floyd Forsyth Franklin Fulton Gilmer Glascock Glynn Gordon Grady Greene Gwinnett Habersham Hall Hancock Haralson Harris Hart Heard Henry Houston Irwin Jackson Jasper Jeff Davis Jefferson Jenkins Johnson Jones Lamar Lanier Laurens Lee Liberty Lincoln Long Lowndes Lumpkin Macon Madison Marion McDuffie McIntosh Meriwether Miller Mitchell Monroe Montgomery Morgan Murray
362 ....... $223 ...... 12.4 332 ....... $187 ...... 13.2
61 ....... $208 ...... 13.6 215 ....... $205 ...... 16.0 354 ....... $261 ...... 18.7 1,000 ....... $230 ...... 16.0 698 ....... $274 ...... 19.1 313 ....... $228 ...... 14.8 5,238 ....... $236 ...... 18.5 306 ....... $232 ...... 15.6
30 ....... $227 ...... 13.2 486 ....... $214 ...... 16.2 652 ....... $242 ...... 14.3 174 ....... $197 ...... 16.2 188 ....... $196 ...... 16.4 4,385 ....... $262 ...... 18.5 388 ....... $226 ...... 15.2 1,152 ....... $245 ...... 16.6 106 ....... $238 ...... 18.1 263 ....... $245 ...... 16.5 210 ....... $223 ...... 14.0 338 ....... $214 ...... 15.3
78 ....... $242 ...... 15.6 1,151 ....... $253 ...... 18.1
548 ....... $226 ...... 16.3 98 ....... $204 ...... 16.9
426 ....... $249 ...... 17.7 141 ....... $241 ...... 16.9 189 ....... $223 ...... 13.6 186 ....... $199 ...... 16.4
75 ....... $186 ...... 15.8 110 ....... $211 ...... 15.0 139 ....... $240 ...... 16.5 116 ....... $229 ...... 18.4 62 ....... $217 ...... 15.1 558 ....... $203 ...... 13.6 165 ....... $252 ...... 14.6 291 ....... $202 ...... 15.9 72 ....... $230 ...... 14.3 58 ....... $207 ...... 15.5 670 ....... $197 ...... 15.5 131 ....... $243 ...... 19.7 152 ....... $194 ...... 12.9 250 ....... $233 ...... 14.8 45 ....... $219 ...... 14.8 212 ....... $193 ...... 14.8 85 ....... $219 ...... 15.9 242 ....... $219 ...... 15.1 45 ....... $201 ...... 17.4 130 ....... $210 ...... 16.4 152 ....... $243 ...... 16.9 120 ....... $206 ...... 12.4 138 ....... $218 ...... 17.0 646 ....... $239 ...... 11.6
Initial claims include intrastate initial and additional claims, as well as agent state initial and additional claims for regular UI only. Average duration of benefits is represented in weeks.
County
February Average Average Initial Weekly Duration
Claims Benefit Weeks
Muscogee Newton Oconee Oglethorpe Paulding Peach Pickens Pierce Pike Polk Pulaski Putnam Quitman Rabun Randolph Richmond Rockdale Schley Screven Seminole Spalding Stephens Stewart Sumter Talbot Taliaferro Tattnall Taylor Telfair Terrell Thomas Tift Toombs Towns Treutlen Troup Turner Twiggs Union Upson Walker Walton Ware Warren Washington Wayne Webster Wheeler White Whitfield Wilcox Wilkes Wilkinson Worth
926 ....... $207 ...... 14.1 710 ....... $241 ...... 18.0 137 ....... $238 ...... 17.2
88 ....... $249 ...... 16.8 867 ....... $262 ...... 18.5 154 ....... $227 ...... 13.8 290 ....... $242 ...... 18.0 215 ....... $209 ...... 15.0 144 ....... $241 ...... 15.5 740 ....... $248 ...... 15.8
48 ....... $226 ...... 13.5 329 ....... $208 ...... 15.6
1 ....... $270 ...... 17.2 124 ....... $222 ...... 15.2
53 ....... $197 ...... 10.7 1,168 ....... $202 ...... 15.2
539 ....... $248 ...... 17.9 41 ....... $184 ...... 16.5 113 ....... $225 ...... 16.5 45 ....... $192 ...... 17.2
487 ....... $223 ...... 17.5 320 ....... $221 ...... 15.7
33 ....... $197 ...... 19.0 238 ....... $192 ...... 18.1
59 ....... $179 ...... 13.9 14 ....... $183 ...... 16.6 98 ....... $202 ...... 15.0 64 ....... $226 ...... 14.5 66 ....... $223 ...... 11.1 57 ....... $217 ...... 17.1 334 ....... $215 ...... 15.4 235 ....... $216 ...... 15.5 454 ....... $210 ...... 13.5 107 ....... $189 ...... 15.7 67 ....... $216 ...... 13.6 485 ....... $226 ...... 16.4 122 ....... $197 ...... 18.5 87 ....... $208 ...... 15.5 276 ....... $190 ...... 17.0 240 ....... $227 ...... 16.0 404 ....... $221 ...... 13.2 507 ....... $242 ...... 18.1 396 ....... $193 ...... 14.9 125 ....... $195 ...... 15.5 116 ....... $211 ...... 17.8 175 ....... $214 ...... 16.2 14 ....... $229 ...... 20.5 73 ....... $243 ...... 12.1 206 ....... $218 ...... 16.4 1,591 ....... $238 ...... 11.1 34 ....... $224 ...... 15.1 142 ....... $195 ...... 13.9 87 ....... $225 ...... 18.0 127 ....... $242 ...... 15.7
21
Georgia Department of Labor Workforce Information & Analysis 148 Andrew Young International Boulevard, N.E. Atlanta, Georgia 30303-1751
Return Service Requested