- Collection:
- Georgia Government Publications
- Title:
- Dimensions: measuring Georgia's workforce, Vol. 36, no. 11 (Nov. 2010)
- Creator:
- Georgia. Department of Labor
- Contributor to Resource:
- Georgia. Workforce Information and Analysis
- Publisher:
- Atlanta, Ga. : Georgia Dept. of Labor, 2010-11
- Date of Original:
- 2010-11
- Subject:
- Labor market--Georgia--Statistics
Wages--Georgia--Statistics
Hours of labor--Georgia--Statistics - Location:
- United States, Georgia, 32.75042, -83.50018
- Medium:
- state government records
- Type:
- Text
- Format:
- application/pdf
- External Identifiers:
- Call Number GA L200.E46 P1 T7 36/11
- Metadata URL:
- https://dlg.galileo.usg.edu/id:dlg_ggpd_i-ga-bl200-pe46-bp1-bt7-b36-s11-belec-p-btext
- Digital Object URL:
- https://dlg.galileo.usg.edu/do:dlg_ggpd_i-ga-bl200-pe46-bp1-bt7-b36-s11-belec-p-btext
- Language:
- eng
- Holding Institution:
- University of Georgia. Map and Government Information Library
- Rights:
-

November 2010 Data
November 2010 Employment Situation
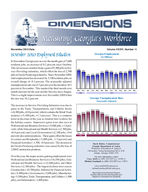
In November, Georgia saw an over the month gain of 7,000 nonfarm jobs, an increase of 0.2 percent since October. This net increase resulted from a gain of 9,500 jobs in Service-Providing industries, which offset the loss of 2,500 jobs in Goods Producing industries. Since November 2009, total employment has decreased by 5,100 nonfarm jobs, an overall change of -0.1 percent. The seasonally adjusted unemployment rate rose 0.3 percent over the month to 10.1 percent in November. This marked the third month over month increase for the year and the first rise since August. This is a slight improvement over November 2009 when the rate was 10.2 percent.
The increase in Service-Providing Industries was due to gains in the Trade, Transportation, and Utilities Sector (+6,300 jobs, +0.8 percent), which contains the Retail Trade industry (+5,500 jobs, +1.3 percent). This is a common trend at this time of the year as retailers hire workers for the holiday season. Impressive gains were also seen in Professional and Business Services (+5,000 jobs, +1.0 percent), while Educational and Health Services (+2,700 jobs, +0.6 percent) and Local Government (+2,300 jobs, +0.6 percent) also added positions. These gains offset the losses in Leisure and Hospitality (-5,600 jobs, -1.5 percent) and Financial Activities (-1,700, -0.9 percent). The decrease in the Goods Producing industries was caused by the loss of 2,500 Construction positions.
Over the year, the major sectors gaining employment were Professional and Business Services (+16,100 jobs), Educational and Health Services (+12,000 jobs), and Other Services (+2,100 jobs). The largest declines were seen in Construction (-10,700 jobs), followed by Financial Activities (-9,400 jobs), Government (-5,600 jobs), Manufacturing (-5,500 jobs), Trade, Transportation, and Utilities (-1,900 jobs), and Information (-1,600 jobs).
Volume XXXVI, Number 11
Georgia Employment
(In Millions)
3.855
3.835
3.778
3.785
3.795
3.819
3.838
3.827
3.803
3.821
3.815
3.843
3.850
Nov Dec Jan Feb Mar Apr May Jun Jul Aug Sep Oct Nov
2009
2010
Georgia Unemployment Rate
(Seasonally Adjusted)
10.5% 10.5%
10.4%
10.3%
10.3%
10.2%
10.1%
10.0%
9.9%
10.0%
9.9%
10.1% 9.8%
Nov Dec Jan Feb Mar Apr May Jun Jul Aug Sep Oct Nov
2009
2010
Mark Butler, Commissioner Georgia Department of Labor Workforce Information & Analysis 148 Andrew Young International Blvd., N.E.
Atlanta, Georgia 30303-1751
For more information, contact Corey Smith at (404) 232-3875 ext. 21299 or Michael Alzubaydi at (404) 232-3875 ext. 27671.
corey.smith@dol.state.ga.us michael.alzubaydi@dol.state.ga.us
Equal Opportunity Employer/Program Auxiliary Aids and Services Available upon
Request to Individuals with Disabilities
GEORGIA Nonagricultural Employment (000s)
Change in Jobs
Change in Jobs
Preliminary Revised
Revised
NOV 2010 OCT 2010 NOV 2009
from OCT 2010 Net %
from NOV 2009 Net %
Total Nonfarm
3,849.5
3,842.5
3,854.6
7.0 0.2
-5.1 -0.1
Total Private
3,160.6
3,156.0
3,160.1
4.6 0.2
0.5 0.0
Goods Producing
494.8
497.3
511.0
-2.5 -0.5
-16.2 -3.2
Service-Providing
3,354.7
3,345.2
3,343.6
9.5 0.3
11.1 0.3
Private Service-Providing
2,665.8
2,658.7
2,649.1
7.1 0.3
16.7 0.6
Mining and Logging
9.1
9.2
9.1
-0.1 -1.1
0.0 0.0
Construction
149.7
152.2
160.4
-2.5 -1.6
-10.7 -6.7
Construction of Buildings
32.0
31.5
33.7
0.5 1.6
-1.7 -5.0
Heavy and Civil Engineering Construction
25.2
25.5
25.4
-0.3 -1.2
-0.2 -0.8
Specialty Trade Contractors
92.5
95.2
101.3
-2.7 -2.8
-8.8 -8.7
Manufacturing
336.0
335.9
341.5
0.1 0.0
-5.5 -1.6
Durable Goods
146.6
146.7
149.5
-0.1 -0.1
-2.9 -1.9
Computer, Electrical Equip and Appliance Mfg
19.5
19.5
20.1
0.0 0.0
-0.6 -3.0
Transportation Equipment Manufacturing
34.8
34.8
35.4
0.0 0.0
-0.6 -1.7
Non-Durable Goods
189.4
189.2
192.0
0.2 0.1
-2.6 -1.4
Food Manufacturing
61.6
61.4
63.0
0.2 0.3
-1.4 -2.2
Textile Mills
17.5
17.5
18.8
0.0 0.0
-1.3 -6.9
Textile Product Mills
30.6
30.5
31.6
0.1 0.3
-1.0 -3.2
Trade, Transportation and Utilities
816.6
810.3
818.5
6.3 0.8
-1.9 -0.2
Wholesale Trade
194.7
193.1
193.2
1.6 0.8
1.5 0.8
Merchant Wholesalers, Durable Goods
94.3
93.0
94.1
1.3 1.4
0.2 0.2
Merchant Wholesalers, Non-durable Goods
58.1
57.6
58.3
0.5 0.9
-0.2 -0.3
Wholesale Electronic Markets and Agents and Brokers
42.3
42.5
40.8
-0.2 -0.5
1.5 3.7
Retail Trade
439.4
433.9
444.8
5.5 1.3
-5.4 -1.2
Food and Beverage Stores
80.5
80.0
80.8
0.5 0.6
-0.3 -0.4
General Merchandise Stores
100.0
95.1
101.3
4.9 5.2
-1.3 -1.3
Miscellaneous Store Retailers
19.1
19.0
20.3
0.1 0.5
-1.2 -5.9
Transportation, Warehousing, and Utilities
182.5
183.3
180.5
-0.8 -0.4
2.0 1.1
Utilities
19.9
20.2
20.1
-0.3 -1.5
-0.2 -1.0
Transportation and Warehousing
162.6
163.1
160.4
-0.5 -0.3
2.2 1.4
Air Transportation
40.3
40.5
39.7
-0.2 -0.5
0.6 1.5
Truck Transportation
40.3
41.1
42.2
-0.8 -2.0
-1.9 -4.5
Couriers and Messengers
17.9
17.4
18.8
0.5 2.9
-0.9 -4.8
Warehousing and Storage
27.5
27.4
26.7
0.1 0.4
0.8 3.0
Information
101.4
100.8
103.0
0.6 0.6
-1.6 -1.6
Telecommunications
50.1
50.1
50.6
0.0 0.0
-0.5 -1.0
Wired Telecommunications Carriers
28.5
28.5
28.7
0.0 0.0
-0.2 -0.7
Wireless Telecommunications Carriers
11.0
11.0
10.8
0.0 0.0
0.2 1.9
Internet Service Providers, Search Portals, and DP
6.4
6.3
6.5
0.1 1.6
-0.1 -1.5
Financial Activities
195.0
196.7
204.4
-1.7 -0.9
-9.4 -4.6
Finance and Insurance
140.4
142.5
148.5
-2.1 -1.5
-8.1 -5.5
Insurance Carriers and Related Activities
64.1
64.0
65.0
0.1 0.2
-0.9 -1.4
Real Estate, Rental and Leasing
54.6
54.2
55.9
0.4 0.7
-1.3 -2.3
Professional and Business Services
522.4
517.4
506.3
5.0 1.0
16.1 3.2
Professional, Scientific, and Technical Services
212.9
211.8
208.1
1.1 0.5
4.8 2.3
Accounting, Tax Preparation and Bookkeeping
32.1
32.3
32.0
-0.2 -0.6
0.1 0.3
Architectural, Engineering and Related Services
32.2
32.0
34.9
0.2 0.6
-2.7 -7.7
Computer Systems Design and Related Services
45.3
45.7
45.6
-0.4 -0.9
-0.3 -0.7
Management and Technical Consulting Services
32.1
32.3
30.6
-0.2 -0.6
1.5 4.9
Management of Companies and Enterprises
49.3
49.2
48.9
0.1 0.2
0.4 0.8
Admin and Support, Waste Mngmnt and Remediation
260.2
256.4
249.3
3.8 1.5
10.9 4.4
Employment Services
115.3
114.3
105.0
1.0 0.9
10.3 9.8
Educational and Health Services
492.6
489.9
480.6
2.7 0.6
12.0 2.5
Educational Services
97.3
95.7
95.3
1.6 1.7
2.0 2.1
Colleges, Universities, and Professional Schools
61.0
59.3
61.6
1.7 2.9
-0.6 -1.0
Health Care and Social Assistance
395.3
394.2
385.3
1.1 0.3
10.0 2.6
Ambulatory Health Care Services
145.7
145.5
143.5
0.2 0.1
2.2 1.5
Hospitals
132.7
133.0
129.7
-0.3 -0.2
3.0 2.3
Nursing and Residential Care Facilities
55.7
55.0
55.3
0.7 1.3
0.4 0.7
Social Assistance
61.2
60.7
56.8
0.5 0.8
4.4 7.8
Leisure and Hospitality
378.1
383.7
378.7
-5.6 -1.5
-0.6 -0.2
Arts, Entertainment, and Recreation
40.3
43.1
39.5
-2.8 -6.5
0.8 2.0
Amusement, Gambling, and Recreation
26.5
28.1
27.2
-1.6 -5.7
-0.7 -2.6
Accommodation and Food Services
337.8
340.6
339.2
-2.8 -0.8
-1.4 -0.4
Accommodation
37.6
37.9
38.7
-0.3 -0.8
-1.1 -2.8
Food Services and Drinking Places
300.2
302.7
300.5
-2.5 -0.8
-0.3 -0.1
Other Services
159.7
159.9
157.6
-0.2 -0.1
2.1 1.3
Repair and Maintenance
34.6
34.8
34.1
-0.2 -0.6
0.5 1.5
Personal and Laundry Services
32.9
33.0
33.2
-0.1 -0.3
-0.3 -0.9
Religious, Grantmaking, Civic, Professional and Similar
92.2
92.1
90.3
0.1 0.1
1.9 2.1
Government
688.9
686.5
694.5
2.4 0.4
-5.6 -0.8
Federal Government
100.2
100.8
100.3
-0.6 -0.6
-0.1 -0.1
Department of Defense
41.2
41.0
39.3
0.2 0.5
1.9 4.8
State Government
169.0
168.3
167.1
0.7 0.4
1.9 1.1
State Government Education
96.7
96.0
90.0
0.7 0.7
6.7 7.4
Local Government
419.7
417.4
427.1
2.3 0.6
-7.4 -1.7
Local Government Education
260.0
258.7
265.7
1.3 0.5
-5.7 -2.2
Note: These preliminary estimates were prepared in cooperation with the U.S. Department of Labor, Bureau of Labor Statistics, based upon monthly reports submitted by selected employers
throughout Georgia. The estimates include all full- and part-time wage and salary workers who were employed during or received pay for any part of the pay period that includes the twelfth of the
month. Proprietors, domestic workers, self-employed persons, unpaid family workers and personnel of the armed forces are excluded. Estimates based on 2009 benchmark.
2
Source: Georgia Department of Labor, Workforce Information & Analysis
ATLANTA MSA Nonagricultural Employment (000s)
Preliminary NOV 2010
Revised
Revised
OCT 2010 NOV 2009
Change in Jobs
from OCT 2010
Net
%
Change in Jobs from NOV 2009
Net %
Total Nonfarm Total Private Goods Producing Service-Providing Private Service-Providing
Mining and Logging Construction Construction of Buildings Specialty Trade Contractors Manufacturing Durable Goods Transportation Equipment Manufacturing Non-Durable Goods Food Manufacturing Trade, Transportation and Utilities Wholesale Trade Merchant Wholesalers, Durable Goods Merchant Wholesalers, Non-durable Goods Wholesale Electronic Markets and Agents and Brokers Retail Trade Food and Beverage Stores General Merchandise Stores Miscellaneous Store Retailers Transportation, Warehousing, and Utilities Utilities Transportation and Warehousing Air Transportation Truck Transportation Couriers and Messengers Information Telecommunications Wired Telecommunications Carriers Wireless Telecommunications Carriers Internet Service Providers, Search Portals, and DP Financial Activities Finance and Insurance Insurance Carriers and Related Activities Real Estate, Rental and Leasing Professional and Business Services Professional, Scientific, and Technical Services Accounting, Tax Preparation and Bookkeeping Architectural, Engineering and Related Services Computer Systems Design and Related Services Management and Technical Consulting Services Management of Companies and Enterprises Admin and Support, Waste Mngmnt and Remediation Employment Services Educational and Health Services Educational Services Health Care and Social Assistance Ambulatory Health Care Services Hospitals Social Assistance Leisure and Hospitality Arts, Entertainment, and Recreation Accommodation and Food Services Accommodation Food Services and Drinking Places Other Services Repair and Maintenance Personal and Laundry Services Government Federal Government State Government Local Government
2,278.6 1,951.0
231.8 2,046.8 1,719.2
1.2 90.4 17.1 54.8 140.2 65.7 13.3 74.5 23.0 523.6 141.9 70.1 38.4 33.4 256.0 49.4 53.7 12.6 125.7 10.8 114.9 39.4 24.0 14.2 76.5 37.4 23.4
9.3 5.9 133.2 94.0 43.9 39.2 380.9 165.6 22.8 24.2 37.5 27.5 37.5 177.8 79.5 280.7 61.6 219.1 82.6 72.8 34.6 223.0 25.2 197.8 21.3 176.5 101.3 18.0 21.5 327.6 45.8 69.0 212.8
2,274.4 1,947.2
234.2 2,040.2 1,713.0
1.2 93.4 17.6 56.4 139.6 65.7 13.3 73.9 22.8 518.2 139.9 69.4 37.9 32.6 253.0 48.5 51.9 12.6 125.3 10.9 114.4 39.7 24.1 13.9 75.7 37.2 23.4
9.3 5.8 134.5 95.0 43.5 39.5 378.4 164.9 22.6 24.2 37.3 27.5 37.4 176.1 77.8 279.0 61.5 217.5 82.9 72.4 34.4 225.2 27.1 198.1 21.3 176.8 102.0 18.3 21.7 327.2 46.1 68.8 212.3
2,276.3 1,941.6
237.3 2,039.0 1,704.3
1.3 96.8 19.4 62.1 139.2 66.6 12.9 72.6 23.4 519.7 141.0 70.7 38.6 31.7 255.9 48.2 55.0 13.3 122.8 11.0 111.8 38.5 24.8 14.8 78.7 36.7 23.2
8.8 6.1 139.7 99.9 44.1 39.8 372.3 163.3 22.5 26.1 36.9 26.7 37.2 171.8 71.7 270.5 60.5 210.0 81.7 70.2 34.1 221.7 25.3 196.4 21.6 174.8 101.7 18.9 22.0 334.7 46.8 69.9 218.0
4.2 0.2 3.8 0.2 -2.4 -1.0 6.6 0.3 6.2 0.4 0.0 0.0 -3.0 -3.2 -0.5 -2.8 -1.6 -2.8 0.6 0.4 0.0 0.0 0.0 0.0 0.6 0.8 0.2 0.9 5.4 1.0 2.0 1.4 0.7 1.0 0.5 1.3 0.8 2.5 3.0 1.2 0.9 1.9 1.8 3.5 0.0 0.0 0.4 0.3 -0.1 -0.9 0.5 0.4 -0.3 -0.8 -0.1 -0.4 0.3 2.2 0.8 1.1 0.2 0.5 0.0 0.0 0.0 0.0 0.1 1.7 -1.3 -1.0 -1.0 -1.1 0.4 0.9 -0.3 -0.8 2.5 0.7 0.7 0.4 0.2 0.9 0.0 0.0 0.2 0.5 0.0 0.0 0.1 0.3 1.7 1.0 1.7 2.2 1.7 0.6 0.1 0.2 1.6 0.7 -0.3 -0.4 0.4 0.6 0.2 0.6 -2.2 -1.0 -1.9 -7.0 -0.3 -0.2 0.0 0.0 -0.3 -0.2 -0.7 -0.7 -0.3 -1.6 -0.2 -0.9 0.4 0.1 -0.3 -0.7 0.2 0.3 0.5 0.2
2.3 0.1 9.4 0.5 -5.5 -2.3 7.8 0.4 14.9 0.9 -0.1 -7.7 -6.4 -6.6 -2.3 -11.9 -7.3 -11.8 1.0 0.7 -0.9 -1.4 0.4 3.1 1.9 2.6 -0.4 -1.7 3.9 0.8 0.9 0.6 -0.6 -0.9 -0.2 -0.5 1.7 5.4 0.1 0.0 1.2 2.5 -1.3 -2.4 -0.7 -5.3 2.9 2.4 -0.2 -1.8 3.1 2.8 0.9 2.3 -0.8 -3.2 -0.6 -4.1 -2.2 -2.8 0.7 1.9 0.2 0.9 0.5 5.7 -0.2 -3.3 -6.5 -4.7 -5.9 -5.9 -0.2 -0.5 -0.6 -1.5 8.6 2.3 2.3 1.4 0.3 1.3 -1.9 -7.3 0.6 1.6 0.8 3.0 0.3 0.8 6.0 3.5 7.8 10.9 10.2 3.8 1.1 1.8 9.1 4.3 0.9 1.1 2.6 3.7 0.5 1.5 1.3 0.6 -0.1 -0.4 1.4 0.7 -0.3 -1.4 1.7 1.0 -0.4 -0.4 -0.9 -4.8 -0.5 -2.3 -7.1 -2.1 -1.0 -2.1 -0.9 -1.3 -5.2 -2.4
Note: These preliminary estimates were prepared in cooperation with the U.S. Department of Labor, Bureau of Labor Statistics, based upon monthly reports submitted by selected employers
in the Atlanta Metropolitan Statistical Area, which includes Barrow, Bartow, Butts, Carroll, Cherokee, Clayton, Cobb, Coweta, Dawson, DeKalb, Douglas, Fayette, Forsyth, Fulton, Gwinnett, Haralson, Heard, Henry, Jasper, Lamar, Meriwether, Newton, Paulding, Pickens, Pike, Rockdale, Spalding and Walton counties. The estimates include all full- and part-time wage and salary workers who were employed during or received pay for any part of the pay period that includes the twelfth of the month. Proprietors, domestic workers, self-employed persons, unpaid family workers and personnel of the armed forces are excluded. Estimates based on 2009 benchmark.
Source: Georgia Department of Labor, Workforce Information & Analysis
3
ALBANY MSA Nonagricultural Employment (000s)
Preliminary
Revised
Revised
NOV 2010 OCT 2010 NOV 2009
Change in Jobs from OCT 2010
Net %
Change in Jobs
from NOV 2009
Net
%
Total Nonfarm Total Private
62.1
61.6
61.8
48.4
47.9
47.9
0.5 0.8 0.5 1.0
0.3 0.5 0.5 1.0
Goods Producing Service-Providing Private Service-Providing
7.2
7.3
7.6
-0.1 -1.4
54.9
54.3
54.2
0.6 1.1
41.2
40.6
40.3
0.6 1.5
-0.4 -5.3 0.7 1.3 0.9 2.2
Manufacturing Trade, Transportation and Utilities Retail Trade
4.6
4.6
4.9
12.4
12.4
12.5
7.7
7.6
7.7
0.0 0.0 0.0 0.0 0.1 1.3
-0.3 -6.1 -0.1 -0.8 0.0 0.0
Government Federal Government State Government
13.7
13.7
13.9
3.4
3.4
3.4
3.0
3.0
3.0
0.0 0.0 0.0 0.0 0.0 0.0
-0.2 -1.4 0.0 0.0 0.0 0.0
Local Government
7.3
7.3
7.5
0.0 0.0
-0.2 -2.7
Note: These preliminary estimates were prepared in cooperation with the U.S. Department of Labor, Bureau of Labor Statistics, based upon monthly reports submitted by selected employers
in the Albany Metropolitan Statistical Area, which includes Baker, Dougherty, Lee, Terrell and Worth counties. The estimates include all full- and part-time wage and salary workers who were employed during or received pay for any part of the pay period that includes the twelfth of the month. Proprietors, domestic workers, self-employed persons, unpaid family workers and personnel
of the armed forces are excluded. Estimates based on 2009 benchmark.
ATHENS - CLARKE MSA Nonagricultural Employment (000s)
Preliminary
Revised
Revised
NOV 2010 OCT 2010 NOV 2009
Change in Jobs
from OCT 2010
Net
%
Change in Jobs from NOV 2009
Net %
Total Nonfarm
80.8
80.7
81.6
0.1 0.1
-0.8 -1.0
Total Private
56.4
56.2
56.9
0.2 0.4
-0.5 -0.9
Goods Producing
9.6
9.6
10.0
0.0 0.0
-0.4 -4.0
Service-Providing
71.2
71.1
71.6
0.1 0.1
-0.4 -0.6
Private Service-Providing
46.8
46.6
46.9
0.2 0.4
-0.1 -0.2
Trade, Transportation and Utilities
13.2
13.0
13.2
0.2 1.5
0.0 0.0
Retail Trade
9.6
9.4
9.6
0.2 2.1
0.0 0.0
Professional and Business Services
7.0
7.0
6.5
0.0 0.0
0.5 7.7
Leisure and Hospitality
8.1
8.2
8.3
-0.1 -1.2
-0.2 -2.4
Government
24.4
24.5
24.7
-0.1 -0.4
-0.3 -1.2
Federal Government
1.4
1.5
1.6
-0.1 -6.7
-0.2 -12.5
State Government
15.0
15.0
15.0
0.0 0.0
0.0 0.0
Local Government
8.0
8.0
8.1
0.0 0.0
-0.1 -1.2
Note: These preliminary estimates were prepared in cooperation with the U.S. Department of Labor, Bureau of Labor Statistics, based upon monthly reports submitted by selected employers in
the Athens - Clarke County Metropolitan Statistical Area, which includes Clarke, Madison, Oconee and Oglethorpe counties. The estimates include all full- and part-time wage and salary workers who were employed during or received pay for any part of the pay period that includes the twelfth of the month. Proprietors, domestic workers, self-employed persons, unpaid family workers and personnel of the armed forces are excluded. Estimates based on 2009 benchmark.
Source: Georgia Department of Labor, Workforce Information & Analysis
4
AUGUSTA-RICHMOND MSA Nonagricultural Employment (000s)
Preliminary Revised Revised NOV 2010 OCT 2010 NOV 2009
Change in Jobs from OCT 2010
Net %
Change in Jobs from NOV 2009
Net %
Total Nonfarm Total Private Goods Producing Service-Providing Private Service-Providing Mining, Logging, and Construction Manufacturing Trade, Transportation and Utilities Wholesale Trade Retail Trade Transportation,Warehousing, and Utilities Information Financial Activitities Professional and Business Services Educational and Health Services Leisure and Hospitality Other Services Government Federal Government State Government Local Government
210.7 167.1
29.6 181.1 137.5
10.2 19.4 36.1
4.5 25.1
6.5 2.8 7.1 31.4 29.1 20.9 10.1 43.6 8.7 13.7 21.2
210.5 167.1
29.8 180.7 137.3
10.5 19.3 35.9
4.5 24.9
6.5 2.8 7.2 31.0 29.1 21.2 10.1 43.4 8.8 13.5 21.1
208.9 164.8
30.6 178.3 134.2
10.9 19.7 36.0
4.4 25.3
6.3 2.8 7.4 29.0 28.6 20.8 9.6 44.1 8.6 13.9 21.6
0.2 0.1 0.0 0.0 -0.2 -0.7 0.4 0.2 0.2 0.2 -0.3 -2.9 0.1 0.5 0.2 0.6 0.0 0.0 0.2 0.8 0.0 0.0 0.0 0.0 -0.1 -1.4 0.4 1.3 0.0 0.0 -0.3 -1.4 0.0 0.0 0.2 0.5 -0.1 -1.1 0.2 1.5 0.1 0.5
1.8 0.9 2.3 1.4 -1.0 -3.3 2.8 1.6 3.3 2.5 -0.7 -6.4 -0.3 -1.5 0.1 0.3 0.1 2.3 -0.2 -0.8 0.2 3.2 0.0 0.0 -0.3 -4.1 2.4 8.3 0.5 1.8 0.1 0.5 0.5 5.2 -0.5 -1.1 0.1 1.2 -0.2 -1.4 -0.4 -1.9
Note: These preliminary estimates were prepared in cooperation with the U.S. Department of Labor, Bureau of Labor Statistics, based upon monthly reports submitted by selected employers in the
Augusta - Richmond County Metropolitan Statistical Area, which includes Burke, Columbia, McDuffie and Richmond counties in Georgia and Aiken and Edgefield counties in South Carolina. The estimates include all full- and part-time wage and salary workers who were employed during or received pay for any part of the pay period that includes the twelfth of the month. Proprietors, domestic
workers, self-employed persons, unpaid family workers and personnel of the armed forces are excluded. Estimates based on 2009 benchmark.
BRUNSWICK MSA Nonagricultural Employment (000s)
Preliminary Revised Revised NOV 2010 OCT 2010 NOV 2009
Change in Jobs from OCT 2010
Net %
Change in Jobs from NOV 2009
Net %
Total Nonfarm Total Private Goods Producing Service-Providing Private Service-Providing Trade, Transportation and Utilities
Retail Trade Government
Federal Government State Government Local Government
41.1
41.1
42.2
31.1
31.1
31.6
4.5
4.5
4.6
36.6
36.6
37.6
26.6
26.6
27.0
7.7
7.6
7.8
5.5
5.5
5.6
10.0
10.0
10.6
1.8
1.8
2.0
1.6
1.6
2.0
6.6
6.6
6.6
0.0 0.0 0.0 0.0 0.0 0.0 0.0 0.0 0.0 0.0 0.1 1.3 0.0 0.0 0.0 0.0 0.0 0.0 0.0 0.0 0.0 0.0
-1.1 -2.6 -0.5 -1.6 -0.1 -2.2 -1.0 -2.7 -0.4 -1.5 -0.1 -1.3 -0.1 -1.8 -0.6 -5.7 -0.2 -10.0 -0.4 -20.0 0.0 0.0
Note: These preliminary estimates were prepared in cooperation with the U.S. Department of Labor, Bureau of Labor Statistics, based upon monthly reports submitted by selected
employers in the Brunswick Metropolitan Statistical Area, which includes Brantley, Glynn and McIntosh counties. The estimates include all full- and part-time wage and salary workers who were employed during or received pay for any part of the pay period that includes the twelfth of the month. Proprietors, domestic workers, self-employed persons, unpaid family workers and personnel of the armed forces are excluded. Estimates based on 2009 benchmark.
Source: Georgia Department of Labor, Workforce Information & Analysis
5
COLUMBUS MSA Nonagricultural Employment (000s)
Preliminary Revised Revised NOV 2010 OCT 2010 NOV 2009
Change in Jobs from OCT 2010
Net %
Change in Jobs from NOV 2009
Net %
Total Nonfarm Total Private Goods Producing
116.9 93.1 13.1
117.1 93.3 13.2
116.5 92.5 14.1
-0.2 -0.2 -0.2 -0.2 -0.1 -0.8
0.4 0.3 0.6 0.7 -1.0 -7.1
Service-Providing Private Service-Providing Trade, Transportation and Utilities
103.8 80.0 17.9
103.9 80.1 17.8
102.4 78.4 18.1
-0.1 -0.1 -0.1 -0.1 0.1 0.6
1.4 1.4 1.6 2.0 -0.2 -1.1
Retail Trade Information Financial Activities
12.7
12.6
13.1
0.1 0.8
5.5
5.4
5.6
0.1 1.9
8.2
8.3
8.4
-0.1 -1.2
-0.4 -3.1 -0.1 -1.8 -0.2 -2.4
Finance and Insurance Insurance Carriers and Related Activities Professional and Business Services
6.8
6.9
6.8
-0.1 -1.5
4.5
4.5
4.5
0.0 0.0
13.5
13.4
13.0
0.1 0.8
0.0 0.0 0.0 0.0 0.5 3.9
Leisure and Hospitality Government Federal Government
13.2
13.2
13.1
0.0 0.0
23.8
23.8
24.0
0.0 0.0
6.0
6.1
6.1
-0.1 -1.6
0.1 0.8 -0.2 -0.8 -0.1 -1.6
State Government Local Government
4.4
4.3
4.5
13.4
13.4
13.4
0.1 2.3 0.0 0.0
-0.1 -2.2 0.0 0.0
Note: These preliminary estimates were prepared in cooperation with the U.S. Department of Labor, Bureau of Labor Statistics, based upon monthly reports submitted by selected
employers in the Columbus Metropolitan Statistical Area, which includes Chattahoochee, Harris, Marion and Muscogee counties in Georgia and Russell County in Alabama. The estimates include all full- and part-time wage and salary workers who were employed during or received pay for any part of the pay period that includes the twelfth of the month. Proprietors, domestic workers, self-employed persons, unpaid family workers and personnel of the armed forces are excluded. Estimates based on 2009 benchmark.
DALTON MSA Nonagricultural Employment (000s)
Preliminary Revised
Revised
NOV 2010 OCT 2010 NOV 2009
Change in Jobs from OCT 2010
Net %
Change in Jobs from NOV 2009
Net %
Total Nonfarm Total Private
64.6
64.7
66.3
-0.1 -0.2
57.2
57.4
59.1
-0.2 -0.4
-1.7 -2.6 -1.9 -3.2
Goods Producing
24.2
24.3
25.2
-0.1 -0.4
-1.0 -4.0
Service-Providing Private Service-Providing
40.4
40.4
41.1
0.0 0.0
33.0
33.1
33.9
-0.1 -0.3
-0.7 -1.7 -0.9 -2.7
Manufacturing
23.3
23.3
23.9
0.0 0.0
-0.6 -2.5
Textile Mills Textile Product Mills
2.2
2.2
2.3
0.0 0.0
17.1
17.2
17.8
-0.1 -0.6
-0.1 -4.4 -0.7 -3.9
Trade, Transportation and Utilities
14.5
14.4
14.5
0.1 0.7
0.0 0.0
Retail Trade Transportation, Warehouse, and Utilities
7.4
7.4
3.4
3.4
7.5
0.0 0.0
-0.1 -1.3
3.4
0.0 0.0
0.0 0.0
Professional and Business Services
5.6
5.5
5.5
0.1 1.8
0.1 1.8
Government Federal Government
7.4
7.3
0.3
0.3
7.2
0.1 1.4
0.3
0.0 0.0
0.2 2.8 0.0 0.0
State Government
1.2
1.2
1.2
0.0 0.0
0.0 0.0
Local Government
5.9
5.8
5.7
0.1 1.7
0.2 3.5
Note: These preliminary estimates were prepared in cooperation with the U.S. Department of Labor, Bureau of Labor Statistics, based upon monthly reports submitted by selected employers
in the Dalton Metropolitan Statistical Area, which includes Murray and Whitfield counties. The estimates include all full- and part-time wage and salary workers who were employed during or received pay for any part of the pay period that includes the twelfth of the month. Proprietors, domestic workers, self-employed persons, unpaid family workers and personnel of the armed forces are excluded. Estimates based on 2009 benchmark.
Source: Georgia Department of Labor, Workforce Information & Analysis
6
GAINESVILLE MSA Nonagricultural Employment (000s)
Preliminary Revised
Revised
NOV 2010 OCT 2010 NOV 2009
Change in Jobs from OCT 2010
Net %
Change in Jobs from NOV 2009
Net %
Total Nonfarm Total Private
70.9
71.5
60.2
60.7
71.6
-0.6 -0.8
60.8
-0.5 -0.8
-0.7 -1.0 -0.6 -1.0
Goods Producing
17.8
17.9
18.6
-0.1 -0.6
-0.8 -4.3
Service-Providing Private Service-Providing
53.1
53.6
53.0
-0.5 -0.9
42.4
42.8
42.2
-0.4 -0.9
0.1 0.2 0.2 0.5
Trade, Transportation and Utilities
13.7
13.8
13.2
-0.1 -0.7
0.5 3.8
Retail Trade Government
7.3
7.3
10.7
10.8
7.4
0.0 0.0
10.8
-0.1 -0.9
-0.1 -1.4 -0.1 -0.9
Federal Government
0.5
0.5
0.5
0.0 0.0
0.0 0.0
State Government Local Government
3.0
3.0
7.2
7.3
2.8
0.0 0.0
7.5
-0.1 -1.4
0.2 7.1 -0.3 -4.0
Note: These preliminary estimates were prepared in cooperation with the U.S. Department of Labor, Bureau of Labor Statistics, based upon monthly reports submitted by selected employers
in the Gainesville Metropolitan Statistical Area, which comprises Hall county. The estimates include all full- and part-time wage and salary workers who were employed during or received pay for any part of the pay period that includes the twelfth of the month. Proprietors, domestic workers, self-employed persons, unpaid family workers and personnel of the armed forces are excluded. Estimates based on 2009 benchmark.
HINESVILLE - FT. STEWART MSA Nonagricultural Employment (000s)
Preliminary Revised
Revised
NOV 2010 OCT 2010 NOV 2009
Change in Jobs from OCT 2010
Net %
Change in Jobs from NOV 2009
Net %
Total Nonfarm Total Private Goods Producing Service-Providing Private Service-Providing Government
Federal Government State Government Local Government
19.9
19.7
19.6
11.8
11.7
11.7
1.7
1.7
1.7
18.2
18.0
17.9
10.1
10.0
10.0
8.1
8.0
7.9
4.5
4.4
4.1
0.3
0.3
0.3
3.3
3.3
3.5
0.2 1.0 0.1 0.9 0.0 0.0 0.2 1.1 0.1 1.0 0.1 1.3 0.1 2.3 0.0 0.0 0.0 0.0
0.3 1.5 0.1 0.9 0.0 0.0 0.3 1.7 0.1 1.0 0.2 2.5 0.4 9.8 0.0 0.0 -0.2 -5.7
Note: These preliminary estimates were prepared in cooperation with the U.S. Department of Labor, Bureau of Labor Statistics, based upon monthly reports submitted by selected
employers in the Hinesville - Ft. Stewart Metropolitan Statistical Area, which includes Liberty and Long counties. The estimates include all full- and part-time wage and salary workers who were employed during or received pay for any part of the pay period that includes the twelfth of the month. Proprietors, domestic workers, self-employed persons, unpaid family workers and personnel of the armed forces are excluded. Estimates based on 2009 benchmark.
Source: Georgia Department of Labor, Workforce Information & Analysis
7
MACON MSA Nonagricultural Employment (000s)
Preliminary Revised
Revised
NOV 2010 OCT 2010 NOV 2009
Change in Jobs from OCT 2010
Net %
Change in Jobs from NOV 2009
Net %
Total Nonfarm Total Private Goods Producing Service-Providing Private Service-Providing Trade Transportation and Utilities Retail Trade Transportation, Warehousing, and Utilities Financial Activities Professional and Business Services Educational and Health Services Leisure and Hospitality Government Federal Government State Government Local Government
96.1
95.1
81.3
80.4
9.8
9.8
86.3
85.3
71.5
70.6
18.9
18.7
11.8
11.6
4.1
4.1
8.3
8.3
11.6
11.6
19.4
19.3
8.5
8.6
14.8
14.7
1.4
1.4
3.4
3.4
10.0
9.9
97.6
1.0 1.1
82.6
0.9 1.1
10.1
0.0 0.0
87.5
1.0 1.2
72.5
0.9 1.3
18.8
0.2 1.1
11.9
0.2 1.7
4.1
0.0 0.0
8.3
0.0 0.0
11.4
0.0 0.0
19.0
0.1 0.5
8.5
-0.1 -1.2
15.0
0.1 0.7
1.4
0.0 0.0
3.4
0.0 0.0
10.2
0.1 1.0
-1.5 -1.5 -1.3 -1.6 -0.3 -3.0 -1.2 -1.4 -1.0 -1.4 0.1 0.5 -0.1 -0.8 0.0 0.0 0.0 0.0 0.2 1.8 0.4 2.1 0.0 0.0 -0.2 -1.3 0.0 0.0 0.0 0.0 -0.2 -2.0
Note: These preliminary estimates were prepared in cooperation with the U.S. Department of Labor, Bureau of Labor Statistics, based upon monthly reports submitted by selected employers
in the Macon Metropolitan Statistical Area, which includes Bibb, Crawford, Jones, Monroe and Twiggs counties. The estimates include all full- and part-time wage and salary workers who were employed during or received pay for any part of the pay period that includes the twelfth of the month. Proprietors, domestic workers, self-employed persons, unpaid family workers and personnel of the armed forces are excluded. Estimates based on 2009 benchmark.
ROME MSA Nonagricultural Employment (000s)
Preliminary Revised
Revised
NOV 2010 OCT 2010 NOV 2009
Change in Jobs from OCT 2010
Net %
Change in Jobs from NOV 2009
Net %
Total Nonfarm Total Private Goods Producing Service-Providing Private Service-Providing Manufacturing Trade, Transportation and Utilities
Retail Trade Educational and Health Services Government Federal Government State Government Local Government
39.4
39.3
39.7
32.5
32.4
32.8
7.0
7.0
7.3
32.4
32.3
32.4
25.5
25.4
25.5
6.1
6.1
6.1
6.1
6.1
6.2
4.1
4.0
4.1
8.9
8.8
8.7
6.9
6.9
6.9
0.2
0.2
0.2
2.7
2.7
2.6
4.0
4.0
4.1
0.1 0.3 0.1 0.3 0.0 0.0 0.1 0.3 0.1 0.4 0.0 0.0 0.0 0.0 0.1 2.5 0.1 1.1 0.0 0.0 0.0 0.0 0.0 0.0 0.0 0.0
-0.3 -0.8 -0.3 -0.9 -0.3 -4.1 0.0 0.0 0.0 0.0 0.0 0.0 -0.1 -1.6 0.0 0.0 0.2 2.3 0.0 0.0 0.0 0.0 0.1 3.9 -0.1 -2.4
Note: These preliminary estimates were prepared in cooperation with the U.S. Department of Labor, Bureau of Labor Statistics, based upon monthly reports submitted by selected employers
in the Rome Metropolitan Statistical Area, which comprises Floyd county. The estimates include all full- and part-time wage and salary workers who were employed during or received pay for any part of the pay period that includes the twelfth of the month. Proprietors, domestic workers, self-employed persons, unpaid family workers and personnel of the armed forces are excluded. Estimates based on 2009 benchmark.
Source: Georgia Department of Labor, Workforce Information & Analysis
8
SAVANNAH MSA Nonagricultural Employment (000s)
Preliminary Revised
Revised
NOV 2010 OCT 2010 NOV 2009
Change in Jobs from OCT 2010
Net %
Change in Jobs from NOV 2009
Net %
Total Nonfarm Total Private
152.8 128.8
151.9 128.3
151.0 127.1
0.9 0.6 0.5 0.4
1.8 1.2 1.7 1.3
Goods Producing Service-Providing Private Service-Providing
20.3 132.5 108.5
20.4 131.5 107.9
20.8 130.2 106.3
-0.1 -0.5 1.0 0.8 0.6 0.6
-0.5 -2.4 2.3 1.8 2.2 2.1
Mining, Logging, and Construction Manufacturing Trade, Transportation and Utilities
7.0
7.1
13.3
13.3
33.1
32.7
7.4
-0.1 -1.4
13.4
0.0 0.0
32.3
0.4 1.2
-0.4 -5.4 -0.1 -0.8 0.8 2.5
Wholesale Trade Retail Trade Transportation, Warehousing, and Utilities
5.5
5.5
5.5
17.6
17.2
16.8
10.0
10.0
10.0
0.0 0.0 0.4 2.3 0.0 0.0
0.0 0.0 0.8 4.8 0.0 0.0
Information Financial Activities Professional and Business Services
1.7
1.7
1.7
5.4
5.4
5.6
16.7
16.5
16.1
0.0 0.0 0.0 0.0 0.2 1.2
0.0 0.0 -0.2 -3.6 0.6 3.7
Educational and Health Services Leisure and Hospitality Other Services
24.4
24.3
23.8
0.1 0.4
19.8
19.9
19.6
-0.1 -0.5
7.4
7.4
7.2
0.0 0.0
0.6 2.5 0.2 1.0 0.2 2.8
Government Federal Government State Government
24.0
23.6
23.9
3.0
3.0
3.0
5.7
5.6
5.6
0.4 1.7 0.0 0.0 0.1 1.8
0.1 0.4 0.0 0.0 0.1 1.8
Local Government
15.3
15.0
15.3
0.3 2.0
0.0 0.0
Note: These preliminary estimates were prepared in cooperation with the U.S. Department of Labor, Bureau of Labor Statistics, based upon monthly reports submitted by selected employers
in the Savannah Metropolitan Statistical Area, which includes Bryan, Chatham and Effingham counties. The estimates include all full- and part-time wage and salary workers who were employed during or received pay for any part of the pay period that includes the twelfth of the month. Proprietors, domestic workers, self-employed persons, unpaid family workers and personnel of the armed forces are excluded. Estimates based on 2009 benchmark.
VALDOSTA MSA Nonagricultural Employment (000s)
Preliminary Revised Revised NOV 2010 OCT 2010 NOV 2009
Change in Jobs from OCT 2010
Net %
Change in Jobs from NOV 2009
Net %
Total Nonfarm Total Private Goods Producing Service-Providing Private Service-Providing Trade, Transportation and Utilities Retail Trade Government Federal Government State Government Local Government
53.3
53.3
53.5
40.1
40.1
40.1
6.7
6.7
6.9
46.6
46.6
46.6
33.4
33.4
33.2
11.0
10.9
11.0
7.9
7.8
7.9
13.2
13.2
13.4
1.0
1.0
1.0
4.3
4.3
4.5
7.9
7.9
7.9
0.0 0.0 0.0 0.0 0.0 0.0 0.0 0.0 0.0 0.0 0.1 0.9 0.1 1.3 0.0 0.0 0.0 0.0 0.0 0.0 0.0 0.0
-0.2 -0.4 0.0 0.0 -0.2 -2.9 0.0 0.0 0.2 0.6 0.0 0.0 0.0 0.0 -0.2 -1.5 0.0 0.0 -0.2 -4.4 0.0 0.0
Note: These preliminary estimates were prepared in cooperation with the U.S. Department of Labor, Bureau of Labor Statistics, based upon monthly reports submitted by selected employers
in the Valdosta Metropolitan Statistical Area, which includes Brooks, Echols, Lanier and Lowndes counties. The estimates include all full- and part-time wage and salary workers who were employed during or received pay for any part of the pay period that includes the twelfth of the month. Proprietors, domestic workers, self-employed persons, unpaid family workers and personnel of the armed forces are excluded. Estimates based on 2009 benchmark.
Source: Georgia Department of Labor, Workforce Information & Analysis
9
WARNER ROBINS MSA Nonagricultural Employment (000s)
Preliminary Revised
Revised
NOV 2010 OCT 2010 NOV 2009
Change in Jobs from OCT 2010
Net %
Change in Jobs from NOV 2009
Net %
Total Nonfarm Total Private Goods Producing Service-Providing Private Service-Providing Trade, Transportation and Utilities Retail Trade Government Federal Government State Government Local Government
59.0
59.2
34.0
34.0
6.5
6.5
52.5
52.7
27.5
27.5
7.8
7.7
6.1
6.0
25.0
25.2
15.9
16.0
1.1
1.3
8.0
7.9
59.3
-0.2 -0.3
34.9
0.0 0.0
6.6
0.0 0.0
52.7
-0.2 -0.4
28.3
0.0 0.0
7.8
0.1 1.3
6.1
0.1 1.7
24.4
-0.2 -0.8
15.0
-0.1 -0.6
1.2
-0.2 -15.4
8.2
0.1 1.3
-0.3 -0.5 -0.9 -2.6 -0.1 -1.5 -0.2 -0.4 -0.8 -2.8 0.0 0.0 0.0 0.0 0.6 2.5 0.9 6.0 -0.1 -8.3 -0.2 -2.4
Note: These preliminary estimates were prepared in cooperation with the U.S. Department of Labor, Bureau of Labor Statistics, based upon monthly reports submitted by selected employers
in the Warner Robins Metropolitan Statistical Area, which comprises Houston county. The estimates include all full- and part-time wage and salary workers who were employed during or received pay for any part of the pay period that includes the twelfth of the month. Proprietors, domestic workers, self-employed persons, unpaid family workers and personnel of the armed forces are excluded. Estimates based on 2009 benchmark.
Source: Georgia Department of Labor, Workforce Information & Analysis
10
Georgia Statewide Hours and Earnings
All Employee
Average Weekly Earnings
Preliminary NOV 2010
Revised OCT 2010
Revised NOV 2009
Total Private ........................................................................................... $748.31 ........................ $749.92 ................... $751.10 Goods Producing ................................................................................ $820.79 ........................ $820.79 ................... $826.75 Private Service Providing .................................................................... $735.33 ........................ $737.52 ................... $735.39 Construction .................................................................................... $823.08 ........................ $822.95 ................... $826.50 Manufacturing .................................................................................. $803.76 ........................ $796.56 ................... $783.12 Trade, Transportation, and Utilities ................................................ $697.18 ........................ $687.40 ................... $685.09 Financial Activities ........................................................................... $857.14 ........................ $864.38 ................... $905.03 Professional and Business Services ............................................. $949.07 ........................ $946.19 ................... $961.20 Educational and Health Services .................................................... $776.68 ........................ $782.38 ................... $800.64 Leisure and Hospitality ................................................................... $327.78 ........................ $324.54 ................... $320.93 Other Services ................................................................................. $586.31 ........................ $594.07 ................... $558.87
Average Weekly Hours
Preliminary NOV 2010
Revised OCT 2010
Revised NOV 2009
Total Private .................................................................................................. 34.5 .............................. 34.4 ......................... 35.0 Goods Producing ....................................................................................... 38.9 .............................. 38.9 ......................... 38.4 Private Service Providing ........................................................................... 33.7 .............................. 33.6 ......................... 34.3
Construction ...........................................................................................38.0 .............................. 38.8 ......................... 38.0 Manufacturing ......................................................................................... 39.4 .............................. 38.8 ......................... 39.0 Trade, Transportation, and Utilities .......................................................35.3 .............................. 35.0 ......................... 34.9 Financial Activities ..................................................................................35.1 .............................. 34.7 ......................... 36.1 Professional and Business Services ....................................................35.4 .............................. 35.8 ......................... 35.6 Educational and Health Services ........................................................... 35.4 .............................. 35.1 ......................... 35.6 Leisure and Hospitality .......................................................................... 27.0 .............................. 27.0 ......................... 27.5 Other Services ........................................................................................33.2 .............................. 33.3 ......................... 31.7
Average Hourly Earnings
Preliminary NOV 2010
Revised OCT 2010
Revised NOV 2009
Total Private ............................................................................................. $21.69 .......................... $21.80 ..................... $21.46 Goods Producing .................................................................................. $21.10 .......................... $21.10 ..................... $21.53 Private Service Providing ...................................................................... $21.82 .......................... $21.95 ..................... $21.44
Construction ...................................................................................... $21.66 .......................... $21.21 ..................... $21.75 Manufacturing .................................................................................... $20.40 .......................... $20.53 ..................... $20.08 Trade, Transportation, and Utilities .................................................. $19.75 .......................... $19.64 ..................... $19.63 Financial Activities ............................................................................. $24.42 .......................... $24.91 ..................... $25.07 Professional and Business Services ............................................... $26.81 .......................... $26.43 ..................... $27.00 Educational and Health Services ...................................................... $21.94 .......................... $22.29 ..................... $22.49 Leisure and Hospitality ..................................................................... $12.14 .......................... $12.02 ..................... $11.67 Other Services ................................................................................... $17.66 .......................... $17.84 ..................... $17.63
Read more about the hours and earnings series at http://www.bls.gov/sae/saeaepp.htm
Source: Georgia Department of Labor, Workforce Information & Analysis
11
Georgia MSA Hours and Earnings
All Employee Total Private
Average Weekly Earnings
Preliminary NOV 2010
Revised OCT 2010
Revised NOV 2009
Albany MSA ............................................................................................ $500.33 ........................ $507.86 ................... $524.40 Athens-Clarke County MSA ................................................................... $675.70 ........................ $675.02 ................... $704.41 Atlanta MSA ............................................................................................ $845.91 ........................ $844.51 ................... $833.84 Augusta-Richmond County MSA ........................................................... $706.46 ........................ $723.54 ................... $735.71 Brunswick MSA ...................................................................................... $490.75 ........................ $484.84 ................... $553.55 Columbus MSA ..................................................................................... $561.78 ........................ $577.61 ................... $582.29 Dalton MSA ............................................................................................ $559.92 ........................ $551.77 ................... $616.51 Gainesville MSA .................................................................................... $832.65 ........................ $859.19 ................... $825.36 Hinesville-Fort Stewart MSA .................................................................. $498.78 ........................ $454.58 ................... $524.89 Macon MSA ............................................................................................ $756.76 ........................ $764.48 ................... $838.83 Rome MSA ............................................................................................ $741.85 ........................ $731.80 ................... $770.97 Savannah MSA ...................................................................................... $690.50 ........................ $676.56 ................... $692.27 Valdosta MSA ......................................................................................... $523.38 ........................ $510.56 ................... $570.22 Warner Robins MSA .............................................................................. $660.81 ........................ $646.81 ................... $662.59
Average Weekly Hours
Preliminary NOV 2010
Revised OCT 2010
Revised NOV 2009
Albany MSA ................................................................................................... 33.4 .............................. 33.7 ......................... 34.5 Athens-Clarke County MSA .......................................................................... 33.6 .............................. 33.6 ......................... 33.4 Atlanta MSA ................................................................................................... 35.1 .............................. 35.1 ......................... 34.7 Augusta-Richmond County MSA .................................................................. 37.3 .............................. 37.2 ......................... 38.1 Brunswick MSA ............................................................................................. 31.6 .............................. 31.0 ......................... 32.6 Columbus MSA ............................................................................................33.7 .............................. 34.3 ......................... 33.6 Dalton MSA ................................................................................................... 34.1 .............................. 34.9 ......................... 33.8 Gainesville MSA ...........................................................................................36.6 .............................. 37.8 ......................... 38.0 Hinesville-Fort Stewart MSA .........................................................................35.2 .............................. 31.9 ......................... 39.2 Macon MSA ................................................................................................... 39.6 .............................. 39.9 ......................... 40.7 Rome MSA ................................................................................................... 35.7 .............................. 36.7 ......................... 37.7 Savannah MSA ............................................................................................. 34.2 .............................. 33.1 ......................... 34.7 Valdosta MSA ................................................................................................ 30.5 .............................. 31.4 ......................... 31.4 Warner Robins MSA .....................................................................................35.7 .............................. 34.7 ......................... 35.7
Average Hourly Earnings
Preliminary NOV 2010
Revised OCT 2010
Revised NOV 2009
Albany MSA .............................................................................................. $14.98 .......................... $15.07 ..................... $15.20 Athens-Clarke County MSA ...................................................................... $20.11 .......................... $20.09 ..................... $21.09 Atlanta MSA .............................................................................................. $24.10 .......................... $24.06 ..................... $24.03 Augusta-Richmond County MSA ............................................................. $18.94 .......................... $19.45 ..................... $19.31 Brunswick MSA ........................................................................................ $15.53 .......................... $15.64 ..................... $16.98 Columbus MSA ....................................................................................... $16.67 .......................... $16.84 ..................... $17.33 Dalton MSA .............................................................................................. $16.42 .......................... $15.81 ..................... $18.24 Gainesville MSA ...................................................................................... $22.75 .......................... $22.73 ..................... $21.72 Hinesville-Fort Stewart MSA .................................................................... $14.17 .......................... $14.25 ..................... $13.39 Macon MSA ............................................................................................... $19.11 .......................... $19.16 ..................... $20.61 Rome MSA .............................................................................................. $20.78 .......................... $19.94 ..................... $20.45 Savannah MSA ........................................................................................ $20.19 .......................... $20.44 ..................... $19.95 Valdosta MSA ........................................................................................... $17.16 .......................... $16.26 ..................... $18.16 Warner Robins MSA ................................................................................ $18.51 .......................... $18.64 ..................... $18.56
Read more about the hours and earnings series at http://www.bls.gov/sae/saeaepp.htm
Source: Georgia Department of Labor, Workforce Information & Analysis
12
Dimensions - Measuring Georgia's Labor Force
Unemployment rates -- Georgia and U.S.
11.0%
10.0%
9.0%
8.0%
7.0%
Ge orgia
U.S.
6.0%
Nov Dec Jan Feb Mar Apr May Jun Jul Aug Sep Oct Nov
2009
2010
WA 9.2
OR
10.6
ID
9.4
NV
14.3
UT
CA
7.5
12.4
AZ 9.4
AK 8.0
State unemployment rates
November 2010
National Unemployment Rate: 9.8% Rates are seasonally adjusted
MT 7.2
WY 6.6
CO 8.6
NM 8.5
ND 3.8
SD 4.5
NE 4.6
KS 6.8
MN 7.1
WI 7.6
IA 6.6
IL 9.6
MO 9.4
OK 6.9
TX 8.2
AR 7.9
MS 9.9
LA 8.2
NH
5.4 ME
VT
7.3
5.7
MI 12.4
OH
IN
9.8
9.8
KY 10.2
TN 9.4
PA 8.6
WV
9.3
VA
6.8
NC 9.7
SC 10.6
AL
GA
9.0
10.1
FL 12.0
MA 8.2 NY 8.3
RI 11.6 CT NJ 9.0 9.2 DE 8.4 DC 9.8
MD 7.4
Unemployment rate 10.0% or greater 7.0% to 9.9% 6.0% to 6.9% 5.0% to 5.9% 4.0% to 4.9% 3.0% to 3.9%
HI 6.4
13
Georgia Labor Force Estimates (not seasonally adjusted) Place of Residence - Persons 16 Years and Older
Georgia
(Seasonally adjusted)
Georgia
(Not Seasonally adjusted)
Albany MSA
Athens-Clarke County MSA
Atlanta MSA
Augusta-Richmond County MSA
Brunswick MSA
Columbus MSA
Dalton MSA
Gainesville MSA
Employment Status
Civilian labor force Employed Unemployed Rate
Civilian labor force Employed Unemployed Rate
Civilian labor force Employed Unemployed Rate
Civilian labor force Employed Unemployed Rate
Civilian labor force Employed Unemployed Rate
Civilian labor force Employed Unemployed Rate
Civilian labor force Employed Unemployed Rate
Civilian labor force Employed Unemployed Rate
Civilian labor force Employed Unemployed Rate
Civilian labor force Employed Unemployed Rate
NOV 2010
4,665,587 4,195,885
469,702 10.1
4,679,515 4,197,320
482,195 10.3
76,087 67,854
8,233 10.8
104,357 96,439 7,918 7.6
2,659,105 2,385,887
273,218 10.3
257,876 234,490
23,386 9.1
51,181 46,025
5,156 10.1
127,787 115,539 12,248
9.6
61,087 52,997
8,090 13.2
87,086 78,892
8,194 9.4
OCT 2010
4,658,894 4,201,359
457,535 9.8
4,653,253 4,208,205
445,048 9.6
75,547 67,919
7,628 10.1
104,291 96,827 7,464 7.2
2,637,227 2,384,499
252,728 9.6
257,108 235,126
21,982 8.5
50,918 46,191
4,727 9.3
127,399 115,995
11,404 9.0
60,286 53,335
6,951 11.5
87,298 79,682
7,616 8.7
NOV 2009
4,708,922 4,228,774
480,148 10.2
4,717,396 4,251,350
466,046 9.9
75,976 68,229
7,747 10.2
105,944 98,140 7,804 7.4
2,673,756 2,407,501
266,255 10.0
257,743 233,968
23,775 9.2
52,221 47,572
4,649 8.9
126,850 115,001
11,849 9.3
62,729 54,836
7,893 12.6
88,325 80,253
8,072 9.1
Change From
OCT 2010
NOV 2009
6,693 -5,474 12,167
-43,335 -32,889 -10,446
26,262 -10,885 37,147
-37,881 -54,030 16,149
540
111
-65
-375
605
486
66 -388 454
-1,587 -1,701
114
21,878 1,388
20,490
-14,651 -21,614
6,963
768 -636 1,404
133 522 -389
263 -166 429
-1,040 -1,547
507
388
937
-456
538
844
399
801 -338 1,139
-1,642 -1,839
197
-212 -790 578
-1,239 -1,361
122
Note: MSA data are not seasonally adjusted. Employment includes nonagricultural wage and salary employment, self-employment, unpaid family and private
household workers and agricultural workers. Persons in labor disputes are counted as employed. The use of unrounded data does not imply that the numbers are exact. Georgia and Metropolitan Statistical Area data have not been seasonally adjusted.
Albany MSA: Baker, Dougherty, Lee, Terrell, and Worth counties. Athens - Clarke County MSA: Clarke, Madison, Oconee, and Oglethorpe counties. Atlanta MSA: Barrow, Bartow, Butts, Carroll, Cherokee, Clayton, Cobb, Coweta, Dawson, DeKalb, Douglas, Fayette, Forsyth, Fulton, Gwinnett, Haralson, Heard, Henry, Jasper, Lamar, Meriwether, Newton, Paulding, Pickens, Pike, Rockdale, Spalding, and Walton counties. Augusta - Richmond County MSA: Burke, Columbia, McDuffie, and Richmond counties in Georgia and Aiken and Edgefield counties in South Carolina. Brunswick MSA: Brantley, Glynn, and McIntosh counties. Columbus MSA: Chattahoochee, Harris, Marion, and Muscogee counties in Georgia and Russell County in Alabama. Dalton MSA: Murray and Whitfield counties. Gainesville MSA: Hall County. Hinesville - Fort Stewart MSA: Liberty and Long counties. Macon MSA: Bibb, Crawford, Jones, Monroe, and Twiggs counties. Rome MSA: Floyd County. Savannah MSA: Bryan, Chatham, and Effingham counties. Valdosta MSA: Brooks, Echols, Lanier, and Lowndes counties. Warner Robins MSA: Houston County.
Source: Georgia Department of Labor, Workforce Information & Analysis
14
Georgia Labor Force Estimates (not seasonally adjusted) Place of Residence - Persons 16 Years and Older
Hinesville-Ft. Stewart MSA Macon MSA
Rome MSA Savannah MSA
Valdosta MSA Warner Robins MSA
Employment Status
Civilian labor force Employed Unemployed Rate
Civilian labor force Employed Unemployed Rate
Civilian labor force Employed Unemployed Rate
Civilian labor force Employed Unemployed Rate
Civilian labor force Employed Unemployed Rate
Civilian labor force Employed Unemployed Rate
NOV 2010
32,888 30,109
2,779 8.4
111,539 99,950 11,589
10.4
48,872 43,663
5,209 10.7
176,158 160,542
15,616 8.9
66,422 60,617
5,805 8.7
69,642 64,156
5,486 7.9
OCT 2010
32,593 29,995
2,598 8.0
110,254 99,486 10,768
9.8
48,457 43,686
4,771 9.8
174,453 160,032
14,421 8.3
66,542 61,228
5,314 8.0
69,642 64,502
5,140 7.4
NOV 2009
32,396 29,980
2,416 7.5
113,529 102,623
10,906 9.6
49,393 44,276
5,117 10.4
174,694 160,500
14,194 8.1
67,188 61,458
5,730 8.5
70,405 65,501
4,904 7.0
Change From
OCT 2010
NOV 2009
295
492
114
129
181
363
1,285 464 821
-1,990 -2,673
683
415
-521
-23
-613
438
92
1,705 510
1,195
1,464 42
1,422
-120 -611 491
-766 -841
75
-346 346
-763 -1,345
582
United States Labor Force Estimates Place of Residence - Persons 16 Years and Older
Area
United States
(Seasonally adjusted)
Employment Status
Civilian labor force Employed Unemployed Rate
NOV 2010
154,007,000 13,888,000 15,119,000 9.8
OCT 2010
153,904,000 139,061,000
14,843,000 9.6
NOV 2009
153,720,000 138,381,000
15,340,000 10.0
Change From
OCT 2010
NOV 2009
103,000 -125,173,000
276,000
287,000 -124,493,000
-221,000
United States
(Not Seasonally adjusted)
Civilian labor force Employed Unemployed
Rate
153,698,000 139,415,000
14,282,000 9.3
153,652,000 139,749,000
13,903,000 9.0
153,539,000 139,132,000
14,407,000 9.4
46,000 -334,000 379,000
159,000 283,000 -125,000
Note: Employment includes nonagricultural wage and salary employment, self-employment, unpaid family and private household workers and agricultural
workers. Persons in labor disputes are counted as employed. The use of unrounded data does not imply that the numbers are exact. Georgia and Metropolitan Statistical Area data have not been seasonally adjusted. Seasonally adjusted data for Georgia available upon request.
Albany MSA: Baker, Dougherty, Lee, Terrell, and Worth counties. Athens - Clarke County MSA: Clarke, Madison, Oconee, and Oglethorpe counties. Atlanta MSA: Barrow, Bartow, Butts, Carroll, Cherokee, Clayton, Cobb, Coweta, Dawson, DeKalb, Douglas, Fayette, Forsyth, Fulton, Gwinnett, Haralson, Heard, Henry, Jasper, Lamar, Meriwether, Newton, Paulding, Pickens, Pike, Rockdale, Spalding, and Walton counties. Augusta - Richmond County MSA: Burke, Columbia, McDuffie, and Richmond counties in Georgia and Aiken and Edgefield counties in South Carolina. Brunswick MSA: Brantley, Glynn, and McIntosh counties. Columbus MSA: Chattahoochee, Harris, Marion, and Muscogee counties in Georgia and Russell County in Alabama. Dalton MSA: Murray and Whitfield counties. Gainesville MSA: Hall County. Hinesville - Fort Stewart MSA: Liberty and Long counties. Macon MSA: Bibb, Crawford, Jones, Monroe, and Twiggs counties. Rome MSA: Floyd County. Savannah MSA: Bryan, Chatham, and Effingham counties. Valdosta MSA: Brooks, Echols, Lanier, and Lowndes counties. Warner Robins MSA: Houston County.
Source: Georgia Department of Labor, Workforce Information & Analysis
15
Georgia Labor Force Estimates by County (not seasonally adjusted)
Georgia
Place of Residence - Persons 16 Years and Older
November 2010
October 2010
Labor Force
Employment
Unemployment Number Rate
4,679,515 4,197,320 482,195 10.3
Labor Force
Employment
Unemployment Number Rate
4,653,253 4,208,205 445,048 9.6
Appling Atkinson Bacon Baker Baldwin
9,072 2,953 4,515 1,640 18,351
8,045 2,505 4,054 1,482 15,682
1,027 11.3 448 15.2 461 10.2 158 9.6
2,669 14.5
9,196 2,990 4,601 1,630 18,419
8,250 2,579 4,184 1,483 15,836
946 10.3 411 13.7 417 9.1 147 9.0 2,583 14.0
Banks Barrow Bartow Ben Hill Berrien
9,808 33,839 45,352
6,915 7,736
9,090 30,403 40,037
5,828 6,753
718 7.3 3,436 10.2 5,315 11.7 1,087 15.7
983 12.7
9,808 33,658 44,904
6,949 7,803
9,138 30,385 40,013
5,976 6,921
670 6.8 3,273 9.7 4,891 10.9
973 14.0 882 11.3
Bibb Bleckley Brantley Brooks Bryan
73,425 5,432 7,163 7,996
16,624
65,502 4,711 6,393 7,279
15,266
7,923 10.8 721 13.3 770 10.7 717 9.0
1,358 8.2
72,593 5,468 7,148 7,957
16,446
65,197 4,787 6,416 7,352
15,218
7,396 10.2 681 12.5 732 10.2 605 7.6
1,228 7.5
Bulloch Burke Butts Calhoun Camden
32,024 9,827 10,114 2,283
19,471
28,931 8,699 8,885 2,050
17,539
3,093 9.7 1,128 11.5 1,229 12.2
233 10.2 1,932 9.9
31,926 9,726 9,959 2,335
19,299
28,971 8,716 8,880 2,122
17,520
2,955 9.3 1,010 10.4 1,079 10.8
213 9.1 1,779 9.2
Candler Carroll Catoosa Charlton Chatham
4,184 3,757
427 10.2
51,924 46,210 5,714 11.0
33,979 31,162 2,817 8.3
4,273 3,765
508 11.9
131,206 119,277 11,929 9.1
4,237 51,269 33,745
4,274 129,960
3,842 46,183 31,125
3,812 118,898
395 9.3 5,086 9.9 2,620 7.8
462 10.8 11,062 8.5
Chattahoochee 2,552
Chattooga
10,366
Cherokee
107,175
Clarke
63,025
Clay
1,412
2,116 9,124 97,801 58,248 1,280
436 17.1 1,242 12.0 9,374 8.7 4,777 7.6
132 9.3
2,518 10,318 106,424 62,989
1,462
2,125 9,168 97,744 58,482 1,336
393 15.6 1,150 11.1 8,680 8.2 4,507 7.2
126 8.6
Clayton Clinch Cobb Coffee Colquitt
132,914 115,946 16,968 12.8
2,704 2,351
353 13.1
366,264 330,930 35,334 9.6
15,020 12,377 2,643 17.6
20,043 18,118 1,925 9.6
131,336 115,879 15,457 11.8
2,745 2,428
317 11.5
363,737 330,737 33,000 9.1
15,227 12,741 2,486 16.3
20,643 18,760 1,883 9.1
Columbia Cook Coweta Crawford Crisp
59,644 6,626
58,840 6,093 9,227
55,284 5,747
53,180 5,459 7,970
4,360 7.3 879 13.3
5,660 9.6 634 10.4
1,257 13.6
59,334 6,668
58,154 6,058 9,273
55,388 5,862
53,149 5,433 8,090
3,946 6.7 806 12.1
5,005 8.6 625 10.3
1,183 12.8
November 2009
Labor Force
Employment
Unemployment Number Rate
4,717,396 4,251,350 466,046 9.9
9,074 3,169 4,514 1,632 20,404
8,176 2,694 4,108 1,490 17,618
898 9.9 475 15.0 406 9.0 142 8.7 2,786 13.7
10,314 34,193 46,118
6,993 7,896
9,572 30,678 40,399
5,862 6,843
742 7.2 3,515 10.3 5,719 12.4 1,131 16.2 1,053 13.3
74,450 5,359 7,372 8,096
16,537
67,253 4,780 6,608 7,380
15,262
7,197 9.7 579 10.8 764 10.4 716 8.8
1,275 7.7
32,790 9,849
10,232 2,298
20,079
29,931 8,715 8,965 2,047
18,309
2,859 8.7 1,134 11.5 1,267 12.4
251 10.9 1,770 8.8
4,149 52,178 33,915
4,351 130,004
3,782 46,628 31,058
3,929 119,246
367 8.8 5,550 10.6 2,857 8.4
422 9.7 10,758 8.3
2,526 10,285 108,358 64,016
1,393
2,126 9,076 98,687 59,275 1,287
400 15.8 1,209 11.8 9,671 8.9 4,741 7.4
106 7.6
133,091 2,825
367,488 16,030 19,989
116,997 2,523
333,928 13,310 18,169
16,094 12.1 302 10.7
33,560 9.1 2,720 17.0 1,820 9.1
59,539 6,739
59,385 6,253 9,524
55,386 5,872
53,662 5,605 8,423
4,153 7.0 867 12.9
5,723 9.6 648 10.4
1,101 11.6
16
Georgia Labor Force Estimates by County (not seasonally adjusted)
Dade Dawson Decatur DeKalb Dodge
Place of Residence - Persons 16 Years and Older
November 2010
October 2010
Labor Force
Employment
Unemployment Number Rate
Labor Force
Employment
Unemployment Number Rate
7,995 7,318
677 8.5
10,955 9,833 1,122 10.2
11,429 9,922 1,507 13.2
377,604 337,905 39,699 10.5
8,858 7,708 1,150 13.0
7,943 7,309
634 8.0
10,865 9,828 1,037 9.5
11,608 10,243 1,365 11.8
374,832 337,708 37,124 9.9
8,854 7,804 1,050 11.9
Dooly Dougherty Douglas Early Echols
4,756 42,177 64,283
5,422 2,097
4,168 37,140 57,027
4,915 1,949
588 12.4 5,037 11.9 7,256 11.3
507 9.4 148 7.1
4,861 41,832 63,475
5,556 2,097
4,308 37,175 56,994
5,085 1,969
553 11.4 4,657 11.1 6,481 10.2
471 8.5 128 6.1
Effingham Elbert Emanuel Evans Fannin
28,328 9,334 9,812 4,764
10,718
25,998 8,020 8,643 4,332 9,574
2,330 8.2 1,314 14.1 1,169 11.9
432 9.1 1,144 10.7
28,046 9,304 9,918 4,824
10,652
25,916 8,104 8,783 4,419 9,622
2,130 7.6 1,200 12.9 1,135 11.4
405 8.4 1,030 9.7
Fayette Floyd Forsyth Franklin Fulton
50,757 46,379 4,378 8.6 48,872 43,663 5,209 10.7 84,356 77,397 6,959 8.2
9,344 8,213 1,131 12.1 478,287 427,422 50,865 10.6
50,324 46,352 3,972 7.9 48,457 43,686 4,771 9.8 83,745 77,352 6,393 7.6
9,403 8,340 1,063 11.3 474,522 427,173 47,349 10.0
Gilmer Glascock Glynn Gordon Grady
13,320 1,105
38,824 24,724 11,229
11,944 966
35,055 21,685 10,179
1,376 10.3 139 12.6
3,769 9.7 3,039 12.3 1,050 9.4
13,343 1,104
38,618 24,504 11,391
12,075 978
35,181 21,693 10,448
1,268 9.5 126 11.4
3,437 8.9 2,811 11.5
943 8.3
Greene Gwinnett Habersham Hall Hancock
7,088 6,293
795 11.2
406,762 369,281 37,481 9.2
19,227 17,302 1,925 10.0
87,086 78,892 8,194 9.4
3,098 2,358
740 23.9
7,156 6,414
742 10.4
404,024 369,066 34,958 8.7
19,325 17,571 1,754 9.1
87,298 79,682 7,616 8.7
2,990 2,381
609 20.4
Haralson Harris Hart Heard Henry
12,574 15,907
9,657 4,782 95,639
11,115 14,753
8,509 4,213 85,672
1,459 11.6 1,154 7.3 1,148 11.9
569 11.9 9,967 10.4
12,488 15,835
9,670 4,724 94,712
11,108 14,817
8,593 4,211 85,622
1,380 11.1 1,018 6.4 1,077 11.1
513 10.9 9,090 9.6
Houston Irwin Jackson Jasper Jeff Davis
69,642 3,859
26,885 6,394 5,135
64,156 3,309
24,037 5,575 4,326
5,486 7.9 550 14.3
2,848 10.6 819 12.8 809 15.8
69,642 3,889
26,752 6,336 5,210
64,502 3,393 24,117 5,572 4,480
5,140 7.4 496 12.8
2,635 9.8 764 12.1 730 14.0
November 2009
Labor Force
Employment
Unemployment Number Rate
8,013 10,916 12,001 379,646
9,003
7,294 9,923 10,561 340,966 8,039
719 9.0 993 9.1 1,440 12.0 38,680 10.2 964 10.7
4,691 42,017 64,482
5,472 2,127
4,259 37,345 57,544
4,904 1,976
432 9.2 4,672 11.1 6,938 10.8
568 10.4 151 7.1
28,153 10,036 10,292
4,825 10,619
25,992 8,900 9,201 4,414 9,586
2,161 7.7 1,136 11.3 1,091 10.6
411 8.5 1,033 9.7
50,925 49,393 84,908
9,847 479,748
46,799 44,276 78,098
8,688 431,294
4,126 8.1 5,117 10.4 6,810 8.0 1,159 11.8 48,454 10.1
13,381 1,119
39,592 24,520 11,327
12,046 989
36,233 21,315 10,246
1,335 10.0 130 11.6
3,359 8.5 3,205 13.1 1,081 9.5
7,384 409,242
19,805 88,325
3,404
6,582 372,626
17,939 80,253
2,649
802 10.9 36,616 8.9
1,866 9.4 8,072 9.1
755 22.2
12,650 15,919 10,164
4,825 95,920
11,216 14,822
8,895 4,252 86,448
1,434 11.3 1,097 6.9 1,269 12.5
573 11.9 9,472 9.9
70,405 3,896
26,737 6,498 5,151
65,501 3,328
23,861 5,626 4,457
4,904 7.0 568 14.6
2,876 10.8 872 13.4 694 13.5
17
Georgia Labor Force Estimates by County (not seasonally adjusted)
Jefferson Jenkins Johnson Jones Lamar
Place of Residence - Persons 16 Years and Older
November 2010
October 2010
Labor Force
6,659 2,403 3,498 14,036 7,740
Employment
Unemployment Number Rate
5,727 1,970 3,055 12,707 6,773
932 14.0 433 18.0 443 12.7 1,329 9.5 967 12.5
Labor Force
6,634 2,459 3,434 13,804 7,662
Employment
Unemployment Number Rate
5,773 2,056 3,077 12,648 6,769
861 13.0 403 16.4 357 10.4 1,156 8.4 893 11.7
Lanier Laurens Lee Liberty Lincoln
4,042 21,450 17,753 26,237
3,755
3,656 18,632 16,291 23,894
3,344
386 9.5 2,818 13.1 1,462 8.2 2,343 8.9
411 10.9
4,055 21,414 17,648 25,968
3,770
3,693 18,762 16,307 23,803
3,392
362 8.9 2,652 12.4 1,341 7.6 2,165 8.3
378 10.0
Long Lowndes Lumpkin McDuffie McIntosh
6,651 52,287 12,629 10,554
5,194
6,215 47,733 11,287
9,477 4,577
436 6.6 4,554 8.7 1,342 10.6 1,077 10.2
617 11.9
6,625 52,434 12,594 10,419
5,152
6,192 48,214 11,344
9,495 4,594
433 6.5 4,220 8.0 1,250 9.9
924 8.9 558 10.8
Macon Madison Marion Meriwether Miller
5,062 15,648
3,283 9,261 3,458
4,363 14,357
2,952 8,123 3,203
699 13.8 1,291 8.3
331 10.1 1,138 12.3
255 7.4
5,124 15,634
3,258 9,140 3,600
4,461 14,414
2,964 8,118 3,362
663 12.9 1,220 7.8
294 9.0 1,022 11.2
238 6.6
Mitchell Monroe Montgomery Morgan Murray
10,006 13,370
4,364 8,834 18,604
8,977 12,179
3,868 7,989 16,241
1,029 10.3 1,191 8.9
496 11.4 845 9.6 2,363 12.7
10,162 13,233
4,462 8,872 18,507
9,192 12,123
3,978 8,082 16,345
970 9.5 1,110 8.4
484 10.8 790 8.9 2,162 11.7
Muscogee Newton Oconee Oglethorpe Paulding
84,431 46,140 18,017
7,667 66,065
76,282 40,531 16,810
7,024 59,166
8,149 9.7 5,609 12.2 1,207 6.7
643 8.4 6,899 10.4
84,078 45,671 18,015
7,652 65,470
76,609 40,508 16,878
7,052 59,132
7,469 8.9 5,163 11.3 1,137 6.3
600 7.8 6,338 9.7
Peach Pickens Pierce Pike Polk
12,000 14,920
8,544 7,973 20,335
10,576 13,386
7,690 7,091 18,206
1,424 11.9 1,534 10.3
854 10.0 882 11.1 2,129 10.5
11,991 14,741
8,597 7,869 20,229
10,635 13,378
7,797 7,087 18,260
1,356 11.3 1,363 9.2
800 9.3 782 9.9 1,969 9.7
Pulaski Putnam Quitman Rabun Randolph
4,330 9,717
980 6,545 2,632
3,893 8,525
850 5,776 2,263
437 10.1 1,192 12.3
130 13.3 769 11.7 369 14.0
4,344 9,607
987 6,542 2,715
3,952 8,621
863 5,850 2,362
392 9.0 986 10.3 124 12.6 692 10.6 353 13.0
November 2009
Labor Force
Employment
Unemployment Number Rate
6,893 2,630 3,598 14,301 7,922
5,908 2,119 3,191 13,046 6,834
985 14.3 511 19.4 407 11.3 1,255 8.8 1,088 13.7
4,064 21,807 17,751 25,825
3,868
3,707 19,457 16,381 23,792
3,447
357 8.8 2,350 10.8 1,370 7.7 2,033 7.9
421 10.9
6,571 52,901 13,130 10,788
5,256
6,188 48,395 11,714
9,495 4,731
383 5.8 4,506 8.5 1,416 10.8 1,293 12.0
525 10.0
5,165 15,982
3,301 9,431 3,626
4,491 14,610
2,965 8,197 3,339
674 13.0 1,372 8.6
336 10.2 1,234 13.1
287 7.9
10,162 13,783
4,377 9,090 19,196
9,132 12,505
3,991 8,188 16,805
1,030 10.1 1,278 9.3
386 8.8 902 9.9 2,391 12.5
84,130 46,556 18,155
7,791 66,529
76,638 40,898 17,107
7,148 59,702
7,492 8.9 5,658 12.2 1,048 5.8
643 8.3 6,827 10.3
12,088 15,075
8,238 8,036 20,998
10,838 13,507
7,517 7,156 18,778
1,250 10.3 1,568 10.4
721 8.8 880 11.0 2,220 10.6
4,302 10,237
965 6,962 2,673
3,977 9,034
847 6,255 2,357
325 7.6 1,203 11.8
118 12.2 707 10.2 316 11.8
18
Georgia Labor Force Estimates by County (not seasonally adjusted)
Richmond Rockdale Schley Screven Seminole
Spalding Stephens Stewart Sumter Talbot
Taliaferro Tattnall Taylor Telfair Terrell
Thomas Tift Toombs Towns Treutlen
Troup Turner Twiggs Union Upson
Walker Walton Ware Warren Washington
Wayne Webster Wheeler White Whitfield
Wilcox Wilkes Wilkinson Worth
Place of Residence - Persons 16 Years and Older
November 2010
October 2010
Labor Force
Employment
Unemployment Number Rate
Labor Force
Employment
Unemployment Number Rate
91,298 39,631
1,754 6,854 3,907
81,590 34,919
1,503 5,929 3,510
9,708 10.6 4,712 11.9
251 14.3 925 13.5 397 10.2
90,630 39,292
1,751 6,878 3,970
81,744 34,899
1,518 6,008 3,600
8,886 9.8 4,393 11.2
233 13.3 870 12.6 370 9.3
28,019 12,947
2,267 13,358
3,042
24,359 11,560 2,020 11,651 2,782
3,660 13.1 1,387 10.7
247 10.9 1,707 12.8
260 8.5
27,710 12,920
2,288 13,380
3,046
24,345 11,644 2,060 11,771 2,806
3,365 12.1 1,276 9.9
228 10.0 1,609 12.0
240 7.9
796 9,089 3,506 4,384 4,396
690 8,231 3,034 3,397 3,911
106 13.3 858 9.4 472 13.5 987 22.5 485 11.0
802 9,397 3,492 4,337 4,378
703 8,595 3,071 3,468 3,915
99 12.3 802 8.5 421 12.1 869 20.0 463 10.6
20,298 18,500 13,417
5,636 2,829
18,345 16,228 11,937
5,133 2,464
1,953 9.6 2,272 12.3 1,480 11.0
503 8.9 365 12.9
20,354 18,606 13,571
5,769 2,816
18,559 16,520 12,276
5,298 2,473
1,795 8.8 2,086 11.2 1,295 9.5
471 8.2 343 12.2
30,703 4,327 4,617 10,833 11,338
27,084 3,736 4,104 9,884 9,932
3,619 11.8 591 13.7 513 11.1 949 8.8
1,406 12.4
30,454 4,400 4,567
10,873 11,286
27,156 3,882 4,085 9,997 9,981
3,298 10.8 518 11.8 482 10.6 876 8.1
1,305 11.6
32,009 40,540 15,019
2,447 7,517
28,670 36,328 13,293
2,058 6,372
3,339 10.4 4,212 10.4 1,726 11.5
389 15.9 1,145 15.2
31,721 40,183 14,991
2,473 7,511
28,635 36,307 13,478
2,105 6,452
3,086 9.7 3,876 9.6 1,513 10.1
368 14.9 1,059 14.1
11,949 1,164 2,840 11,871 42,483
10,443 1,037 2,491
10,677 36,756
1,506 12.6 127 10.9 349 12.3
1,194 10.1 5,727 13.5
11,831 1,162 2,864 11,967 41,779
10,471 1,058 2,553
10,872 36,990
1,360 11.5 104 9.0 311 10.9
1,095 9.2 4,789 11.5
3,082 4,305 4,248 10,120
2,671 3,781 3,733 9,030
411 13.3 524 12.2 515 12.1 1,090 10.8
3,112 4,319 4,423 10,058
2,742 3,832 3,952 9,039
370 11.9 487 11.3 471 10.6 1,019 10.1
November 2009
Labor Force
Employment
Unemployment Number Rate
90,897 39,813
1,814 7,076 3,986
81,741 35,235
1,590 6,161 3,583
9,156 10.1 4,578 11.5
224 12.3 915 12.9 403 10.1
28,676 13,079
2,311 14,207
3,058
24,580 11,656 2,073 12,322 2,795
4,096 14.3 1,423 10.9
238 10.3 1,885 13.3
263 8.6
876 9,032 3,526 4,330 4,403
721 8,248 3,107 3,645 3,933
155 17.7 784 8.7 419 11.9 685 15.8 470 10.7
21,166 18,175 13,671
5,636 2,953
19,250 16,197 12,316
5,181 2,612
1,916 9.1 1,978 10.9 1,355 9.9
455 8.1 341 11.5
29,332 4,550 4,742
10,878 12,363
25,718 3,976 4,214 9,889
10,822
3,614 12.3 574 12.6 528 11.1 989 9.1
1,541 12.5
31,653 40,919 14,638
2,580 7,935
28,574 36,657 12,995
2,119 6,779
3,079 9.7 4,262 10.4 1,643 11.2
461 17.9 1,156 14.6
11,995 1,201 2,833 12,085 43,533
10,618 1,081 2,566
10,939 38,031
1,377 11.5 120 10.0 267 9.4
1,146 9.5 5,502 12.6
3,186 4,514 4,669 10,172
2,840 3,989 4,132 9,080
346 10.9 525 11.6 537 11.5 1,092 10.7
19
New Developments
Bioworks, a German-based company that designs, manufactures, and oversees installation of wastewater treatment plants in Asia, Africa and Europe has opened an office in Bryan County. The Richmond Hill office plans to hire 20 new employees in the near future. Although the company has potential clients in the U S the current plans are to manufacture wastewater treatment system control panels and export them to other countries.
Fulton County's North Point Mall will be getting another anchor store based in the Midwest. Von Maur, a family owned chain with 25 stores, plans to open a store in November of 2011. The store would normally employ 230 and more during the holiday period. This location would serve as the company's flagship store in the south. The store is a mid to high end customer service oriented retailer.
A distribution center and manufacturing operation in Monroe County has been announced by Ohiobased Encore Plastics Corporation. The company will locate near Forsyth, makes and distributes an assortment of paint related packaging items along with a full line of industrial pails. The operation is scheduled to be up and running early in 2011 with around 25 employees but the company is anticipating expansion that would bring the total employment to around 100.
A power boat manufacturer plans to begin production in Sumter County and have finished products coming off the assembly line early next year. Caravelle Powerboats was acquired by Sak Marine Company, LLC who had planned to move the closed facility. However, local officials were able to convince the new owners to make use of the local workforce. Once the company is fully operational they will employ 150 people.
Gulfstream Aerospace has announced an expansion to their Chatham County facilities that will include an investment of at least $500 million and the creation of 1,000 new jobs. The seven year plan calls for the expanding their jet calls for expanding their jet production and maintenance facilities at the Savannah-Hilton Head International Airport and renovating several existing facilities at their main Savannah campus. The reasoning behind the expansion is to better position the company to meet a projected increase for new business-jet aircraft as well as the ability to service and maintain the larger fleet.
By the end of 2011 JCB plans to add 200 jobs to its manufacturing plant in Chatham County. The company is the world's third largest construction equipment producer and has been in business for 65 years. The Savannah manufacturing plant is now producing a new line of skid steer and compact truck loaders. The design for this new equipment is concentrated on cost efficiency, safety, productivity, and serviceability.
The continued surge in internet shopping has prompting Macy's, Inc. to expand its Fulton County technology campus. The department store chain was one of the first to embrace the online business more than a decade ago. Its technology division, Macy's Systems and Technology, Inc., is located in the northern part of the county in John's Creek. The increase in volume in this segment of the company's business will result in the addition of 160 new jobs.
In Gwinnett County a $20 million investment based on the mass production of a new product at Elesys North America, Inc. will create 150 new jobs. The company is a Honda subsidiary located in Suwanee and manufactures automotive safety electronic systems, including passenger sensing systems for safer air bag deployment and vehicle stability controls that prevent over steering. The new product is an electronic power steering control that assists with power steering. Production will begin in January of 2011.
SKC, located in Newton County, has announced plans to expand their Covington manufacturing plant. The company is investing $100 million to build a 200,000 square foot facility to produce ethylene vinyl acetate film to be used to coat solar power cells. The overall expansion is expected to create 120 new jobs. The company plans to begin hiring in April of 2011.
A factory in Wilkinson County is helping to improve the economy as they have recently added 40 new jobs and one of their suppliers has added positions as well. Carbo Ceramics is adding a fourth production line and sees the possibility for even more expansion. The plant manufactures propants which are tiny BB-sized balls used in the "hydraulic fracturing process" in oil wells and natural gas wells. The company uses Arcilla Mining to supply its kaolin and the expansion at Carbo has resulted in 20 new jobs at Arcilla.
20
Georgia Unemployment Rates by County
November 2010
Dade
Catoosa
Murray
Fannin
Towns
Union
Rabun
Whitfield Walker
Gilmer
White Habersham
Chattooga
Gordon
Pickens
Lumpkin
Stephens
Floyd
Dawson
Banks Franklin Hart
Bartow Cherokee Forsyth
Hall
14.0% or greater 12.0% to 13.9% 10.3% to 11.9%
Jackson Madison Elbert
Polk Haralson
Paulding Cobb
Barrow Gwinnett
DeKalb
Walton
Douglas Fulton
Rockdale
Clarke Oconee
Oglethorpe Wilkes
Lincoln
Carroll
Clayton
Newton Morgan Greene Taliaferro
Columbia
Fayette
Henry
McDuffie
Coweta Heard
Spalding Butts Jasper Putnam
Warren Hancock Glascock
Richmond
Less than 10.3%
Troup
Meriwether Pike Lamar Monroe
Jones Baldwin
Jefferson Washington
Burke
Upson
Harris
Talbot
Muscogee
Bibb Crawford
Taylor
Peach
Wilkinson Twiggs
Johnson
Jenkins Emanuel
Screven
Marion Chattahoochee
Macon
Schley
Stewart Webster Sumter
Quitman
Terrell Lee Randolph
Houston Bleckley
Laurens Treutlen
Candler Bulloch
Effingham
Dooly Crisp
Pulaski Wilcox
Dodge
Montgomery
Wheeler
Toombs
Telfair
Evans Tattnall
Bryan
Chatham
Turner
Ben Hill
Jeff Davis Appling
Liberty Long
Clay Calhoun Dougherty
Early
Baker
Miller
Mitchell
Worth
Irwin Tift
Coffee
Colquitt
Berrien Atkinson Cook
Seminole Decatur
Grady
Thomas
Brooks
Lanier
Clinch
Lowndes Echols
Bacon
Wayne
Pierce
Ware
Brantley
McIntosh Glynn
Charlton
Camden
Georgia's Unemployment Rate: 10.3%
(Not Seasonally Adjusted)
21
Georgia Unemployment Insurance Claims by County
County
November Average Average Initial Weekly Duration
Claims Benefit Weeks
County
November Average Average Initial Weekly Duration
Claims Benefit Weeks
Georgia
67,714 ...... $259 ..... 14.9
Appling
290 ...... $218 ..... 13.9
Atkinson
93 ...... $198 ..... 10.6
Bacon
105 ...... $203 ..... 11.5
Baker
12 ...... $181 ..... 14.8
Baldwin
333 ...... $183 ..... 18.9
Banks
129 ...... $230 ..... 15.5
Barrow
406 ...... $244 ..... 16.9
Bartow
844 ...... $243 ..... 14.5
Ben Hill
541 ...... $190 ..... 11.5
Berrien
222 ...... $216 ..... 11.4
Bibb
901 ...... $193 ..... 17.2
Bleckley
158 ...... $226 ..... 13.5
Brantley
144 ...... $210 ..... 14.7
Brooks
161 ...... $187 ..... 14.2
Bryan
155 ...... $245 ..... 14.3
Bulloch
317 ...... $211 ..... 13.2
Burke
192 ...... $196 ..... 13.1
Butts
150 ...... $213 ..... 16.1
Calhoun
32 ...... $166 ..... 14.0
Camden
206 ...... $217 ..... 16.0
Candler
72 ...... $219 ..... 12.5
Carroll
1,091 ...... $223 ..... 14.0
Catoosa
499 ...... $227 ..... 12.2
Charlton
60 ...... $222 ..... 12.1
Chatham
1,537 ...... $218 ..... 15.2
Chattahoochee 18 ...... $198 ..... 16.2
Chattooga
111 ...... $236 ..... 16.3
Cherokee
970 ...... $256 ..... 17.6
Clarke
592 ...... $207 ..... 16.1
Clay
29 ...... $205 ..... 13.1
Clayton
1,992 ...... $224 ..... 17.3
Clinch
45 ...... $175 ....... 7.7
Cobb
3,004 ...... $255 ..... 18.0
Coffee
482 ...... $202 ..... 12.5
Colquitt
282 ...... $214 ..... 14.1
Columbia
305 ...... $239 ..... 14.9
Cook
157 ...... $196 ..... 14.1
Coweta
965 ...... $234 ..... 16.5
Crawford
56 ...... $241 ..... 15.8
Crisp
197 ...... $205 ..... 15.8
Dade
51 ...... $226 ..... 14.2
Dawson
126 ...... $266 ..... 17.2
Decatur
177 ...... $195 ..... 15.6
DeKalb
3,748 ...... $232 ..... 17.7
Dodge
259 ...... $209 ..... 15.2
Dooly
85 ...... $239 ..... 12.4
Dougherty
560 ...... $190 ..... 17.9
Douglas
797 ...... $249 ..... 17.5
Early
44 ...... $202 ..... 16.7
Echols
17 ...... $185 ..... 13.3
Effingham
258 ...... $247 ..... 12.9
Elbert Emanuel Evans Fannin Fayette Floyd Forsyth Franklin Fulton Gilmer Glascock Glynn Gordon Grady Greene Gwinnett Habersham Hall Hancock Haralson Harris Hart Heard Henry Houston Irwin Jackson Jasper Jeff Davis Jefferson Jenkins Johnson Jones Lamar Lanier Laurens Lee Liberty Lincoln Long Lowndes Lumpkin Macon Madison Marion McDuffie McIntosh Meriwether Miller Mitchell Monroe Montgomery Morgan Murray
268 ...... $207 ..... 11.5 415 ...... $189 ..... 13.4
45 ...... $222 ..... 15.4 214 ...... $220 ..... 14.3 322 ...... $254 ..... 18.2 1,164 ...... $220 ..... 13.4 454 ...... $268 ..... 18.7 185 ...... $222 ..... 13.0 4,668 ...... $226 ..... 17.7 290 ...... $238 ..... 13.9
25 ...... $222 ..... 12.8 479 ...... $202 ..... 16.1 1,125 ...... $233 ..... 11.1 143 ...... $179 ..... 12.9 145 ...... $192 ..... 14.2 3,080 ...... $255 ..... 17.8 334 ...... $232 ..... 13.7 1,376 ...... $241 ..... 15.6 160 ...... $201 ..... 17.3 235 ...... $240 ..... 13.2 159 ...... $236 ..... 14.0 250 ...... $207 ..... 11.4 120 ...... $238 ..... 14.0 1,106 ...... $249 ..... 17.4 602 ...... $220 ..... 15.7 171 ...... $208 ..... 14.0 330 ...... $236 ..... 16.5 139 ...... $239 ..... 15.5 277 ...... $201 ..... 12.2 235 ...... $171 ..... 14.7
57 ...... $199 ..... 16.6 130 ...... $193 ..... 13.9 173 ...... $237 ..... 17.1 120 ...... $192 ..... 15.4
90 ...... $197 ..... 12.3 720 ...... $203 ..... 13.3 153 ...... $227 ..... 16.3 199 ...... $204 ..... 16.5
78 ...... $212 ..... 11.5 46 ...... $236 ..... 15.4 939 ...... $190 ..... 14.7 172 ...... $236 ..... 15.7 103 ...... $192 ..... 13.1 263 ...... $226 ..... 15.5 52 ...... $209 ..... 15.2 288 ...... $197 ..... 12.7 71 ...... $219 ..... 16.3 318 ...... $205 ..... 13.5 38 ...... $176 ..... 15.6 123 ...... $185 ..... 16.1 145 ...... $228 ..... 16.4 101 ...... $206 ..... 12.7 104 ...... $234 ..... 15.8 1,334 ...... $241 ....... 8.2
Initial claims include intrastate initial and additional claims, as well as agent state initial and additional claims for regular UI only. Average duration of benefits is represented in weeks.
22
County
November Average Average Initial Weekly Duration
Claims Benefit Weeks
Muscogee Newton Oconee Oglethorpe Paulding Peach Pickens Pierce Pike Polk Pulaski Putnam Quitman Rabun Randolph Richmond Rockdale Schley Screven Seminole Spalding Stephens Stewart Sumter Talbot Taliaferro Tattnall Taylor Telfair Terrell Thomas Tift Toombs Towns Treutlen Troup Turner Twiggs Union Upson Walker Walton Ware Warren Washington Wayne Webster Wheeler White Whitfield Wilcox Wilkes Wilkinson Worth
946 ...... $204 ..... 13.7 742 ...... $229 ..... 16.9 114 ...... $235 ..... 17.3 104 ...... $219 ..... 15.5 713 ...... $261 ..... 17.6 214 ...... $198 ..... 15.1 212 ...... $243 ..... 15.9 214 ...... $203 ..... 13.1 124 ...... $246 ..... 14.1 509 ...... $240 ..... 11.9
57 ...... $229 ..... 13.9 409 ...... $221 ..... 14.6
0 ...... $172 ..... 11.4 106 ...... $240 ..... 15.6 128 ...... $230 ..... 10.8 1,179 ...... $197 ..... 14.5 601 ...... $239 ..... 16.8
42 ...... $210 ..... 16.0 147 ...... $193 ..... 14.0
40 ...... $194 ..... 16.3 511 ...... $195 ..... 15.5 238 ...... $224 ..... 12.5
41 ...... $205 ..... 14.8 304 ...... $185 ..... 15.4
76 ...... $202 ..... 10.1 23 ...... $244 ..... 16.9 70 ...... $210 ..... 14.9 94 ...... $166 ..... 14.1 501 ...... $197 ..... 13.7 65 ...... $190 ..... 17.5 222 ...... $205 ..... 14.8 283 ...... $203 ..... 15.5 270 ...... $199 ..... 13.2 58 ...... $215 ..... 15.5 73 ...... $219 ..... 13.2 534 ...... $224 ..... 12.9 126 ...... $173 ..... 14.2 61 ...... $205 ..... 14.0 139 ...... $232 ..... 14.7 155 ...... $194 ..... 13.6 589 ...... $240 ..... 11.5 477 ...... $235 ..... 16.8 457 ...... $185 ..... 13.1 93 ...... $172 ..... 12.1 172 ...... $185 ..... 17.6 211 ...... $219 ..... 15.0 18 ...... $177 ..... 14.2 114 ...... $204 ..... 12.8 170 ...... $224 ..... 15.2 3,491 ...... $229 ....... 8.6 81 ...... $212 ..... 14.0 136 ...... $199 ..... 12.7 62 ...... $212 ..... 18.3 147 ...... $207 ..... 16.4
Georgia Department of Labor Workforce Information & Analysis 148 Andrew Young International Boulevard, N.E. Atlanta, Georgia 30303-1751
Return Service Requested