- Collection:
- Georgia Government Publications
- Title:
- Dimensions: measuring Georgia's workforce, Vol. 35, no. 3 (Mar. 2009)
- Creator:
- Georgia. Department of Labor
- Contributor to Resource:
- Georgia. Workforce Information and Analysis
- Publisher:
- Atlanta, Ga. : Georgia Dept. of Labor, 2009-03
- Date of Original:
- 2009-03
- Subject:
- Labor market--Georgia--Statistics
Wages--Georgia--Statistics
Hours of labor--Georgia--Statistics - Location:
- United States, Georgia, 32.75042, -83.50018
- Medium:
- state government records
- Type:
- Text
- Format:
- application/pdf
- External Identifiers:
- Call Number GA L200.E46 P1 T7 35/3
- Metadata URL:
- https://dlg.galileo.usg.edu/id:dlg_ggpd_i-ga-bl200-pe46-bp1-bt7-b35-s3-belec-p-btext
- Digital Object URL:
- https://dlg.galileo.usg.edu/do:dlg_ggpd_i-ga-bl200-pe46-bp1-bt7-b35-s3-belec-p-btext
- Language:
- eng
- Holding Institution:
- University of Georgia. Map and Government Information Library
- Rights:
-

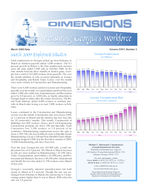
March 2009 Data
March 2009 Employment Situation
Total employment in Georgia inched up from February to March as nonfarm payrolls added 3,000 workers. The 0.1 percent growth in March is the first employment increase since the state added 5,000 jobs in October 2008. In the four months between these months of modest gains, Georgia lost a total of 143,600 workers from payrolls. The over the month addition of jobs occurred primarily in Leisure and Hospitality and Retail Trade. Losses over the month were most evident in Construction and Manufacturing.
There were 6,400 workers added to Leisure and Hospitality payrolls over the month. Accommodation and Food Services added 3,800 jobs while Arts, Entertainment, and Recreation grew by 6.8 percent, or 2,600 jobs, as family attractions in Georgia begin to rehire after the winter slowdown. The Retail Trade industry added 4,400 workers to nonfarm payrolls in March after losing a revised 5,800 workers in February.
Losses continued in the Construction and Manufacturing sectors over the month. Construction jobs were down 3,900, or 2.2 percent, in March and the industry has now lost jobs for 10 consecutive months. This month, Construction of Buildings lost 600 workers, Heavy and Civil Engineering Construction positions are down 100 and Specialty Trade Contractors lost 3,200 workers or 2.8 percent of its workforce. Manufacturing employment across the state is down 1,500. The jobs lost in March come as Durable Goods Manufacturing was up 1,100 and Non-Durable Goods Manufacturing dropped 2,600. For the first three months of 2009, 15,800 manufacturing jobs have been lost.
Over the year, Georgia has lost 185,900 jobs, a total employment loss of 4.5 percent. The March to March decrease in jobs are most realized in Manufacturing (-47,500 jobs), Trade, Transportation, and Utilities (-41,000 jobs), and Professional and Business Services (-40,200 jobs). Educational and Health Services has added 11,700 workers since March of last year.
Georgia's seasonally adjusted unemployment rate held steady in March at 9.2 percent. Though the rate was unchanged from February to March, the current rate is 3.6 percentage points higher than it was in March 2008 when the rate was 5.6 percent.
Volume XXXV, Number 3 Georgia Employment
(In Millions)
4.13 4.14 4.15 4.12 4.08 4.11 4.08 4.09 4.07 4.03 3.96 3.94 3.95
Mar Apr May Jun Jul Aug Sep Oct Nov Dec Jan Feb Mar
2008
2009
Georgia Unemployment Rate
(Seasonally Adjusted)
9.2% 9.2% 8.5%
5.6%
5.8%
5.9%
6.1%
6.2%
6.4%
6.6%
6.9%
7.1%
7.5%
Mar Apr May Jun Jul Aug Sep Oct Nov Dec Jan Feb Mar
2008
2009
Michael L. Thurmond, Commissioner Georgia Department of Labor
Workforce Information & Analysis 148 Andrew Young International Blvd., N.E.
Atlanta, Georgia 30303-1751
For more information, contact Corey Smith at (404) 232-3875 ext. 21299 or
David Echols at (404)232-3875 ext. 21272
corey.smith@dol.state.ga.us
david.echols@dol.state.ga.us
Equal Opportunity Employer/Program Auxiliary Aids and Services Available upon
Request to Individuals with Disabilities
GEORGIA Nonagricultural Employment (000s)
Change in Jobs
Change in Jobs
Preliminary Revised
Revised
MAR 2009 FEB 2009 MAR 2008
from FEB 2009 Net %
from MAR 2008 Net %
Total Nonfarm
3,945.9
3,942.9
4,131.8
3.0 0.1
-185.9 -4.5
Total Private
3,245.7
3,244.7
3,431.4
1.0 0.0
-185.7 -5.4
Goods Producing
558.5
564.0
638.7
-5.5 -1.0
-80.2 -12.6
Service-Providing
3,387.4
3,378.9
3,493.1
8.5 0.3
-105.7 -3.0
Private Service-Providing
2,687.2
2,680.7
2,792.7
6.5 0.2
-105.5 -3.8
Mining and Logging
9.8
9.9
10.5
-0.1 -1.0
-0.7 -6.7
Construction
177.9
181.8
209.9
-3.9 -2.2
-32.0 -15.3
Construction of Buildings
38.9
39.5
46.6
-0.6 -1.5
-7.7 -16.5
Heavy and Civil Engineering Construction
26.9
27.0
31.5
-0.1 -0.4
-4.6 -14.6
Specialty Trade Contractors
112.1
115.3
131.8
-3.2 -2.8
-19.7 -15.0
Manufacturing
370.8
372.3
418.3
-1.5 -0.4
-47.5 -11.4
Durable Goods
164.9
163.8
195.6
1.1 0.7
-30.7 -15.7
Computer, Electrical Equip and Appliance Mfg
26.5
26.6
27.8
-0.1 -0.4
-1.3 -4.7
Transportation Equipment Manufacturing
39.9
39.9
42.0
0.0 0.0
-2.1 -5.0
Non-Durable Goods
205.9
208.5
222.7
-2.6 -1.3
-16.8 -7.5
Food Manufacturing
66.3
66.6
66.9
-0.3 -0.5
-0.6 -0.9
Textile Mills
22.3
22.2
24.7
0.1 0.5
-2.4 -9.7
Textile Product Mills
32.2
32.8
36.0
-0.6 -1.8
-3.8 -10.6
Trade, Transportation and Utilities
839.2
835.7
880.2
3.5 0.4
-41.0 -4.7
Wholesale Trade
208.4
209.7
218.2
-1.3 -0.6
-9.8 -4.5
Merchant Wholesalers, Durable Goods
103.0
103.4
112.4
-0.4 -0.4
-9.4 -8.4
Merchant Wholesalers, Non-durable Goods
60.6
60.8
62.5
-0.2 -0.3
-1.9 -3.0
Wholesale Electronic Markets and Agents and Brokers
44.8
45.5
43.3
-0.7 -1.5
1.5 3.5
Retail Trade
450.0
445.6
470.3
4.4 1.0
-20.3 -4.3
Food and Beverage Stores
80.2
79.8
81.6
0.4 0.5
-1.4 -1.7
General Merchandise Stores
99.3
97.8
101.2
1.5 1.5
-1.9 -1.9
Miscellaneous Store Retailers
19.8
20.2
22.3
-0.4 -2.0
-2.5 -11.2
Transportation, Warehousing, and Utilities
180.8
180.4
191.7
0.4 0.2
-10.9 -5.7
Utilities
20.3
20.2
20.7
0.1 0.5
-0.4 -1.9
Transportation and Warehousing
160.5
160.2
171.0
0.3 0.2
-10.5 -6.1
Air Transportation
38.7
38.6
40.0
0.1 0.3
-1.3 -3.3
Truck Transportation
45.9
45.9
48.4
0.0 0.0
-2.5 -5.2
Couriers and Messengers
18.9
18.9
20.3
0.0 0.0
-1.4 -6.9
Warehousing and Storage
26.7
26.7
28.2
0.0 0.0
-1.5 -5.3
Information
103.8
105.4
109.7
-1.6 -1.5
-5.9 -5.4
Telecommunications
51.8
51.6
52.3
0.2 0.4
-0.5 -1.0
Wired Telecommunications Carriers
27.8
27.6
29.0
0.2 0.7
-1.2 -4.1
Wireless Telecommunications Carriers
12.2
12.1
11.7
0.1 0.8
0.5 4.3
Internet Service Providers, Search Portals, and DP
6.9
6.8
7.6
0.1 1.5
-0.7 -9.2
Financial Activities
214.6
215.6
226.1
-1.0 -0.5
-11.5 -5.1
Finance and Insurance
155.4
156.1
163.3
-0.7 -0.5
-7.9 -4.8
Insurance Carriers and Related Activities
68.1
67.8
67.6
0.3 0.4
0.5 0.7
Real Estate, Rental and Leasing
59.2
59.5
62.8
-0.3 -0.5
-3.6 -5.7
Professional and Business Services
519.5
521.3
559.7
-1.8 -0.4
-40.2 -7.2
Professional, Scientific, and Technical Services
220.8
226.3
230.3
-5.5 -2.4
-9.5 -4.1
Accounting, Tax Preparation and Bookkeeping
36.3
37.4
37.2
-1.1 -2.9
-0.9 -2.4
Architectural, Engineering and Related Services
37.6
37.9
41.5
-0.3 -0.8
-3.9 -9.4
Computer Systems Design and Related Services
46.7
47.2
48.7
-0.5 -1.1
-2.0 -4.1
Management and Technical Consulting Services
34.6
34.6
33.1
0.0 0.0
1.5 4.5
Management of Companies and Enterprises
54.5
53.9
54.5
0.6 1.1
0.0 0.0
Admin and Support, Waste Mngmnt and Remediation
244.2
241.1
274.9
3.1 1.3
-30.7 -11.2
Employment Services
104.6
103.4
131.0
1.2 1.2
-26.4 -20.2
Educational and Health Services
474.5
473.0
462.8
1.5 0.3
11.7 2.5
Educational Services
92.1
91.0
85.0
1.1 1.2
7.1 8.4
Colleges, Universities, and Professional Schools
56.9
56.4
51.9
0.5 0.9
5.0 9.6
Health Care and Social Assistance
382.4
382.0
377.8
0.4 0.1
4.6 1.2
Ambulatory Health Care Services
144.7
144.2
142.4
0.5 0.4
2.3 1.6
Hospitals
124.6
125.2
123.1
-0.6 -0.5
1.5 1.2
Nursing and Residential Care Facilities
54.7
54.1
54.9
0.6 1.1
-0.2 -0.4
Social Assistance
58.4
58.5
57.4
-0.1 -0.2
1.0 1.7
Leisure and Hospitality
380.0
373.6
393.4
6.4 1.7
-13.4 -3.4
Arts, Entertainment, and Recreation
41.1
38.5
39.0
2.6 6.8
2.1 5.4
Amusement, Gambling, and Recreation
30.0
28.4
28.9
1.6 5.6
1.1 3.8
Accommodation and Food Services
338.9
335.1
354.4
3.8 1.1
-15.5 -4.4
Accommodation
39.2
38.9
43.0
0.3 0.8
-3.8 -8.8
Food Services and Drinking Places
299.7
296.2
311.4
3.5 1.2
-11.7 -3.8
Other Services
155.6
156.1
160.8
-0.5 -0.3
-5.2 -3.2
Repair and Maintenance
34.6
35.6
36.8
-1.0 -2.8
-2.2 -6.0
Personal and Laundry Services
32.3
32.4
34.8
-0.1 -0.3
-2.5 -7.2
Religious, Grantmaking, Civic, Professional and Similar
88.7
88.1
89.2
0.6 0.7
-0.5 -0.6
Government
700.2
698.2
700.4
2.0 0.3
-0.2 0.0
Federal Government
101.1
100.0
98.1
1.1 1.1
3.0 3.1
Department of Defense
38.4
38.0
36.7
0.4 1.1
1.7 4.6
State Government
162.3
161.9
165.6
0.4 0.3
-3.3 -2.0
State Government Education
82.3
82.3
78.8
0.0 0.0
3.5 4.4
Local Government
436.8
436.3
436.7
0.5 0.1
0.1 0.0
Local Government Education
270.4
269.6
270.7
0.8 0.3
-0.3 -0.1
Note: These preliminary estimates were prepared in cooperation with the U.S. Department of Labor, Bureau of Labor Statistics, based upon monthly reports submitted by selected employers
throughout Georgia. The estimates include all full- and part-time wage and salary workers who were employed during or received pay for any part of the pay period that includes the twelfth of the
month. Proprietors, domestic workers, self-employed persons, unpaid family workers and personnel of the armed forces are excluded. Estimates based on 2008 benchmark.
2
Source: Georgia Department of Labor, Workforce Information & Analysis
ATLANTA MSA Nonagricultural Employment (000s)
Preliminary MAR 2009
Revised
Revised
FEB 2009 MAR 2008
Change in Jobs
from FEB 2009
Net
%
Change in Jobs from MAR 2008
Net %
Total Nonfarm Total Private Goods Producing Service-Providing Private Service-Providing
Mining and Logging Construction Construction of Buildings Specialty Trade Contractors Manufacturing Durable Goods
Transportation Equipment Manufacturing Non-Durable Goods Food Manufacturing Trade, Transportation and Utilities Wholesale Trade Merchant Wholesalers, Durable Goods Merchant Wholesalers, Non-durable Goods Wholesale Electronic Markets and Agents and Brokers Retail Trade Food and Beverage Stores General Merchandise Stores Miscellaneous Store Retailers Transportation, Warehousing, and Utilities Utilities Transportation and Warehousing
Air Transportation Truck Transportation Couriers and Messengers Information Telecommunications Wired Telecommunications Carriers Wireless Telecommunications Carriers Internet Service Providers, Search Portals, and DP Financial Activities Finance and Insurance Insurance Carriers and Related Activities Real Estate, Rental and Leasing Professional and Business Services Professional, Scientific, and Technical Services Accounting, Tax Preparation and Bookkeeping Architectural, Engineering and Related Services Computer Systems Design and Related Services Management and Technical Consulting Services Management of Companies and Enterprises Admin and Support, Waste Mngmnt and Remediation Employment Services Educational and Health Services Educational Services Health Care and Social Assistance Ambulatory Health Care Services Hospitals Social Assistance Leisure and Hospitality Arts, Entertainment, and Recreation Accommodation and Food Services Accommodation Food Services and Drinking Places Other Services Repair and Maintenance Personal and Laundry Services Government Federal Government State Government Local Government
2,329.7 1,986.6
263.4 2,066.3 1,723.2
1.4 109.2
24.6 68.7 152.8 76.1 14.6 76.7 24.0 529.1 150.8 76.0 40.6 34.2 254.3 47.8 53.3 13.3 124.0 11.9 112.1 37.8 28.1 16.1 80.7 38.2 22.5 10.4
6.3 148.1 104.6
46.1 43.5 379.7 169.9 24.9 27.8 38.8 30.2 42.4 167.4 72.7 262.0 59.0 203.0 79.5 65.4 35.8 227.5 27.9 199.6 23.2 176.4 96.1 20.6 23.0 343.1 48.6 69.1 225.4
2,330.6 1,989.0
268.2 2,062.4 1,720.8
1.5 111.6 24.5 71.8 155.1 77.0 14.5 78.1 24.3 526.9 151.8 76.4 40.7 34.7 251.0 47.5 51.1 13.4 124.1 11.8 112.3 37.5 28.0 16.0 81.8 37.9 22.5 10.3
6.2 148.8 105.4
45.9 43.4 379.8 174.0 25.5 28.1 39.5 30.4 42.0 163.8 71.4 263.0 58.7 204.3 80.2 65.8 35.8 223.7 25.5 198.2 22.8 175.4 96.8 20.6 22.9 341.6 47.9 68.7 225.0
2,445.6 2,103.8
305.7 2,139.9 1,798.1
1.8 132.2
29.2 84.0 171.7 88.7 15.9 83.0 24.8 558.1 159.9 84.2 41.5 34.2 268.7 49.2 53.7 14.5 129.5 11.5 118.0 38.8 29.0 15.9 84.0 37.5 23.1
9.8 7.1 157.3 111.9 46.2 45.4 407.9 178.8 24.9 31.6 39.6 28.6 41.9 187.2 87.6 259.2 57.0 202.2 79.0 64.5 34.5 233.4 25.7 207.7 24.1 183.6 98.2 21.6 23.4 341.8 47.6 68.8 225.4
-0.9 0.0 -2.4 -0.1 -4.8 -1.8 3.9 0.2 2.4 0.1 -0.1 -6.7 -2.4 -2.2 0.1 0.4 -3.1 -4.3 -2.3 -1.5 -0.9 -1.2 0.1 0.7 -1.4 -1.8 -0.3 -1.2 2.2 0.4 -1.0 -0.7 -0.4 -0.5 -0.1 -0.3 -0.5 -1.4 3.3 1.3 0.3 0.6 2.2 4.3 -0.1 -0.8 -0.1 -0.1 0.1 0.9 -0.2 -0.2 0.3 0.8 0.1 0.4 0.1 0.6 -1.1 -1.3 0.3 0.8 0.0 0.0 0.1 1.0 0.1 1.6 -0.7 -0.5 -0.8 -0.8 0.2 0.4 0.1 0.2 -0.1 0.0 -4.1 -2.4 -0.6 -2.4 -0.3 -1.1 -0.7 -1.8 -0.2 -0.7 0.4 1.0 3.6 2.2 1.3 1.8 -1.0 -0.4 0.3 0.5 -1.3 -0.6 -0.7 -0.9 -0.4 -0.6 0.0 0.0 3.8 1.7 2.4 9.4 1.4 0.7 0.4 1.8 1.0 0.6 -0.7 -0.7 0.0 0.0 0.1 0.4 1.5 0.4 0.7 1.5 0.4 0.6 0.4 0.2
-115.9 -4.7 -117.2 -5.6 -42.3 -13.8 -73.6 -3.4 -74.9 -4.2
-0.4 -22.2 -23.0 -17.4
-4.6 -15.8 -15.3 -18.2 -18.9 -11.0 -12.6 -14.2
-1.3 -8.2 -6.3 -7.6 -0.8 -3.2 -29.0 -5.2 -9.1 -5.7 -8.2 -9.7 -0.9 -2.2 0.0 0.0 -14.4 -5.4 -1.4 -2.9 -0.4 -0.7 -1.2 -8.3 -5.5 -4.3 0.4 3.5 -5.9 -5.0 -1.0 -2.6 -0.9 -3.1 0.2 1.3 -3.3 -3.9 0.7 1.9 -0.6 -2.6 0.6 6.1 -0.8 -11.3 -9.2 -5.9 -7.3 -6.5 -0.1 -0.2 -1.9 -4.2 -28.2 -6.9 -8.9 -5.0 0.0 0.0 -3.8 -12.0 -0.8 -2.0 1.6 5.6 0.5 1.2 -19.8 -10.6 -14.9 -17.0 2.8 1.1 2.0 3.5 0.8 0.4 0.5 0.6 0.9 1.4 1.3 3.8 -5.9 -2.5 2.2 8.6 -8.1 -3.9 -0.9 -3.7 -7.2 -3.9 -2.1 -2.1 -1.0 -4.6 -0.4 -1.7 1.3 0.4 1.0 2.1 0.3 0.4 0.0 0.0
Note: These preliminary estimates were prepared in cooperation with the U.S. Department of Labor, Bureau of Labor Statistics, based upon monthly reports submitted by selected employers
in the Atlanta Metropolitan Statistical Area, which includes Barrow, Bartow, Butts, Carroll, Cherokee, Clayton, Cobb, Coweta, Dawson, DeKalb, Douglas, Fayette, Forsyth, Fulton, Gwinnett, Haralson, Heard, Henry, Jasper, Lamar, Meriwether, Newton, Paulding, Pickens, Pike, Rockdale, Spalding and Walton counties. The estimates include all full- and part-time wage and salary workers who were employed during or received pay for any part of the pay period that includes the twelfth of the month. Proprietors, domestic workers, self-employed persons, unpaid family workers and personnel of the armed forces are excluded. Estimates based on 2008 benchmark.
Source: Georgia Department of Labor, Workforce Information & Analysis
3
ALBANY MSA Nonagricultural Employment (000s)
Preliminary
Revised
Revised
MAR 2009 FEB 2009 MAR 2008
Change in Jobs from FEB 2009
Net %
Change in Jobs
from MAR 2008
Net
%
Total Nonfarm Total Private
62.2
62.7
64.7
-0.5 -0.8
48.6
49.0
51.0
-0.4 -0.8
-2.5 -3.9 -2.4 -4.7
Goods Producing Service-Providing Private Service-Providing
9.4
9.5
10.5
-0.1 -1.1
52.8
53.2
54.2
-0.4 -0.8
39.2
39.5
40.5
-0.3 -0.8
-1.1 -10.5 -1.4 -2.6 -1.3 -3.2
Manufacturing Trade, Transportation and Utilities Retail Trade
6.2
6.2
6.6
12.8
12.6
13.3
7.5
7.4
8.1
0.0 0.0 0.2 1.6 0.1 1.4
-0.4 -6.1 -0.5 -3.8 -0.6 -7.4
Government Federal Government State Government
13.6
13.7
13.7
-0.1 -0.7
3.4
3.4
3.1
0.0 0.0
2.9
2.9
2.9
0.0 0.0
-0.1 -0.7 0.3 9.7 0.0 0.0
Local Government
7.3
7.4
7.7
-0.1 -1.4
-0.4 -5.2
Note: These preliminary estimates were prepared in cooperation with the U.S. Department of Labor, Bureau of Labor Statistics, based upon monthly reports submitted by selected employers
in the Albany Metropolitan Statistical Area, which includes Baker, Dougherty, Lee, Terrell and Worth counties. The estimates include all full- and part-time wage and salary workers who were employed during or received pay for any part of the pay period that includes the twelfth of the month. Proprietors, domestic workers, self-employed persons, unpaid family workers and personnel
of the armed forces are excluded. Estimates based on 2008 benchmark.
ATHENS - CLARKE MSA Nonagricultural Employment (000s)
Preliminary
Revised
Revised
MAR 2009 FEB 2009 MAR 2008
Change in Jobs
from FEB 2009
Net
%
Change in Jobs from MAR 2008
Net %
Total Nonfarm
84.1
84.6
85.5
-0.5 -0.6
-1.4 -1.6
Total Private
59.8
60.2
61.7
-0.4 -0.7
-1.9 -3.1
Goods Producing
11.3
11.3
12.2
0.0 0.0
-0.9 -7.4
Service-Providing
72.8
73.3
73.3
-0.5 -0.7
-0.5 -0.7
Private Service-Providing
48.5
48.9
49.5
-0.4 -0.8
-1.0 -2.0
Trade, Transportation and Utilities
13.0
13.0
13.7
0.0 0.0
-0.7 -5.1
Retail Trade
9.4
9.3
9.5
0.1 1.1
-0.1 -1.1
Professional and Business Services
6.4
6.4
6.9
0.0 0.0
-0.5 -7.3
Leisure and Hospitality
8.4
8.3
8.9
0.1 1.2
-0.5 -5.6
Government
24.3
24.4
23.8
-0.1 -0.4
0.5 2.1
Federal Government
1.6
1.7
1.6
-0.1 -5.9
0.0 0.0
State Government
14.6
14.6
14.2
0.0 0.0
0.4 2.8
Local Government
8.1
8.1
8.0
0.0 0.0
0.1 1.3
Note: These preliminary estimates were prepared in cooperation with the U.S. Department of Labor, Bureau of Labor Statistics, based upon monthly reports submitted by selected employers in
the Athens - Clarke County Metropolitan Statistical Area, which includes Clarke, Madison, Oconee and Oglethorpe counties. The estimates include all full- and part-time wage and salary workers who were employed during or received pay for any part of the pay period that includes the twelfth of the month. Proprietors, domestic workers, self-employed persons, unpaid family workers and personnel of the armed forces are excluded. Estimates based on 2008 benchmark.
Source: Georgia Department of Labor, Workforce Information & Analysis
4
AUGUSTA-RICHMOND MSA Nonagricultural Employment (000s)
Preliminary Revised Revised MAR 2009 FEB 2009 MAR 2008
Change in Jobs from FEB 2009
Net %
Change in Jobs from MAR 2008
Net %
Total Nonfarm Total Private Goods Producing Service-Providing Private Service-Providing Mining, Logging, and Construction Manufacturing Trade, Transportation and Utilities
Wholesale Trade Retail Trade Transportation,Warehousing, and Utilities Information Financial Activitities Professional and Business Services Educational and Health Services Leisure and Hospitality Other Services Government Federal Government State Government Local Government
212.9 169.7
32.5 180.4 137.2
11.2 21.3 37.3
4.9 25.6
6.8 3.3 7.7 30.1 29.0 20.9 8.9 43.2 7.7 13.5 22.0
211.8 168.6
32.9 178.9 135.7
11.5 21.4 36.9
4.9 25.2
6.8 3.3 7.7 29.9 28.8 20.3 8.8 43.2 7.7 13.5 22.0
216.0 172.8
35.6 180.4 137.2
12.3 23.3 36.3
4.8 24.9
6.6 3.5 7.7 31.0 28.3 21.5 8.9 43.2 7.5 13.4 22.3
1.1 0.5 1.1 0.7 -0.4 -1.2 1.5 0.8 1.5 1.1 -0.3 -2.6 -0.1 -0.5 0.4 1.1 0.0 0.0 0.4 1.6 0.0 0.0 0.0 0.0 0.0 0.0 0.2 0.7 0.2 0.7 0.6 3.0 0.1 1.1 0.0 0.0 0.0 0.0 0.0 0.0 0.0 0.0
-3.1 -1.4 -3.1 -1.8 -3.1 -8.7 0.0 0.0 0.0 0.0 -1.1 -8.9 -2.0 -8.6 1.0 2.8 0.1 2.1 0.7 2.8 0.2 3.0 -0.2 -5.7 0.0 0.0 -0.9 -2.9 0.7 2.5 -0.6 -2.8 0.0 0.0 0.0 0.0 0.2 2.7 0.1 0.8 -0.3 -1.4
Note: These preliminary estimates were prepared in cooperation with the U.S. Department of Labor, Bureau of Labor Statistics, based upon monthly reports submitted by selected employers in the
Augusta - Richmond County Metropolitan Statistical Area, which includes Burke, Columbia, McDuffie and Richmond counties in Georgia and Aiken and Edgefield counties in South Carolina. The estimates include all full- and part-time wage and salary workers who were employed during or received pay for any part of the pay period that includes the twelfth of the month. Proprietors, domestic
workers, self-employed persons, unpaid family workers and personnel of the armed forces are excluded. Estimates based on 2008 benchmark.
COLUMBUS MSA Nonagricultural Employment (000s)
Preliminary Revised Revised MAR 2009 FEB 2009 MAR 2008
Change in Jobs from FEB 2009
Net %
Change in Jobs from MAR 2008
Net %
Total Nonfarm Total Private Goods Producing
119.8 96.2 15.0
118.8 95.3 15.1
121.3 98.2 16.5
1.0 0.8 0.9 0.9 -0.1 -0.7
-1.5 -1.2 -2.0 -2.0 -1.5 -9.1
Service-Providing Private Service-Providing Trade, Transportation and Utilities
104.8 81.2 18.4
103.7 80.2 18.0
104.8 81.7 19.0
1.1 1.1 1.0 1.3 0.4 2.2
0.0 0.0 -0.5 -0.6 -0.6 -3.2
Retail Trade Information Financial Activities
13.2
13.0
14.0
0.2 1.5
5.9
6.0
6.0
-0.1 -1.7
9.1
9.1
9.2
0.0 0.0
-0.8 -5.7 -0.1 -1.7 -0.1 -1.1
Finance and Insurance Insurance Carriers and Related Activities Professional and Business Services
7.3
7.3
7.4
4.9
4.8
5.0
13.1
13.1
13.8
0.0 0.0 0.1 2.1 0.0 0.0
-0.1 -1.4 -0.1 -2.0 -0.7 -5.1
Leisure and Hospitality Government
Federal Government
13.2
12.9
13.8
23.6
23.5
23.1
5.9
5.8
5.4
0.3 2.3 0.1 0.4 0.1 1.7
-0.6 -4.4 0.5 2.2 0.5 9.3
State Government Local Government
4.0
4.1
4.1
-0.1 -2.4
13.7
13.6
13.6
0.1 0.7
-0.1 -2.4 0.1 0.7
Note: These preliminary estimates were prepared in cooperation with the U.S. Department of Labor, Bureau of Labor Statistics, based upon monthly reports submitted by selected
employers in the Columbus Metropolitan Statistical Area, which includes Chattahoochee, Harris, Marion and Muscogee counties in Georgia and Russell County in Alabama. The estimates include all full- and part-time wage and salary workers who were employed during or received pay for any part of the pay period that includes the twelfth of the month. Proprietors, domestic
workers, self-employed persons, unpaid family workers and personnel of the armed forces are excluded. Estimates based on 2008 benchmark.
5
DALTON MSA Nonagricultural Employment (000s)
Preliminary Revised
Revised
MAR 2009 FEB 2009 MAR 2008
Change in Jobs from FEB 2009
Net %
Change in Jobs from MAR 2008
Net %
Total Nonfarm
69.1
69.7
75.6
-0.6 -0.9
-6.5 -8.6
Total Private
61.9
62.7
67.6
-0.8 -1.3
-5.7 -8.4
Goods Producing Service-Providing
25.6
25.8
43.5
43.9
29.0
-0.2 -0.8
46.6
-0.4 -0.9
-3.4 -11.7 -3.1 -6.7
Private Service-Providing
36.3
36.9
38.6
-0.6 -1.6
-2.3 -6.0
Manufacturing Textile Mills
24.8
25.0
2.9
2.9
27.3
-0.2 -0.8
3.1
0.0 0.0
-2.5 -9.2 -0.2 -6.5
Textile Product Mills
17.5
17.6
18.6
-0.1 -0.6
-1.1 -5.9
Trade, Transportation and Utilities Retail Trade
15.2
15.1
7.4
7.3
15.6 7.6
0.1 0.7 0.1 1.4
-0.4 -2.6 -0.2 -2.6
Transportation, Warehouse, and Utilities
3.5
3.5
3.4
0.0 0.0
0.1 2.9
Professional and Business Services Government
8.3
8.3
7.2
7.0
9.8
0.0 0.0
-1.5 -15.3
8.0
0.2 2.9
-0.8 -10.0
Federal Government
0.3
0.3
0.3
0.0 0.0
0.0 0.0
State Government Local Government
1.2
1.1
5.7
5.6
1.6
0.1 9.1
-0.4 -25.0
6.1
0.1 1.8
-0.4 -6.6
Note: These preliminary estimates were prepared in cooperation with the U.S. Department of Labor, Bureau of Labor Statistics, based upon monthly reports submitted by selected employers
in the Dalton Metropolitan Statistical Area, which includes Murray and Whitfield counties. The estimates include all full- and part-time wage and salary workers who were employed during or received pay for any part of the pay period that includes the twelfth of the month. Proprietors, domestic workers, self-employed persons, unpaid family workers and personnel of the armed forces are excluded. Estimates based on 2008 benchmark.
Source: Georgia Department of Labor, Workforce Information & Analysis
GAINESVILLE MSA Nonagricultural Employment (000s)
Preliminary Revised
Revised
MAR 2009 FEB 2009 MAR 2008
Change in Jobs from FEB 2009
Net %
Change in Jobs from MAR 2008
Net %
Total Nonfarm
76.1
75.8
78.3
0.3 0.4
-2.2 -2.8
Total Private
65.1
64.8
67.6
0.3 0.5
-2.5 -3.7
Goods Producing Service-Providing
20.1
20.2
56.0
55.6
21.8
-0.1 -0.5
56.5
0.4 0.7
-1.7 -7.8 -0.5 -0.9
Private Service-Providing
45.0
44.6
45.8
0.4 0.9
-0.8 -1.8
Trade, Transportation and Utilities Retail Trade
14.4
14.1
14.6
0.3 2.1
-0.2 -1.4
7.9
7.8
7.8
0.1 1.3
0.1 1.3
Government
11.0
11.0
10.7
0.0 0.0
0.3 2.8
Federal Government State Government
0.5
0.5
2.8
2.8
0.5
0.0 0.0
2.7
0.0 0.0
0.0 0.0 0.1 3.7
Local Government
7.7
7.7
7.5
0.0 0.0
0.2 2.7
Note: These preliminary estimates were prepared in cooperation with the U.S. Department of Labor, Bureau of Labor Statistics, based upon monthly reports submitted by selected employers
in the Gainesville Metropolitan Statistical Area, which comprises Hall county. The estimates include all full- and part-time wage and salary workers who were employed during or received pay for any part of the pay period that includes the twelfth of the month. Proprietors, domestic workers, self-employed persons, unpaid family workers and personnel of the armed forces are excluded.
Estimates based on 2008 benchmark.
6
MACON MSA Nonagricultural Employment (000s)
Preliminary Revised
Revised
MAR 2009 FEB 2009 MAR 2008
Change in Jobs from FEB 2009
Net %
Change in Jobs from MAR 2008
Net %
Total Nonfarm Total Private Goods Producing Service-Providing Private Service-Providing Trade Transportation and Utilities
Retail Trade Transportation, Warehousing, and Utilities Financial Activities Professional and Business Services Educational and Health Services Leisure and Hospitality Government Federal Government State Government Local Government
98.7
98.0
101.1
83.7
83.1
85.7
10.7
10.8
11.5
88.0
87.2
89.6
73.0
72.3
74.2
20.2
20.1
20.7
12.0
11.8
12.2
4.4
4.4
4.6
8.5
8.5
8.4
11.7
11.7
11.5
19.6
19.5
18.9
8.4
8.2
9.1
15.0
14.9
15.4
1.4
1.3
1.4
3.4
3.4
3.6
10.2
10.2
10.4
0.7 0.7 0.6 0.7 -0.1 -0.9 0.8 0.9 0.7 1.0 0.1 0.5 0.2 1.7 0.0 0.0 0.0 0.0 0.0 0.0 0.1 0.5 0.2 2.4 0.1 0.7 0.1 7.7 0.0 0.0 0.0 0.0
-2.4 -2.4 -2.0 -2.3 -0.8 -7.0 -1.6 -1.8 -1.2 -1.6 -0.5 -2.4 -0.2 -1.6 -0.2 -4.4 0.1 1.2 0.2 1.7 0.7 3.7 -0.7 -7.7 -0.4 -2.6 0.0 0.0 -0.2 -5.6 -0.2 -1.9
Note: These preliminary estimates were prepared in cooperation with the U.S. Department of Labor, Bureau of Labor Statistics, based upon monthly reports submitted by selected employers
in the Macon Metropolitan Statistical Area, which includes Bibb, Crawford, Jones, Monroe and Twiggs counties. The estimates include all full- and part-time wage and salary workers who were employed during or received pay for any part of the pay period that includes the twelfth of the month. Proprietors, domestic workers, self-employed persons, unpaid family workers and personnel
of the armed forces are excluded. Estimates based on 2008 benchmark.
SAVANNAH MSA Nonagricultural Employment (000s)
Preliminary Revised
Revised
MAR 2009 FEB 2009 MAR 2008
Change in Jobs from FEB 2009
Net %
Change in Jobs
from MAR 2008
Net
%
Total Nonfarm
156.8
155.8
160.7
1.0 0.6
-3.9 -2.4
Total Private
133.3
132.4
137.4
0.9 0.7
-4.1 -3.0
Goods Producing Service-Providing
22.3 134.5
22.4 133.4
24.0 136.7
-0.1 -0.5 1.1 0.8
-1.7 -7.1 -2.2 -1.6
Private Service-Providing
111.0
110.0
113.4
1.0 0.9
-2.4 -2.1
Mining, Logging, and Construction Manufacturing
8.0
8.1
9.2
-0.1 -1.2
14.3
14.3
14.8
0.0 0.0
-1.2 -13.0 -0.5 -3.4
Trade, Transportation and Utilities
35.6
35.2
36.1
0.4 1.1
-0.5 -1.4
Wholesale Trade Retail Trade
6.2
6.2
6.7
17.8
17.5
18.3
0.0 0.0 0.3 1.7
-0.5 -7.5 -0.5 -2.7
Transportation, Warehousing, and Utilities
11.6
11.5
11.1
0.1 0.9
0.5 4.5
Information Financial Activities
1.9
1.9
5.9
5.9
1.9
0.0 0.0
0.0 0.0
6.0
0.0 0.0
-0.1 -1.7
Professional and Business Services
17.3
17.2
19.3
0.1 0.6
-2.0 -10.4
Educational and Health Services Leisure and Hospitality
22.6
22.5
22.1
20.1
19.7
20.2
0.1 0.4 0.4 2.0
0.5 2.3 -0.1 -0.5
Other Services
7.6
7.6
7.8
0.0 0.0
-0.2 -2.6
Government Federal Government
23.5
23.4
23.3
3.0
2.9
2.9
0.1 0.4 0.1 3.5
0.2 0.9 0.1 3.5
State Government
5.3
5.3
5.6
0.0 0.0
-0.3 -5.4
Local Government
15.2
15.2
14.8
0.0 0.0
0.4 2.7
Note: These preliminary estimates were prepared in cooperation with the U.S. Department of Labor, Bureau of Labor Statistics, based upon monthly reports submitted by selected employers
in the Savannah Metropolitan Statistical Area, which includes Bryan, Chatham and Effingham counties. The estimates include all full- and part-time wage and salary workers who were employed during or received pay for any part of the pay period that includes the twelfth of the month. Proprietors, domestic workers, self-employed persons, unpaid family workers and personnel of the armed
forces are excluded. Estimates based on 2008 benchmark.
7
VALDOSTA MSA Nonagricultural Employment (000s)
Preliminary Revised
Revised
MAR 2009 FEB 2009 MAR 2008
Change in Jobs from FEB 2009
Net %
Change in Jobs
from MAR 2008
Net
%
Total Nonfarm Total Private Goods Producing Service-Providing Private Service-Providing Trade, Transportation and Utilities
Retail Trade Government
Federal Government State Government Local Government
55.8
55.5
56.3
0.3 0.5
42.1
41.9
43.1
0.2 0.5
7.9
8.0
8.9
-0.1 -1.3
47.9
47.5
47.4
0.4 0.8
34.2
33.9
34.2
0.3 0.9
11.9
11.8
12.2
0.1 0.9
7.9
7.8
8.2
0.1 1.3
13.7
13.6
13.2
0.1 0.7
0.9
0.8
0.8
0.1 12.5
4.7
4.7
4.4
0.0 0.0
8.1
8.1
8.0
0.0 0.0
-0.5 -0.9 -1.0 -2.3 -1.0 -11.2 0.5 1.1 0.0 0.0 -0.3 -2.5 -0.3 -3.7 0.5 3.8 0.1 12.5 0.3 6.8 0.1 1.3
Note: These preliminary estimates were prepared in cooperation with the U.S. Department of Labor, Bureau of Labor Statistics, based upon monthly reports submitted by selected employers
in the Valdosta Metropolitan Statistical Area, which includes Brooks, Echols, Lanier and Lowndes counties. The estimates include all full- and part-time wage and salary workers who were employed during or received pay for any part of the pay period that includes the twelfth of the month. Proprietors, domestic workers, self-employed persons, unpaid family workers and personnel of the armed forces are excluded. Estimates based on 2008 benchmark.
Source: Georgia Department of Labor, Workforce Information & Analysis
WARNER ROBINS MSA Nonagricultural Employment (000s)
Preliminary Revised
Revised
MAR 2009 FEB 2009 MAR 2008
Change in Jobs from FEB 2009
Net %
Change in Jobs
from MAR 2008
Net
%
Total Nonfarm Total Private Goods Producing Service-Providing Private Service-Providing Trade, Transportation and Utilities
Retail Trade Government
Federal Government State Government Local Government
57.1
56.6
58.6
0.5 0.9
33.6
33.3
35.5
0.3 0.9
6.2
6.3
7.1
-0.1 -1.6
50.9
50.3
51.5
0.6 1.2
27.4
27.0
28.4
0.4 1.5
7.9
7.9
8.0
0.0 0.0
6.1
6.0
6.3
0.1 1.7
23.5
23.3
23.1
0.2 0.9
14.4
14.3
14.2
0.1 0.7
1.0
0.9
1.0
0.1 11.1
8.1
8.1
7.9
0.0 0.0
-1.5 -2.6 -1.9 -5.4 -0.9 -12.7 -0.6 -1.2 -1.0 -3.5 -0.1 -1.3 -0.2 -3.2 0.4 1.7 0.2 1.4 0.0 0.0 0.2 2.5
Note: These preliminary estimates were prepared in cooperation with the U.S. Department of Labor, Bureau of Labor Statistics, based upon monthly reports submitted by selected employers
in the Warner Robins Metropolitan Statistical Area, which comprises Houston county. The estimates include all full- and part-time wage and salary workers who were employed during or received pay for any part of the pay period that includes the twelfth of the month. Proprietors, domestic workers, self-employed persons, unpaid family workers and personnel of the armed forces are excluded. Estimates based on 2008 benchmark.
Source: Georgia Department of Labor, Workforce Information & Analysis
8
Georgia Hours and Earnings
Experimental All Employee
Average Weekly Earnings
Preliminary MAR 2009
Revised FEB 2009
Revised MAR 2008
Total Private ............................................................................................ $753.60 ........................ $754.30 ................... $728.38 Goods Producing ................................................................................... $753.98 ........................ $746.23 ................... $738.53 Private Service Providing ....................................................................... $752.90 ........................ $756.81 ................... $726.62 Construction ........................................................................................... $756.24 ........................ $748.08 ................... $712.14 Manufacturing ......................................................................................... $729.64 ........................ $720.39 ................... $754.21 Trade, Transportation, and Utilities ........................................................ $719.20 ........................ $708.75 ................... $699.69 Financial Activities .................................................................................. $934.36 ........................ $955.99 ................... $893.88 Professional and Business Services ...................................................... $960.87 ........................ $967.13 ................... $909.44 Educational and Health Services ........................................................... $770.71 ........................ $783.30 ................... $774.57 Leisure and Hospitality ........................................................................... $329.75 ........................ $335.53 ................... $339.92 Other Services ........................................................................................ $543.04 ........................ $544.50 ................... $499.22
Average Weekly Hours
Preliminary MAR 2009
Revised FEB 2009
Revised MAR 2008
Total Private .................................................................................................. 35.1 .............................. 35.1 ......................... 35.6 Goods Producing ......................................................................................... 37.4 .............................. 37.2 ......................... 39.2 Private Service Providing ............................................................................. 34.6 .............................. 34.7 ......................... 34.8 Construction ................................................................................................. 36.8 .............................. 36.4 ......................... 37.6 Manufacturing ............................................................................................... 37.0 .............................. 37.0 ......................... 39.8 Trade, Transportation, and Utilities .............................................................. 35.1 .............................. 35.0 ......................... 35.9 Financial Activities ........................................................................................ 36.3 .............................. 36.6 ......................... 36.0 Professional and Business Services ............................................................ 35.3 .............................. 35.4 ......................... 35.1 Educational and Health Services ................................................................. 35.5 .............................. 35.8 ......................... 38.1 Leisure and Hospitality ................................................................................. 28.9 .............................. 29.0 ......................... 28.0 Other Services .............................................................................................. 32.0 .............................. 32.2 ......................... 32.8
Average Hourly Earnings
Preliminary MAR 2009
Revised FEB 2009
Revised MAR 2008
Total Private .............................................................................................. $21.47 .......................... $21.49 ..................... $20.46 Goods Producing ..................................................................................... $20.16 .......................... $20.06 ..................... $18.84 Private Service Providing ......................................................................... $21.76 .......................... $21.81 ..................... $20.88 Construction ............................................................................................. $20.55 .......................... $20.58 ..................... $18.94 Manufacturing ........................................................................................... $19.72 .......................... $19.47 ..................... $18.95 Trade, Transportation, and Utilities .......................................................... $20.49 .......................... $20.25 ..................... $19.49 Financial Activities .................................................................................... $25.74 .......................... $26.12 ..................... $24.83 Professional and Business Services ........................................................ $27.22 .......................... $27.32 ..................... $25.91 Educational and Health Services ............................................................. $21.71 .......................... $21.88 ..................... $20.33 Leisure and Hospitality ............................................................................. $11.41 .......................... $11.57 ..................... $12.14 Other Services .......................................................................................... $16.97 .......................... $16.91 ..................... $15.22
The release of these new series are designated "experimental" because of the limited experience to date with the editing and review of the sample reports and the resultant estimates. The experimental State series includes estimates at a total private sector level and limited industry detail.
Read more about the experimental hours and earnings series at http://www.bls.gov/sae/saeaepp.htm
9
Dimensions - Measuring Georgia's Labor Force
10.0% 9.0%
Unemployment rates -- Georgia and U.S.
Ge orgia
U.S.
8.0%
7.0%
6.0%
5.0%
4.0%
Mar Apr May Jun Jul Aug Sep Oct Nov Dec Jan Feb Mar
2008
2009
WA 9.2
OR
12.1
ID
7.0
NV
10.4
UT
CA
5.2
11.2
AZ 7.8
AK 8.5
State unemployment rates
March 2009
National Unemployment Rate: 8.5% Rates are seasonally adjusted
MT 6.1
WY 4.5
CO 7.5
NM 5.9
ND 4.2
SD 4.9
NE 4.6
KS 6.1
MN 8.2
WI 8.5
IA 5.2
IL 9.1
MO 8.7
OK 5.9
TX 6.7
AR 6.5
MS 9.4
LA 5.8
NH
6.2
ME
VT
8.1
7.2
MI 12.6
OH
IN
9.7
10.0
KY 9.8
TN 9.6
PA 7.8
WV
6.9
VA
6.8
NC 10.8
SC 11.4
AL
GA
9.0
9.2
FL 9.7
MA 7.8 NY 7.8
RI 10.5 CT NJ 7.5 8.3 DE 7.7 DC 9.8
MD 6.9
Unemployment rate 10.0% or greater 7.0% to 9.9% 6.0% to 6.9% 5.0% to 5.9% 4.0% to 4.9%
HI 7.1
10
Georgia Labor Force Estimates (not seasonally adjusted) Place of Residence - Persons 16 Years and Older
Georgia
(Seasonally adjusted)
Georgia
(Not Seasonally adjusted)
Albany MSA
Athens-Clarke County MSA
Atlanta MSA
Augusta-Richmond County MSA
Brunswick MSA
Columbus MSA
Dalton MSA
Gainesville MSA
Employment Status
Civilian labor force Employed Unemployed Rate
Civilian labor force Employed Unemployed Rate
Civilian labor force Employed Unemployed Rate
Civilian labor force Employed Unemployed Rate
Civilian labor force Employed Unemployed Rate
Civilian labor force Employed Unemployed Rate
Civilian labor force Employed Unemployed Rate
Civilian labor force Employed Unemployed Rate
Civilian labor force Employed Unemployed Rate
Civilian labor force Employed Unemployed Rate
MAR 2009
4,787,731 4,344,973
442,758 9.2
4,780,020 4,340,768
439,252 9.2
74,670 68,526
6,144 8.2
107,890 100,562
7,328 6.8
2,678,299 2,434,168
244,131 9.1
259,010 236,271
22,739 8.8
53,840 49,441
4,399 8.2
127,959 117,260 10,699
8.4
65,716 56,707
9,009 13.7
91,954 83,975
7,979 8.7
FEB 2009
4,811,586 4,371,132
440,454 9.2
4,799,023 4,350,921
448,102 9.3
75,355 68,867
6,488 8.6
109,060 101,246
7,814 7.2
2,695,706 2,447,563
248,143 9.2
259,437 236,022
23,415 9.0
54,439 49,875
4,564 8.4
128,035 116,840
11,195 8.7
65,866 57,414
8,452 12.8
92,068 83,933
8,135 8.8
MAR 2008
4,834,846 4,564,957
269,889 5.6
4,843,128 4,586,184
256,944 5.3
76,049 71,931
4,118 5.4
108,837 104,427
4,410 4.1
2,750,848 2,607,889
142,959 5.2
256,571 242,886
13,685 5.3
54,160 51,836
2,324 4.3
128,389 121,566
6,823 5.3
67,399 63,042
4,357 6.5
92,562 88,462
4,100 4.4
Change From
FEB 2009
MAR 2008
-23,855 -26,159
2,304
-47,115 -219,984 172,869
-19,003 -10,153
-8,850
-63,108 -245,416 182,308
-685 -341 -344
-1,379 -3,405 2,026
-1,170 -684 -486
-947 -3,865 2,918
-17,407 -13,395
-4,012
-72,549 -173,721 101,172
-427 249 -676
2,439 -6,615 9,054
-599 -434 -165
-320 -2,395 2,075
-76 420 -496
-430 -4,306 3,876
-150 -707 557
-1,683 -6,335 4,652
-114 42
-156
-608 -4,487 3,879
Note: MSA data are not seasonally adjusted. Employment includes nonagricultural wage and salary employment, self-employment, unpaid family and private
household workers and agricultural workers. Persons in labor disputes are counted as employed. The use of unrounded data does not imply that the numbers are exact. Georgia and Metropolitan Statistical Area data have not been seasonally adjusted.
Albany MSA: Baker, Dougherty, Lee, Terrell, and Worth counties. Athens - Clarke County MSA: Clarke, Madison, Oconee, and Oglethorpe counties. Atlanta MSA: Barrow, Bartow, Butts, Carroll, Cherokee, Clayton, Cobb, Coweta, Dawson, DeKalb, Douglas, Fayette, Forsyth, Fulton, Gwinnett, Haralson, Heard, Henry, Jasper, Lamar, Meriwether, Newton, Paulding, Pickens, Pike, Rockdale, Spalding, and Walton counties. Augusta - Richmond County MSA: Burke, Columbia, McDuffie, and Richmond counties in Georgia and Aiken and Edgefield counties in South Carolina. Brunswick MSA: Brantley, Glynn, and McIntosh counties. Columbus MSA: Chattahoochee, Harris, Marion, and Muscogee counties in Georgia and Russell County in Alabama. Dalton MSA: Murray and Whitfield counties. Gainesville MSA: Hall County. Hinesville - Fort Stewart MSA: Liberty and Long counties. Macon MSA: Bibb, Crawford, Jones, Monroe, and Twiggs counties. Rome MSA: Floyd County. Savannah MSA: Bryan, Chatham, and Effingham counties. Valdosta MSA: Brooks, Echols, Lanier, and Lowndes counties. Warner Robins MSA: Houston County.
Source: Georgia Department of Labor, Workforce Information & Analysis
11
Georgia Labor Force Estimates (not seasonally adjusted) Place of Residence - Persons 16 Years and Older
Hinesville-Ft. Stewart MSA Macon MSA
Rome MSA Savannah MSA
Valdosta MSA Warner Robins MSA
Employment Status
Civilian labor force Employed Unemployed Rate
Civilian labor force Employed Unemployed Rate
Civilian labor force Employed Unemployed Rate
Civilian labor force Employed Unemployed Rate
Civilian labor force Employed Unemployed Rate
Civilian labor force Employed Unemployed Rate
MAR 2009
31,458 29,095
2,363 7.5
112,305 102,598
9,707 8.6
48,320 43,242
5,078 10.5
177,467 164,088
13,379 7.5
69,015 63,905
5,110 7.4
67,407 62,843
4,564 6.8
FEB 2009
31,796 29,211 2,585
8.1
112,441 102,250
10,191 9.1
48,663 43,820
4,843 10.0
178,234 164,159
14,075 7.9
69,357 63,599
5,758 8.3
67,657 62,716
4,941 7.3
MAR 2008
30,910 29,393
1,517 4.9
113,279 107,077
6,202 5.5
49,738 46,993
2,745 5.5
179,678 171,543
8,135 4.5
68,603 65,582
3,021 4.4
68,942 65,888
3,054 4.4
Change From
FEB 2009
MAR 2008
-338 -116 -222
548 -298 846
-136 348 -484
-974 -4,479 3,505
-343 -578 235
-1,418 -3,751 2,333
-767 -71
-696
-2,211 -7,455 5,244
-342 306 -648
412 -1,677 2,089
-250 127 -377
-1,535 -3,045 1,510
United States Labor Force Estimates Place of Residence - Persons 16 Years and Older
Area
United States
(Seasonally adjusted)
Employment Status
Civilian labor force Employed Unemployed Rate
MAR 2009
154,048,000 140,887,000
13,161,000 8.5
FEB 2009
154,214,000 141,748,000
12,467,000 8.1
MAR 2008
153,843,000 146,023,000
7,820,000 5.1
Change From
FEB 2009
MAR 2008
-166,000 -861,000 694,000
205,000 -5,136,000 5,341,000
United States
(Not Seasonally adjusted)
Civilian labor force Employed Unemployed
Rate
153,728,000 139,833,000
13,895,000 9.0
153,804,000 140,105,000
13,699,000 8.9
153,135,000 145,108,000
8,027,000 5.2
-76,000 -272,000 196,000
593,000 -5,275,000 5,868,000
Note: Employment includes nonagricultural wage and salary employment, self-employment, unpaid family and private household workers and agricultural
workers. Persons in labor disputes are counted as employed. The use of unrounded data does not imply that the numbers are exact. Georgia and Metropolitan Statistical Area data have not been seasonally adjusted. Seasonally adjusted data for Georgia available upon request.
Albany MSA: Baker, Dougherty, Lee, Terrell, and Worth counties. Athens - Clarke County MSA: Clarke, Madison, Oconee, and Oglethorpe counties. Atlanta MSA: Barrow, Bartow, Butts, Carroll, Cherokee, Clayton, Cobb, Coweta, Dawson, DeKalb, Douglas, Fayette, Forsyth, Fulton, Gwinnett, Haralson, Heard, Henry, Jasper, Lamar, Meriwether, Newton, Paulding, Pickens, Pike, Rockdale, Spalding, and Walton counties. Augusta - Richmond County MSA: Burke, Columbia, McDuffie, and Richmond counties in Georgia and Aiken and Edgefield counties in South Carolina. Brunswick MSA: Brantley, Glynn, and McIntosh counties. Columbus MSA: Chattahoochee, Harris, Marion, and Muscogee counties in Georgia and Russell County in Alabama. Dalton MSA: Murray and Whitfield counties. Gainesville MSA: Hall County. Hinesville - Fort Stewart MSA: Liberty and Long counties. Macon MSA: Bibb, Crawford, Jones, Monroe, and Twiggs counties. Rome MSA: Floyd County. Savannah MSA: Bryan, Chatham, and Effingham counties. Valdosta MSA: Brooks, Echols, Lanier, and Lowndes counties. Warner Robins MSA: Houston County.
Source: Georgia Department of Labor, Workforce Information & Analysis
12
Georgia Labor Force Estimates by County (not seasonally adjusted)
Georgia
Place of Residence - Persons 16 Years and Older
March 2009
February 2009
Labor Force
Employment
Unemployment Number Rate
4,780,020 4,340,768 439,252 9.2
Labor Force
Employment
Unemployment Number Rate
4,799,023 4,350,921 448,102 9.3
Appling Atkinson Bacon Baker Baldwin
9,451 3,631 4,862 1,622 20,988
8,609 3,142 4,463 1,496 18,996
842 8.9 489 13.5 399 8.2 126 7.8 1,992 9.5
9,360 3,581 4,884 1,644 21,747
8,459 3,099 4,381 1,504 18,933
901 9.6 482 13.5 503 10.3 140 8.5 2,814 12.9
Banks Barrow Bartow Ben Hill Berrien
11,553 33,875 45,960
7,724 8,992
10,669 30,264 40,685
6,590 7,917
884 7.7 3,611 10.7 5,275 11.5 1,134 14.7 1,075 12.0
11,467 34,157 46,131
7,674 9,066
10,630 30,430 40,909
6,481 7,857
837 7.3 3,727 10.9 5,222 11.3 1,193 15.5 1,209 13.3
Bibb Bleckley Brantley Brooks Bryan
73,850 5,335 7,672 8,465
16,479
67,295 4,883 6,908 7,820
15,314
6,555 452 764 645
1,165
8.9 8.5 10.0 7.6 7.1
73,899 67,066 6,833 9.2 5,318 4,852 466 8.8 7,736 6,969 767 9.9 8,474 7,782 692 8.2
16,535 15,321 1,214 7.3
Bulloch Burke Butts Calhoun Camden
33,408 10,166 10,037
2,441 21,484
30,753 8,900 8,980 2,194
19,780
2,655 1,266 1,057
247 1,704
7.9 12.5 10.5 10.1
7.9
33,876 10,052 10,109
2,413 21,725
30,967 8,895 9,029 2,148
19,847
2,909 8.6 1,157 11.5 1,080 10.7
265 11.0 1,878 8.6
Candler Carroll Catoosa Charlton Chatham
4,276 3,897
379 8.9
52,735 47,278 5,457 10.3
35,557 32,410 3,147 8.9
4,656 4,176 480 10.3
132,602 122,483 10,119 7.6
4,273 3,879 394 9.2 53,082 47,538 5,544 10.4 35,491 32,568 2,923 8.2
4,654 4,129 525 11.3 133,280 122,536 10,744 8.1
Chattahoochee 1,725
Chattooga
11,945
Cherokee 107,463
Clarke
65,355
Clay
1,418
1,494 9,796 98,634 60,986 1,290
231 13.4 2,149 18.0 8,829 8.2 4,369 6.7
128 9.0
1,724 11,522 108,303 66,111 1,384
1,487 9,938 99,177 61,401 1,257
237 13.7 1,584 13.7 9,126 8.4 4,710 7.1
127 9.2
Clayton Clinch Cobb Coffee Colquitt
133,928 119,803 14,125 10.5 2,905 2,623 282 9.7
371,901 340,742 31,159 8.4 17,230 15,273 1,957 11.4 21,344 19,618 1,726 8.1
134,987 120,462 14,525 10.8 2,858 2,568 290 10.1
374,014 342,617 31,397 8.4 17,084 15,066 2,018 11.8 21,109 19,225 1,884 8.9
Columbia Cook Coweta Crawford Crisp
59,736 7,477
58,704 6,221
10,418
55,727 6,592
53,460 5,615 9,258
4,009 6.7 885 11.8
5,244 8.9 606 9.7
1,160 11.1
59,731 7,539
59,081 6,214
10,370
55,696 6,518
53,754 5,596 9,196
4,035 6.8 1,021 13.5 5,327 9.0
618 9.9 1,174 11.3
March 2008
Labor Force
Employment
Unemployment Number Rate
4,843,128 4,586,184 256,944 5.3
9,081 8,608
473 5.2
3,354 3,146
208 6.2
4,667 4,430
237 5.1
1,655 1,570
85 5.1
20,877 19,636 1,241 5.9
11,031 10,611
420 3.8
34,366 32,424 1,942 5.7
46,511 43,589 2,922 6.3
7,484 6,777
707 9.4
8,625 8,218
407 4.7
74,438 70,232 4,206 5.7
5,285 5,003
282 5.3
7,651 7,243
408 5.3
8,437 8,025
412 4.9
16,694 16,010 684 4.1
32,622 31,065 1,557 4.8
10,010 9,211
799 8.0
10,368 9,621
747 7.2
2,393 2,242
151 6.3
21,370 20,427
943 4.4
4,177 3,960
217 5.2
53,825 50,652 3,173 5.9
35,869 34,114 1,755 4.9
4,567 4,339
228 5.0
134,283 128,047 6,236 4.6
1,704 11,916 110,513 66,064 1,509
1,543 10,215 105,673 63,330
1,403
161 9.4 1,701 14.3 4,840 4.4 2,734 4.1
106 7.0
137,191 128,353 8,838 6.4
2,743 2,593
150 5.5
382,914 365,060 17,854 4.7
16,415 15,295 1,120 6.8
20,323 19,266 1,057 5.2
60,128 57,670 2,458 4.1
7,178 6,721
457 6.4
60,184 57,275 2,909 4.8
6,141 5,860
281 4.6
10,107 9,434
673 6.7
13
Georgia Labor Force Estimates by County (not seasonally adjusted)
Dade Dawson Decatur DeKalb Dodge
Place of Residence - Persons 16 Years and Older
March 2009
February 2009
Labor Force
Employment
Unemployment Number Rate
Labor Force
Employment
Unemployment Number Rate
8,558 7,662 896 10.5 11,088 9,974 1,114 10.0 12,249 10,805 1,444 11.8 383,804 349,710 34,094 8.9 9,471 8,698 773 8.2
8,586 7,700 886 10.3 11,118 10,029 1,089 9.8 12,269 10,729 1,540 12.6 386,414 351,634 34,780 9.0 9,448 8,622 826 8.7
Dooly Dougherty Douglas Early Echols
4,830 41,402 64,208
5,623 2,273
4,380 37,704 57,657
5,045 2,120
450 9.3 3,698 8.9 6,551 10.2
578 10.3 153 6.7
4,772 41,737 64,574
5,563 2,271
4,305 37,892 57,974
4,956 2,110
467 9.8 3,845 9.2 6,600 10.2
607 10.9 161 7.1
Effingham Elbert Emanuel Evans Fannin
28,386 10,198 10,716
5,096 11,207
26,291 8,787 9,624 4,703
10,069
2,095 7.4 1,411 13.8 1,092 10.2
393 7.7 1,138 10.2
28,419 10,051 10,733
5,126 11,231
26,303 8,744 9,537 4,689
10,066
2,116 7.4 1,307 13.0 1,196 11.1
437 8.5 1,165 10.4
Fayette Floyd Forsyth Franklin Fulton
51,892 48,041 3,851 7.4 48,320 43,242 5,078 10.5 82,816 76,036 6,780 8.2 10,704 9,506 1,198 11.2 477,601 434,098 43,503 9.1
52,394 48,305 4,089 7.8 48,663 43,820 4,843 10.0 83,055 76,454 6,601 7.9 10,580 9,390 1,190 11.2 481,043 436,487 44,556 9.3
Gilmer Glascock Glynn Gordon Grady
14,360 1,150
40,714 27,035 12,258
12,972 1,020
37,578 23,887 11,177
1,388 9.7 130 11.3
3,136 7.7 3,148 11.6 1,081 8.8
14,281 1,133
41,204 27,032 12,046
12,918 1,014
37,908 23,822 10,907
1,363 9.5 119 10.5
3,296 8.0 3,210 11.9 1,139 9.5
Greene Gwinnett Habersham Hall Hancock
7,871 6,928
943 12.0
412,004 377,290 34,714 8.4
21,561 19,423 2,138 9.9
91,954 83,975 7,979 8.7
3,503 2,935
568 16.2
7,622 6,850
772 10.1
414,320 379,367 34,953 8.4
21,374 19,446 1,928 9.0
92,068 83,933 8,135 8.8
3,608 2,926
682 18.9
Haralson Harris Hart Heard Henry
12,989 16,112 10,902 5,000 94,687
11,444 14,991
9,514 4,343 86,469
1,545 11.9 1,121 7.0 1,388 12.7
657 13.1 8,218 8.7
13,004 16,047 10,895
5,048 95,531
11,507 14,927
9,406 4,367 86,945
1,497 11.5 1,120 7.0 1,489 13.7
681 13.5 8,586 9.0
Houston Irwin Jackson Jasper Jeff Davis
67,407 4,262
28,331 6,512 5,318
62,843 3,631
25,521 5,716 4,633
4,564 6.8 631 14.8
2,810 9.9 796 12.2 685 12.9
67,657 4,207
28,307 6,548 5,304
62,716 3,571
25,419 5,748 4,595
4,941 7.3 636 15.1
2,888 10.2 800 12.2 709 13.4
March 2008
Labor Force
Employment
Unemployment Number Rate
8,514 8,065
449 5.3
11,234 10,686
548 4.9
11,848 11,107
741 6.3
396,155 374,668 21,487 5.4
9,398 8,897
501 5.3
4,729 42,078 65,313
5,356 2,248
4,434 39,578 61,772
5,049 2,175
295 6.2 2,500 5.9 3,541 5.4
307 5.7 73 3.2
28,701 9,904
10,786 4,973
10,695
27,486 9,230
10,067 4,697 10,110
1,215 4.2 674 6.8 719 6.7 276 5.5 585 5.5
53,715 51,469 2,246 4.2
49,738 46,993 2,745 5.5
84,892 81,462 3,430 4.0
10,458 9,828
630 6.0
491,219 465,079 26,140 5.3
13,896 1,120
41,059 26,874 11,990
13,164 1,054
39,399 25,209 11,441
732 5.3 66 5.9
1,660 4.0 1,665 6.2
549 4.6
7,485 424,357
20,426 92,562
3,386
7,061 404,217
19,532 88,462
3,034
424 5.7 20,140 4.7
894 4.4 4,100 4.4
352 10.4
12,938 16,116 10,673 4,986 97,789
12,261 15,489
9,818 4,653 92,640
677 5.2 627 3.9 855 8.0 333 6.7 5,149 5.3
68,942 4,098
27,357 6,664 5,181
65,888 3,733
26,024 6,124 4,822
3,054 4.4 365 8.9
1,333 4.9 540 8.1 359 6.9
14
Georgia Labor Force Estimates by County (not seasonally adjusted)
Jefferson Jenkins Johnson Jones Lamar
Place of Residence - Persons 16 Years and Older
March 2009
February 2009
Labor Force
7,394 2,772 3,788 13,964 7,879
Employment
6,361 2,211 3,356 12,948 7,020
Unemployment Number Rate
1,033 14.0 561 20.2 432 11.4
1,016 7.3 859 10.9
Labor Force
7,337 2,757 3,792 14,076 7,932
Employment
Unemployment Number Rate
6,316 2,177 3,339 12,905 7,059
1,021 13.9 580 21.0 453 11.9
1,171 8.3 873 11.0
Lanier Laurens Lee Liberty Lincoln
4,169 22,676 17,273 25,287
3,957
3,791 20,361 16,201 23,310
3,558
378 9.1 2,315 10.2 1,072 6.2 1,977 7.8
399 10.1
4,200 22,479 17,447 25,575
4,016
3,773 20,261 16,282 23,403
3,524
427 10.2 2,218 9.9 1,165 6.7 2,172 8.5
492 12.3
Long Lowndes Lumpkin McDuffie McIntosh
6,171 54,109 13,790 10,663
5,454
5,785 50,174 12,263
9,596 4,954
386 6.3 3,935 7.3 1,527 11.1 1,067 10.0
500 9.2
6,221 54,412 13,819 10,685
5,499
5,808 49,934 12,191
9,590 4,998
413 6.6 4,478 8.2 1,628 11.8 1,095 10.2
501 9.1
Macon Madison Marion Meriwether Miller
5,172 16,339
3,389 9,633 3,692
4,583 15,019
3,064 8,406 3,388
589 11.4 1,320 8.1
325 9.6 1,227 12.7
304 8.2
5,150 16,487
3,353 9,746 3,639
4,521 15,121
3,050 8,452 3,320
629 12.2 1,366 8.3
303 9.0 1,294 13.3
319 8.8
Mitchell Monroe Montgomery Morgan Murray
10,597 13,563
4,640 9,795 20,546
9,698 12,501
4,260 8,888 17,545
899 8.5 1,062 7.8
380 8.2 907 9.3 3,001 14.6
10,509 13,579
4,657 9,734 20,368
9,551 12,458
4,215 8,823 17,763
958 9.1 1,121 8.3
442 9.5 911 9.4 2,605 12.8
Muscogee Newton Oconee Oglethorpe Paulding
85,563 46,591 18,286
7,911 65,432
78,536 41,032 17,235
7,323 59,057
7,027 8.2 5,559 11.9 1,051 5.7
588 7.4 6,375 9.7
85,560 46,773 18,438
8,025 65,742
78,198 41,257 17,352
7,373 59,382
7,362 8.6 5,516 11.8 1,086 5.9
652 8.1 6,360 9.7
Peach Pickens Pierce Pike Polk
11,976 15,105
8,702 7,955 21,809
10,876 13,601
7,902 7,214 19,526
1,100 9.2 1,504 10.0
800 9.2 741 9.3 2,283 10.5
11,936 15,250
8,624 7,998 21,750
10,805 13,676
7,876 7,254 19,536
1,131 9.5 1,574 10.3
748 8.7 744 9.3 2,214 10.2
Pulaski Putnam Quitman Rabun Randolph
4,593 10,421
1,044 7,258 2,827
4,295 9,452
951 6,420 2,528
298 6.5 969 9.3
93 8.9 838 11.5 299 10.6
4,604 10,459
1,034 7,132 2,785
4,273 9,354
939 6,373 2,457
331 7.2 1,105 10.6
95 9.2 759 10.6 328 11.8
March 2008
Labor Force
Employment
Unemployment Number Rate
7,116 2,904 3,744 14,244 8,004
6,532 2,444 3,496 13,514 7,521
584 8.2 460 15.8 248 6.6 730 5.1 483 6.0
4,074 22,509 17,663 24,815
3,792
3,891 21,207 17,007 23,549
3,563
183 4.5 1,302 5.8
656 3.7 1,266 5.1
229 6.0
6,095 53,844 13,449 10,644
5,450
5,844 51,491 12,812
9,930 5,194
251 4.1 2,353 4.4
637 4.7 714 6.7 256 4.7
4,987 16,291
3,345 9,703 3,572
4,634 15,596
3,165 9,006 3,424
353 7.1 695 4.3 180 5.4 697 7.2 148 4.1
10,352 13,745
4,577 9,557 20,700
9,734 13,046
4,283 9,075 19,505
618 6.0 699 5.1 294 6.4 482 5.0 1,195 5.8
85,783 46,875 18,549
7,934 66,567
81,145 43,960 17,897
7,604 63,271
4,638 5.4 2,915 6.2
652 3.5 330 4.2 3,296 5.0
11,861 15,350
8,526 8,210 21,386
11,151 14,572
8,147 7,729 20,169
710 6.0 778 5.1 379 4.4 481 5.9 1,217 5.7
4,603 10,389
1,065 6,771 2,793
4,402 9,760
964 6,389 2,595
201 4.4 629 6.1 101 9.5 382 5.6 198 7.1
15
Georgia Labor Force Estimates by County (not seasonally adjusted)
Richmond Rockdale Schley Screven Seminole
Place of Residence - Persons 16 Years and Older
March 2009
February 2009
Labor Force
Employment
Unemployment Number Rate
Labor Force
Employment
Unemployment Number Rate
91,231 39,725
1,931 7,730 4,217
82,511 35,769
1,668 6,690 3,762
8,720 9.6 3,956 10.0
263 13.6 1,040 13.5
455 10.8
91,196 40,036
1,897 7,734 4,192
82,466 35,966
1,667 6,650 3,710
8,730 9.6 4,070 10.2
230 12.1 1,084 14.0
482 11.5
Spalding Stephens Stewart Sumter Talbot
28,290 14,068
2,371 15,181
3,177
24,878 12,661
2,132 13,380
2,895
3,412 12.1 1,407 10.0
239 10.1 1,801 11.9
282 8.9
28,439 14,045
2,377 15,161
3,175
25,015 12,616
2,106 13,372
2,883
3,424 12.0 1,429 10.2
271 11.4 1,789 11.8
292 9.2
Taliaferro Tattnall Taylor Telfair Terrell
867 9,506 3,486 4,396 4,342
767 8,749 3,131 3,895 3,960
100 11.5 757 8.0 355 10.2 501 11.4 382 8.8
858 9,304 3,471 4,362 4,371
758 8,461 3,081 3,823 3,980
100 11.7 843 9.1 390 11.2 539 12.4 391 8.9
Thomas Tift Toombs Towns Treutlen
22,198 19,026 14,116
5,848 2,931
20,424 17,106 12,830
5,362 2,636
1,774 8.0 1,920 10.1 1,286 9.1
486 8.3 295 10.1
22,130 18,820 14,103
5,843 2,936
20,246 16,874 12,696
5,330 2,621
1,884 8.5 1,946 10.3 1,407 10.0
513 8.8 315 10.7
Troup Turner Twiggs Union Upson
30,950 4,974 4,706 11,560
12,145
27,014 4,263 4,239
10,527 10,752
3,936 12.7 711 14.3 467 9.9
1,033 8.9 1,393 11.5
30,951 4,853 4,673 11,513
12,127
27,071 4,154 4,225
10,455 10,757
3,880 12.5 699 14.4 448 9.6
1,058 9.2 1,370 11.3
Walker Walton Ware Warren Washington
34,587 40,486 15,318
2,644 8,326
29,982 36,569 13,827
2,198 7,364
4,605 13.3 3,917 9.7 1,491 9.7
446 16.9 962 11.6
33,878 40,877 15,302
2,618 8,344
30,129 36,771 13,783
2,184 7,337
3,749 11.1 4,106 10.0 1,519 9.9
434 16.6 1,007 12.1
Wayne Webster Wheeler White Whitfield
12,343 1,355 2,893
12,779 45,170
11,001 1,250 2,634 11,571 39,162
1,342 10.9 105 7.7 259 9.0
1,208 9.5 6,008 13.3
12,320 1,342 2,877
12,721 45,498
10,949 1,226 2,591 11,484
39,651
1,371 11.1 116 8.6 286 9.9
1,237 9.7 5,847 12.9
Wilcox Wilkes Wilkinson Worth
3,432 4,725 4,807 10,029
3,070 4,216 4,315 9,164
362 10.5 509 10.8 492 10.2 865 8.6
3,389 4,760 4,853 10,157
3,001 4,177 4,304 9,210
388 11.4 583 12.2 549 11.3 947 9.3
March 2008
Labor Force
Employment
Unemployment Number Rate
91,219 85,389 5,830 6.4
40,663 38,322 2,341 5.8
1,805 1,697
108 6.0
7,244 6,812
432 6.0
4,049 3,802
247 6.1
28,819 26,653 2,166 7.5
13,709 12,999
710 5.2
2,273 2,103
170 7.5
14,545 13,609
936 6.4
3,155 2,971
184 5.8
832 9,123 3,391 5,048 4,415
782 8,549 3,196 4,731 4,157
50 6.0 574 6.3 195 5.8 317 6.3 258 5.8
22,275 21,208 1,067 4.8
18,756 17,601 1,155 6.2
13,762 12,900
862 6.3
5,771 5,459
312 5.4
2,850 2,650
200 7.0
30,650 28,426 2,224 7.3
4,656 4,249
407 8.7
4,710 4,424
286 6.1
11,123 10,569
554 5.0
11,996 11,083
913 7.6
34,568 31,558 3,010 8.7
41,524 39,179 2,345 5.6
15,070 14,257
813 5.4
2,430 2,227
203 8.4
8,109 7,563
546 6.7
12,041 11,265
776 6.4
1,276 1,212
64 5.0
2,914 2,758 156 5.4
12,467 11,894
573 4.6
46,699 43,537 3,162 6.8
3,207 4,653 4,729 10,237
2,990 4,333 4,468 9,619
217 6.8 320 6.9 261 5.5 618 6.0
16
New Developments
GreenTech Manufacturing will be opening a manufacturing and distribution facility in Coffee County that will be an investment in the local economy of $20 million. The company has contracted for a 103,000 square foot building to be located on nine acres in Southwest Industrial Park in Douglas. GreenTech uses its Powder Impression Molding (PIM) system to produce strongerthan-steel, lightweight products that use up to 95 percent recycled materials from single-stream solid waste sources. Plans are for the first PIM products to come off the production line in September of this year and when fully operational the new facility will employ 320 people.
increase that number to around 200 when full production level is reachED.
QT Kitchen will be opening in Clayton County and hiring approximately 225 people to make sandwiches, doughnuts, and cookies for the QuikTrip convenience stores throughout the metro area. The 112,000 square foot bakery is located on East Clayton Drive in Ellenwood to have easy access to I-675 to get to the 115 stores it will serve. The company has already generated $16.2 million in real estate and construction costs. QuickTrip has also spent an additional $6.8 million for equipment for the facility.
In Laurens County Hi-Tek Rations will spend $1.5 million to expand their existing facility and double their production capability. The company bought a 30,000 square foot adjacent building on Industrial Boulevard in Dublin and is moving equipment in to start production of a new line of dog food. Hi-Tek will launch its new line of dog food called "Perfectly Natural" in April. The expansion should add some 30 new jobs to the local economy.
Crown Healthcare Laundry Services has opened their fourth facility and it is located in Brooks County. The company already operates three sights in other southeastern states and features quality products and excellent customer service. The new location in Quitman has been open for a month and already has 45 employees, but it is expected to
The first of three Food Lion grocery stores planned for Coweta County has opened just north of Newnan on Highway 29. The newly opened store has 34,928 square feet and employs 56 people. The company selected the area due to its growth potential. The second store in Sargent is scheduled to open later in March and the Grantville store is planned for later this year.
In Barrow County two big box retailers have opened their doors at Barrow Crossing shopping center in Winder. Target and Belk have begun doing business in the newly created retail hub at the corner of Georgia Highway 316 and Georgia Highway 81 South. These two stores have already provided some 250 new jobs between them. There is still more to come as PETCO, Publix, and McDonald's are slated to open in the not too distant future.
17
Georgia Unemployment Rates by County
March 2009
Dade
Catoosa
Murray
Fannin
Towns
Union
Rabun
Whitfield Walker
Gilmer
White Habersham
Chattooga
Gordon
Pickens
Lumpkin
Stephens
Floyd
Dawson
Banks Franklin Hart
Bartow Cherokee Forsyth Hall
13.0% or greater 11.0% to 12.9% 9.2% to 10.9%
Jackson Madison Elbert
Polk Haralson
Paulding Cobb
Barrow Gwinnett
DeKalb
Walton
Douglas Fulton
Rockdale
Clarke Oconee
Oglethorpe Wilkes
Lincoln
Carroll
Clayton
Newton Morgan Greene Taliaferro
Columbia
Fayette
Henry
McDuffie
Coweta Heard
Spalding
Butts Jasper Putnam
Warren Hancock Glascock
Richmond
Less than 9.2%
Troup
Meriwether
Pike Lamar Monroe
Jones Baldwin
Jefferson Washington
Burke
Upson
Harris
Talbot
Muscogee
Bibb Crawford
Taylor
Peach
Wilkinson Twiggs
Johnson
Emanuel
Jenkins
Screven
Marion Chattahoochee
Macon
Schley
Stewart Webster Sumter
Houston Bleckley
Laurens Treutlen
Candler Bulloch
Effingham
Dooly Crisp
Pulaski Wilcox
Dodge
Montgomery
Wheeler
Toombs
Telfair
Evans Tattnall
Bryan
Chatham
Quitman Terrell Lee
Randolph
Turner
Ben Hill
Jeff Davis Appling
Liberty Long
Clay Calhoun Dougherty
Early
Baker
Miller
Mitchell
Worth
Irwin Tift
Coffee
Colquitt
Berrien Atkinson Cook
Seminole Decatur
Grady
Thomas
Brooks
Lanier
Clinch
Lowndes Echols
Bacon
Wayne
Pierce
Ware
Brantley
McIntosh Glynn
Charlton
Camden
Georgia's Unemployment Rate: 9.2%
18
Georgia Unemployment Insurance Claims by County
County
March Average Average Initial Weekly Duration Claims Benefit Weeks
County
March Average Average Initial Weekly Duration Claims Benefit Weeks
Georgia
96,306 ....... $277 ...... 12.1
Appling
409 ....... $235 ...... 11.6
Atkinson
178 ....... $227 ...... 10.3
Bacon
157 ....... $224 ...... 11.1
Baker
25 ....... $204 ...... 12.5
Baldwin
472 ....... $216 ...... 13.7
Banks
221 ....... $250 ...... 11.5
Barrow
594 ....... $253 ...... 13.8
Bartow
1,402 ....... $252 ...... 10.5
Ben Hill
295 ....... $226 ...... 12.2
Berrien
682 ....... $234 ...... 11.9
Bibb
1,164 ....... $200 ...... 13.7
Bleckley
243 ....... $225 ........ 8.5
Brantley
157 ....... $244 ...... 12.6
Brooks
104 ....... $218 ...... 11.8
Bryan
146 ....... $259 ...... 13.1
Bulloch
464 ....... $219 ...... 11.2
Burke
342 ....... $220 ...... 11.9
Butts
197 ....... $236 ...... 14.8
Calhoun
89 ....... $209 ...... 11.5
Camden
186 ....... $224 ...... 13.0
Candler
114 ....... $214 ...... 10.4
Carroll
1,245 ....... $244 ...... 10.9
Catoosa
1,143 ....... $254 ........ 9.7
Charlton
45 ....... $233 ...... 13.8
Chatham
1,687 ....... $229 ...... 14.3
Chattahoochee 15 ....... $222 ...... 14.7
Chattooga
138 ....... $243 ...... 14.4
Cherokee
1,542 ....... $271 ...... 13.7
Clarke
925 ....... $221 ...... 11.8
Clay
43 ....... $223 ...... 10.9
Clayton
2,421 ....... $240 ...... 14.8
Clinch
63 ....... $220 ...... 13.2
Cobb
3,959 ....... $262 ...... 14.9
Coffee
508 ....... $233 ...... 10.6
Colquitt
447 ....... $217 ...... 10.6
Columbia
603 ....... $253 ...... 11.3
Cook
318 ....... $226 ...... 12.5
Coweta
1,036 ....... $253 ...... 12.2
Crawford
106 ....... $222 ...... 12.4
Crisp
229 ....... $193 ...... 13.8
Dade
129 ....... $250 ...... 12.0
Dawson
200 ....... $258 ...... 14.2
Decatur
402 ....... $225 ...... 13.8
DeKalb
4,999 ....... $247 ...... 15.0
Dodge
214 ....... $216 ...... 10.4
Dooly
131 ....... $213 ...... 10.8
Dougherty
643 ....... $197 ...... 12.4
Douglas
926 ....... $254 ...... 14.0
Early
88 ....... $207 ...... 14.1
Echols
22 ....... $245 ...... 11.7
Effingham
342 ....... $257 ...... 12.7
Elbert Emanuel Evans Fannin Fayette Floyd Forsyth Franklin Fulton Gilmer Glascock Glynn Gordon Grady Greene Gwinnett Habersham Hall Hancock Haralson Harris Hart Heard Henry Houston Irwin Jackson Jasper Jeff Davis Jefferson Jenkins Johnson Jones Lamar Lanier Laurens Lee Liberty Lincoln Long Lowndes Lumpkin Macon Madison Marion McDuffie McIntosh Meriwether Miller Mitchell Monroe Montgomery Morgan Murray
506 ....... $236 ...... 10.8 348 ....... $197 ...... 10.7
61 ....... $210 ...... 12.8 311 ....... $216 ...... 12.7 475 ....... $265 ...... 14.0 2,659 ....... $236 ........ 9.7 920 ....... $277 ...... 14.2 365 ....... $241 ...... 10.4 5,961 ....... $244 ...... 15.0 472 ....... $236 ...... 11.5 25 ....... $243 ........ 8.9 631 ....... $218 ...... 12.1 1,456 ....... $255 ........ 9.4 407 ....... $239 ...... 12.5 250 ....... $215 ...... 11.1 4,644 ....... $268 ...... 15.0 851 ....... $239 ........ 9.7 2,025 ....... $256 ...... 12.5 170 ....... $210 ...... 13.6 434 ....... $249 ...... 10.6 238 ....... $241 ...... 12.2 498 ....... $234 ...... 11.4 143 ....... $252 ...... 10.4 1,198 ....... $256 ...... 14.6 673 ....... $224 ...... 13.1 147 ....... $225 ...... 13.3 559 ....... $253 ...... 12.3 162 ....... $244 ...... 14.4 403 ....... $236 ...... 11.2 236 ....... $207 ...... 11.4 201 ....... $198 ...... 15.0 202 ....... $216 ...... 11.8 142 ....... $228 ...... 13.3 255 ....... $237 ...... 12.6 96 ....... $217 ...... 12.8 1,115 ....... $205 ...... 11.2 163 ....... $245 ...... 10.7 191 ....... $223 ...... 13.9 134 ....... $246 ...... 10.0 48 ....... $220 ...... 12.6 857 ....... $207 ...... 13.1 368 ....... $253 ...... 14.8 377 ....... $204 ........ 9.3 354 ....... $253 ...... 10.9 75 ....... $226 ...... 11.1 259 ....... $214 ...... 10.7 86 ....... $231 ...... 11.7 300 ....... $234 ...... 11.9 73 ....... $212 ...... 14.0 182 ....... $201 ...... 13.7 174 ....... $230 ...... 13.0 112 ....... $207 ...... 11.7 190 ....... $238 ...... 11.7 1,698 ....... $259 ........ 7.9
Initial claims include intrastate initial and additional claims, as well as agent state initial and additional claims for regular UI only. Average duration of benefits is represented in weeks.
County
March Average Average Initial Weekly Duration Claims Benefit Weeks
Muscogee Newton Oconee Oglethorpe Paulding Peach Pickens Pierce Pike Polk Pulaski Putnam Quitman Rabun Randolph Richmond Rockdale Schley Screven Seminole Spalding Stephens Stewart Sumter Talbot Taliaferro Tattnall Taylor Telfair Terrell Thomas Tift Toombs Towns Treutlen Troup Turner Twiggs Union Upson Walker Walton Ware Warren Washington Wayne Webster Wheeler White Whitfield Wilcox Wilkes Wilkinson Worth
1,077 ....... $213 ...... 12.4 1,068 ....... $253 ...... 14.0
192 ....... $250 ...... 11.8 179 ....... $247 ...... 11.0 881 ....... $265 ...... 13.9 295 ....... $208 ...... 11.7 293 ....... $253 ...... 12.5 238 ....... $228 ...... 10.2 183 ....... $244 ...... 13.1 1,650 ....... $241 ........ 9.6 110 ....... $234 ...... 10.0 302 ....... $229 ...... 11.7
1 ....... $287 ...... 10.6 283 ....... $234 ........ 8.9 142 ....... $235 ........ 7.4 1,524 ....... $218 ...... 12.8 680 ....... $253 ...... 14.3
77 ....... $198 ........ 9.0 527 ....... $249 ...... 10.7 107 ....... $208 ...... 15.2 860 ....... $224 ...... 13.7 601 ....... $238 ........ 9.7
52 ....... $197 ...... 11.6 413 ....... $183 ...... 12.5
63 ....... $230 ...... 12.3 29 ....... $194 ...... 11.4 109 ....... $207 ...... 12.0 136 ....... $207 ...... 10.5 122 ....... $240 ........ 9.8 78 ....... $205 ...... 12.3 513 ....... $222 ...... 11.9 654 ....... $225 ...... 12.1 368 ....... $217 ...... 11.4 111 ....... $223 ...... 12.8 81 ....... $242 ........ 9.8 1,122 ....... $243 ...... 11.1 159 ....... $178 ...... 12.9 134 ....... $224 ...... 11.1 232 ....... $233 ...... 13.0 260 ....... $219 ...... 12.1 1,779 ....... $241 ........ 9.5 636 ....... $249 ...... 14.1 336 ....... $210 ...... 10.6 84 ....... $215 ...... 10.2 198 ....... $198 ...... 12.3 248 ....... $236 ...... 12.9 36 ....... $238 ...... 10.6 71 ....... $227 ...... 10.1 277 ....... $237 ...... 11.2 4,249 ....... $260 ........ 7.8 50 ....... $217 ...... 13.4 178 ....... $216 ...... 11.6 140 ....... $213 ...... 11.7 237 ....... $211 ...... 10.9
19
Georgia Department of Labor Workforce Information & Analysis 148 Andrew Young International Boulevard, N.E. Atlanta, Georgia 30303-1751
Return Service Requested