- Collection:
- Georgia Government Publications
- Title:
- Dimensions: measuring Georgia's workforce, Vol. 34, no. 8 (Aug. 2008)
- Creator:
- Georgia. Department of Labor
- Contributor to Resource:
- Georgia. Workforce Information and Analysis
- Publisher:
- Atlanta, Ga. : Georgia Dept. of Labor, 2008-08
- Date of Original:
- 2008-08
- Subject:
- Labor market--Georgia--Statistics
Wages--Georgia--Statistics
Hours of labor--Georgia--Statistics - Location:
- United States, Georgia, 32.75042, -83.50018
- Medium:
- state government records
- Type:
- Text
- Format:
- application/pdf
- External Identifiers:
- Call Number GA L200.E46 P1 T7 34/8
- Metadata URL:
- https://dlg.galileo.usg.edu/id:dlg_ggpd_i-ga-bl200-pe46-bp1-bt7-b34-s8-belec-p-btext
- Digital Object URL:
- https://dlg.galileo.usg.edu/do:dlg_ggpd_i-ga-bl200-pe46-bp1-bt7-b34-s8-belec-p-btext
- Language:
- eng
- Holding Institution:
- University of Georgia. Map and Government Information Library
- Rights:
-

August 2008 Data
August 2008 Employment Situation
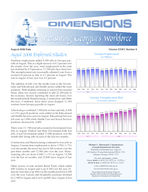
Nonfarm employment added 8,100 jobs to Georgia payrolls in August. This is a slight increase of 0.2 percent over the month. Over the year, total employment in the state has declined by 0.9 percent as 37,700 jobs have been lost. The unemployment rate (seasonally adjusted) rose from a revised 6.0 percent in July to 6.3 percent in August. The rate in August of last year was 4.4 percent.
The addition of jobs over the month come as the Government and Educational and Health sectors added the most positions. With students returning to school from summer break, these two sectors combined to add 22,100 jobs to the economy. Sectors reporting the most job losses over the month include Manufacturing, Construction, and Other Services. Combined, these three areas dropped 11,100 workers from Georgia payrolls in August.
After losing a combined 7,500 jobs in June and July, 6,400 (+1.4%) payroll positions were added in the Educational and Health Services sector in August. Educational Services job were up 1,800 while Health Care and Social Services positions increased by 4,600.
There were 15, 700 total jobs created in Government from July to August. Federal and State Government both lost jobs. Local Government added 17,000 positions over the month after losing jobs in each of the last two months.
Construction and Manufacturing continued to lose jobs in August. Construction employment is down 3,700 (-1.7%) over the month, the sector has lost 8,300 workers over the past three months and 12,300 jobs over the year. Manufacturing jobs are down 4,400 (-1.1%) in August, 15,500 over the last six months, and 22,800 since August of last year.
Other sectors of note include Retail Trade which added 800 workers in August and is up 6,700 over the year. Financial Activities is up 400 over the month and down 4,500 over the year. Leisure and Hospitality positions declined by 2,500 in August and is now up 800 since August of last year.
Volume XXXIV, Number 8 Georgia Employment
(In Millions)
4.16 4.15 4.17 4.19 4.19 4.14 4.15 4.16 4.17 4.18 4.16 4.11 4.12
Aug Sep Oct Nov Dec Jan Feb Mar Apr May Jun Jul Aug
2007
2008
Georgia Unemployment Rate
(Seasonally adjusted)
4.4%
4.5%
4.5%
4.5%
4.5%
4.9%
5.1%
5.3%
5.3%
5.7%
5.6%
6.0%
6.3%
Aug Sep Oct Nov Dec Jan Feb Mar Apr May Jun Jul Aug
2007
2008
Michael L. Thurmond, Commissioner Georgia Department of Labor
Workforce Information & Analysis 148 Andrew Young International Blvd., N.E.
Atlanta, Georgia 30303-1751
For more information, contact Corey Smith at (404) 232-3875 ext. 21299 or
David Echols at (404)232-3875 ext. 21272
corey.smith@dol.state.ga.us
david.echols@dol.state.ga.us
Equal Opportunity Employer/Program Auxiliary Aids and Services Available upon
Request to Individuals with Disabilities
GEORGIA Nonagricultural Employment (000s)
Change in Jobs
Change in Jobs
Preliminary Revised
Revised
AUG 2008 JUL 2008 AUG 2007
from JUL 2008 Net %
from AUG 2007 Net %
Total Nonfarm
4,122.3
4,114.2
4,160.0
+8.1 +0.2
-37.7 -0.9
Total Private
3,455.5
3,463.1
3,490.3
-7.6 -0.2
-34.8 -1.0
Goods Producing
631.2
639.3
666.9
-8.1 -1.3
-35.7 -5.4
Service-Providing
3,491.1
3,474.9
3,493.1
+16.2 +0.5
-2.0 -0.1
Private Service-Providing
2,824.3
2,823.8
2,823.4
+.5 +0.0
+.9 +0.0
Natural Resources and Mining
11.4
11.4
12.0
+.0 +0.0
-.6 -5.0
Construction
211.7
215.4
224.0
-3.7 -1.7
-12.3 -5.5
Construction of Buildings
47.7
48.4
50.3
-.7 -1.4
-2.6 -5.2
Heavy and Civil Engineering Construction
32.7
33.3
34.5
-.6 -1.8
-1.8 -5.2
Specialty Trade Contractors
131.3
133.7
139.2
-2.4 -1.8
-7.9 -5.7
Manufacturing
408.1
412.5
430.9
-4.4 -1.1
-22.8 -5.3
Durable Goods
193.7
196.5
203.0
-2.8 -1.4
-9.3 -4.6
Computer, Electrical Equip and Appliance Mfg
27.5
27.7
28.1
-.2 -0.7
-.6 -2.1
Transportation Equipment Manufacturing
39.4
39.4
41.6
+.0 +0.0
-2.2 -5.3
Non-Durable Goods
214.4
216.0
227.9
-1.6 -0.7
-13.5 -5.9
Food Manufacturing
65.2
64.8
67.8
+.4 +0.6
-2.6 -3.8
Textile Mills
24.5
24.5
26.9
+.0 +0.0
-2.4 -8.9
Textile Product Mills
34.7
35.7
37.4
-1.0 -2.8
-2.7 -7.2
Trade, Transportation and Utilities
890.6
891.0
886.4
-.4 +0.0
+4.2 +0.5
Wholesale Trade
216.7
217.3
220.6
-.6 -0.3
-3.9 -1.8
Merchant Wholesalers, Durable Goods
111.0
111.9
114.3
-.9 -0.8
-3.3 -2.9
Merchant Wholesalers, Non-durable Goods
61.9
61.8
62.7
+.1 +0.2
-.8 -1.3
Wholesale Electronic Markets and Agents and Brokers
43.8
43.6
43.6
+.2 +0.5
+.2 +0.5
Retail Trade
482.3
481.5
475.6
+.8 +0.2
+6.7 +1.4
Food and Beverage Stores
80.4
80.6
81.2
-.2 -0.2
-.8 -1.0
General Merchandise Stores
99.5
99.2
97.3
+.3 +0.3
+2.2 +2.3
Miscellaneous Store Retailers
23.6
23.3
23.8
+.3 +1.3
-.2 -0.8
Transportation, Warehousing, and Utilities
191.6
192.2
190.2
-.6 -0.3
+1.4 +0.7
Utilities
20.9
21.1
20.5
-.2 -0.9
+.4 +2.0
Transportation and Warehousing
170.7
171.1
169.7
-.4 -0.2
+1.0 +0.6
Air Transportation
37.3
37.9
39.2
-.6 -1.6
-1.9 -4.8
Truck Transportation
49.9
49.9
50.3
+.0 +0.0
-.4 -0.8
Couriers and Messengers
19.0
19.1
19.4
-.1 -0.5
-.4 -2.1
Warehousing and Storage
27.5
27.4
27.4
+.1 +0.4
+.1 +0.4
Information
114.3
115.1
114.2
-.8 -0.7
+.1 +0.1
Telecommunications
52.9
52.7
51.8
+.2 +0.4
+1.1 +2.1
Wired Telecommunications Carriers
27.0
26.8
26.5
+.2 +0.7
+.5 +1.9
Wireless Telecommunications Carriers
13.4
13.3
12.4
+.1 +0.8
+1.0 +8.1
Internet Service Providers, Search Portals, and DP
10.5
10.6
10.9
-.1 -0.9
-.4 -3.7
Financial Activities
227.9
227.5
232.4
+.4 +0.2
-4.5 -1.9
Finance and Insurance
163.0
163.0
167.1
+.0 +0.0
-4.1 -2.5
Insurance Carriers and Related Activities
65.7
66.4
66.6
-.7 -1.1
-.9 -1.4
Real Estate, Rental and Leasing
64.9
64.5
65.3
+.4 +0.6
-.4 -0.6
Professional and Business Services
559.9
559.5
565.9
+.4 +0.1
-6.0 -1.1
Professional, Scientific, and Technical Services
222.2
221.2
219.0
+1.0 +0.5
+3.2 +1.5
Accounting, Tax Preparation and Bookkeeping
27.8
27.7
28.0
+.1 +0.4
-.2 -0.7
Architectural, Engineering and Related Services
40.8
40.5
41.4
+.3 +0.7
-.6 -1.4
Computer Systems Design and Related Services
46.8
47.3
48.0
-.5 -1.1
-1.2 -2.5
Management and Technical Consulting Services
31.1
30.5
29.7
+.6 +2.0
+1.4 +4.7
Management of Companies and Enterprises
53.7
53.8
53.9
-.1 -0.2
-.2 -0.4
Admin and Support, Waste Mngmnt and Remediation
284.0
284.5
293.0
-.5 -0.2
-9.0 -3.1
Employment Services
137.9
140.1
141.9
-2.2 -1.6
-4.0 -2.8
Educational and Health Services
466.1
459.7
457.1
+6.4 +1.4
+9.0 +2.0
Educational Services
82.4
80.6
79.8
+1.8 +2.2
+2.6 +3.3
Colleges, Universities, and Professional Schools
48.4
49.0
49.3
-.6 -1.2
-.9 -1.8
Health Care and Social Assistance
383.7
379.1
377.3
+4.6 +1.2
+6.4 +1.7
Ambulatory Health Care Services
144.3
144.6
142.5
-.3 -0.2
+1.8 +1.3
Hospitals
127.3
126.4
123.9
+.9 +0.7
+3.4 +2.7
Nursing and Residential Care Facilities
56.1
55.5
55.4
+.6 +1.1
+.7 +1.3
Social Assistance
56.0
52.6
55.5
+3.4 +6.5
+.5 +0.9
Leisure and Hospitality
405.7
408.2
404.9
-2.5 -0.6
+.8 +0.2
Arts, Entertainment, and Recreation
44.2
46.7
44.6
-2.5 -5.4
-.4 -0.9
Amusement, Gambling, and Recreation
32.9
34.7
33.2
-1.8 -5.2
-.3 -0.9
Accommodation and Food Services
361.5
361.5
360.3
+.0 +0.0
+1.2 +0.3
Accommodation
44.3
44.9
44.4
-.6 -1.3
-.1 -0.2
Food Services and Drinking Places
317.2
316.6
315.9
+.6 +0.2
+1.3 +0.4
Other Services
159.8
162.8
162.5
-3.0 -1.8
-2.7 -1.7
Repair and Maintenance
35.4
37.4
37.3
-2.0 -5.3
-1.9 -5.1
Personal and Laundry Services
35.1
35.0
35.5
+.1 +0.3
-.4 -1.1
Religious, Grantmaking, Civic, Professional and Similar
89.3
90.4
89.7
-1.1 -1.2
-.4 -0.4
Government
666.8
651.1
669.7
+15.7 +2.4
-2.9 -0.4
Federal Government
95.5
96.2
94.8
-.7 -0.7
+.7 +0.7
Department of Defense
35.9
36.0
34.9
-.1 -0.3
+1.0 +2.9
State Government
155.1
155.7
157.4
-.6 -0.4
-2.3 -1.5
State Government Education
71.8
70.9
72.2
+.9 +1.3
-.4 -0.6
Local Government
416.2
399.2
417.5
+17.0 +4.3
-1.3 -0.3
Local Government Education
251.5
234.5
253.4
+17.0 +7.2
-1.9 -0.7
Note: These preliminary estimates were prepared in cooperation with the U.S. Department of Labor, Bureau of Labor Statistics, based upon monthly reports submitted by selected employers
throughout Georgia. The estimates include all full- and part-time wage and salary workers who were employed during or received pay for any part of the pay period that includes the twelfth of the
month. Proprietors, domestic workers, self-employed persons, unpaid family workers and personnel of the armed forces are excluded. Estimates based on 2007 benchmark.
2
Source: Georgia Department of Labor, Workforce Information & Analysis
ATLANTA MSA Nonagricultural Employment (000s)
Preliminary AUG 2008
Revised
Revised
JUL 2008 AUG 2007
Change in Jobs
from JUL 2008
Net
%
Change in Jobs from AUG 2007
Net %
Total Nonfarm Total Private Goods Producing Service-Providing Private Service-Providing Natural Resources and Mining Construction
Construction of Buildings Specialty Trade Contractors Manufacturing Durable Goods Transportation Equipment Manufacturing Non-Durable Goods Food Manufacturing Trade, Transportation and Utilities Wholesale Trade Merchant Wholesalers, Durable Goods Merchant Wholesalers, Non-durable Goods Wholesale Electronic Markets and Agents and Brokers Retail Trade Food and Beverage Stores General Merchandise Stores Miscellaneous Store Retailers Transportation, Warehousing, and Utilities Utilities Transportation and Warehousing
Air Transportation Truck Transportation Couriers and Messengers Information Telecommunications Wired Telecommunications Carriers Wireless Telecommunications Carriers Internet Service Providers, Search Portals, and DP Financial Activities Finance and Insurance Insurance Carriers and Related Activities Real Estate, Rental and Leasing Professional and Business Services Professional, Scientific, and Technical Services Accounting, Tax Preparation and Bookkeeping Architectural, Engineering and Related Services Computer Systems Design and Related Services Management and Technical Consulting Services Management of Companies and Enterprises Admin and Support, Waste Mngmnt and Remediation Employment Services Educational and Health Services Educational Services Health Care and Social Assistance Ambulatory Health Care Services Hospitals Social Assistance Leisure and Hospitality Arts, Entertainment, and Recreation Accommodation and Food Services Accommodation Food Services and Drinking Places Other Services Repair and Maintenance Personal and Laundry Services Government Federal Government State Government Local Government
2,449.8 2,121.0
302.6 2,147.2 1,818.4
2.4 132.5
30.3 82.9 167.7 88.1 15.0 79.6 24.8 559.7 158.7 83.8 41.5 33.4 271.8 49.1 51.9 15.6 129.2 11.4 117.8 37.2 29.7 15.5 88.1 37.8 21.8 10.6
9.6 159.5 112.6
46.0 46.9 410.4 172.4 18.7 31.0 38.5 27.0 40.9 197.1 93.2 260.2 55.8 204.4 79.2 66.4 33.1 241.0 29.7 211.3 24.2 187.1 99.5 21.3 24.0 328.8 45.8 68.0 215.0
2,439.9 2,123.4
307.7 2,132.2 1,815.7
2.4 135.9
30.5 85.0 169.4 88.9 14.8 80.5 24.8 561.0 159.1 84.3 41.5 33.3 272.5 49.3 52.1 15.7 129.4 11.4 118.0 37.5 29.6 15.6 88.5 37.8 21.6 10.8
9.8 159.7 112.8
46.1 46.9 408.5 171.1 18.2 30.8 38.7 26.7 40.9 196.5 93.5 257.1 55.1 202.0 79.2 65.7 31.5 241.3 30.9 210.4 24.3 186.1 99.6 21.1 23.9 316.5 46.2 65.5 204.8
2,469.9 2,140.6
318.8 2,151.1 1,821.8
2.5 140.5
31.4 88.1 175.8 92.0 15.8 83.8 25.2 562.5 161.5 85.4 41.7 34.4 271.4 49.5 50.6 15.5 129.6 11.1 118.5 38.4 30.8 15.4 87.7 37.7 21.6 10.2 10.3 163.2 116.0 45.8 47.2 413.6 171.0 18.9 31.5 39.3 26.1 41.4 201.2 94.0 254.4 54.0 200.4 78.6 64.6 32.7 240.9 30.0 210.9 24.0 186.9 99.5 21.5 23.8 329.3 44.6 70.4 214.3
+9.9 -2.4 -5.1 +15.0 +2.7 +.0 -3.4
-.2 -2.1 -1.7
-.8 +.2 -.9 +.0 -1.3 -.4 -.5 +.0 +.1 -.7 -.2 -.2 -.1 -.2 +.0 -.2 -.3 +.1 -.1 -.4 +.0 +.2 -.2 -.2 -.2 -.2 -.1 +.0 +1.9 +1.3 +.5 +.2 -.2 +.3 +.0 +.6 -.3 +3.1 +.7 +2.4 +.0 +.7 +1.6 -.3 -1.2 +.9 -.1 +1.0 -.1 +.2 +.1 +12.3 -.4 +2.5 +10.2
+0.4 -0.1 -1.7 +0.7 +0.1 +0.0 -2.5 -0.7 -2.5 -1.0 -0.9 +1.4 -1.1 +0.0 -0.2 -0.3 -0.6 +0.0 +0.3 -0.3 -0.4 -0.4 -0.6 -0.2 +0.0 -0.2 -0.8 +0.3 -0.6 -0.5 +0.0 +0.9 -1.9 -2.0 -0.1 -0.2 -0.2 +0.0 +0.5 +0.8 +2.7 +0.6 -0.5 +1.1 +0.0 +0.3 -0.3 +1.2 +1.3 +1.2 +0.0 +1.1 +5.1 -0.1 -3.9 +0.4 -0.4 +0.5 -0.1 +0.9 +0.4 +3.9 -0.9 +3.8 +5.0
-20.1 -19.6 -16.2
-3.9 -3.4
-.1 -8.0 -1.1 -5.2 -8.1 -3.9
-.8 -4.2
-.4 -2.8 -2.8 -1.6
-.2 -1.0 +.4
-.4 +1.3
+.1 -.4 +.3 -.7 -1.2 -1.1 +.1 +.4 +.1 +.2 +.4 -.7 -3.7 -3.4 +.2 -.3 -3.2 +1.4 -.2 -.5 -.8 +.9 -.5 -4.1 -.8 +5.8 +1.8 +4.0 +.6 +1.8 +.4 +.1 -.3 +.4 +.2 +.2 +.0 -.2 +.2 -.5 +1.2 -2.4 +.7
-0.8 -0.9 -5.1 -0.2 -0.2 -4.0 -5.7 -3.5 -5.9 -4.6 -4.2 -5.1 -5.0 -1.6 -0.5 -1.7 -1.9 -0.5 -2.9 +0.1 -0.8 +2.6 +0.6 -0.3 +2.7 -0.6 -3.1 -3.6 +0.6 +0.5 +0.3 +0.9 +3.9 -6.8 -2.3 -2.9 +0.4 -0.6 -0.8 +0.8 -1.1 -1.6 -2.0 +3.4 -1.2 -2.0 -0.9 +2.3 +3.3 +2.0 +0.8 +2.8 +1.2 +0.0 -1.0 +0.2 +0.8 +0.1 +0.0 -0.9 +0.8 -0.2 +2.7 -3.4 +0.3
Note: These preliminary estimates were prepared in cooperation with the U.S. Department of Labor, Bureau of Labor Statistics, based upon monthly reports submitted by selected employers
in the Atlanta Metropolitan Statistical Area, which includes Barrow, Bartow, Butts, Carroll, Cherokee, Clayton, Cobb, Coweta, Dawson, DeKalb, Douglas, Fayette, Forsyth, Fulton, Gwinnett, Haralson, Heard, Henry, Jasper, Lamar, Meriwether, Newton, Paulding, Pickens, Pike, Rockdale, Spalding and Walton counties. The estimates include all full- and part-time wage and salary workers who were employed during or received pay for any part of the pay period that includes the twelfth of the month. Proprietors, domestic workers, self-employed persons, unpaid family workers and personnel of the armed forces are excluded. Estimates based on 2007 benchmark.
Source: Georgia Department of Labor, Workforce Information & Analysis
3
ALBANY MSA Nonagricultural Employment (000s)
Preliminary
Revised
Revised
AUG 2008 JUL 2008 AUG 2007
Change in Jobs from JUL 2008
Net %
Change in Jobs
from AUG 2007
Net
%
Total Nonfarm Total Private
63.8
64.4
64.1
50.4
50.5
50.7
-.6 -0.9 -.1 -0.2
-.3 -0.5 -.3 -0.6
Goods Producing Service-Providing Private Service-Providing
10.0
9.9
9.9
53.8
54.5
54.2
40.4
40.6
40.8
+.1 +1.0 -.7 -1.3 -.2 -0.5
+.1 +1.0 -.4 -0.7 -.4 -1.0
Manufacturing Trade, Transportation and Utilities Retail Trade
6.6
6.6
6.7
13.1
13.1
13.4
7.9
7.9
8.1
+.0 +0.0 +.0 +0.0 +.0 +0.0
-.1 -1.5 -.3 -2.2 -.2 -2.5
Government Federal Government State Government
13.4
13.9
13.4
-.5 -3.6
3.1
3.1
3.1
+.0 +0.0
2.7
2.9
2.8
-.2 -6.9
+.0 +0.0 +.0 +0.0 -.1 -3.6
Local Government
7.6
7.9
7.5
-.3 -3.8
+.1 +1.3
Note: These preliminary estimates were prepared in cooperation with the U.S. Department of Labor, Bureau of Labor Statistics, based upon monthly reports submitted by selected employers
in the Albany Metropolitan Statistical Area, which includes Baker, Dougherty, Lee, Terrell and Worth counties. The estimates include all full- and part-time wage and salary workers who were employed during or received pay for any part of the pay period that includes the twelfth of the month. Proprietors, domestic workers, self-employed persons, unpaid family workers and personnel
of the armed forces are excluded. Estimates based on 2007 benchmark.
ATHENS - CLARKE MSA Nonagricultural Employment (000s)
Preliminary
Revised
Revised
AUG 2008 JUL 2008 AUG 2007
Change in Jobs
from JUL 2008
Net
%
Change in Jobs from AUG 2007
Net %
Total Nonfarm
83.5
83.7
82.0
-.2 -0.2
+1.5 +1.8
Total Private
60.5
60.5
59.3
+.0 +0.0
+1.2 +2.0
Goods Producing
12.4
12.6
12.7
-.2 -1.6
-.3 -2.4
Service-Providing
71.1
71.1
69.3
+.0 +0.0
+1.8 +2.6
Private Service-Providing
48.1
47.9
46.6
+.2 +0.4
+1.5 +3.2
Trade, Transportation and Utilities
13.6
13.7
13.7
-.1 -0.7
-.1 -0.7
Retail Trade
9.3
9.4
9.3
-.1 -1.1
+.0 +0.0
Professional and Business Services
6.8
6.7
6.5
+.1 +1.5
+.3 +4.6
Leisure and Hospitality
8.5
8.5
8.0
+.0 +0.0
+.5 +6.3
Government
23.0
23.2
22.7
-.2 -0.9
+.3 +1.3
Federal Government
1.6
1.6
1.7
+.0 +0.0
-.1 -5.9
State Government
13.8
13.8
13.8
+.0 +0.0
+.0 +0.0
Local Government
7.6
7.8
7.2
-.2 -2.6
+.4 +5.6
Note: These preliminary estimates were prepared in cooperation with the U.S. Department of Labor, Bureau of Labor Statistics, based upon monthly reports submitted by selected employers in
the Athens - Clarke County Metropolitan Statistical Area, which includes Clarke, Madison, Oconee and Oglethorpe counties. The estimates include all full- and part-time wage and salary workers who were employed during or received pay for any part of the pay period that includes the twelfth of the month. Proprietors, domestic workers, self-employed persons, unpaid family workers and personnel of the armed forces are excluded. Estimates based on 2007 benchmark.
Source: Georgia Department of Labor, Workforce Information & Analysis
4
AUGUSTA-RICHMOND MSA Nonagricultural Employment (000s)
Preliminary Revised Revised AUG 2008 JUL 2008 AUG 2007
Change in Jobs from JUL 2008
Net %
Change in Jobs from AUG 2007
Net %
Total Nonfarm Total Private Goods Producing Service-Providing Private Service-Providing Natural Resources, Mining and Construction Manufacturing Trade, Transportation and Utilities
Wholesale Trade Retail Trade Transportation,Warehousing, and Utilities Information Financial Activitities Professional and Business Services Educational and Health Services Leisure and Hospitality Other Services Government Federal Government State Government Local Government
215.0 174.1
37.3 177.7 136.8
13.9 23.4 37.4
5.3 25.3
6.8 3.8 7.4 29.9 28.0 21.4 8.9 40.9 7.6 12.7 20.6
218.8 175.9
37.6 181.2 138.3
14.1 23.5 37.6
5.4 25.5
6.7 3.7 7.3 30.7 28.0 22.0 9.0 42.9 7.6 13.0 22.3
213.9 173.8
38.5 175.4 135.3
14.2 24.3 37.0
5.3 25.0
6.7 3.9 7.4 29.7 27.6 20.9 8.8 40.1 7.5 12.4 20.2
-3.8 -1.7 -1.8 -1.0
-.3 -0.8 -3.5 -1.9 -1.5 -1.1
-.2 -1.4 -.1 -0.4 -.2 -0.5 -.1 -1.9 -.2 -0.8 +.1 +1.5 +.1 +2.7 +.1 +1.4 -.8 -2.6 +.0 +0.0 -.6 -2.7 -.1 -1.1 -2.0 -4.7 +.0 +0.0 -.3 -2.3 -1.7 -7.6
+1.1 +.3 -1.2
+2.3 +1.5
-.3 -.9 +.4 +.0 +.3 +.1 -.1 +.0 +.2 +.4 +.5 +.1 +.8 +.1 +.3 +.4
+0.5 +0.2 -3.1 +1.3 +1.1 -2.1 -3.7 +1.1 +0.0 +1.2 +1.5 -2.6 +0.0 +0.7 +1.4 +2.4 +1.1 +2.0 +1.3 +2.4 +2.0
Note: These preliminary estimates were prepared in cooperation with the U.S. Department of Labor, Bureau of Labor Statistics, based upon monthly reports submitted by selected employers in the
Augusta - Richmond County Metropolitan Statistical Area, which includes Burke, Columbia, McDuffie and Richmond counties in Georgia and Aiken and Edgefield counties in South Carolina. The estimates include all full- and part-time wage and salary workers who were employed during or received pay for any part of the pay period that includes the twelfth of the month. Proprietors, domestic
workers, self-employed persons, unpaid family workers and personnel of the armed forces are excluded. Estimates based on 2007 benchmark.
COLUMBUS MSA Nonagricultural Employment (000s)
Preliminary Revised Revised AUG 2008 JUL 2008 AUG 2007
Change in Jobs from JUL 2008
Net %
Change in Jobs from AUG 2007
Net %
Total Nonfarm Total Private Goods Producing
120.2 98.5 16.3
121.7 99.3 16.4
120.4 99.2 17.1
-1.5 -1.2 -.8 -0.8 -.1 -0.6
-.2 -0.2 -.7 -0.7 -.8 -4.7
Service-Providing Private Service-Providing Trade, Transportation and Utilities
103.9 82.2 18.2
105.3 82.9 18.2
103.3 82.1 18.4
-1.4 -1.3 -.7 -0.8 +.0 +0.0
+.6 +0.6 +.1 +0.1 -.2 -1.1
Retail Trade Information Financial Activities
13.5
13.6
14.0
5.8
5.9
5.9
9.4
9.4
9.3
-.1 -0.7 -.1 -1.7 +.0 +0.0
-.5 -3.6 -.1 -1.7 +.1 +1.1
Finance and Insurance Insurance Carriers and Related Activities Professional and Business Services
7.4
7.4
7.5
5.1
5.0
5.0
14.3
14.4
14.3
+.0 +0.0 +.1 +2.0 -.1 -0.7
-.1 -1.3 +.1 +2.0 +.0 +0.0
Leisure and Hospitality Government
Federal Government
13.6
13.8
13.8
21.7
22.4
21.2
5.3
5.3
5.2
-.2 -1.4 -.7 -3.1 +.0 +0.0
-.2 -1.4 +.5 +2.4 +.1 +1.9
State Government Local Government
3.9
3.9
3.8
12.5
13.2
12.2
+.0 +0.0 -.7 -5.3
+.1 +2.6 +.3 +2.5
Note: These preliminary estimates were prepared in cooperation with the U.S. Department of Labor, Bureau of Labor Statistics, based upon monthly reports submitted by selected
employers in the Columbus Metropolitan Statistical Area, which includes Chattahoochee, Harris, Marion and Muscogee counties in Georgia and Russell County in Alabama. The estimates include all full- and part-time wage and salary workers who were employed during or received pay for any part of the pay period that includes the twelfth of the month. Proprietors, domestic
workers, self-employed persons, unpaid family workers and personnel of the armed forces are excluded. Estimates based on 2007 benchmark.
5
DALTON MSA Nonagricultural Employment (000s)
Preliminary Revised
Revised
AUG 2008 JUL 2008 AUG 2007
Change in Jobs from JUL 2008
Net %
Change in Jobs from AUG 2007
Net %
Total Nonfarm
76.8
78.0
77.9
-1.2 -1.5
-1.1 -1.4
Total Private Goods Producing
69.6
70.5
70.9
30.3
30.6
31.3
-.9 -1.3 -.3 -1.0
-1.3 -1.8 -1.0 -3.2
Service-Providing
46.5
47.4
46.6
-.9 -1.9
-.1 -0.2
Private Service-Providing Manufacturing
39.3
39.9
39.6
28.1
28.3
29.4
-.6 -1.5 -.2 -0.7
-.3 -0.8 -1.3 -4.4
Textile Mills
3.2
3.2
3.4
+.0 +0.0
-.2 -5.9
Textile Product Mills Trade, Transportation and Utilities
19.3
19.5
20.0
15.7
15.8
16.0
-.2 -1.0 -.1 -0.6
-.7 -3.5 -.3 -1.9
Retail Trade
7.8
7.9
7.9
-.1 -1.3
-.1 -1.3
Transportation, Warehouse, and Utilities Professional and Business Services
3.5
3.5
10.5
10.6
3.6 10.3
+.0 +0.0 -.1 -0.9
-.1 -2.8 +.2 +1.9
Government
7.2
7.5
7.0
-.3 -4.0
+.2 +2.9
Federal Government State Government
.3
.3
1.1
1.1
.3
+.0 +0.0
1.0
+.0 +0.0
+.0 +0.0 +.1 +10.0
Local Government
5.8
6.1
5.7
-.3 -4.9
+.1 +1.8
Note: These preliminary estimates were prepared in cooperation with the U.S. Department of Labor, Bureau of Labor Statistics, based upon monthly reports submitted by selected employers
in the Dalton Metropolitan Statistical Area, which includes Murray and Whitfield counties. The estimates include all full- and part-time wage and salary workers who were employed during or received pay for any part of the pay period that includes the twelfth of the month. Proprietors, domestic workers, self-employed persons, unpaid family workers and personnel of the armed forces are excluded. Estimates based on 2007 benchmark.
Source: Georgia Department of Labor, Workforce Information & Analysis
GAINESVILLE MSA Nonagricultural Employment (000s)
Preliminary Revised
Revised
AUG 2008 JUL 2008 AUG 2007
Change in Jobs from JUL 2008
Net %
Change in Jobs from AUG 2007
Net %
Total Nonfarm
77.4
77.5
76.6
-.1 -0.1
+.8 +1.0
Total Private Goods Producing
67.1
67.1
21.7
21.8
66.9 22.4
+.0 +0.0 -.1 -0.5
+.2 +0.3 -.7 -3.1
Service-Providing
55.7
55.7
54.2
+.0 +0.0
+1.5 +2.8
Private Service-Providing Trade, Transportation and Utilities
45.4
45.3
44.5
13.8
13.5
13.6
+.1 +0.2 +.3 +2.2
+.9 +2.0 +.2 +1.5
Retail Trade
7.6
7.6
7.6
+.0 +0.0
+.0 +0.0
Government Federal Government
10.3
10.4
.5
.5
9.7
-.1 -1.0
.5
+.0 +0.0
+.6 +6.2 +.0 +0.0
State Government
2.6
2.6
2.5
+.0 +0.0
+.1 +4.0
Local Government
7.2
7.3
6.7
-.1 -1.4
+.5 +7.5
Note: These preliminary estimates were prepared in cooperation with the U.S. Department of Labor, Bureau of Labor Statistics, based upon monthly reports submitted by selected employers
in the Gainesville Metropolitan Statistical Area, which comprises Hall county. The estimates include all full- and part-time wage and salary workers who were employed during or received pay for any part of the pay period that includes the twelfth of the month. Proprietors, domestic workers, self-employed persons, unpaid family workers and personnel of the armed forces are excluded.
Estimates based on 2007 benchmark.
6
MACON MSA Nonagricultural Employment (000s)
Preliminary Revised
Revised
AUG 2008 JUL 2008 AUG 2007
Change in Jobs from JUL 2008
Net %
Change in Jobs from AUG 2007
Net %
Total Nonfarm Total Private Goods Producing Service-Providing Private Service-Providing Trade Transportation and Utilities
Retail Trade Transportation, Warehousing, and Utilities Financial Activities Professional and Business Services Educational and Health Services Leisure and Hospitality Government Federal Government State Government Local Government
99.4
100.4
99.6
-1.0 -1.0
84.5
84.9
84.7
-.4 -0.5
11.7
11.7
12.1
+.0 +0.0
87.7
88.7
87.5
-1.0 -1.1
72.8
73.2
72.6
-.4 -0.5
19.7
19.8
20.1
-.1 -0.5
12.1
12.2
12.3
-.1 -0.8
4.1
4.0
4.0
+.1 +2.5
8.3
8.2
8.1
+.1 +1.2
11.3
11.5
11.3
-.2 -1.7
18.6
18.7
18.4
-.1 -0.5
9.1
9.1
9.1
+.0 +0.0
14.9
15.5
14.9
-.6 -3.9
1.3
1.3
1.3
+.0 +0.0
3.7
4.0
3.9
-.3 -7.5
9.9
10.2
9.7
-.3 -2.9
-.2 -0.2 -.2 -0.2 -.4 -3.3 +.2 +0.2 +.2 +0.3 -.4 -2.0 -.2 -1.6 +.1 +2.5 +.2 +2.5 +.0 +0.0 +.2 +1.1 +.0 +0.0 +.0 +0.0 +.0 +0.0 -.2 -5.1 +.2 +2.1
Note: These preliminary estimates were prepared in cooperation with the U.S. Department of Labor, Bureau of Labor Statistics, based upon monthly reports submitted by selected employers
in the Macon Metropolitan Statistical Area, which includes Bibb, Crawford, Jones, Monroe and Twiggs counties. The estimates include all full- and part-time wage and salary workers who were employed during or received pay for any part of the pay period that includes the twelfth of the month. Proprietors, domestic workers, self-employed persons, unpaid family workers and personnel
of the armed forces are excluded. Estimates based on 2007 benchmark.
SAVANNAH MSA Nonagricultural Employment (000s)
Preliminary Revised
Revised
AUG 2008 JUL 2008 AUG 2007
Change in Jobs from JUL 2008
Net %
Change in Jobs
from AUG 2007
Net
%
Total Nonfarm Total Private Goods Producing Service-Providing Private Service-Providing Natural Resources, Mining and Construction Manufacturing Trade, Transportation and Utilities
Wholesale Trade Retail Trade Transportation, Warehousing, and Utilities Information Financial Activities Professional and Business Services Educational and Health Services Leisure and Hospitality Other Services Government Federal Government State Government Local Government
160.5 139.9
24.4 136.1 115.5
9.8 14.6 36.5
6.8 18.5 11.2
2.0 6.0 19.5 22.4 21.1 8.0 20.6 2.8 3.9 13.9
162.6 141.4
24.7 137.9 116.7
10.0 14.7 36.9
6.7 18.7 11.5
2.0 6.0 19.8 22.5 21.5 8.0 21.2 2.8 3.9 14.5
160.0 139.7
24.9 135.1 114.8
10.0 14.9 35.6
6.7 18.4 10.5
2.0 6.2 19.9 21.9 21.3 7.9 20.3 2.9 3.8 13.6
-2.1 -1.3 -1.5 -1.1
-.3 -1.2 -1.8 -1.3 -1.2 -1.0
-.2 -2.0 -.1 -0.7 -.4 -1.1 +.1 +1.5 -.2 -1.1 -.3 -2.6 +.0 +0.0 +.0 +0.0 -.3 -1.5 -.1 -0.4 -.4 -1.9 +.0 +0.0 -.6 -2.8 +.0 +0.0 +.0 +0.0 -.6 -4.1
+.5 +.2 -.5 +1.0 +.7 -.2 -.3 +.9 +.1 +.1 +.7 +.0 -.2 -.4 +.5 -.2 +.1 +.3 -.1 +.1 +.3
+0.3 +0.1 -2.0 +0.7 +0.6 -2.0 -2.0 +2.5 +1.5 +0.5 +6.7 +0.0 -3.2 -2.0 +2.3 -0.9 +1.3 +1.5 -3.4 +2.6 +2.2
Note: These preliminary estimates were prepared in cooperation with the U.S. Department of Labor, Bureau of Labor Statistics, based upon monthly reports submitted by selected employers
in the Savannah Metropolitan Statistical Area, which includes Bryan, Chatham and Effingham counties. The estimates include all full- and part-time wage and salary workers who were employed during or received pay for any part of the pay period that includes the twelfth of the month. Proprietors, domestic workers, self-employed persons, unpaid family workers and personnel of the armed
forces are excluded. Estimates based on 2007 benchmark.
7
VALDOSTA MSA Nonagricultural Employment (000s)
Preliminary Revised
Revised
AUG 2008 JUL 2008 AUG 2007
Change in Jobs from JUL 2008
Net %
Change in Jobs
from AUG 2007
Net
%
Total Nonfarm Total Private Goods Producing Service-Providing Private Service-Providing Trade, Transportation and Utilities
Retail Trade Government
Federal Government State Government Local Government
55.6
56.4
43.5
43.9
8.9
9.0
46.7
47.4
34.6
34.9
12.7
12.8
9.1
9.2
12.1
12.5
.8
.8
3.9
3.9
7.4
7.8
55.5 44.2
9.1 46.4 35.1 12.7
9.1 11.3
.8 3.5 7.0
-.8 -1.4 -.4 -0.9 -.1 -1.1 -.7 -1.5 -.3 -0.9 -.1 -0.8 -.1 -1.1 -.4 -3.2 +.0 +0.0 +.0 +0.0 -.4 -5.1
+.1 +0.2 -.7 -1.6 -.2 -2.2 +.3 +0.6 -.5 -1.4 +.0 +0.0 +.0 +0.0 +.8 +7.1 +.0 +0.0 +.4 +11.4 +.4 +5.7
Note: These preliminary estimates were prepared in cooperation with the U.S. Department of Labor, Bureau of Labor Statistics, based upon monthly reports submitted by selected employers
in the Valdosta Metropolitan Statistical Area, which includes Brooks, Echols, Lanier and Lowndes counties. The estimates include all full- and part-time wage and salary workers who were employed during or received pay for any part of the pay period that includes the twelfth of the month. Proprietors, domestic workers, self-employed persons, unpaid family workers and personnel of the armed forces are excluded. Estimates based on 2007 benchmark.
Source: Georgia Department of Labor, Workforce Information & Analysis
WARNER ROBINS MSA Nonagricultural Employment (000s)
Preliminary Revised
Revised
AUG 2008 JUL 2008 AUG 2007
Change in Jobs from JUL 2008
Net %
Change in Jobs
from AUG 2007
Net
%
Total Nonfarm Total Private Goods Producing Service-Providing Private Service-Providing Trade, Transportation and Utilities
Retail Trade Government
Federal Government State Government Local Government
58.3
59.3
35.7
36.3
7.1
7.4
51.2
51.9
28.6
28.9
7.9
7.9
6.4
6.5
22.6
23.0
14.3
14.3
1.0
1.0
7.3
7.7
58.1 36.2
7.7 50.4 28.5
7.7 6.3 21.9 14.0
.9 7.0
-1.0 -1.7 -.6 -1.7 -.3 -4.1 -.7 -1.3 -.3 -1.0 +.0 +0.0 -.1 -1.5 -.4 -1.7 +.0 +0.0 +.0 +0.0 -.4 -5.2
+.2 +0.3 -.5 -1.4 -.6 -7.8 +.8 +1.6 +.1 +0.4 +.2 +2.6 +.1 +1.6 +.7 +3.2 +.3 +2.1 +.1 +11.1 +.3 +4.3
Note: These preliminary estimates were prepared in cooperation with the U.S. Department of Labor, Bureau of Labor Statistics, based upon monthly reports submitted by selected employers
in the Warner Robins Metropolitan Statistical Area, which comprises Houston county. The estimates include all full- and part-time wage and salary workers who were employed during or received pay for any part of the pay period that includes the twelfth of the month. Proprietors, domestic workers, self-employed persons, unpaid family workers and personnel of the armed forces are excluded. Estimates based on 2007 benchmark.
Source: Georgia Department of Labor, Workforce Information & Analysis
8
Georgia Hours and Earnings
Experimental All Employee
Average Weekly Earnings
Preliminary AUG 2008
Revised JUL 2008
Revised AUG 2007
Total Private ............................................................................................ $741.13 ........................ $738.14 ................... $746.18 Goods Producing ................................................................................... $762.35 ........................ $754.60 ................... $759.32 Private Service Providing ....................................................................... $737.44 ........................ $734.36 ................... $742.60 Construction ........................................................................................... $739.19 ........................ $752.09 ................... $733.46 Manufacturing ......................................................................................... $778.74 ........................ $754.30 ................... $781.15 Trade, Transportation, and Utilities ........................................................ $708.22 ........................ $705.51 ................... $646.47 Financial Activities .................................................................................. $891.07 ........................ $908.27 ................... $790.40 Professional and Business Services ...................................................... $932.04 ........................ $902.02 ................... $851.51 Educational and Health Services ........................................................... $786.80 ........................ $776.48 ................... $749.36 Leisure and Hospitality ........................................................................... $323.81 ........................ $332.01 ................... $332.92 Other Services ........................................................................................ $500.86 ........................ $477.39 ................... $476.58
Average Weekly Hours
Preliminary AUG 2008
Revised JUL 2008
Revised AUG 2007
Total Private .................................................................................................. 35.7 .............................. 35.2 ......................... 35.6 Goods Producing ......................................................................................... 39.5 .............................. 39.2 ......................... 41.0 Private Service Providing ............................................................................. 34.9 .............................. 34.3 ......................... 34.3 Construction ................................................................................................. 38.6 .............................. 38.1 ......................... 40.5 Manufacturing ............................................................................................... 40.1 .............................. 39.7 ......................... 41.2 Trade, Transportation, and Utilities .............................................................. 35.2 .............................. 35.1 ......................... 33.9 Financial Activities ........................................................................................ 35.7 .............................. 35.9 ......................... 34.5 Professional and Business Services ............................................................ 36.0 .............................. 34.6 ......................... 34.6 Educational and Health Services ................................................................. 37.9 .............................. 36.8 ......................... 38.0 Leisure and Hospitality ................................................................................. 27.7 .............................. 27.9 ......................... 29.0 Other Services .............................................................................................. 31.7 .............................. 30.7 ......................... 32.8
Average Hourly Earnings
Preliminary AUG 2008
Revised JUL 2008
Revised AUG 2007
Total Private .............................................................................................. $20.76 .......................... $20.97 ..................... $20.96 Goods Producing ..................................................................................... $19.30 .......................... $19.25 ..................... $18.52 Private Service Providing ......................................................................... $21.13 .......................... $21.41 ..................... $21.65 Construction ............................................................................................. $19.15 .......................... $19.74 ...................... $18.11 Manufacturing ........................................................................................... $19.42 .......................... $19.00 ..................... $18.96 Trade, Transportation, and Utilities .......................................................... $20.12 .......................... $20.10 ..................... $19.07 Financial Activities .................................................................................... $24.96 .......................... $25.30 ..................... $22.91 Professional and Business Services ........................................................ $25.89 .......................... $26.07 ..................... $24.61 Educational and Health Services ............................................................. $20.76 .......................... $21.10 ..................... $19.72 Leisure and Hospitality ............................................................................. $11.69 .......................... $11.90 ...................... $11.48 Other Services .......................................................................................... $15.80 .......................... $15.55 ..................... $14.53
The Current Employment Statistics (CES) program began work in 2005 to add new series on hours and earnings. New series have been developed such as average hourly earnings and average weekly hours of all nonfarm private sector employees. Historically, the CES program has produced average hours and earnings series for such categories as production workers in the manufacturing industry and nonsupervisory workers in other industries. The new hours and earnings, covering all employees rather than just production or non-supervisory workers, are more comprehensive in coverage.
The release of these new series are designated "experimental" because of the limited experience to date with the editing and review of the sample reports and the resultant estimates. The experimental State series, being released in August 2008, includes estimates at a total private sector level and limited industry detail.
Read more about the experimental hours and earnings series at http://www.bls.gov/sae/saeaepp.htm
9
Dimensions - Measuring Georgia's Labor Force
Unemployment rates -- Georgia and U.S.
(Seasonally Adjusted)
6.5%
Ge orgia
U.S.
5.5%
4.5%
3.5%
Aug Sep Oct Nov Dec Jan Feb Mar Apr May Jun Jul Aug
2007
2008
WA 6.0
OR
6.5
ID
4.6
NV
7.1
UT
CA
3.7
7.7
AZ 5.6
AK 6.9
MT 4.4
WY 3.9
CO 5.4
NM 4.6
HI 4.2
August 2008
National Unemployment Rate: 6.1% Rates are seasonally adjusted
ND 3.6
SD 3.3
NE 3.5
KS 4.7
MN 6.2
WI 5.1
IA 4.6
IL 7.3
MO 6.6
OK 4.0
TX 5.0
AR 4.8
MS 7.7
LA 4.7
NH 4.2
VT
ME
4.9
5.5
MI 8.9
OH
IN
7.4
6.4
KY 6.8
TN 6.6
PA 5.8
WV
4.1
VA
4.6
NC 6.9
SC 7.6
AL
GA
4.9
6.3
FL 6.5
MA 5.3 NY 5.8
RI 8.5 CT NJ 6.5 5.9 DE 4.9 DC 6.9
MD 4.5
Unemployment rate 7.0% to 9.9% 6.0% to 6.9% 5.0% to 5.9% 4.0% to 4.9% 3.0% to 3.9%
10
Georgia Labor Force Estimates Place of Residence - Persons 16 Years and Older
Employment Status
Preliminary AUG 2008
Revised JUL 2008
Revised AUG 2007
Change From
Revised
Revised
JUL 2008
AUG 2007
Georgia
(Seasonally adjusted)
Georgia
(Not Seasonally adjusted)
Albany MSA
Athens-Clarke County MSA
Atlanta MSA
Augusta-Richmond County MSA
Brunswick MSA
Columbus MSA
Dalton MSA
Gainesville MSA
Civilian labor force Employed Unemployed Rate
Civilian labor force Employed Unemployed Rate
Civilian labor force Employed Unemployed Rate
Civilian labor force Employed Unemployed Rate
Civilian labor force Employed Unemployed Rate
Civilian labor force Employed Unemployed Rate
Civilian labor force Employed Unemployed Rate
Civilian labor force Employed Unemployed Rate
Civilian labor force Employed Unemployed Rate
Civilian labor force Employed Unemployed Rate
4,912,557 4,601,874
310,683 6.3
4,920,837 4,605,730
315,107 6.4
76,725 71,584
5,141 6.7
109,002 102,944
6,058 5.6
2,794,172 2,618,002
176,170 6.3
259,635 242,298
17,337 6.7
54,364 51,262
3,102 5.7
130,793 122,023
8,770 6.7
68,386 63,737
4,649 6.8
93,267 88,154
5,113 5.5
4,928,333 4,632,939
295,394 6.0
4,963,655 4,651,834
311,821 6.3
77,214 72,201
5,013 6.5
109,696 103,686
6,010 5.5
2,824,091 2,650,838
173,253 6.1
263,246 245,771
17,475 6.6
55,437 52,593
2,844 5.1
131,325 122,535
8,790 6.7
69,775 64,841
4,934 7.1
93,770 88,795
4,975 5.3
4,824,440 4,611,193
213,247 4.4
4,802,928 4,586,191
216,737 4.5
75,553 71,667
3,886 5.1
105,095 100,959
4,136 3.9
2,727,809 2,608,333
119,476 4.4
255,074 240,375
14,699 5.8
53,467 51,490
1,977 3.7
128,416 121,590
6,826 5.3
67,617 64,575
3,042 4.5
90,412 87,270
3,142 3.5
-15,776 -31,065 15,289
-42,818 -46,104
3,286
-489 -617 128
-694 -742
48
-29,919 -32,836
2,917
-3,611 -3,473
-138
-1,073 -1,331
258
-532 -512
-20
-1,389 -1,104
-285
-503 -641 138
88,117 -9,319 97,436
117,909 19,539 98,370
1,172 -83
1,255
3,907 1,985 1,922
66,363 9,669
56,694
4,561 1,923 2,638
897 -228 1,125
2,377 433
1,944
769 -838 1,607
2,855 884
1,971
Note: MSA data are not seasonally adjusted. Employment includes nonagricultural wage and salary employment, self-employment, unpaid family and private
household workers and agricultural workers. Persons in labor disputes are counted as employed. The use of unrounded data does not imply that the numbers are exact. Georgia and Metropolitan Statistical Area data have not been seasonally adjusted.
Albany MSA: Baker, Dougherty, Lee, Terrell, and Worth counties. Athens - Clarke County MSA: Clarke, Madison, Oconee, and Oglethorpe counties. Atlanta MSA: Barrow, Bartow, Butts, Carroll, Cherokee, Clayton, Cobb, Coweta, Dawson, DeKalb, Douglas, Fayette, Forsyth, Fulton, Gwinnett, Haralson, Heard, Henry, Jasper, Lamar, Meriwether, Newton, Paulding, Pickens, Pike, Rockdale, Spalding, and Walton counties. Augusta - Richmond County MSA: Burke, Columbia, McDuffie, and Richmond counties in Georgia and Aiken and Edgefield counties in South Carolina. Brunswick MSA: Brantley, Glynn, and McIntosh counties. Columbus MSA: Chattahoochee, Harris, Marion, and Muscogee counties in Georgia and Russell County in Alabama. Dalton MSA: Murray and Whitfield counties. Gainesville MSA: Hall County. Hinesville - Fort Stewart MSA: Liberty and Long counties. Macon MSA: Bibb, Crawford, Jones, Monroe, and Twiggs counties. Rome MSA: Floyd County. Savannah MSA: Bryan, Chatham, and Effingham counties. Valdosta MSA: Brooks, Echols, Lanier, and Lowndes counties. Warner Robins MSA: Houston County.
Source: Georgia Department of Labor, Workforce Information & Analysis
11
Georgia Labor Force Estimates Place of Residence - Persons 16 Years and Older
Hinesville-Ft. Stewart MSA Macon MSA
Rome MSA Savannah MSA
Valdosta MSA Warner Robins MSA
Employment Status
Civilian labor force Employed Unemployed Rate
Civilian labor force Employed Unemployed Rate
Civilian labor force Employed Unemployed Rate
Civilian labor force Employed Unemployed Rate
Civilian labor force Employed Unemployed Rate
Civilian labor force Employed Unemployed Rate
Preliminary AUG 2008
31,463 29,376
2,087 6.6
113,934 106,425
7,509 6.6
50,616 47,215
3,401 6.7
183,070 172,385
10,685 5.8
69,123 65,116 4,007
5.8
69,619 65,792
3,827 5.5
Revised JUL 2008
31,660 29,643
2,017 6.4
114,507 107,159
7,348 6.4
51,146 47,587
3,559 7.0
184,724 174,483
10,241 5.5
69,315 65,580
3,735 5.4
70,092 66,374
3,718 5.3
Revised AUG 2007
30,315 28,777
1,538 5.1
110,972 105,495
5,477 4.9
48,973 46,646
2,327 4.8
178,039 171,027
7,012 3.9
67,958 65,235
2,723 4.0
67,966 65,365
2,601 3.8
Change From
Revised
Revised
JUL 2008
AUG 2007
-197 -267
70
1,148 599 549
-573 -734 161
2,962 930
2,032
-530 -372 -158
1,643 569
1,074
-1,654 -2,098
444
5,031 1,358 3,673
-192 -464 272
1,165 -119
1,284
-473 -582 109
1,653 427
1,226
United States Labor Force Estimates Place of Residence - Persons 16 Years and Older
Employment Status
AUG 2008
JUL 2008
AUG 2007
Change From
JUL 2008
AUG 2007
United States
(Seasonally adjusted)
Civilian labor force Employed Unemployed
Rate
154,853,000 145,477,000
9,376,000 6.1
154,603,000 145,819,000
8,784,000 5.7
152,886,000 145,753,000
7,133,000 4.7
250,000 -342,000 592,000
1,967,000 -276,000 2,243,000
United States
(Not Seasonally adjusted)
Civilian labor force Employed Unemployed
Rate
155,387,000 145,909,000
9,479,000 6.1
156,300,000 146,867,000
9,433,000 6.0
153,493,000 146,406,000
7,088,000 4.6
-913,000 -958,000
46,000
1,894,000 -497,000 2,391,000
Note: MSA data are not seasonally adjusted. Employment includes nonagricultural wage and salary employment, self-employment, unpaid family and private
household workers and agricultural workers. Persons in labor disputes are counted as employed. The use of unrounded data does not imply that the numbers are exact. Georgia and Metropolitan Statistical Area data have not been seasonally adjusted.
Albany MSA: Baker, Dougherty, Lee, Terrell, and Worth counties. Athens - Clarke County MSA: Clarke, Madison, Oconee, and Oglethorpe counties. Atlanta MSA: Barrow, Bartow, Butts, Carroll, Cherokee, Clayton, Cobb, Coweta, Dawson, DeKalb, Douglas, Fayette, Forsyth, Fulton, Gwinnett, Haralson, Heard, Henry, Jasper, Lamar, Meriwether, Newton, Paulding, Pickens, Pike, Rockdale, Spalding, and Walton counties. Augusta - Richmond County MSA: Burke, Columbia, McDuffie, and Richmond counties in Georgia and Aiken and Edgefield counties in South Carolina. Brunswick MSA: Brantley, Glynn, and McIntosh counties. Columbus MSA: Chattahoochee, Harris, Marion, and Muscogee counties in Georgia and Russell County in Alabama. Dalton MSA: Murray and Whitfield counties. Gainesville MSA: Hall County. Hinesville - Fort Stewart MSA: Liberty and Long counties. Macon MSA: Bibb, Crawford, Jones, Monroe, and Twiggs counties. Rome MSA: Floyd County. Savannah MSA: Bryan, Chatham, and Effingham counties. Valdosta MSA: Brooks, Echols, Lanier, and Lowndes counties. Warner Robins MSA: Houston County.
Source: Georgia Department of Labor, Workforce Information & Analysis
12
Georgia Labor Force Estimates by County (not seasonally adjusted)
Georgia
Place of Residence - Persons 16 Years and Older
Preliminary August 2008
Revised July 2008
Labor Force
Employment
Unemployment Number Rate
4,920,837 4,605,730 315,107 6.4
Labor Force
Employment
Unemployment Number Rate
4,963,655 4,651,834 311,821 6.3
Appling Atkinson Bacon Baker Baldwin
9,304 8,603
701 7.5
3,371 3,088 283 8.4
4,750 4,439
311 6.5
1,822 1,695 127 7.0
20,799 19,293 1,506 7.2
9,324 8,587 737 7.9
3,328 3,069 259 7.8
4,706 4,395
311 6.6
1,819 1,709
110 6.0
20,922 19,517 1,405 6.7
Banks Barrow Bartow Ben Hill Berrien
11,536 33,928 47,601
7,730 8,976
11,045 31,730 44,196
6,733 8,319
491 4.3 2,198 6.5 3,405 7.2
997 12.9 657 7.3
11,563 34,296 48,033
7,635 8,949
11,051 32,127 44,750
6,733 8,337
512 4.4 2,169 6.3 3,283 6.8
902 11.8 612 6.8
Bibb Bleckley Brantley Brooks Bryan
75,138 70,079 5,059 6.7
5,514 5,112 402 7.3
7,918 7,389 529 6.7
8,780 8,275 505 5.8
17,170 16,291
879 5.1
75,510 70,562 4,948 6.6 5,483 5,081 402 7.3 8,103 7,580 523 6.5 8,778 8,334 444 5.1
17,317 16,489 828 4.8
Bulloch Burke Butts Calhoun Camden
33,490 10,298 10,628
2,099 21,877
31,380 9,409 9,840 1,875
20,615
2,110 6.3 889 8.6 788 7.4 224 10.7
1,262 5.8
33,074 10,413 10,729
2,049 21,987
30,946 9,519 9,963 1,841
20,736
2,128 6.4 894 8.6 766 7.1 208 10.2
1,251 5.7
Candler Carroll Catoosa Charlton Chatham
4,293 3,990
303 7.1
53,771 50,080 3,691 6.9
37,156 35,352 1,804 4.9
4,708 4,361 347 7.4
137,046 128,663 8,383 6.1
4,278 3,984 294 6.9 54,480 50,708 3,772 6.9 37,609 35,789 1,820 4.8
4,729 4,378 351 7.4 138,285 130,229 8,056 5.8
Chattahoochee 2,634
Chattooga
11,036
Cherokee 110,108
Clarke
66,283
Clay
1,460
2,286 10,143 104,168 62,376
1,363
348 13.2 893 8.1 5,940 5.4 3,907 5.9
97 6.6
2,647 11,135 111,228 66,795 1,477
2,300 10,132 105,475 62,826
1,370
347 13.1 1,003 9.0 5,753 5.2 3,969 5.9
107 7.2
Clayton Clinch Cobb Coffee Colquitt
142,748 131,903 10,845 7.6 2,782 2,565 217 7.8
391,936 369,663 22,273 5.7 16,739 15,401 1,338 8.0 20,528 19,204 1,324 6.4
144,222 133,557 10,665 7.4 2,752 2,558 194 7.0
395,916 374,300 21,616 5.5 16,703 15,305 1,398 8.4 20,393 19,067 1,326 6.5
Columbia Cook Coweta Crawford Crisp
60,083 57,130 2,953 4.9
7,326 6,688
638 8.7
60,791 57,260 3,531 5.8
6,412 5,999 413 6.4
10,667 9,891 776 7.3
60,918 57,803 3,115 5.1 7,198 6,659 539 7.5
61,678 57,979 3,699 6.0 6,463 6,040 423 6.5
10,701 9,950 751 7.0
Revised August 2007
Labor Force
Employment
Unemployment Number Rate
4,802,928 4,586,191 216,737 4.5
9,046 8,514
532 5.9
3,234 3,066
168 5.2
4,636 4,420
216 4.7
1,787 1,697
90 5.0
20,529 19,445 1,084 5.3
10,529 10,200
329 3.1
33,025 31,612 1,413 4.3
46,187 44,033 2,154 4.7
7,675 7,085
590 7.7
8,786 8,387
399 4.5
73,302 69,466 3,836 5.2
5,180 4,905
275 5.3
7,775 7,421
354 4.6
8,656 8,290
366 4.2
16,745 16,163
582 3.5
32,611 31,139 1,472 4.5
10,248 9,294
954 9.3
10,337 9,804
533 5.2
2,214 2,084
130 5.9
21,932 21,094
838 3.8
4,498 4,299
199 4.4
52,393 49,895 2,498 4.8
36,169 35,009 1,160 3.2
4,448 4,221
227 5.1
133,105 127,650 5,455 4.1
2,527 10,739 107,684 63,898
1,483
2,268 10,150 103,784 61,173
1,398
259 10.2 589 5.5 3,900 3.6 2,725 4.3
85 5.7
139,000 131,416 7,584 5.5
2,845 2,655
190 6.7
383,317 368,298 15,019 3.9
16,238 15,290
948 5.8
20,452 19,529
923 4.5
58,750 56,434 2,316 3.9
7,187 6,796
391 5.4
59,359 57,049 2,310 3.9
6,236 5,946
290 4.7
10,567 10,005 562 5.3
13
Georgia Labor Force Estimates by County (not seasonally adjusted)
Dade Dawson Decatur DeKalb Dodge
Place of Residence - Persons 16 Years and Older
Preliminary August 2008
Revised July 2008
Labor Force
Employment
Unemployment Number Rate
Labor Force
Employment
Unemployment Number Rate
8,933 8,459 474 5.3 11,253 10,590 663 5.9 11,621 10,692 929 8.0 405,733 379,345 26,388 6.5 10,143 9,474 669 6.6
9,073 8,563
510 5.6
11,400 10,722 678 5.9
11,658 10,750 908 7.8
409,694 384,103 25,591 6.2
10,114 9,465
649 6.4
Dooly Dougherty Douglas Early Echols
4,919 4,588 331 6.7
42,184 39,051 3,133 7.4
65,580 61,182 4,398 6.7
5,491 5,068 423 7.7
2,428 2,324
104 4.3
4,893 4,579 314 6.4
42,461 39,387 3,074 7.2
66,303 61,950 4,353 6.6
5,430 5,052
378 7.0
2,436 2,341
95 3.9
Effingham Elbert Emanuel Evans Fannin
28,855 27,431 1,424 4.9
10,279 9,396
883 8.6
11,033 10,133 900 8.2
5,148 4,797 351 6.8
11,487 10,722 765 6.7
29,122 27,764 1,358 4.7
10,309 9,453
856 8.3
11,009 10,155 854 7.8
5,062 4,737 325 6.4
11,550 10,822 728 6.3
Fayette Floyd Forsyth Franklin Fulton
56,307 53,347 2,960 5.3
50,616 47,215 3,401 6.7
84,028 79,816 4,212 5.0
10,639 9,897
742 7.0
497,303 464,131 33,172 6.7
56,963 54,016 2,947 5.2
51,146 47,587 3,559 7.0
84,845 80,817 4,028 4.7
10,641 9,860
781 7.3
502,652 469,953 32,699 6.5
Gilmer Glascock Glynn Gordon Grady
14,696 13,847 849 5.8
1,124 1,040
84 7.5
41,001 38,752 2,249 5.5
27,116 25,121 1,995 7.4
12,158 11,417 741 6.1
14,785 13,963
822 5.6
1,121 1,039
82 7.3
41,762 39,758 2,004 4.8
27,286 25,296 1,990 7.3
12,224 11,418
806 6.6
Greene Gwinnett Habersham Hall Hancock
7,732 7,182 550 7.1
431,007 406,543 24,464 5.7
20,639 19,380 1,259 6.1
93,267 88,154 5,113 5.5
3,414 3,068
346 10.1
7,740 7,232
508 6.6
435,854 411,642 24,212 5.6
20,573 19,338 1,235 6.0
93,770 88,795 4,975 5.3
3,465 3,104 361 10.4
Haralson Harris Hart Heard Henry
13,479 12,600 879 6.5 16,170 15,262 908 5.6 11,115 10,181 934 8.4
5,199 4,835 364 7.0 97,624 91,435 6,189 6.3
13,634 12,758
876 6.4
16,192 15,352 840 5.2
11,213 10,234 979 8.7
5,299 4,896
403 7.6
98,704 92,581 6,123 6.2
Houston Irwin Jackson Jasper Jeff Davis
69,619 4,326
27,628 6,884 5,334
65,792 3,887
25,876 6,299 4,794
3,827 5.5 439 10.1
1,752 6.3 585 8.5 540 10.1
70,092 4,334
27,752 6,819 5,343
66,374 3,887
26,100 6,378 4,803
3,718 5.3 447 10.3
1,652 6.0 441 6.5 540 10.1
Revised August 2007
Labor Force
Employment
Unemployment Number Rate
8,693 8,377
316 3.6
10,950 10,550
400 3.7
11,621 10,934
687 5.9
396,842 377,944 18,898 4.8
9,418 8,968
450 4.8
4,934 41,417 63,852
5,354 2,403
4,671 39,096 60,956
5,047 2,329
263 5.3 2,321 5.6 2,896 4.5
307 5.7 74 3.1
28,189 9,739
10,653 4,926
10,869
27,214 9,165
10,050 4,700
10,454
975 3.5 574 5.9 603 5.7 226 4.6 415 3.8
55,250 53,150 2,100 3.8
48,973 46,646 2,327 4.8
82,241 79,521 2,720 3.3
10,323 9,819
504 4.9
485,638 462,417 23,221 4.8
14,044 1,117
40,331 26,796 12,224
13,517 1,056
38,924 25,586 11,758
527 3.8 61 5.5
1,407 3.5 1,210 4.5
466 3.8
7,492 7,104
388 5.2
421,594 405,042 16,552 3.9
19,794 19,002
792 4.0
90,412 87,270 3,142 3.5
3,344 3,092
252 7.5
13,135 15,717 10,677
5,040 95,161
12,554 15,142 10,005
4,817 91,097
581 4.4 575 3.7 672 6.3 223 4.4 4,064 4.3
67,966 4,361
26,802 6,609 5,229
65,365 4,091
25,687 6,276 4,881
2,601 3.8 270 6.2
1,115 4.2 333 5.0 348 6.7
14
Georgia Labor Force Estimates by County (not seasonally adjusted)
Jefferson Jenkins Johnson Jones Lamar
Place of Residence - Persons 16 Years and Older
Preliminary August 2008
Revised July 2008
Labor Force
Employment
Unemployment Number Rate
7,318 3,280 3,867 14,180 8,236
6,532 2,853 3,546 13,341 7,628
786 10.7 427 13.0 321 8.3 839 5.9 608 7.4
Labor Force
7,319 3,311 3,857 14,205 8,429
Employment
Unemployment Number Rate
6,529 2,849 3,545 13,433 7,724
790 10.8 462 14.0 312 8.1 772 5.4 705 8.4
Lanier Laurens Lee Liberty Lincoln
4,110 3,869 241 5.9 22,922 21,213 1,709 7.5 17,535 16,658 877 5.0 25,392 23,630 1,762 6.9
3,888 3,616 272 7.0
4,114 3,896
218 5.3
22,961 21,206 1,755 7.6
17,645 16,802 843 4.8
25,593 23,845 1,748 6.8
3,938 3,648
290 7.4
Long Lowndes Lumpkin McDuffie McIntosh
6,071 5,746 325 5.4 53,806 50,648 3,158 5.9 13,854 12,866 988 7.1 11,071 10,212 859 7.8
5,445 5,121 324 6.0
6,067 5,798 269 4.4 53,987 51,009 2,978 5.5 13,852 12,639 1,213 8.8 11,398 10,332 1,066 9.4
5,571 5,254 317 5.7
Macon Madison Marion Meriwether Miller
5,085 4,614 471 9.3
16,320 15,438 882 5.4
3,472 3,264
208 6.0
10,346 9,343 1,003 9.7
3,557 3,361 196 5.5
5,049 16,394
3,499 10,383
3,527
4,595 15,549
3,283 9,460 3,352
454 9.0 845 5.2 216 6.2 923 8.9 175 5.0
Mitchell
10,464 9,657 807 7.7
Monroe
13,504 12,639 865 6.4
Montgomery 4,723 4,386
337 7.1
Morgan
9,726 9,128 598 6.1
Murray
21,525 20,020 1,505 7.0
10,388 9,661
727 7.0
13,599 12,726 873 6.4
4,724 4,366
358 7.6
9,799 9,218
581 5.9
21,808 20,367 1,441 6.6
Muscogee Newton Oconee Oglethorpe Paulding
87,068 81,451 5,617 6.5
46,774 43,181 3,593 7.7
18,354 17,538 816 4.4
8,047 7,593
454 5.6
66,143 62,003 4,140 6.3
87,586 81,934 5,652 6.5
47,519 43,723 3,796 8.0
18,441 17,664 777 4.2
8,066 7,647
419 5.2
66,820 62,781 4,039 6.0
Peach Pickens Pierce Pike Polk
11,786 10,960 826 7.0
15,573 14,611
962 6.2
8,638 8,149
489 5.7
8,364 7,785 579 6.9
22,061 20,666 1,395 6.3
11,899 11,041
858 7.2
15,721 14,794
927 5.9
8,608 8,141
467 5.4
8,477 7,883
594 7.0
22,193 20,768 1,425 6.4
Pulaski Putnam Quitman Rabun Randolph
4,718 10,677
985 7,446 2,766
4,455 9,957
914 6,993 2,511
263 5.6 720 6.7
71 7.2 453 6.1 255 9.2
4,721 10,744
1,013 7,598 2,770
4,457 10,110
918 7,140 2,511
264 5.6 634 5.9
95 9.4 458 6.0 259 9.4
Revised August 2007
Labor Force
Employment
Unemployment Number Rate
7,225 3,375 3,755 13,805 7,997
6,594 3,081 3,520 13,224 7,600
631 8.7 294 8.7 235 6.3 581 4.2 397 5.0
4,028 22,219 17,371 24,460
3,776
3,876 21,060 16,678 23,149
3,562
152 3.8 1,159 5.2
693 4.0 1,311 5.4
214 5.7
5,855 52,872 12,956 10,770
5,359
5,628 50,741 12,446 10,087
5,144
227 3.9 2,131 4.0
510 3.9 683 6.3 215 4.0
5,091 15,717
3,421 9,879 3,547
4,733 15,140
3,238 9,308 3,383
358 7.0 577 3.7 183 5.3 571 5.8 164 4.6
10,328 13,077
4,604 9,412 21,276
9,800 12,528
4,372 8,994 20,283
528 5.1 549 4.2 232 5.0 418 4.4 993 4.7
85,299 45,411 17,745 7,735 64,364
80,813 43,022 17,199
7,446 61,774
4,486 5.3 2,389 5.3
546 3.1 289 3.7 2,590 4.0
11,310 15,141
8,518 8,107 21,063
10,712 14,557
8,162 7,756 20,146
598 5.3 584 3.9 356 4.2 351 4.3 917 4.4
4,664 10,024
972 7,219 2,707
4,479 9,574
922 6,848 2,537
185 4.0 450 4.5
50 5.1 371 5.1 170 6.3
15
Georgia Labor Force Estimates by County (not seasonally adjusted)
Richmond Rockdale Schley Screven Seminole
Place of Residence - Persons 16 Years and Older
Preliminary August 2008
Revised July 2008
Labor Force
Employment
Unemployment Number Rate
Labor Force
Employment
Unemployment Number Rate
91,525 85,039 6,486 7.1
41,668 38,696 2,972 7.1
1,839 1,715
124 6.7
7,481 6,842 639 8.5
4,037 3,724
313 7.8
93,019 86,040 6,979 7.5 42,118 39,181 2,937 7.0 1,855 1,730 125 6.7 7,464 6,806 658 8.8 4,064 3,726 338 8.3
Spalding Stephens Stewart Sumter Talbot
29,833 27,209 2,624 8.8
13,963 13,033
930 6.7
2,371 2,180 191 8.1
14,705 13,496 1,209 8.2
3,255 2,993 262 8.0
30,106 27,550 2,556 8.5 14,004 13,102 902 6.4
2,362 2,174 188 8.0 14,745 13,609 1,136 7.7
3,237 3,012 225 7.0
Taliaferro Tattnall Taylor Telfair Terrell
879 9,240 3,324 5,378 4,613
798 8,597 3,054 4,809 4,302
81 9.2 643 7.0 270 8.1 569 10.6 311 6.7
873 9,099 3,328 5,329 4,652
804 8,490 3,061 4,769 4,339
69 7.9 609 6.7 267 8.0 560 10.5 313 6.7
Thomas Tift Toombs Towns Treutlen
23,046 21,680 1,366 5.9
18,901 17,503 1,398 7.4
14,078 13,105
973 6.9
6,305 5,957
348 5.5
2,783 2,543 240 8.6
23,055 21,709 1,346 5.8 18,852 17,477 1,375 7.3 14,072 13,043 1,029 7.3
6,226 5,870 356 5.7 2,789 2,530 259 9.3
Troup Turner Twiggs Union Upson
31,069 28,461 2,608 8.4
4,980 4,607 373 7.5
4,701 4,368 333 7.1
12,088 11,402
686 5.7
12,102 11,069 1,033 8.5
31,393 28,640 2,753 8.8 4,989 4,569 420 8.4 4,731 4,398 333 7.0
12,079 11,403 676 5.6 12,206 11,161 1,045 8.6
Walker Walton Ware Warren Washington
34,611 41,326 15,643
2,566 8,417
32,850 38,582 14,578
2,293 7,768
1,761 5.1 2,744 6.6 1,065 6.8
273 10.6 649 7.7
35,235 41,766 15,589
2,634 8,468
33,255 39,066 14,563
2,292 7,823
1,980 5.6 2,700 6.5 1,026 6.6
342 13.0 645 7.6
Wayne Webster Wheeler White Whitfield
12,621 11,631
990 7.8
1,303 1,229
74 5.7
2,975 2,746
229 7.7
13,511 12,792
719 5.3
46,861 43,717 3,144 6.7
12,611 11,676 935 7.4
1,286 1,207
79 6.1
2,928 2,720
208 7.1
13,578 12,850 728 5.4
47,967 44,474 3,493 7.3
Wilcox Wilkes Wilkinson Worth
3,325 4,544 4,554 10,571
3,019 4,109 4,244 9,878
306 9.2 435 9.6 310 6.8 693 6.6
3,297 4,519 4,549 10,635
3,010 4,141 4,242 9,963
287 8.7 378 8.4 307 6.7 672 6.3
Revised August 2007
Labor Force
Employment
Unemployment Number Rate
89,909 84,003 5,906 6.6
40,533 38,553 1,980 4.9
1,819 1,709
110 6.0
7,204 6,834
370 5.1
3,977 3,775
202 5.1
28,650 27,108 1,542 5.4
13,477 12,849
628 4.7
2,277 2,127
150 6.6
14,530 13,448 1,082 7.4
3,093 2,897
196 6.3
838 9,020 3,267 4,811 4,597
789 8,593 3,073 4,453 4,307
49 5.8 427 4.7 194 5.9 358 7.4 290 6.3
23,055 22,138
917 4.0
19,415 18,410 1,005 5.2
13,735 13,064
671 4.9
6,394 6,172
222 3.5
2,710 2,553
157 5.8
30,519 28,862 1,657 5.4
4,931 4,660
271 5.5
4,550 4,330
220 4.8
11,426 11,006
420 3.7
11,934 11,185
749 6.3
33,769 32,531 1,238 3.7
40,112 38,440 1,672 4.2
15,316 14,601
715 4.7
2,433 2,251
182 7.5
8,292 7,830 462 5.6
12,085 11,444
641 5.3
1,236 1,183
53 4.3
2,942 2,780 162 5.5
13,087 12,632
455 3.5
46,341 44,292 2,049 4.4
3,227 4,492 4,621 10,381
3,042 4,210 4,388 9,889
185 5.7 282 6.3 233 5.0 492 4.7
16
Georgia Unemployment Rates by County
August 2008
Dade
Catoosa
Murray
Fannin
Towns
Union
Rabun
Whitfield Walker
Gilmer
White Habersham
Chattooga
Gordon
Pickens
Lumpkin
Stephens
Floyd
Dawson
Banks Franklin Hart
Bartow Cherokee Forsyth Hall
Jackson Madison Elbert
Polk Haralson
Paulding Cobb
Gwinnett Barrow Clarke Oglethorpe
Oconee
DeKalb
Walton
Wilkes
Douglas Fulton
Rockdale
Lincoln
Carroll
Clayton
Newton Morgan Greene Taliaferro
Columbia
Fayette Henry
McDuffie
Coweta Heard
Spalding Butts Jasper Putnam
Warren Hancock Glascock
Richmond
10.0% or greater 8.0% to 9.9% 6.4% to 7.9% Less than 6.4%
Troup
Meriwether Pike Lamar Monroe
Jones Baldwin
Jefferson Washington
Burke
Upson
Harris
Talbot
Bibb Crawford
Muscogee
Taylor
Peach
Wilkinson Twiggs
Johnson
Jenkins Emanuel
Screven
Marion Chattahoochee
Macon
Houston Bleckley
Laurens Treutlen
Candler Bulloch
Effingham
Stewart
Schley Webster Sumter
Dooly Crisp
Pulaski Wilcox
Dodge
Montgomery
Wheeler
Toombs
Telfair
Evans Tattnall
Bryan
Chatham
Quitman Terrell Lee
Randolph
Turner
Ben Hill
Jeff Davis Appling
Liberty Long
Clay Calhoun Dougherty
Early
Baker
Miller
Mitchell
Worth
Irwin Tift
Coffee
Colquitt
Berrien Atkinson Cook
Seminole Decatur
Grady
Thomas
Brooks
Lanier
Clinch
Lowndes Echols
Bacon
Wayne
Pierce
Ware
Brantley
McIntosh Glynn
Charlton
Camden
Georgia's Unemployment Rate: 6.4%
(Not Seasonally Adjusted)
17
New Developments
The GRAAL Group plans to establish a multimillion dollar "Security Training Center" in Marion County with a customer list that will include Fortune 500 companies that do business across the globe. The principals of the company plan to provide security training for their clients at their center that will include a headquarters and office building; housing for students and VIPs (including a cafeteria); a training center complex with four classrooms, offices, and weapons vault; a 2.5 mile technical driving course; an urban assault village; close quarters combat facility; and a small arms shooting range. The center is expected to employ 290 people in specialty positions who will relocate to the area as well as hiring some 30 to 40 people locally for general staff jobs.
In Bartow County Toyo Tire North America Manufacturing, Inc. will soon begin its third expansion in the last four years by spending $270 million and adding 400 new jobs. The company plans to add 820,000 square feet to its manufacturing floor space in Cartersville and double the output of the two-year-old plant, increasing to 5.2 million units annually by 2011.
Chowel Weldparts and Classic Signature Foods are planning to invest $25 million in their new facilities in Meriwether County. In the first three years of operation Chowel Weldparts will create 250 jobs as a supplier to Dongwon Autopart Technology, Sewon, Kia, and Hyundai. They will locate adjacent to Dongwon in a $10 million, 100,000 square foot plant that is expected to be fully operational in late spring of 2009. Classic Signature Foods will begin their operations late summer of 2009. Their plant will also be 100,000 square feet and will be located in Meriwether Park where they will manufacture food processor dressings, sauces, and seasonings. This $15 million investment will employ 75 people.
Powertech America will be supplying automatic transmissions to Kia upon completion of their new plant in West Point. The Troup County location will be the company's first in the United States and will be located on a 20 acre tract. It will measure 213,000 square feet and represent an investment of $150 million. The company is planning to begin production in February of 2010. The 355 jobs that will be created by Powertech will bring the total jobs created that are related to the Kia plant to 6200.
Ingles has just opened two new stores in Georgia and has another under construction and two others on the drawing board. They have opened their largest store in the state in Lamar County, replacing their old store in Barnesville. The store measures 82,000 square feet and will have an additional 200 employees. The other new store located in Carroll County in Bremen is not as big, but it has increased the employee count by 80. The company will open another new Carroll County store in Temple in December of this year as well as two others in Villa Rica in 2009.
The construction has begun on the newly relocated Daniel Defense facility in Bryan County. The company designs and builds parts for small arms, mainly the rail systems that attach to weapons which allow for the addition of optic systems and lasers to rifles. Located just off Interstate 16 in Black Creek the, 37,000 square foot, two-story plant will house about 40 additional employees when it is operational in May of 2009. The company already has a contract with the U. S. Military Special Forces and is delivering orders to the United Kingdom Ministry of Defense.
18
Georgia Unemployment Insurance Claims by County
County
August Average Average Initial Weekly Duration
Claims Benefit Weeks
County
August Average Average Initial Weekly Duration
Claims Benefit Weeks
Georgia
59,090 ....... $264 ...... 11.6
Appling
152 ....... $231 ...... 10.7
Atkinson
66 ....... $229 ........ 8.1
Bacon
87 ....... $230 ........ 8.7
Baker
36 ....... $202 ...... 12.2
Baldwin
349 ....... $188 ...... 11.4
Banks
89 ....... $245 ...... 10.0
Barrow
393 ....... $251 ...... 12.6
Bartow
742 ....... $245 ...... 11.8
Ben Hill
370 ....... $202 ...... 10.2
Berrien
104 ....... $218 ........ 9.2
Bibb
1,084 ....... $193 ...... 13.9
Bleckley
74 ....... $197 ...... 11.2
Brantley
99 ....... $247 ...... 12.7
Brooks
94 ....... $196 ...... 12.8
Bryan
117 ....... $242 ...... 12.6
Bulloch
311 ....... $214 ...... 10.0
Burke
297 ....... $202 ...... 15.4
Butts
175 ....... $233 ...... 12.0
Calhoun
26 ....... $184 ...... 12.2
Camden
169 ....... $225 ...... 13.5
Candler
46 ....... $223 ........ 9.1
Carroll
645 ....... $241 ...... 11.6
Catoosa
244 ....... $240 ........ 8.0
Charlton
33 ....... $222 ...... 13.7
Chatham
1,267 ....... $213 ...... 13.6
Chattahoochee 16 ....... $225 ...... 13.4
Chattooga
87 ....... $244 ...... 13.9
Cherokee
811 ....... $264 ...... 13.1
Clarke
480 ....... $200 ...... 12.3
Clay
18 ....... $236 ...... 13.7
Clayton
2,022 ....... $232 ...... 14.4
Clinch
34 ....... $187 ...... 13.0
Cobb
3,256 ....... $258 ...... 14.8
Coffee
372 ....... $213 ........ 9.6
Colquitt
266 ....... $190 ...... 10.7
Columbia
408 ....... $240 ...... 12.3
Cook
130 ....... $211 ........ 9.4
Coweta
657 ....... $246 ...... 11.0
Crawford
55 ....... $228 ...... 10.8
Crisp
220 ....... $174 ...... 13.4
Dade
80 ....... $234 ........ 7.4
Dawson
95 ....... $259 ...... 13.5
Decatur
437 ....... $189 ...... 10.9
DeKalb
4,551 ....... $237 ...... 14.5
Dodge
127 ....... $204 ...... 10.6
Dooly
77 ....... $178 ...... 11.3
Dougherty
513 ....... $179 ...... 13.1
Douglas
659 ....... $248 ...... 14.3
Early
87 ....... $163 ...... 13.0
Echols
9 ....... $192 ...... 10.0
Effingham
208 ....... $242 ...... 12.8
Elbert Emanuel Evans Fannin Fayette Floyd Forsyth Franklin Fulton Gilmer Glascock Glynn Gordon Grady Greene Gwinnett Habersham Hall Hancock Haralson Harris Hart Heard Henry Houston Irwin Jackson Jasper Jeff Davis Jefferson Jenkins Johnson Jones Lamar Lanier Laurens Lee Liberty Lincoln Long Lowndes Lumpkin Macon Madison Marion McDuffie McIntosh Meriwether Miller Mitchell Monroe Montgomery Morgan Murray
198 ....... $217 ........ 9.3 218 ....... $194 ...... 10.7
50 ....... $207 ...... 11.4 211 ....... $211 ...... 10.5 340 ....... $253 ...... 14.0 600 ....... $227 ........ 9.9 444 ....... $275 ...... 14.0 168 ....... $231 ...... 10.0 5,127 ....... $232 ...... 14.8 193 ....... $245 ........ 9.9 14 ....... $185 ........ 8.5 464 ....... $226 ...... 11.9 699 ....... $254 ........ 9.0 213 ....... $199 ...... 10.1 144 ....... $193 ...... 10.9 3,236 ....... $262 ...... 14.4 370 ....... $243 ........ 7.0 933 ....... $245 ...... 10.9 140 ....... $189 ...... 10.6 145 ....... $237 ...... 10.3 179 ....... $252 ...... 11.6 268 ....... $218 ...... 10.7 66 ....... $259 ........ 9.2 1,013 ....... $252 ...... 14.0 590 ....... $215 ...... 12.4 140 ....... $223 ...... 11.9 322 ....... $254 ...... 11.4 146 ....... $240 ...... 12.2 155 ....... $219 ........ 9.0 156 ....... $183 ...... 13.1 105 ....... $211 ...... 13.3 85 ....... $196 ...... 11.4 162 ....... $223 ...... 14.1 116 ....... $201 ........ 9.9 32 ....... $205 ........ 9.1 497 ....... $201 ...... 11.1 103 ....... $230 ...... 11.8 246 ....... $213 ...... 13.7 53 ....... $231 ...... 10.2 56 ....... $201 ...... 13.3 607 ....... $206 ...... 11.6 147 ....... $242 ........ 9.8 147 ....... $171 ........ 8.7 160 ....... $233 ...... 10.0 49 ....... $221 ........ 9.4 191 ....... $193 ...... 10.3 61 ....... $220 ...... 10.7 350 ....... $250 ...... 10.3 104 ....... $183 ........ 9.6 172 ....... $184 ...... 14.2 140 ....... $229 ...... 11.7 57 ....... $228 ...... 10.1 114 ....... $235 ...... 11.5 438 ....... $244 ........ 6.6
Initial claims include intrastate initial and additional claims, as well as agent state initial and additional claims for regular UI only. Average duration of benefits is represented in weeks.
County
August Average Average Initial Weekly Duration
Claims Benefit Weeks
Muscogee Newton Oconee Oglethorpe Paulding Peach Pickens Pierce Pike Polk Pulaski Putnam Quitman Rabun Randolph Richmond Rockdale Schley Screven Seminole Spalding Stephens Stewart Sumter Talbot Taliaferro Tattnall Taylor Telfair Terrell Thomas Tift Toombs Towns Treutlen Troup Turner Twiggs Union Upson Walker Walton Ware Warren Washington Wayne Webster Wheeler White Whitfield Wilcox Wilkes Wilkinson Worth
1,255 ....... $209 ...... 11.9 640 ....... $237 ...... 13.4 83 ....... $244 ...... 11.8 74 ....... $216 ...... 11.0 635 ....... $261 ...... 13.7 153 ....... $189 ...... 10.8 147 ....... $252 ...... 11.6 77 ....... $223 ...... 10.7 116 ....... $226 ...... 10.9 306 ....... $234 ........ 9.2 46 ....... $216 ...... 10.0 295 ....... $188 ........ 9.7 5 ....... $250 ...... 10.1 101 ....... $225 ...... 10.1 37 ....... $205 ........ 9.5
1,409 ....... $204 ...... 13.7 439 ....... $244 ...... 14.1 36 ....... $213 ........ 9.8 232 ....... $230 ........ 8.3 104 ....... $190 ...... 12.0 699 ....... $208 ...... 11.8 228 ....... $223 ...... 10.2 45 ....... $213 ...... 11.3 252 ....... $177 ...... 11.8 85 ....... $240 ...... 12.6 14 ....... $180 ...... 11.8 108 ....... $218 ...... 10.9 57 ....... $212 ........ 9.7 117 ....... $182 ...... 10.1 41 ....... $201 ...... 14.3 241 ....... $203 ...... 13.5 286 ....... $204 ...... 11.7 198 ....... $214 ...... 10.6 64 ....... $242 ...... 14.6 45 ....... $241 ........ 8.8 563 ....... $222 ...... 10.5 114 ....... $175 ...... 11.1 84 ....... $206 ...... 13.5 112 ....... $225 ...... 13.3 233 ....... $217 ...... 12.9 354 ....... $238 ........ 7.0 566 ....... $246 ...... 13.4 220 ....... $199 ...... 10.1 83 ....... $188 ........ 8.7 107 ....... $209 ...... 12.9 246 ....... $225 ...... 12.3 16 ....... $191 ........ 9.3 51 ....... $207 ...... 10.2 148 ....... $252 ........ 8.4
1,108 ....... $245 ........ 6.2 65 ....... $204 ...... 12.6
140 ....... $191 ...... 10.7 74 ....... $181 ...... 12.3 114 ....... $189 ...... 12.0
19
Georgia Department of Labor Workforce Information & Analysis 148 Andrew Young International Boulevard, N.E. Atlanta, Georgia 30303-1751
Return Service Requested