- Collection:
- Georgia Government Publications
- Title:
- Dimensions: measuring Georgia's workforce, Vol. 34, no. 3 (Mar. 2008)
- Creator:
- Georgia. Department of Labor
- Contributor to Resource:
- Georgia. Workforce Information and Analysis
- Publisher:
- Atlanta, Ga. : Georgia Dept. of Labor, 2008-03
- Date of Original:
- 2008-03
- Subject:
- Labor market--Georgia--Statistics
Wages--Georgia--Statistics
Hours of labor--Georgia--Statistics - Location:
- United States, Georgia, 32.75042, -83.50018
- Medium:
- state government records
- Type:
- Text
- Format:
- application/pdf
- External Identifiers:
- Call Number GA L200.E46 P1 T7 34/3
- Metadata URL:
- https://dlg.galileo.usg.edu/id:dlg_ggpd_i-ga-bl200-pe46-bp1-bt7-b34-s3-belec-p-btext
- Digital Object URL:
- https://dlg.galileo.usg.edu/do:dlg_ggpd_i-ga-bl200-pe46-bp1-bt7-b34-s3-belec-p-btext
- Language:
- eng
- Holding Institution:
- University of Georgia. Map and Government Information Library
- Rights:
-

March 2008 Data
March 2008 Employment Situation
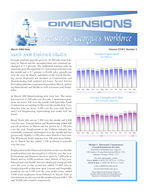
Georgia nonfarm payrolls grew by 10,200 jobs from February to March and the unemployment rate remained unchanged at 5.3 percent. The additional nonfarm jobs on statewide payrolls represent a 0.2 percent growth rate over the month and a 0.7 percent (+30,400 jobs) growth rate over the year. In March, industries in the Goods Producing sector displayed job declines as Construction and Manufacturing both endured job losses. Several Service Providing industries experienced growth in March, including Educational and Health as well as Leisure and Hospitality.
In March, 600 Manufacturing jobs were lost. The sector has now lost 11,500 jobs over the year. Construction positions are down 500 over the month with Specialty Trade Construction accounting for this over the month drop. Construction jobs are down 3,400 over the year with Heavy and Civil Engineering representing just under half the losses.
Retail Trade jobs are up 2,300 over the month and 6,400 over the year. Transportation and Warehousing added 400 payroll positions in March and has grown by 4,700 jobs over the year. Employment in the Utilities industry has essentially remained unchanged over the month and has grown only slightly (+300 jobs) since March of last year. The Wholesale Trade industry lost 700 jobs from February to March but has added 1,100 positions to payrolls over the year.
Employment in the Financial Activities sector was flat this month and has now decreased by 4,100 jobs over the year. Professional and Business Services grew by 2,800 jobs in March and by 6,900 positions since March of last year. Educational and Health Services displayed strong growth over the year as the sector has added 14,000 jobs to Georgia payrolls in that time span. Leisure and Hospitality positions are up 5,100 over the year as the sector added 4,900 more employees from February to March. Jobs in Government are also up over the month and year with 1,700 and 10,000 jobs created, respectively.
Volume XXXIV, Number 3 Georgia Employment
(In Millions)
4.13 4.14 4.16 4.15 4.12 4.16 4.15 4.17 4.19 4.19 4.14 4.15 4.16
Mar Apr May Jun Jul Aug Sep Oct Nov Dec Jan Feb Mar
2007
2008
Georgia Unemployment Rate
(not seasonally adjusted)
4.1%
4.0%
4.1%
4.7%
4.8%
4.5%
4.5%
4.5%
4.2%
4.6%
5.1%
5.3%
5.3%
Mar Apr May Jun Jul Aug Sep Oct Nov Dec Jan Feb Mar
2007
2008
Michael L. Thurmond, Commissioner Georgia Department of Labor
Workforce Information & Analysis 148 Andrew Young International Blvd., N.E.
Atlanta, Georgia 30303-1751
For more information, contact Corey Smith at (404) 232-3875 ext. 21299 or
David Echols at (404)232-3875 ext. 21272
corey.smith@dol.state.ga.us
david.echols@dol.state.ga.us
Equal Opportunity Employer/Program Auxiliary Aids and Services Available upon
Request to Individuals with Disabilities
GEORGIA Nonagricultural Employment (000s)
Change in Jobs
Change in Jobs
Preliminary Revised
Revised
MAR 2008 FEB 2008 MAR 2007
from FEB 2008 Net %
from MAR 2007 Net %
Total Nonfarm
4,161.3
4,151.1
4,130.9
+10.2 +0.2
+30.4 +0.7
Total Private
3,470.1
3,461.6
3,449.7
+8.5 +0.2
+20.4 +0.6
Goods Producing
652.6
653.7
667.8
-1.1 -0.2
-15.2 -2.3
Service-Providing
3,508.7
3,497.4
3,463.1
+11.3 +0.3
+45.6 +1.3
Private Service-Providing
2,817.5
2,807.9
2,781.9
+9.6 +0.3
+35.6 +1.3
Natural Resources and Mining
11.8
11.8
12.1
+.0 +0.0
-.3 -2.5
Construction
217.9
218.4
221.3
-.5 -0.2
-3.4 -1.5
Construction of Buildings
48.2
48.2
48.8
+.0 +0.0
-.6 -1.2
Heavy and Civil Engineering Construction
33.3
33.3
34.8
+.0 +0.0
-1.5 -4.3
Specialty Trade Contractors
136.4
136.9
137.7
-.5 -0.4
-1.3 -0.9
Manufacturing
422.9
423.5
434.4
-.6 -0.1
-11.5 -2.6
Durable Goods
200.0
200.2
204.4
-.2 -0.1
-4.4 -2.2
Computer, Electrical Equip and Appliance Mfg
28.1
28.0
28.2
+.1 +0.4
-.1 -0.4
Transportation Equipment Manufacturing
41.2
41.2
42.2
+.0 +0.0
-1.0 -2.4
Non-Durable Goods
222.9
223.3
230.0
-.4 -0.2
-7.1 -3.1
Food Manufacturing
66.4
66.3
67.9
+.1 +0.2
-1.5 -2.2
Textile Mills
25.7
25.7
27.1
+.0 +0.0
-1.4 -5.2
Textile Product Mills
37.6
37.5
37.7
+.1 +0.3
-.1 -0.3
Trade, Transportation and Utilities
889.6
887.6
877.1
+2.0 +0.2
+12.5 +1.4
Wholesale Trade
218.6
219.3
217.5
-.7 -0.3
+1.1 +0.5
Merchant Wholesalers, Durable Goods
112.2
112.4
113.4
-.2 -0.2
-1.2 -1.1
Merchant Wholesalers, Non-durable Goods
62.5
62.6
61.9
-.1 -0.2
+.6 +1.0
Wholesale Electronic Markets and Agents and Brokers
43.9
44.3
42.2
-.4 -0.9
+1.7 +4.0
Retail Trade
480.4
478.1
474.0
+2.3 +0.5
+6.4 +1.4
Food and Beverage Stores
81.5
81.3
80.3
+.2 +0.2
+1.2 +1.5
General Merchandise Stores
98.4
97.4
98.9
+1.0 +1.0
-.5 -0.5
Miscellaneous Store Retailers
23.2
23.4
23.1
-.2 -0.9
+.1 +0.4
Transportation, Warehousing, and Utilities
190.6
190.2
185.6
+.4 +0.2
+5.0 +2.7
Utilities
20.7
20.7
20.4
+.0 +0.0
+.3 +1.5
Transportation and Warehousing
169.9
169.5
165.2
+.4 +0.2
+4.7 +2.8
Air Transportation
39.0
38.8
37.4
+.2 +0.5
+1.6 +4.3
Truck Transportation
49.0
48.9
48.7
+.1 +0.2
+.3 +0.6
Couriers and Messengers
19.5
19.7
19.6
-.2 -1.0
-.1 -0.5
Warehousing and Storage
27.3
27.3
27.1
+.0 +0.0
+.2 +0.7
Information
114.7
114.6
114.8
+.1 +0.1
-.1 -0.1
Telecommunications
52.2
52.1
52.9
+.1 +0.2
-.7 -1.3
Wired Telecommunications Carriers
26.8
26.8
27.3
+.0 +0.0
-.5 -1.8
Wireless Telecommunications Carriers
12.3
12.3
12.2
+.0 +0.0
+.1 +0.8
Internet Service Providers, Search Portals, and DP
10.5
10.5
10.6
+.0 +0.0
-.1 -0.9
Financial Activities
227.9
227.9
232.0
+.0 +0.0
-4.1 -1.8
Finance and Insurance
164.5
164.6
167.4
-.1 -0.1
-2.9 -1.7
Insurance Carriers and Related Activities
66.3
66.0
66.2
+.3 +0.5
+.1 +0.2
Real Estate, Rental and Leasing
63.4
63.3
64.6
+.1 +0.2
-1.2 -1.9
Professional and Business Services
565.2
562.4
558.3
+2.8 +0.5
+6.9 +1.2
Professional, Scientific, and Technical Services
224.7
226.5
220.1
-1.8 -0.8
+4.6 +2.1
Accounting, Tax Preparation and Bookkeeping
32.7
33.6
33.7
-.9 -2.7
-1.0 -3.0
Architectural, Engineering and Related Services
40.6
40.7
40.8
-.1 -0.2
-.2 -0.5
Computer Systems Design and Related Services
46.6
46.7
46.4
-.1 -0.2
+.2 +0.4
Management and Technical Consulting Services
29.4
29.3
29.1
+.1 +0.3
+.3 +1.0
Management of Companies and Enterprises
53.0
52.9
52.2
+.1 +0.2
+.8 +1.5
Admin and Support, Waste Mngmnt and Remediation
287.5
283.0
286.0
+4.5 +1.6
+1.5 +0.5
Employment Services
139.7
135.5
138.1
+4.2 +3.1
+1.6 +1.2
Educational and Health Services
463.1
463.1
449.1
+.0 +0.0
+14.0 +3.1
Educational Services
84.1
83.9
81.3
+.2 +0.2
+2.8 +3.4
Colleges, Universities, and Professional Schools
51.6
51.3
50.4
+.3 +0.6
+1.2 +2.4
Health Care and Social Assistance
379.0
379.2
367.8
-.2 -0.1
+11.2 +3.0
Ambulatory Health Care Services
141.6
142.4
136.4
-.8 -0.6
+5.2 +3.8
Hospitals
125.3
125.0
122.5
+.3 +0.2
+2.8 +2.3
Nursing and Residential Care Facilities
55.5
55.4
53.3
+.1 +0.2
+2.2 +4.1
Social Assistance
56.6
56.4
55.6
+.2 +0.4
+1.0 +1.8
Leisure and Hospitality
396.7
391.8
391.6
+4.9 +1.3
+5.1 +1.3
Arts, Entertainment, and Recreation
39.9
38.1
39.6
+1.8 +4.7
+.3 +0.8
Amusement, Gambling, and Recreation
29.1
27.6
28.7
+1.5 +5.4
+.4 +1.4
Accommodation and Food Services
356.8
353.7
352.0
+3.1 +0.9
+4.8 +1.4
Accommodation
42.5
42.4
43.0
+.1 +0.2
-.5 -1.2
Food Services and Drinking Places
314.3
311.3
309.0
+3.0 +1.0
+5.3 +1.7
Other Services
160.3
160.5
159.0
-.2 -0.1
+1.3 +0.8
Repair and Maintenance
37.4
37.6
36.9
-.2 -0.5
+.5 +1.4
Personal and Laundry Services
34.5
34.9
34.4
-.4 -1.1
+.1 +0.3
Religious, Grantmaking, Civic, Professional and Similar
88.4
88.0
87.7
+.4 +0.5
+.7 +0.8
Government
691.2
689.5
681.2
+1.7 +0.2
+10.0 +1.5
Federal Government
96.2
96.4
95.6
-.2 -0.2
+.6 +0.6
Department of Defense
35.2
35.1
34.6
+.1 +0.3
+.6 +1.7
State Government
163.7
163.1
161.4
+.6 +0.4
+2.3 +1.4
State Government Education
77.4
77.2
75.2
+.2 +0.3
+2.2 +2.9
Local Government
431.3
430.0
424.2
+1.3 +0.3
+7.1 +1.7
Local Government Education
267.5
266.4
263.7
+1.1 +0.4
+3.8 +1.4
Note: These preliminary estimates were prepared in cooperation with the U.S. Department of Labor, Bureau of Labor Statistics, based upon monthly reports submitted by selected employers
throughout Georgia. The estimates include all full- and part-time wage and salary workers who were employed during or received pay for any part of the pay period that includes the twelfth of the
month. Proprietors, domestic workers, self-employed persons, unpaid family workers and personnel of the armed forces are excluded. Estimates based on 2007 benchmark.
2
Source: Georgia Department of Labor, Workforce Information & Analysis
ATLANTA MSA Nonagricultural Employment (000s)
Preliminary MAR 2008
Revised
Revised
FEB 2008 MAR 2007
Change in Jobs
from FEB 2008
Net
%
Change in Jobs from MAR 2007
Net %
Total Nonfarm Total Private Goods Producing Service-Providing Private Service-Providing Natural Resources and Mining Construction
Construction of Buildings Specialty Trade Contractors Manufacturing Durable Goods Transportation Equipment Manufacturing Non-Durable Goods Food Manufacturing Trade, Transportation and Utilities Wholesale Trade Merchant Wholesalers, Durable Goods Merchant Wholesalers, Non-durable Goods Wholesale Electronic Markets and Agents and Brokers Retail Trade Food and Beverage Stores General Merchandise Stores Miscellaneous Store Retailers Transportation, Warehousing, and Utilities Utilities Transportation and Warehousing
Air Transportation Truck Transportation Couriers and Messengers Information Telecommunications Wired Telecommunications Carriers Wireless Telecommunications Carriers Internet Service Providers, Search Portals, and DP Financial Activities Finance and Insurance Insurance Carriers and Related Activities Real Estate, Rental and Leasing Professional and Business Services Professional, Scientific, and Technical Services Accounting, Tax Preparation and Bookkeeping Architectural, Engineering and Related Services Computer Systems Design and Related Services Management and Technical Consulting Services Management of Companies and Enterprises Admin and Support, Waste Mngmnt and Remediation Employment Services Educational and Health Services Educational Services Health Care and Social Assistance Ambulatory Health Care Services Hospitals Social Assistance Leisure and Hospitality Arts, Entertainment, and Recreation Accommodation and Food Services Accommodation Food Services and Drinking Places Other Services Repair and Maintenance Personal and Laundry Services Government Federal Government State Government Local Government
2,471.2 2,131.5
314.9 2,156.3 1,816.6
2.5 137.7
30.3 86.4 174.7 91.3 15.4 83.4 25.0 562.6 159.5 84.4 41.3 33.8 273.6 50.2 52.3 15.2 129.5 11.1 118.4 38.1 29.9 15.7 88.2 37.9 22.1 10.1
9.9 160.6 114.3
45.8 46.3 412.2 173.8 21.9 31.3 37.9 25.9 40.3 198.1 94.2 258.2 56.8 201.4 77.8 65.3 34.1 236.9 26.4 210.5 24.2 186.3 97.9 21.3 23.3 339.7 45.9 71.8 222.0
2,462.3 2,123.9
314.7 2,147.6 1,809.2
2.5 137.2
30.2 86.1 175.0 91.4 15.6 83.6 25.0 561.7 159.8 84.5 41.3 34.0 272.8 50.1 52.0 15.5 129.1 11.1 118.0 38.0 29.7 15.8 88.0 37.8 22.1 10.1
9.9 160.6 114.4
45.6 46.2 410.0 174.9 22.5 31.4 38.0 26.0 40.5 194.6 91.1 258.0 56.5 201.5 78.3 65.1 34.2 233.2 24.9 208.3 24.0 184.3 97.7 21.4 23.3 338.4 45.8 71.3 221.3
2,444.8 2,113.8
318.8 2,126.0 1,795.0
2.6 139.6
30.1 87.5 176.6 92.4 16.1 84.2 25.0 557.1 159.6 85.1 41.4 33.1 270.6 48.9 51.3 15.2 126.9 11.1 115.8 36.6 29.7 15.6 88.1 38.4 21.9 10.1 10.1 163.9 117.1 45.6 46.8 406.5 170.9 22.4 31.0 37.6 25.6 39.7 195.9 91.7 249.9 54.4 195.5 75.5 63.9 32.9 232.6 26.2 206.4 24.3 182.1 96.9 21.5 22.7 331.0 45.8 67.2 218.0
+8.9 +7.6
+.2 +8.7 +7.4
+.0 +.5 +.1 +.3 -.3 -.1 -.2 -.2 +.0 +.9 -.3 -.1 +.0 -.2 +.8 +.1 +.3 -.3 +.4 +.0 +.4 +.1 +.2 -.1 +.2 +.1 +.0 +.0 +.0 +.0 -.1 +.2 +.1 +2.2 -1.1 -.6 -.1 -.1 -.1 -.2 +3.5 +3.1 +.2 +.3 -.1 -.5 +.2 -.1 +3.7 +1.5 +2.2 +.2 +2.0 +.2 -.1 +.0 +1.3 +.1 +.5 +.7
+0.4 +0.4 +0.1 +0.4 +0.4 +0.0 +0.4 +0.3 +0.3 -0.2 -0.1 -1.3 -0.2 +0.0 +0.2 -0.2 -0.1 +0.0 -0.6 +0.3 +0.2 +0.6 -1.9 +0.3 +0.0 +0.3 +0.3 +0.7 -0.6 +0.2 +0.3 +0.0 +0.0 +0.0 +0.0 -0.1 +0.4 +0.2 +0.5 -0.6 -2.7 -0.3 -0.3 -0.4 -0.5 +1.8 +3.4 +0.1 +0.5 +0.0 -0.6 +0.3 -0.3 +1.6 +6.0 +1.1 +0.8 +1.1 +0.2 -0.5 +0.0 +0.4 +0.2 +0.7 +0.3
+26.4 +17.7
-3.9 +30.3 +21.6
-.1 -1.9 +.2 -1.1 -1.9 -1.1
-.7 -.8 +.0 +5.5 -.1 -.7 -.1 +.7 +3.0 +1.3 +1.0 +.0 +2.6 +.0 +2.6 +1.5 +.2 +.1 +.1 -.5 +.2 +.0 -.2 -3.3 -2.8 +.2 -.5 +5.7 +2.9 -.5 +.3 +.3 +.3 +.6 +2.2 +2.5 +8.3 +2.4 +5.9 +2.3 +1.4 +1.2 +4.3 +.2 +4.1 -.1 +4.2 +1.0 -.2 +.6 +8.7 +.1 +4.6 +4.0
+1.1 +0.8 -1.2 +1.4 +1.2 -3.8 -1.4 +0.7 -1.3 -1.1 -1.2 -4.3 -1.0 +0.0 +1.0 -0.1 -0.8 -0.2 +2.1 +1.1 +2.7 +1.9 +0.0 +2.0 +0.0 +2.2 +4.1 +0.7 +0.6 +0.1 -1.3 +0.9 +0.0 -2.0 -2.0 -2.4 +0.4 -1.1 +1.4 +1.7 -2.2 +1.0 +0.8 +1.2 +1.5 +1.1 +2.7 +3.3 +4.4 +3.0 +3.0 +2.2 +3.6 +1.8 +0.8 +2.0 -0.4 +2.3 +1.0 -0.9 +2.6 +2.6 +0.2 +6.8 +1.8
Note: These preliminary estimates were prepared in cooperation with the U.S. Department of Labor, Bureau of Labor Statistics, based upon monthly reports submitted by selected employers
in the Atlanta Metropolitan Statistical Area, which includes Barrow, Bartow, Butts, Carroll, Cherokee, Clayton, Cobb, Coweta, Dawson, DeKalb, Douglas, Fayette, Forsyth, Fulton, Gwinnett, Haralson, Heard, Henry, Jasper, Lamar, Meriwether, Newton, Paulding, Pickens, Pike, Rockdale, Spalding and Walton counties. The estimates include all full- and part-time wage and salary workers who were employed during or received pay for any part of the pay period that includes the twelfth of the month. Proprietors, domestic workers, self-employed persons, unpaid family workers and personnel of the armed forces are excluded. Estimates based on 2007 benchmark.
Source: Georgia Department of Labor, Workforce Information & Analysis
3
ALBANY MSA Nonagricultural Employment (000s)
Preliminary
Revised
Revised
MAR 2008 FEB 2008 MAR 2007
Change in Jobs from FEB 2008
Net %
Change in Jobs
from MAR 2007
Net
%
Total Nonfarm Total Private
64.6
64.4
64.7
50.5
50.3
50.7
+.2 +0.3 +.2 +0.4
-.1 -0.2 -.2 -0.4
Goods Producing Service-Providing Private Service-Providing
9.8
9.8
10.0
54.8
54.6
54.7
40.7
40.5
40.7
+.0 +0.0 +.2 +0.4 +.2 +0.5
-.2 -2.0 +.1 +0.2 +.0 +0.0
Manufacturing Trade, Transportation and Utilities Retail Trade
6.6
6.6
7.0
13.3
13.3
13.4
8.0
7.9
8.1
+.0 +0.0 +.0 +0.0 +.1 +1.3
-.4 -5.7 -.1 -0.7 -.1 -1.2
Government Federal Government State Government
14.1
14.1
14.0
3.1
3.1
3.1
3.1
3.1
3.1
+.0 +0.0 +.0 +0.0 +.0 +0.0
+.1 +0.7 +.0 +0.0 +.0 +0.0
Local Government
7.9
7.9
7.8
+.0 +0.0
+.1 +1.3
Note: These preliminary estimates were prepared in cooperation with the U.S. Department of Labor, Bureau of Labor Statistics, based upon monthly reports submitted by selected employers
in the Albany Metropolitan Statistical Area, which includes Baker, Dougherty, Lee, Terrell and Worth counties. The estimates include all full- and part-time wage and salary workers who were employed during or received pay for any part of the pay period that includes the twelfth of the month. Proprietors, domestic workers, self-employed persons, unpaid family workers and personnel
of the armed forces are excluded. Estimates based on 2007 benchmark.
ATHENS - CLARKE MSA Nonagricultural Employment (000s)
Preliminary
Revised
Revised
MAR 2008 FEB 2008 MAR 2007
Change in Jobs
from FEB 2008
Net
%
Change in Jobs from MAR 2007
Net %
Total Nonfarm
82.7
82.9
81.6
-.2 -0.2
+1.1 +1.3
Total Private
59.9
60.1
59.4
-.2 -0.3
+.5 +0.8
Goods Producing
12.5
12.5
13.0
+.0 +0.0
-.5 -3.8
Service-Providing
70.2
70.4
68.6
-.2 -0.3
+1.6 +2.3
Private Service-Providing
47.4
47.6
46.4
-.2 -0.4
+1.0 +2.2
Trade, Transportation and Utilities
13.7
13.9
13.6
-.2 -1.4
+.1 +0.7
Retail Trade
9.5
9.5
9.3
+.0 +0.0
+.2 +2.2
Professional and Business Services
6.3
6.4
6.1
-.1 -1.6
+.2 +3.3
Leisure and Hospitality
8.6
8.5
8.4
+.1 +1.2
+.2 +2.4
Government
22.8
22.8
22.2
+.0 +0.0
+.6 +2.7
Federal Government
1.6
1.6
1.6
+.0 +0.0
+.0 +0.0
State Government
13.5
13.5
13.3
+.0 +0.0
+.2 +1.5
Local Government
7.7
7.7
7.3
+.0 +0.0
+.4 +5.5
Note: These preliminary estimates were prepared in cooperation with the U.S. Department of Labor, Bureau of Labor Statistics, based upon monthly reports submitted by selected employers in
the Athens - Clarke County Metropolitan Statistical Area, which includes Clarke, Madison, Oconee and Oglethorpe counties. The estimates include all full- and part-time wage and salary workers who were employed during or received pay for any part of the pay period that includes the twelfth of the month. Proprietors, domestic workers, self-employed persons, unpaid family workers and personnel of the armed forces are excluded. Estimates based on 2007 benchmark.
Source: Georgia Department of Labor, Workforce Information & Analysis
4
AUGUSTA-RICHMOND MSA Nonagricultural Employment (000s)
Preliminary Revised Revised MAR 2008 FEB 2008 MAR 2007
Change in Jobs from FEB 2008
Net %
Change in Jobs from MAR 2007
Net %
Total Nonfarm Total Private Goods Producing Service-Providing Private Service-Providing Natural Resources, Mining and Construction Manufacturing Trade, Transportation and Utilities
Wholesale Trade Retail Trade Transportation,Warehousing, and Utilities Information Financial Activitities Professional and Business Services Educational and Health Services Leisure and Hospitality Other Services Government Federal Government State Government Local Government
218.0 175.0
37.9 180.1 137.1
14.1 23.8 36.9
5.4 24.9
6.6 3.7 7.4 30.8 28.2 21.3 8.8 43.0 7.5 13.0 22.5
216.9 174.0
37.9 179.0 136.1
14.0 23.9 36.8
5.4 24.8
6.6 3.8 7.4 30.6 28.1 20.6 8.8 42.9 7.4 13.1 22.4
215.9 173.0
38.4 177.5 134.6
13.9 24.5 36.3
5.3 24.6
6.4 3.3 7.3 30.2 27.4 21.3 8.8 42.9 7.5 13.1 22.3
+1.1 +1.0
+.0 +1.1 +1.0
+.1 -.1 +.1 +.0 +.1 +.0 -.1 +.0 +.2 +.1 +.7 +.0 +.1 +.1 -.1 +.1
+0.5 +0.6 +0.0 +0.6 +0.7 +0.7 -0.4 +0.3 +0.0 +0.4 +0.0 -2.6 +0.0 +0.7 +0.4 +3.4 +0.0 +0.2 +1.4 -0.8 +0.4
+2.1 +1.0 +2.0 +1.2
-.5 -1.3 +2.6 +1.5 +2.5 +1.9
+.2 +1.4 -.7 -2.9 +.6 +1.7 +.1 +1.9 +.3 +1.2 +.2 +3.1 +.4 +12.1 +.1 +1.4 +.6 +2.0 +.8 +2.9 +.0 +0.0 +.0 +0.0 +.1 +0.2 +.0 +0.0 -.1 -0.8 +.2 +0.9
Note: These preliminary estimates were prepared in cooperation with the U.S. Department of Labor, Bureau of Labor Statistics, based upon monthly reports submitted by selected employers in the
Augusta - Richmond County Metropolitan Statistical Area, which includes Burke, Columbia, McDuffie and Richmond counties in Georgia and Aiken and Edgefield counties in South Carolina. The estimates include all full- and part-time wage and salary workers who were employed during or received pay for any part of the pay period that includes the twelfth of the month. Proprietors, domestic
workers, self-employed persons, unpaid family workers and personnel of the armed forces are excluded. Estimates based on 2007 benchmark.
COLUMBUS MSA Nonagricultural Employment (000s)
Preliminary Revised Revised MAR 2008 FEB 2008 MAR 2007
Change in Jobs from FEB 2008
Net %
Change in Jobs from MAR 2007
Net %
Total Nonfarm Total Private Goods Producing
121.1 98.3 16.3
121.2 98.4 16.3
121.3 98.4 17.3
-.1 -0.1 -.1 -0.1 +.0 +0.0
-.2 -0.2 -.1 -0.1 -1.0 -5.8
Service-Providing Private Service-Providing Trade, Transportation and Utilities
104.8 82.0 18.4
104.9 82.1 18.4
104.0 81.1 18.7
-.1 -0.1 -.1 -0.1 +.0 +0.0
+.8 +0.8 +.9 +1.1 -.3 -1.6
Retail Trade Information Financial Activities
13.9
13.9
14.3
5.9
5.9
5.9
9.4
9.4
9.2
+.0 +0.0 +.0 +0.0 +.0 +0.0
-.4 -2.8 +.0 +0.0 +.2 +2.2
Finance and Insurance Insurance Carriers and Related Activities Professional and Business Services
7.4
7.4
7.3
4.9
4.9
4.9
14.2
14.2
13.8
+.0 +0.0 +.0 +0.0 +.0 +0.0
+.1 +1.4 +.0 +0.0 +.4 +2.9
Leisure and Hospitality Government
Federal Government
13.4
13.2
13.4
22.8
22.8
22.9
5.3
5.3
5.3
+.2 +1.5 +.0 +0.0 +.0 +0.0
+.0 +0.0 -.1 -0.4 +.0 +0.0
State Government Local Government
4.2
4.2
4.2
13.3
13.3
13.4
+.0 +0.0 +.0 +0.0
+.0 +0.0 -.1 -0.7
Note: These preliminary estimates were prepared in cooperation with the U.S. Department of Labor, Bureau of Labor Statistics, based upon monthly reports submitted by selected
employers in the Columbus Metropolitan Statistical Area, which includes Chattahoochee, Harris, Marion and Muscogee counties in Georgia and Russell County in Alabama. The estimates include all full- and part-time wage and salary workers who were employed during or received pay for any part of the pay period that includes the twelfth of the month. Proprietors, domestic
workers, self-employed persons, unpaid family workers and personnel of the armed forces are excluded. Estimates based on 2007 benchmark.
5
DALTON MSA Nonagricultural Employment (000s)
Preliminary Revised
Revised
MAR 2008 FEB 2008 MAR 2007
Change in Jobs from FEB 2008
Net %
Change in Jobs from MAR 2007
Net %
Total Nonfarm
77.6
77.5
78.3
+.1 +0.1
-.7 -0.9
Total Private Goods Producing
70.2
70.1
70.8
+.1 +0.1
30.9
30.9
31.4
+.0 +0.0
-.6 -0.8 -.5 -1.6
Service-Providing
46.7
46.6
46.9
+.1 +0.2
-.2 -0.4
Private Service-Providing Manufacturing
39.3
39.2
28.6
28.7
39.4 29.5
+.1 +0.3 -.1 -0.3
-.1 -0.3 -.9 -3.1
Textile Mills
3.3
3.4
3.5
-.1 -2.9
-.2 -5.7
Textile Product Mills Trade, Transportation and Utilities
19.8
19.8
20.2
+.0 +0.0
15.9
15.8
16.2
+.1 +0.6
-.4 -2.0 -.3 -1.9
Retail Trade
7.9
7.9
8.1
+.0 +0.0
-.2 -2.5
Transportation, Warehouse, and Utilities Professional and Business Services
3.5
3.5
10.3
10.2
3.7 10.1
+.0 +0.0 +.1 +1.0
-.2 -5.4 +.2 +2.0
Government
7.4
7.4
7.5
+.0 +0.0
-.1 -1.3
Federal Government State Government
.3
.3
1.1
1.1
.3
+.0 +0.0
1.2
+.0 +0.0
+.0 +0.0 -.1 -8.3
Local Government
6.0
6.0
6.0
+.0 +0.0
+.0 +0.0
Note: These preliminary estimates were prepared in cooperation with the U.S. Department of Labor, Bureau of Labor Statistics, based upon monthly reports submitted by selected employers
in the Dalton Metropolitan Statistical Area, which includes Murray and Whitfield counties. The estimates include all full- and part-time wage and salary workers who were employed during or received pay for any part of the pay period that includes the twelfth of the month. Proprietors, domestic workers, self-employed persons, unpaid family workers and personnel of the armed forces are excluded. Estimates based on 2007 benchmark.
Source: Georgia Department of Labor, Workforce Information & Analysis
GAINESVILLE MSA Nonagricultural Employment (000s)
Preliminary Revised
Revised
MAR 2008 FEB 2008 MAR 2007
Change in Jobs from FEB 2008
Net %
Change in Jobs from MAR 2007
Net %
Total Nonfarm
77.2
76.9
75.6
+.3 +0.4
+1.6 +2.1
Total Private Goods Producing
66.7
66.4
65.3
21.9
21.9
22.1
+.3 +0.5 +.0 +0.0
+1.4 +2.1 -.2 -0.9
Service-Providing
55.3
55.0
53.5
+.3 +0.5
+1.8 +3.4
Private Service-Providing Trade, Transportation and Utilities
44.8
44.5
43.2
13.4
13.3
13.0
+.3 +0.7 +.1 +0.8
+1.6 +3.7 +.4 +3.1
Retail Trade
7.6
7.5
7.2
+.1 +1.3
+.4 +5.6
Government Federal Government
10.5
10.5
10.3
.5
.5
.5
+.0 +0.0 +.0 +0.0
+.2 +1.9 +.0 +0.0
State Government
2.8
2.8
2.8
+.0 +0.0
+.0 +0.0
Local Government
7.2
7.2
7.0
+.0 +0.0
+.2 +2.9
Note: These preliminary estimates were prepared in cooperation with the U.S. Department of Labor, Bureau of Labor Statistics, based upon monthly reports submitted by selected employers
in the Gainesville Metropolitan Statistical Area, which comprises Hall county. The estimates include all full- and part-time wage and salary workers who were employed during or received pay for any part of the pay period that includes the twelfth of the month. Proprietors, domestic workers, self-employed persons, unpaid family workers and personnel of the armed forces are excluded.
Estimates based on 2007 benchmark.
6
MACON MSA Nonagricultural Employment (000s)
Preliminary Revised
Revised
MAR 2008 FEB 2008 MAR 2007
Change in Jobs from FEB 2008
Net %
Change in Jobs from MAR 2007
Net %
Total Nonfarm Total Private Goods Producing Service-Providing Private Service-Providing Trade Transportation and Utilities
Retail Trade Transportation, Warehousing, and Utilities Financial Activities Professional and Business Services Educational and Health Services Leisure and Hospitality Government Federal Government State Government Local Government
100.4 84.4 11.7 88.7 72.7 19.7 12.3 4.0 8.1 11.5 18.7 9.0 16.0 1.3 4.1 10.6
100.2 84.3 11.7 88.5 72.6 19.6 12.2 4.0 8.1 11.4 18.7 8.9 15.9 1.3 4.1 10.5
99.7 83.6 11.7 88.0 71.9 19.6 12.2
3.9 8.1 11.5 18.3 8.7 16.1 1.3 4.2 10.6
+.2 +0.2 +.1 +0.1 +.0 +0.0 +.2 +0.2 +.1 +0.1 +.1 +0.5 +.1 +0.8 +.0 +0.0 +.0 +0.0 +.1 +0.9 +.0 +0.0 +.1 +1.1 +.1 +0.6 +.0 +0.0 +.0 +0.0 +.1 +1.0
+.7 +0.7 +.8 +1.0 +.0 +0.0 +.7 +0.8 +.8 +1.1 +.1 +0.5 +.1 +0.8 +.1 +2.6 +.0 +0.0 +.0 +0.0 +.4 +2.2 +.3 +3.4 -.1 -0.6 +.0 +0.0 -.1 -2.4 +.0 +0.0
Note: These preliminary estimates were prepared in cooperation with the U.S. Department of Labor, Bureau of Labor Statistics, based upon monthly reports submitted by selected employers
in the Macon Metropolitan Statistical Area, which includes Bibb, Crawford, Jones, Monroe and Twiggs counties. The estimates include all full- and part-time wage and salary workers who were employed during or received pay for any part of the pay period that includes the twelfth of the month. Proprietors, domestic workers, self-employed persons, unpaid family workers and personnel
of the armed forces are excluded. Estimates based on 2007 benchmark.
SAVANNAH MSA Nonagricultural Employment (000s)
Preliminary Revised
Revised
MAR 2008 FEB 2008 MAR 2007
Change in Jobs from FEB 2008
Net %
Change in Jobs
from MAR 2007
Net
%
Total Nonfarm Total Private Goods Producing Service-Providing Private Service-Providing Natural Resources, Mining and Construction Manufacturing Trade, Transportation and Utilities
Wholesale Trade Retail Trade Transportation, Warehousing, and Utilities Information Financial Activities Professional and Business Services Educational and Health Services Leisure and Hospitality Other Services Government Federal Government State Government Local Government
161.8 140.5
24.5 137.3 116.0
9.9 14.6 36.4
6.6 18.2 11.6
2.0 6.0 20.1 22.2 21.1 8.2 21.3 2.8 4.2 14.3
161.0 139.7
24.4 136.6 115.3
9.8 14.6 36.2
6.6 18.1 11.5
2.0 6.0 19.9 22.3 20.7 8.2 21.3 2.8 4.2 14.3
161.0 139.5
24.9 136.1 114.6
10.0 14.9 34.8
6.5 17.9 10.4
2.0 6.2 20.7 22.0 20.7 8.2 21.5 2.8 4.4 14.3
+.8 +0.5 +.8 +0.6 +.1 +0.4 +.7 +0.5 +.7 +0.6 +.1 +1.0 +.0 +0.0 +.2 +0.6 +.0 +0.0 +.1 +0.6 +.1 +0.9 +.0 +0.0 +.0 +0.0 +.2 +1.0 -.1 -0.4 +.4 +1.9 +.0 +0.0 +.0 +0.0 +.0 +0.0 +.0 +0.0 +.0 +0.0
+.8 +1.0
-.4 +1.2 +1.4
-.1 -.3 +1.6 +.1 +.3 +1.2 +.0 -.2 -.6 +.2 +.4 +.0 -.2 +.0 -.2 +.0
+0.5 +0.7 -1.6 +0.9 +1.2 -1.0 -2.0 +4.6 +1.5 +1.7 +11.5 +0.0 -3.2 -2.9 +0.9 +1.9 +0.0 -0.9 +0.0 -4.5 +0.0
Note: These preliminary estimates were prepared in cooperation with the U.S. Department of Labor, Bureau of Labor Statistics, based upon monthly reports submitted by selected employers
in the Savannah Metropolitan Statistical Area, which includes Bryan, Chatham and Effingham counties. The estimates include all full- and part-time wage and salary workers who were employed during or received pay for any part of the pay period that includes the twelfth of the month. Proprietors, domestic workers, self-employed persons, unpaid family workers and personnel of the armed
forces are excluded. Estimates based on 2007 benchmark.
7
VALDOSTA MSA Nonagricultural Employment (000s)
Preliminary Revised
Revised
MAR 2008 FEB 2008 MAR 2007
Change in Jobs from FEB 2008
Net %
Change in Jobs
from MAR 2007
Net
%
Total Nonfarm Total Private Goods Producing Service-Providing Private Service-Providing Trade, Transportation and Utilities
Retail Trade Government
Federal Government State Government Local Government
56.4
56.4
43.8
43.9
9.0
9.1
47.4
47.3
34.8
34.8
12.9
12.9
9.3
9.4
12.6
12.5
.8
.8
4.1
4.0
7.7
7.7
56.1 43.6
9.1 47.0 34.5 12.7
9.2 12.5
.8 4.2 7.5
+.0 +0.0 -.1 -0.2 -.1 -1.1 +.1 +0.2 +.0 +0.0 +.0 +0.0 -.1 -1.1 +.1 +0.8 +.0 +0.0 +.1 +2.5 +.0 +0.0
+.3 +0.5 +.2 +0.5 -.1 -1.1 +.4 +0.9 +.3 +0.9 +.2 +1.6 +.1 +1.1 +.1 +0.8 +.0 +0.0 -.1 -2.4 +.2 +2.7
Note: These preliminary estimates were prepared in cooperation with the U.S. Department of Labor, Bureau of Labor Statistics, based upon monthly reports submitted by selected employers
in the Valdosta Metropolitan Statistical Area, which includes Brooks, Echols, Lanier and Lowndes counties. The estimates include all full- and part-time wage and salary workers who were employed during or received pay for any part of the pay period that includes the twelfth of the month. Proprietors, domestic workers, self-employed persons, unpaid family workers and personnel of the armed forces are excluded. Estimates based on 2007 benchmark.
Source: Georgia Department of Labor, Workforce Information & Analysis
WARNER ROBINS MSA Nonagricultural Employment (000s)
Preliminary Revised
Revised
MAR 2008 FEB 2008 MAR 2007
Change in Jobs from FEB 2008
Net %
Change in Jobs
from MAR 2007
Net
%
Total Nonfarm Total Private Goods Producing Service-Providing Private Service-Providing Trade, Transportation and Utilities
Retail Trade Government
Federal Government State Government Local Government
59.4
59.1
58.8
36.5
36.2
36.5
7.5
7.4
7.6
51.9
51.7
51.2
29.0
28.8
28.9
7.9
7.9
7.6
6.5
6.4
6.2
22.9
22.9
22.3
14.2
14.2
13.8
1.0
1.0
1.0
7.7
7.7
7.5
+.3 +0.5 +.3 +0.8 +.1 +1.4 +.2 +0.4 +.2 +0.7 +.0 +0.0 +.1 +1.6 +.0 +0.0 +.0 +0.0 +.0 +0.0 +.0 +0.0
+.6 +1.0 +.0 +0.0 -.1 -1.3 +.7 +1.4 +.1 +0.3 +.3 +3.9 +.3 +4.8 +.6 +2.7 +.4 +2.9 +.0 +0.0 +.2 +2.7
Note: These preliminary estimates were prepared in cooperation with the U.S. Department of Labor, Bureau of Labor Statistics, based upon monthly reports submitted by selected employers
in the Warner Robins Metropolitan Statistical Area, which comprises Houston county. The estimates include all full- and part-time wage and salary workers who were employed during or received pay for any part of the pay period that includes the twelfth of the month. Proprietors, domestic workers, self-employed persons, unpaid family workers and personnel of the armed forces are excluded. Estimates based on 2007 benchmark.
Source: Georgia Department of Labor, Workforce Information & Analysis
8
Georgia Hours and Earnings
Experimental All Employee
Average Weekly Earnings
Preliminary MAR 2008
Revised FEB 2008
Revised MAR 2007
Total Private ............................................................................................ $719.59 ........................ $719.14 ................... $724.88 Goods Producing ................................................................................... $740.10 ........................ $733.73 ................... $737.23 Private Service Providing ....................................................................... $715.86 ........................ $714.78 ................... $721.39 Construction ........................................................................................... $710.63 ........................ $695.84 ................... $680.68 Manufacturing ......................................................................................... $755.09 ........................ $754.38 ................... $798.68 Trade, Transportation, and Utilities ........................................................ $658.67 ........................ $701.89 ................... $691.73 Financial Activities .................................................................................. $894.99 ........................ $833.15 ................... $930.58 Professional and Business Services ...................................................... $908.80 ........................ $865.73 ................... $871.08 Educational and Health Services ........................................................... $777.92 ........................ $767.22 ................... $764.57 Leisure and Hospitality ........................................................................... $339.45 ........................ $336.05 ................... $328.30 Other Services ........................................................................................ $498.35 ........................ $476.29 ................... $492.78
Average Weekly Hours
Preliminary MAR 2008
Revised FEB 2008
Revised MAR 2007
Total Private .................................................................................................. 35.5 .............................. 35.2 ......................... 34.8 Goods Producing ......................................................................................... 39.2 .............................. 39.3 ......................... 39.7 Private Service Providing ............................................................................. 34.7 .............................. 34.2 ......................... 33.6 Construction ................................................................................................. 37.5 .............................. 37.9 ......................... 38.5 Manufacturing ............................................................................................... 39.7 .............................. 39.6 ......................... 41.0 Trade, Transportation, and Utilities .............................................................. 35.7 .............................. 35.2 ......................... 34.5 Financial Activities ........................................................................................ 35.9 .............................. 34.7 ......................... 35.6 Professional and Business Services ............................................................ 34.9 .............................. 34.3 ......................... 34.0 Educational and Health Services ................................................................. 37.8 .............................. 38.0 ......................... 36.9 Leisure and Hospitality ................................................................................. 28.1 .............................. 27.5 ......................... 26.8 Other Services .............................................................................................. 32.7 .............................. 32.6 ......................... 30.4
Average Hourly Earnings
Preliminary MAR 2008
Revised FEB 2008
Revised MAR 2007
Total Private .............................................................................................. $20.27 .......................... $20.43 ..................... $20.83 Goods Producing ..................................................................................... $18.88 .......................... $18.67 ..................... $18.57 Private Service Providing ......................................................................... $20.63 .......................... $20.90 ..................... $21.47 Construction ............................................................................................. $18.95 .......................... $18.36 ..................... $17.68 Manufacturing ........................................................................................... $19.02 .......................... $19.05 ..................... $19.48 Trade, Transportation, and Utilities .......................................................... $18.45 .......................... $19.94 ..................... $20.05 Financial Activities .................................................................................... $24.93 .......................... $24.01 ..................... $26.14 Professional and Business Services ........................................................ $26.04 .......................... $25.24 ..................... $25.62 Educational and Health Services ............................................................. $20.58 .......................... $20.19 ..................... $20.72 Leisure and Hospitality ............................................................................. $12.08 .......................... $12.22 ..................... $12.25 Other Services .......................................................................................... $15.24 .......................... $14.61 ..................... $16.21
The Current Employment Statistics (CES) program began work in 2005 to add new series on hours and earnings. New series have been developed such as average hourly earnings and average weekly hours of all nonfarm private sector employees. Historically, the CES program has produced average hours and earnings series for such categories as production workers in the manufacturing industry and nonsupervisory workers in other industries. The new hours and earnings, covering all employees rather than just production or non-supervisory workers, are more comprehensive in coverage.
The release of these new series are designated "experimental" because of the limited experience to date with the editing and review of the sample reports and the resultant estimates. The experimental State series, being released in March 2008, includes estimates at a total private sector level and limited industry detail.
Read more about the experimental hours and earnings series at http://www.bls.gov/sae/saeaepp.htm
9
Dimensions - Measuring Georgia's Labor Force
Unemployment rates -- Georgia and U.S.
6.0%
Ge orgia
U.S.
5.0%
4.0%
3.0%
Mar Apr May Jun Jul Aug Sep Oct Nov Dec Jan Feb Mar
2007
2008
WA 5.3 OR 6.3
NV 5.8 CA 6.4
AK 7.4
ID 3.8
UT 3.5
AZ 3.9
State unemployment rates
National Unemployment Rate: 5.2% Rates are not seasonally adjusted
MT 4.4
WY 3.8
CO 4.7
NM 3.7
ND 4.0
SD 3.0
NE 3.2
KS 4.4
MN 5.4
WI 5.6
IA 3.9
IL 5.7
MO 6.1
OK 3.2
TX 4.2
AR 5.0
MS 5.9
LA 4.3
NH 4.3
VT
ME
5.3
5.8
MI 7.9
OH
IN
6.1
5.6
KY 6.1
TN 5.9
PA 5.3
WV
5.4
VA
3.9
NC 5.2
SC 5.5
AL
GA
4.1
5.3
FL 4.7
MA 4.8 NY 5.1
RI 6.7 CT NJ 5.5 5.1 DE 4.0 DC 6.4
MD 3.7
Unemployment rate 7.0% to 9.9% 6.0% to 6.9% 5.0% to 5.9% 4.0% to 4.9% 3.0% to 3.9% Less than 3.0%
HI 3.0
10
Georgia Labor Force Estimates (not seasonally adjusted) Place of Residence - Persons 16 Years and Older
Employment Status
Preliminary MAR 2008
Revised FEB 2008
Revised MAR 2007
Change From
Revised
Revised
FEB 2008
MAR 2007
Georgia
Civilian labor force Employed Unemployed Rate
4,883,895 4,627,068
256,827 5.3
4,845,783 4,591,342
254,441 5.3
4,792,438 4,597,951
194,487 4.1
38,112 35,726
2,386
91,457 29,117 62,340
Albany MSA
Athens-Clarke County MSA
Atlanta MSA
Augusta-Richmond County MSA
Brunswick MSA
Columbus MSA
Civilian labor force Employed Unemployed Rate
Civilian labor force Employed Unemployed Rate
Civilian labor force Employed Unemployed Rate
Civilian labor force Employed Unemployed Rate
Civilian labor force Employed Unemployed Rate
Civilian labor force Employed Unemployed Rate
75,883 71,738
4,145 5.5
106,078 101,507
4,571 4.3
2,781,461 2,640,049
141,412 5.1
258,397 244,758
13,639 5.3
53,081 50,768
2,313 4.4
129,010 121,987
7,023 5.4
75,494 71,322
4,172 5.5
106,045 101,494
4,551 4.3
2,756,539 2,617,152
139,387 5.1
256,107 242,061
14,046 5.5
53,222 50,850
2,372 4.5
128,654 121,521
7,133 5.5
75,824 72,327
3,497 4.6
103,902 100,416
3,486 3.4
2,718,634 2,612,131
106,503 3.9
255,958 243,338
12,620 4.9
52,740 50,979
1,761 3.3
128,299 122,037
6,262 4.9
389 416 -27
33 13 20
24,922 22,897
2,025
2,290 2,697
-407
-141 -82 -59
356 466 -110
59 -589 648
2,176 1,091 1,085
62,827 27,918 34,909
2,439 1,420 1,019
341 -211 552
711 -50 761
Dalton MSA
Civilian labor force Employed Unemployed Rate
69,165 64,755
4,410 6.4
68,833 64,487
4,346 6.3
68,212 65,294
2,918 4.3
332
953
268
-539
64
1,492
Gainesville MSA
Civilian labor force Employed Unemployed Rate
91,734 87,661
4,073 4.4
91,075 87,107
3,968 4.4
89,022 86,202
2,820 3.2
659
2,712
554
1,459
105
1,253
Note: Employment includes nonagricultural wage and salary employment, self-employment, unpaid family and private household workers and agricultural
workers. Persons in labor disputes are counted as employed. The use of unrounded data does not imply that the numbers are exact. Georgia and Metropolitan Statistical Area data have not been seasonally adjusted. Seasonally adjusted data for Georgia available upon request.
Albany MSA: Baker, Dougherty, Lee, Terrell, and Worth counties. Athens - Clarke County MSA: Clarke, Madison, Oconee, and Oglethorpe counties. Atlanta MSA: Barrow, Bartow, Butts, Carroll, Cherokee, Clayton, Cobb, Coweta, Dawson, DeKalb, Douglas, Fayette, Forsyth, Fulton, Gwinnett, Haralson, Heard, Henry, Jasper, Lamar, Meriwether, Newton, Paulding, Pickens, Pike, Rockdale, Spalding, and Walton counties. Augusta - Richmond County MSA: Burke, Columbia, McDuffie, and Richmond counties in Georgia and Aiken and Edgefield counties in South Carolina. Brunswick MSA: Brantley, Glynn, and McIntosh counties. Columbus MSA: Chattahoochee, Harris, Marion, and Muscogee counties in Georgia and Russell County in Alabama. Dalton MSA: Murray and Whitfield counties. Gainesville MSA: Hall County. Hinesville - Fort Stewart MSA: Liberty and Long counties. Macon MSA: Bibb, Crawford, Jones, Monroe, and Twiggs counties. Rome MSA: Floyd County. Savannah MSA: Bryan, Chatham, and Effingham counties. Valdosta MSA: Brooks, Echols, Lanier, and Lowndes counties. Warner Robins MSA: Houston County.
Source: Georgia Department of Labor, Workforce Information & Analysis
11
Hinesville-Ft. Stewart MSA Macon MSA
Rome MSA Savannah MSA
Valdosta MSA Warner Robins MSA
Georgia Labor Force Estimates (not seasonally adjusted) Place of Residence - Persons 16 Years and Older
Employment Status
Civilian labor force Employed Unemployed Rate
Civilian labor force Employed Unemployed Rate
Preliminary MAR 2008
30,812 29,256
1,556 5.0
112,665 106,482
6,183 5.5
Revised FEB 2008
30,420 28,841
1,579 5.2
112,064 105,870
6,194 5.5
Revised MAR 2007
30,217 28,854
1,363 4.5
110,832 105,815
5,017 4.5
Change From
Revised
Revised
FEB 2008
MAR 2007
392
595
415
402
-23
193
601
1,833
612
667
-11
1,166
Civilian labor force Employed Unemployed
Rate
49,603 46,862
2,741 5.5
49,425 46,538
2,887 5.8
49,469 47,043
2,426 4.9
178 324 -146
134 -181 315
Civilian labor force Employed Unemployed Rate
181,065 173,087
7,978 4.4
179,311 171,348
7,963 4.4
177,954 172,242
5,712 3.2
1,754 1,739
15
3,111 845
2,266
Civilian labor force Employed Unemployed
Rate
68,884 65,852
3,032 4.4
68,677 65,638
3,039 4.4
67,846 65,512
2,334 3.4
207
1,038
214
340
-7
698
Civilian labor force Employed Unemployed
Rate
69,670 66,632
3,038 4.4
69,215 66,165
3,050 4.4
68,162 65,913
2,249 3.3
455
1,508
467
719
-12
789
United States Labor Force Estimates Place of Residence - Persons 16 Years and Older
Employment Status
MAR 2008
FEB 2008
MAR 2007
Change From
FEB 2008
MAR 2007
United States
(Seasonally adjusted)
Civilian labor force Employed Unemployed
Rate
153,784,000 145,969,000
7,815,000 5.1
153,374,000 145,993,000
7,381,000 4.8
152,884,000 146,145,000
6,738,000 4.4
410,000 -24,000 434,000
900,000 -176,000 1,077,000
United States
(Not Seasonally adjusted)
Civilian labor force Employed Unemployed
Rate
153,135,000 145,108,000
8,027,000 5.2
152,503,000 144,550,000
7,953,000 5.2
152,236,000 145,323,000
6,913,000 4.5
632,000 558,000
74,000
899,000 -215,000 1,114,000
Note: Employment includes nonagricultural wage and salary employment, self-employment, unpaid family and private household workers and agricultural
workers. Persons in labor disputes are counted as employed. The use of unrounded data does not imply that the numbers are exact. Georgia and Metropolitan Statistical Area data have not been seasonally adjusted. Seasonally adjusted data for Georgia available upon request.
Albany MSA: Baker, Dougherty, Lee, Terrell, and Worth counties. Athens - Clarke County MSA: Clarke, Madison, Oconee, and Oglethorpe counties. Atlanta MSA: Barrow, Bartow, Butts, Carroll, Cherokee, Clayton, Cobb, Coweta, Dawson, DeKalb, Douglas, Fayette, Forsyth, Fulton, Gwinnett, Haralson, Heard, Henry, Jasper, Lamar, Meriwether, Newton, Paulding, Pickens, Pike, Rockdale, Spalding, and Walton counties. Augusta - Richmond County MSA: Burke, Columbia, McDuffie, and Richmond counties in Georgia and Aiken and Edgefield counties in South Carolina. Brunswick MSA: Brantley, Glynn, and McIntosh counties. Columbus MSA: Chattahoochee, Harris, Marion, and Muscogee counties in Georgia and Russell County in Alabama. Dalton MSA: Murray and Whitfield counties. Gainesville MSA: Hall County. Hinesville - Fort Stewart MSA: Liberty and Long counties. Macon MSA: Bibb, Crawford, Jones, Monroe, and Twiggs counties. Rome MSA: Floyd County. Savannah MSA: Bryan, Chatham, and Effingham counties. Valdosta MSA: Brooks, Echols, Lanier, and Lowndes counties. Warner Robins MSA: Houston County.
Source: Georgia Department of Labor, Workforce Information & Analysis
12
Georgia Labor Force Estimates by County (not seasonally adjusted)
Georgia
Place of Residence - Persons 16 Years and Older
Preliminary March 2008
Revised February 2008
Labor Force
Employment
Unemployment Number Rate
4,883,895 4,627,068 256,827 5.3
Labor Force
Employment
Unemployment Number Rate
4,845,783 4,591,342 254,441 5.3
Appling Atkinson Bacon Baker Baldwin
9,117 8,640
477 5.2
3,307 3,097 210 6.4
4,794 4,556
238 5.0
1,784 1,698
86 4.8
20,667 19,431 1,236 6.0
9,073 8,583 490 5.4
3,324 3,074 250 7.5
4,791 4,549 242 5.1
1,778 1,689
89 5.0
20,641 19,237 1,404 6.8
Banks Barrow Bartow Ben Hill Berrien
11,470 11,042 428 3.7 33,898 31,997 1,901 5.6 47,502 44,568 2,934 6.2
7,856 7,107 749 9.5 8,623 8,204 419 4.9
11,437 11,002 435 3.8 33,522 31,719 1,803 5.4 47,003 44,182 2,821 6.0
7,765 7,021 744 9.6 8,575 8,163 412 4.8
Bibb Bleckley Brantley Brooks Bryan
74,319 70,116 4,203 5.7
5,407 5,073 334 6.2
7,737 7,317 420 5.4
8,783 8,368 415 4.7
17,038 16,357
681 4.0
73,885 69,713 4,172 5.6 5,344 5,054 290 5.4 7,748 7,329 419 5.4 8,783 8,341 442 5.0
16,909 16,193 716 4.2
Bulloch Burke Butts Calhoun Camden
32,664 31,148 1,516 4.6
10,343 9,493 850 8.2
10,664 9,923
741 6.9
2,069 1,917
152 7.3
21,690 20,796
894 4.1
32,783 31,221 1,562 4.8 10,243 9,390 853 8.3 10,529 9,837 692 6.6
2,078 1,922 156 7.5 21,563 20,641 922 4.3
Candler Carroll Catoosa Charlton Chatham
4,338 4,105 233 5.4 53,727 50,502 3,225 6.0 37,157 35,390 1,767 4.8
4,645 4,412 233 5.0 135,339 129,187 6,152 4.5
4,344 4,115 229 5.3 53,228 50,064 3,164 5.9 36,785 35,052 1,733 4.7
4,641 4,382 259 5.6 133,973 127,889 6,084 4.5
Chattahoochee 2,525
Chattooga
11,976
Cherokee 109,805
Clarke
64,404
Clay
1,421
2,280 10,199 105,046 61,505
1,318
245 9.7 1,777 14.8 4,759 4.3 2,899 4.5
103 7.2
2,503 11,839 108,970 64,383 1,408
2,269 10,129 104,135 61,497
1,310
234 9.3 1,710 14.4 4,835 4.4 2,886 4.5
98 7.0
Clayton Clinch Cobb Coffee Colquitt
141,727 133,014 8,713 6.1
2,756 2,607
149 5.4
390,386 372,776 17,610 4.5
16,632 15,450 1,182 7.1
20,259 19,183 1,076 5.3
140,323 131,860 8,463 6.0 2,746 2,590 156 5.7
386,947 369,543 17,404 4.5 16,503 15,332 1,171 7.1 20,207 19,110 1,097 5.4
Columbia Cook Coweta Crawford Crisp
60,117 57,640 2,477 4.1
7,046 6,578
468 6.6
60,663 57,743 2,920 4.8
6,284 6,002 282 4.5
10,618 9,940 678 6.4
59,409 57,020 2,389 4.0 6,976 6,543 433 6.2
60,041 57,242 2,799 4.7 6,269 5,968 301 4.8
10,613 9,900 713 6.7
Revised March 2007
Labor Force
Employment
Unemployment Number Rate
4,792,438 4,597,951 194,487 4.1
8,958 3,335 4,687 1,787 20,688
8,558 3,123 4,452 1,712 19,720
400 4.5 212 6.4 235 5.0
75 4.2 968 4.7
10,418 10,127
291 2.8
32,839 31,658 1,181 3.6
46,126 44,097 2,029 4.4
7,929 7,491
438 5.5
8,851 8,489
362 4.1
73,172 69,677 3,495 4.8
5,368 5,104
264 4.9
7,604 7,348
256 3.4
8,637 8,325
312 3.6
16,763 16,278
485 2.9
31,881 30,774 1,107 3.5
10,079 9,411
668 6.6
10,276 9,818
458 4.5
2,089 1,960
129 6.2
21,868 21,198
670 3.1
4,330 4,146
184 4.2
52,254 49,968 2,286 4.4
36,618 35,456 1,162 3.2
4,592 4,411
181 3.9
133,025 128,557 4,468 3.4
2,463 2,280
183 7.4
10,906 10,356
550 5.0
107,392 103,935 3,457 3.2
63,096 60,844 2,252 3.6
1,481 1,413
68 4.6
138,635 131,607 7,028 5.1
2,720 2,607
113 4.2
382,342 368,834 13,508 3.5
16,487 15,577
910 5.5
20,199 19,351
848 4.2
59,166 57,143 2,023 3.4
7,075 6,686
389 5.5
59,181 57,132 2,049 3.5
6,227 5,964
263 4.2
10,721 10,099 622 5.8
13
Georgia Labor Force Estimates by County (not seasonally adjusted)
Dade Dawson Decatur DeKalb Dodge
Place of Residence - Persons 16 Years and Older
Preliminary March 2008
Revised February 2008
Labor Force
Employment
Unemployment Number Rate
Labor Force
Employment
Unemployment Number Rate
8,915 8,468 447 5.0 11,229 10,679 550 4.9 11,332 10,595 737 6.5 403,780 382,540 21,240 5.3 9,505 9,004 501 5.3
8,839 8,387
452 5.1
11,109 10,586 523 4.7
11,366 10,604 762 6.7
400,262 379,222 21,040 5.3
9,479 8,952 527 5.6
Dooly Dougherty Douglas Early Echols
4,773 4,477 296 6.2
41,638 39,135 2,503 6.0
65,203 61,697 3,506 5.4
5,111 4,806 305 6.0
2,430 2,351
79 3.3
4,763 4,462 301 6.3
41,428 38,908 2,520 6.1
64,595 61,162 3,433 5.3
5,090 4,783
307 6.0
2,431 2,343
88 3.6
Effingham Elbert Emanuel Evans Fannin
28,687 27,542 1,145 4.0
9,810 9,105
705 7.2
11,006 10,204 802 7.3
5,009 4,736 273 5.5
11,219 10,601 618 5.5
28,429 27,266 1,163 4.1
9,705 9,003
702 7.2
10,794 10,168 626 5.8
5,012 4,736 276 5.5
11,122 10,499 623 5.6
Fayette Floyd Forsyth Franklin Fulton
56,044 53,796 2,248 4.0
49,603 46,862 2,741 5.5
83,827 80,488 3,339 4.0
10,433 9,777
656 6.3
493,739 468,040 25,699 5.2
55,616 53,329 2,287 4.1
49,425 46,538 2,887 5.8
83,137 79,790 3,347 4.0
10,365 9,706
659 6.4
489,615 463,981 25,634 5.2
Gilmer Glascock Glynn Gordon Grady
14,588 13,834 754 5.2
1,106 1,039
67 6.1
40,025 38,379 1,646 4.1
27,130 25,381 1,749 6.4
12,219 11,672 547 4.5
14,436 13,684
752 5.2
1,091 1,028
63 5.8
40,138 38,441 1,697 4.2
27,076 25,074 2,002 7.4
12,129 11,540
589 4.9
Greene Gwinnett Habersham Hall Hancock
7,452 7,026 426 5.7
429,882 409,967 19,915 4.6
20,196 19,292 904 4.5
91,734 87,661 4,073 4.4
3,442 3,090
352 10.2
7,409 6,969
440 5.9
426,157 406,411 19,746 4.6
20,190 19,208
982 4.9
91,075 87,107 3,968 4.4
3,402 3,059 343 10.1
Haralson Harris Hart Heard Henry
13,395 12,706 689 5.1 15,858 15,223 635 4.0 10,804 9,927 877 8.1
5,212 4,876 336 6.4 97,283 92,205 5,078 5.2
13,306 12,596
710 5.3
15,810 15,146 664 4.2
10,667 9,839
828 7.8
5,163 4,834
329 6.4
96,363 91,405 4,958 5.1
Houston Irwin Jackson Jasper Jeff Davis
69,670 66,632 3,038 4.4
4,486 4,104
382 8.5
26,969 25,654 1,315 4.9
6,890 6,352 538 7.8
5,020 4,657
363 7.2
69,215 66,165 3,050 4.4
4,472 4,054
418 9.3
26,763 25,431 1,332 5.0
6,836 6,297 539 7.9
5,047 4,671
376 7.4
Revised March 2007
Labor Force
Employment
Unemployment Number Rate
8,821 8,483
338 3.8
10,916 10,566
350 3.2
11,446 10,753
693 6.1
395,138 378,495 16,643 4.2
9,264 8,870
394 4.3
4,856 41,591 63,716
5,240 2,393
4,594 39,456 61,045
4,953 2,339
262 5.4 2,135 5.1 2,671 4.2
287 5.5 54 2.3
28,167 9,870
10,620 4,895
10,962
27,408 9,379
10,207 4,721
10,587
759 2.7 491 5.0 413 3.9 174 3.6 375 3.4
54,975 53,227 1,748 3.2
49,469 47,043 2,426 4.9
81,854 79,637 2,217 2.7
10,437 9,969
468 4.5
483,305 463,090 20,215 4.2
14,270 1,111
39,851 27,208 12,150
13,837 1,066
38,538 25,991 11,770
433 3.0 45 4.1
1,313 3.3 1,217 4.5
380 3.1
7,283 6,917
366 5.0
420,285 405,632 14,653 3.5
19,895 19,161 734 3.7
89,022 86,202 2,820 3.2
3,354 3,136
218 6.5
13,140 15,740 10,913
5,078 94,911
12,572 15,223 10,198
4,824 91,230
568 4.3 517 3.3 715 6.6 254 5.0 3,681 3.9
68,162 4,537
26,466 6,537 5,217
65,913 4,325
25,532 6,285 4,868
2,249 3.3 212 4.7 934 3.5 252 3.9 349 6.7
14
Georgia Labor Force Estimates by County (not seasonally adjusted)
Jefferson Jenkins Johnson Jones Lamar
Place of Residence - Persons 16 Years and Older
Preliminary March 2008
Revised February 2008
Labor Force
Employment
Unemployment Number Rate
7,185 3,410 3,834 14,068 8,180
6,595 2,904 3,564 13,348 7,693
590 8.2 506 14.8 270 7.0 720 5.1 487 6.0
Labor Force
7,094 3,382 3,799 14,010 8,132
Employment
Unemployment Number Rate
6,541 2,894 3,544 13,271 7,626
553 7.8 488 14.4 255 6.7 739 5.3 506 6.2
Lanier Laurens Lee Liberty Lincoln
4,095 3,912 183 4.5 22,674 21,321 1,353 6.0 17,359 16,694 665 3.8 24,840 23,534 1,306 5.3
3,821 3,580 241 6.3
4,074 3,900
174 4.3
22,506 21,202 1,304 5.8
17,259 16,597 662 3.8
24,532 23,200 1,332 5.4
3,797 3,549
248 6.5
Long Lowndes Lumpkin McDuffie McIntosh
5,972 5,722 250 4.2 53,576 51,221 2,355 4.4 13,268 12,638 630 4.7 11,035 10,303 732 6.6
5,318 5,072 246 4.6
5,888 5,641 247 4.2
53,389 51,054 2,335 4.4
13,144 12,504
640 4.9
10,932 10,192
740 6.8
5,335 5,080 255 4.8
Macon Madison Marion Meriwether Miller
4,829 15,920
3,433 10,131
3,410
4,475 15,222
3,255 9,421 3,263
354 7.3 698 4.4 178 5.2 710 7.0 147 4.3
4,815 15,949
3,410 10,020
3,366
4,476 15,220
3,239 9,340 3,225
339 7.0 729 4.6 171 5.0 680 6.8 141 4.2
Mitchell
10,308 9,696 612 5.9
Monroe
13,339 12,645 694 5.2
Montgomery 4,684 4,363
321 6.9
Morgan
9,521 9,037 484 5.1
Murray
21,555 20,340 1,215 5.6
10,292 9,647
645 6.3
13,258 12,573 685 5.2
4,588 4,340
248 5.4
9,415 8,947
468 5.0
21,635 20,256 1,379 6.4
Muscogee Newton Oconee Oglethorpe Paulding
86,020 81,243 4,777 5.6
46,457 43,545 2,912 6.3
17,939 17,293 646 3.6
7,815 7,487
328 4.2
65,766 62,525 3,241 4.9
85,665 80,835 4,830 5.6
45,959 43,167 2,792 6.1
17,914 17,291 623 3.5
7,799 7,486
313 4.0
65,183 61,983 3,200 4.9
Peach Pickens Pierce Pike Polk
11,586 10,879 707 6.1
15,526 14,734
792 5.1
8,465 8,092
373 4.4
8,344 7,851 493 5.9
21,686 20,457 1,229 5.7
11,428 10,745 683 6.0
15,374 14,606
768 5.0
8,469 8,096
373 4.4
8,223 7,783
440 5.4
21,484 20,330 1,154 5.4
Pulaski Putnam Quitman Rabun Randolph
4,631 10,801
1,017 7,058 2,703
4,430 10,176
920 6,664 2,508
201 4.3 625 5.8
97 9.5 394 5.6 195 7.2
4,664 10,682
995 7,009 2,674
4,447 10,029
910 6,590 2,486
217 4.7 653 6.1
85 8.5 419 6.0 188 7.0
Revised March 2007
Labor Force
Employment
Unemployment Number Rate
7,105 3,326 3,757 13,764 7,963
6,689 2,961 3,569 13,264 7,611
416 5.9 365 11.0 188 5.0 500 3.6 352 4.4
4,022 22,336 17,380 24,363
3,825
3,892 21,354 16,831 23,210
3,613
130 3.2 982 4.4 549 3.2 1,153 4.7 212 5.5
5,854 52,794 13,288 10,880
5,285
5,644 50,956 12,830 10,214
5,093
210 3.6 1,838 3.5
458 3.4 666 6.1 192 3.6
5,027 15,584
3,406 9,773 3,591
4,662 15,059
3,256 9,322 3,430
365 7.3 525 3.4 150 4.4 451 4.6 161 4.5
10,250 13,058
4,575 9,527 21,418
9,778 12,566
4,404 9,161 20,509
472 4.6 492 3.8 171 3.7 366 3.8 909 4.2
85,723 45,282 17,542
7,680 64,215
81,247 43,084 17,107
7,406 61,864
4,476 5.2 2,198 4.9
435 2.5 274 3.6 2,351 3.7
11,437 15,081
8,420 8,043 20,264
10,876 14,578
8,130 7,768 19,352
561 4.9 503 3.3 290 3.4 275 3.4 912 4.5
4,549 10,243
1,000 7,199 2,719
4,396 9,873
936 6,689 2,545
153 3.4 370 3.6
64 6.4 510 7.1 174 6.4
15
Georgia Labor Force Estimates by County (not seasonally adjusted)
Richmond Rockdale Schley Screven Seminole
Place of Residence - Persons 16 Years and Older
Preliminary March 2008
Revised February 2008
Labor Force
Employment
Unemployment Number Rate
Labor Force
Employment
Unemployment Number Rate
91,605 85,798 5,807 6.3
41,359 39,022 2,337 5.7
1,827 1,721
106 5.8
7,288 6,846 442 6.1
3,923 3,676
247 6.3
90,507 84,875 5,632 6.2 40,909 38,683 2,226 5.4
1,826 1,718 108 5.9 7,229 6,801 428 5.9 3,962 3,681 281 7.1
Spalding Stephens Stewart Sumter Talbot
29,622 27,438 2,184 7.4
13,673 12,929
744 5.4
2,392 2,222 170 7.1
14,481 13,540 941 6.5
3,166 2,979 187 5.9
29,187 27,200 1,987 6.8 13,571 12,810 761 5.6
2,389 2,212 177 7.4 14,437 13,518 919 6.4
3,160 2,957 203 6.4
Taliaferro Tattnall Taylor Telfair Terrell
829 9,069 3,320 4,852 4,571
781 8,486 3,122 4,518 4,311
48 5.8 583 6.4 198 6.0 334 6.9 260 5.7
833 9,057 3,304 4,851 4,548
774 8,477 3,101 4,486 4,286
59 7.1 580 6.4 203 6.1 365 7.5 262 5.8
Thomas Tift Toombs Towns Treutlen
23,320 22,250 1,070 4.6
18,590 17,410 1,180 6.3
13,935 13,036
899 6.5
6,124 5,796
328 5.4
2,766 2,562 204 7.4
23,141 22,049 1,092 4.7 18,468 17,281 1,187 6.4 13,750 12,966 784 5.7
6,072 5,763 309 5.1 2,719 2,538 181 6.7
Troup Turner Twiggs Union Upson
30,919 28,661 2,258 7.3
4,857 4,435 422 8.7
4,654 4,370 284 6.1
11,568 10,984
584 5.0
12,207 11,276
931 7.6
30,540 28,508 2,032 6.7 4,792 4,350 442 9.2 4,641 4,345 296 6.4 11,519 10,942 577 5.0
12,158 11,222 936 7.7
Walker
35,964 32,885 3,079 8.6
Walton
41,225 38,907 2,318 5.6
Ware
15,300 14,474
826 5.4
Warren
2,463 2,261
202 8.2
Washington
8,348 7,807
541 6.5
35,438 32,571 2,867 8.1
40,831 38,570 2,261 5.5
15,330 14,482 848 5.5
2,436 2,260 176 7.2
8,263 7,750
513 6.2
Wayne Webster Wheeler White Whitfield
12,239 11,451
788 6.4
1,267 1,201
66 5.2
2,874 2,701
173 6.0
13,008 12,433
575 4.4
47,610 44,415 3,195 6.7
12,073 11,328 745 6.2
1,248 1,188
60 4.8
2,875 2,705
170 5.9
12,974 12,390 584 4.5
47,198 44,231 2,967 6.3
Wilcox Wilkes Wilkinson Worth
3,252 4,494 4,616 10,530
3,031 4,154 4,354 9,899
221 6.8 340 7.6 262 5.7 631 6.0
3,246 4,440 4,622 10,480
3,020 4,103 4,320 9,842
226 7.0 337 7.6 302 6.5 638 6.1
Revised March 2007
Labor Force
Employment
Unemployment Number Rate
90,071 85,058 5,013 5.6
40,412 38,609 1,803 4.5
1,835 1,743
92 5.0
7,133 6,822
311 4.4
4,018 3,792
226 5.6
28,554 27,148 1,406 4.9
13,560 12,896
664 4.9
2,210 2,077
133 6.0
14,958 13,716 1,242 8.3
3,145 2,932
213 6.8
819 9,011 3,358 4,798 4,568
769 8,577 3,188 4,511 4,347
50 6.1 434 4.8 170 5.1 287 6.0 221 4.8
23,038 19,270 13,755
6,025 2,695
22,232 18,326 13,156
5,816 2,571
806 3.5 944 4.9 599 4.4 209 3.5 124 4.6
30,434 28,854 1,580 5.2
4,908 4,546
362 7.4
4,611 4,343
268 5.8
11,294 10,929
365 3.2
12,046 11,334
712 5.9
34,252 32,946 1,306 3.8
40,411 38,496 1,915 4.7
15,251 14,544
707 4.6
2,391 2,226
165 6.9
8,348 7,958 390 4.7
11,995 11,447
548 4.6
1,234 1,168
66 5.3
2,987 2,854 133 4.5
12,449 12,035
414 3.3
46,794 44,785 2,009 4.3
3,294 4,535 4,598 10,496
3,134 4,237 4,397 9,980
160 4.9 298 6.6 201 4.4 516 4.9
16
Georgia Unemployment Rates by County
March 2008
Dade
Catoosa
Murray
Fannin
Towns
Union
Rabun
Whitfield Walker
Gilmer
White Habersham
Chattooga
Gordon
Pickens
Lumpkin
Stephens
Floyd
Dawson
Banks Franklin Hart
Bartow Cherokee Forsyth Hall
Jackson Madison Elbert
Polk Haralson
Paulding Cobb
Gwinnett Barrow Clarke Oglethorpe
Oconee
DeKalb
Walton
Wilkes
Douglas Fulton
Rockdale
Lincoln
Carroll
Clayton
Newton Morgan Greene Taliaferro
Columbia
Fayette Henry
McDuffie
Coweta Heard
Spalding Butts Jasper Putnam
Warren Hancock Glascock
Richmond
10.0% or greater 7.0% to 9.9% 5.3% to 6.9% Less than 5.3%
Troup
Meriwether
Pike Lamar Monroe
Upson
Jones Baldwin
Jefferson Washington
Burke
Harris
Talbot
Bibb Crawford
Muscogee
Taylor
Peach
Wilkinson Twiggs
Johnson
Emanuel
Jenkins
Screven
Marion Chattahoochee
Macon
Houston Bleckley
Laurens Treutlen
Candler Bulloch
Effingham
Stewart
Schley Webster Sumter
Dooly Crisp
Pulaski Wilcox
Dodge
Montgomery
Wheeler
Toombs
Telfair
Evans Tattnall
Bryan
Chatham
Quitman Terrell Lee
Randolph
Turner
Ben Hill
Jeff Davis Appling
Liberty Long
Clay Calhoun Dougherty
Early
Baker
Miller
Mitchell
Worth
Irwin Tift
Coffee
Colquitt
Berrien Atkinson Cook
Seminole Decatur
Grady
Thomas
Brooks
Lanier
Clinch
Lowndes Echols
Bacon
Wayne
Pierce
Ware
Brantley
McIntosh Glynn
Charlton
Camden
Georgia's Unemployment Rate: 5.3%
17
New Developments
It isn't cast in stone, but all the papers are signed and that means that Meriwether County has its newest employer. East Coast Precast of Georgia will be locating their new facility in Greenville. Eighteen acres of land has been purchased in Greenville North Industrial Park for the company's newest venture. Within the first 3 years of commencing operations the firm expects to employ around 100 people. The company constructs precast foundations and walls from concrete for commercial as well as residential structures.
Most folks in Liberty County will like their new Boss. Their newly expanded Hugo Boss distribution center, that is. The manufacturer of upscale men's and women's clothing is spending $6.8 million on their facility in Midway that will increase their square footage from 165,000 square feet to 330,000 square feet. The project is expected to be completed in May and will result in an increase of 75 positions that the company expects they will have no trouble filling. This project is the first step in a five-year plan to increase the company's operations.
You will be able to choose from an expanded list of accommodations in Tift County when the "Tifton Corners" project is completed. This multiphase development will enhance the hospitality industry in Tifton. The first phase of the project which is already underway is the construction of a new Hilton Garden Inn that will be located near the Holiday Inn at the corner of I-75 and U. S. Highway 319. The Hilton Garden Inn complex will also provide space for four restaurants along with enough additional space for a dozen or more other businesses. The inn itself will offer 100 rooms and 3,000 square feet of meeting space and will have all the amenities of a standard Hilton Hotel. The Stafford Hospitality Company already owns most of the property involved and will also rebuild the Holiday Inn after the first phase nears completion in the summer of 2009. The new Holiday Inn will be built behind the old one which will not be torn down until the new Holiday Inn is in operation. The completed project is expected to create
some 210 new jobs for the area with a $4.3 million annual payroll.
Harris County has become a recent recipient of the positive economic effect in Georgia that is Kia. Inchon, Korea based Daehan Solutions will construct a 160,000 square foot facility in the Northwest Harris Business Park to supply the main Kia auto assembly plant with "noise, vibration, and harshness system" components. These products are for sound insulation in automobiles which include carpet, insulation and interior foam. Daehan Solutions has been doing business with Hyundai-Kia Automotive Group for over two decades and their new plant will be conveniently located only 6 miles from their customer's new facility in neighboring Troup County. The company is investing $35 million in their new factory and will employ around 300 people when fully operational.
There is a new pet project in Barrow County. San Diego based pet products retailer, PETCO, is building a distribution center in Braselton. The company plans to invest $33 million and the facility will be located in Braselton Business Park. It will measure 506,240 square feet and will serve more than 200 of the company's retail stores in the southern United States which includes the 15 existing stores throughout Georgia. When fully operational the new facility is expected to employ 277 workers.
A Muscogee County company is expanding which will increase the number of manufacturing jobs in the area. Kodak is building a 16,000 square foot addition to their existing facility in Columbus. A company spokesperson said the construction at their Corporate Ridge Business Park location would be completed in 2009 and that would add 50 more to their total of very talented employees. The rising demand for digital plates is the reason that the company decided to add a third production line for their products. These high technology, digital printing plates are used throughout North and South America to print a myriad of products such as books, magazines, boxes and bumper stickers. The company also produces conventional plates for printing as well.
18
Georgia Unemployment Insurance Claims by County
County
March Average Average Initial Weekly Duration Claims Benefit Weeks
County
March Average Average Initial Weekly Duration Claims Benefit Weeks
Georgia
42,550 ....... $265 ...... 11.3
Appling
199 ....... $206 ...... 10.4
Atkinson
125 ....... $204 ........ 7.6
Bacon
130 ....... $201 ........ 8.5
Baker
9 ....... $155 ...... 12.1
Baldwin
397 ....... $199 ........ 9.7
Banks
87 ....... $234 ........ 9.0
Barrow
321 ....... $249 ...... 11.6
Bartow
496 ....... $244 ...... 11.6
Ben Hill
178 ....... $236 ...... 11.2
Berrien
226 ....... $201 ........ 9.0
Bibb
536 ....... $188 ...... 13.8
Bleckley
66 ....... $203 ...... 10.5
Brantley
55 ....... $243 ...... 12.4
Brooks
68 ....... $206 ...... 13.2
Bryan
67 ....... $245 ...... 12.1
Bulloch
188 ....... $219 ...... 10.7
Burke
149 ....... $203 ...... 13.6
Butts
98 ....... $227 ...... 10.9
Calhoun
67 ....... $191 ...... 11.4
Camden
78 ....... $218 ...... 12.7
Candler
38 ....... $215 ........ 9.5
Carroll
470 ....... $226 ...... 10.1
Catoosa
368 ....... $237 ........ 8.0
Charlton
29 ....... $225 ...... 13.2
Chatham
684 ....... $218 ...... 13.0
Chattahoochee 7 ....... $192 ...... 12.1
Chattooga
64 ....... $233 ...... 13.7
Cherokee
532 ....... $263 ...... 12.7
Clarke
375 ....... $205 ...... 12.4
Clay
30 ....... $230 ...... 12.3
Clayton
1,175 ....... $232 ...... 14.3
Clinch
28 ....... $197 ...... 11.5
Cobb
1,763 ....... $254 ...... 14.3
Coffee
295 ....... $206 ........ 9.2
Colquitt
214 ....... $190 ...... 11.5
Columbia
177 ....... $246 ...... 11.9
Cook
165 ....... $202 ........ 9.7
Coweta
538 ....... $244 ........ 9.8
Crawford
35 ....... $221 ...... 10.4
Crisp
108 ....... $198 ...... 13.6
Dade
167 ....... $205 ........ 6.6
Dawson
59 ....... $263 ...... 11.8
Decatur
198 ....... $214 ...... 10.7
DeKalb
2,477 ....... $238 ...... 14.4
Dodge
112 ....... $180 ...... 10.8
Dooly
78 ....... $193 ...... 13.1
Dougherty
339 ....... $189 ...... 12.8
Douglas
388 ....... $248 ...... 13.9
Early
49 ....... $181 ...... 13.4
Echols
19 ....... $191 ...... 10.6
Effingham
107 ....... $246 ...... 12.4
Elbert Emanuel Evans Fannin Fayette Floyd Forsyth Franklin Fulton Gilmer Glascock Glynn Gordon Grady Greene Gwinnett Habersham Hall Hancock Haralson Harris Hart Heard Henry Houston Irwin Jackson Jasper Jeff Davis Jefferson Jenkins Johnson Jones Lamar Lanier Laurens Lee Liberty Lincoln Long Lowndes Lumpkin Macon Madison Marion McDuffie McIntosh Meriwether Miller Mitchell Monroe Montgomery Morgan Murray
184 ....... $216 ........ 9.1 310 ....... $170 ........ 9.2
24 ....... $216 ...... 12.2 180 ....... $216 ........ 9.3 144 ....... $256 ...... 13.7 835 ....... $229 ........ 9.9 210 ....... $276 ...... 13.4 202 ....... $232 ........ 9.5 2,885 ....... $234 ...... 14.6 275 ....... $231 ........ 8.6
13 ....... $164 ........ 9.3 226 ....... $213 ...... 12.1 644 ....... $244 ........ 8.3
97 ....... $205 ........ 8.5 49 ....... $201 ...... 10.8 1,966 ....... $259 ...... 13.8 227 ....... $235 ........ 6.8 571 ....... $244 ........ 8.5 110 ....... $194 ........ 8.5 77 ....... $232 ...... 10.3 44 ....... $233 ...... 11.6 236 ....... $220 ...... 10.9 81 ....... $235 ........ 8.4 575 ....... $247 ...... 13.5 313 ....... $221 ...... 11.9 75 ....... $222 ...... 11.1 255 ....... $248 ...... 10.7 50 ....... $246 ........ 9.8 271 ....... $217 ........ 7.5 159 ....... $173 ...... 11.9 149 ....... $214 ...... 13.1 53 ....... $203 ...... 12.2 75 ....... $223 ...... 12.0 149 ....... $198 ........ 9.3 76 ....... $205 ........ 8.1 320 ....... $197 ...... 10.8 58 ....... $234 ...... 11.1 106 ....... $207 ...... 13.7 54 ....... $196 ........ 9.5 30 ....... $226 ...... 13.6 582 ....... $183 ...... 10.9 113 ....... $235 ........ 7.9 63 ....... $187 ...... 10.0 128 ....... $228 ........ 9.8 40 ....... $233 ...... 10.3 87 ....... $206 ........ 9.6 29 ....... $217 ...... 10.5 153 ....... $213 ........ 9.4 51 ....... $184 ...... 10.2 77 ....... $185 ...... 13.3 50 ....... $218 ...... 10.5 98 ....... $210 ........ 9.1 64 ....... $239 ...... 10.7 643 ....... $237 ........ 6.5
Initial claims include intrastate initial and additional claims, as well as agent state initial and additional claims for regular UI only. Average duration of benefits is represented in weeks.
County
March Average Average Initial Weekly Duration Claims Benefit Weeks
Muscogee Newton Oconee Oglethorpe Paulding Peach Pickens Pierce Pike Polk Pulaski Putnam Quitman Rabun Randolph Richmond Rockdale Schley Screven Seminole Spalding Stephens Stewart Sumter Talbot Taliaferro Tattnall Taylor Telfair Terrell Thomas Tift Toombs Towns Treutlen Troup Turner Twiggs Union Upson Walker Walton Ware Warren Washington Wayne Webster Wheeler White Whitfield Wilcox Wilkes Wilkinson Worth
498 ....... $201 ...... 11.7 453 ....... $236 ...... 12.5
67 ....... $241 ...... 10.9 55 ....... $230 ...... 12.0 302 ....... $258 ...... 13.6 115 ....... $205 ........ 9.5 117 ....... $242 ...... 10.0 45 ....... $188 ...... 11.3 137 ....... $238 ........ 9.6 584 ....... $218 ........ 8.6 21 ....... $228 ...... 10.0 105 ....... $208 ........ 7.4
3 ....... $293 ........ 7.5 29 ....... $222 ...... 13.1 37 ....... $201 ........ 8.0 716 ....... $207 ...... 13.3 336 ....... $239 ...... 13.5 11 ....... $168 ...... 11.9 112 ....... $214 ........ 9.6 68 ....... $202 ...... 11.0 994 ....... $210 ...... 10.4 169 ....... $229 ...... 10.2 22 ....... $206 ...... 10.9 163 ....... $184 ...... 19.6 22 ....... $204 ...... 11.8
9 ....... $217 ...... 11.2 61 ....... $227 ...... 10.6 19 ....... $213 ........ 9.6 94 ....... $208 ...... 10.8 38 ....... $205 ...... 13.7 111 ....... $204 ...... 12.5 435 ....... $217 ...... 11.5 274 ....... $207 ........ 9.7 75 ....... $222 ...... 13.3 36 ....... $200 ........ 7.9 463 ....... $219 ........ 9.6 127 ....... $171 ...... 12.0 39 ....... $198 ...... 12.6 114 ....... $208 ...... 11.8 95 ....... $193 ...... 13.7 942 ....... $242 ........ 7.3 266 ....... $244 ...... 13.4 127 ....... $193 ...... 11.4 31 ....... $182 ........ 8.1 135 ....... $196 ...... 10.9 165 ....... $197 ...... 11.1
9 ....... $174 ...... 11.6 45 ....... $208 ...... 10.6 104 ....... $223 ........ 9.1 1,654 ....... $248 ........ 6.3 35 ....... $227 ...... 11.5 73 ....... $210 ...... 10.6 68 ....... $178 ...... 11.4 164 ....... $214 ...... 11.3
19
Georgia Department of Labor Workforce Information & Analysis 148 Andrew Young International Boulevard, N.E. Atlanta, Georgia 30303-1751
Return Service Requested