- Collection:
- Georgia Government Publications
- Title:
- Dimensions: measuring Georgia's workforce, Vol. 34, no. 12 (Annual issue)
- Creator:
- Georgia. Department of Labor
- Contributor to Resource:
- Georgia. Workforce Information and Analysis
- Publisher:
- Atlanta, Ga. : Georgia Dept. of Labor, 2008
- Date of Original:
- 2008
- Subject:
- Labor market--Georgia--Statistics
Wages--Georgia--Statistics
Hours of labor--Georgia--Statistics - Location:
- United States, Georgia, 32.75042, -83.50018
- Medium:
- state government records
- Type:
- Text
- Format:
- application/pdf
- External Identifiers:
- Call Number GA L200.E46 P1 T7 34/12
- Metadata URL:
- https://dlg.galileo.usg.edu/id:dlg_ggpd_i-ga-bl200-pe46-bp1-bt7-b34-s12-belec-p-btext
- Digital Object URL:
- https://dlg.galileo.usg.edu/do:dlg_ggpd_i-ga-bl200-pe46-bp1-bt7-b34-s12-belec-p-btext
- Language:
- eng
- Holding Institution:
- University of Georgia. Map and Government Information Library
- Rights:
-

Revised estimates for 2007 -- 2008 in this issue
Annual 2008 Employment Situation
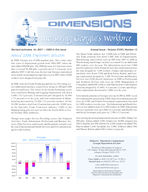
In 2008, Georgia lost 43,000 nonfarm jobs. This comes after four years of employment growth from 2004-2007 where the state added 300,600 jobs. The 2008 decrease of 1.0 percent comes after a revised 56,400 jobs, a growth rate of 1.4 percent, were added in 2007. Until this year, the last time Georgia experienced a loss in jobs on an annual average basis was in 2003 when 24,600 workers were dropped from payrolls.
In 2008, both the Goods Producing and Service-Providing sectors endured job declines, respectively, losing 41,200 and 1,800 payroll employees. The losses in the Goods Producing sector were realized as Mining and Logging employment was down 1,600 (-13.4 percent), Construction jobs dropped by 16,500 (-7.5 percent) over the year, and total employment in Manufacturing decreased by 23,100 (-5.4 percent) workers. Of the 16,500 workers shed from Construction payrolls, 8,000 were in the Specialty Trade Contractor industry. 5,000 of the Manufacturing jobs lost were in either the Textile Mills or Textile Product Mills industries.
Though most major Service-Providing sectors like Financial Activities, Trade, Information, Professional and Business Services, Other Services, and Leisure and Hospitality lost jobs over the year, Educational and Health Services and Government managed to add workers.
Annual Issue - Volume XXXIV, Number 12
The Retail Trade industry lost 12,000 jobs in 2008 and Wholesale Trade positions were down 1,000. Jobs in Transportation, Warehousing, and Utilities were up 900 from 2007 to 2008 as Warehousing and Storage facilities accounted for an additional 600 workers over the year. The Information sector lost 2,800 payroll employees while Financial Activities employment across the state dropped by 7,100 workers. Finance and Insurance related jobs were down 4,700 and Real Estate, Rental, and Leasing employment dropped by 2,400. Professional and Business Services lost 6,200 payroll employees in 2008 as Professional and Technical Services jobs were up 5,800, Management of Companies added 600 workers, and Administrative and Support positions dropped by 12,600 (-4.4 percent). Leisure and Hospitality employment decreased by 1,600 over the year.
Government positions in Georgia were up 16,900 in 2008. Local Government jobs increased by 9,900, State Government positions were up 4,100, and Federal Government employment increased by 2,800 workers over the year. The Educational and Health Services sector added a total of 11,100 workers in 2008. Educational Services positions were up 3,400 (+4.2 percent) and Health Care and Social Assistance jobs grew by 7,700 (+2.1 percent).
In reviewing the metropolitan statistical areas in 2008: Albany lost 500 jobs, Athens added 2,100, Atlanta lost 26,900, Augusta lost 200, Columbus lost 400, Dalton lost 4,100, Gainesville added 700, Macon added 1,100, Savannah lost 1,900, Valdosta added 200, and Warner Robins added 100 workers to payrolls.
120,000 100,000 80,000 60,000 40,000 20,000
0 -20,000 -40,000 -60,000 -80,000
Georgia
2001 - 2008 Annual Employment Change
102,700
87,900
53,600
56,400
-6,100 -73,700 -24,600
2001
2002
2003
2004
2005
2006
2007
-43,000 2008
Michael L. Thurmond, Commissioner Georgia Department of Labor
Workforce Information & Analysis 148 Andrew Young International Blvd., N.E.
Atlanta, Georgia 30303-1751
For more information, contact
Corey Smith at (404) 232-3875 ext. 21299 or David Echols at (404)232-3875 ext. 21272
corey.smith@dol.state.ga.us david.echols@dol.state.ga.us
Equal Opportunity Employer/Program Auxiliary Aids and Services Available upon
Request to Individuals with Disabilities
MSA Nonagricultural Employment
2001 2008 Annual Employment Change
120,000 80,000 40,000
Georgia
102,700
87,900
53,600
56,400
-6,100 0
-73,700
-24,600
-43,000
-40,000
-80,000
2001
2002
2003
2004
2005
2006
2007
2008
1,500
1,000
500
-1,300 0
-500
-1,000
-1,500
2001
-600 2002
Albany MSA
1,300
600 300
-100
2003
2004
2005
2006
100 2007
-500 2008
2,700
2,200
1,700
1,200
700
200
-100
-300
-800 2001
800 2002
Athens MSA
2,200
2,300
2,000
2,100
1,200
300
2003
2004
2005
2006
2007
2008
80,000
60,000
40,000
20,000 11,700 0
-20,000
-40,000
-60,000
2001
Atlanta MSA
69,700
67,000
30,300 -42,700 -22,500
2002
2003
2004
2005
2006
49,700 -26,900
2007
2008
Augusta MSA
5,200
4,800
3,200
1,200
-2,100
-800
1,100
1,800
2,200
1,100
-500
-200
-2,800
2001
2002
2003
2004
2005
2006
2007
2008
2,000
1,000 0
-1,600
-1,000
-2,000
-3,000
-4,000
-5,000
2001
600 2002
Dalton MSA
700 -1,200
1,100
1,500
2003
2004
2005
2006
-1,200
-4,100
2007
2008
2
1,500 500 -3,100 -500
-1,700
Columbus MSA
1,700
500 300
-100
-800
-400
-1,500
-2,500
-3,500
2001
2002
2003
2004
2005
2006
2007
2008
4,200 3,700 3,200 2,700 2,200 1,700 1,200
700 200 -300 -800
-100 2001
Gainesville MSA
2,800
3,000 2,100
500 -400
2002
2003
2004
2005
2006
3,700
700
2007
2008
MSA Nonagricultural Employment
2001 2008 Annual Employment Change
1,700 1,200
700 200 -300 -800 -1,300 -1,800 -2,300 -2,800
-2,300 2001
-200 2002
Macon MSA
1,200
1,000
0
-500
2003
2004
2005
2006
1,100 100
2007
2008
8,500
6,500
4,500
2,500
500
-100
-1,500
-3,500
2001
Savannah MSA
7,400
5,500
6,100
1,700 0
2002
2003
2004
2005
2006
5,500
-1,900
2007
2008
Valdosta MSA
2,500
2,000 1,500 1,000
2,000
1,700
1,300
1,100
1,100 800
500
0 0
2001
2002
2003
2004
2005
2006
2007
200 2008
Warner Robins MSA
4,000
3,500
3,400
3,000
2,500 2,000
1,900
1,900
1,500 1,000
1,000
1,000
1,100
1,200
500
0 2001
2002
2003
2004
2005
2006
2007
100 2008
3
GEORGIA Nonagricultural Employment (000s)
2008 Preliminary Series
Industry
Annual Jan Feb Mar Apr M ay Jun Jul Aug Sep Oct Nov Dec Average
Total Nonfarm Total Private Goods Producing Service-Providing Private Service-Providing Mining and Logging Construction Construction of Buildings Heavy and Civil Engineering Construction Specialty Trade Contractors Manufacturing Durable Goods Computer, Electrical Equip and Appliance Mfg
Transportation Equipment Manufacturing Non-Durable Goods Food Manufacturing Textile Mills Textile Product Mills Trade, Transportation and Utilities Wholesale Trade Merchant Wholesalers, Durable Goods Merchant Wholesalers, Non-durable Goods Wholesale Electronic Markets and Agents and Brokers Retail Trade Food and Beverage Stores General Merchandise Stores Miscellaneous Store Retailers Transportation, Warehousing, and Utilities Utilities Transportation and Warehousing Air Transportation Truck Transportation Couriers and Messengers Warehousing and Storage Information Telecommunications Wired Telecommunications Carriers Wireless Telecommunications Carriers Internet Service Providers, Search Portals, and DP Financial Activities Finance and Insurance Insurance Carriers and Related Activities Real Estate, Rental and Leasing Professional and Business Services Professional, Scientific, and Technical Services Accounting, Tax Preparation and Bookkeeping Architectural, Engineering and Related Services Computer Systems Design and Related Services Management and Technical Consulting Services Management of Companies and Enterprises Admin and Support, Waste Mngmnt and Remediation Employment Services Educational and Health Services Educational Services Colleges, Universities, and Professional Schools Health Care and Social Assistance Ambulatory Health Care Services Hospitals Nursing and Residential Care Facilities Social Assistance Leisure and Hospitality Arts, Entertainment, and Recreation Amusement, Gambling, and Recreation Accommodation and Food Services Accommodation Food Services and Drinking Places Other Services Repair and Maintenance Personal and Laundry Services Religious, Grantmaking, Civic, Professional and Similar Government Federal Government Department of Defense State Government State Government Education Local Government Local Government Education
4110.7 3422.1 643.8 3466.9 2778.3
10.8 211.1 47.6 32.0 131.5 421.9 196.9 27.9 42.3 225.0 67.6 25.3 36.8 883.5 218.0 112.4 62.9 42.7 474.5 81.7 101.2 22.9 191.0 20.7 170.3 39.1 48.7 20.4 28.1 108.7 51.9 28.7 11.6
7.4 226.3 163.9 67.7 62.4 559.0 230.0 37.3 41.4 48.5 33.2 54.9 274.1 129.4 458.0 82.9 50.7 375.1 142.5 121.8 54.4 56.4 383.3 37.2 27.3 346.1 41.8 304.3 159.5 36.6 34.3 88.6 688.6 96.7 36.5 160.5 74.3 431.4 266.6
4130.7 3432.0 642.3 3488.4 2789.7
10.6 211.4 47.2 31.8 132.4 420.3 196.2 27.8 42.0 224.1 67.1 25.0 36.6 879.3 218.8 112.8 62.9 43.1 469.2 81.5 99.8 22.8 191.3 20.7 170.6 39.6 48.5 20.3 28.1 109.6 52.1 28.9
11.7 7.5 227.1 164.4 68.0 62.7 562.0 233.4 38.6 41.6 49.2 33.6 54.8 273.8 130.0 463.6 85.1 51.9 378.5 143.8 122.7 54.6 57.4 387.2 37.3 27.6 349.9 42.4 307.5 160.9 37.1 34.9 88.9 698.7 98.0 36.6 164.9 78.6 435.8 269.6
4131.8 3431.4 638.7 3493.1 2792.7
10.5 209.9
46.6 31.5 131.8 418.3 195.6 27.8 42.0 222.7 66.9 24.7 36.0 880.2 218.2 112.4 62.5 43.3 470.3 81.6 101.2 22.3 191.7 20.7 171.0 40.0 48.4 20.3 28.2 109.7 52.3 29.0 11.7 7.6 226.1 163.3 67.6 62.8 559.7 230.3 37.2 41.5 48.7 33.1 54.5 274.9 131.0 462.8 85.0 51.9 377.8 142.4 123.1 54.9 57.4 393.4 39.0 28.9 354.4 43.0 311.4 160.8 36.8 34.8 89.2 700.4 98.1 36.7 165.6 78.8 436.7 270.7
4137.0 3438.3 634.1 3502.9 2804.2
10.4 208.7
45.6 31.4 131.7 415.0 193.5 27.5 41.7 221.5 67.1 23.9 36.1 876.4 219.1 112.0 62.9 44.2 466.6 80.7 99.6 22.5 190.7 20.5 170.2 39.8 48.4 19.9 28.2 109.4 52.9 29.0 11.6
7.5 226.3 163.3 67.8 63.0 566.2 230.7 37.2 41.3 49.1 32.9 54.4 281.1 134.1 464.5 85.2 52.6 379.3 144.2 122.8 54.5 57.8 400.2 41.6 30.4 358.6 43.6 315.0 161.2 36.9 35.1 89.2 698.7 98.7 36.9 165.4 78.9 434.6 267.9
4147.4 3448.4 633.2 3514.2 2815.2
10.3 209.4
45.7 31.3 132.4 413.5 192.4 27.5 41.6 221.1 67.4 23.9 35.7 877.5 219.2 111.8 63.0 44.4 467.0 80.0 99.0 22.7 191.3 20.5 170.8 39.6 48.8 20.2 28.1 109.9 53.0 29.1 11.7 7.5 226.5 163.2 68.1 63.3 565.5 226.6 32.1 41.7 49.2 33.1 54.6 284.3 135.6 466.3 85.0 52.5 381.3 145.3 123.7 54.3 58.0 407.1 44.4 33.2 362.7 44.3 318.4 162.4 36.9 35.5 90.0 699.0 98.2 37.1 164.0 77.4 436.8 268.9
4119.3 3432.6 630.5 3488.8 2802.1
10.2 208.1
45.9 30.8 131.4 412.2 191.9 27.6 41.6 220.3 67.2 23.8 35.6 873.6 218.1 111.2 62.6 44.3 464.0 79.6 99.4 22.2 191.5 20.5 171.0 39.8 48.8 20.2 28.1 110.3 52.9 29.0 11.7
7.5 225.5 162.7 68.1 62.8 566.5 226.1 31.9 41.6 49.0 33.0 54.6 285.8 137.1 458.5 82.3 51.3 376.2 142.9 123.8 54.9 54.6 405.1 46.8 35.5 358.3 43.9 314.4 162.6 36.6 35.0 91.0 686.7 98.4 37.6 158.0 71.1 430.3 259.9
4077.9 3413.1 625.2 3452.7 2787.9
10.3 206.8
45.0 30.2 131.6 408.1 190.6 27.5 41.5 217.5 66.7 23.3 35.1 872.7 218.1 110.7 62.8 44.6 463.9 80.3 99.7 22.0 190.7 20.5 170.2 39.3 49.3 19.9 28.2 109.2 52.6 28.8 11.7 7.5 225.6 163.3 68.1 62.3 557.0 226.1 31.0 41.4 49.1 33.9 55.2 275.7 128.3 459.4 80.7 50.7 378.7 144.9 125.0 54.7 54.1 402.3 46.4 35.5 355.9 44.7 311.2 161.7 36.2 34.9 90.6 664.8 98.3 37.4 157.0 70.3 409.5 237.4
4105.2 3416.2 622.7 3482.5 2793.5
10.3 204.6
44.4 29.9 130.3 407.8 189.9 27.5 41.1 217.9 67.2 23.5 35.6 871.7 218.3 110.6 62.4 45.3 463.4 80.3 100.0 22.2 190.0 20.4 169.6 38.7 49.2 20.2 28.3 108.9 52.4 28.5 11.8 7.3 224.4 162.6 67.9 61.8 559.0 226.0 31.2 41.2 49.3 33.9 55.1 277.9 129.8 466.3 82.5 50.5 383.8 146.1 125.4 54.9 57.4 402.1 43.9 33.4 358.2 44.0 314.2 161.1 36.1 35.0 90.0 689.0 97.8 37.3 163.1 76.3 428.1 258.1
4081.5 3388.1 615.9 3465.6 2772.2
10.2 201.2
43.5 29.5 128.2 404.5 187.6 27.4 40.8 216.9 67.3 23.3 35.3 866.8 217.4 109.9 62.2 45.3 459.8 80.6 100.0 21.6 189.6 20.4 169.2 38.1 48.8 20.1 28.4 108.2 52.0 28.2 11.8
7.4 221.9 160.7 67.5 61.2 554.5 224.3 31.6 40.7 49.2 33.7 55.0 275.2 128.4 466.3 85.1 52.1 381.2 143.6 125.5 54.8 57.3 395.2 42.3 31.6 352.9 42.9 310.0 159.3 35.5 34.2 89.6 693.4 97.9 37.5 165.2 79.3 430.3 262.5
4086.5 3385.7 608.7 3477.8 2777.0
10.2 198.7
43.5 28.5 126.7 399.8 183.6 27.3 40.6 216.2 67.4 23.1 34.4 869.6 217.6 109.3 62.2 46.1 462.2 80.7 99.7 22.1 189.8 20.4 169.4 37.9 48.8 20.2 28.6 107.5 52.1 28.1 11.9 7.3 220.7 159.0 67.8 61.7 556.0 225.9 32.2 40.3 49.9 34.1 54.9 275.2 127.7 474.2 89.6 55.2 384.6 144.1 125.8 55.6 59.1 389.4 40.6 30.4 348.8 42.2 306.6 159.6 35.1 34.2 90.3 700.8 99.1 37.8 166.2 81.0 435.5 267.0
4066.6 3364.8 598.6 3468.0 2766.2
10.0 197.5
43.2 28.4 125.9 391.1 177.1 27.2 40.2 214.0 67.6 22.9 34.2 874.4 216.7 107.7 61.9 47.1 469.4 82.8 103.9 21.5 188.3 20.6 167.7 38.1 48.6 20.3 28.5 106.6 52.0 28.0 12.0
7.3 219.6 157.9 67.3 61.7 544.3 225.4 32.3 40.1 49.1 34.1 54.8 264.1 119.7 474.4 88.7 55.4 385.7 144.1 126.0 55.6 60.0 387.4 39.8 28.6 347.6 40.7 306.9 159.5 35.1 34.2 90.2 701.8 98.9 38.0 165.4 82.1 437.5 268.5
4034.8 3335.1 585.8 3449.0 2749.3
10.0 189.2 41.4 27.7 120.1 386.6 173.6 26.9 40.2 213.0 67.7 22.7 33.8 870.7 214.1 107.3 60.7 46.1 468.7 82.5 105.7 21.6 187.9 20.4 167.5 38.0 48.0 20.9 28.4 106.1 51.9 27.9 12.0
7.3 219.7 158.1
67.6 61.6 539.6 225.5 32.5 39.3 48.4 34.5 54.7 259.4 116.1 475.3 88.8 55.3 386.5 144.7 126.7 55.5 59.6 381.6 38.4 28.1 343.2 40.1 303.1 156.3 34.0 33.1 89.2 699.7 98.7 38.2 164.2 81.6 436.8 268.2
4102.5 3409.0 623.3 3479.2 2785.7
10.3 204.7 45.0 30.3 129.5 408.3 189.1 27.5 41.3 219.2 67.3 23.8 35.4 874.7 217.8 110.7 62.4 44.7 466.6 81.0 100.8 22.2 190.3 20.5 169.8 39.0 48.7 20.2 28.3 108.7 52.3 28.6
11.8 7.4 224.1 161.9 67.8 62.3 557.4 227.5 33.8 41.0 49.1 33.6 54.8 275.1 128.9 465.8 85.1 52.5 380.7 144.1 124.4 54.9 57.4 394.5 41.5 30.9 353.1 42.8 310.3 160.4 36.1 34.6 89.7 693.5 98.2 37.3 163.3 77.5 431.9 263.8
Note: These preliminary estimates were prepared in cooperation with the U.S. Department of Labor, Bureau of Labor Statistics, based upon monthly reports submitted by selected
employers throughout Georgia. The estimates include all full- and part-time wage and salary workers who were employed during or received pay for any part of the pay period that includes the twelfth of the month. Proprietors, domestic workers, self-employed persons, unpaid family workers and personnel of the armed forces are excluded. Estimates based on 2008 benchmark.
Source: Georgia Department of Labor, Workforce Information & Analysis
4
GEORGIA Nonagricultural Employment (000s)
2007 Final Series
Industry
Annual Jan Feb Mar Apr M ay Jun Jul Aug Sep Oct Nov Dec Average
Total Nonfarm Total Private Goods Producing Service-Providing Private Service-Providing Mining and Logging Construction Construction of Buildings Heavy and Civil Engineering Construction Specialty Trade Contractors Manufacturing Durable Goods Computer, Electrical Equip and Appliance Mfg
Transportation Equipment Manufacturing Non-Durable Goods Food Manufacturing Textile Mills Textile Product Mills Trade, Transportation and Utilities Wholesale Trade Merchant Wholesalers, Durable Goods Merchant Wholesalers, Non-durable Goods Wholesale Electronic Markets and Agents and Brokers Retail Trade Food and Beverage Stores General Merchandise Stores Miscellaneous Store Retailers Transportation, Warehousing, and Utilities Utilities Transportation and Warehousing Air Transportation Truck Transportation Couriers and Messengers Warehousing and Storage Information Telecommunications Wired Telecommunications Carriers Wireless Telecommunications Carriers Internet Service Providers, Search Portals, and DP Financial Activities Finance and Insurance Insurance Carriers and Related Activities Real Estate, Rental and Leasing Professional and Business Services Professional, Scientific, and Technical Services Accounting, Tax Preparation and Bookkeeping Architectural, Engineering and Related Services Computer Systems Design and Related Services Management and Technical Consulting Services Management of Companies and Enterprises Admin and Support, Waste Mngmnt and Remediation Employment Services Educational and Health Services Educational Services Colleges, Universities, and Professional Schools Health Care and Social Assistance Ambulatory Health Care Services Hospitals Nursing and Residential Care Facilities Social Assistance Leisure and Hospitality Arts, Entertainment, and Recreation Amusement, Gambling, and Recreation Accommodation and Food Services Accommodation Food Services and Drinking Places Other Services Repair and Maintenance Personal and Laundry Services Religious, Grantmaking, Civic, Professional and Similar Government Federal Government Department of Defense State Government State Government Education Local Government Local Government Education
4094.3 3423.7 667.6 3426.7 2756.1
12.1 218.6 48.8 34.3 135.5 436.9 204.9 28.1 42.9 232.0 68.5 27.9 38.2 880.7 216.7 112.9 62.0 41.8 479.3 80.4 99.1 23.5 184.7 20.3 164.4 36.9 48.3 19.6 27.3 112.8 53.4 28.8 12.2
8.2 230.5 166.7 65.5 63.8 549.9 220.0 35.7 40.3 45.8 28.2 52.0 277.9 131.4 445.9 79.5 49.6 366.4 137.6 121.6 53.0 54.2 378.2 36.3 26.5 341.9 42.0 299.9 158.1 36.5 34.3 87.3 670.6 94.2 34.4 156.9 70.7 419.5 260.4
4114.8 3435.3 668.5 3446.3 2766.8
12.1 220.2 48.7 34.4 137.1 436.2 204.8 28.2 42.7 231.4 68.1 27.6 38.2 874.8 217.4 113.5 62.1 41.8 472.3 80.0 96.5 23.4 185.1 20.3 164.8 37.1 48.4 19.5 27.1 112.5 53.0 28.8 12.3
8.3 232.1 167.5 66.1 64.6 555.1 223.5 37.0 40.7 46.4 28.9 52.3 279.3 132.6 450.0 81.0 50.3 369.0 138.2 122.1 53.3 55.4 383.7 37.3 27.1 346.4 42.6 303.8 158.6 36.8 34.3 87.5 679.5 95.7 34.5 161.1 74.9 422.7 262.7
4130.9 3449.7 667.8 3463.1 2781.9
12.1 221.3 48.8 34.8 137.7 434.4 204.4 28.2 42.2 230.0 67.9 27.1 37.7 877.1 217.5 113.4 61.9 42.2 474.0 80.3 98.9 23.1 185.6 20.4 165.2 37.4 48.7 19.6 27.1 112.5 52.9 28.8 12.2
8.3 232.0 167.4 66.2 64.6 560.6 222.4 36.0 40.8 46.4 29.1 52.2 286.0 138.1 449.1 81.3 50.4 367.8 136.4 122.5 53.3 55.6 391.6 39.6 28.7 352.0 43.0 309.0 159.0 36.9 34.4 87.7 681.2 95.6 34.6 161.4 75.2 424.2 263.7
4140.2 3461.0 667.3 3472.9 2793.7
12.0 221.7 49.3 34.1 138.3 433.6 205.5 28.4 42.2 228.1 66.9 26.5 38.0 878.5 218.8 113.8 62.1 42.9 473.4 80.0 97.1 23.3 186.3 20.5 165.8 37.8 49.0 19.4 26.7 111.0 52.1 28.3 12.2
8.3 231.6 167.2 66.2 64.4 558.9 220.7 35.2 40.4 46.0 29.2 52.8 285.4 138.6 453.4 82.2 51.1 371.2 139.7 121.8 53.9 55.8 399.7 43.1 31.6 356.6 43.9 312.7 160.6 37.4 35.3 87.9 679.2 96.3 34.5 161.0 74.8 421.9 260.7
4158.8 3479.6 669.0 3489.8 2810.6
12.0 223.2 49.8 34.5 138.9 433.8 205.4 28.3 42.2 228.4 67.2 26.9 37.6 884.2 219.1 114.3 62.6 42.2 476.5 80.6 98.9 23.4 188.6 20.3 168.3 39.7 49.3 19.4 26.9 111.6 51.9 28.0 12.1
8.5 231.7 167.1 66.4 64.6 561.8 217.2 30.1 40.8 46.5 29.2 53.2 291.4 143.1 454.1 81.7 50.8 372.4 140.4 121.6 54.3 56.1 405.6 44.4 33.2 361.2 44.8 316.4 161.6 37.4 35.4 88.8 679.2 96.0 34.6 158.6 72.8 424.6 262.1
4147.3 3479.6 669.2 3478.1 2810.4
11.9 224.1 50.1 34.7 139.3 433.2 204.2 28.1 42.3 229.0 67.9 26.7 37.6 884.7 218.8 113.9 62.8 42.1 474.7 80.7 98.1 23.3 191.2 20.5 170.7 40.2 50.1 19.8 27.1 111.7 51.7 27.8 12.0
8.5 231.6 167.0 66.4 64.6 563.6 218.2 29.8 41.2 46.5 29.7 54.4 291.0 143.3 449.4 80.0 50.3 369.4 139.1 122.3 54.7 53.3 406.9 46.8 35.4 360.1 45.3 314.8 162.5 37.2 35.1 90.2 667.7 95.8 35.0 153.9 67.3 418.0 253.1
4115.8 3472.5 666.2 3449.6 2806.3
11.9 223.0 50.0 34.2 138.8 431.3 202.8 28.2 41.3 228.5 67.6 26.7 37.7 885.1 219.4 114.1 62.7 42.6 475.9 80.6 98.3 23.2 189.8 20.4 169.4 39.3 50.3 19.4 27.6 111.3 52.0 28.1
11.9 8.4 232.1 167.2 66.4 64.9 562.4 219.1 28.9 41.5 47.8 30.0 54.8 288.5 138.1 449.7 78.4 49.5 371.3 141.0 123.0 55.2 52.1 403.2 46.1 34.9 357.1 44.7 312.4 162.5 37.0 35.4 90.1 643.3 95.2 35.0 152.0 66.4 396.1 231.0
4160.0 3490.3 667.2 3492.8 2823.1
11.9 224.1 50.3 34.7 139.1 431.2 202.8 28.1 41.6 228.4 67.8 26.8 37.6 885.7 219.5 114.0 63.1 42.4 475.2 81.0 98.0 23.3 191.0 20.6 170.4 39.2 50.4 19.4 28.1 111.4 52.0 28.0
11.8 8.5 232.0 166.9 66.6 65.1 569.7 221.4 30.4 41.9 48.1 30.3 55.4 292.9 141.5 456.6 79.9 49.3 376.7 142.0 123.3 55.7 55.7 405.4 44.9 33.4 360.5 44.4 316.1 162.3 37.5 35.6 89.2 669.7 94.8 34.9 157.4 72.2 417.5 253.4
4154.3 3474.4 662.3 3492.0 2812.1
11.8 221.7 49.7 34.5 137.5 428.8 201.2 28.0 41.6 227.6 67.7 26.4 37.7 884.9 219.0 113.7 63.1 42.2 473.9 81.1 99.0 23.2 192.0 20.6 171.4 39.1 50.3 19.9 28.4 111.3 52.0 27.9
11.7 8.5 230.2 165.7 66.6 64.5 567.7 218.4 28.9 41.4 47.6 30.7 55.7 293.6 143.5 458.9 82.7 50.8 376.2 140.1 123.8 55.9 56.4 398.6 42.4 31.4 356.2 43.9 312.3 160.5 37.4 35.0 88.1 679.9 94.6 35.0 160.3 75.3 425.0 261.8
4164.0 3476.6 657.7 3506.3 2818.9
11.7 220.7 49.7 34.0 137.0 425.3 199.6 27.9 41.2 225.7 67.8 26.1 36.0 889.9 219.8 113.3 63.7 42.8 477.9 81.8 100.7 23.5 192.2 20.5 171.7 39.0 49.9 20.0 28.7 110.4 52.0 27.6
11.8 8.5 230.5 165.7 66.7 64.8 569.2 223.8 30.3 41.7 49.0 32.1 55.3 290.1 141.1 462.9 84.6 51.9 378.3 143.1 123.2 55.4 56.6 395.2 40.4 29.9 354.8 43.7 311.1 160.8 37.7 35.1 88.0 687.4 95.4 35.9 162.2 76.2 429.8 266.0
4184.8 3493.9 657.3 3527.5 2836.6
11.6 219.5 49.3 33.9 136.3 426.2 199.1 27.9 41.6 227.1 68.5 25.8 37.1 906.6 220.0 113.0 64.1 42.9 494.2 84.0 106.3 23.7 192.4 20.8 171.6 39.3 49.5 20.2 28.9 111.0 52.3 27.6
11.9 8.6 230.4 165.5 66.9 64.9 569.7 225.4 31.0 41.8 49.2 32.5 55.9 288.4 139.6 464.3 84.7 51.9 379.6 143.4 123.7 55.8 56.7 394.1 38.9 28.2 355.2 43.7 311.5 160.5 37.5 35.1 87.9 690.9 95.7 36.0 163.2 77.0 432.0 267.9
4181.1 3491.1 654.0 3527.1 2837.1
11.4 216.6
49.0 33.3 134.3 426.0 199.1 28.0 42.1 226.9 68.6 25.4 37.1 910.2 219.6 113.2 63.7 42.7 496.3 83.2 108.6 23.7 194.3 20.8 173.5 39.4 48.9 22.8 28.7 111.0 52.2 27.5 11.8 8.4 230.0 165.0 66.9 65.0 574.7 230.7 32.8 41.8 49.3 32.9 56.2 287.8 140.4 461.6 83.8 51.2 377.8 141.2 124.3 55.8 56.5 390.6 38.3 27.9 352.3 42.9 309.4 159.0 36.6 34.5 87.9 690.0 95.0 36.1 162.7 76.4 432.3 268.3
4145.5 3469.0 664.5 3481.0 2804.5
11.9 221.2
49.5 34.3 137.5 431.4 202.8 28.1 42.0 228.6 67.9 26.7 37.5 886.9 218.8 113.6 62.8 42.4 478.6 81.1 100.0 23.4 189.4 20.5 168.9 38.7 49.4 19.9 27.7 111.5 52.3 28.1 12.0 8.4 231.2 166.6 66.4 64.7 563.6 221.7 32.2 41.2 47.4 30.2 54.2 287.7 139.3 454.7 81.7 50.6 373.0 140.2 122.8 54.7 55.4 396.1 41.5 30.7 354.5 43.7 310.8 160.5 37.2 35.0 88.4 676.6 95.4 35.0 159.2 73.3 422.0 259.3
Note: These preliminary estimates were prepared in cooperation with the U.S. Department of Labor, Bureau of Labor Statistics, based upon monthly reports submitted by selected
employers throughout Georgia. The estimates include all full- and part-time wage and salary workers who were employed during or received pay for any part of the pay period that includes the twelfth of the month. Proprietors, domestic workers, self-employed persons, unpaid family workers and personnel of the armed forces are excluded. Estimates based on 2008 benchmark.
Source: Georgia Department of Labor, Workforce Information & Analysis
5
ATLANTA MSA Nonagricultural Employment (000s)
2008 Preliminary Series
Industry
Annual Jan Feb Mar Apr M ay Jun Jul Aug Sep Oct Nov Dec Average
Total Nonfarm Total Private Goods Producing Service-Providing Private Service-Providing Mining and Logging Construction Construction of Buildings Specialty Trade Contractors Manufacturing Durable Goods
Transportation Equipment Manufacturing Non-Durable Goods Food Manufacturing Trade, Transportation and Utilities Wholesale Trade Merchant Wholesalers, Durable Goods Merchant Wholesalers, Non-durable Goods Wholesale Electronic Markets and Agents and Brokers Retail Trade Food and Beverage Stores General Merchandise Stores Miscellaneous Store Retailers Transportation, Warehousing, and Utilities Utilities Transportation and Warehousing Air Transportation Truck Transportation Couriers and Messengers Information Telecommunications Wired Telecommunications Carriers Wireless Telecommunications Carriers Internet Service Providers, Search Portals, and DP Financial Activities Finance and Insurance Insurance Carriers and Related Activities Real Estate, Rental and Leasing Professional and Business Services Professional, Scientific, and Technical Services Accounting, Tax Preparation and Bookkeeping Architectural, Engineering and Related Services Computer Systems Design and Related Services Management and Technical Consulting Services Management of Companies and Enterprises Admin and Support, Waste Mngmnt and Remediation Employment Services Educational and Health Services Educational Services Health Care and Social Assistance Ambulatory Health Care Services Hospitals Social Assistance Leisure and Hospitality Arts, Entertainment, and Recreation Accommodation and Food Services Accommodation Food Services and Drinking Places Other Services Repair and Maintenance Personal and Laundry Services Government Federal Government State Government Local Government
2432.5 2097.7 306.9 2125.6 1790.8
1.8 132.7 29.9 83.5 172.4 89.6 15.9 82.8 24.5 560.2 159.7 84.1 41.7 33.9 271.6 49.5 54.0 14.9 128.9
11.6 117.3 37.9 29.2 16.0 83.2 37.1 22.8
9.8 7.0 157.3 112.2 46.0 45.1 409.5 178.1 24.9 31.4 39.3 28.8 42.1 189.3 88.1 255.5 55.7 199.8 78.6 63.6 33.8 227.8 24.6 203.2 23.6 179.6 97.3 21.3 23.1 334.8 46.1 66.7 222.0
2444.0 2103.9 307.2 2136.8 1796.7
1.8 133.3 29.7 84.5 172.1 89.0 15.9 83.1 24.7 557.9 160.2 84.4 41.7 34.1 268.4 49.4 53.3 14.7 129.3
11.5 117.8 38.4 29.0 15.9 83.7 37.3 23.0
9.8 7.1 157.8 112.5 46.1 45.3 410.2 180.7 25.8 31.5 40.0 29.1 41.9 187.6 87.6 259.0 57.0 202.0 79.5 64.2 34.5 229.8 24.5 205.3 23.9 181.4 98.3 21.6 23.6 340.1 47.3 68.4 224.4
2445.6 2103.8 305.7 2139.9 1798.1
1.8 132.2 29.2 84.0 171.7 88.7 15.9 83.0 24.8 558.1 159.9 84.2 41.5 34.2 268.7 49.2 53.7 14.5 129.5
11.5 118.0 38.8 29.0 15.9 84.0 37.5 23.1
9.8 7.1 157.3 111.9 46.2 45.4 407.9 178.8 24.9 31.6 39.6 28.6 41.9 187.2 87.6 259.2 57.0 202.2 79.0 64.5 34.5 233.4 25.7 207.7 24.1 183.6 98.2 21.6 23.4 341.8 47.6 68.8 225.4
2445.7 2104.4 302.3 2143.4 1802.1
1.7 130.4 28.3 83.3 170.2 87.6 15.7 82.6 24.7 554.4 159.7 83.4 41.7 34.6 265.7 48.6 52.8 14.4 129.0
11.3 117.7 38.5 28.9 15.9 84.0 38.2 23.2
9.7 7.0 157.0 111.6 45.9 45.4 412.4 178.7 25.0 30.9 39.9 28.9 41.2 192.5 90.3 259.9 57.1 202.8 79.6 64.5 34.7 236.4 27.7 208.7 24.2 184.5 98.0 21.5 23.4 341.3 48.0 68.9 224.4
2453.2 2112.5 302.3 2150.9 1810.2
1.7 130.6 28.5 83.5 170.0 87.3 15.6 82.7 24.8 555.4 159.7 83.2 41.7 34.8 266.2 47.8 52.6 14.5 129.5
11.3 118.2 38.3 29.1 16.2 84.5 38.3 23.2
9.9 7.1 157.1 111.5 46.2 45.6 411.5 176.5 22.0 31.2 40.0 29.0 41.5 193.5 90.1 261.2 57.1 204.1 79.9 65.3 34.9 241.5 29.6 211.9 24.4 187.5 99.0 21.7 23.7 340.7 47.4 68.1 225.2
2437.6 2104.4 301.4 2136.2 1803.0
1.7 130.1 28.7 83.0 169.6 87.6 15.7 82.0 24.5 553.2 159.2 82.9 41.6 34.7 264.8 47.6 52.8 14.3 129.2
11.1 118.1 38.5 29.0 16.2 84.7 38.2 23.2
9.8 7.1 156.3 111.0 46.2 45.3 412.5 176.9 22.1 31.5 40.0 28.9 41.6 194.0 90.8 256.0 55.5 200.5 78.7 65.0 32.7 241.5 31.7 209.8 24.4 185.4 98.8 21.5 23.4 333.2 47.3 65.2 220.7
2414.1 2092.6 298.5 2115.6 1794.1
1.5 129.1 28.0 83.2 167.9 87.0 15.3 80.9 24.3 552.8 159.6 82.7 41.9 35.0 264.7 48.0 53.0 14.3 128.5
11.2 117.3 38.0 29.0 15.9 83.9 37.8 22.9
9.8 7.1 156.4 111.5 46.2 44.9 407.6 177.0 21.5 31.4 40.2 29.7 42.5 188.1 86.3 256.3 54.7 201.6 80.3 64.9 32.5 238.9 31.4 207.5 24.7 182.8 98.2 21.0 23.4 321.5 46.6 64.4 210.5
2427.6 2092.9 296.4 2131.2 1796.5
1.5 127.7 27.5 82.5 167.2 86.6 15.6 80.6 24.4 551.5 159.5 82.5 41.5 35.5 263.8 47.8 52.9 14.4 128.2
11.2 117.0 37.5 29.1 16.1 83.7 37.7 22.7
9.9 6.8 155.4 111.0 46.1 44.4 408.7 176.8 21.6 31.2 40.4 29.7 42.4 189.5 87.0 260.8 55.6 205.2 80.9 65.6 34.7 238.4 29.4 209.0 24.2 184.8 98.0 20.9 23.5 334.7 46.1 67.8 220.8
2412.8 2077.1 293.2 2119.6 1783.9
1.5 125.9 27.0 81.5 165.8 85.8 15.6 80.0 24.3 548.9 158.8 82.1 41.1 35.6 262.4 48.3 53.1 14.1 127.7
11.2 116.5 36.8 29.0 16.0 83.1 37.3 22.5
9.8 7.0 153.6 109.6 45.9 44.0 405.5 175.3 22.0 30.8 39.9 29.4 42.4 187.8 86.0 261.1 57.1 204.0 79.8 65.7 34.5 234.8 28.5 206.3 23.9 182.4 96.9 20.6 23.0 335.7 46.1 69.4 220.2
2411.7 2071.0 288.0 2123.7 1783.0
1.5 122.8 26.2 79.6 163.7 83.1 15.5 80.6 24.3 549.5 157.8 81.5 40.8 35.5 264.2 48.2 53.0 14.2 127.5
11.1 116.4 36.5 28.8 16.1 82.9 37.4 22.4 10.0
6.8 152.6 108.5 45.9 44.1 405.5 175.4 22.2 30.1 41.3 29.7 42.2 187.9 87.1 263.4 58.4 205.0 80.0 65.8 34.9 231.2 27.2 204.0 23.7 180.3 97.9 20.4 22.8 340.7 47.1 70.3 223.3
2399.6 2058.5 284.5 2115.1 1774.0
1.5 121.5 26.1 79.1 161.5 81.7 15.1 79.8 24.3 553.0 158.1 81.0 40.8 36.3 268.4 49.6 55.8 14.3 126.5
11.1 115.4 36.6 28.5 16.2 82.4 37.1 22.4 10.1
6.9 151.8 107.7 45.9 44.1 396.3 174.8 22.3 29.8 40.5 29.7 42.2 179.3 80.8 263.6 58.5 205.1 79.3 66.0 35.2 229.5 25.8 203.7 23.1 180.6 97.4 20.4 22.9 341.1 46.5 70.1 224.5
2381.3 2041.1 276.8 2104.5 1764.3
1.5 115.9 24.9 75.1 159.4 80.2 15.0 79.2 24.4 550.4 157.1 80.7 41.1 35.3 266.7 49.4 56.3 14.5 126.6 11.1 115.5 36.8 28.4 16.6 82.5 37.1 22.3 10.1
6.9 151.4 107.3
46.1 44.1 392.2 174.6 22.6 29.2 40.5 30.2 42.2 175.4 80.2 264.3 57.8 206.5 80.3 66.6 35.2 227.7 25.4 202.3 23.2 179.1 95.8 20.1 22.9 340.2 46.1 70.0 224.1
2425.5 2088.3 296.9 2128.5 1791.4
1.6 127.7
27.8 81.9 167.6 86.2 15.6 81.4 24.5 553.8 159.1 82.7 41.4 35.0 266.3 48.6 53.6 14.4 128.4 11.3 117.1 37.7 28.9 16.1 83.6 37.6 22.8
9.9 7.0 155.3 110.5 46.1 44.8 406.7 177.0 23.1 30.9 40.1 29.3 42.0 187.7 86.8 260.0 56.8 203.2 79.7 65.1 34.3 234.2 27.6 206.6 24.0 182.7 97.8 21.1 23.3 337.2 46.9 68.2 222.1
Note: These preliminary estimates were prepared in cooperation with the U.S. Department of Labor, Bureau of Labor Statistics, based upon monthly reports submitted by selected
employers in the Atlanta Metropolitan Statistical Area, which includes Barrow, Bartow, Butts, Carroll, Cherokee, Clayton, Cobb, Coweta, Dawson, DeKalb, Douglas, Fayette, Forsyth, Fulton, Gwinnett, Haralson, Heard, Henry, Jasper, Lamer, Meriwether, Newton, Paulding, Pickens, Pike, Rockdale, Spalding and Walton counties. The estimates include all full- and part-time wage and salary workers who were employed during or received pay for any part of the pay period that includes the twelfth of the month. Proprietors, domestic workers, self-employed persons, unpaid family workers and personnel of the armed forces are excluded. Estimates based on 2008 benchmark.
Source: Georgia Department of Labor, Workforce Information & Analysis
6
ATLANTA MSA Nonagricultural Employment (000s)
2007 Final Series
Industry
Annual Jan Feb Mar Apr M ay Jun Jul Aug Sep Oct Nov Dec Average
Total Nonfarm Total Private Goods Producing Service-Providing Private Service-Providing Mining and Logging Construction Construction of Buildings Specialty Trade Contractors Manufacturing Durable Goods
Transportation Equipment Manufacturing Non-Durable Goods Food Manufacturing Trade, Transportation and Utilities Wholesale Trade Merchant Wholesalers, Durable Goods Merchant Wholesalers, Non-durable Goods Wholesale Electronic Markets and Agents and Brokers Retail Trade Food and Beverage Stores General Merchandise Stores Miscellaneous Store Retailers Transportation, Warehousing, and Utilities Utilities Transportation and Warehousing Air Transportation Truck Transportation Couriers and Messengers Information Telecommunications Wired Telecommunications Carriers Wireless Telecommunications Carriers Internet Service Providers, Search Portals, and DP Financial Activities Finance and Insurance Insurance Carriers and Related Activities Real Estate, Rental and Leasing Professional and Business Services Professional, Scientific, and Technical Services Accounting, Tax Preparation and Bookkeeping Architectural, Engineering and Related Services Computer Systems Design and Related Services Management and Technical Consulting Services Management of Companies and Enterprises Admin and Support, Waste Mngmnt and Remediation Employment Services Educational and Health Services Educational Services Health Care and Social Assistance Ambulatory Health Care Services Hospitals Social Assistance Leisure and Hospitality Arts, Entertainment, and Recreation Accommodation and Food Services Accommodation Food Services and Drinking Places Other Services Repair and Maintenance Personal and Laundry Services Government Federal Government State Government Local Government
2419.4 2094.0 316.0 2103.4 1778.0
2.1 137.0 30.1 85.3 176.9 92.9 16.4 84.0 24.9 560.4 159.2 85.0 41.2 33.0 275.2 48.9 52.5 15.6 126.0
11.0 115.0 36.2 29.4 15.7 86.3 38.6 22.2 10.0
8.1 162.1 116.2 45.0 45.9 401.3 170.2 23.9 30.6 37.0 24.8 39.5 191.6 88.1 247.2 53.1 194.1 75.8 63.4 32.0 224.5 23.7 200.8 23.7 177.1 96.2 21.3 22.5 325.4 45.0 65.3 215.1
2432.3 2102.6 317.6 2114.7 1785.0
2.0 138.7 29.8 87.2 176.9 92.7 16.2 84.2 25.0 556.4 159.6 85.2 41.4 33.0 270.4 48.8 50.6 15.5 126.4
11.1 115.3 36.4 29.5 15.6 86.1 38.3 21.8 10.1
8.1 163.6 117.0 45.5 46.6 404.8 173.1 24.8 31.0 37.6 25.5 39.9 191.8 88.4 249.8 54.1 195.7 76.1 63.6 32.9 227.8 24.4 203.4 24.2 179.2 96.5 21.4 22.6 329.7 45.9 66.9 216.9
2444.3 2113.3 318.3 2126.0 1795.0
2.1 139.6 30.1 87.5 176.6 92.4 16.1 84.2 25.0 557.1 159.6 85.1 41.4 33.1 270.6 48.9 51.3 15.2 126.9
11.1 115.8 36.6 29.7 15.6 86.1 38.4 21.9 10.1
8.1 163.9 117.1 45.6 46.8 408.5 172.9 24.4 31.0 37.6 25.6 39.7 195.9 91.7 249.9 54.4 195.5 75.5 63.9 32.9 232.6 26.2 206.4 24.3 182.1 96.9 21.5 22.7 331.0 45.8 67.2 218.0
2442.6 2112.8 317.1 2125.5 1795.7
2.0 139.1 30.1 87.8 176.0 92.3 16.2 83.7 24.8 557.4 160.1 85.1 41.4 33.6 270.3 48.6 50.5 15.2 127.0
11.1 115.9 37.0 29.9 15.4 85.3 37.9 21.8 10.1
8.1 163.2 116.6 45.5 46.6 405.2 171.0 23.5 30.7 37.4 25.9 40.2 194.0 92.0 251.4 55.1 196.3 77.1 63.0 32.7 235.2 27.7 207.5 24.3 183.2 98.0 21.7 23.5 329.8 46.5 67.1 216.2
2454.2 2125.0
317.9 2136.3 1807.1
2.0 139.9 30.4 88.1 176.0 92.3 16.1 83.7 25.0 560.8 159.9 85.3 41.5 33.1 271.6 48.9 51.3 15.2 129.3
11.1 118.2 38.9 30.1 15.5 85.8 37.7 21.6 10.0
8.2 163.1 116.3 45.6 46.8 407.4 168.8 20.3 30.9 37.7 25.9 40.6 198.0 94.8 251.3 54.9 196.4 77.2 62.8 32.9 240.0 29.6 210.4 24.6 185.8 98.7 21.7 23.7 329.2 46.1 65.4 217.7
2447.7 2126.9
318.6 2129.1 1808.3
2.0 140.4 30.9 88.0 176.2 92.2 16.1 84.0 25.2 561.0 159.7 85.0 41.7 33.0 270.8 48.9 50.8 15.2 130.5
11.1 119.4 39.3 30.6 15.8 85.8 37.6 21.4 10.0
8.3 162.9 116.2 45.7 46.7 408.9 169.7 20.0 31.3 37.7 26.4 41.7 197.5 94.7 248.9 53.9 195.0 76.9 63.1 31.3 241.7 31.7 210.0 24.8 185.2 99.1 21.6 23.4 320.8 45.5 62.2 213.1
2443.0 2128.5
317.2 2125.8 1811.3
2.0 139.8 31.2 87.7 175.4 91.5 15.4 83.9 25.2 561.4 160.6 85.3 41.8 33.5 271.5 48.9 50.9 15.2 129.3
11.0 118.3 38.3 30.7 15.4 85.5 37.8 21.7 10.0
8.2 163.0 116.2 45.7 46.8 412.7 171.6 20.0 31.6 39.1 27.1 42.3 198.8 92.6 249.4 53.2 196.2 77.8 63.7 30.5 240.0 31.3 208.7 24.3 184.4 99.3 21.5 23.7 314.5 44.8 66.8 202.9
2466.6 2138.1
318.1 2148.5 1820.0
2.0 140.5 31.5 87.8 175.6 91.8 15.8 83.8 25.2 561.2 160.6 85.2 41.9 33.5 271.0 49.4 50.6 15.2 129.6
11.2 118.4 38.2 30.7 15.4 85.6 37.8 21.6 10.0
8.2 162.9 116.0 45.7 46.9 416.1 173.2 21.1 31.8 39.3 27.3 42.7 200.2 93.7 253.7 54.1 199.6 78.3 64.1 32.8 241.3 30.3 211.0 24.0 187.0 99.2 21.6 23.9 328.5 44.6 69.6 214.3
2462.5 2129.1
315.7 2146.8 1813.4
2.0 139.1 31.0 87.0 174.6 91.2 15.8 83.4 25.1 561.2 160.1 84.9 41.8 33.4 270.9 49.5 51.4 15.3 130.2
11.2 119.0 38.0 30.7 15.8 85.7 37.7 21.5 10.0
8.2 161.6 115.1 45.9 46.5 415.3 171.3 20.1 31.5 38.8 27.7 43.0 201.0 95.7 255.4 55.7 199.7 77.4 64.4 33.4 236.6 28.3 208.3 24.0 184.3 97.6 21.6 23.4 333.4 44.4 70.5 218.5
2463.2 2130.3
315.2 2148.0 1815.1
2.0 139.1 31.3 87.0 174.1 91.0 15.9 83.1 24.7 563.4 160.1 84.7 41.8 33.6 273.3 49.6 52.3 15.4 130.0
11.2 118.8 37.9 30.3 15.9 84.7 37.6 21.2 10.0
8.2 161.4 114.6 45.7 46.8 415.5 175.2 20.5 31.8 40.1 28.7 42.2 198.1 93.6 258.1 56.9 201.2 78.6 64.4 33.6 234.1 26.9 207.2 24.0 183.2 97.9 21.9 23.5 332.9 45.1 66.7 221.1
2475.7 2141.1
314.4 2161.3 1826.7
2.0 138.4 31.1 86.6 174.0 90.8 16.0 83.2 24.8 573.8 160.0 84.4 41.9 33.7 283.4 51.1 55.8 15.5 130.4
11.5 118.9 38.1 29.9 16.0 85.1 37.6 21.3 10.0
8.2 161.3 114.3 45.9 47.0 416.8 176.5 21.2 31.8 40.3 29.1 42.7 197.6 93.1 259.1 57.0 202.1 79.0 64.8 33.7 233.0 25.3 207.7 24.0 183.7 97.6 21.7 23.5 334.6 45.3 66.9 222.4
2477.6 2143.0 312.5 2165.1 1830.5
1.9 136.7
30.9 85.6 173.9 90.7 16.0 83.2 24.7 578.4 160.4 84.7 42.1 33.6 286.3 50.8 57.1 15.6 131.7 11.5 120.2 38.2 29.7 17.5 85.2 37.6 21.2 9.9 8.0 161.0 114.0 45.9 47.0 417.7 177.8 22.1 31.8 40.3 29.4 43.0 196.9 93.9 259.0 56.7 202.3 78.4 65.3 33.7 232.2 25.2 207.0 23.7 183.3 97.0 21.2 23.3 334.6 44.9 66.9 222.8
2452.4 2123.7 316.6 2135.9 1807.2
2.0 139.0
30.7 87.1 175.5 91.8 16.0 83.7 25.0 562.7 160.0 85.0 41.7 33.3 273.8 49.4 52.1 15.3 128.9 11.2 117.8 37.8 30.1 15.8 85.6 37.9 21.6 10.0 8.2 162.5 115.8 45.6 46.7 410.9 172.6 21.8 31.3 38.6 27.0 41.5 196.8 92.7 252.8 54.9 197.8 77.3 63.9 32.7 234.9 27.6 207.4 24.2 183.2 97.8 21.6 23.3 328.7 45.3 66.8 216.6
Note: These preliminary estimates were prepared in cooperation with the U.S. Department of Labor, Bureau of Labor Statistics, based upon monthly reports submitted by selected
employers in the Atlanta Metropolitan Statistical Area, which includes Barrow, Bartow, Butts, Carroll, Cherokee, Clayton, Cobb, Coweta, Dawson, DeKalb, Douglas, Fayette, Forsyth, Fulton, Gwinnett, Haralson, Heard, Henry, Jasper, Lamer, Meriwether, Newton, Paulding, Pickens, Pike, Rockdale, Spalding and Walton counties. The estimates include all full- and part-time wage and salary workers who were employed during or received pay for any part of the pay period that includes the twelfth of the month. Proprietors, domestic workers, self-employed persons, unpaid family workers and personnel of the armed forces are excluded. Estimates based on 2008 benchmark.
Source: Georgia Department of Labor, Workforce Information & Analysis
7
ALBANY MSA Nonagricultural Employment (000s)
Industry Total Nonfarm Total Private Goods Producing Service-Providing Private Service-Providing Manufacturing Trade, Transportation and Utilities Retail Trade Government Federal Government State Government Local Government
2008 Preliminary Series
Annual Jan Feb Mar Apr M ay Jun Jul Aug Sep Oct Nov Dec Average
64.2 64.8 64.7 64.5 64.4 64.6 63.3 63.8 63.9 64.7 63.8 63.4 64.2
50.8 51.1 51.0 50.7 50.7 50.9 50.3 50.3 50.1 50.7 49.9 49.4 50.5
10.4 10.5 10.5 10.1 10.1 10.2 10.2 10.1 10.1 10.0
9.8
9.7 10.1
53.8 54.3 54.2 54.4 54.3 54.4 53.1 53.7 53.8 54.7 54.0 53.7 54.0
40.4 40.6 40.5 40.6 40.6 40.7 40.1 40.2 40.0 40.7 40.1 39.7 40.4
6.6
6.6
6.6
6.5
6.5
6.6 6.6
6.6
6.6
6.5
6.4
6.4
6.5
13.3 13.3 13.3 13.0 13.0 12.8 13.0 12.9 13.0 13.0 12.7 12.7 13.0
8.1
8.0
8.1
7.9
7.9
7.8 7.7
7.7
7.6
7.6
7.7
7.7
7.8
13.4 13.7 13.7 13.8 13.7 13.7 13.0 13.5 13.8 14.0 13.9 14.0 13.7
3.1
3.1
3.1
3.1
3.2
3.2 3.2
3.2
3.2
3.3
3.3
3.4
3.2
2.6
2.9
2.9
3.0
2.8
2.8 2.6
2.7
3.0
3.0
2.9
2.9
2.8
7.7
7.7
7.7
7.7
7.7
7.7 7.2
7.6
7.6
7.7
7.7
7.7
7.6
2007 Final Series
Industry
Annual Jan Feb Mar Apr M ay Jun Jul Aug Sep Oct Nov Dec Average
Total Nonfarm
64.1 64.8 64.7 64.9 64.8 64.7 64.2 65.0 64.8 64.6 64.8 64.7 64.7
Total Private
50.2 50.7 50.7 51.0 50.9 50.8 50.8 51.2 50.8 50.9 51.1 51.0 50.8
Goods Producing
10.0 10.1 10.0
9.9
9.8
9.9 9.9 10.0
9.9 10.0 10.0 10.1 10.0
Service-Providing
54.1 54.7 54.7 55.0 55.0 54.8 54.3 55.0 54.9 54.6 54.8 54.6 54.7
Private Service-Providing
40.2 40.6 40.7 41.1 41.1 40.9 40.9 41.2 40.9 40.9 41.1 40.9 40.9
Manufacturing
7.0
7.0
7.0
6.7
6.7
6.7 6.7
6.7
6.7
6.7
6.6
6.6
6.8
Trade, Transportation and Utilities
13.5 13.4 13.4 13.5 13.5 13.5 13.5 13.4 13.4 13.7 13.9 13.7 13.5
Retail Trade
8.2
8.1
8.1
8.1
8.2
8.1 8.0
8.0
7.9
8.1
8.4
8.2
8.1
Government
13.9 14.1 14.0 13.9 13.9 13.9 13.4 13.8 14.0 13.7 13.7 13.7 13.8
Federal Government
3.1
3.1
3.1
3.1
3.1
3.1 3.1
3.1
3.1
3.1
3.1
3.1
3.1
State Government
2.9
3.1
3.1
3.1
3.0
3.0 2.8
2.8
2.9
2.9
2.9
2.9
3.0
Local Government
7.9
7.9
7.8
7.7
7.8
7.8 7.5
7.9
8.0
7.7
7.7
7.7
7.8
Note: These preliminary estimates were prepared in cooperation with the U.S. Department of Labor, Bureau of Labor Statistics, based upon monthly reports submitted by selected employers in
the Albany Metropolitan Statistical Area, which includes Baker, Dougherty, Lee, Terrell and Worth counties. The estimates include all full- and part-time wage and salary workers who were employed during or received pay for any part of the pay period that includes the twelfth of the month. Proprietors, domestic workers, self-employed persons, unpaid family workers and personnel of the armed forces are excluded. Estimates based on 2008 benchmark.
Source: Georgia Department of Labor, Workforce Information & Analysis
8
ATHENS - CLARKE MSA Nonagricultural Employment (000s)
Industry Total Nonfarm Total Private Goods Producing Service-Providing Private Service-Providing Trade, Transportation and Utilities Retail Trade Professional and Business Services Leisure and Hospitality Government Federal Government State Government Local Government
2008 Preliminary Series
Annual Jan Feb Mar Apr M ay Jun Jul Aug Sep Oct Nov Dec Average
84.6 85.0 85.5 85.5 85.6 84.6 84.3 85.1 85.7 86.2 87.1 86.3 85.5
61.1 61.3 61.7 62.0 62.1 61.3 60.6 61.4 61.5 62.0 62.7 62.1 61.7
12.4 12.4 12.2 12.3 12.4 12.3 12.2 12.2 12.0 11.9 11.8 11.7 12.2
72.2 72.6 73.3 73.2 73.2 72.3 72.1 72.9 73.7 74.3 75.3 74.6 73.3
48.7 48.9 49.5 49.7 49.7 49.0 48.4 49.2 49.5 50.1 50.9 50.4 49.5
14.1 13.9 13.7 13.6 13.5 13.3 13.5 13.7 13.7 13.6 13.8 13.8 13.7
9.8
9.6
9.5
9.5
9.4
9.2 9.4
9.6
9.6
9.6
9.7
9.8
9.6
6.8
6.8
6.9
7.0
7.0
6.9 6.7
6.8
6.9
6.9
6.7
6.7
6.8
8.7
9.0
8.9
9.0
9.0
8.7 8.4
8.7
8.8
8.7
8.6
8.5
8.8
23.5 23.7 23.8 23.5 23.5 23.3 23.7 23.7 24.2 24.2 24.4 24.2 23.8
1.6
1.6
1.6
1.6
1.6
1.6 1.7
1.7
1.7
1.7
1.7
1.7
1.7
14.0 14.1 14.2 14.3 14.3 14.2 14.5 14.0 14.4 14.3 14.3 14.4 14.3
7.9
8.0
8.0
7.6
7.6
7.5 7.5
8.0
8.1
8.2
8.4
8.1
7.9
2007 Final Series
Industry
Annual Jan Feb Mar Apr M ay Jun Jul Aug Sep Oct Nov Dec Average
Total Nonfarm
80.8 81.8 81.6 82.3 82.5 82.9 82.4 83.2 84.2 85.9 86.4 86.5 83.4
Total Private
59.0 59.6 59.4 59.6 59.8 59.8 59.4 60.2 60.9 61.7 62.2 62.5 60.3
Goods Producing
13.0 13.0 13.0 12.9 12.8 12.8 12.7 12.7 12.6 12.8 12.7 12.7 12.8
Service-Providing
67.8 68.8 68.6 69.4 69.7 70.1 69.7 70.5 71.6 73.1 73.7 73.8 70.6
Private Service-Providing
46.0 46.6 46.4 46.7 47.0 47.0 46.7 47.5 48.3 48.9 49.5 49.8 47.5
Trade, Transportation and Utilities
13.9 13.7 13.6 13.7 13.6 13.6 13.7 13.9 13.9 13.9 14.5 14.7 13.9
Retail Trade
9.6
9.4
9.3
9.4
9.3
9.3 9.3
9.6
9.6
9.6 10.1 10.2
9.6
Professional and Business Services
6.0
6.2
6.1
6.3
6.6
6.7 6.6
6.6
6.9
7.0
7.1
7.3
6.6
Leisure and Hospitality
8.0
8.2
8.4
8.4
8.5
8.3 8.1
8.5
8.8
8.8
8.8
8.6
8.5
Government
21.8 22.2 22.2 22.7 22.7 23.1 23.0 23.0 23.3 24.2 24.2 24.0 23.0
Federal Government
1.7
1.6
1.6
1.6
1.6
1.7 1.7
1.6
1.6
1.7
1.7
1.7
1.7
State Government
12.9 13.3 13.3 13.4 13.4 13.9 14.1 13.7 14.0 14.6 14.6 14.4 13.8
Local Government
7.2
7.3
7.3
7.7
7.7
7.5 7.2
7.7
7.7
7.9
7.9
7.9
7.6
Note: These preliminary estimates were prepared in cooperation with the U.S. Department of Labor, Bureau of Labor Statistics, based upon monthly reports submitted by selected employers in the
Athens - Clarke County Metropolitan Statistical Area, which includes Clarke, Madison, Oconee and Oglethorpe counties. The estimates include all full- and part-time wage and salary workers who were employed during or received pay for any part of the pay period that includes the twelfth of the month. Proprietors, domestic workers, self-employed persons, unpaid family workers and personnel of the armed forces are excluded. Estimates based on 2008 benchmark.
Source: Georgia Department of Labor, Workforce Information & Analysis
9
AUGUSTA - RICHMOND MSA Nonagricultural Employment (000s)
Industry Total Nonfarm Total Private Goods Producing Service-Providing Private Service-Providing Mining, Logging, and Construction Manufacturing Trade, Transportation and Utilities Wholesale Trade Retail Trade Transportation,Warehousing, and Utilities Information Financial Activitities Professional and Business Services Educational and Health Services Leisure and Hospitality Other Services Government Federal Government State Government Local Government
2008 Preliminary Series
Jan 214.3 171.2 36.3 178.0 134.9 12.9 23.4 36.6
4.7 25.2 6.7 3.5 7.6 30.1 27.9 20.4 8.8 43.1 7.5 13.4 22.2
Feb 215.0 171.5 35.7 179.3 135.8 12.5 23.2 36.3
4.8 24.8 6.7 3.5 7.7 30.6 28.2 20.6 8.9 43.5 7.5 13.4 22.6
M ar 216.0 172.8 35.6 180.4 137.2 12.3 23.3 36.3
4.8 24.9 6.6 3.5 7.7 31.0 28.3 21.5 8.9 43.2 7.5 13.4 22.3
Apr 218.9 175.3 35.8 183.1 139.5 12.9 22.9 37.2
5.1 25.3 6.8 3.5 7.8 31.7 28.2 22.0 9.1 43.6 7.6 13.5 22.5
M ay 219.3 175.7 35.9 183.4 139.8 13.0 22.9 37.3
5.1 25.4 6.8 3.5 7.8 31.5 28.5 21.9 9.3 43.6 7.6 13.5 22.5
Jun 217.7 174.4 35.6 182.1 138.8 12.8 22.8 37.4
5.0 25.5 6.9 3.5 7.8 31.5 27.9 21.6 9.1 43.3 7.6 13.4 22.3
Jul 215.2 174.0 35.4 179.8 138.6 12.7 22.7 37.4
5.2 25.5 6.7 3.4 7.7 31.4 28.0 21.6 9.1 41.2 7.4 13.0 20.8
Aug 215.9 174.0 35.4 180.5 138.6 12.7 22.7 37.3
5.3 25.4 6.6 3.4 7.7 31.1 28.3 21.8 9.0 41.9 7.5 13.2 21.2
Sep 216.1 173.6 35.5 180.6 138.1 12.7 22.8 37.1
5.3 25.3 6.5 3.3 7.7 31.2 28.3 21.5 9.0 42.5 7.5 13.1 21.9
Oct 215.3 172.4 35.0 180.3 137.4 12.4 22.6 36.9
5.1 25.3 6.5 3.2 7.7 30.9 28.6 21.1 9.0 42.9 7.6 13.4 21.9
Nov 215.5 172.5 34.3 181.2 138.2 12.0 22.3 37.4
5.1 25.8 6.5 3.3 7.7 31.1 28.6 21.1 9.0 43.0 7.6 13.4 22.0
Annual Dec Average
215.0 216.2
172.3 173.3
33.9 35.4
181.1 180.8
138.4 137.9
11.8 12.6
22.1 22.8
36.9 37.0
5.0
5.0
25.4 25.3
6.5
6.7
3.2
3.4
7.8
7.7
31.7 31.2
29.0 28.3
20.9 21.3
8.9
9.0
42.7 42.9
7.7
7.6
13.0 13.3
22.0 22.0
2007 Final Series
Industry
Annual Jan Feb Mar Apr M ay Jun Jul Aug Sep Oct Nov Dec Average
Total Nonfarm
213.7 214.2 215.9 219.3 218.7 218.0 213.8 215.8 216.8 215.8 217.5 217.8 216.4
Total Private
171.1 171.4 173.0 176.7 176.1 175.5 173.6 174.6 174.8 172.8 174.0 174.5 174.0
Goods Producing
38.4 38.4 38.4 38.3 38.3 38.3 38.0 37.8 37.6 36.9 36.6 36.8 37.8
Service-Providing
175.3 175.8 177.5 181.0 180.4 179.7 175.8 178.0 179.2 178.9 180.9 181.0 178.6
Private Service-Providing
132.7 133.0 134.6 138.4 137.8 137.2 135.6 136.8 137.2 135.9 137.4 137.7 136.2
Mining, Logging, and Construction
13.9 13.9 13.9 14.4 14.5 14.5 14.1 14.2 14.1 13.6 13.3 13.6 14.0
Manufacturing
24.5 24.5 24.5 23.9 23.8 23.8 23.9 23.6 23.5 23.3 23.3 23.2 23.8
Trade, Transportation and Utilities
36.4 36.0 36.3 36.7 36.9 36.8 36.9 36.8 37.1 36.9 37.7 38.1 36.9
Wholesale Trade
5.3
5.3
5.3
5.3
5.2
5.1 5.2
5.1
5.2
5.0
5.0
5.0
5.2
Retail Trade
24.8 24.4 24.6 24.8 25.1 25.0 25.0 25.0 25.2 25.1 25.9 26.2 25.1
Transportation, Warehousing, and Utilities
6.3
6.3
6.4
6.6
6.6
6.7 6.7
6.7
6.7
6.8
6.8
6.9
6.6
Information
3.4
3.3
3.3
3.7
3.8
3.8 3.9
3.9
3.9
4.1
4.1
4.2
3.8
Financial Activities
7.5
7.4
7.3
7.5
7.5
7.5 7.4
7.4
7.4
7.4
7.4
7.4
7.4
Professional and Business Services
29.5 29.9 30.2 30.6 30.6 30.8 30.1 30.6 30.8 29.4 29.9 30.2 30.2
Educational and Health Services
27.2 27.4 27.4 27.7 27.9 27.7 27.6 28.1 28.2 28.2 28.3 28.1 27.8
Leisure and Hospitality
20.1 20.3 21.3 23.2 22.1 21.6 20.9 21.2 21.0 20.9 21.0 20.8 21.2
Other Services
8.6
8.7
8.8
9.0
9.0
9.0 8.8
8.8
8.8
9.0
9.0
8.9
8.9
Government
42.6 42.8 42.9 42.6 42.6 42.5 40.2 41.2 42.0 43.0 43.5 43.3 42.4
Federal Government
7.4
7.4
7.5
7.5
7.4
7.5 7.5
7.5
7.5
7.5
7.5
7.5
7.5
State Government
13.0 13.2 13.1 13.1 12.9 12.9 12.4 12.6 12.7 13.2 13.5 13.3 13.0
Local Government
22.2 22.2 22.3 22.0 22.3 22.1 20.3 21.1 21.8 22.3 22.5 22.5 22.0
Note: These preliminary estimates were prepared in cooperation with the U.S. Department of Labor, Bureau of Labor Statistics, based upon monthly reports submitted by selected employers in the
Augusta - Richmond County Metropolitan Statistical Area, which includes Burke, Columbia, McDuffie and Richmond counties in Georgia and Aiken and Edgefield counties in South Carolina. The estimates include all full- and part-time wage and salary workers who were employed during or received pay for any part of the pay period that includes the twelfth of the month. Proprietors, domestic workers, selfemployed persons, unpaid family workers and personnel of the armed forces are excluded. Estimates based on 2008 benchmark.
Source: Georgia Department of Labor, Workforce Information & Analysis
10
COLUMBUS MSA Nonagricultural Employment (000s)
Industry
Total Nonfarm Total Private Goods Producing Service-Providing Private Service-Providing Trade, Transportation and Utilities Retail Trade Information Financial Activities Finance and Insurance Insurance Carriers and Related Activities Professional and Business Services Leisure and Hospitality Government Federal Government State Government Local Government
2008 Preliminary Series
Jan
120.2 97.8 16.6 103.6 81.2 19.0 13.9 5.9 9.2 7.5 5.0 13.6 13.2 22.4 5.3 3.8 13.3
Feb
121.7 98.7 16.7 105.0 82.0 19.0 14.0 6.0 9.2 7.4 4.9 13.9 13.4 23.0 5.4 4.1 13.5
M ar
121.3 98.2 16.5
104.8 81.7 19.0 14.0 6.0 9.2 7.4 5.0 13.8 13.8 23.1 5.4 4.1 13.6
Apr
122.3 99.3 16.6 105.7 82.7 19.0 13.8 5.9 9.2 7.4 4.9 14.7 13.8 23.0 5.4 4.1 13.5
M ay
122.7 99.5 16.6
106.1 82.9 19.0 13.8 5.9 9.2 7.4 4.9 14.9 13.8 23.2 5.5 4.1 13.6
Jun
122.4 99.5 16.7 105.7 82.8 18.9 13.7 6.0 9.2 7.4 4.9 14.5 13.9 22.9 5.4 3.7 13.8
Jul
120.6 98.6 16.5
104.1 82.1 18.7 13.6 5.9 9.2 7.4 4.9 14.1 13.9 22.0 5.5 3.9 12.6
Aug
120.8 98.1 16.3
104.5 81.8 18.7 13.5 5.9 9.1 7.4 4.9 14.2 13.8 22.7 5.6 3.9 13.2
Sep
119.9 96.8 16.1 103.8 80.7 18.6 13.3 5.9 9.0 7.3 4.8 13.9 13.5 23.1 5.6 4.1 13.4
Oct
119.8 96.4 16.0 103.8 80.4 18.2 13.1 5.9 9.1 7.3 4.8 13.8 13.3 23.4 5.7 4.2 13.5
Nov
120.3 96.8 15.8 104.5 81.0 18.5 13.6 5.9 9.1 7.3 4.8 13.6 13.3 23.5 5.8 4.1 13.6
Annual Dec Average
120.6 97.3 15.5
105.1 81.8 18.7 13.7 5.8 9.1 7.4 4.8 13.5 13.3 23.3 5.8 4.0 13.5
121.1 98.1 16.3
104.7 81.8 18.8 13.7 5.9 9.2 7.4 4.9 14.0 13.6 23.0 5.5 4.0 13.4
2007 Final Series
Industry
Annual Jan Feb Mar Apr M ay Jun Jul Aug Sep Oct Nov Dec Average
Total Nonfarm
120.2 121.0 121.3 121.2 122.4 122.3 120.5 122.2 121.7 121.3 122.2 122.1 121.5
Total Private
97.7 98.2 98.4 98.7 99.7 100.0 99.3 100.1 99.2 98.9 99.5 99.3 99.1
Goods Producing
17.4 17.3 17.3 17.3 17.3 17.3 17.1 17.1 16.8 16.8 16.8 16.6 17.1
Service-Providing
102.8 103.7 104.0 103.9 105.1 105.0 103.4 105.1 104.9 104.5 105.4 105.5 104.4
Private Service-Providing
80.3 80.9 81.1 81.4 82.4 82.7 82.2 83.0 82.4 82.1 82.7 82.7 82.0
Trade, Transportation and Utilities
18.7 18.6 18.7 18.3 18.6 18.4 18.5 18.6 18.5 18.6 19.2 19.3 18.7
Retail Trade
14.3 14.3 14.3 14.0 14.0 13.9 14.0 14.0 13.9 13.9 14.4 14.5 14.1
Information
5.9
6.1
5.9
5.9
5.9
5.9 5.9
5.9
5.9
5.8
5.9
5.9
5.9
Financial Activities
9.2
9.2
9.2
9.2
9.3
9.3 9.3
9.4
9.3
9.5
9.5
9.5
9.3
Finance and Insurance
7.3
7.3
7.3
7.4
7.4
7.5 7.5
7.5
7.5
7.6
7.6
7.6
7.5
Insurance Carriers and Related Activities
4.9
4.9
4.9
5.0
5.0
5.0 5.0
5.0
5.0
5.0
5.0
5.0
5.0
Professional and Business Services
13.4 13.5 13.8 14.0 14.4 14.5 14.3 14.9 14.8 14.4 14.1 14.2 14.2
Leisure and Hospitality
13.0 13.2 13.4 13.9 14.0 14.1 13.9 13.8 13.6 13.5 13.6 13.6 13.6
Government
22.5 22.8 22.9 22.5 22.7 22.3 21.2 22.1 22.5 22.4 22.7 22.8 22.5
Federal Government
5.3
5.3
5.3
5.3
5.3
5.2 5.2
5.3
5.3
5.3
5.4
5.3
5.3
State Government
3.9
4.2
4.2
4.1
4.2
3.8 3.8
3.8
4.0
4.0
4.0
4.1
4.0
Local Government
13.3 13.3 13.4 13.1 13.2 13.3 12.2 13.0 13.2 13.1 13.3 13.4 13.2
Note: These preliminary estimates were prepared in cooperation with the U.S. Department of Labor, Bureau of Labor Statistics, based upon monthly reports submitted by selected
employers in the Columbus Metropolitan Statistical Area, which includes Chattahoochee, Harris, Marion and Muscogee counties in Georgia and Russell County in Alabama. The estimates include all full- and part-time wage and salary workers who were employed during or received pay for any part of the pay period that includes the twelfth of the month. Proprietors, domestic workers, selfemployed persons, unpaid family workers and personnel of the armed forces are excluded. Estimates based on 2008 benchmark.
Source: Georgia Department of Labor, Workforce Information & Analysis
11
DALTON MSA Nonagricultural Employment (000s)
Industry
Total Nonfarm Total Private Goods Producing Service-Providing Private Service-Providing Manufacturing Textile Mills Textile Product Mills Trade, Transportation and Utilities Retail Trade Transportation, Warehouse, and Utilities Professional and Business Services Government Federal Government State Government Local Government
2008 Preliminary Series
Annual Jan Feb Mar Apr M ay Jun Jul Aug Sep Oct Nov Dec Average
76.1 75.6 75.6 75.3 74.9 74.7 73.0 73.5 72.8 72.6 72.6 71.9 74.1
68.2 67.6 67.6 67.6 67.3 67.1 65.9 66.3 65.3 65.2 65.2 64.6 66.5
29.8 29.5 29.0 29.2 28.9 28.8 28.2 28.4 28.0 27.5 27.4 26.5 28.4
46.3 46.1 46.6 46.1 46.0 45.9 44.8 45.1 44.8 45.1 45.2 45.4 45.6
38.4 38.1 38.6 38.4 38.4 38.3 37.7 37.9 37.3 37.7 37.8 38.1 38.1
28.2 27.9 27.3 27.6 27.3 27.2 26.7 26.9 26.5 26.2 25.8 25.5 26.9
3.1
3.1
3.1
3.1
3.0
3.0 3.0
3.0
3.0
3.0
3.0
3.0
3.0
19.4 19.1 18.6 18.8 18.6 18.5 18.0 18.4 18.1 18.0 17.9 17.7 18.4
15.6 15.4 15.6 15.8 15.8 15.6 15.6 15.8 15.3 15.3 15.4 15.5 15.6
7.7
7.6
7.6
7.6
7.6
7.5 7.6
7.6
7.5
7.5
7.6
7.7
7.6
3.5
3.3
3.4
3.6
3.6
3.5 3.5
3.7
3.5
3.5
3.5
3.5
3.5
9.6
9.6
9.8
9.4
9.3
9.6 9.1
9.0
8.9
8.9
8.7
8.7
9.2
7.9
8.0
8.0
7.7
7.6
7.6 7.1
7.2
7.5
7.4
7.4
7.3
7.6
0.3
0.3
0.3
0.3
0.3
0.3 0.3
0.3
0.3
0.3
0.3
0.3
0.3
1.5
1.6
1.6
1.2
1.2
1.1 1.1
1.1
1.2
1.2
1.2
1.2
1.3
6.1
6.1
6.1
6.2
6.1
6.2 5.7
5.8
6.0
5.9
5.9
5.8
6.0
2007 Final Series
Industry
Annual Jan Feb Mar Apr M ay Jun Jul Aug Sep Oct Nov Dec Average
Total Nonfarm Total Private Goods Producing Service-Providing Private Service-Providing Manufacturing Textile Mills Textile Product Mills Trade, Transportation and Utilities Retail Trade Transportation, Warehouse, and Utilities Professional and Business Services Government Federal Government State Government Local Government
77.7 78.3 78.3 79.0 79.1 79.0 78.0 78.2 78.3 77.1 77.8 77.5 78.2
70.3 70.8 70.8 71.5 71.4 71.4 70.8 70.8 70.6 69.2 69.9 69.7 70.6
31.7 31.9 31.4 31.7 31.3 31.3 31.2 31.0 31.1 29.5 30.3 30.1 31.0
46.0 46.4 46.9 47.3 47.8 47.7 46.8 47.2 47.2 47.6 47.5 47.4 47.2
38.6 38.9 39.4 39.8 40.1 40.1 39.6 39.8 39.5 39.7 39.6 39.6 39.6
29.9 30.0 29.5 29.8 29.5 29.5 29.4 29.2 29.2 27.7 28.6 28.5 29.2
3.5
3.5
3.5
3.2
3.4
3.3 3.3
3.3
3.3
3.2
3.2
3.1
3.3
20.5 20.5 20.2 20.6 20.1 20.1 20.0 19.9 20.0 18.8 19.6 19.6 20.0
15.9 16.0 16.2 16.1 16.1 16.1 16.0 15.9 15.6 15.6 15.8 15.8 15.9
8.0
7.9
8.1
8.1
8.0
7.9 7.9
7.8
7.8
7.8
7.9
7.9
7.9
3.7
3.6
3.7
3.5
3.5
3.5 3.5
3.6
3.5
3.5
3.5
3.6
3.6
9.8 10.0 10.1 10.3 10.6 10.5 10.3 10.6 10.5 10.5 10.5 10.6 10.4
7.4
7.5
7.5
7.5
7.7
7.6 7.2
7.4
7.7
7.9
7.9
7.8
7.6
0.3
0.3
0.3
0.3
0.3
0.3 0.3
0.3
0.3
0.3
0.3
0.2
0.3
1.1
1.2
1.2
1.2
1.3
1.2 1.2
1.3
1.4
1.5
1.5
1.5
1.3
6.0
6.0
6.0
6.0
6.1
6.1 5.7
5.8
6.0
6.1
6.1
6.1
6.0
Note: These preliminary estimates were prepared in cooperation with the U.S. Department of Labor, Bureau of Labor Statistics, based upon monthly reports submitted by selected employers in
the Dalton Metropolitan Statistical Area, which includes Murray and Whitfield counties. The estimates include all full- and part-time wage and salary workers who were employed during or received pay for any part of the pay period that includes the twelfth of the month. Proprietors, domestic workers, self-employed persons, unpaid family workers and personnel of the armed forces are excluded. Estimates based on 2008 benchmark.
Source: Georgia Department of Labor, Workforce Information & Analysis
12
GAINESVILLE MSA Nonagricultural Employment (000s)
Industry
Total Nonfarm Total Private Goods Producing Service-Providing Private Service-Providing Trade, Transportation and Utilities Retail Trade Government Federal Government State Government Local Government
2008 Preliminary Series
Annual Jan Feb Mar Apr M ay Jun Jul Aug Sep Oct Nov Dec Average
77.6 78.3 78.3 78.8 78.8 77.7 77.8 78.4 78.1 77.6 77.8 77.2 78.0
67.2 67.3 67.6 68.1 68.3 67.4 67.6 67.8 67.3 66.7 66.8 66.2 67.4 21.9 21.7 21.8 21.7 21.7 21.5 21.4 21.4 21.1 21.0 20.8 20.5 21.4
55.7 56.6 56.5 57.1 57.1 56.2 56.4 57.0 57.0 56.6 57.0 56.7 56.7 45.3 45.6 45.8 46.4 46.6 45.9 46.2 46.4 46.2 45.7 46.0 45.7 46.0 14.5 14.6 14.6 14.7 14.7 14.7 14.8 14.8 14.9 14.5 14.7 14.6 14.7
7.8
7.7
7.8
7.8
7.8
7.9 7.9
8.0
8.0
8.0
8.1
8.1
7.9
10.4 11.0 10.7 10.7 10.5 10.3 10.2 10.6 10.8 10.9 11.0 11.0 10.7
0.5
0.5
0.5
0.5
0.5
0.5 0.5
0.5
0.5
0.5
0.5
0.5
0.5
2.5
2.7
2.7
2.7
2.5
2.3 2.4
2.4
2.7
2.7
2.8
2.8
2.6
7.4
7.8
7.5
7.5
7.5
7.5 7.3
7.7
7.6
7.7
7.7
7.7
7.6
2007 Final Series
Industry
Annual Jan Feb Mar Apr M ay Jun Jul Aug Sep Oct Nov Dec Average
Total Nonfarm Total Private Goods Producing Service-Providing Private Service-Providing Trade, Transportation and Utilities Retail Trade Government Federal Government State Government Local Government
74.6 75.2 75.6 76.9 77.5 77.1 77.0 78.1 78.1 79.2 79.1 79.2 77.3
64.5 64.9 65.3 66.8 67.4 67.2 67.3 67.9 67.6 68.7 68.6 68.6 67.1
22.1 22.2 22.1 22.1 22.0 22.0 22.4 22.3 22.2 22.0 21.9 21.9 22.1
52.5 53.0 53.5 54.8 55.5 55.1 54.6 55.8 55.9 57.2 57.2 57.3 55.2
42.4 42.7 43.2 44.7 45.4 45.2 44.9 45.6 45.4 46.7 46.7 46.7 45.0
13.0 13.0 13.0 13.5 13.9 13.8 13.8 13.8 13.9 14.3 14.6 14.9 13.8
7.3
7.2
7.2
7.6
7.8
7.7 7.6
7.5
7.5
7.8
8.0
8.0
7.6
10.1 10.3 10.3 10.1 10.1 9.9 9.7 10.2 10.5 10.5 10.5 10.6 10.2
0.5
0.5
0.5
0.5
0.5
0.5 0.5
0.5
0.5
0.5
0.5
0.5
0.5
2.7
2.8
2.8
2.7
2.6
2.5 2.5
2.6
2.8
2.7
2.7
2.7
2.7
6.9
7.0
7.0
6.9
7.0
6.9 6.7
7.1
7.2
7.3
7.3
7.4
7.1
Note: These preliminary estimates were prepared in cooperation with the U.S. Department of Labor, Bureau of Labor Statistics, based upon monthly reports submitted by selected employers in
the Gainesville Metropolitan Statistical Area, which comprises Hall county. The estimates include all full- and part-time wage and salary workers who were employed during or received pay for any part of the pay period that includes the twelfth of the month. Proprietors, domestic workers, self-employed persons, unpaid family workers and personnel of the armed forces are excluded. Estimates based on 2008 benchmark.
Source: Georgia Department of Labor, Workforce Information & Analysis
13
MACON MSA Nonagricultural Employment (000s)
Industry Total Nonfarm Total Private Goods Producing Service-Providing Private Service-Providing Trade Transportation and Utilities Retail Trade Transportation, Warehousing, and Utilities Financial Activities Professional and Business Services Educational and Health Services Leisure and Hospitality Government Federal Government State Government Local Government
2008 Preliminary Series
Jan 100.3 85.3
11.6 88.7 73.7 20.6 12.1 4.6 8.4 11.3 18.8 9.0 15.0 1.3 3.4 10.3
Feb 100.9 85.6
11.5 89.4 74.1 20.4 11.9 4.6 8.4 11.7 18.9 9.0 15.3 1.4 3.5 10.4
M ar 101.1 85.7
11.5 89.6 74.2 20.7 12.2 4.6 8.4 11.5 18.9 9.1 15.4 1.4 3.6 10.4
Apr 103.0 87.9
11.8 91.2 76.1 20.9 12.2 4.6 8.4 12.6 19.0 9.3 15.1 1.3 3.4 10.4
M AY 103.5 88.3
11.9 91.6 76.4 20.8 12.0 4.7 8.5 13.0 19.1 9.2 15.2 1.3 3.5 10.4
Jun 102.8 88.2
11.7 91.1 76.5 20.8 12.0 4.6 8.5 13.3 18.9 9.3 14.6 1.3 3.2 10.1
Jul 101.7 87.2 12.1 89.6 75.1 20.8 12.1
4.6 8.5 12.0 18.9 9.2 14.5 1.4 3.3 9.8
Aug 102.5 87.6
11.8 90.7 75.8 20.7 12.1 4.5 8.4 12.5 19.2 9.3 14.9 1.3 3.4 10.2
Sep 101.6 86.6
11.6 90.0 75.0 20.6 12.1 4.4 8.4 12.5 19.1 8.8 15.0 1.3 3.4 10.3
Oct 102.4 87.2
11.5 90.9 75.7 20.9 12.1 4.5 8.4 12.5 19.2 8.6 15.2 1.4 3.4 10.4
Nov 102.2 87.0
11.4 90.8 75.6 21.1 12.3 4.4 8.4 12.2 19.3 8.6 15.2 1.4 3.4 10.4
Annual Dec Average
101.6 102.0
86.3 86.9
11.2 11.6
90.4 90.3
75.1 75.3
21.1 20.8
12.4 12.1
4.5
4.6
8.5
8.4
12.2 12.3
19.5 19.1
8.5
9.0
15.3 15.1
1.4
1.4
3.4
3.4
10.5 10.3
2007 Final Series
Industry
Annual Jan Feb Mar Apr M AY Jun Jul Aug Sep Oct Nov Dec Average
Total Nonfarm
99.9 100.7 100.5 100.9 101.3 100.7 100.0 101.1 100.8 101.2 102.0 101.5 100.9
Total Private
83.5 83.9 83.6 85.1 85.6 85.2 85.2 85.6 85.4 86.1 86.7 86.5 85.2
Goods Producing
11.7 11.8 11.7 12.2 12.1 12.0 12.1 12.0 12.0 12.2 12.0 11.8 12.0
Service-Providing
88.2 88.9 88.8 88.7 89.2 88.7 87.9 89.1 88.8 89.0 90.0 89.7 88.9
Private Service-Providing
71.8 72.1 71.9 72.9 73.5 73.2 73.1 73.6 73.4 73.9 74.7 74.7 73.2
Trade Transportation and Utilities
19.9 19.7 19.6 20.0 20.2 20.2 20.3 20.2 20.2 20.5 21.1 21.2 20.3
Retail Trade
12.4 12.2 12.2 12.2 12.3 12.2 12.3 12.2 12.2 12.3 12.8 12.8 12.3
Transportation, Warehousing, and Utilities
4.3
4.3
4.3
4.3
4.4
4.4 4.3
4.3
4.3
4.3
4.3
4.4
4.3
Financial Activities
8.1
8.1
8.1
8.0
8.1
8.2 8.2
8.2
8.3
8.3
8.4
8.4
8.2
Professional and Business Services
11.3 11.6 11.5 11.6 11.7 11.6 11.4 11.5 11.5 11.6 11.4 11.6 11.5
Educational and Health Services
18.2 18.4 18.3 18.6 18.7 18.4 18.5 18.7 18.6 18.8 18.9 18.7 18.6
Leisure and Hospitality
8.4
8.6
8.7
9.0
9.2
9.1 9.2
9.3
9.1
9.1
9.2
9.2
9.0
Government
16.4 16.8 16.9 15.8 15.7 15.5 14.8 15.5 15.4 15.1 15.3 15.0 15.7
Federal Government
1.3
1.3
1.3
1.3
1.3
1.3 1.3
1.4
1.4
1.3
1.4
1.3
1.3
State Government
4.6
4.9
5.0
4.1
4.0
4.0 3.8
3.8
3.8
3.5
3.5
3.4
4.0
Local Government
10.5 10.6 10.6 10.4 10.4 10.2 9.7 10.3 10.2 10.3 10.4 10.3 10.3
Note: These preliminary estimates were prepared in cooperation with the U.S. Department of Labor, Bureau of Labor Statistics, based upon monthly reports submitted by selected employers in
the Macon Metropolitan Statistical Area, which includes Bibb, Crawford, Jones, Monroe and Twiggs counties. The estimates include all full- and part-time wage and salary workers who were employed during or received pay for any part of the pay period that includes the twelfth of the month. Proprietors, domestic workers, self-employed persons, unpaid family workers and personnel of the armed forces are excluded. Estimates based on 2007 benchmark.
Source: Georgia Department of Labor, Workforce Information & Analysis
14
SAVANNAH MSA Nonagricultural Employment (000s)
Industry Total Nonfarm Total Private Goods Producing Service-Providing Private Service-Providing Mining, Logging, and Construction Manufacturing Trade, Transportation and Utilities Wholesale Trade Retail Trade Transportation, Warehousing, and Utilities Information Financial Activities Professional and Business Services Educational and Health Services Leisure and Hospitality Other Services Government Federal Government State Government Local Government
2008 Preliminary Series
Jan 158.9 136.3 24.2 134.7 112.1
9.4 14.8 36.1
6.7 18.3 11.1
1.9 6.1 19.1 21.8 19.4 7.7 22.6 2.9 5.0 14.7
Feb 160.2 137.1 24.1 136.1 113.0
9.3 14.8 36.0 6.7 18.2 11.1 1.9 6.1 19.4 22.1 19.8 7.7 23.1 2.9 5.5 14.7
M ar 160.7 137.4 24.0 136.7 113.4
9.2 14.8 36.1 6.7 18.3 11.1 1.9 6.0 19.3 22.1 20.2 7.8 23.3 2.9 5.6 14.8
Apr 160.5 137.5 23.9 136.6 113.6
9.1 14.8 36.0 6.8 18.4 10.8 1.9 6.1 18.8 22.1 21.0 7.7 23.0 2.9 5.3 14.8
M ay 161.1 138.2 24.0 137.1 114.2
9.2 14.8 35.8 6.8 18.3 10.7 1.9 6.1 18.8 22.5 21.3 7.8 22.9 2.9 5.2 14.8
Jun 160.4 137.8 24.1 136.3 113.7
9.2 14.9 35.6 6.8 18.1 10.7 2.0 6.1 18.8 22.3 21.0 7.9 22.6 2.9 4.8 14.9
Jul 158.3 136.0 23.9 134.4 112.1
9.0 14.9 35.7 6.7 18.3 10.7 2.0 6.0 18.1 21.6 20.8 7.9 22.3 2.9 5.0 14.4
Aug 159.0 136.4 24.0 135.0 112.4
8.8 15.2 35.8 6.8 18.2 10.8 2.0 6.0 18.2 21.7 20.9 7.8 22.6 3.0 5.2 14.4
Sep 158.3 135.6 23.8 134.5 111.8
8.7 15.1 35.7 6.7 17.9 11.1 1.9 5.9 18.1 21.8 20.6 7.8 22.7 2.9 5.2 14.6
Oct 158.9 135.4 23.6 135.3 111.8
8.6 15.0 35.6 6.7 17.8 11.1 1.9 6.0 18.1 22.1 20.3 7.8 23.5 3.0 5.3 15.2
Nov 158.9 135.4 23.4 135.5 112.0
8.6 14.8 35.8 6.7 18.0 11.1 1.9 6.0 17.8 22.3 20.3 7.9 23.5 2.9 5.3 15.3
Annual Dec Average
158.4 159.5
134.9 136.5
23.1 23.8
135.3 111.8
135.6 112.7
8.3
9.0
14.8 14.9
35.8 35.8
6.7
6.7
18.0 18.2
11.1 11.0
1.9
1.9
6.0
6.0
17.7 18.5
22.5 22.1
20.1 20.5
7.8
7.8
23.5 23.0
2.9
2.9
5.3
5.2
15.3 14.8
2007 Final Series
Industry
Annual Jan Feb Mar Apr M ay Jun Jul Aug Sep Oct Nov Dec Average
Total Nonfarm Total Private
158.7 160.4 161.0 162.1 163.2 162.5 160.5 161.8 161.7 137.8 138.9 139.5 140.1 140.9 140.8 139.6 140.4 140.2
161.5 139.5
162.4 161.1 140.0 138.9
161.4 139.7
Goods Producing Service-Providing Private Service-Providing
25.0 133.7 112.8
24.9 135.5 114.0
24.9 136.1 114.6
25.0 137.1 115.1
25.0 138.2 115.9
25.0 137.5 115.8
24.9 135.6 114.7
24.8 137.0 115.6
24.9 136.8 115.3
24.4 137.1 115.1
24.4 138.0 115.6
24.7 136.4 114.2
24.8 136.6 114.9
Mining, Logging, and Construction
10.1 10.0 10.0 10.0 10.0
9.9 10.0 10.0 10.0
9.6
9.6
9.5
9.9
Manufacturing
14.9 14.9 14.9 15.0 15.0 15.1 14.9 14.8 14.9 14.8 14.8 15.2 14.9
Trade, Transportation and Utilities
34.8 34.9 34.8 35.1 35.3 35.6 35.5 36.1 36.4 36.5 36.8 37.2 35.8
Wholesale Trade
6.5
6.5
6.5
6.6
6.6
6.6 6.7
6.7
6.7
6.7
6.8
6.8
6.6
Retail Trade
18.1 17.8 17.9 18.0 18.3 18.2 18.3 18.3 18.3 18.4 19.0 19.1 18.3
Transportation, Warehousing, and Utilities
10.2 10.6 10.4 10.5 10.4 10.8 10.5 11.1 11.4 11.4 11.0 11.3 10.8
Information
2.0
2.0
2.0
2.0
2.0
2.0 2.0
2.0
2.0
2.0
2.0
2.0
2.0
Financial Activities
6.1
6.2
6.2
6.1
6.1
6.1 6.2
6.2
6.1
6.2
6.1
6.0
6.1
Professional and Business Services
19.9 20.3 20.7 20.5 20.5 20.4 20.0 20.4 19.8 19.9 19.9 19.5 20.2
Educational and Health Services
21.8 22.1 22.0 22.2 22.3 22.2 21.8 21.8 22.1 22.2 22.4 21.8 22.1
Leisure and Hospitality
20.1 20.3 20.7 21.3 21.7 21.5 21.3 21.1 20.8 20.3 20.4 19.9 20.8
Other Services
8.1
8.2
8.2
7.9
8.0
8.0 7.9
8.0
8.1
8.0
8.0
7.8
8.0
Government
20.9 21.5 21.5 22.0 22.3 21.7 20.9 21.4 21.5 22.0 22.4 22.2 21.7
Federal Government
2.8
2.8
2.8
2.8
2.9
2.9 2.9
2.9
2.9
2.9
2.9
2.9
2.9
State Government
4.0
4.4
4.4
4.9
5.0
4.5 4.4
4.6
4.6
4.6
4.8
4.8
4.6
Local Government
14.1 14.3 14.3 14.3 14.4 14.3 13.6 13.9 14.0 14.5 14.7 14.5 14.2
Note: These preliminary estimates were prepared in cooperation with the U.S. Department of Labor, Bureau of Labor Statistics, based upon monthly reports submitted by selected employers in
the Savannah Metropolitan Statistical Area, which includes Bryan, Chatham and Effingham counties. The estimates include all full- and part-time wage and salary workers who were employed during or received pay for any part of the pay period that includes the twelfth of the month. Proprietors, domestic workers, self-employed persons, unpaid family workers and personnel of the armed forces are excluded. Estimates based on 2008 benchmark.
Source: Georgia Department of Labor, Workforce Information & Analysis
15
VALDOSTA MSA Nonagricultural Employment (000s)
Industry Total Nonfarm Total Private Goods Producing Service-Providing Private Service-Providing Trade, Transportation and Utilities Retail Trade Government Federal Government State Government Local Government
2008 Preliminary Series
Annual Jan Feb Mar Apr M AY Jun Jul Aug Sep Oct Nov Dec Average
56.3 57.0 56.3 57.2 57.4 55.7 56.0 56.7 56.2 56.6 57.1 57.0 56.6
43.4 43.8 43.1 44.0 44.2 43.2 43.8 43.8 43.0 43.3 43.5 43.3 43.5
8.9
9.0
8.9
8.8
8.9
8.7 8.7
8.7
8.6
8.5
8.4
8.3
8.7
47.4 48.0 47.4 48.4 48.5 47.0 47.3 48.0 47.6 48.1 48.7 48.7 47.9
34.5 34.8 34.2 35.2 35.3 34.5 35.1 35.1 34.4 34.8 35.1 35.0 34.8
12.5 12.5 12.2 12.4 12.4 12.2 12.3 12.3 12.0 12.0 12.1 12.1 12.3
8.5
8.4
8.2
8.4
8.3
8.1 8.2
8.2
8.0
8.0
8.1
8.1
8.2
12.9 13.2 13.2 13.2 13.2 12.5 12.2 12.9 13.2 13.3 13.6 13.7 13.1
0.8
0.8
0.8
0.8
0.8
0.8 0.8
0.8
0.8
0.8
0.8
0.8
0.8
4.3
4.5
4.4
4.5
4.5
3.8 3.8
4.3
4.4
4.4
4.7
4.8
4.4
7.8
7.9
8.0
7.9
7.9
7.9 7.6
7.8
8.0
8.1
8.1
8.1
7.9
2007 Final Series
Industry
Annual Jan Feb Mar Apr M AY Jun Jul Aug Sep Oct Nov Dec Average
Total Nonfarm
55.2 56.2 56.1 57.0 57.3 56.0 55.2 55.9 55.8 57.3 57.7 56.7 56.4
Total Private
43.2 43.7 43.6 44.5 44.7 44.1 43.9 44.0 43.6 44.2 44.5 43.5 44.0
Goods Producing
8.9
9.1
9.1
9.0
9.2
9.3 9.1
9.2
9.3
9.1
9.3
9.2
9.2
Service-Providing
46.3 47.1 47.0 48.0 48.1 46.7 46.1 46.7 46.5 48.2 48.4 47.5 47.2
Private Service-Providing
34.3 34.6 34.5 35.5 35.5 34.8 34.8 34.8 34.3 35.1 35.2 34.3 34.8
Trade, Transportation and Utilities
12.7 12.7 12.7 12.8 12.7 12.5 12.4 12.4 12.3 12.4 12.6 12.3 12.5
Retail Trade
9.3
9.2
9.2
9.2
9.1
9.0 8.8
8.8
8.7
8.8
8.9
8.7
9.0
Government
12.0 12.5 12.5 12.5 12.6 11.9 11.3 11.9 12.2 13.1 13.2 13.2 12.4
Federal Government
0.8
0.8
0.8
0.8
0.8
0.8 0.8
0.8
0.8
0.8
0.8
0.8
0.8
State Government
3.8
4.2
4.2
4.2
4.3
3.6 3.5
3.8
3.9
4.5
4.5
4.5
4.1
Local Government
7.4
7.5
7.5
7.5
7.5
7.5 7.0
7.3
7.5
7.8
7.9
7.9
7.5
Note: These preliminary estimates were prepared in cooperation with the U.S. Department of Labor, Bureau of Labor Statistics, based upon monthly reports submitted by selected employers in
the Valdosta Metropolitan Statistical Area, which includes Brooks, Echols, Lanier and Lowndes counties. The estimates include all full- and part-time wage and salary workers who were employed during or received pay for any part of the pay period that includes the twelfth of the month. Proprietors, domestic workers, self-employed persons, unpaid family workers and personnel of the armed forces are excluded. Estimates based on 2007 benchmark.
Source: Georgia Department of Labor, Workforce Information & Analysis
16
WARNER ROBINS MSA Nonagricultural Employment (000s)
Industry Total Nonfarm Total Private Goods Producing Service-Providing Private Service-Providing Trade, Transportation and Utilities Retail Trade Government Federal Government State Government Local Government
2008 Preliminary Series
Annual Jan Feb Mar Apr M ay Jun Jul Aug Sep Oct Nov Dec Average
58.8 58.6 58.6 58.6 58.9 59.0 58.6 59.2 58.7 59.1 58.6 58.0 58.7
35.8 35.5 35.5 35.4 35.8 35.7 35.9 36.1 35.4 35.5 35.1 34.6 35.5
7.2
7.1
7.1
6.9
7.0
6.9 6.9
6.9
6.8
6.7
6.6
6.5
6.9
51.6 51.5 51.5 51.7 51.9 52.1 51.7 52.3 51.9 52.4 52.0 51.5 51.8
28.6 28.4 28.4 28.5 28.8 28.8 29.0 29.2 28.6 28.8 28.5 28.1 28.6
8.1
8.1
8.0
7.9
7.9
7.9 8.1
8.1
8.0
8.0
8.0
8.0
8.0
6.4
6.4
6.3
6.3
6.3
6.2 6.3
6.3
6.2
6.2
6.3
6.3
6.3
23.0 23.1 23.1 23.2 23.1 23.3 22.7 23.1 23.3 23.6 23.5 23.4 23.2
14.2 14.2 14.2 14.2 14.2 14.3 14.3 14.3 14.4 14.4 14.4 14.4 14.3
0.9
1.0
1.0
1.1
1.0
1.0 1.0
1.1
1.0
1.2
1.0
0.9
1.0
7.9
7.9
7.9
7.9
7.9
8.0 7.4
7.7
7.9
8.0
8.1
8.1
7.9
2007 Final Series
Industry
Annual Jan Feb Mar Apr M ay Jun Jul Aug Sep Oct Nov Dec Average
Total Nonfarm
58.1 58.4 58.8 58.7 59.1 59.3 58.1 58.8 59.0 58.6 58.4 58.4 58.6
Total Private
36.0 36.1 36.5 36.4 36.7 36.6 36.1 36.3 36.2 35.6 35.5 35.4 36.1
Goods Producing
7.5
7.5
7.6
7.5
7.7
7.8 7.7
7.8
7.7
7.5
7.3
7.1
7.6
Service-Providing
50.6 50.9 51.2 51.2 51.4 51.5 50.4 51.0 51.3 51.1 51.1 51.3 51.1
Private Service-Providing
28.5 28.6 28.9 28.9 29.0 28.8 28.4 28.5 28.5 28.1 28.2 28.3 28.6
Trade, Transportation and Utilities
7.6
7.6
7.6
7.7
7.7
7.6 7.7
7.7
7.9
7.9
8.1
8.2
7.8
Retail Trade
6.3
6.2
6.2
6.2
6.2
6.2 6.3
6.2
6.4
6.4
6.7
6.7
6.3
Government
22.1 22.3 22.3 22.3 22.4 22.7 22.0 22.5 22.8 23.0 22.9 23.0 22.5
Federal Government
13.7 13.8 13.8 13.8 13.9 14.0 14.0 14.1 14.1 14.1 14.1 14.2 14.0
State Government
0.9
1.0
1.0
1.0
0.9
1.0 0.9
1.0
1.0
1.1
1.0
0.9
1.0
Local Government
7.5
7.5
7.5
7.5
7.6
7.7 7.1
7.4
7.7
7.8
7.8
7.9
7.6
Note: These preliminary estimates were prepared in cooperation with the U.S. Department of Labor, Bureau of Labor Statistics, based upon monthly reports submitted by selected employers in
the Warner Robins Metropolitan Statistical Area, which comprises Houston county. The estimates include all full- and part-time wage and salary workers who were employed during or received pay for any part of the pay period that includes the twelfth of the month. Proprietors, domestic workers, self-employed persons, unpaid family workers and personnel of the armed forces are excluded. Estimates based on 2008 benchmark.
Source: Georgia Department of Labor, Workforce Information & Analysis
17
MSA Nonagricultural Employment
2001 2008 Annual Average Employment
4,300,000
Georgia
4,200,000 4,100,000
4,145,500
4,089,100
4,102,500
4,000,000 3,900,000
3,943,200 3,869,500
3,844,900
4,001,200 3,898,500
3,800,000
3,700,000
2001
2002
2003
2004
2005
2006
2007
2008
65,900
65,200
64,500
63,800 63,100 62,400
63,100
62,500
61,700
2001
2002
Albany MSA
63,800
63,700
64,300
2003
2004
2005
64,600
64,700
64,200
2006
2007
2008
88,000
85,000
82,000
79,000 76,000 74,600 73,000
75,400
70,000
2001
2002
Athens MSA
76,600
76,900
79,100
2003
2004
2005
81,400
83,400
85,500
2006
2007
2008
2,600,000
Atlanta MSA
2,500,000 2,400,000 2,300,000
2,300,900 2,258,200
2,452,400 2,425,500
2,402,700
2,335,700
2,266,000 2,235,700
2,200,000
2,100,000
2,000,000
2001
2002
2003
2004
2005
2006
2007
2008
Augusta MSA
221,000
218,000
215,000
212,000
209,000 206,000
205,900
207,000
208,800
214,700 213,600
214,200
216,400
216,200
203,000
2001
2002
2003
2004
2005
2006
2007
2008
Columbus MSA
124,000
123,000
122,000 121,600
121,000 120,000
119,900
120,200
121,800 120,100
122,300
121,500 121,100
119,000
118,000
2001
2002
2003
2004
2005
2006
2007
2008
82,000
80,000
78,000 76,000
76,700
77,300
74,000
72,000
70,000
2001
2002
Dalton MSA
76,100
76,800
77,900
79,400
78,200
74,100
2003
2004
2005
2006
2007
2008
Gainesville MSA
84,000
80,000
76,000
72,000
68,000 64,000
65,600
65,200
68,000
68,500
70,600
73,600
77,300
78,000
60,000 2001
2002
2003
2004
2005
2006
2007
2008
18
MSA Nonagricultural Employment
2001 2008 Annual Average Employment
103,000
102,000
101,000
100,000 99,000
99,300
99,100
Macon MSA
100,300
101,300 101,300
100,800
100,900
102,000
98,000
97,000
2001
2002
2003
2004
2005
2006
2007
2008
166,000 160,000 154,000 148,000 142,000 136,000
135,200
136,900
Savannah MSA
155,900 149,800 144,300 136,900
161,400
159,500
130,000
2001
2002
2003
2004
2005
2006
2007
2008
59,000
57,000
55,000
53,000
51,000
50,400
49,000 48,400
47,000
2001
2002
Valdosta MSA
51,700
52,800
54,500
55,600
56,400
2003
2004
2005
2006
2007
56,600 2008
Warner Robins MSA
63,000
60,000
57,000
54,000
51,000 48,000
48,100
49,100
50,200
51,400
53,300
56,700
58,600
58,700
45,000
2001
2002
2003
2004
2005
2006
2007
2008
19
Industry Total Private Goods Producing Private Service Providing Construction Manufacturing Trade, Transportation, and Utilities Financial Activities Professional and Business Services Education and Health Services Leisure and Hospitality Other Services
Industry Total Private Goods Producing Private Service Providing Construction Manufacturing Trade, Transportation, and Utilities Financial Activities Professional and Business Services Education and Health Services Leisure and Hospitality Other Services
Industry Total Private Goods Producing Private Service Providing Construction Manufacturing Trade, Transportation, and Utilities Financial Activities Professional and Business Services Education and Health Services Leisure and Hospitality Other Services
20
Georgia Hours and Earnings
2008 Experimental All Employee*
Jan 20.19 18.78 20.57 18.69 19.03 19.02 23.76 26.13 20.35 12.43 14.59
AVERAGE HOURLY EARNINGS (AHE)
Feb 20.43 18.67 20.90 18.36 19.05 19.94 24.01 25.24 20.19 12.22 14.61
Mar 20.46 18.84 20.88 18.94 18.95 19.49 24.83 25.91 20.33 12.14 15.22
Apr 20.34 18.55 20.80 18.54 18.66 19.31 25.00 25.93 20.08 12.27 14.79
May 20.41 18.85 20.81 19.06 18.80 19.59 25.11 25.76 20.30 12.14 14.70
Jun 20.67 19.07 21.08 18.90 19.25 19.67 25.49 25.99 20.75 11.90 15.50
Jul 20.97 19.25 21.41 19.74 19.00 20.10 25.30 26.07 21.10 11.90 15.55
Aug 20.90 19.49 21.25 19.26 19.66 20.11 24.98 26.02 20.91 11.78 15.82
Sep 20.91 19.19 21.34 19.54 18.99 19.90 25.02 26.41 21.29 11.91 15.70
Oct 20.96 19.07 21.42 20.10 18.35 19.99 24.52 26.72 21.47 11.87 15.98
Nov 21.50 19.87 21.88 21.36 18.83 20.14 25.57 27.50 22.10 11.92 16.44
Dec Average 21.53 20.77 20.37 19.17 21.80 21.18 21.11 19.47 19.89 19.04 20.49 19.81 25.73 24.94 26.91 26.22 21.94 20.90 11.83 12.03 16.59 15.46
Jan 35.0 39.1 34.0 38.1 39.9 35.2 34.3 33.4 37.2 26.9 31.8
AVERAGE WEEKLY HOURS (AWH)
Feb Mar Apr May Jun Jul Aug Sep Oct Nov Dec Average 35.2 35.6 35.3 35.4 35.9 35.2 35.6 35.0 34.9 35.5 34.9 35.3 39.3 39.2 39.5 39.6 39.8 39.2 39.0 38.6 38.1 38.0 37.4 38.9 34.2 34.8 34.4 34.4 35.0 34.3 34.8 34.2 34.2 34.9 34.4 34.5 37.9 37.6 38.6 38.8 39.3 38.1 38.2 37.6 37.0 36.8 35.6 37.8 39.6 39.8 39.6 39.8 39.9 39.7 39.5 39.1 38.8 38.7 38.6 39.4 35.2 35.9 35.7 35.5 35.8 35.1 35.3 35.2 34.8 35.8 35.3 35.4 34.7 36.0 35.3 35.4 36.7 35.9 35.8 35.7 36.5 37.8 37.0 35.9 34.3 35.1 34.5 34.8 35.6 34.6 35.5 34.0 34.4 35.4 34.3 34.7 38.0 38.1 37.4 37.2 37.3 36.8 37.5 36.3 36.3 36.4 36.0 37.0 27.5 28.0 27.9 27.7 28.5 27.9 27.7 27.2 27.1 27.3 27.6 27.6 32.6 32.8 32.5 33.1 32.8 30.7 31.4 32.2 32.0 32.1 31.7 32.1
AVERAGE WEEKLY EARNINGS (AWE)
Jan
Feb Mar Apr May Jun Jul Aug Sep Oct Nov Dec Average
706.65 719.14 728.38 718.00 722.51 742.05 738.14 744.04 731.85 731.50 763.25 751.40 733.08
734.30 733.73 738.53 732.73 746.46 758.99 754.60 760.11 740.73 726.57 755.06 761.84 745.30
699.38 714.78 726.62 715.52 715.86 737.80 734.36 739.50 729.83 732.56 763.61 749.92 729.98
712.09 695.84 712.14 715.64 739.53 742.77 752.09 735.73 734.70 743.70 786.05 751.52 735.15
759.30 754.38 754.21 738.94 748.24 768.08 754.30 776.57 742.51 711.98 728.72 767.75 750.41
669.50 701.89 699.69 689.37 695.45 704.19 705.51 709.88 700.48 695.65 721.01 723.30 701.33
814.97 833.15 893.88 882.50 888.89 935.48 908.27 894.28 893.21 894.98 966.55 952.01 896.51
872.74 865.73 909.44 894.59 896.45 925.24 902.02 923.71 897.94 919.17 973.50 923.01 908.63
757.02 767.22 774.57 750.99 755.16 773.98 776.48 784.13 772.83 779.36 804.44 789.84 773.84
334.37 336.05 339.92 342.33 336.28 339.15 332.01 326.31 323.95 321.68 325.42 326.51 332.00
463.96 476.29 499.22 480.68 486.57 508.40 477.39 496.75 505.54 511.36 527.72 525.90 496.65
* See "Background/Plans" on next page
Georgia Hours and Earnings
Industry Total Private Goods Producing Private Service Providing Construction Manufacturing Trade, Transportation, and Utilities Financial Activities Professional and Business Services Education and Health Services Leisure and Hospitality Other Services
2007 Experimental All Employee*
Jan 20.07 18.47 20.52 18.61 20.19 19.31 25.47 25.98 20.14 11.92 16.06
AVERAGE HOURLY EARNINGS (AHE)
Feb 20.13 18.37 20.62 16.99 19.64 19.77 25.03 25.69 20.29 11.81 15.88
Mar 20.83 18.57 21.47 17.68 19.48 20.05 26.14 25.62 20.72 12.25 16.21
Apr 20.05 18.21 20.55 17.61 18.90 19.11 24.97 25.69 20.34 12.31 15.66
May 19.79 18.02 20.28 17.10 18.93 18.76 24.88 25.17 19.97 13.22 14.73
Jun 21.03 18.75 21.65 17.27 20.08 19.52 23.72 26.38 19.41 12.12 14.95
Jul 20.34 18.50 20.83 17.83 19.16 19.37 23.79 24.88 19.75 12.54 14.79
Aug 20.96 18.52 21.65 18.11 18.96 19.07 22.91 24.61 19.72 11.48 14.53
Sep 20.58 19.45 20.88 18.81 18.56 19.34 24.59 25.66 20.52 12.11 14.40
Oct 20.74 19.78 20.99 18.37 18.71 19.64 24.30 25.09 20.41 12.29 14.29
Nov 20.62 19.89 20.81 18.57 18.74 19.00 23.21 24.86 20.77 11.98 15.18
Dec 20.08 19.02 20.36 18.75 19.43 18.81 24.09 25.60 20.18 12.23 16.01
Average 20.43 18.80 20.88 17.98 19.23 19.31 24.43 25.44 20.18 12.19 15.22
Industry Total Private Goods Producing Private Service Providing Construction Manufacturing Trade, Transportation, and Utilities Financial Activities Professional and Business Services Education and Health Services Leisure and Hospitality Other Services
Jan 35.1 39.8 33.9 38.8 40.4 34.6 36.4 33.4 37.5 27.7 30.5
AVERAGE WEEKLY HOURS (AWH)
Feb Mar Apr May Jun Jul Aug Sep Oct Nov Dec Average 34.9 34.8 35.7 35.4 35.7 36.0 35.6 36.4 35.8 35.8 35.9 35.6 39.2 39.7 39.8 39.8 39.8 39.6 41.0 40.2 39.7 40.1 40.3 39.9 33.9 33.6 34.7 34.4 34.7 35.1 34.3 35.5 34.9 34.8 34.9 34.6 37.6 38.5 38.5 39.6 39.7 39.0 40.5 39.9 40.0 39.8 39.6 39.3 40.8 41.0 41.1 40.3 39.8 40.0 41.2 40.3 41.0 41.7 40.9 40.7 34.1 34.5 35.4 34.9 35.5 35.3 33.9 35.8 35.2 35.8 35.7 35.1 36.1 35.6 36.3 35.4 36.5 35.9 34.5 35.7 35.1 35.0 35.6 35.7 34.4 34.0 35.0 34.9 34.5 35.0 34.6 36.5 35.3 35.0 34.9 34.8 37.7 36.9 38.6 38.5 39.2 39.3 38.0 38.2 37.9 38.1 38.2 38.2 27.7 26.8 27.9 28.5 28.4 29.2 29.0 28.7 28.1 27.8 27.5 28.1 30.3 30.4 31.9 33.0 32.7 32.0 32.8 33.0 32.3 32.0 32.1 31.9
Industry Total Private Goods Producing Private Service Providing Construction Manufacturing Trade, Transportation, and Utilities Financial Activities Professional and Business Services Education and Health Services Leisure and Hospitality Other Services
AVERAGE WEEKLY EARNINGS (AWE)
Jan 704.46 735.11 695.63 722.07 815.68 668.13 927.11 867.73 755.25 330.18 489.83
Feb 702.54 720.10 699.02 638.82 801.31 674.16 903.58 883.74 764.93 327.14 481.16
Mar 724.88 737.23 721.39 680.68 798.68 691.73 930.58 871.08 764.57 328.30 492.78
Apr 715.79 724.76 713.09 677.99 776.79 676.49 906.41 899.15 785.12 343.45 499.55
May 700.57 717.20 697.63 677.16 762.88 654.72 880.75 878.43 768.85 376.77 486.09
Jun 750.77 746.25 751.26 685.62 799.18 692.96 865.78 910.11 760.87 344.21 488.87
Jul 732.24 732.60 731.13 695.37 766.40 683.76 854.06 870.80 776.18 366.17 473.28
Aug 746.18 759.32 742.60 733.46 781.15 646.47 790.40 851.51 749.36 332.92 476.58
Sep 749.11 781.89 741.24 750.52 747.97 692.37 877.86 936.59 783.86 347.56 475.20
Oct 742.49 785.27 732.55 734.80 767.11 691.33 852.93 885.68 773.54 345.35 461.57
Nov 738.20 797.59 724.19 739.09 781.46 680.20 812.35 870.10 791.34 333.04 485.76
Dec 720.87 766.51 710.56 742.50 794.69 671.52 857.60 893.44 770.88 336.33 513.92
Average 727.34 750.32 721.69 706.51 782.77 676.99 871.62 884.86 770.40 342.62 485.38
Background/Plans: Experimental All Employee Hours and Earnings
The Current Employment Statistics (CES) program began work in 2005 to add new series on hours and earnings. New series have been developed such as average hourly earnings and average weekly hours of all nonfarm private sector employees. Historically, the CES program has produced average hours and earnings series for such categories as production workers in the manufacturing industry and nonsupervisory workers in other industries. The new hours and earnings, covering all employees rather than just production or non-supervisory workers, are more comprehensive in coverage.
The release of these new series are designated "experimental" because of the limited experience to date with the editing and review of the sample reports and the resultant estimates. The experimental State series includes estimates at a total private sector level and limited industry detail.
By the end of 2009, BLS should have sufficient historical data to seasonally adjust the all employee payroll and hours series and is planning to publish them as official CES data in the Employment Situation news release and other BLS publications beginning in February 2010.
Read more about the experimental hours and earnings series at http://www.bls.gov/sae/saeaepp.htm
21
Industry Manufacturing Durable Goods Non-Durable Goods
Industry Manufacturing Durable Goods Non-Durable Goods
Industry Manufacturing Durable Goods Non-Durable Goods
Georgia Manufacturing Hours and Earnings
Jan 38.4 39.3 37.7
2008
AVERAGE WEEKLY HOURS (AWH)
Feb Mar Apr May Jun Jul Aug Sep Oct Nov Dec Average 39.3 39.7 39.1 39.3 39.9 39.9 39.8 39.5 38.9 39.4 39.0 39.4 40.1 40.4 39.6 40.3 40.1 39.4 39.1 39.2 39.1 39.6 38.8 39.6 38.6 39.2 38.7 38.4 39.7 40.4 40.3 39.8 38.7 39.2 39.2 39.1
Jan 14.91 16.07 13.88
AVERAGE HOURLY EARNINGS (AHE)
Feb Mar Apr May Jun Jul Aug Sep Oct Nov Dec Average 14.57 14.42 14.81 14.71 14.83 15.05 15.24 15.36 14.29 14.71 15.04 14.83 16.28 16.13 16.38 16.05 16.20 16.48 16.81 16.96 16.70 17.34 17.28 16.53 13.08 12.94 13.45 13.54 13.68 13.86 13.95 14.07 12.36 12.64 13.35 13.40
AVERAGE WEEKLY EARNINGS (AWE)
Jan
Feb Mar Apr May Jun Jul Aug Sep Oct Nov Dec Average
572.54 572.60 572.47 579.07 578.10 591.72 600.50 606.55 606.72 555.88 579.57 586.56 584.30
631.55 652.83 651.65 648.65 646.82 649.62 649.31 657.27 664.83 652.97 686.66 670.46 654.59
523.28 504.89 507.25 520.52 519.94 543.10 559.94 562.19 559.99 478.33 495.49 523.32 523.94
Industry Manufacturing Durable Goods Non-Durable Goods
Industry Manufacturing Durable Goods Non-Durable Goods
Industry Manufacturing Durable Goods Non-Durable Goods
22
Jan 38.6 39.5 37.9
2007
AVERAGE WEEKLY HOURS (AWH)
Feb Mar Apr May Jun Jul Aug Sep Oct Nov Dec Average 39.5 40.0 38.6 39.0 39.4 39.8 39.8 39.7 39.7 39.0 39.0 39.3 40.2 40.1 39.8 39.9 39.8 39.4 40.3 40.3 40.2 39.6 39.5 39.9 38.9 40.0 37.5 38.3 39.0 40.1 39.3 39.2 39.2 38.5 38.6 38.9
Jan 15.20 17.40 13.21
AVERAGE HOURLY EARNINGS (AHE)
Feb Mar Apr May Jun Jul Aug Sep Oct Nov Dec Average 14.43 14.68 14.79 14.76 14.97 14.97 15.02 15.02 14.89 14.97 14.83 14.88 16.14 15.82 15.76 15.83 16.16 15.91 16.19 16.30 16.13 16.04 15.93 16.13 12.89 13.70 13.89 13.79 13.92 14.17 13.99 13.89 13.81 14.03 13.87 13.77
AVERAGE WEEKLY EARNINGS (AWE)
Jan
Feb Mar Apr May Jun Jul Aug Sep Oct Nov Dec Average
586.72 569.99 587.20 570.89 575.64 589.82 595.81 597.80 596.29 591.13 583.83 578.37 584.78
687.30 648.83 634.38 627.25 631.62 643.17 626.85 652.46 656.89 648.43 635.18 629.24 643.59
500.66 501.42 548.00 520.88 528.16 542.88 568.22 549.81 544.49 541.35 540.16 535.38 535.65
Georgia Department of Labor Workforce Information & Analysis 148 Andrew Young International Boulevard, N.E. Atlanta, Georgia 30303-1751 Return Service Requested
23