- Collection:
- Georgia Government Publications
- Title:
- Dimensions: measuring Georgia's workforce, Vol. 34, no. 10 (Oct. 2008)
- Creator:
- Georgia. Department of Labor
- Contributor to Resource:
- Georgia. Workforce Information and Analysis
- Publisher:
- Atlanta, Ga. : Georgia Dept. of Labor, 2008-10
- Date of Original:
- 2008-10
- Subject:
- Labor market--Georgia--Statistics
Wages--Georgia--Statistics
Hours of labor--Georgia--Statistics - Location:
- United States, Georgia, 32.75042, -83.50018
- Medium:
- state government records
- Type:
- Text
- Format:
- application/pdf
- External Identifiers:
- Call Number GA L200.E46 P1 T7 34/10
- Metadata URL:
- https://dlg.galileo.usg.edu/id:dlg_ggpd_i-ga-bl200-pe46-bp1-bt7-b34-s10-belec-p-btext
- Digital Object URL:
- https://dlg.galileo.usg.edu/do:dlg_ggpd_i-ga-bl200-pe46-bp1-bt7-b34-s10-belec-p-btext
- Language:
- eng
- Holding Institution:
- University of Georgia. Map and Government Information Library
- Rights:
-

October 2008 Data
October 2008 Employment Situation
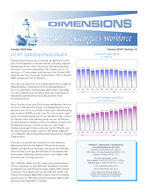
Nonfarm payrolls grew by 0.1 percent, an addition of 4,300 jobs, from September to October and the seasonally adjusted unemployment rate rose to 7.0 percent. The unemployment rate was 6.4 percent in September. The October rate of 7.0 percent is a 2.5 percentage point increase from October 2007 when the rate was 4.5 percent. From October 2007 to October 2008, Georgia has lost 61,300 jobs.
Over-the-year job losses were widespread but most evident in Manufacturing, Construction, Professional and Business Services, and Trade, Transportation and Utilities. The slight over-the-month growth was due in large part to job gains in Educational and Health Services and positions in the Government sector.
Since October of last year, Professional and Business Services has lost 13,200 payroll positions. The Employment Services portion of this sector lost 10,500 of those jobs. Manufacturing jobs are down 20,800 over-the-year. The loss is nearly equal in the two manufacturing sub-sectors: Durable Goods is down 10,700 jobs while Non-Durable Goods has lost 10,100 jobs. Construction jobs continue to fall as the industry has now lost 18,600 positions since October of last year. The Trade, Transportation and Utilities sector has lost 10,500 jobs overthe-year. Wholesale Trade is down 5,700, Retail Trade has lost 3,000 jobs, and Transportation and Utilities have dropped 1,800 workers.
Over-the-year growth has occurred in several industries. Educational Services has added 3,700 payroll positions. Health Care and Social Assistance has grown by 6,300 jobs since October a year ago and the Federal Government and Amusement, Gambling, Recreation have each added 1,900 new positions to Georgia payrolls.
The 4,300 jobs added over the month come as Educational Services positions are up 2,600 from September to October and Health Care and Social Assistance added 5,000 workers to payrolls. Government jobs are up 5,900 this month. The Federal Government added 800 workers, State Government payrolls grew by 500, and Local Governments added 4,600 positions from September to October.
Volume XXXIV, Number 10 Georgia Employment
(In Millions)
4.17 4.19 4.19 4.14 4.15 4.16 4.17 4.18 4.16 4.11 4.13 4.11 4.11
Oct Nov Dec Jan Feb Mar Apr May Jun Jul Aug Sep Oct
2007
2008
Georgia Unemployment Rate
(Seasonally adjusted)
4.5%
4.5%
4.5%
4.9%
5.1%
5.3%
5.3%
5.7%
5.6%
6.0%
6.3%
6.4%
7.0%
Oct Nov Dec Jan Feb Mar Apr May Jun Jul Aug Sep Oct
2007
2008
Michael L. Thurmond, Commissioner Georgia Department of Labor
Workforce Information & Analysis 148 Andrew Young International Blvd., N.E.
Atlanta, Georgia 30303-1751
For more information, contact Corey Smith at (404) 232-3875 ext. 21299 or
David Echols at (404)232-3875 ext. 21272
corey.smith@dol.state.ga.us
david.echols@dol.state.ga.us
Equal Opportunity Employer/Program Auxiliary Aids and Services Available upon
Request to Individuals with Disabilities
GEORGIA Nonagricultural Employment (000s)
Change in Jobs
Change in Jobs
Preliminary Revised
Revised
OCT 2008 SEP 2008 OCT 2007
from SEP 2008 Net %
from OCT 2007 Net %
Total Nonfarm
4,110.1
4,105.8
4,171.4
+4.3 +0.1
-61.3 -1.5
Total Private
3,426.5
3,428.1
3,486.4
-1.6 +0.0
-59.9 -1.7
Goods Producing
618.0
623.3
657.9
-5.3 -0.9
-39.9 -6.1
Service-Providing
3,492.1
3,482.5
3,513.5
+9.6 +0.3
-21.4 -0.6
Private Service-Providing
2,808.5
2,804.8
2,828.5
+3.7 +0.1
-20.0 -0.7
Natural Resources and Mining
11.3
11.3
11.8
+.0 +0.0
-.5 -4.2
Construction
202.6
205.1
221.2
-2.5 -1.2
-18.6 -8.4
Construction of Buildings
45.6
46.2
49.9
-.6 -1.3
-4.3 -8.6
Heavy and Civil Engineering Construction
30.8
31.8
34.0
-1.0 -3.1
-3.2 -9.4
Specialty Trade Contractors
126.2
127.1
137.3
-.9 -0.7
-11.1 -8.1
Manufacturing
404.1
406.9
424.9
-2.8 -0.7
-20.8 -4.9
Durable Goods
188.8
192.7
199.5
-3.9 -2.0
-10.7 -5.4
Computer, Electrical Equip and Appliance Mfg
27.8
27.4
28.1
+.4 +1.5
-.3 -1.1
Transportation Equipment Manufacturing
38.1
39.1
41.3
-1.0 -2.6
-3.2 -7.7
Non-Durable Goods
215.3
214.2
225.4
+1.1 +0.5
-10.1 -4.5
Food Manufacturing
66.0
65.5
66.8
+.5 +0.8
-.8 -1.2
Textile Mills
23.6
24.2
26.3
-.6 -2.5
-2.7 -10.3
Textile Product Mills
34.9
35.4
37.9
-.5 -1.4
-3.0 -7.9
Trade, Transportation and Utilities
885.2
883.4
895.7
+1.8 +0.2
-10.5 -1.2
Wholesale Trade
215.0
215.0
220.7
+.0 +0.0
-5.7 -2.6
Merchant Wholesalers, Durable Goods
110.2
110.6
113.5
-.4 -0.4
-3.3 -2.9
Merchant Wholesalers, Non-durable Goods
60.3
60.8
62.9
-.5 -0.8
-2.6 -4.1
Wholesale Electronic Markets and Agents and Brokers
44.5
43.6
44.3
+.9 +2.1
+.2 +0.5
Retail Trade
479.8
478.4
482.8
+1.4 +0.3
-3.0 -0.6
Food and Beverage Stores
80.7
81.3
82.5
-.6 -0.7
-1.8 -2.2
General Merchandise Stores
99.6
99.7
100.6
-.1 -0.1
-1.0 -1.0
Miscellaneous Store Retailers
24.2
23.7
24.2
+.5 +2.1
+.0 +0.0
Transportation, Warehousing, and Utilities
190.4
190.0
192.2
+.4 +0.2
-1.8 -0.9
Utilities
20.5
20.5
20.7
+.0 +0.0
-.2 -1.0
Transportation and Warehousing
169.9
169.5
171.5
+.4 +0.2
-1.6 -0.9
Air Transportation
36.6
36.8
38.9
-.2 -0.5
-2.3 -5.9
Truck Transportation
49.9
49.9
50.4
+.0 +0.0
-.5 -1.0
Couriers and Messengers
18.9
19.4
19.8
-.5 -2.6
-.9 -4.5
Warehousing and Storage
27.8
27.6
28.0
+.2 +0.7
-.2 -0.7
Information
115.5
115.0
115.0
+.5 +0.4
+.5 +0.4
Telecommunications
52.7
52.4
52.0
+.3 +0.6
+.7 +1.3
Wired Telecommunications Carriers
26.7
26.7
26.4
+.0 +0.0
+.3 +1.1
Wireless Telecommunications Carriers
13.1
13.1
12.5
+.0 +0.0
+.6 +4.8
Internet Service Providers, Search Portals, and DP
10.7
10.7
10.9
+.0 +0.0
-.2 -1.8
Financial Activities
226.4
226.5
229.9
-.1 +0.0
-3.5 -1.5
Finance and Insurance
161.9
162.2
165.5
-.3 -0.2
-3.6 -2.2
Insurance Carriers and Related Activities
66.4
65.8
66.5
+.6 +0.9
-.1 -0.2
Real Estate, Rental and Leasing
64.5
64.3
64.4
+.2 +0.3
+.1 +0.2
Professional and Business Services
553.3
554.3
566.5
-1.0 -0.2
-13.2 -2.3
Professional, Scientific, and Technical Services
219.7
218.7
219.5
+1.0 +0.5
+.2 +0.1
Accounting, Tax Preparation and Bookkeeping
27.9
26.9
27.0
+1.0 +3.7
+.9 +3.3
Architectural, Engineering and Related Services
40.1
40.2
41.1
-.1 -0.2
-1.0 -2.4
Computer Systems Design and Related Services
48.6
47.1
47.3
+1.5 +3.2
+1.3 +2.7
Management and Technical Consulting Services
31.4
31.3
30.4
+.1 +0.3
+1.0 +3.3
Management of Companies and Enterprises
53.4
53.2
53.9
+.2 +0.4
-.5 -0.9
Admin and Support, Waste Mngmnt and Remediation
280.2
282.4
293.1
-2.2 -0.8
-12.9 -4.4
Employment Services
133.0
135.7
143.5
-2.7 -2.0
-10.5 -7.3
Educational and Health Services
474.6
467.0
464.6
+7.6 +1.6
+10.0 +2.2
Educational Services
87.3
84.7
83.6
+2.6 +3.1
+3.7 +4.4
Colleges, Universities, and Professional Schools
51.2
49.6
51.3
+1.6 +3.2
-.1 -0.2
Health Care and Social Assistance
387.3
382.3
381.0
+5.0 +1.3
+6.3 +1.7
Ambulatory Health Care Services
145.8
142.8
143.6
+3.0 +2.1
+2.2 +1.5
Hospitals
127.4
127.4
124.7
+.0 +0.0
+2.7 +2.2
Nursing and Residential Care Facilities
55.3
55.3
55.9
+.0 +0.0
-.6 -1.1
Social Assistance
58.8
56.8
56.8
+2.0 +3.5
+2.0 +3.5
Leisure and Hospitality
392.2
398.1
396.0
-5.9 -1.5
-3.8 -1.0
Arts, Entertainment, and Recreation
41.9
43.5
40.9
-1.6 -3.7
+1.0 +2.4
Amusement, Gambling, and Recreation
31.1
32.2
29.2
-1.1 -3.4
+1.9 +6.5
Accommodation and Food Services
350.3
354.6
355.1
-4.3 -1.2
-4.8 -1.4
Accommodation
41.0
41.7
43.4
-.7 -1.7
-2.4 -5.5
Food Services and Drinking Places
309.3
312.9
311.7
-3.6 -1.2
-2.4 -0.8
Other Services
161.3
160.5
160.8
+.8 +0.5
+.5 +0.3
Repair and Maintenance
38.2
38.4
37.6
-.2 -0.5
+.6 +1.6
Personal and Laundry Services
34.5
34.6
35.1
-.1 -0.3
-.6 -1.7
Religious, Grantmaking, Civic, Professional and Similar
88.6
87.5
88.1
+1.1 +1.3
+.5 +0.6
Government
683.6
677.7
685.0
+5.9 +0.9
-1.4 -0.2
Federal Government
96.4
95.6
94.5
+.8 +0.8
+1.9 +2.0
Department of Defense
36.5
36.1
35.1
+.4 +1.1
+1.4 +4.0
State Government
161.3
160.8
161.5
+.5 +0.3
-.2 -0.1
State Government Education
77.6
75.3
76.3
+2.3 +3.1
+1.3 +1.7
Local Government
425.9
421.3
429.0
+4.6 +1.1
-3.1 -0.7
Local Government Education
260.5
256.9
264.9
+3.6 +1.4
-4.4 -1.7
Note: These preliminary estimates were prepared in cooperation with the U.S. Department of Labor, Bureau of Labor Statistics, based upon monthly reports submitted by selected employers
throughout Georgia. The estimates include all full- and part-time wage and salary workers who were employed during or received pay for any part of the pay period that includes the twelfth of the
month. Proprietors, domestic workers, self-employed persons, unpaid family workers and personnel of the armed forces are excluded. Estimates based on 2007 benchmark.
2
Source: Georgia Department of Labor, Workforce Information & Analysis
ATLANTA MSA Nonagricultural Employment (000s)
Preliminary
Revised
Revised
OCT 2008 SEP 2008 OCT 2007
Change in Jobs
from SEP 2008
Net
%
Change in Jobs from OCT 2007
Net %
Total Nonfarm Total Private Goods Producing Service-Providing Private Service-Providing Natural Resources and Mining Construction
Construction of Buildings Specialty Trade Contractors Manufacturing Durable Goods Transportation Equipment Manufacturing Non-Durable Goods Food Manufacturing Trade, Transportation and Utilities Wholesale Trade Merchant Wholesalers, Durable Goods Merchant Wholesalers, Non-durable Goods Wholesale Electronic Markets and Agents and Brokers Retail Trade Food and Beverage Stores General Merchandise Stores Miscellaneous Store Retailers Transportation, Warehousing, and Utilities Utilities Transportation and Warehousing
Air Transportation Truck Transportation Couriers and Messengers Information Telecommunications Wired Telecommunications Carriers Wireless Telecommunications Carriers Internet Service Providers, Search Portals, and DP Financial Activities Finance and Insurance Insurance Carriers and Related Activities Real Estate, Rental and Leasing Professional and Business Services Professional, Scientific, and Technical Services Accounting, Tax Preparation and Bookkeeping Architectural, Engineering and Related Services Computer Systems Design and Related Services Management and Technical Consulting Services Management of Companies and Enterprises Admin and Support, Waste Mngmnt and Remediation Employment Services Educational and Health Services Educational Services Health Care and Social Assistance Ambulatory Health Care Services Hospitals Social Assistance Leisure and Hospitality Arts, Entertainment, and Recreation Accommodation and Food Services Accommodation Food Services and Drinking Places Other Services Repair and Maintenance Personal and Laundry Services Government Federal Government State Government Local Government
2,434.7 2,100.6
293.9 2,140.8 1,806.7
2.4 126.7
27.0 78.3 164.8 84.3 14.0 80.5 25.3 557.3 157.4 82.9 40.9 33.6 271.9 50.1 52.4 15.8 128.0 11.4 116.6 36.8 29.6 15.4 88.1 37.8 21.5 10.6
9.6 159.3 112.5
46.2 46.8 404.5 169.3 18.3 30.2 39.9 27.5 40.6 194.6 90.7 267.1 58.8 208.3 80.7 66.7 34.7 233.2 27.4 205.8 22.8 183.0 97.2 21.2 23.8 334.1 46.0 68.9 219.2
2,434.1 2,103.0
297.2 2,136.9 1,805.8
2.4 128.1
29.5 79.4 166.7 87.5 14.5 79.2 25.0 556.6 157.3 83.2 41.1 33.0 270.8 50.2 52.3 15.7 128.5 11.4 117.1 36.8 29.7 15.8 88.0 37.4 21.4 10.6
9.6 158.7 111.9
46.1 46.8 406.0 169.6 18.0 30.5 38.7 27.6 40.8 195.6 90.4 262.6 57.7 204.9 78.7 66.5 34.4 236.8 28.6 208.2 23.1 185.1 97.1 21.4 23.9 331.1 45.5 68.7 216.9
2,479.5 2,142.9
317.9 2,161.6 1,825.0
2.5 140.1
31.6 87.7 175.3 91.5 15.8 83.8 25.6 566.1 161.3 85.1 41.5 34.7 274.2 50.2 53.2 15.8 130.6 11.1 119.5 38.1 30.6 15.8 88.0 37.8 21.6 10.3 10.3 161.8 114.9 46.0 46.9 414.3 171.3 18.2 31.3 38.9 26.7 41.3 201.7 95.3 259.0 56.4 202.6 78.9 65.3 33.5 236.5 27.0 209.5 24.2 185.3 99.3 21.6 23.5 336.6 44.2 72.0 220.4
+.6 -2.4 -3.3 +3.9 +.9 +.0 -1.4 -2.5 -1.1 -1.9 -3.2
-.5 +1.3
+.3 +.7 +.1 -.3 -.2 +.6 +1.1 -.1 +.1 +.1 -.5 +.0 -.5 +.0 -.1 -.4 +.1 +.4 +.1 +.0 +.0 +.6 +.6 +.1 +.0 -1.5 -.3 +.3 -.3 +1.2 -.1 -.2 -1.0 +.3 +4.5 +1.1 +3.4 +2.0 +.2 +.3 -3.6 -1.2 -2.4 -.3 -2.1 +.1 -.2 -.1 +3.0 +.5 +.2 +2.3
+0.0 -0.1 -1.1 +0.2 +0.0 +0.0 -1.1 -8.5 -1.4 -1.1 -3.7 -3.4 +1.6 +1.2 +0.1 +0.1 -0.4 -0.5 +1.8 +0.4 -0.2 +0.2 +0.6 -0.4 +0.0 -0.4 +0.0 -0.3 -2.5 +0.1 +1.1 +0.5 +0.0 +0.0 +0.4 +0.5 +0.2 +0.0 -0.4 -0.2 +1.7 -1.0 +3.1 -0.4 -0.5 -0.5 +0.3 +1.7 +1.9 +1.7 +2.5 +0.3 +0.9 -1.5 -4.2 -1.2 -1.3 -1.1 +0.1 -0.9 -0.4 +0.9 +1.1 +0.3 +1.1
-44.8 -42.3 -24.0 -20.8 -18.3
-.1 -13.4
-4.6 -9.4 -10.5 -7.2 -1.8 -3.3
-.3 -8.8 -3.9 -2.2
-.6 -1.1 -2.3
-.1 -.8 +.0 -2.6 +.3 -2.9 -1.3 -1.0 -.4 +.1 +.0 -.1 +.3 -.7 -2.5 -2.4 +.2 -.1 -9.8 -2.0 +.1 -1.1 +1.0 +.8 -.7 -7.1 -4.6 +8.1 +2.4 +5.7 +1.8 +1.4 +1.2 -3.3 +.4 -3.7 -1.4 -2.3 -2.1 -.4 +.3 -2.5 +1.8 -3.1 -1.2
-1.8 -2.0 -7.5 -1.0 -1.0 -4.0 -9.6 -14.6 -10.7 -6.0 -7.9 -11.4 -3.9 -1.2 -1.6 -2.4 -2.6 -1.4 -3.2 -0.8 -0.2 -1.5 +0.0 -2.0 +2.7 -2.4 -3.4 -3.3 -2.5 +0.1 +0.0 -0.5 +2.9 -6.8 -1.5 -2.1 +0.4 -0.2 -2.4 -1.2 +0.5 -3.5 +2.6 +3.0 -1.7 -3.5 -4.8 +3.1 +4.3 +2.8 +2.3 +2.1 +3.6 -1.4 +1.5 -1.8 -5.8 -1.2 -2.1 -1.9 +1.3 -0.7 +4.1 -4.3 -0.5
Note: These preliminary estimates were prepared in cooperation with the U.S. Department of Labor, Bureau of Labor Statistics, based upon monthly reports submitted by selected employers
in the Atlanta Metropolitan Statistical Area, which includes Barrow, Bartow, Butts, Carroll, Cherokee, Clayton, Cobb, Coweta, Dawson, DeKalb, Douglas, Fayette, Forsyth, Fulton, Gwinnett, Haralson, Heard, Henry, Jasper, Lamar, Meriwether, Newton, Paulding, Pickens, Pike, Rockdale, Spalding and Walton counties. The estimates include all full- and part-time wage and salary workers who were employed during or received pay for any part of the pay period that includes the twelfth of the month. Proprietors, domestic workers, self-employed persons, unpaid family workers and personnel of the armed forces are excluded. Estimates based on 2007 benchmark.
Source: Georgia Department of Labor, Workforce Information & Analysis
3
ALBANY MSA Nonagricultural Employment (000s)
Preliminary
Revised
Revised
OCT 2008 SEP 2008 OCT 2007
Change in Jobs from SEP 2008
Net %
Change in Jobs
from OCT 2007
Net
%
Total Nonfarm Total Private
64.1
63.9
64.5
50.0
49.9
50.4
+.2 +0.3 +.1 +0.2
-.4 -0.6 -.4 -0.8
Goods Producing Service-Providing Private Service-Providing
9.8
9.9
9.8
54.3
54.0
54.7
40.2
40.0
40.6
-.1 -1.0 +.3 +0.6 +.2 +0.5
+.0 +0.0 -.4 -0.7 -.4 -1.0
Manufacturing Trade, Transportation and Utilities Retail Trade
6.5
6.6
6.6
12.8
12.8
13.4
7.8
7.8
8.0
-.1 -1.5 +.0 +0.0 +.0 +0.0
-.1 -1.5 -.6 -4.5 -.2 -2.5
Government Federal Government State Government
14.1
14.0
14.1
3.1
3.1
3.1
3.0
2.9
3.0
+.1 +0.7 +.0 +0.0 +.1 +3.4
+.0 +0.0 +.0 +0.0 +.0 +0.0
Local Government
8.0
8.0
8.0
+.0 +0.0
+.0 +0.0
Note: These preliminary estimates were prepared in cooperation with the U.S. Department of Labor, Bureau of Labor Statistics, based upon monthly reports submitted by selected employers
in the Albany Metropolitan Statistical Area, which includes Baker, Dougherty, Lee, Terrell and Worth counties. The estimates include all full- and part-time wage and salary workers who were employed during or received pay for any part of the pay period that includes the twelfth of the month. Proprietors, domestic workers, self-employed persons, unpaid family workers and personnel
of the armed forces are excluded. Estimates based on 2007 benchmark.
ATHENS - CLARKE MSA Nonagricultural Employment (000s)
Preliminary
Revised
Revised
OCT 2008 SEP 2008 OCT 2007
Change in Jobs
from SEP 2008
Net
%
Change in Jobs from OCT 2007
Net %
Total Nonfarm
84.2
84.1
83.7
+.1 +0.1
+.5 +0.6
Total Private
61.0
60.8
60.7
+.2 +0.3
+.3 +0.5
Goods Producing
12.1
12.2
12.6
-.1 -0.8
-.5 -4.0
Service-Providing
72.1
71.9
71.1
+.2 +0.3
+1.0 +1.4
Private Service-Providing
48.9
48.6
48.1
+.3 +0.6
+.8 +1.7
Trade, Transportation and Utilities
13.9
13.7
13.9
+.2 +1.5
+.0 +0.0
Retail Trade
9.4
9.4
9.6
+.0 +0.0
-.2 -2.1
Professional and Business Services
6.8
6.9
6.9
-.1 -1.4
-.1 -1.4
Leisure and Hospitality
8.7
8.7
8.8
+.0 +0.0
-.1 -1.1
Government
23.2
23.3
23.0
-.1 -0.4
+.2 +0.9
Federal Government
1.6
1.6
1.6
+.0 +0.0
+.0 +0.0
State Government
13.6
13.6
13.7
+.0 +0.0
-.1 -0.7
Local Government
8.0
8.1
7.7
-.1 -1.2
+.3 +3.9
Note: These preliminary estimates were prepared in cooperation with the U.S. Department of Labor, Bureau of Labor Statistics, based upon monthly reports submitted by selected employers in
the Athens - Clarke County Metropolitan Statistical Area, which includes Clarke, Madison, Oconee and Oglethorpe counties. The estimates include all full- and part-time wage and salary workers who were employed during or received pay for any part of the pay period that includes the twelfth of the month. Proprietors, domestic workers, self-employed persons, unpaid family workers and personnel of the armed forces are excluded. Estimates based on 2007 benchmark.
Source: Georgia Department of Labor, Workforce Information & Analysis
4
AUGUSTA-RICHMOND MSA Nonagricultural Employment (000s)
Preliminary Revised Revised OCT 2008 SEP 2008 OCT 2007
Change in Jobs from SEP 2008
Net %
Change in Jobs from OCT 2007
Net %
Total Nonfarm Total Private Goods Producing Service-Providing Private Service-Providing Natural Resources, Mining and Construction Manufacturing Trade, Transportation and Utilities
Wholesale Trade Retail Trade Transportation,Warehousing, and Utilities Information Financial Activitities Professional and Business Services Educational and Health Services Leisure and Hospitality Other Services Government Federal Government State Government Local Government
214.4 171.9
36.6 177.8 135.3
13.6 23.0 37.2
5.2 25.2
6.8 3.6 7.5 29.2 28.5 20.4 8.9 42.5 7.7 13.0 21.8
214.9 172.6
36.9 178.0 135.7
13.8 23.1 36.9
5.3 24.9
6.7 3.7 7.4 29.7 28.3 20.8 8.9 42.3 7.6 13.0 21.7
217.0 174.9
38.2 178.8 136.7
14.3 23.9 37.5
5.3 25.4
6.8 3.9 7.4 30.3 28.1 20.8 8.7 42.1 7.5 12.6 22.0
-.5 -0.2 -.7 -0.4 -.3 -0.8 -.2 -0.1 -.4 -0.3 -.2 -1.4 -.1 -0.4 +.3 +0.8 -.1 -1.9 +.3 +1.2 +.1 +1.5 -.1 -2.7 +.1 +1.4 -.5 -1.7 +.2 +0.7 -.4 -1.9 +.0 +0.0 +.2 +0.5 +.1 +1.3 +.0 +0.0 +.1 +0.5
-2.6 -1.2 -3.0 -1.7 -1.6 -4.2 -1.0 -0.6 -1.4 -1.0
-.7 -4.9 -.9 -3.8 -.3 -0.8 -.1 -1.9 -.2 -0.8 +.0 +0.0 -.3 -7.7 +.1 +1.4 -1.1 -3.6 +.4 +1.4 -.4 -1.9 +.2 +2.3 +.4 +1.0 +.2 +2.7 +.4 +3.2 -.2 -0.9
Note: These preliminary estimates were prepared in cooperation with the U.S. Department of Labor, Bureau of Labor Statistics, based upon monthly reports submitted by selected employers in the
Augusta - Richmond County Metropolitan Statistical Area, which includes Burke, Columbia, McDuffie and Richmond counties in Georgia and Aiken and Edgefield counties in South Carolina. The estimates include all full- and part-time wage and salary workers who were employed during or received pay for any part of the pay period that includes the twelfth of the month. Proprietors, domestic
workers, self-employed persons, unpaid family workers and personnel of the armed forces are excluded. Estimates based on 2007 benchmark.
COLUMBUS MSA Nonagricultural Employment (000s)
Preliminary Revised Revised OCT 2008 SEP 2008 OCT 2007
Change in Jobs from SEP 2008
Net %
Change in Jobs from OCT 2007
Net %
Total Nonfarm Total Private Goods Producing
120.1 97.2 15.8
120.8 98.2 16.0
122.0 99.3 16.7
-.7 -0.6 -1.0 -1.0
-.2 -1.3
-1.9 -1.6 -2.1 -2.1
-.9 -5.4
Service-Providing Private Service-Providing Trade, Transportation and Utilities
104.3 81.4 18.2
104.8 82.2 18.4
105.3 82.6 18.6
-.5 -0.5 -.8 -1.0 -.2 -1.1
-1.0 -0.9 -1.2 -1.5
-.4 -2.2
Retail Trade Information Financial Activities
13.6
13.7
14.0
5.9
5.8
5.9
9.5
9.4
9.4
-.1 -0.7 +.1 +1.7 +.1 +1.1
-.4 -2.9 +.0 +0.0 +.1 +1.1
Finance and Insurance Insurance Carriers and Related Activities Professional and Business Services
7.6
7.4
7.5
5.0
5.0
5.0
14.0
14.1
14.6
+.2 +2.7 +.0 +0.0 -.1 -0.7
+.1 +1.3 +.0 +0.0 -.6 -4.1
Leisure and Hospitality Government
Federal Government
13.0
13.2
13.5
22.9
22.6
22.7
5.5
5.4
5.4
-.2 -1.5 +.3 +1.3 +.1 +1.9
-.5 -3.7 +.2 +0.9 +.1 +1.9
State Government Local Government
4.1
4.0
4.1
13.3
13.2
13.2
+.1 +2.5 +.1 +0.8
+.0 +0.0 +.1 +0.8
Note: These preliminary estimates were prepared in cooperation with the U.S. Department of Labor, Bureau of Labor Statistics, based upon monthly reports submitted by selected
employers in the Columbus Metropolitan Statistical Area, which includes Chattahoochee, Harris, Marion and Muscogee counties in Georgia and Russell County in Alabama. The estimates include all full- and part-time wage and salary workers who were employed during or received pay for any part of the pay period that includes the twelfth of the month. Proprietors, domestic
workers, self-employed persons, unpaid family workers and personnel of the armed forces are excluded. Estimates based on 2007 benchmark.
5
DALTON MSA Nonagricultural Employment (000s)
Preliminary Revised
Revised
OCT 2008 SEP 2008 OCT 2007
Change in Jobs from SEP 2008
Net %
Change in Jobs from OCT 2007
Net %
Total Nonfarm
75.1
75.7
78.0
-.6 -0.8
-2.9 -3.7
Total Private Goods Producing
67.7
68.2
70.4
28.9
29.6
31.1
-.5 -0.7 -.7 -2.4
-2.7 -3.8 -2.2 -7.1
Service-Providing
46.2
46.1
46.9
+.1 +0.2
-.7 -1.5
Private Service-Providing Manufacturing
38.8
38.6
27.5
28.0
39.3 28.9
+.2 +0.5 -.5 -1.8
-.5 -1.3 -1.4 -4.8
Textile Mills
3.1
3.1
3.4
+.0 +0.0
-.3 -8.8
Textile Product Mills Trade, Transportation and Utilities
18.9
19.3
15.6
15.6
19.8 15.8
-.4 -2.1 +.0 +0.0
-.9 -4.5 -.2 -1.3
Retail Trade
7.6
7.6
7.9
+.0 +0.0
-.3 -3.8
Transportation, Warehouse, and Utilities Professional and Business Services
3.5
3.4
10.3
10.3
3.6 10.4
+.1 +2.9 +.0 +0.0
-.1 -2.8 -.1 -1.0
Government
7.4
7.5
7.6
-.1 -1.3
-.2 -2.6
Federal Government State Government
.3
.3
1.2
1.2
.3
+.0 +0.0
1.2
+.0 +0.0
+.0 +0.0 +.0 +0.0
Local Government
5.9
6.0
6.1
-.1 -1.7
-.2 -3.3
Note: These preliminary estimates were prepared in cooperation with the U.S. Department of Labor, Bureau of Labor Statistics, based upon monthly reports submitted by selected employers
in the Dalton Metropolitan Statistical Area, which includes Murray and Whitfield counties. The estimates include all full- and part-time wage and salary workers who were employed during or received pay for any part of the pay period that includes the twelfth of the month. Proprietors, domestic workers, self-employed persons, unpaid family workers and personnel of the armed forces are excluded. Estimates based on 2007 benchmark.
Source: Georgia Department of Labor, Workforce Information & Analysis
GAINESVILLE MSA Nonagricultural Employment (000s)
Preliminary Revised
Revised
OCT 2008 SEP 2008 OCT 2007
Change in Jobs from SEP 2008
Net %
Change in Jobs from OCT 2007
Net %
Total Nonfarm
77.5
77.5
77.6
+.0 +0.0
-.1 -0.1
Total Private Goods Producing
66.4
66.6
67.0
21.2
21.4
22.0
-.2 -0.3 -.2 -0.9
-.6 -0.9 -.8 -3.6
Service-Providing
56.3
56.1
55.6
+.2 +0.4
+.7 +1.3
Private Service-Providing Trade, Transportation and Utilities
45.2
45.2
13.4
13.6
45.0 13.6
+.0 +0.0 -.2 -1.5
+.2 +0.4 -.2 -1.5
Retail Trade
7.5
7.5
7.5
+.0 +0.0
+.0 +0.0
Government Federal Government
11.1
10.9
10.6
.5
.5
.5
+.2 +1.8 +.0 +0.0
+.5 +4.7 +.0 +0.0
State Government
2.8
2.7
2.8
+.1 +3.7
+.0 +0.0
Local Government
7.8
7.7
7.3
+.1 +1.3
+.5 +6.8
Note: These preliminary estimates were prepared in cooperation with the U.S. Department of Labor, Bureau of Labor Statistics, based upon monthly reports submitted by selected employers
in the Gainesville Metropolitan Statistical Area, which comprises Hall county. The estimates include all full- and part-time wage and salary workers who were employed during or received pay for any part of the pay period that includes the twelfth of the month. Proprietors, domestic workers, self-employed persons, unpaid family workers and personnel of the armed forces are excluded.
Estimates based on 2007 benchmark.
6
MACON MSA Nonagricultural Employment (000s)
Preliminary Revised
Revised
OCT 2008 SEP 2008 OCT 2007
Change in Jobs from SEP 2008
Net %
Change in Jobs from OCT 2007
Net %
Total Nonfarm Total Private Goods Producing Service-Providing Private Service-Providing Trade Transportation and Utilities
Retail Trade Transportation, Warehousing, and Utilities Financial Activities Professional and Business Services Educational and Health Services Leisure and Hospitality Government Federal Government State Government Local Government
100.7 85.2 11.3 89.4 73.9 20.0 12.1 4.0 8.3 11.0 19.0 8.8 15.5 1.3 3.6 10.6
99.9
100.8
84.6
84.9
11.5
12.0
88.4
88.8
73.1
72.9
19.8
20.0
12.1
12.3
4.0
4.0
8.2
8.2
11.1
11.3
18.8
18.7
8.9
9.1
15.3
15.9
1.3
1.4
3.6
4.0
10.4
10.5
+.8 +.6 -.2 +1.0 +.8 +.2 +.0 +.0 +.1 -.1 +.2 -.1 +.2 +.0 +.0 +.2
+0.8 +0.7 -1.7 +1.1 +1.1 +1.0 +0.0 +0.0 +1.2 -0.9 +1.1 -1.1 +1.3 +0.0 +0.0 +1.9
-.1 +.3 -.7 +.6 +1.0 +.0 -.2 +.0 +.1 -.3 +.3 -.3 -.4 -.1 -.4 +.1
-0.1 +0.4 -5.8 +0.7 +1.4 +0.0 -1.6 +0.0 +1.2 -2.7 +1.6 -3.3 -2.5 -7.1 -10.0 +1.0
Note: These preliminary estimates were prepared in cooperation with the U.S. Department of Labor, Bureau of Labor Statistics, based upon monthly reports submitted by selected employers
in the Macon Metropolitan Statistical Area, which includes Bibb, Crawford, Jones, Monroe and Twiggs counties. The estimates include all full- and part-time wage and salary workers who were employed during or received pay for any part of the pay period that includes the twelfth of the month. Proprietors, domestic workers, self-employed persons, unpaid family workers and personnel
of the armed forces are excluded. Estimates based on 2007 benchmark.
SAVANNAH MSA Nonagricultural Employment (000s)
Preliminary Revised
Revised
OCT 2008 SEP 2008 OCT 2007
Change in Jobs from SEP 2008
Net %
Change in Jobs
from OCT 2007
Net
%
Total Nonfarm Total Private Goods Producing Service-Providing Private Service-Providing Natural Resources, Mining and Construction Manufacturing Trade, Transportation and Utilities
Wholesale Trade Retail Trade Transportation, Warehousing, and Utilities Information Financial Activities Professional and Business Services Educational and Health Services Leisure and Hospitality Other Services Government Federal Government State Government Local Government
160.4 138.5
23.8 136.6 114.7
9.3 14.5 36.5
6.7 18.6 11.2
1.9 6.2 19.2 22.5 20.4 8.0 21.9 2.8 4.1 15.0
160.4 139.0
24.0 136.4 115.0
9.5 14.5 36.6
6.7 18.6 11.3
1.9 6.1 19.3 22.3 20.8 8.0 21.4 2.8 4.0 14.6
162.4 141.1
25.1 137.3 116.0
10.1 15.0 36.7
6.7 18.3 11.7
2.0 6.1 19.8 22.3 20.9 8.2 21.3 2.9 4.1 14.3
+.0 +0.0 -.5 -0.4 -.2 -0.8 +.2 +0.1 -.3 -0.3 -.2 -2.1 +.0 +0.0 -.1 -0.3 +.0 +0.0 +.0 +0.0 -.1 -0.9 +.0 +0.0 +.1 +1.6 -.1 -0.5 +.2 +0.9 -.4 -1.9 +.0 +0.0 +.5 +2.3 +.0 +0.0 +.1 +2.5 +.4 +2.7
-2.0 -1.2 -2.6 -1.8 -1.3 -5.2
-.7 -0.5 -1.3 -1.1
-.8 -7.9 -.5 -3.3 -.2 -0.5 +.0 +0.0 +.3 +1.6 -.5 -4.3 -.1 -5.0 +.1 +1.6 -.6 -3.0 +.2 +0.9 -.5 -2.4 -.2 -2.4 +.6 +2.8 -.1 -3.4 +.0 +0.0 +.7 +4.9
Note: These preliminary estimates were prepared in cooperation with the U.S. Department of Labor, Bureau of Labor Statistics, based upon monthly reports submitted by selected employers
in the Savannah Metropolitan Statistical Area, which includes Bryan, Chatham and Effingham counties. The estimates include all full- and part-time wage and salary workers who were employed during or received pay for any part of the pay period that includes the twelfth of the month. Proprietors, domestic workers, self-employed persons, unpaid family workers and personnel of the armed
forces are excluded. Estimates based on 2007 benchmark.
7
VALDOSTA MSA Nonagricultural Employment (000s)
Preliminary Revised
Revised
OCT 2008 SEP 2008 OCT 2007
Change in Jobs from SEP 2008
Net %
Change in Jobs
from OCT 2007
Net
%
Total Nonfarm Total Private Goods Producing Service-Providing Private Service-Providing Trade, Transportation and Utilities
Retail Trade Government
Federal Government State Government Local Government
55.5
55.3
42.9
42.7
8.5
8.7
47.0
46.6
34.4
34.0
12.6
12.6
9.0
9.0
12.6
12.6
.8
.8
4.0
4.0
7.8
7.8
56.7 44.3
9.2 47.5 35.1 12.9
9.3 12.4
.8 4.0 7.6
+.2 +0.4 +.2 +0.5 -.2 -2.3 +.4 +0.9 +.4 +1.2 +.0 +0.0 +.0 +0.0 +.0 +0.0 +.0 +0.0 +.0 +0.0 +.0 +0.0
-1.2 -2.1 -1.4 -3.2
-.7 -7.6 -.5 -1.1 -.7 -2.0 -.3 -2.3 -.3 -3.2 +.2 +1.6 +.0 +0.0 +.0 +0.0 +.2 +2.6
Note: These preliminary estimates were prepared in cooperation with the U.S. Department of Labor, Bureau of Labor Statistics, based upon monthly reports submitted by selected employers
in the Valdosta Metropolitan Statistical Area, which includes Brooks, Echols, Lanier and Lowndes counties. The estimates include all full- and part-time wage and salary workers who were employed during or received pay for any part of the pay period that includes the twelfth of the month. Proprietors, domestic workers, self-employed persons, unpaid family workers and personnel of the armed forces are excluded. Estimates based on 2007 benchmark.
Source: Georgia Department of Labor, Workforce Information & Analysis
WARNER ROBINS MSA Nonagricultural Employment (000s)
Preliminary Revised
Revised
OCT 2008 SEP 2008 OCT 2007
Change in Jobs from SEP 2008
Net %
Change in Jobs
from OCT 2007
Net
%
Total Nonfarm Total Private Goods Producing Service-Providing Private Service-Providing Trade, Transportation and Utilities
Retail Trade Government
Federal Government State Government Local Government
58.7
58.3
35.3
35.0
7.0
7.1
51.7
51.2
28.3
27.9
7.9
7.9
6.3
6.3
23.4
23.3
14.4
14.4
1.3
1.2
7.7
7.7
59.2 36.2
7.6 51.6 28.6
7.9 6.4 23.0 14.1 1.2 7.7
+.4 +0.7 +.3 +0.9 -.1 -1.4 +.5 +1.0 +.4 +1.4 +.0 +0.0 +.0 +0.0 +.1 +0.4 +.0 +0.0 +.1 +8.3 +.0 +0.0
-.5 -0.8 -.9 -2.5 -.6 -7.9 +.1 +0.2 -.3 -1.0 +.0 +0.0 -.1 -1.6 +.4 +1.7 +.3 +2.1 +.1 +8.3 +.0 +0.0
Note: These preliminary estimates were prepared in cooperation with the U.S. Department of Labor, Bureau of Labor Statistics, based upon monthly reports submitted by selected employers
in the Warner Robins Metropolitan Statistical Area, which comprises Houston county. The estimates include all full- and part-time wage and salary workers who were employed during or received pay for any part of the pay period that includes the twelfth of the month. Proprietors, domestic workers, self-employed persons, unpaid family workers and personnel of the armed forces are excluded. Estimates based on 2007 benchmark.
Source: Georgia Department of Labor, Workforce Information & Analysis
8
Georgia Hours and Earnings
Experimental All Employee
Average Weekly Earnings
Preliminary OCT 2008
Revised SEP 2008
Revised OCT 2007
Total Private ............................................................................................ $738.15 ........................ $731.85 ................... $742.49 Goods Producing ................................................................................... $732.56 ........................ $740.73 ................... $785.27 Private Service Providing ....................................................................... $739.60 ........................ $729.83 ................... $732.55 Construction ........................................................................................... $740.95 ........................ $734.70 ................... $734.80 Manufacturing ......................................................................................... $726.14 ........................ $742.51 .................... $767.11 Trade, Transportation, and Utilities ........................................................ $690.00 ........................ $700.48 ................... $691.33 Financial Activities .................................................................................. $908.23 ........................ $893.21 ................... $852.93 Professional and Business Services ...................................................... $950.69 ........................ $897.94 ................... $885.68 Educational and Health Services ........................................................... $772.71 ........................ $772.83 ................... $773.54 Leisure and Hospitality ........................................................................... $320.59 ........................ $323.95 ................... $345.35 Other Services ........................................................................................ $503.33 ........................ $505.54 ................... $461.57
Average Weekly Hours
Preliminary OCT 2008
Revised SEP 2008
Revised OCT 2007
Total Private .................................................................................................. 35.0 .............................. 35.0 ......................... 35.8 Goods Producing ......................................................................................... 37.8 .............................. 38.6 ......................... 39.7 Private Service Providing ............................................................................. 34.4 .............................. 34.2 ......................... 34.9 Construction ................................................................................................. 36.9 .............................. 37.6 ......................... 40.0 Manufacturing ............................................................................................... 38.4 .............................. 39.1 ......................... 41.0 Trade, Transportation, and Utilities .............................................................. 34.5 .............................. 35.2 ......................... 35.2 Financial Activities ........................................................................................ 36.3 .............................. 35.7 ......................... 35.1 Professional and Business Services ............................................................ 35.7 .............................. 34.0 ......................... 35.3 Educational and Health Services ................................................................. 36.5 .............................. 36.3 ......................... 37.9 Leisure and Hospitality ................................................................................. 27.1 .............................. 27.2 ......................... 28.1 Other Services .............................................................................................. 32.1 .............................. 32.2 ......................... 32.3
Average Hourly Earnings
Preliminary OCT 2008
Revised SEP 2008
Revised OCT 2007
Total Private .............................................................................................. $21.09 .......................... $20.91 ..................... $20.74 Goods Producing ..................................................................................... $19.38 .......................... $19.19 ..................... $19.78 Private Service Providing ......................................................................... $21.50 .......................... $21.34 ..................... $20.99 Construction ............................................................................................. $20.08 .......................... $19.54 ..................... $18.37 Manufacturing ........................................................................................... $18.91 .......................... $18.99 ..................... $18.71 Trade, Transportation, and Utilities .......................................................... $20.00 .......................... $19.90 ..................... $19.64 Financial Activities .................................................................................... $25.02 .......................... $25.02 ..................... $24.30 Professional and Business Services ........................................................ $26.63 .......................... $26.41 ..................... $25.09 Educational and Health Services ............................................................. $21.17 .......................... $21.29 ..................... $20.41 Leisure and Hospitality ............................................................................. $11.83 .......................... $11.91 ..................... $12.29 Other Services .......................................................................................... $15.68 .......................... $15.70 ..................... $14.29
The Current Employment Statistics (CES) program began work in 2005 to add new series on hours and earnings. New series have been developed such as average hourly earnings and average weekly hours of all nonfarm private sector employees. Historically, the CES program has produced average hours and earnings series for such categories as production workers in the manufacturing industry and nonsupervisory workers in other industries. The new hours and earnings, covering all employees rather than just production or non-supervisory workers, are more comprehensive in coverage.
The release of these new series are designated "experimental" because of the limited experience to date with the editing and review of the sample reports and the resultant estimates. The experimental State series, being released in October 2008, includes estimates at a total private sector level and limited industry detail.
Read more about the experimental hours and earnings series at http://www.bls.gov/sae/saeaepp.htm
9
Dimensions - Measuring Georgia's Labor Force
Unemployment rates -- Georgia and U.S.
(Seasonally Adjusted)
6.5%
Ge orgia
U.S.
5.5%
4.5%
3.5%
Oct Nov Dec Jan Feb Mar Apr May Jun Jul Aug Sep Oct
2007
2008
WA 6.3
OR
7.3
ID
5.3
NV
7.6
UT
CA
3.5
8.2
AZ 6.1
AK 7.4
MT 4.8
WY 3.3
CO 5.7
NM 4.4
HI 4.5
October 2008
National Unemployment Rate: 6.5% Rates are seasonally adjusted
ND 3.4
SD 3.3
NE 3.6
KS 4.9
MN 6.0
WI 5.1
IA 4.4
IL 7.3
MO 6.5
OK 4.3
TX 5.6
AR 5.4
MS 7.2
LA 5.5
NH
4.1 ME
VT
5.7
5.2
MI 9.3
OH
IN
7.3
6.4
KY 6.8
TN 7.0
PA 5.8
WV
4.7
VA
4.4
NC 7.0
SC 8.0
AL
GA
5.6
7.0
FL 7.0
MA 5.5 NY 5.7
RI 9.3 CT NJ 6.5 6.0 DE 5.4 DC 7.4
MD 5.0
Unemployment rate 7.0% to 9.9% 6.0% to 6.9% 5.0% to 5.9% 4.0% to 4.9% 3.0% to 3.9%
10
Georgia Labor Force Estimates Place of Residence - Persons 16 Years and Older
Employment Status
Preliminary OCT 2008
Revised SEP 2008
Revised OCT 2007
Change From
Revised
Revised
SEP 2008
OCT 2007
Georgia
(Seasonally adjusted)
Georgia
(Not Seasonally adjusted)
Albany MSA
Athens-Clarke County MSA
Atlanta MSA
Augusta-Richmond County MSA
Brunswick MSA
Columbus MSA
Dalton MSA
Gainesville MSA
Civilian labor force Employed Unemployed Rate
Civilian labor force Employed Unemployed Rate
Civilian labor force Employed Unemployed Rate
Civilian labor force Employed Unemployed Rate
Civilian labor force Employed Unemployed Rate
Civilian labor force Employed Unemployed Rate
Civilian labor force Employed Unemployed Rate
Civilian labor force Employed Unemployed Rate
Civilian labor force Employed Unemployed Rate
Civilian labor force Employed Unemployed Rate
4,898,433 4,555,340
343,093 7.0
4,897,241 4,553,508
343,733 7.0
76,713 71,198
5,515 7.2
109,233 102,486
6,747 6.2
2,773,643 2,584,400
189,243 6.8
257,903 239,549
18,354 7.1
53,540 50,165
3,375 6.3
129,615 119,986
9,629 7.4
68,293 62,202
6,091 8.9
92,803 86,964
5,839 6.3
4,894,137 4,578,889
315,248 6.4
4,880,392 4,561,939
318,453 6.5
76,432 71,128
5,304 6.9
108,152 102,106
6,046 5.6
2,768,571 2,590,854
177,717 6.4
257,171 240,499
16,672 6.5
53,691 50,544
3,147 5.9
129,703 120,870
8,833 6.8
67,843 62,827
5,016 7.4
92,457 87,176
5,281 5.7
4,841,797 4,622,999
218,798 4.5
4,833,740 4,615,902
217,838 4.5
75,675 71,806
3,869 5.1
106,600 102,417
4,183 3.9
2,744,047 2,624,614
119,433 4.4
256,123 242,048
14,075 5.5
52,918 50,881
2,037 3.8
128,640 122,042
6,598 5.1
67,580 64,509
3,071 4.5
90,452 87,252
3,200 3.5
4,296 -23,549 27,845
16,849 -8,431 25,280
281 70 211
1,081 380 701
5,072 -6,454 11,526
732 -950 1,682
-151 -379 228
-88 -884 796
450 -625 1,075
346 -212 558
56,636 -67,659 124,295
63,501 -62,394 125,895
1,038 -608
1,646
2,633 69
2,564
29,596 -40,214 69,810
1,780 -2,499 4,279
622 -716 1,338
975 -2,056 3,031
713 -2,307 3,020
2,351 -288
2,639
Note: MSA data are not seasonally adjusted. Employment includes nonagricultural wage and salary employment, self-employment, unpaid family and private
household workers and agricultural workers. Persons in labor disputes are counted as employed. The use of unrounded data does not imply that the numbers are exact. Georgia and Metropolitan Statistical Area data have not been seasonally adjusted.
Albany MSA: Baker, Dougherty, Lee, Terrell, and Worth counties. Athens - Clarke County MSA: Clarke, Madison, Oconee, and Oglethorpe counties. Atlanta MSA: Barrow, Bartow, Butts, Carroll, Cherokee, Clayton, Cobb, Coweta, Dawson, DeKalb, Douglas, Fayette, Forsyth, Fulton, Gwinnett, Haralson, Heard, Henry, Jasper, Lamar, Meriwether, Newton, Paulding, Pickens, Pike, Rockdale, Spalding, and Walton counties. Augusta - Richmond County MSA: Burke, Columbia, McDuffie, and Richmond counties in Georgia and Aiken and Edgefield counties in South Carolina. Brunswick MSA: Brantley, Glynn, and McIntosh counties. Columbus MSA: Chattahoochee, Harris, Marion, and Muscogee counties in Georgia and Russell County in Alabama. Dalton MSA: Murray and Whitfield counties. Gainesville MSA: Hall County. Hinesville - Fort Stewart MSA: Liberty and Long counties. Macon MSA: Bibb, Crawford, Jones, Monroe, and Twiggs counties. Rome MSA: Floyd County. Savannah MSA: Bryan, Chatham, and Effingham counties. Valdosta MSA: Brooks, Echols, Lanier, and Lowndes counties. Warner Robins MSA: Houston County.
Source: Georgia Department of Labor, Workforce Information & Analysis
11
Georgia Labor Force Estimates Place of Residence - Persons 16 Years and Older
Hinesville-Ft. Stewart MSA Macon MSA
Rome MSA Savannah MSA
Valdosta MSA Warner Robins MSA
Employment Status
Civilian labor force Employed Unemployed Rate
Civilian labor force Employed Unemployed Rate
Civilian labor force Employed Unemployed Rate
Civilian labor force Employed Unemployed Rate
Civilian labor force Employed Unemployed Rate
Civilian labor force Employed Unemployed Rate
Preliminary OCT 2008
31,617 29,351
2,266 7.2
114,258 106,174
8,084 7.1
50,102 46,303
3,799 7.6
181,534 170,644
10,890 6.0
68,878 64,325
4,553 6.6
69,358 65,320
4,038 5.8
Revised SEP 2008
31,547 29,459
2,088 6.6
113,257 105,642
7,615 6.7
49,856 46,475
3,381 6.8
181,460 171,184
10,276 5.7
68,252 64,160
4,092 6.0
68,875 65,113 3,762
5.5
Revised OCT 2007
30,300 28,771
1,529 5.0
111,698 106,189
5,509 4.9
49,313 47,013
2,300 4.7
178,981 172,259
6,722 3.8
68,370 65,665
2,705 4.0
68,445 65,633
2,812 4.1
Change From
Revised
Revised
SEP 2008
OCT 2007
70 -108 178
1,317 580 737
1,001 532 469
2,560 -15
2,575
246 -172 418
789 -710 1,499
74 -540 614
2,553 -1,615 4,168
626
508
165
-1,340
461
1,848
483
913
207
-313
276
1,226
United States Labor Force Estimates Place of Residence - Persons 16 Years and Older
Employment Status
OCT 2008
SEP 2008
OCT 2007
Change From
SEP 2008
OCT 2007
United States
(Seasonally adjusted)
Civilian labor force Employed Unemployed
Rate
155,038,000 144,958,000
10,080,000 6.5
154,732,000 145,255,000
9,477,000 6.1
153,306,000 146,016,000
7,291,000 4.8
306,000 -297,000 603,000
1,732,000 -1,058,000 2,789,000
United States
(Not Seasonally adjusted)
Civilian labor force Employed Unemployed
Rate
155,012,000 145,543,000
9,469,000 6.1
154,509,000 145,310,000
9,199,000 6.0
153,516,000 146,743,000
6,773,000 4.4
503,000 233,000 270,000
1,496,000 -1,200,000 2,696,000
Note: MSA data are not seasonally adjusted. Employment includes nonagricultural wage and salary employment, self-employment, unpaid family and private
household workers and agricultural workers. Persons in labor disputes are counted as employed. The use of unrounded data does not imply that the numbers are exact. Georgia and Metropolitan Statistical Area data have not been seasonally adjusted.
Albany MSA: Baker, Dougherty, Lee, Terrell, and Worth counties. Athens - Clarke County MSA: Clarke, Madison, Oconee, and Oglethorpe counties. Atlanta MSA: Barrow, Bartow, Butts, Carroll, Cherokee, Clayton, Cobb, Coweta, Dawson, DeKalb, Douglas, Fayette, Forsyth, Fulton, Gwinnett, Haralson, Heard, Henry, Jasper, Lamar, Meriwether, Newton, Paulding, Pickens, Pike, Rockdale, Spalding, and Walton counties. Augusta - Richmond County MSA: Burke, Columbia, McDuffie, and Richmond counties in Georgia and Aiken and Edgefield counties in South Carolina. Brunswick MSA: Brantley, Glynn, and McIntosh counties. Columbus MSA: Chattahoochee, Harris, Marion, and Muscogee counties in Georgia and Russell County in Alabama. Dalton MSA: Murray and Whitfield counties. Gainesville MSA: Hall County. Hinesville - Fort Stewart MSA: Liberty and Long counties. Macon MSA: Bibb, Crawford, Jones, Monroe, and Twiggs counties. Rome MSA: Floyd County. Savannah MSA: Bryan, Chatham, and Effingham counties. Valdosta MSA: Brooks, Echols, Lanier, and Lowndes counties. Warner Robins MSA: Houston County.
Source: Georgia Department of Labor, Workforce Information & Analysis
12
Georgia Labor Force Estimates by County (not seasonally adjusted)
Georgia
Place of Residence - Persons 16 Years and Older
Preliminary October 2008
Revised September 2008
Labor Force
Employment
Unemployment Number Rate
4,897,241 4,553,508 343,733 7.0
Labor Force
Employment
Unemployment Number Rate
4,880,392 4,561,939 318,453 6.5
Appling Atkinson Bacon Baker Baldwin
9,400 3,509 4,830 1,806 21,424
8,659 3,107 4,502 1,686 19,436
741 7.9 402 11.5 328 6.8 120 6.6 1,988 9.3
9,328 8,650 678 7.3 3,357 3,079 278 8.3 4,843 4,500 343 7.1 1,809 1,684 125 6.9 21,154 19,517 1,637 7.7
Banks Barrow Bartow Ben Hill Berrien
11,181 33,828 47,458
7,544 8,892
10,611 31,322 43,629
6,610 8,161
570 5.1 2,506 7.4 3,829 8.1
934 12.4 731 8.2
11,240 33,614 47,115
7,586 8,797
10,713 31,400 43,738
6,603 8,128
527 4.7 2,214 6.6 3,377 7.2
983 13.0 669 7.6
Bibb Bleckley Brantley Brooks Bryan
75,464 69,913 5,551 7.4
5,444 5,011 433 8.0
7,784 7,230 554 7.1
8,744 8,174 570 6.5
17,089 16,127
962 5.6
74,720 69,563 5,157 6.9 5,367 4,959 408 7.6 7,826 7,285 541 6.9 8,671 8,153 518 6.0
17,108 16,178 930 5.4
Bulloch Burke Butts Calhoun Camden
33,767 31,331 2,436 7.2
10,208 9,288 920 9.0
10,577 9,714
863 8.2
2,503 2,293
210 8.4
21,646 20,253 1,393 6.4
33,336 31,144 2,192 6.6
10,184 9,333 851 8.4
10,532 9,738 794 7.5
2,511 2,299
212 8.4
21,528 20,198 1,330 6.2
Candler Carroll Catoosa Charlton Chatham
4,280 3,953
327 7.6
53,386 49,437 3,949 7.4
37,081 35,212 1,869 5.0
4,663 4,325 338 7.2
135,741 127,364 8,377 6.2
4,280 3,979 301 7.0 53,272 49,561 3,711 7.0 37,283 35,418 1,865 5.0
4,711 4,349 362 7.7 135,675 127,767 7,908 5.8
Chattahoochee 2,619
Chattooga
11,041
Cherokee 109,615
Clarke
66,541
Clay
1,555
2,246 10,022 102,831 62,098
1,461
373 14.2 1,019 9.2 6,784 6.2 4,443 6.7
94 6.0
2,607 10,992 109,221 65,794
1,545
2,266 10,038 103,088 61,868
1,450
341 13.1 954 8.7 6,133 5.6 3,926 6.0
95 6.1
Clayton Clinch Cobb Coffee Colquitt
141,603 130,210 11,393 8.0 2,846 2,576 270 9.5
388,833 364,919 23,914 6.2 17,208 15,500 1,708 9.9 21,299 19,618 1,681 7.9
141,577 130,535 11,042 7.8 2,779 2,559 220 7.9
388,408 365,830 22,578 5.8 16,785 15,359 1,426 8.5 20,664 19,351 1,313 6.4
Columbia Cook Coweta Crawford Crisp
59,610 56,397 3,213 5.4
7,272 6,621
651 9.0
60,320 56,525 3,795 6.3
6,397 5,985 412 6.4
10,587 9,722 865 8.2
59,553 56,669 2,884 4.8 7,259 6,706 553 7.6
60,189 56,667 3,522 5.9 6,351 5,955 396 6.2
10,569 9,712 857 8.1
Revised October 2007
Labor Force
Employment
Unemployment Number Rate
4,833,740 4,615,902 217,838 4.5
9,043 8,612
431 4.8
3,309 3,106
203 6.1
4,702 4,514
188 4.0
1,787 1,700
87 4.9
20,933 19,712 1,221 5.8
10,517 10,202
315 3.0
33,195 31,810 1,385 4.2
46,565 44,308 2,257 4.8
7,751 7,191
560 7.2
8,816 8,435
381 4.3
73,707 69,923 3,784 5.1
5,337 5,024
313 5.9
7,648 7,334
314 4.1
8,738 8,345
393 4.5
16,884 16,279
605 3.6
32,836 31,327 1,509 4.6
10,312 9,385
927 9.0
10,400 9,865
535 5.1
2,249 2,130
119 5.3
22,033 21,191
842 3.8
4,476 4,265
211 4.7
52,663 50,207 2,456 4.7
36,717 35,368 1,349 3.7
4,500 4,260
240 5.3
133,743 128,569 5,174 3.9
2,528 10,816 108,379 64,790
1,554
2,276 10,192 104,432 62,057
1,468
252 10.0 624 5.8 3,947 3.6 2,733 4.2
86 5.5
139,817 132,236 7,581 5.4
2,898 2,704
194 6.7
385,591 370,597 14,994 3.9
16,406 15,492
914 5.6
21,139 20,233
906 4.3
59,368 56,990 2,378 4.0
7,111 6,735
376 5.3
59,742 57,405 2,337 3.9
6,322 5,986
336 5.3
10,604 10,027 577 5.4
13
Georgia Labor Force Estimates by County (not seasonally adjusted)
Dade Dawson Decatur DeKalb Dodge
Place of Residence - Persons 16 Years and Older
Preliminary October 2008
Revised September 2008
Labor Force
Employment
Unemployment Number Rate
Labor Force
Employment
Unemployment Number Rate
8,901 8,425 476 5.3 11,201 10,454 747 6.7 12,578 11,537 1,041 8.3 402,301 374,476 27,825 6.9 9,860 9,040 820 8.3
8,965 8,474
491 5.5
11,170 10,480 690 6.2
12,154 11,179
975 8.0
401,704 375,412 26,292 6.5
9,700 9,021 679 7.0
Dooly Dougherty Douglas Early Echols
4,934 4,580 354 7.2
42,224 38,840 3,384 8.0
65,070 60,397 4,673 7.2
5,653 5,228 425 7.5
2,423 2,296
127 5.2
4,847 4,503 344 7.1
42,071 38,802 3,269 7.8
64,976 60,548 4,428 6.8
5,628 5,206
422 7.5
2,399 2,290
109 4.5
Effingham Elbert Emanuel Evans Fannin
28,704 10,263 10,834
5,112 11,209
27,153 9,143 9,901 4,748
10,392
1,551 5.4 1,120 10.9
933 8.6 364 7.1 817 7.3
28,677 27,239 1,438 5.0
10,054 9,171
883 8.8
10,739 9,859 880 8.2
5,086 4,732 354 7.0
11,131 10,385 746 6.7
Fayette Floyd Forsyth Franklin Fulton
55,950 52,662 3,288 5.9
50,102 46,303 3,799 7.6
83,372 78,792 4,580 5.5
10,556 9,734
822 7.8
493,017 458,174 34,843 7.1
55,824 52,794 3,030 5.4
49,856 46,475 3,381 6.8
83,260 78,988 4,272 5.1
10,549 9,774
775 7.3
492,682 459,318 33,364 6.8
Gilmer Glascock Glynn Gordon Grady
14,373 13,394 979 6.8
1,137 1,050
87 7.7
40,370 37,923 2,447 6.1
27,662 25,223 2,439 8.8
12,329 11,483 846 6.9
14,311 13,455
856 6.0
1,137 1,057
80 7.0
40,487 38,209 2,278 5.6
27,577 25,493 2,084 7.6
12,255 11,461
794 6.5
Greene Gwinnett Habersham Hall Hancock
7,862 7,250 612 7.8
428,083 401,325 26,758 6.3
21,266 19,896 1,370 6.4
92,803 86,964 5,839 6.3
3,700 3,091
609 16.5
7,882 7,314
568 7.2
427,182 402,327 24,855 5.8
21,030 19,764 1,266 6.0
92,457 87,176 5,281 5.7
3,567 3,103
464 13.0
Haralson Harris Hart Heard Henry
13,456 15,830 10,879
5,143 96,834
12,438 14,997
9,762 4,773 90,261
1,018 7.6 833 5.3
1,117 10.3 370 7.2
6,573 6.8
13,357 12,469
888 6.6
16,014 15,127 887 5.5
10,805 9,874
931 8.6
5,140 4,785
355 6.9
96,697 90,486 6,211 6.4
Houston Irwin Jackson Jasper Jeff Davis
69,358 4,284
28,275 6,833 5,446
65,320 3,816
26,309 6,218 4,833
4,038 5.8 468 10.9
1,966 7.0 615 9.0 613 11.3
68,875 4,281
28,075 6,813 5,434
65,113 3,813 26,279 6,234 4,829
3,762 5.5 468 10.9
1,796 6.4 579 8.5 605 11.1
Revised October 2007
Labor Force
Employment
Unemployment Number Rate
8,782 8,462
320 3.6
11,038 10,616
422 3.8
11,960 11,286
674 5.6
398,893 380,303 18,590 4.7
9,599 9,100
499 5.2
5,102 41,518 64,281
5,407 2,411
4,828 39,172 61,337
5,139 2,344
274 5.4 2,346 5.7 2,944 4.6
268 5.0 67 2.8
28,353 9,744
10,708 4,986 11,011
27,410 9,123
10,090 4,764
10,601
943 3.3 621 6.4 618 5.8 222 4.5 410 3.7
55,618 53,481 2,137 3.8
49,313 47,013 2,300 4.7
82,811 80,018 2,793 3.4
10,343 9,830
513 5.0
488,124 465,303 22,821 4.7
14,221 1,121
39,966 27,036 12,623
13,713 1,059
38,464 25,753 12,081
508 3.6 62 5.5
1,502 3.8 1,283 4.7
542 4.3
7,560 424,204
20,130 90,452
3,497
7,133 407,570
19,342 87,252
3,135
427 5.6 16,634 3.9
788 3.9 3,200 3.5
362 10.4
13,241 15,773 10,774
5,077 95,847
12,632 15,193 10,035
4,847 91,666
609 4.6 580 3.7 739 6.9 230 4.5 4,181 4.4
68,445 4,412
27,058 6,649 5,233
65,633 4,152
25,959 6,315 4,890
2,812 4.1 260 5.9
1,099 4.1 334 5.0 343 6.6
14
Georgia Labor Force Estimates by County (not seasonally adjusted)
Jefferson Jenkins Johnson Jones Lamar
Place of Residence - Persons 16 Years and Older
Preliminary October 2008
Revised September 2008
Labor Force
Employment
Unemployment Number Rate
7,268 2,854 3,914 14,227 8,270
6,428 2,429 3,526 13,309 7,531
840 11.6 425 14.9 388 9.9 918 6.5 739 8.9
Labor Force
7,254 2,875 3,853 14,110 8,154
Employment
Unemployment Number Rate
6,457 2,429 3,526 13,243 7,549
797 11.0 446 15.5 327 8.5 867 6.1 605 7.4
Lanier Laurens Lee Liberty Lincoln
4,122 3,822 300 7.3 23,114 21,091 2,023 8.8 17,450 16,568 882 5.1 25,532 23,610 1,922 7.5 3,908 3,584 324 8.3
4,034 3,812
222 5.5
22,848 21,091 1,757 7.7
17,387 16,552 835 4.8
25,469 23,697 1,772 7.0
3,869 3,595
274 7.1
Long Lowndes Lumpkin McDuffie McIntosh
6,085 5,741 344 5.7 53,589 50,033 3,556 6.6 13,879 12,792 1,087 7.8 11,014 10,080 934 8.5
5,386 5,012 374 6.9
6,078 5,762 316 5.2
53,148 49,905 3,243 6.1
13,834 12,829 1,005 7.3
10,997 10,129
868 7.9
5,378 5,050 328 6.1
Macon Madison Marion Meriwether Miller
5,166 16,331
3,436 10,109
3,791
4,657 15,369
3,207 9,223 3,601
509 9.9 962 5.9 229 6.7 886 8.8 190 5.0
5,090 16,199
3,452 10,300
3,688
4,618 15,312
3,235 9,246 3,519
472 9.3 887 5.5 217 6.3 1,054 10.2 169 4.6
Mitchell
10,575 9,805 770 7.3
Monroe
13,422 12,609 813 6.1
Montgomery 4,686 4,316
370 7.9
Morgan
9,827 9,158 669 6.8
Murray
21,364 19,538 1,826 8.5
10,467 9,714 753 7.2
13,390 12,546 844 6.3
4,605 4,286
319 6.9
9,771 9,180
591 6.0
21,343 19,734 1,609 7.5
Muscogee Newton Oconee Oglethorpe Paulding
86,309 80,038 6,271 7.3
46,641 42,627 4,014 8.6
18,284 17,460 824 4.5
8,076 7,559
517 6.4
65,815 61,207 4,608 7.0
86,492 80,735 5,757 6.7
46,334 42,733 3,601 7.8
18,173 17,395 778 4.3
7,987 7,531
456 5.7
65,696 61,360 4,336 6.6
Peach Pickens Pierce Pike Polk
11,940 11,069 871 7.3
15,552 14,423 1,129 7.3
8,630 8,091
539 6.2
8,325 7,685 640 7.7
21,674 20,126 1,548 7.1
11,803 10,983 820 6.9
15,415 14,459
956 6.2
8,533 8,036
497 5.8
8,290 7,704
586 7.1
21,647 20,234 1,413 6.5
Pulaski Putnam Quitman Rabun Randolph
4,723 10,695
970 7,081 2,873
4,449 9,725
904 6,561 2,603
274 5.8 970 9.1
66 6.8 520 7.3 270 9.4
4,715 10,483
996 7,055 2,834
4,459 9,745
908 6,610 2,592
256 5.4 738 7.0
88 8.8 445 6.3 242 8.5
Revised October 2007
Labor Force
Employment
Unemployment Number Rate
7,151 3,505 3,775 13,924 8,061
6,633 3,144 3,540 13,311 7,648
518 7.2 361 10.3 235 6.2 613 4.4 413 5.1
4,045 22,391 17,343 24,472
3,820
3,901 21,178 16,710 23,144
3,606
144 3.6 1,213 5.4
633 3.6 1,328 5.4
214 5.6
5,828 53,177 13,086 10,905
5,305
5,627 51,075 12,563 10,186
5,083
201 3.4 2,102 4.0
523 4.0 719 6.6 222 4.2
5,240 15,946
3,398 9,935 3,697
4,794 15,359
3,249 9,366 3,561
446 8.5 587 3.7 149 4.4 569 5.7 136 3.7
10,546 13,139
4,637 9,497 21,192
10,009 12,610
4,425 9,038 20,262
537 5.1 529 4.0 212 4.6 459 4.8 930 4.4
85,437 45,645 18,020
7,845 64,784
81,087 43,290 17,448
7,554 62,160
4,350 5.1 2,355 5.2
572 3.2 291 3.7 2,624 4.1
11,494 15,225
8,528 8,163 21,113
10,785 14,648
8,185 7,805 20,176
709 6.2 577 3.8 343 4.0 358 4.4 937 4.4
4,704 10,236
977 7,158 2,761
4,490 9,722
937 6,794 2,592
214 4.5 514 5.0
40 4.1 364 5.1 169 6.1
15
Georgia Labor Force Estimates by County (not seasonally adjusted)
Richmond Rockdale Schley Screven Seminole
Place of Residence - Persons 16 Years and Older
Preliminary October 2008
Revised September 2008
Labor Force
Employment
Unemployment Number Rate
Labor Force
Employment
Unemployment Number Rate
91,072 83,948 7,124 7.8
41,394 38,199 3,195 7.7
1,856 1,718
138 7.4
7,539 6,818 721 9.6
4,118 3,793
325 7.9
90,791 84,352 6,439 7.1 41,277 38,295 2,982 7.2
1,837 1,714 123 6.7 7,384 6,761 623 8.4 4,082 3,755 327 8.0
Spalding Stephens Stewart Sumter Talbot
29,500 26,860 2,640 8.9 13,987 12,935 1,052 7.5
2,327 2,140 187 8.0 14,817 13,521 1,296 8.7
3,202 2,968 234 7.3
29,480 26,927 2,553 8.7 13,868 12,946 922 6.6
2,313 2,135 178 7.7 14,632 13,482 1,150 7.9
3,219 2,956 263 8.2
Taliaferro Tattnall Taylor Telfair Terrell
890 9,126 3,431 5,558 4,615
806 8,449 3,146 4,685 4,279
84 9.4 677 7.4 285 8.3 873 15.7 336 7.3
889 9,050 3,401 5,298 4,588
813 8,425 3,141 4,724 4,275
76 8.5 625 6.9 260 7.6 574 10.8 313 6.8
Thomas Tift Toombs Towns Treutlen
22,263 20,812 1,451 6.5
18,991 17,438 1,553 8.2
14,007 12,894 1,113 7.9
6,103 5,718
385 6.3
2,875 2,613 262 9.1
22,099 20,705 1,394 6.3 18,956 17,519 1,437 7.6 13,799 12,806 993 7.2
6,134 5,770 364 5.9 2,845 2,602 243 8.5
Troup Turner Twiggs Union Upson
30,877 28,128 2,749 8.9
4,874 4,520 354 7.3
4,748 4,358 390 8.2
11,542 10,776
766 6.6
12,035 10,941 1,094 9.1
30,779 28,175 2,604 8.5 4,947 4,545 402 8.1 4,687 4,336 351 7.5 11,507 10,789 718 6.2
12,003 10,980 1,023 8.5
Walker Walton Ware Warren Washington
34,737 41,159 15,761
2,512 8,372
32,720 38,087 14,473
2,242 7,619
2,017 5.8 3,072 7.5 1,288 8.2
270 10.7 753 9.0
34,873 40,889 15,443
2,583 8,275
32,911 38,182 14,375
2,256 7,590
1,962 5.6 2,707 6.6 1,068 6.9
327 12.7 685 8.3
Wayne Webster Wheeler White Whitfield
12,424 11,227 1,197 9.6
1,316 1,241
75 5.7
3,041 2,756
285 9.4
12,969 12,156
813 6.3
46,929 42,664 4,265 9.1
12,290 11,301 989 8.0
1,301 1,234
67 5.1
2,987 2,767
220 7.4
12,955 12,207 748 5.8
46,500 43,093 3,407 7.3
Wilcox
3,321 3,008
313 9.4
3,312 3,018
294 8.9
Wilkes
4,841 4,365
476 9.8
4,729 4,318
411 8.7
Wilkinson
4,807 4,415
392 8.2
4,781 4,441
340 7.1
Worth
10,618 9,825
793 7.5
10,578 9,815 763 7.2
Georgia - Seasonally Adjusted4,898,4334,555,340343,093 7.0 4,894,1374,578,889315,248
218,798
4.5
Revised October 2007
Labor Force
Employment
Unemployment Number Rate
90,351 84,830 5,521 6.1
40,782 38,794 1,988 4.9
1,847 1,719
128 6.9
7,336 6,968
368 5.0
4,015 3,813
202 5.0
28,843 27,278 1,565 5.4
13,422 12,820
602 4.5
2,308 2,158
150 6.5
14,492 13,525
967 6.7
3,092 2,923
169 5.5
857 9,161 3,352 4,913 4,609
793 8,744 3,107 4,476 4,316
64 7.5 417 4.6 245 7.3 437 8.9 293 6.4
23,197 19,433 13,850
6,332 2,734
22,242 18,476 13,222
6,120 2,585
955 4.1 957 4.9 628 4.5 212 3.3 149 5.4
30,390 28,669 1,721 5.7
4,990 4,720
270 5.4
4,605 4,358
247 5.4
11,420 11,000
420 3.7
12,014 11,194
820 6.8
34,530 32,865 1,665 4.8
40,475 38,680 1,795 4.4
15,387 14,641
746 4.8
2,453 2,278
175 7.1
8,410 7,917 493 5.9
12,124 11,463
661 5.5
1,268 1,219
49 3.9
2,967 2,809 158 5.3
13,051 12,599
452 3.5
46,388 44,247 2,141 4.6
3,313 3,111
202 6.1
4,602 4,296
306 6.6
4,655 4,389 266 5.7
10,419 9,909
510 4.9
6.4 4,841,7974,622,999
16
Georgia Unemployment Rates by County
October 2008
Dade
Catoosa
Murray
Fannin
Towns
Union
Rabun
Whitfield Walker
Gilmer
White Habersham
Chattooga
Gordon
Pickens
Lumpkin
Stephens
Floyd
Dawson
Banks Franklin Hart
Bartow Cherokee Forsyth Hall
Jackson Madison Elbert
Polk Haralson
Paulding Cobb
Gwinnett Barrow Clarke Oglethorpe
Oconee
DeKalb
Walton
Wilkes
Douglas Fulton
Rockdale
Lincoln
Carroll
Clayton
Newton Morgan Greene Taliaferro
Columbia
Fayette Henry
McDuffie
Coweta Heard
Spalding Butts Jasper Putnam
Warren Hancock Glascock
Richmond
10.0% or greater 8.0% to 9.9% 7.0% to 7.9% Less than 7.0%
Troup
Meriwether Pike Lamar Monroe
Jones Baldwin
Jefferson Washington
Burke
Upson
Harris
Talbot
Bibb Crawford
Muscogee
Taylor
Peach
Wilkinson Twiggs
Johnson
Jenkins Emanuel
Screven
Marion Chattahoochee
Macon
Houston Bleckley
Laurens Treutlen
Candler Bulloch
Effingham
Stewart
Schley Webster Sumter
Dooly Crisp
Pulaski Wilcox
Dodge
Montgomery
Wheeler
Toombs
Telfair
Evans Tattnall
Bryan
Chatham
Quitman Terrell Lee
Randolph
Turner
Ben Hill
Jeff Davis Appling
Liberty Long
Clay Calhoun Dougherty
Early
Baker
Miller
Mitchell
Worth
Irwin Tift
Coffee
Colquitt
Berrien Atkinson Cook
Seminole Decatur
Grady
Thomas
Brooks
Lanier
Clinch
Lowndes Echols
Bacon
Wayne
Pierce
Ware
Brantley
McIntosh Glynn
Charlton
Camden
Georgia's Unemployment Rate: 7.0%
(Not Seasonally Adjusted)
17
New Developments
NCR is expanding two of its Georgia facilities. The one in Fayette County will become the company's center of excellence and will use part of the $15 million for the expansion to create approximately 640 new positions. The location in Gwinnett County will add about 275 jobs after the expansion project is complete. The company plans to make its Georgia locations in Duluth and Peachtree City its base of world-wide customer service.
In Floyd County Pirelli Tire North America will be expanding by investing $15 million to increase production by 20 percent. The investment will increase the number of Modular Integrated Robotized Systems (MIRS) production lines from four to five. The company has seen large gains in its North American market share with a 30 percent sales increase. Pirelli Tire North America designs, develops, manufactures and markets tires for passenger vehicles, motorcycles, and racecars for original equipment and replacement markets. The expansion to the Rome facility will add about 20 new highly skilled technical jobs to the local area.
IXP Corporation is designing and implementing the new 911 center that will serve the new cities of Sandy Springs and Johns Creek in Fulton County. A significant increase is expected in the speed with which calls are answered and accurately processed with the new system. It will also reduce the response time to emergencies for the police and fire departments. The center will need 55 to 60 newly trained employees to staff it.
Bentley Dye Services, Inc., the largest wool supplier in the United States, is planning a new facility in Gordon County. The new polyester extrusion/yarn mill manufacturing plant in Calhoun will represent a $30 million investment and will create 75 new jobs. The latest equipment technology available will be used at the new facility which will also be energy efficient and environmentally
friendly. A climate controled work place will also be featured for the workers' comfort. Phase two of this venture would be an additional investment of $20 million and 75 additional jobs if market conditions remain favorable.
In Pike County Yancey Packaging is planning to expand their operations. They are planning to invest $2 million in an addition of 20,000 square feet that will include a third 25 ton crane. This will also include improvements to the facility such as external hard standing for storage and additional rest area and office accommodations. The company is running three years ahead of its original expansion schedule and 26 new jobs will be created.
In Whitfield County a $10 million expansion is being implemented at US Floors in Dalton that will create 15 new jobs. The company produces "green" floor coverings made from materials such as cork and bamboo.
In Wilkes County a company has purchased the former SCT Yarns building and will produce hightemperature fiberglass insulation for industrial applications. AFG USA is working to prepare the building now and expects to hire 25 people by early next year. The insulation that will be used mainly in petrochemical refineries and thermal power plants produced at the new Washington plant will be able to withstand up to 1,000 degrees Fahrenheit.
Pliant Corporation, Wilkes County's biggest employer, is expanding and will create 22 new jobs. Two new process lines will be implemented at their plastic film manufacturing facility in Washington. The company is a leading producer of value-added film and packaging for personal care, medical, food, industrial and agricultural markets. The first line will be coming online in November of this year and the second in early 2009.
18
Georgia Unemployment Insurance Claims by County
County
October Average Average Initial Weekly Duration
Claims Benefit Weeks
County
October Average Average Initial Weekly Duration
Claims Benefit Weeks
Georgia
72,627 ....... $267 ...... 11.6
Appling
256 ....... $224 ...... 11.3
Atkinson
199 ....... $222 ........ 8.7
Bacon
116 ....... $223 ........ 9.1
Baker
37 ....... $182 ...... 11.4
Baldwin
825 ....... $181 ...... 12.2
Banks
81 ....... $245 ...... 10.2
Barrow
526 ....... $259 ...... 12.6
Bartow
1,060 ....... $248 ...... 11.5
Ben Hill
203 ....... $210 ...... 11.3
Berrien
285 ....... $230 ...... 10.0
Bibb
1,210 ....... $192 ...... 13.7
Bleckley
95 ....... $189 ...... 11.7
Brantley
113 ....... $218 ...... 12.3
Brooks
127 ....... $191 ...... 11.9
Bryan
102 ....... $252 ...... 13.3
Bulloch
363 ....... $220 ...... 10.1
Burke
267 ....... $195 ...... 13.7
Butts
164 ....... $226 ...... 12.0
Calhoun
43 ....... $197 ...... 12.9
Camden
184 ....... $224 ...... 12.7
Candler
90 ....... $218 ........ 9.6
Carroll
714 ....... $237 ...... 11.6
Catoosa
393 ....... $247 ........ 8.7
Charlton
30 ....... $200 ...... 13.9
Chatham
1,072 ....... $219 ...... 13.9
Chattahoochee 18 ....... $213 ...... 13.0
Chattooga
96 ....... $257 ...... 14.1
Cherokee
1,022 ....... $270 ...... 13.0
Clarke
680 ....... $206 ...... 12.2
Clay
23 ....... $217 ...... 14.5
Clayton
1,773 ....... $229 ...... 14.5
Clinch
76 ....... $191 ...... 11.5
Cobb
3,127 ....... $258 ...... 14.6
Coffee
633 ....... $216 ........ 9.2
Colquitt
518 ....... $190 ........ 9.4
Columbia
390 ....... $242 ...... 12.1
Cook
322 ....... $216 ........ 9.7
Coweta
686 ....... $240 ...... 11.1
Crawford
96 ....... $222 ...... 11.6
Crisp
243 ....... $170 ...... 13.6
Dade
69 ....... $248 ........ 7.6
Dawson
156 ....... $256 ...... 13.4
Decatur
594 ....... $197 ...... 10.7
DeKalb
4,150 ....... $240 ...... 14.5
Dodge
218 ....... $206 ...... 10.4
Dooly
105 ....... $176 ...... 11.6
Dougherty
808 ....... $183 ...... 12.1
Douglas
683 ....... $253 ...... 14.1
Early
106 ....... $171 ...... 12.9
Echols
30 ....... $229 ........ 9.7
Effingham
180 ....... $241 ...... 13.3
Elbert Emanuel Evans Fannin Fayette Floyd Forsyth Franklin Fulton Gilmer Glascock Glynn Gordon Grady Greene Gwinnett Habersham Hall Hancock Haralson Harris Hart Heard Henry Houston Irwin Jackson Jasper Jeff Davis Jefferson Jenkins Johnson Jones Lamar Lanier Laurens Lee Liberty Lincoln Long Lowndes Lumpkin Macon Madison Marion McDuffie McIntosh Meriwether Miller Mitchell Monroe Montgomery Morgan Murray
422 ....... $207 ........ 9.4 414 ....... $188 ...... 10.5
46 ....... $202 ...... 13.0 232 ....... $218 ...... 11.0 327 ....... $259 ...... 13.6 1,110 ....... $238 ........ 9.9 544 ....... $277 ...... 13.9 221 ....... $240 ........ 9.9 4,721 ....... $237 ...... 14.7 275 ....... $245 ...... 10.2
24 ....... $212 ........ 8.8 445 ....... $225 ...... 12.1 1,022 ....... $254 ........ 9.2 298 ....... $224 ........ 9.9 153 ....... $218 ...... 11.7 3,639 ....... $265 ...... 14.3 296 ....... $242 ........ 7.6 1,141 ....... $249 ...... 10.9 298 ....... $186 ...... 11.9 193 ....... $237 ...... 10.8 178 ....... $252 ...... 11.8 381 ....... $225 ...... 10.4
76 ....... $258 ........ 9.6 913 ....... $250 ...... 14.1 819 ....... $215 ...... 12.8
90 ....... $230 ...... 12.6 382 ....... $245 ...... 11.6 140 ....... $232 ...... 12.9 305 ....... $203 ...... 10.8 229 ....... $186 ...... 13.4 304 ....... $171 ...... 13.7 182 ....... $201 ...... 10.4 181 ....... $211 ...... 14.1 201 ....... $227 ........ 9.9
99 ....... $215 ........ 8.8 762 ....... $207 ...... 10.5 117 ....... $221 ...... 11.2 215 ....... $224 ...... 14.0
90 ....... $223 ........ 9.6 43 ....... $225 ...... 13.1 928 ....... $213 ...... 11.4 181 ....... $241 ...... 10.8 246 ....... $169 ........ 8.9 227 ....... $239 ...... 10.3 51 ....... $224 ........ 9.3 290 ....... $199 ........ 9.9 85 ....... $219 ...... 10.9 242 ....... $212 ...... 11.1 132 ....... $209 ........ 9.3 146 ....... $185 ...... 14.3 176 ....... $222 ...... 11.8 165 ....... $177 ...... 11.1 131 ....... $236 ...... 13.1 1,128 ....... $259 ........ 7.1
Initial claims include intrastate initial and additional claims, as well as agent state initial and additional claims for regular UI only. Average duration of benefits is represented in weeks.
County
October Average Average Initial Weekly Duration
Claims Benefit Weeks
Muscogee Newton Oconee Oglethorpe Paulding Peach Pickens Pierce Pike Polk Pulaski Putnam Quitman Rabun Randolph Richmond Rockdale Schley Screven Seminole Spalding Stephens Stewart Sumter Talbot Taliaferro Tattnall Taylor Telfair Terrell Thomas Tift Toombs Towns Treutlen Troup Turner Twiggs Union Upson Walker Walton Ware Warren Washington Wayne Webster Wheeler White Whitfield Wilcox Wilkes Wilkinson Worth
1,207 ....... $206 ...... 11.6 867 ....... $243 ...... 13.2 109 ....... $254 ...... 12.6 134 ....... $239 ...... 11.3 672 ....... $261 ...... 13.8 329 ....... $198 ...... 11.6 229 ....... $253 ...... 11.3 146 ....... $226 ...... 10.0 128 ....... $229 ...... 11.0 457 ....... $235 ........ 9.3 63 ....... $217 ...... 11.4 371 ....... $214 ...... 10.5 2 ....... $279 ...... 10.9 101 ....... $239 ........ 9.7 68 ....... $204 ........ 9.9
1,269 ....... $202 ...... 13.1 534 ....... $244 ...... 14.4 34 ....... $196 ........ 8.4 262 ....... $236 ........ 8.4 118 ....... $200 ...... 11.5 591 ....... $210 ...... 11.9 304 ....... $232 ........ 9.9 36 ....... $213 ...... 12.3 439 ....... $161 ...... 10.5 54 ....... $242 ...... 13.3 22 ....... $151 ...... 11.0 141 ....... $192 ...... 11.5 127 ....... $213 ...... 10.2 346 ....... $189 ........ 9.8 49 ....... $183 ...... 12.6 274 ....... $194 ...... 12.4 322 ....... $212 ...... 11.8 547 ....... $183 ...... 11.3 77 ....... $259 ...... 13.4 83 ....... $219 ........ 9.0 721 ....... $227 ...... 10.9 129 ....... $173 ...... 11.6 43 ....... $196 ...... 14.1 153 ....... $219 ...... 12.7 208 ....... $202 ...... 12.6 979 ....... $249 ........ 7.5 573 ....... $246 ...... 13.6 384 ....... $195 ........ 9.5 158 ....... $188 ........ 8.5 255 ....... $190 ...... 12.2 333 ....... $218 ...... 11.8 17 ....... $190 ........ 9.5 102 ....... $176 ...... 10.0 139 ....... $247 ........ 8.9
3,145 ....... $252 ........ 6.5 67 ....... $206 ...... 12.8
190 ....... $198 ...... 11.3 139 ....... $196 ...... 12.4 266 ....... $206 ...... 10.7
19
Georgia Department of Labor Workforce Information & Analysis 148 Andrew Young International Boulevard, N.E. Atlanta, Georgia 30303-1751
Return Service Requested