- Collection:
- Georgia Government Publications
- Title:
- Dimensions: measuring Georgia's workforce, Vol. 31, no. 1 (Jan. 2005)
- Creator:
- Georgia. Department of Labor
- Contributor to Resource:
- Georgia. Workforce Information and Analysis
- Publisher:
- Atlanta, Ga. : Georgia Dept. of Labor, 2005-01
- Date of Original:
- 2005-01
- Subject:
- Labor market--Georgia--Statistics
Wages--Georgia--Statistics
Hours of labor--Georgia--Statistics - Location:
- United States, Georgia, 32.75042, -83.50018
- Medium:
- state government records
- Type:
- Text
- Format:
- application/pdf
- External Identifiers:
- Call Number GA L200.E46 P1 T7 31/1
- Metadata URL:
- https://dlg.galileo.usg.edu/id:dlg_ggpd_i-ga-bl200-pe46-bp1-bt7-b31-s1-belec-p-btext
- Digital Object URL:
- https://dlg.galileo.usg.edu/do:dlg_ggpd_i-ga-bl200-pe46-bp1-bt7-b31-s1-belec-p-btext
- Language:
- eng
- Holding Institution:
- University of Georgia. Map and Government Information Library
- Rights:
-

January 2005 Data
Key Indicators
True to trend, Georgia lost jobs in January. The largely seasonal decline occurred mainly in Retail Trade and Professional and Business services. However, over the year, the state has added 35,300 workers to its payrolls.
The state unemployment rate increased in January from 4.7 percent to 5.0 percent, also following seasonal patterns. The national unemployment rate also trended upwards from 5.1 to 5.7 percent.
Weekly initial unemployment claims, for the reference week that includes the 12th of January, ticked up but continued a downward trend annually dropping 30.4 percent from a year ago and 29.2 percent from two years ago. Weekly continued claims have also been declining the last two years, but at an average 59,815 claimants for the reference week they are remaining much too high. Unfortunately, until job growth kicks into a much higher gear, this number will remain stubbornly high.
Ending on a better note, State net revenue collections increased in January by 7.7 percent over the previous year.
Employment Situation
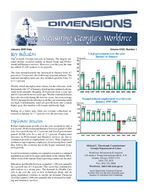
Robust employment growth over the year occurred in only a few sectors. Professional and Business Services gained 15,800 jobs for a growth rate of 3.2 percent and Local government gained 10,500 jobs for a rate of 2.7 percent. Employment increases in Professional and Business services are due to continued growth in employment services. Wary employers continue to tap temporary employees, from leasing firms, until they believe the economy has really begun sustained, longterm growth.
Local Government continues to expand in reaction to continued population growth in Georgia, particularly in the Atlanta MSA, where some of the nations fastest growing counties are located.
Education and Health Services expanded 7,100 jobs annually for a growth rate of 1.8 percent. This sector has continued to add workers at a strong pace. The demand for Health Care jobs is up over the year as new technology, drugs and an aging population combine to ratchet up demand. Financial Activities gained 3,600 jobs annually due to demand for banking and insurance services.
Volume XXXI, Number 1
Local government over-the-year
Thousands 16
January to January
14.4
14
11.6
12
10.5
10 8.2
9.2
8
6.1
6.6
6
4.7
3.9
4
2.5
1.8
2
0 1995 1996 1997 1998 1999 2000 2001 2002 2003 2004 2005
Nonagricultural employment over-the-year
Thousands 200
155.8
January 19952005
150 100
121.3 107.8 100.8
119.9 92.7
79.7
50
23.8 35.3
0
-50
-18.9
-100
-115 -150
1995 1996 1997 1998 1999 2000 2001 2002 2003 2004 2005
Michael L. Thurmond, Commissioner Georgia Department of Labor
Workforce Information & Analysis 148 Andrew Young International Blvd., N.E.
Atlanta, Georgia 30303-1751 (404) 232-3875
Fax (404) 232-3888 Workforce_Info@dol.state.ga.us
Equal Opportunity Employer/Program Auxiliary Aids and Services Available upon
Request to Individuals with Disabilities
Georgia New/Redefined MSAs
In June 2003 the federal Office of Management and Budget (OMB) announced the updated definitions of metropolitan statistical areas (MSA) based on the 2000 Census. Nationally, this increases the number of metropolitan areas published by the Current Employment Statistics (CES) program from 274 to approximately 400. In Georgia, the number of MSAs has doubled, thus CES expanded its estimates from 7 to 14 MSAs. Below are the counties that comprise each of Georgia's MSAs.
Sequatchie
Marion
Hamilton
Chattanooga
Dade
Catoosa
Murray
Dalton
Fannin
Towns Union
Rabun
Walker Whitfield
Gilmer
White Haber-
Chattooga
Gordon
Rome
Floyd
Bartow
Pickens Cherokee
Lumpkin
sham Stephens
Dawson Gaines- Banks ville
Forsyth Hall Jackson
Franklin Hart
Madison
Athens Elbert
Polk
Paulding Cobb
Barrow Gwinnett
Clarke Co.
Clarke
Atlanta-Sandy Springs-Marietta Oconee Oglethorpe
Haralson Carroll
Douglas
DeKalb
Walton
Fulton
Rock-
Clayton
dale Newton
Morgan
Fayette
Henry
Greene
Wilkes Lincoln
Edgefield
Taliaferro
McDuffie Columbia
Warren
Aiken
Augusta
Heard
Coweta
Spalding
Butts Jasper Putnam
Hancock
Glascock
Richmond
Troup
Meriwether
Pike Lamar Monroe
Jones
Upson
Macon
Baldwin
Jefferson Washington
Burke
Harris
Talbot
Crawford
Bibb
Wilkinson Twiggs
Johnson
Jenkins Screven
Muscogee
Taylor
Peach Houston
Emanuel
Russell
Columbus
Chattahoochee
Marion
Macon
Schley
Stewart Webster Sumter
Warner Bleckley Robins
Dooly
Pulaski Dodge
Crisp Wilcox
Laurens
Treutlen
Montgomery
Wheeler
Toombs
Telfair
Candler Bulloch
Effingham
Evans Tattnall
Savannah
Bryan Chatham Liberty
Quitman
Randolph Terrell
Lee
Albany
Clay
Calhoun Dougherty
Turner Worth
Tift
Ben Hill
Irwin
Jeff Davis
Appling
Coffee
Bacon
HinesvilleFt. Stewart
Long
Wayne
McIntosh
Early Miller
Baker
Mitchell
Colquitt
Berrien Cook
Atkinson
Ware
Pierce
Brunswick
Brantley
Glynn
Seminole Decatur
Grady
Thomas
Lanier
Brooks Valdosta
Clinch
Charlton
Camden
Lowndes Echols
2
GEORGIA Nonagricultural Employment (000's)
Change in Jobs
Change in Jobs
Prelminary
Revised
Revised
from DEC 2004
from JAN 2004
JAN 2005 DEC 2004
JAN 2004
Net %
Net %
Total Nonfarm Total Private Goods Producing Service-Providing Private Service-Providing Natural Res & Mining Construction
Construction of Buildings Heavy and Civil Engineering Construction Specialty Trade Contractors Manufacturing Durable Goods Wood Product Manufacturing Transportation Equipment Manufacturing Non-Durable Goods Food Manufacturing Textile Mills Textile Product Mills Paper Manufacturing Trade, Transportation and Utilities Wholesale Trade Merchant Wholesalers, Durable Goods Merchant Wholesalers, Non-durable Goods Wholesale Electronic Markets and Agents and Brokers Retail Trade Food and Beverage Stores General Merchandise Stores Miscellaneous Store Retailers Transportation, Warehousing, and Utilities Utilities Transport & Warehousing
Air Transportation Truck Transportation Couriers and Messengers Warehousing and Storage Information Telecommunications Wired Telecommunications Carriers Wireless Telecommunications Carriers Internet Service Providers, Search Portals, and DP Financial Activities Finance and Insurance Insurance Carriers and Related Activities Real Estate, Rental and Leasing Professional and Business Professional, Scientific, and Technical Services Accounting, Tax Preparation and Bookkeeping Architectural, Engineering and Related Services Computer Systems Design and Related Services Management and Technical Consulting Services Management of Companies and Enterprises Admin and Support, Waste Mngmnt and Remediation Employment Services Educational and Health Services Educational Services Colleges, Universities, and Professional Schools Health Care and Social Assistance Ambulatory Health Care Services Hospitals Nursing and Residential Care Facilities Social Assistance Leisure and Hospitality Arts, Entertainment, and Recreation Amusement, Gambling, and Recreation Accommodation and Food Services Accommodation Food Services and Drinking Places Other Services Repair and Maintenance Personal and Laundry Services Religious, Grantmaking, Civic, Professional and Similar Government Federal Government Department of Defense State Government State Government Education Local Government Local Government Education
3,853.5 3,209.3
641.0 3,212.5 2,568.3
12.0 192.7
43.3 29.2 120.2 436.3 196.2 24.0 42.6 240.1 65.5 34.1 38.1 24.2 818.8 207.9 107.0 59.7 41.2 434.1 77.1 90.2 25.0 176.8 19.8 157.0 38.9 46.8 19.3 25.8 117.2 48.9 27.2 10.6 17.5 218.5 160.8 65.2 57.7 509.0 191.8 30.5 33.6 41.2 23.3 52.8 264.4 132.8 407.9 70.0 44.8 337.9 126.3 114.9 49.6 47.1 345.5 32.7 25.2 312.8 39.8 273.0 151.4 33.7 34.4 83.3 644.2 92.9 32.2 153.2 66.6 398.1 246.2
3,932.2 3,281.6
650.5 3,281.7 2,631.1
12.0 197.2
44.4 29.6 123.2 441.3 198.9 24.5 43.9 242.4 66.2 34.5 37.9 24.5 853.2 210.0 108.2 60.2 41.6 461.5 80.2 98.6 26.0 181.7 20.0 161.7 39.2 47.6 20.4 26.1 117.8 48.7 27.0 10.5 18.3 220.4 162.0 66.0 58.4 519.9 194.9 27.8 34.2 41.9 24.0 52.7 272.3 138.8 411.6 71.3 45.6 340.3 126.8 115.3 50.4 47.8 354.7 34.7 27.0 320.0 40.7 279.3 153.5 33.6 35.3 84.6 650.6 94.5 32.8 155.3 69.8 400.8 245.1
3,818.2 3,188.4
648.2 3,170.0 2,540.2
12.3 193.7
43.9 30.6 119.2 442.2 196.5 23.3 42.3 245.7 65.2 36.5 38.9 24.5 817.4 202.8 106.1 58.6 38.1 439.8 79.0 87.5 24.8 174.8 20.1 154.7 38.7 45.8 19.1 22.6 118.4 49.6 28.9 10.5 18.5 214.9 157.3 64.0 57.6 493.2 192.3 30.8 33.9 41.1 23.9 52.8 248.1 118.2 400.8 68.8 43.1 332.0 123.9 112.5 49.3 46.3 340.6 31.5 22.6 309.1 39.2 269.9 154.9 35.3 34.0 85.6 629.8 90.8 31.8 151.4 65.9 387.6 241.1
-78.7 -72.3
-9.5 -69.2 -62.8
+.0 -4.5 -1.1
-.4 -3.0 -5.0 -2.7
-.5 -1.3 -2.3
-.7 -.4 +.2 -.3 -34.4 -2.1 -1.2 -.5 -.4 -27.4 -3.1 -8.4 -1.0 -4.9 -.2 -4.7 -.3 -.8 -1.1 -.3 -.6 +.2 +.2 +.1 -.8 -1.9 -1.2 -.8 -.7 -10.9 -3.1 +2.7 -.6 -.7 -.7 +.1 -7.9 -6.0 -3.7 -1.3 -.8 -2.4 -.5 -.4 -.8 -.7 -9.2 -2.0 -1.8 -7.2 -.9 -6.3 -2.1 +.1 -.9 -1.3 -6.4 -1.6 -.6 -2.1 -3.2 -2.7 +1.1
-2.0 -2.2 -1.5 -2.1 -2.4 +0.0 -2.3 -2.5 -1.4 -2.4 -1.1 -1.4 -2.0 -3.0 -0.9 -1.1 -1.2 +0.5 -1.2 -4.0 -1.0 -1.1 -0.8 -1.0 -5.9 -3.9 -8.5 -3.8 -2.7 -1.0 -2.9 -0.8 -1.7 -5.4 -1.1 -0.5 +0.4 +0.7 +1.0 -4.4 -0.9 -0.7 -1.2 -1.2 -2.1 -1.6 +9.7 -1.8 -1.7 -2.9 +0.2 -2.9 -4.3 -0.9 -1.8 -1.8 -0.7 -0.4 -0.3 -1.6 -1.5 -2.6 -5.8 -6.7 -2.3 -2.2 -2.3 -1.4 +0.3 -2.5 -1.5 -1.0 -1.7 -1.8 -1.4 -4.6 -0.7 +0.4
+35.3 +0.9 +20.9 +0.7
-7.2 -1.1 +42.5 +1.3 +28.1 +1.1
-.3 -2.4 -1.0 -0.5
-.6 -1.4 -1.4 -4.6 +1.0 +0.8 -5.9 -1.3
-.3 -0.2 +.7 +3.0 +.3 +0.7 -5.6 -2.3 +.3 +0.5 -2.4 -6.6 -.8 -2.1 -.3 -1.2 +1.4 +0.2 +5.1 +2.5 +.9 +0.8 +1.1 +1.9 +3.1 +8.1 -5.7 -1.3 -1.9 -2.4 +2.7 +3.1 +.2 +0.8 +2.0 +1.1 -.3 -1.5 +2.3 +1.5 +.2 +0.5 +1.0 +2.2 +.2 +1.0 +3.2 +14.2 -1.2 -1.0 -.7 -1.4 -1.7 -5.9 +.1 +1.0 -1.0 -5.4 +3.6 +1.7 +3.5 +2.2 +1.2 +1.9 +.1 +0.2 +15.8 +3.2 -.5 -0.3 -.3 -1.0 -.3 -0.9 +.1 +0.2 -.6 -2.5 +.0 +0.0 +16.3 +6.6 +14.6 +12.4 +7.1 +1.8 +1.2 +1.7 +1.7 +3.9 +5.9 +1.8 +2.4 +1.9 +2.4 +2.1 +.3 +0.6 +.8 +1.7 +4.9 +1.4 +1.2 +3.8 +2.6 +11.5 +3.7 +1.2 +.6 +1.5 +3.1 +1.1 -3.5 -2.3 -1.6 -4.5 +.4 +1.2 -2.3 -2.7 +14.4 +2.3 +2.1 +2.3 +.4 +1.3 +1.8 +1.2 +.7 +1.1 +10.5 +2.7 +5.1 +2.1
Note: These preliminary estimates were prepared in cooperation with the U.S. Department of Labor, Bureau of Labor Statistics, based upon monthly reports submitted by selected employers
throughout Georgia. The estimates include all full- and part-time wage and salary workers who were employed during or received pay for any part of the pay period that includes the twelfth of the
month. Proprietors, domestic workers, self-employed persons, unpaid family workers and personnel of the armed forces are excluded. Estimates based on 2004 benchmark.
Source: Georgia Department of Labor, Workforce Information & Analysis
3
ATLANTA MSA Nonagricultural Employment (000's)
Preliminary
Revised
JAN 2005 DEC 2004
Revised JAN 2004
Change in Jobs
from DEC 2004
Net
%
Change in Jobs from JAN 2004
Net %
Total Nonfarm Total Private Goods Producing Service-Providing Private Service-Providing Natural Res & Mining Construction
Construction of Buildings Specialty Trade Contractors Manufacturing Durable Goods Transportation Equipment Manufacturing Non-Durable Goods Food Manufacturing Trade, Transportation and Utilities Wholesale Trade Merchant Wholesalers, Durable Goods Merchant Wholesalers, Non-durable Goods Wholesale Electronic Markets and Agents and Brokers Retail Trade Food and Beverage Stores General Merchandise Stores Miscellaneous Store Retailers Transportation, Warehousing, and Utilities Utilities Transport & Warehousing
Air Transportation Truck Transportation Couriers and Messengers Information Telecommunications Wired Telecommunications Carriers Wireless Telecommunications Carriers Internet Service Providers, Search Portals, and DP Financial Activities Finance and Insurance Insurance Carriers and Related Activities Real Estate, Rental and Leasing Professional and Business Professional, Scientific, and Technical Services Accounting, Tax Preparation and Bookkeeping Architectural, Engineering and Related Services Computer Systems Design and Related Services Management and Technical Consulting Services Management of Companies and Enterprises Admin and Support, Waste Mngmnt and Remediation Employment Services Educational and Health Services Educational Services Health Care and Social Assistance Ambulatory Health Care Services Hospitals Social Assistance Leisure and Hospitality Arts, Entertainment, and Recreation Accommodation and Food Services Accommodation Food Services and Drinking Places Other Services Repair and Maintenance Personal and Laundry Services Government Federal Government State Government Local Government
2,243.9 1,934.1
295.0 1,948.9 1,639.1
2.1 120.9
25.6 77.5 172.0 87.8 18.7 84.2 24.1 511.0 153.4 81.2 40.1 32.1 239.4 43.5 44.9 16.2 118.2 10.7 107.5 37.6 27.2 15.2 90.7 38.6 23.1
8.5 13.1 151.4 109.4 44.0 42.0 369.0 147.9 20.1 25.9 32.3 20.7 39.9 181.2 90.4 221.1 45.8 175.3 69.8 59.3 26.0 204.5 22.7 181.8 21.4 160.4 91.4 20.0 23.0 309.8 46.9 60.7 202.2
2,293.3 1,982.3
301.5 1,991.8 1,680.8
2.2 124.0
26.5 79.1 175.3 90.1 19.6 85.2 24.3 532.9 154.6 81.9 40.4 32.3 256.9 46.2 49.7 17.0 121.4 10.8 110.6 37.9 27.6 16.2 91.3 38.4 22.9
8.4 13.7 153.2 110.9 44.9 42.3 376.5 149.9 18.5 26.5 32.9 21.2 40.0 186.6 94.2 223.5 46.7 176.8 70.1 59.6 26.5 210.7 23.9 186.8 22.1 164.7 92.7 19.9 23.7 311.0 46.6 61.5 202.9
2,218.3 1,917.7
297.6 1,920.7 1,620.1
2.0 121.0
26.1 76.7 174.6 88.6 17.7 86.0 22.9 513.1 149.9 80.6 39.2 30.1 245.9 45.2 44.4 16.3 117.3 10.8 106.5 37.4 25.6 15.2 93.4 40.0 24.8
8.4 14.4 149.1 107.9 42.7 41.2 356.1 145.0 20.7 26.1 30.9 20.7 39.9 171.2 82.0 217.6 44.7 172.9 68.2 58.2 25.9 199.3 20.0 179.3 21.9 157.4 91.5 20.5 22.1 300.6 45.4 60.6 194.6
-49.4 -48.2
-6.5 -42.9 -41.7
-.1 -3.1
-.9 -1.6 -3.3 -2.3
-.9 -1.0
-.2 -21.9
-1.2 -.7 -.3 -.2
-17.5 -2.7 -4.8 -.8 -3.2 -.1 -3.1 -.3 -.4 -1.0 -.6 +.2 +.2 +.1 -.6 -1.8 -1.5 -.9 -.3 -7.5 -2.0 +1.6 -.6 -.6 -.5 -.1 -5.4 -3.8 -2.4 -.9 -1.5 -.3 -.3 -.5 -6.2 -1.2 -5.0 -.7 -4.3 -1.3 +.1 -.7 -1.2 +.3 -.8 -.7
-2.2 -2.4 -2.2 -2.2 -2.5 -4.5 -2.5 -3.4 -2.0 -1.9 -2.6 -4.6 -1.2 -0.8 -4.1 -0.8 -0.9 -0.7 -0.6 -6.8 -5.8 -9.7 -4.7 -2.6 -0.9 -2.8 -0.8 -1.4 -6.2 -0.7 +0.5 +0.9 +1.2 -4.4 -1.2 -1.4 -2.0 -0.7 -2.0 -1.3 +8.6 -2.3 -1.8 -2.4 -0.3 -2.9 -4.0 -1.1 -1.9 -0.8 -0.4 -0.5 -1.9 -2.9 -5.0 -2.7 -3.2 -2.6 -1.4 +0.5 -3.0 -0.4 +0.6 -1.3 -0.3
+25.6 +1.2 +16.4 +0.9
-2.6 -0.9 +28.2 +1.5 +19.0 +1.2
+.1 +5.0 -.1 -0.1 -.5 -1.9 +.8 +1.0 -2.6 -1.5 -.8 -0.9 +1.0 +5.6 -1.8 -2.1 +1.2 +5.2 -2.1 -0.4 +3.5 +2.3 +.6 +0.7 +.9 +2.3 +2.0 +6.6 -6.5 -2.6 -1.7 -3.8 +.5 +1.1 -.1 -0.6 +.9 +0.8 -.1 -0.9 +1.0 +0.9 +.2 +0.5 +1.6 +6.3 +.0 +0.0 -2.7 -2.9 -1.4 -3.5 -1.7 -6.9 +.1 +1.2 -1.3 -9.0 +2.3 +1.5 +1.5 +1.4 +1.3 +3.0 +.8 +1.9 +12.9 +3.6 +2.9 +2.0 -.6 -2.9 -.2 -0.8 +1.4 +4.5 +.0 +0.0 +.0 +0.0 +10.0 +5.8 +8.4 +10.2 +3.5 +1.6 +1.1 +2.5 +2.4 +1.4 +1.6 +2.3 +1.1 +1.9 +.1 +0.4 +5.2 +2.6 +2.7 +13.5 +2.5 +1.4 -.5 -2.3 +3.0 +1.9 -.1 -0.1 -.5 -2.4 +.9 +4.1 +9.2 +3.1 +1.5 +3.3 +.1 +0.2 +7.6 +3.9
Note: These preliminary estimates were prepared in cooperation with the U.S. Department of Labor, Bureau of Labor Statistics, based upon monthly reports submitted by selected employers
in the Atlanta Metropolitan Statistical Area, which includes Barrow, Bartow, Butts, Carroll, Cherokee, Clayton, Cobb, Coweta, Dawson, DeKalb, Douglas, Fayette, Forsyth, Fulton, Gwinnett, Haralson, Heard, Henry, Jasper, Lamer, Meriwether, Newton, Paulding, Pickens, Pike, Rockdale, Spalding and Walton counties. The estimates include all full- and part-time wage and salary workers who were employed during or received pay for any part of the pay period that includes the twelfth of the month. Proprietors, domestic workers, self-employed persons, unpaid family workers and personnel of the armed forces are excluded. Estimates based on 2004 benchmark.
Source: Georgia Department of Labor, Workforce Information & Analysis
4
ALBANY MSA Nonagricultural Employment (000's)
Preliminary
Revised
Revised
JAN 2005 DEC 2004 JAN 2004
Change in Jobs from DEC 2004
Net %
Change in Jobs
from JAN 2004
NET
%
Total Nonfarm Total Private Goods Producing Service-Providing Private Service-Providing Natural Resources, Mining and Construction Manufacturing Trade, Transportation and Utilities
Wholesale Trade Retail Trade Transportation, Warehousing, and Utilities Information Financial Activities Professional and Business Services Educational and Health Services Leisure and Hospitality Other Services Government Federal Government State Government Local Government
63.6
64.6
63.2
-1.0 -1.5
50.2
51.1
49.8
-.9 -1.8
11.4
11.5
11.2
-.1 -0.9
52.2
53.1
52.0
-.9 -1.7
38.8
39.6
38.6
-.8 -2.0
3.5
3.5
3.5
+.0 +0.0
7.9
8.0
7.7
-.1 -1.3
13.8
14.4
13.4
-.6 -4.2
2.7
2.8
2.6
-.1 -3.6
8.3
8.7
8.1
-.4 -4.6
2.8
2.9
2.7
-.1 -3.4
.9
.9
1.0
+.0 +0.0
2.4
2.4
2.4
+.0 +0.0
5.8
5.9
5.7
-.1 -1.7
8.8
8.9
8.8
-.1 -1.1
4.4
4.4
4.5
+.0 +0.0
2.7
2.7
2.8
+.0 +0.0
13.4
13.5
13.4
-.1 -0.7
2.7
2.7
2.6
+.0 +0.0
2.9
3.0
2.9
-.1 -3.3
7.8
7.8
7.9
+.0 +0.0
+.4 +0.6 +.4 +0.8 +.2 +1.8 +.2 +0.4 +.2 +0.5 +.0 +0.0 +.2 +2.6 +.4 +3.0 +.1 +3.8 +.2 +2.5 +.1 +3.7 -.1 -10.0 +.0 +0.0 +.1 +1.8 +.0 +0.0 -.1 -2.2 -.1 -3.6 +.0 +0.0 +.1 +3.8 +.0 +0.0 -.1 -1.3
Note: These preliminary estimates were prepared in cooperation with the U.S. Department of Labor, Bureau of Labor Statistics, based upon monthly reports submitted by selected employers
in the Albany Metropolitan Statistical Area, which includes Baker, Dougherty, Lee, Terrell and Worth counties. The estimates include all full- and part-time wage and salary workers who were employed during or received pay for any part of the pay period that includes the twelfth of the month. Proprietors, domestic workers, self-employed persons, unpaid family workers and personnel of the armed forces are excluded. Estimates based on 2004 benchmark.
ATHENS - CLARKE MSA Nonagricultural Employment (000's)
Preliminary
Revised
Revised
JAN 2005 DEC 2004 JAN 2004
Change in Jobs
from DEC 2004
Net
%
Change in Jobs
from JAN 2004
Net
%
Total Nonfarm Total Private Goods Producing Service-Providing Private Service-Providing Natural Resources, Mining and Construction Manufacturing Trade, Transportation and Utilities
Wholesale Trade Retail Trade Transportation, Warehousing, and Utilities Information Financial Activities Professional and Business Services Educational and Health Services Leisure and Hospitality Other Services Government Federal Government State Government Local Government
75.7 53.9 12.5 63.2 41.4
3.2 9.3 12.8 2.3 9.0 1.5
.9 2.7 5.3 8.8 7.2 3.7 21.8 1.7 13.3 6.8
77.5 55.3 12.6 64.9 42.7
3.3 9.3 13.4 2.3 9.5 1.6
.9 2.7 5.4 9.0 7.4 3.9 22.2 1.7 13.7 6.8
75.4 54.4 12.6 62.8 41.8
3.2 9.4 13.0 2.3 9.3 1.4
.9 2.7 5.7 9.0 6.8 3.7 21.0 1.7 12.6 6.7
-1.8 -2.3 -1.4 -2.5
-.1 -0.8 -1.7 -2.6 -1.3 -3.0
-.1 -3.0 +.0 +0.0 -.6 -4.5 +.0 +0.0 -.5 -5.3 -.1 -6.3 +.0 +0.0 +.0 +0.0 -.1 -1.9 -.2 -2.2 -.2 -2.7 -.2 -5.1 -.4 -1.8 +.0 +0.0 -.4 -2.9 +.0 +0.0
+.3 +0.4 -.5 -0.9 -.1 -0.8 +.4 +0.6 -.4 -1.0 +.0 +0.0 -.1 -1.1 -.2 -1.5 +.0 +0.0 -.3 -3.2 +.1 +7.1 +.0 +0.0 +.0 +0.0 -.4 -7.0 -.2 -2.2 +.4 +5.9 +.0 +0.0 +.8 +3.8 +.0 +0.0 +.7 +5.6 +.1 +1.5
Note: These preliminary estimates were prepared in cooperation with the U.S. Department of Labor, Bureau of Labor Statistics, based upon monthly reports submitted by selected employers in
the Athens - Clarke County Metropolitan Statistical Area, which includes Clarke, Madison, Oconee and Oglethorpe counties. The estimates include all full- and part-time wage and salary workers who were employed during or received pay for any part of the pay period that includes the twelfth of the month. Proprietors, domestic workers, self-employed persons, unpaid family workers and personnel of the armed forces are excluded. Estimates based on 2004 benchmark.
Source: Georgia Department of Labor, Workforce Information & Analysis
5
AUGUSTA-RICHMOND MSA Nonagricultural Employment (000's)
Preliminary Revised
Revised
JAN 2005 DEC 2004 JAN 2004
Change in Jobs from DEC 2004
Net %
Change in Jobs from JAN 2004
Net %
Total Nonfarm Total Private Goods Producing Service-Providing Private Service-Providing Natural Resources, Mining and Construction Manufacturing Trade, Transportation and Utilities
Wholesale Trade Retail Trade Transportation, Warehousing, and Utilities Information Financial Activities Professional and Business Services Educational and Health Services Leisure and Hospitality Other Services Government Federal Government State Government Local Government
208.9 168.3
36.9 172.0 131.4
12.5 24.4 37.2
5.5 25.6
6.1 3.2 6.5 32.2 25.9 18.5 7.9 40.6 7.0 12.5 21.1
212.1 171.2
37.5 174.6 133.7
12.7 24.8 38.0
5.5 26.5
6.0 3.2 6.7 32.8 26.2 18.8 8.0 40.9 7.1 12.7 21.1
210.4 169.6
38.9 171.5 130.7
13.8 25.1 35.7
5.3 24.6
5.8 3.4 7.2 31.9 26.0 18.5 8.0 40.8 7.2 12.8 20.8
-3.2 -1.5 -2.9 -1.7
-.6 -1.6 -2.6 -1.5 -2.3 -1.7
-.2 -1.6 -.4 -1.6 -.8 -2.1 +.0 +0.0 -.9 -3.4 +.1 +1.7 +.0 +0.0 -.2 -3.0 -.6 -1.8 -.3 -1.1 -.3 -1.6 -.1 -1.3 -.3 -0.7 -.1 -1.4 -.2 -1.6 +.0 +0.0
-1.5 -1.3 -2.0 +.5 +.7 -1.3
-.7 +1.5
+.2 +1.0
+.3 -.2 -.7 +.3 -.1 +.0 -.1 -.2 -.2 -.3 +.3
-0.7 -0.8 -5.1 +0.3 +0.5 -9.4 -2.8 +4.2 +3.8 +4.1 +5.2 -5.9 -9.7 +0.9 -0.4 +0.0 -1.3 -0.5 -2.8 -2.3 +1.4
Note: These preliminary estimates were prepared in cooperation with the U.S. Department of Labor, Bureau of Labor Statistics, based upon monthly reports submitted by selected employers in the
Augusta - Richmond County Metropolitan Statistical Area, which includes Burke, Columbia, McDuffie and Richmond counties in Georgia and Aiken and Edgefield counties in South Carolina. The estimates include all full- and part-time wage and salary workers who were employed during or received pay for any part of the pay period that includes the twelfth of the month. Proprietors, domestic
workers, self-employed persons, unpaid family workers and personnel of the armed forces are excluded. Estimates based on 2004 benchmark.
BRCUoNluSmWbuIsCNKonaMgrSicAultuNraonlagErimcupltluoryalmEemnptlo(ym0e0nt0(s0)00's)
Preliminary
Revised Revised
JAN 2005 DEC 2004 JAN 2004
Change in Jobs from DEC 2004
Net %
Change in Jobs from JAN 2004
Net %
Total Nonfarm Total Private Goods Producing Service-Providing Private Service-Providing Natural Resources, Mining and Construction Manufacturing Trade, Transportation and Utilities
Wholesale Trade Retail Trade Transportation, Warehousing, and Utilities Information Financial Activities Professional and Business Services Educational and Health Services Leisure and Hospitality Other Services Government Federal Government State Government Local Government
41.9 32.7
6.2 35.7 26.5
3.0 3.2 7.8
.9 5.3 1.6
.7 1.7 2.9 3.3 8.4 1.7 9.2 1.6 2.1 5.5
42.7 33.4
6.3 36.4 27.1
3.0 3.3 8.0
.9 5.5 1.6
.7 1.7 3.0 3.4 8.6 1.7 9.3 1.7 2.1 5.5
41.4 32.1
6.1 35.3 26.0
2.8 3.3 7.6
.8 5.4 1.4
.6 1.7 3.1 3.3 8.0 1.7 9.3 1.8 1.9 5.6
-.8 -1.9 -.7 -2.1 -.1 -1.6 -.7 -1.9 -.6 -2.2 +.0 +0.0 -.1 -3.0 -.2 -2.5 +.0 +0.0 -.2 -3.6 +.0 +0.0 +.0 +0.0 +.0 +0.0 -.1 -3.3 -.1 -2.9 -.2 -2.3 +.0 +0.0 -.1 -1.1 -.1 -5.9 +.0 +0.0 +.0 +0.0
+.5 +1.2 +.6 +1.9 +.1 +1.6 +.4 +1.1 +.5 +1.9 +.2 +7.1 -.1 -3.0 +.2 +2.6 +.1 +12.5 -.1 -1.9 +.2 +14.3 +.1 +16.7 +.0 +0.0 -.2 -6.5 +.0 +0.0 +.4 +5.0 +.0 +0.0 -.1 -1.1 -.2 -11.1 +.2 +10.5 -.1 -1.8
Note: These preliminary estimates were prepared in cooperation with the U.S. Department of Labor, Bureau of Labor Statistics, based upon monthly reports submitted by selected
employers in the Brunswick Metropolitan Statistical Area, which includes Brantley, Glynn and McIntosh counties. The estimates include all full- and part-time wage and salary workers who were employed during or received pay for any part of the pay period that includes the twelfth of the month. Proprietors, domestic workers, self-employed persons, unpaid family workers and personnel of the armed forces are excluded. Estimates based on 2004 benchmark.
Source: Georgia Department of Labor, Workforce Information & Analysis
6
COLUMBUS MSA Nonagricultural Employment (000's)
Preliminary
Revised Revised
JAN 2005 DEC 2004 JAN 2004
Change in Jobs from DEC 2004
Net %
Change in Jobs from JAN 2004
Net %
Total Nonfarm Total Private Goods Producing Service-Providing Private Service-Providing Natural Resources, Mining and Construction Manufacturing Trade, Transportation and Utilities
Wholesale Trade Retail Trade Transportation, Warehousing, and Utilities Information Financial Activities Finance and Insurance Insurance Carriers and Related Activities Professional and Business Services Educational and Health Services Leisure and Hospitality Other Services Government Federal Government State Government Local Government
117.8 96.1 20.2 97.6 75.9 5.6 14.6 18.0 2.6 13.6 1.8 6.2 9.0 7.2 4.9 12.4 13.4 12.3 4.6 21.7 4.9 3.9 12.9
120.1 98.3 20.3 99.8 78.0 5.6 14.7 19.1 2.7 14.5 1.9 6.2 9.1 7.1 4.8 12.7 13.8 12.4 4.7 21.8 4.9 4.1 12.8
117.7 96.3 20.4 97.3 75.9 5.7 14.7 17.9 2.6 13.6 1.7 6.7 8.7 6.9 4.6 12.1 13.3 12.3 4.9 21.4 4.9 3.7 12.8
-2.3 -1.9 -2.2 -2.2
-.1 -0.5 -2.2 -2.2 -2.1 -2.7 +.0 +0.0
-.1 -0.7 -1.1 -5.8
-.1 -3.7 -.9 -6.2 -.1 -5.3 +.0 +0.0 -.1 -1.1 +.1 +1.4 +.1 +2.1 -.3 -2.4 -.4 -2.9 -.1 -0.8 -.1 -2.1 -.1 -0.5 +.0 +0.0 -.2 -4.9 +.1 +0.8
+.1 +0.1 -.2 -0.2 -.2 -1.0 +.3 +0.3 +.0 +0.0 -.1 -1.8 -.1 -0.7 +.1 +0.6 +.0 +0.0 +.0 +0.0 +.1 +5.9 -.5 -7.5 +.3 +3.4 +.3 +4.3 +.3 +6.5 +.3 +2.5 +.1 +0.8 +.0 +0.0 -.3 -6.1 +.3 +1.4 +.0 +0.0 +.2 +5.4 +.1 +0.8
Note: These preliminary estimates were prepared in cooperation with the U.S. Department of Labor, Bureau of Labor Statistics, based upon monthly reports submitted by selected
employers in the Columbus Metropolitan Statistical Area, which includes Chattahoochee, Harris, Marion and Muscogee counties in Georgia and Russell County in Alabama. The estimates include all full- and part-time wage and salary workers who were employed during or received pay for any part of the pay period that includes the twelfth of the month. Proprietors, domestic
workers, self-employed persons, unpaid family workers and personnel of the armed forces are excluded. Estimates based on 2004 benchmark.
DALTON MSA Nonagricultural Employment (000's)
Preliminary
Revised Revised
JAN 2005 DEC 2004 JAN 2004
Change in Jobs from DEC 2004
Net %
Change in Jobs from JAN 2004
Net %
Total Nonfarm Total Private Goods Producing Service-Providing Private Service-Providing Natural Resources, Mining and Construction Manufacturing
Non-Durable Goods Textile Mills Textile Product Mills Trade, Transportation and Utilities Wholesale Trade Retail Trade Transportation, Warehousing, and Utilities Information Financial Activities Professional and Business Services Educational and Health Services Leisure and Hospitality Other Services Government Federal Government State Government Local Government
74.8
75.9
75.6
-1.1 -1.4
67.7
68.7
68.5
-1.0 -1.5
31.9
32.1
32.4
-.2 -0.6
42.9
43.8
43.2
-.9 -2.1
35.8
36.6
36.1
-.8 -2.2
1.4
1.4
1.4
+.0 +0.0
30.5
30.7
31.0
-.2 -0.7
28.7
28.9
29.3
-.2 -0.7
3.6
3.8
4.0
-.2 -5.3
20.7
20.8
21.4
-.1 -0.5
15.3
15.8
15.3
-.5 -3.2
4.1
4.2
4.0
-.1 -2.4
6.8
7.1
6.9
-.3 -4.2
4.4
4.5
4.4
-.1 -2.2
.7
.7
.7
+.0 +0.0
1.6
1.6
1.6
+.0 +0.0
8.6
8.7
8.6
-.1 -1.1
4.1
4.2
4.2
-.1 -2.4
3.6
3.7
3.7
-.1 -2.7
1.9
1.9
2.0
+.0 +0.0
7.1
7.2
7.1
-.1 -1.4
.3
.3
.3
+.0 +0.0
1.2
1.3
1.1
-.1 -7.7
5.6
5.6
5.7
+.0 +0.0
-.8 -1.1 -.8 -1.2 -.5 -1.5 -.3 -0.7 -.3 -0.8 +.0 +0.0 -.5 -1.6 -.6 -2.0 -.4 -10.0 -.7 -3.3 +.0 +0.0 +.1 +2.5 -.1 -1.4 +.0 +0.0 +.0 +0.0 +.0 +0.0 +.0 +0.0 -.1 -2.4 -.1 -2.7 -.1 -5.0 +.0 +0.0 +.0 +0.0 +.1 +9.1 -.1 -1.8
Note: These preliminary estimates were prepared in cooperation with the U.S. Department of Labor, Bureau of Labor Statistics, based upon monthly reports submitted by selected employers
in the Dalton Metropolitan Statistical Area, which includes Murray and Whitfield counties. The estimates include all full- and part-time wage and salary workers who were employed during or received pay for any part of the pay period that includes the twelfth of the month. Proprietors, domestic workers, self-employed persons, unpaid family workers and personnel of the armed forces are excluded. Estimates based on 2004 benchmark.
Source: Georgia Department of Labor, Workforce Information & Analysis
7
GAINESVILLE MSA Nonagricultural Employment (000's)
Preliminary Revised
Revised
JAN 2005 DEC 2004 JAN 2004
Change in Jobs from DEC 2004
Net %
Change in Jobs from JAN 2004
Net %
Total Nonfarm Total Private Goods Producing Service-Providing Private Service-Providing Natural Resources, Mining and Construction Manufacturing
Non-Durable Goods Food Manufacturing Trade, Transportation and Utilities Wholesale Trade Retail Trade Transportation, Warehousing, and Utilities Information Financial Activities Professional and Business Services Educational and Health Services Leisure and Hospitality Other Services Government Federal Government State Government Local Government
67.2
68.7
66.6
-1.5 -2.2
57.7
59.2
57.3
-1.5 -2.5
20.7
21.1
20.8
-.4 -1.9
46.5
47.6
45.8
-1.1 -2.3
37.0
38.1
36.5
-1.1 -2.9
3.8
4.0
3.7
-.2 -5.0
16.9
17.1
17.1
-.2 -1.2
10.6
10.7
10.8
-.1 -0.9
7.9
7.9
7.6
+.0 +0.0
12.5
13.1
12.2
-.6 -4.6
3.7
3.8
3.7
-.1 -2.6
6.8
7.2
6.6
-.4 -5.6
2.0
2.1
1.9
-.1 -4.8
.4
.4
.5
+.0 +0.0
3.2
3.2
3.1
+.0 +0.0
4.5
4.5
4.8
+.0 +0.0
9.4
9.7
9.1
-.3 -3.1
4.6
4.8
4.5
-.2 -4.2
2.4
2.4
2.3
+.0 +0.0
9.5
9.5
9.3
+.0 +0.0
.5
.5
.5
+.0 +0.0
2.5
2.5
2.4
+.0 +0.0
6.5
6.5
6.4
+.0 +0.0
+.6 +0.9 +.4 +0.7 -.1 -0.5 +.7 +1.5 +.5 +1.4 +.1 +2.7 -.2 -1.2 -.2 -1.9 +.3 +3.9 +.3 +2.5 +.0 +0.0 +.2 +3.0 +.1 +5.3 -.1 -20.0 +.1 +3.2 -.3 -6.3 +.3 +3.3 +.1 +2.2 +.1 +4.3 +.2 +2.2 +.0 +0.0 +.1 +4.2 +.1 +1.6
Note: These preliminary estimates were prepared in cooperation with the U.S. Department of Labor, Bureau of Labor Statistics, based upon monthly reports submitted by selected employers
in the Gainesville Metropolitan Statistical Area, which comprises Hall county. The estimates include all full- and part-time wage and salary workers who were employed during or received pay for any part of the pay period that includes the twelfth of the month. Proprietors, domestic workers, self-employed persons, unpaid family workers and personnel of the armed forces are excluded.
Estimates based on 2004 benchmark.
HINESVILLE - FT. STEWART MSA Nonagricultural Employment (000's)
Preliminary Revised
Revised
JAN 2005 DEC 2004 JAN 2004
Change in Jobs from DEC 2004
Net %
Change in Jobs from JAN 2004
Net %
Total Nonfarm Total Private Goods Producing Service-Providing Private Service-Providing Trade, Transportation and Utilities Government
Federal Government State Government Local Government
16.5
16.7
10.0
10.1
1.7
1.7
14.8
15.0
8.3
8.4
2.6
2.7
6.5
6.6
2.9
3.0
.4
.5
3.2
3.1
16.4 9.6 1.5
14.9 8.1 2.5 6.8 2.9 .4 3.5
-.2 -1.2 -.1 -1.0 +.0 +0.0 -.2 -1.3 -.1 -1.2 -.1 -3.7 -.1 -1.5 -.1 -3.3 -.1 -20.0 +.1 +3.2
+.1 +0.6 +.4 +4.2 +.2 +13.3 -.1 -0.7 +.2 +2.5 +.1 +4.0 -.3 -4.4 +.0 +0.0 +.0 +0.0 -.3 -8.6
Note: These preliminary estimates were prepared in cooperation with the U.S. Department of Labor, Bureau of Labor Statistics, based upon monthly reports submitted by selected employers in the
Hinesville - Ft. Stewart Metropolitan Statistical Area, which includes Liberty and Long counties. The estimates include all full- and part-time wage and salary workers who were employed during or received pay for any part of the pay period that includes the twelfth of the month. Proprietors, domestic workers, self-employed persons, unpaid family workers and personnel of the armed forces are excluded. Estimates based on 2004 benchmark.
Source: Georgia Department of Labor, Workforce Information & Analysis
8
MACON MSA Nonagricultural Employment (000's)
Preliminary Revised
Revised
JAN 2005 DEC 2004 JAN 2004
Change in Jobs from DEC 2004
Net %
Change in Jobs from JAN 2004
Net %
Total Nonfarm Total Private Goods Producing Service-Providing Private Service-Providing Natural Resources, Mining and Construction Manufacturing Trade, Transportation and Utilities
Wholesale Trade Retail Trade Transportation, Warehousing, and Utilities Information Financial Activities Professional and Business Services Educational and Health Services Leisure and Hospitality Other Services Government Federal Government State Government Local Government
99.1
101.3
99.6
-2.2 -2.2
83.9
86.0
84.6
-2.1 -2.4
13.9
14.3
14.8
-.4 -2.8
85.2
87.0
84.8
-1.8 -2.1
70.0
71.7
69.8
-1.7 -2.4
5.3
5.4
5.6
-.1 -1.9
8.6
8.9
9.2
-.3 -3.4
18.6
19.5
19.0
-.9 -4.6
3.0
3.1
3.1
-.1 -3.2
11.7
12.4
12.0
-.7 -5.6
3.9
4.0
3.9
-.1 -2.5
2.0
2.1
2.2
-.1 -4.8
8.4
8.4
8.4
+.0 +0.0
11.1
11.4
10.2
-.3 -2.6
17.6
17.8
17.4
-.2 -1.1
8.6
8.7
8.6
-.1 -1.1
3.7
3.8
4.0
-.1 -2.6
15.2
15.3
15.0
-.1 -0.7
1.5
1.6
1.5
-.1 -6.3
3.8
3.8
3.7
+.0 +0.0
9.9
9.9
9.8
+.0 +0.0
-.5 -0.5 -.7 -0.8 -.9 -6.1 +.4 +0.5 +.2 +0.3 -.3 -5.4 -.6 -6.5 -.4 -2.1 -.1 -3.2 -.3 -2.5 +.0 +0.0 -.2 -9.1 +.0 +0.0 +.9 +8.8 +.2 +1.1 +.0 +0.0 -.3 -7.5 +.2 +1.3 +.0 +0.0 +.1 +2.7 +.1 +1.0
Note: These preliminary estimates were prepared in cooperation with the U.S. Department of Labor, Bureau of Labor Statistics, based upon monthly reports submitted by selected employers
in the Macon Metropolitan Statistical Area, which includes Bibb, Crawford, Jones, Monroe and Twiggs counties. The estimates include all full- and part-time wage and salary workers who were employed during or received pay for any part of the pay period that includes the twelfth of the month. Proprietors, domestic workers, self-employed persons, unpaid family workers and personnel
of the armed forces are excluded. Estimates based on 2004 benchmark.
ROME MSA Nonagricultural Employment (000's)
Preliminary Revised
Revised
JAN 2005 DEC 2004 JAN 2004
Change in Jobs from DEC 2004
Net %
Change in Jobs from JAN 2004
Net %
Total Nonfarm Total Private Goods Producing Service-Providing Private Service-Providing Natural Resources, Mining and Construction Manufacturing Trade, Transportation and Utilities
Wholesale Trade Retail Trade Transportation, Warehousing, and Utilities Information Financial Activities Professional and Business Services Educational and Health Services Leisure and Hospitality Other Services Government Federal Government State Government Local Government
42.4
43.2
42.3
36.0
36.7
36.0
10.6
10.8
10.4
31.8
32.4
31.9
25.4
25.9
25.6
1.3
1.4
1.2
9.3
9.4
9.2
7.4
7.7
7.5
1.7
1.8
1.7
4.8
5.0
4.9
.9
.9
.9
.9
.9
.9
1.4
1.5
1.6
3.4
3.5
3.3
7.8
7.7
7.6
3.0
3.1
3.1
1.5
1.5
1.6
6.4
6.5
6.3
.2
.2
.3
2.2
2.2
2.1
4.0
4.1
3.9
-.8 -1.9 -.7 -1.9 -.2 -1.9 -.6 -1.9 -.5 -1.9 -.1 -7.1 -.1 -1.1 -.3 -3.9 -.1 -5.6 -.2 -4.0 +.0 +0.0 +.0 +0.0 -.1 -6.7 -.1 -2.9 +.1 +1.3 -.1 -3.2 +.0 +0.0 -.1 -1.5 +.0 +0.0 +.0 +0.0 -.1 -2.4
+.1 +0.2 +.0 +0.0 +.2 +1.9 -.1 -0.3 -.2 -0.8 +.1 +8.3 +.1 +1.1 -.1 -1.3 +.0 +0.0 -.1 -2.0 +.0 +0.0 +.0 +0.0 -.2 -12.5 +.1 +3.0 +.2 +2.6 -.1 -3.2 -.1 -6.3 +.1 +1.6 -.1 -33.3 +.1 +4.8 +.1 +2.6
Note: These preliminary estimates were prepared in cooperation with the U.S. Department of Labor, Bureau of Labor Statistics, based upon monthly reports submitted by selected employers
in the Rome Metropolitan Statistical Area, which comprises Floyd county. The estimates include all full- and part-time wage and salary workers who were employed during or received pay for any part of the pay period that includes the twelfth of the month. Proprietors, domestic workers, self-employed persons, unpaid family workers and personnel of the armed forces are excluded. Estimates based on 2004 benchmark.
Source: Georgia Department of Labor, Workforce Information & Analysis
9
SAVANNAH MSA Nonagricultural Employment (000's)
Preliminary Revised
Revised
JAN 2005 DEC 2004 JAN 2004
Change in Jobs from DEC 2004
Net %
Change in Jobs
from JAN 2004
Net
%
Total Nonfarm Total Private Goods Producing Service-Providing Private Service-Providing Natural Resources, Mining and Construction Manufacturing Trade, Transportation and Utilities
Wholesale Trade Retail Trade Transportation, Warehousing, and Utilities Information Financial Activities Professional and Business Services Educational and Health Services Leisure and Hospitality Accommodation and Food Services Other Services Government Federal Government State Government Local Government
142.3 120.9
21.9 120.4
99.0 8.5
13.4 32.5
5.1 18.5
8.9 1.9 5.9 15.6 19.8 16.9 15.5 6.4 21.4 2.7 5.2 13.5
146.2 124.6
22.4 123.8 102.2
8.7 13.7 34.2
5.3 19.4
9.5 1.9 6.2 16.2 19.6 17.7 16.2 6.4 21.6 2.8 5.2 13.6
139.2 117.9
21.5 117.7
96.4 8.2
13.3 30.6
4.9 17.5
8.2 1.9 6.0 15.3 19.6 16.4 14.9 6.6 21.3 2.7 5.2 13.4
-3.9 -2.7 -3.7 -3.0
-.5 -2.2 -3.4 -2.7 -3.2 -3.1
-.2 -2.3 -.3 -2.2 -1.7 -5.0 -.2 -3.8 -.9 -4.6 -.6 -6.3 +.0 +0.0 -.3 -4.8 -.6 -3.7 +.2 +1.0 -.8 -4.5 -.7 -4.3 +.0 +0.0 -.2 -0.9 -.1 -3.6 +.0 +0.0 -.1 -0.7
+3.1 +3.0
+.4 +2.7 +2.6
+.3 +.1 +1.9 +.2 +1.0 +.7 +.0 -.1 +.3 +.2 +.5 +.6 -.2 +.1 +.0 +.0 +.1
+2.2 +2.5 +1.9 +2.3 +2.7 +3.7 +0.8 +6.2 +4.1 +5.7 +8.5 +0.0 -1.7 +2.0 +1.0 +3.0 +4.0 -3.0 +0.5 +0.0 +0.0 +0.7
Note: These preliminary estimates were prepared in cooperation with the U.S. Department of Labor, Bureau of Labor Statistics, based upon monthly reports submitted by selected employers
in the Savannah Metropolitan Statistical Area, which includes Bryan, Chatham and Effingham counties. The estimates include all full- and part-time wage and salary workers who were employed during or received pay for any part of the pay period that includes the twelfth of the month. Proprietors, domestic workers, self-employed persons, unpaid family workers and personnel of the armed forces are excluded. Estimates based on 2004 benchmark.
VALDOSTA MSA Nonagricultural Employment (000's)
Preliminary Revised
Revised
JAN 2005 DEC 2004 JAN 2004
Change in Jobs from DEC 2004
Net %
Change in Jobs
from JAN 2004
Net
%
Total Nonfarm Total Private Goods Producing Service-Providing Private Service-Providing Natural Resources, Mining and Construction Manufacturing Trade, Transportation and Utilities
Wholesale Trade Retail Trade Transportation, Warehousing, and Utilities Information Financial Activities Professional and Business Services Educational and Health Services Leisure and Hospitality Other Services Government Federal Government State Government Local Government
51.8
53.0
51.2
-1.2 -2.3
39.7
40.6
39.4
-.9 -2.2
9.2
9.3
9.0
-.1 -1.1
42.6
43.7
42.2
-1.1 -2.5
30.5
31.3
30.4
-.8 -2.6
3.0
3.0
2.9
+.0 +0.0
6.2
6.3
6.1
-.1 -1.6
11.6
12.1
11.2
-.5 -4.1
1.4
1.4
1.4
+.0 +0.0
8.2
8.7
7.8
-.5 -5.7
2.0
2.0
2.0
+.0 +0.0
.5
.5
.6
+.0 +0.0
1.7
1.8
1.7
-.1 -5.6
4.0
4.0
4.3
+.0 +0.0
5.2
5.2
5.2
+.0 +0.0
5.6
5.8
5.4
-.2 -3.4
1.9
1.9
2.0
+.0 +0.0
12.1
12.4
11.8
-.3 -2.4
.8
.8
.8
+.0 +0.0
4.2
4.4
3.9
-.2 -4.5
7.1
7.2
7.1
-.1 -1.4
+.6 +1.2 +.3 +0.8 +.2 +2.2 +.4 +0.9 +.1 +0.3 +.1 +3.4 +.1 +1.6 +.4 +3.6 +.0 +0.0 +.4 +5.1 +.0 +0.0 -.1 -16.7 +.0 +0.0 -.3 -7.0 +.0 +0.0 +.2 +3.7 -.1 -5.0 +.3 +2.5 +.0 +0.0 +.3 +7.7 +.0 +0.0
Note: These preliminary estimates were prepared in cooperation with the U.S. Department of Labor, Bureau of Labor Statistics, based upon monthly reports submitted by selected employers
in the Valdosta Metropolitan Statistical Area, which includes Brooks, Echols, Lanier and Lowndes counties. The estimates include all full- and part-time wage and salary workers who were employed during or received pay for any part of the pay period that includes the twelfth of the month. Proprietors, domestic workers, self-employed persons, unpaid family workers and personnel of the armed forces are excluded. Estimates based on 2004 benchmark.
Source: Georgia Department of Labor, Workforce Information & Analysis
10
WARNER ROBINS MSA Nonagricultural Employment (000's)
Preliminary Revised
Revised
JAN 2005 DEC 2004 JAN 2004
Change in Jobs from DEC 2004
Net %
Change in Jobs
from JAN 2004
Net
%
Total Nonfarm Total Private Goods Producing Service-Providing Private Service-Providing Natural Resources, Mining and Construction Manufacturing Trade, Transportation and Utilities
Wholesale Trade Retail Trade Transportation, Warehousing, and Utilities Information Financial Activities Professional and Business Services Educational and Health Services Leisure and Hospitality Other Services Government Federal Government State Government Local Government
50.2
51.0
50.3
29.7
30.2
30.2
5.4
5.6
5.3
44.8
45.4
45.0
24.3
24.6
24.9
1.4
1.4
1.4
4.0
4.2
3.9
7.0
7.3
6.7
.7
.7
.7
5.7
6.0
5.5
.6
.6
.5
.5
.5
.6
1.4
1.3
1.5
5.4
5.3
5.5
3.5
3.6
3.8
4.8
4.9
5.0
1.7
1.7
1.8
20.5
20.8
20.1
12.7
12.8
12.5
1.1
1.1
1.0
6.7
6.9
6.6
-.8 -1.6 -.5 -1.7 -.2 -3.6 -.6 -1.3 -.3 -1.2 +.0 +0.0 -.2 -4.8 -.3 -4.1 +.0 +0.0 -.3 -5.0 +.0 +0.0 +.0 +0.0 +.1 +7.7 +.1 +1.9 -.1 -2.8 -.1 -2.0 +.0 +0.0 -.3 -1.4 -.1 -0.8 +.0 +0.0 -.2 -2.9
-.1 -0.2 -.5 -1.7 +.1 +1.9 -.2 -0.4 -.6 -2.4 +.0 +0.0 +.1 +2.6 +.3 +4.5 +.0 +0.0 +.2 +3.6 +.1 +20.0 -.1 -16.7 -.1 -6.7 -.1 -1.8 -.3 -7.9 -.2 -4.0 -.1 -5.6 +.4 +2.0 +.2 +1.6 +.1 +10.0 +.1 +1.5
Note: These preliminary estimates were prepared in cooperation with the U.S. Department of Labor, Bureau of Labor Statistics, based upon monthly reports submitted by selected employers
in the Warner Robins Metropolitan Statistical Area, which comprises Houston county. The estimates include all full- and part-time wage and salary workers who were employed during or received pay for any part of the pay period that includes the twelfth of the month. Proprietors, domestic workers, self-employed persons, unpaid family workers and personnel of the armed forces are excluded. Estimates based on 2004 benchmark.
Source: Georgia Department of Labor, Workforce Information & Analysis
11
S E C T OR S P O
I N F O R M
DEFINITION
The information sector comprises establishments engaged in the following processes:
producing and distributing information and cultural products
providing the means to transmit or distribute these products as well as data or communications
processing data.
The main components of this sector are the publishing industries, including software publishing, and both traditional publishing and publishing exclusively on the internet; the motion picture and sound recording industries; the internet service providers and web search portals and data processing industries; telecommunications; and the information services industries.
GEORGIA SITUATION
The job market in Georgia's Information sector has been on a rollercoaster ride for the last ten years. The industry furiously added jobs from 1995 until the apogee was reached in December 2000, however, the onset of the 2001 recession and technology "bubble burst" quickly altered that trend. Spectacular job increases were replaced with painful declines as product oversupply, mergers and acquisitions, bankruptcies and the fierce competition of the market place forced a negative correction.
After the robust job gains of 1995 until 2000, the industry began a downward slide. The hardest hit sector was "wired" telecommunications carriers. The sector lost about 35 percent of its workforce from 2000 through 2004. Employment declines also occurred in software publishers, telecommunications resellers, motion picture and sound recording industries and publishing industries, except
Information Employment
(Employment in Thousands)
160.0
150.0
140.0
134.6
130.0 120.0
125.6 120.3 113.5
110.0 106.5
143.5 143.8
131.8 123.4 118.5
100.0
1995
1996
1997
1998
1999
2000
2001
2002 2003 2004
Note: Data not seasonally adjusted Source: Georgia Department of Labor, Workforce Information & Analysis Division
Wired Telecommunications Carriers
(Employment in Thousands)
60.0
Employment
50.0
43.0
41.1
40.9
40.0
37.1 37.1
38.2
38.5
34.9
30.0
30.2 27.9
20.0
10.0
1995 1996
1997 1998 1999
2000 2001
2002 2003 2004
Note: Data not seasonally adjusted Source: Georgia Department of Labor, Workforce Information & Analysis Division
Wired vs. Wireless
Telecommunications Carriers
(Employment in Thousands)
60
Wireless Telecom
Wired Telecom 50
43.0
41.1
40.9
40
37.1 37.1 38.2 38.5
34.9
30.2
30
27.9
20
10 4.7
5.9
6.9
7.4
12.2 14.2 7.8 8.8
9.8 10.6
0 1995 1996 1997 1998 1999 2000 2001 2002 2003 2004
Note: Data not seasonally adjusted Source: Georgia Department of Labor, Workforce Information & Analysis Division
12
O T L I G H T
A T I O N
the internet. Job gains were recorded in "wireless" telecommunications, but are probably short lived, as oversupply issues threaten the sector.
Even though Information has been shedding jobs in telecommunications, many occupations in the sub-sector are predicted to be among Georgia's "Hot Careers to 2012". These careers are expected to have almost 500 job openings annually while paying above average wages. Even more career opportunities will exist outside the Information industry for trained IT professionals since over 90 percent are employed in other sectors. Occupational titles for IT range from Computer and Information Systems Managers to Computer Systems Analysts to Telecommunications Line Installers and Repairers.
FUTURE
Two employment forecasts for the 2005 Information sector are available.
The UGA Terry College of Business publication "Georgia Business and Economic Conditions" sees job growth of 1.9 percent in the Information sector. They believe many of the "overcapacity issues have been resolved and demand is surging for a broad range of service offerings." Specifically mentioned catalysts are revenue growth generated by mobile telecom, demand for DSP and broadband connections and the transformation potential of the wireless Internet. Despite these trends, job growth returning to pre-recession levels will not happen in 2005.
The latest analysis in "Forecast of Georgia and Atlanta" by the Economic Forecasting Center at Georgia State University predicts job growth of 1.2 percent in 2005. Job growth had been elusive in the past as large telecom employers laid off workers. Although this situation is not entirely rectified and potential future events may have a dampening effect, the good news is companies are spending on technology again.
TRENDS & NEWS
The 2005 federal budget raises H-1B visas 20,000 over the current 65,000 caps--Computerworld November-29-04.
Demand for IT professionals is flat, but contract workers from the business and professional services sector are still sought after--Computer World, November-29-04
No letup in outsourcing is seen as software design and data processing functions join service call centers and manufacturing sectors as targets-- "What's Ahead 2005," Kiplinger Letter
Hottest Tech Skills:--Computer World, December 13, 2004 Unix Windows
Data Base Oracle SQL
Programming Languages C, C+ ASP
New opportunities in the IT market-- by Dan Agronow, December 13, 2004 Security Data base work
Information Technology (IT) is the fastest growing sector in the economy with a 68% increase in growth rate projected between 2002 and 20012-- Bureau of Labor Statistics (BLS)
Seven of the 30 fastest growing occupations are expected to be IT related, with a projected average employment growth rate of 43%--BLS
The IT industry is predicted to add 632,000 new jobs nationally between 2002 and 2012--BLS
KnDidoYwou ?
92% of all IT workers are in non-IT companies, 80% of which are in small companies-- Information Technology Association of America
13
Dimensions - Measuring Georgia's Labor Force
Unemployment rates -- Georgia and U.S.
7.5%
Ge orgi a
U.S.
6.5%
5.5%
4.5%
3.5%
Jan Fe b Mar Apr May Jun Jul Aug Se p O ct Nov De c Jan
2004
2005
Percent Southeastern states and U.S. unemployment rates
10
9
January 2005 De ce mbe r 2004
8
7.7
7.4
7
6.3
6.9 6.6
6 5
5.5 5.2
4.4 4.5
5.0
4.7
5.6 4.6
5.5 5.3
5.2
5.7 5.1
4
3
2
1
0
AL
FL
GA
KY
MS
NC
SC
TN
US
14
Georgia
Georgia Labor Force Estimates (not seasonally adjusted) Place of Residence - Persons 16 Years and Older
Employment Status
Preliminary JAN 2005
Revised DEC 2004
Revised JAN 2004
Change From
Revised
Revised
DEC 2004
JAN 2004
Civilian labor force Employed Unemployed Rate
4,432,418 4,210,200
222,218 5.0
4,449,867 4,238,697
211,170 4.7
4,354,764 4,156,780
197,984 4.5
-17,449 -28,497 11,048
77,654 53,420 24,234
Albany MSA
Civilian labor force Employed Unemployed
Rate
72,558 68,392
4,166 5.7
72,445 68,520
3,925 5.4
71,022 67,506
3,516 5.0
113 -128 241
1,536 886 650
Athens-Clarke County MSA
Civilian labor force Employed Unemployed Rate
91,650
92,104
90,929
-454
721
88,078
88,744
87,655
-666
423
3,572
3,360
3,274
212
298
3.9
3.6
3.6
Atlanta MSA
Civilian labor force Employed Unemployed
Rate
2,517,599 2,394,995
122,604 4.9
2,535,106 2,417,867
117,239 4.6
2,483,553 2,371,812
111,741 4.5
-17,507 -22,872
5,365
34,046 23,183 10,863
Augusta-Richmond County MSA
Civilian labor force Employed Unemployed
Rate
236,863 222,240
14,623 6.2
236,258 222,612
13,646 5.8
236,147 223,832
12,315 5.2
605 -372 977
716 -1,592 2,308
Brunswick MSA
Civilian labor force Employed Unemployed
Rate
49,930 47,652
2,278 4.6
49,817 47,657
2,160 4.3
48,775 46,747
2,028 4.2
113
1,155
-5
905
118
250
Columbus MSA
Civilian labor force Employed Unemployed Rate
121,437
121,870
121,379
-433
58
114,764
115,556
114,616
-792
148
6,673
6,314
6,763
359
-90
5.5
5.2
5.6
Dalton MSA
Civilian labor force Employed Unemployed Rate
62,308 59,357
2,951 4.7
62,453 59,380
3,073 4.9
62,424 59,971
2,453 3.9
-145 -23
-122
-116 -614 498
Gainesville MSA
Civilian labor force Employed Unemployed Rate
76,622
76,946
75,862
-324
760
73,412
73,855
72,859
-443
553
3,210
3,091
3,003
119
207
4.2
4.0
4.0
Hinesville-Ft. Stewart MSA
Civilian labor force Employed Unemployed
Rate
26,598
26,695
26,110
-97
488
24,928
25,074
24,837
-146
91
1,670
1,621
1,273
49
397
6.3
6.1
4.9
Note: Employment includes nonagricultural wage and salary employment, self-employment, unpaid family and private household workers and agricultural
workers. Persons in labor disputes are counted as employed. The use of unrounded data does not imply that the numbers are exact. Georgia and Metropolitan Statistical Area data have not been seasonally adjusted. Seasonally adjusted data for Georgia available upon request.
Albany MSA: Baker, Dougherty, Lee, Terrell, and Worth counties. Athens - Clarke County MSA: Clarke, Madison, Oconee, and Oglethorpe counties. Atlanta MSA: Barrow, Bartow, Butts, Carroll, Cherokee, Clayton, Cobb, Coweta, Dawson, DeKalb, Douglas, Fayette, Forsyth, Fulton, Gwinnett, Haralson, Heard, Henry, Jasper, Lamar, Meriwether, Newton, Paulding, Pickens, Pike, Rockdale, Spalding, and Walton counties. Augusta - Richmond County MSA: Burke, Columbia, McDuffie, and Richmond counties in Georgia and Aiken and Edgefield counties in South Carolina. Brunswick MSA: Brantley, Glynn, and McIntosh counties. Columbus MSA: Chattahoochee, Harris, Marion, and Muscogee counties in Georgia and Russell County in Alabama. Dalton MSA: Murray and Whitfield counties. Gainesville MSA: Hall County. Hinesville - Fort Stewart MSA: Liberty and Long counties. Macon MSA: Bibb, Crawford, Jones, Monroe, and Twiggs counties. Rome MSA: Floyd County. Savannah MSA: Bryan, Chatham, and Effingham counties. Valdosta MSA: Brooks, Echols, Lanier, and Lowndes counties. Warner Robins MSA: Houston County.
Source: Georgia Department of Labor, Workforce Information & Analysis
15
Macon MSA Rome MSA Savannah MSA Valdosta MSA Warner Robins MSA
Georgia Labor Force Estimates (not seasonally adjusted) Place of Residence - Persons 16 Years and Older
Employment Status
Preliminary JAN 2005
Revised DEC 2004
Revised JAN 2004
Change From
Revised
Revised
DEC 2004
JAN 2004
Civilian labor force Employed Unemployed Rate
105,520
105,621
104,689
-101
831
99,724
100,134
99,784
-410
-60
5,796
5,487
4,905
309
891
5.5
5.2
4.7
Civilian labor force Employed Unemployed
Rate
48,722 46,185
2,537 5.2
48,711 46,259
2,452 5.0
47,658 45,732
1,926 4.0
11
1,064
-74
453
85
611
Civilian labor force Employed Unemployed Rate
152,712 145,892
6,820 4.5
154,522 148,063
6,459 4.2
148,920 142,815
6,105 4.1
-1,810 -2,171
361
3,792 3,077
715
Civilian labor force Employed Unemployed
Rate
56,767 54,334
2,433 4.3
56,847 54,547
2,300 4.0
55,658 53,534
2,124 3.8
-80 -213 133
1,109 800 309
Civilian labor force Employed Unemployed
Rate
58,297
58,315
57,784
-18
513
55,660
55,849
55,680
-189
-20
2,637
2,466
2,104
171
533
4.5
4.2
3.6
United States Labor Force Estimates Place of Residence - Persons 16 Years and Older
Area
Employment Status
JAN 2005
DEC 2004
JAN 2004
Change From
DEC 2004
JAN 2004
United States
(Seasonally adjusted)
Civilian labor force Employed Unemployed
Rate
147,979,000 140,241,000
7,737,000 5.2
148,203,000 140,156,000
8,047,000 5.4
146,785,000 138,481,000
8,303,000 5.7
-224,000 85,000
-310,000
1,194,000 1,760,000 -566,000
United States
(Not Seasonally adjusted)
Civilian labor force Employed Unemployed
Rate
147,125,000 138,682,000
8,444,000 5.7
147,877,000 140,278,000
7,599,000 5.1
146,068,000 136,924,000
9,144,000 6.3
-752,000 -1,596,000
845,000
1,057,000 1,758,000 -700,000
Note: Employment includes nonagricultural wage and salary employment, self-employment, unpaid family and private household workers and agricultural
workers. Persons in labor disputes are counted as employed. The use of unrounded data does not imply that the numbers are exact. Georgia and Metropolitan Statistical Area data have not been seasonally adjusted. Seasonally adjusted data for Georgia available upon request.
Albany MSA: Baker, Dougherty, Lee, Terrell, and Worth counties. Athens - Clarke County MSA: Clarke, Madison, Oconee, and Oglethorpe counties. Atlanta MSA: Barrow, Bartow, Butts, Carroll, Cherokee, Clayton, Cobb, Coweta, Dawson, DeKalb, Douglas, Fayette, Forsyth, Fulton, Gwinnett, Haralson, Heard, Henry, Jasper, Lamar, Meriwether, Newton, Paulding, Pickens, Pike, Rockdale, Spalding, and Walton counties. Augusta - Richmond County MSA: Burke, Columbia, McDuffie, and Richmond counties in Georgia and Aiken and Edgefield counties in South Carolina. Brunswick MSA: Brantley, Glynn, and McIntosh counties. Columbus MSA: Chattahoochee, Harris, Marion, and Muscogee counties in Georgia and Russell County in Alabama. Dalton MSA: Murray and Whitfield counties. Gainesville MSA: Hall County. Hinesville - Fort Stewart MSA: Liberty and Long counties. Macon MSA: Bibb, Crawford, Jones, Monroe, and Twiggs counties. Rome MSA: Floyd County. Savannah MSA: Bryan, Chatham, and Effingham counties. Valdosta MSA: Brooks, Echols, Lanier, and Lowndes counties. Warner Robins MSA: Houston County.
Source: Georgia Department of Labor, Workforce Information & Analysis
16
Georgia Labor Force Estimates by County (not seasonally adjusted)
Georgia
Appling Atkinson Bacon Baker Baldwin
Place of Residence - Persons 16 Years and Older
Preliminary January 2005
Revised December 2004
Labor Force
Employment
Unemployment Number Rate
Labor Force
Employment
Unemployment Number Rate
4,432,418 4,210,200 222,218 5.0
8,208 7,632
576 7.0
3,469 3,246
223 6.4
4,228 3,999
229 5.4
1,824 1,741
83 4.6
20,298 19,276 1,022 5.0
4,449,867 4,238,697 211,170 4.7
8,073 3,407 4,165 1,823 20,347
7,589 3,223 3,952 1,744 19,375
484 6.0 184 5.4 213 5.1
79 4.3 972 4.8
Banks Barrow Bartow Ben Hill Berrien
8,464 8,152
312 3.7
28,360 27,148 1,212 4.3
44,122 41,818 2,304 5.2
7,593 7,129
464 6.1
8,412 8,081
331 3.9
8,485 8,157
328 3.9
28,668 27,408 1,260 4.4
44,483 42,218 2,265 5.1
7,535 7,090
445 5.9
8,399 8,076
323 3.8
Bibb Bleckley Brantley Brooks Bryan
70,359 66,433 3,926 5.6
5,368 4,915
453 8.4
7,332 6,971
361 4.9
7,357 7,042
315 4.3
13,370 12,891
479 3.6
70,513 66,706 3,807 5.4
5,278 4,901
377 7.1
7,328 6,972
356 4.9
7,399 7,070
329 4.4
13,541 13,083
458 3.4
Bulloch Burke Butts Calhoun Camden
27,485 26,237 1,248 4.5
9,660 8,987
673 7.0
9,896 9,406
490 5.0
2,292 2,130 162 7.1
19,297 18,360 937 4.9
27,603 26,385 1,218 4.4
9,610 8,997
613 6.4
9,986 9,496
490 4.9
2,248 2,109
139 6.2
19,344 18,457 887 4.6
Candler Carroll Catoosa Charlton Chatham
4,314 4,099
215 5.0
49,366 46,857 2,509 5.1
32,672 31,336 1,336 4.1
4,192 3,984
208 5.0
117,155 111,682 5,473 4.7
4,285 4,085
200 4.7
49,684 47,304 2,380 4.8
32,845 31,632 1,213 3.7
4,165 3,972
193 4.6
118,514 113,344 5,170 4.4
Chattahoochee 3,243 2,993 250 7.7
Chattooga
11,258 10,675
583 5.2
Cherokee
94,122 90,575 3,547 3.8
Clarke
55,089 52,844 2,245 4.1
Clay
1,434 1,356
78 5.4
3,246 3,006
240 7.4
11,325 10,711
614 5.4
94,729 91,440 3,289 3.5
55,337 53,244 2,093 3.8
1,417 1,345
72 5.1
Clayton Clinch Cobb Coffee Colquitt
136,691 128,732 7,959 5.8
2,435 2,284
151 6.2
377,323 361,063 16,260 4.3
17,101 16,002 1,099 6.4
18,223 17,260
963 5.3
137,842 129,961 7,881 5.7
2,427 2,266
161 6.6
380,378 364,511 15,867 4.2
16,845 15,890
955 5.7
17,963 17,082
881 4.9
Columbia Cook Coweta Crawford Crisp
52,085 49,861 2,224 4.3
6,857 6,438
419 6.1
53,609 51,325 2,284 4.3
5,900 5,589
311 5.3
9,371 8,825
546 5.8
51,961 49,917 2,044 3.9
6,841 6,439
402 5.9
53,936 51,815 2,121 3.9
5,878 5,612
266 4.5
9,356 8,832
524 5.6
Revised January 2004
Labor Force
Employment
Unemployment Number Rate
4,354,764 4,156,780 197,984 4.5
7,953 3,320 4,019 1,805 19,413
7,420 3,083 3,796 1,718 18,538
533 6.7 237 7.1 223 5.5
87 4.8 875 4.5
8,283 28,080 43,557
7,135 8,060
7,978 26,886 41,413
6,724 7,763
305 3.7 1,194 4.3 2,144 4.9
411 5.8 297 3.7
69,872 4,997 7,164 7,227
13,060
66,473 4,761 6,839 6,938
12,619
3,399 4.9 236 4.7 325 4.5 289 4.0 441 3.4
26,662 9,718 9,792 2,195
18,710
25,515 9,042 9,315 2,062
17,840
1,147 4.3 676 7.0 477 4.9 133 6.1 870 4.6
4,145 48,651 32,027
4,043 114,219
3,970 46,403 31,077
3,841 109,326
175 4.2 2,248 4.6
950 3.0 202 5.0 4,893 4.3
3,214 10,702 92,943 54,605
1,384
2,984 10,224 89,698 52,591
1,319
230 7.2 478 4.5 3,245 3.5 2,014 3.7
65 4.7
134,576 127,486 7,090 5.3 2,341 2,204 137 5.9
372,411 357,568 14,843 4.0 16,436 15,199 1,237 7.5 17,304 16,449 855 4.9
51,888 6,500
52,736 5,909 9,120
50,165 6,152
50,828 5,592 8,610
1,723 3.3 348 5.4
1,908 3.6 317 5.4 510 5.6
17
Georgia Labor Force Estimates by County (not seasonally adjusted)
Dade Dawson Decatur DeKalb Dodge
Place of Residence - Persons 16 Years and Older
Preliminary January 2005
Revised December 2004
Labor Force
Employment
Unemployment Number Rate
Labor Force
Employment
Unemployment Number Rate
8,255 7,845
410 5.0
10,107 9,711
396 3.9
11,750 11,022 728 6.2
381,365 360,301 21,064 5.5
8,465 7,983
482 5.7
8,292 7,919 373 4.5
10,173 9,804 369 3.6
11,723 10,996 727 6.2
384,115 363,742 20,373 5.3
8,432 7,982
450 5.3
Dooly Dougherty Douglas Early Echols
4,476 4,195
281 6.3
41,148 38,525 2,623 6.4
56,035 53,207 2,828 5.0
5,686 5,370
316 5.6
1,957 1,876
81 4.1
4,418 4,141 277 6.3
41,067 38,598 2,469 6.0
56,519 53,715 2,804 5.0
5,622 5,337 285 5.1
1,939 1,884
55 2.8
Effingham Elbert Emanuel Evans Fannin
22,188 10,223 10,423
4,780 9,779
21,319 9,568 9,761 4,566 9,299
869 3.9 655 6.4 662 6.4 214 4.5 480 4.9
22,467 10,254 10,285
4,731 9,787
21,636 9,603 9,756 4,555 9,330
831 3.7 651 6.3 529 5.1 176 3.7 457 4.7
Fayette Floyd Forsyth Franklin Fulton
52,463 50,416 2,047 3.9 48,722 46,185 2,537 5.2 68,983 66,715 2,268 3.3 10,208 9,672 536 5.3 427,450 403,222 24,228 5.7
52,753 50,898 1,855 3.5 48,711 46,259 2,452 5.0 69,496 67,352 2,144 3.1 10,154 9,669 485 4.8 430,049 407,073 22,976 5.3
Gilmer Glascock Glynn Gordon Grady
12,771 12,260
511 4.0
1,216 1,155
61 5.0
37,507 35,866 1,641 4.4
25,397 24,182 1,215 4.8
11,357 10,830
527 4.6
12,771 12,274 497 3.9
1,214 1,157
57 4.7
37,438 35,870 1,568 4.2
25,442 24,262 1,180 4.6
11,278 10,754 524 4.6
Greene
6,288 5,836
452 7.2
Gwinnett
384,700 368,506 16,194 4.2
Habersham 19,196 18,488 708 3.7
Hall
76,622 73,412 3,210 4.2
Hancock
3,449 3,182 267 7.7
6,212 5,826 386 6.2 387,316 372,025 15,291 3.9
19,222 18,510 712 3.7 76,946 73,855 3,091 4.0
3,450 3,199 251 7.3
Haralson Harris Hart Heard Henry
12,985 12,324 661 5.1
13,568 13,054
514 3.8
11,226 10,601
625 5.6
5,080 4,791
289 5.7
82,226 78,517 3,709 4.5
13,075 12,441 634 4.8
13,615 13,108
507 3.7
11,214 10,597 617 5.5
5,095 4,836 259 5.1
82,683 79,267 3,416 4.1
Houston Irwin Jackson Jasper Jeff Davis
58,297 55,660 2,637 4.5
4,353 4,072 281 6.5
23,420 22,394 1,026 4.4
6,206 5,913
293 4.7
5,411 4,978 433 8.0
58,315 55,849 2,466 4.2 4,279 4,051 228 5.3
23,466 22,471 995 4.2 6,265 5,969 296 4.7 5,376 4,951 425 7.9
Revised January 2004
Labor Force
Employment
Unemployment Number Rate
8,105 7,780
325 4.0
9,970 9,617
353 3.5
11,436 10,714
722 6.3
376,300 356,813 19,487 5.2
8,077 7,689
388 4.8
4,266 4,003
263 6.2
40,264 38,026 2,238 5.6
55,133 52,692 2,441 4.4
5,419 5,135
284 5.2
1,919 1,849
70 3.6
21,640 9,716 9,954 4,610 9,565
20,869 9,138 9,467 4,426 9,116
771 3.6 578 5.9 487 4.9 184 4.0 449 4.7
51,670 49,928 1,742 3.4
47,658 45,732 1,926 4.0
68,290 66,069 2,221 3.3
9,872 9,344
528 5.3
421,181 399,319 21,862 5.2
12,232 11,787
445 3.6
1,177 1,127
50 4.2
36,664 35,185 1,479 4.0
24,576 23,551 1,025 4.2
10,679 10,214
465 4.4
6,061 5,690
371 6.1
380,607 364,939 15,668 4.1
18,501 17,827
674 3.6
75,862 72,859 3,003 4.0
3,278 3,061
217 6.6
12,818 12,204
614 4.8
13,522 13,013 509 3.8
10,656 10,168
488 4.6
4,989 4,744
245 4.9
80,740 77,757 2,983 3.7
57,784 55,680 2,104 3.6
4,038 3,841
197 4.9
22,783 21,826
957 4.2
6,143 5,856
287 4.7
5,172 4,782
390 7.5
18
Georgia Labor Force Estimates by County (not seasonally adjusted)
Jefferson Jenkins Johnson Jones Lamar
Place of Residence - Persons 16 Years and Older
Preliminary January 2005
Revised December 2004
Labor Force
6,861 3,249 3,597 12,585 8,081
Employment
Unemployment Number Rate
6,238 3,047 3,386 11,991 7,568
623 9.1 202 6.2 211 5.9 594 4.7 513 6.3
Labor Force
6,804 3,218 3,591 12,602 8,063
Employment
Unemployment Number Rate
6,237 3,031 3,397 12,040 7,640
567 8.3 187 5.8 194 5.4 562 4.5 423 5.2
Lanier Laurens Lee Liberty Lincoln
3,329 3,181 148 4.4 21,374 20,169 1,205 5.6 14,797 14,231 566 3.8 21,493 20,054 1,439 6.7
3,572 3,301 271 7.6
3,327 3,194
133 4.0
21,445 20,241 1,204 5.6
14,801 14,258 543 3.7
21,590 20,171 1,419 6.6
3,536 3,287
249 7.0
Long Lowndes Lumpkin McDuffie McIntosh
5,105 4,874 231 4.5
44,123 42,234 1,889 4.3
11,688 11,199 489 4.2
10,287 9,559
728 7.1
5,091 4,815 276 5.4
5,105 4,903 202 4.0
44,183 42,400 1,783 4.0
11,776 11,229
547 4.6
10,191 9,570
621 6.1
5,051 4,815 236 4.7
Macon Madison Marion Meriwether Miller
5,162 14,381
3,220 10,227
3,332
4,779 13,837
3,058 9,482 3,184
383 7.4 544 3.8 162 5.0 745 7.3 148 4.4
5,101 14,493
3,196 10,193
3,297
4,744 13,941
3,071 9,573 3,157
357 7.0 552 3.8 125 3.9 620 6.1 140 4.2
Mitchell Monroe Montgomery Morgan Murray
9,526 12,031
3,910 8,379 19,642
8,955 11,439 3,641 8,024 18,758
571 6.0 592 4.9 269 6.9 355 4.2 884 4.5
9,428 12,014
3,865 8,379 19,705
8,857 11,486 3,622 8,033 18,765
571 6.1 528 4.4 243 6.3 346 4.1 940 4.8
Muscogee Newton Oconee Oglethorpe Paulding
80,778 76,237 4,541 5.6
38,723 36,644 2,079 5.4
15,191 14,710 481 3.2
6,989 6,687
302 4.3
54,406 52,035 2,371 4.4
80,815 76,554 4,261 5.3
38,962 36,994 1,968 5.1
15,250 14,821 429 2.8
7,024 6,738
286 4.1
54,787 52,531 2,256 4.1
Peach Pickens Pierce Pike Polk
10,671 14,033
7,585 7,443 19,256
9,932 13,517
7,233 7,073 18,314
739 6.9 516 3.7 352 4.6 370 5.0 942 4.9
10,651 14,206
7,579 7,470 19,327
9,939 13,646
7,232 7,141 18,407
712 6.7 560 3.9 347 4.6 329 4.4 920 4.8
Pulaski Putnam Quitman Rabun Randolph
4,464 9,631 1,033 7,495 2,859
4,219 9,165
972 7,160 2,661
245 5.5 466 4.8
61 5.9 335 4.5 198 6.9
4,430 9,642 1,037 7,468 2,820
4,208 9,179
961 7,195 2,623
222 5.0 463 4.8
76 7.3 273 3.7 197 7.0
Revised January 2004
Labor Force
Employment
Unemployment Number Rate
6,609 3,161 3,458 12,463 7,928
6,082 2,972 3,300 11,998 7,495
527 8.0 189 6.0 158 4.6 465 3.7 433 5.5
3,264 20,912 14,498 21,062
3,446
3,135 19,660 14,047 19,980
3,240
129 4.0 1,252 6.0
451 3.1 1,082 5.1
206 6.0
5,048 43,248 11,332 10,173
4,947
4,857 41,612 10,916
9,617 4,723
191 3.8 1,636 3.8
416 3.7 556 5.5 224 4.5
5,133 14,367
3,254 10,031
3,229
4,689 13,770
3,049 9,390 3,084
444 8.6 597 4.2 205 6.3 641 6.4 145 4.5
9,306 11,944 3,647 8,055 19,718
8,735 11,445 3,427 7,710 18,952
571 6.1 499 4.2 220 6.0 345 4.3 766 3.9
80,193 38,092 15,048
6,908 53,470
76,002 36,289 14,639
6,655 51,531
4,191 5.2 1,803 4.7
409 2.7 253 3.7 1,939 3.6
10,439 13,907
7,394 7,366 18,990
9,717 13,386
7,069 7,005 18,116
722 6.9 521 3.7 325 4.4 361 4.9 874 4.6
4,260 9,098 1,020 7,128 2,698
4,088 8,693
972 6,878 2,515
172 4.0 405 4.5
48 4.7 250 3.5 183 6.8
19
Georgia Labor Force Estimates by County (not seasonally adjusted)
Richmond Rockdale Schley Screven Seminole
Place of Residence - Persons 16 Years and Older
Preliminary January 2005
Revised December 2004
Labor Force
Employment
Unemployment Number Rate
Labor Force
Employment
Unemployment Number Rate
89,048 82,931 6,117 6.9
38,847 36,791 2,056 5.3
2,014 1,923
91 4.5
6,502 6,153 349 5.4
3,821 3,590 231 6.0
88,513 83,024 5,489 6.2
39,075 37,142 1,933 4.9
2,035 1,926
109 5.4
6,450 6,137
313 4.9
3,796 3,578
218 5.7
Spalding Stephens Stewart Sumter Talbot
28,802 12,534
1,897 17,432
3,017
26,972 11,763 1,689 16,496 2,816
1,830 6.4 771 6.2 208 11.0 936 5.4 201 6.7
28,948 12,549
1,889 17,444
3,011
27,230 11,823 1,685 16,525 2,816
1,718 5.9 726 5.8 204 10.8 919 5.3 195 6.5
Taliaferro Tattnall Taylor Telfair Terrell
736 8,408 3,171 3,962 4,565
688 7,827 2,947 3,676 4,281
48 6.5 581 6.9 224 7.1 286 7.2 284 6.2
722 8,166 3,132 3,910 4,572
687 7,684 2,938 3,645 4,289
35 4.8 482 5.9 194 6.2 265 6.8 283 6.2
Thomas Tift Toombs Towns Treutlen
20,896 18,560 11,665
5,255 3,399
19,927 17,628 10,874
5,067 3,228
969 4.6 932 5.0 791 6.8 188 3.6 171 5.0
20,913 18,483 11,530
5,273 3,410
19,968 17,596 10,818
5,090 3,241
945 4.5 887 4.8 712 6.2 183 3.5 169 5.0
Troup Turner Twiggs Union Upson
29,941 27,898 2,043 6.8
4,838 4,576
262 5.4
4,646 4,273 373 8.0
9,643 9,260 383 4.0
11,793 10,968 825 7.0
29,969 28,064 1,905 6.4
4,777 4,537
240 5.0
4,614 4,290
324 7.0
9,635 9,266 369 3.8
11,759 11,027
732 6.2
Walker
31,728 30,116 1,612 5.1
Walton
35,949 34,366 1,583 4.4
Ware
14,589 13,736 853 5.8
Warren
2,582 2,327 255 9.9
Washington 8,368 7,886 482 5.8
31,875 30,400 1,475 4.6
36,152 34,694 1,458 4.0
14,544 13,735 809 5.6
2,504 2,316
188 7.5
8,344 7,903 441 5.3
Wayne Webster Wheeler White Whitfield
11,601 10,911 690 5.9
1,056
985
71 6.7
2,601 2,437 164 6.3
11,096 10,614 482 4.3
42,666 40,599 2,067 4.8
11,600 10,943 657 5.7
1,044
975
69 6.6
2,558 2,417 141 5.5
11,124 10,638 486 4.4
42,748 40,615 2,133 5.0
Wilcox Wilkes Wilkinson Worth
4,466 4,447 4,484 10,223
4,267 4,145 4,243 9,613
199 4.5 302 6.8 241 5.4 610 6.0
4,431 4,430 4,469 10,181
4,248 4,136 4,257 9,631
183 4.1 294 6.6 212 4.7 550 5.4
Revised January 2004
Labor Force
Employment
Unemployment Number Rate
88,162 38,223
1,966 6,277 3,616
83,436 36,435
1,867 5,943 3,418
4,726 5.4 1,788 4.7
99 5.0 334 5.3 198 5.5
28,330 12,315
1,857 16,820
2,983
26,711 11,527 1,674 16,013 2,816
1,619 5.7 788 6.4 183 9.9 807 4.8 167 5.6
716 7,829 3,087 3,771 4,482
671 7,405 2,861 3,454 4,226
45 6.3 424 5.4 226 7.3 317 8.4 256 5.7
20,288 17,580 10,947
5,012 3,277
19,397 16,813 10,237
4,836 3,133
891 4.4 767 4.4 710 6.5 176 3.5 144 4.4
29,098 4,697 4,501 9,321 11,324
27,609 4,427 4,275 8,964
10,657
1,489 5.1 270 5.7 226 5.0 357 3.8 667 5.9
31,039 35,620 14,175
2,420 8,109
29,867 34,033 13,423
2,239 7,663
1,172 3.8 1,587 4.5
752 5.3 181 7.5 446 5.5
11,240 1,024 2,464 10,706 42,706
10,629 954
2,335 10,307 41,019
611 5.4 70 6.8 129 5.2 399 3.7 1,687 4.0
4,308 4,368 4,384 9,972
4,133 4,033 4,160 9,488
175 4.1 335 7.7 224 5.1 484 4.9
20
Georgia Unemployment Rates by County
January 2005
Dade Catoosa
Fannin
Towns
Union
Rabun
Whitfield
Walker
Murray Gilmer
White Haber-
Chattooga
Gordon
Pickens
Lumpkin
sham Stephens
Dawson
Hall Banks Franklin Hart
Floyd
Bartow Cherokee Forsyth
Jackson Madison Elbert
10.0% or greater 7..0% to 9.9% 5.0% to 6.9% Less than 5.0%
Polk Paulding Cobb
Haralson Douglas
Gwinnett Barrow Clarke
Oconee Oglethorpe
DeKalb
Walton
Rock-
Wilkes
Lincoln
Carroll
Fulton Clayton
dale Newton
Morgan Greene Taliaferro
Columbia
Fayette Henry
McDuffie Warren
Heard
Coweta
Spalding Butts Jasper Putnam Hancock Glascock
Richmond
Troup Meriwether Pike Lamar Monroe Jones Baldwin
Jefferson Washington
Burke
Upson
Harris
Talbot
Bibb
Wilkinson
Crawford
Twiggs
Johnson
Jenkins Emanuel
Screven
Muscogee
Taylor
Peach
Marion Chattahoo-
Macon
Houston Bleckley
Laurens
Treutlen
Candler Bulloch Effingham
chee
Schley Stewart Webster Sumter
Dooly
Pulaski Dodge Wilcox
Montgomery
Wheeler
Toombs
Evans
Tattnall
Bryan Chatham
Crisp
Telfair
Quitman
Randolph Terrell
Lee
Turner
Ben Hill
Jeff Davis Appling
Liberty Long
Clay Calhoun Dougherty Worth
Irwin Tift
Coffee
Early Miller
Baker Mitchell
Colquitt
Berrien Atkinson
Cook
Lanier
Seminole Decatur
Grady Thomas Brooks
Lowndes
Clinch
Echols
Bacon
Wayne
Pierce
Ware
Brantley
McIntosh Glynn
Charlton
Camden
Georgia's Unemployment Rate: 5.0%
21
Georgia Unemployment Insurance Claims by County
County
January Average Initial Weekly Average
Claims Benefit Duration
County
January Average Initial Weekly Average
Claims Benefit Duration
Appling
306 ....... $217 ...... 11.2
Atkinson
76 ....... $187 ...... 15.2
Bacon
83 ....... $218 ........ 9.6
Baker
19 ....... $158 ...... 11.1
Baldwin
219 ....... $156 ...... 11.3
Banks
92 ....... $214 ...... 11.0
Barrow
365 ....... $210 ...... 12.2
Bartow
788 ....... $214 ...... 12.4
Ben Hill
244 ....... $151 ........ 8.3
Berrien
54 ....... $200 ...... 10.5
Bibb
727 ....... $175 ...... 14.5
Bleckley
108 ....... $212 ........ 9.6
Brantley
73 ....... $212 ...... 11.9
Brooks
59 ....... $183 ........ 9.7
Bryan
83 ....... $204 ...... 12.1
Bulloch
164 ....... $181 ...... 13.5
Burke
366 ....... $171 ...... 10.9
Butts
112 ....... $192 ...... 12.4
Calhoun
35 ....... $161 ...... 13.4
Camden
117 ....... $197 ...... 13.0
Candler
65 ....... $192 ...... 12.5
Carroll
803 ....... $196 ...... 11.3
Catoosa
174 ....... $225 ........ 9.6
Charlton
12 ....... $221 ...... 16.2
Chatham
868 ....... $185 ...... 13.7
Chattahoochee 18 ....... $204 ...... 13.8
Chattooga
61 ....... $222 ...... 13.8
Cherokee
529 ....... $240 ...... 14.2
Clarke
358 ....... $186 ...... 14.2
Clay
19 ....... $185 ...... 11.9
Clayton
1,351 ....... $220 ...... 15.2
Clinch
14 ....... $178 ...... 10.7
Cobb
1,860 ....... $237 ...... 15.8
Coffee
432 ....... $196 ...... 10.5
Colquitt
289 ....... $180 ........ 9.7
Columbia
293 ....... $218 ...... 13.6
Cook
89 ....... $188 ...... 11.2
Coweta
546 ....... $216 ...... 12.0
Crawford
69 ....... $219 ...... 12.4
Crisp
269 ....... $148 ...... 11.3
Dade
56 ....... $211 ........ 8.7
Dawson
74 ....... $233 ...... 12.1
Decatur
244 ....... $178 ...... 12.0
DeKalb
3,025 ....... $221 ...... 14.9
Dodge
88 ....... $206 ...... 10.3
Dooly
155 ....... $133 ...... 10.4
Dougherty
450 ....... $162 ...... 14.7
Douglas
402 ....... $235 ...... 14.5
Early
78 ....... $166 ...... 11.8
Echols
11 ....... $221 ...... 11.0
Effingham
129 ....... $225 ...... 12.2
Elbert
550 ....... $204 ........ 8.7
Emanuel
411 ....... $182 ........ 9.6
Evans Fannin Fayette Floyd Forsyth Franklin Fulton Gilmer Glascock Glynn Gordon Grady Greene Gwinnett Habersham Hall Hancock Haralson Harris Hart Heard Henry Houston Irwin Jackson Jasper Jeff Davis Jefferson Jenkins Johnson Jones Lamar Lanier Laurens Lee Liberty Lincoln Long Lowndes Lumpkin Macon Madison Marion McDuffie McIntosh Meriwether Miller Mitchell Monroe Montgomery Morgan Murray Muscogee
52 ....... $175 ...... 10.4 140 ....... $187 ...... 11.4 218 ....... $245 ...... 14.6 749 ....... $208 ...... 12.0 225 ....... $256 ...... 14.4 326 ....... $192 ........ 9.4 3,215 ....... $210 ...... 15.3 165 ....... $204 ...... 11.6
31 ....... $186 ...... 12.0 284 ....... $185 ...... 12.3 587 ....... $201 ........ 7.6 328 ....... $194 ...... 12.6 134 ....... $158 ...... 12.1 1,888 ....... $240 ...... 14.4 363 ....... $211 ........ 9.0 875 ....... $218 ...... 10.0
79 ....... $150 ...... 11.2 242 ....... $196 ...... 11.1 127 ....... $207 ...... 11.1 869 ....... $208 ........ 6.9 108 ....... $216 ...... 10.4 507 ....... $231 ...... 14.6 394 ....... $203 ...... 12.6 118 ....... $171 ........ 8.6 170 ....... $216 ...... 12.4
74 ....... $206 ...... 11.2 428 ....... $195 ........ 8.7 224 ....... $163 ...... 13.4 382 ....... $152 ........ 8.8
85 ....... $150 ........ 7.7 104 ....... $212 ...... 14.3 190 ....... $165 ........ 9.2
23 ....... $161 ...... 11.8 661 ....... $172 ...... 10.1 153 ....... $236 ...... 10.6 117 ....... $169 ...... 12.9 112 ....... $199 ........ 9.9
25 ....... $224 ...... 13.0 409 ....... $166 ...... 11.0 496 ....... $227 ........ 8.8 105 ....... $172 ...... 11.8 165 ....... $203 ...... 12.2 103 ....... $186 ...... 11.0 515 ....... $179 ........ 9.2
45 ....... $178 ...... 12.4 218 ....... $207 ...... 10.5
59 ....... $187 ...... 10.6 214 ....... $149 ...... 13.6 156 ....... $208 ...... 11.7 201 ....... $196 ........ 9.7
67 ....... $181 ...... 13.2 394 ....... $219 ........ 7.5 1,438 ....... $187 ...... 11.3
Initial claims include intrastate initial and additional claims, as well as agent state initial and additional claims for regular UI only. Average duration of benefits is represented in weeks.
22
County
January Average Initial Weekly Average
Claims Benefit Duration
Newton Oconee Oglethorpe Paulding Peach Pickens Pierce Pike Polk Pulaski Putnam Quitman Rabun Randolph Richmond Rockdale Schley Screven Seminole Spalding Stephens Stewart Sumter Talbot Taliaferro Tattnall Taylor Telfair Terrell Thomas Tift Toombs Towns Treutlen Troup Turner Twiggs Union Upson Walker Walton Ware Warren Washington Wayne Webster Wheeler White Whitfield Wilcox Wilkes Wilkinson Worth
385 ....... $217 ...... 13.7 79 ....... $227 ...... 13.7 98 ....... $201 ...... 12.1
358 ....... $241 ...... 14.3 191 ....... $171 ...... 11.8 144 ....... $235 ...... 11.8
83 ....... $191 ...... 12.1 95 ....... $203 ...... 10.9 373 ....... $189 ...... 10.6 55 ....... $223 ........ 9.5 90 ....... $181 ...... 11.7
3 ....... $300 ...... 17.8 73 ....... $171 ........ 8.2 77 ....... $170 ........ 9.7 1,076 ....... $180 ...... 13.4 287 ....... $222 ...... 14.1 27 ....... $200 ...... 10.3 178 ....... $170 ........ 8.2 68 ....... $164 ...... 11.3 525 ....... $196 ...... 11.5 393 ....... $198 ........ 9.6 80 ....... $156 ...... 14.9 296 ....... $164 ...... 11.4 46 ....... $225 ........ 9.6 25 ....... $140 ...... 11.3 126 ....... $202 ...... 12.3 93 ....... $175 ........ 8.8 115 ....... $224 ........ 9.0 66 ....... $156 ...... 11.5 208 ....... $161 ...... 13.4 301 ....... $178 ...... 10.3 469 ....... $202 ...... 11.2 71 ....... $188 ...... 10.1 121 ....... $182 ........ 9.0 782 ....... $208 ...... 10.0 161 ....... $146 ...... 10.3 73 ....... $213 ...... 12.1 81 ....... $200 ...... 14.6 238 ....... $171 ........ 9.7 884 ....... $211 ........ 7.5 303 ....... $220 ...... 13.7 215 ....... $180 ...... 12.1 223 ....... $162 ........ 7.4 114 ....... $158 ...... 11.8 109 ....... $208 ...... 10.9 23 ....... $142 ...... 14.2 72 ....... $193 ........ 9.4 138 ....... $218 ...... 10.9 888 ....... $222 ........ 7.3 74 ....... $182 ........ 9.3 197 ....... $193 ...... 10.9 47 ....... $200 ...... 13.3 125 ....... $189 ...... 11.9
VISIT THE GEORGIA LABORMARKET EXPLORER'S WEB SITE
all new dynamic and interactive information system
The source of a wide range of information about the labor market and
economic conditions for Georgia and local areas
Information customized for job seekers, employers, students, education
and training planners, economists and labor market researchers
More information and more tools for
Job Seekers Employers Analysts & Researchers
Try it today at:
http://explorer.dol.state.ga.us
23
Georgia Department of Labor Workforce Information & Analysis 148 Andrew Young International Boulevard, N.E. Atlanta, Georgia 30303-1751
Return Service Requested