- Collection:
- Georgia Government Publications
- Title:
- County labor force estimates (not seasonally adjusted) [Oct. 2000]
- Creator:
- Georgia. Department of Labor. Workforce Information and Analysis
- Contributor to Resource:
- Georgia. Department of Labor. Workforce Information and Analysis
- Publisher:
- Atlanta, Ga. : Georgia. Department of Labor. Workforce Information and Analysis
- Date of Original:
- 2000-10
- Subject:
- Georgia
- Location:
- United States, Georgia, 32.75042, -83.50018
- Medium:
- publications (documents)
- Type:
- Text
- Format:
- application/pdf
- Description:
- This PDF file contains other related documents
- External Identifiers:
- Call Number GA L200.E46 P1 L3 2000/10
- Metadata URL:
- https://dlg.galileo.usg.edu/id:dlg_ggpd_i-ga-bl200-pe46-bp1-bl3-b2000-s10-belec-p-btext
- Digital Object URL:
- https://dlg.galileo.usg.edu/do:dlg_ggpd_i-ga-bl200-pe46-bp1-bl3-b2000-s10-belec-p-btext
- Language:
- eng
- Holding Institution:
- University of Georgia. Map and Government Information Library
- Rights:
-

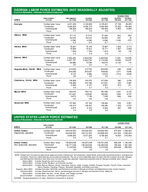
GEORGIA LABOR FORCE ESTIMATES (NOT SEASONALLY ADJUSTED)
PLACE OF RESIDENCE PERSONS 16 YEARS OLD AND OVER
AREA
EMPLOYMENT STATUS
PRELIMINARY OCT 2000
REVISED SEP 2000
REVISED OCT 1999
CHANGE FROM
REVISED SEP 2000
REVISED OCT 1999
Georgia
Civilian labor force Employed
Unemployed Rate
4,221,356 4,064,428
156,928 3.7
4,193,608 4,026,775
166,833 4.0
4,125,061 3,964,068
160,993 3.9
27,748 37,653 -9,905
--
96,295 100,360
-4,065 --
Albany MSA
Civilian labor force Employed
Unemployed Rate
57,172 53,576
3,596 6.3
57,515 52,919
4,596 8.0
57,424 53,558
3,866 6.7
-343 657 -1,000
--
-252 18
-270 --
Athens MSA
Civilian labor force Employed
Unemployed Rate
76,697 74,999
1,698 2.2
75,195 73,412
1,783 2.4
73,987 72,171
1,816 2.5
1,502 1,587
-85 --
2,710 2,828 -118
--
Atlanta MSA
Civilian labor force Employed
Unemployed Rate
2,306,423 2,237,737
68,686 3.0
2,294,542 2,220,754
73,788 3.2
2,242,964 2,174,390
68,574 3.1
11,881 16,983 -5,102
--
63,459 63,347
112 --
Augusta-Aiken, GA-SC MSA
Civilian labor force Employed
Unemployed Rate
212,505 204,368
8,137 3.8
212,753 203,097
9,656 4.5
209,655 198,683
10,972 5.2
-248 1,271 -1,519
--
2,850 5,685 -2,835
--
Columbus, GA-AL MSA
Civilian labor force Employed
Unemployed Rate
130,868 124,488
6,380 4.9
130,276 124,169
6,107 4.7
127,592 121,001
6,591 5.2
592
3,276
319
3,487
273
-211
--
--
Macon MSA
Civilian labor force Employed
Unemployed Rate
158,079 151,407
6,672 4.2
156,718 149,582
7,136 4.6
152,956 145,660
7,296 4.8
1,361 1,825 -464
--
5,123 5,747 -624
--
Savannah MSA
Civilian labor force Employed
Unemployed Rate
137,985 133,310
4,675 3.4
137,169 132,007
5,162 3.8
135,604 130,240
5,364 4.0
816 1,303
-487 --
2,381 3,070 -689
--
UNITED STATES LABOR FORCE ESTIMATES
PLACE OF RESIDENCE PERSONS 16 YEARS OLD AND OVER
AREA United States (Seasonally adjusted)
United States (Not seasonally adjusted)
EMPLOYMENT STATUS
Civilian labor force Employed Unemployed
Rate
Civilian labor force Employed Unemployed Rate
OCT 2000
140,918,000 135,422,000
5,496,000 3.9
140,893,000 135,771,000
5,122,000 3.6
SEP 2000
140,639,000 135,161,000
5,477,000 3.9
140,357,000 135,033,000
5,324,000 3.8
OCT 1999
139,662,000 133,896,000
5,766,000 4.1
139,761,000 134,390,000
5,372,000 3.8
CHANGE FROM
SEP 2000
OCT 1999
279,000 261,000
19,000 --
1,256,000 1,526,000
-270,000 --
536,000 738,000 -202,000
--
1,132,000 1,381,000 -250,000
--
NOTE: Employment includes nonagricultural wage and salary employment, self-employed, unpaid family and private household workers, and agricultural workers. Persons in labor disputes are counted as employed. The use of unrounded data does not imply that the numbers are exact. Georgia and Metropolitan Statistical Area data have not been seasonally adjusted. Seasonally adjusted data for Georgia available upon request. Albany MSA: includes Dougherty and Lee counties. Athens MSA: includes Clarke, Madison, and Oconee counties. Atlanta MSA: includes Barrow, Bartow, Carroll, Cherokee, Clayton, Cobb, Coweta, DeKalb, Douglas, Fayette, Forsyth, Fulton, Gwinnett, Henry, Newton, Paulding, Pickens, Rockdale, Spalding, and Walton counties.
Augusta -Aiken MSA: includes Columbia, McDuffie, and Richmond counties in Georgia and Aiken and Edgefield counties, South Carolina. Columbus MSA: includes Chattahoochee, Harris, and Muscogee counties in Georgia and Russell County, Alabama.
Macon MSA: includes Bibb, Houston, Jones, Peach, and Twiggs counties.
Savannah MSA: includes Bryan, Chatham, and Effingham counties.
SOURCE: Georgia Department of Labor, Workforce Information & Analysis
CITIES LABOR FORCE ESTIMATES (NOT SEASONALLY ADJUSTED)
TOTAL POPULATION OF 10,000 OR MORE
Albany Alpharetta Americus Athens Atlanta
PRELIMINARY OCTOBER 2000
REVISED SEPTEMBER 2000
REVISED OCTOBER 1999
LABOR
UNEMPLOYMENT
FORCE EMPLOYMENT NUMBER RATE
35,940
33,322 2,618 7.3
9,993
9,854 139 1.4
7,955
7,501 454 5.7
48,940
47,769 1,171 2.4
236,522 224,534 11,988 5.1
LABOR FORCE EMPLOYMENT
36,370
32,914
9,930
9,779
7,927
7,408
47,957
46,758
235,832 222,829
UNEMPLOYMENT NUMBER RATE
3,456 9.5 151 1.5 519 6.5
1,199 2.5 13,003 5.5
LABOR FORCE EMPLOYMENT
36,252
33,311
9,708
9,575
7,891
7,381
47,159
45,968
229,800 218,178
UNEMPLOYMENT NUMBER RATE
2,941 8.1 133 1.4 510 6.5
1,191 2.5 11,622 5.1
Augusta Bainbridge Brunswick Carrollton Cartersville
82,899 4,756 8,027
10,181 8,686
78,480 4,419 5.3 4,428 328 6.9 7,437 590 7.4 9,678 503 4.9 8,317 369 4.2
82,691 4,746 8,081
10,173 8,551
77,808 4,366 7,363 9,605 8,253
4,883 5.9 380 8.0 718 8.9 568 5.6 298 3.5
81,518 4,659 7,926
10,039 8,358
76,579 4,345 7,348 9,404 8,081
4,939 6.1 314 6.7 578 7.3 635 6.3 277 3.3
College Park Columbus Cordele Covington Dalton
13,847 89,069
4,508 6,375 14,344
13,199 648 4.7 84,591 4,478 5.0
4,235 273 6.1 6,056 319 5.0 13,293 1,051 7.3
13,804 88,763
4,468 6,373 13,931
13,098 84,329
4,172 6,010 13,157
706 5.1 4,434 5.0
296 6.6 363 5.7 774 5.6
13,441 87,070
4,435 6,217 13,596
12,825 82,271
4,154 5,885 13,110
616 4.6 4,799 5.5
281 6.3 332 5.3 486 3.6
Decatur Douglas Douglasville Dublin East Point
11,162 6,711 8,346 8,296
22,303
10,763 399 3.6 6,222 489 7.3 8,063 283 3.4 7,623 673 8.1
21,258 1,045 4.7
11,116 6,643 8,295 8,169
22,230
10,681 6,137 8,001 7,536
21,097
435 3.9 506 7.6 294 3.5 633 7.7 1,133 5.1
10,877 6,542 8,120 8,308
21,660
10,458 6,110 7,834 7,510
20,657
419 3.9 432 6.6 286 3.5 798 9.6 1,003 4.6
Forest Park Gainesville Griffin Hinesville LaGrange
10,904 12,877 12,055
8,858 13,492
10,431 12,541 11,162
8,238 12,805
473 4.3 336 2.6 893 7.4 620 7.0 687 5.1
10,880 12,773 11,999
8,762 13,421
10,352 12,414 11,077
8,154 12,675
528 4.9 359 2.8 922 7.7 608 6.9 746 5.6
10,569 12,691 11,561
8,632 13,459
10,136 12,339 10,846
8,122 12,638
433 4.1 352 2.8 715 6.2 510 5.9 821 6.1
Lawrenceville Macon Marietta Milledgeville Moultrie
15,064 51,709 35,746
6,038 7,580
14,586 48,867 34,595
5,588 6,615
478 2,842 1,151
450 965
3.2 5.5 3.2 7.5 12.7
14,991 51,324 35,572
6,012 7,170
14,475 48,278 34,332
5,532 6,515
516 3.4 3,046 5.9 1,240 3.5
480 8.0 655 9.1
14,658 49,993 34,839
6,059 7,267
14,173 47,012 33,615
5,513 6,484
485 3.3 2,981 6.0 1,224 3.5
546 9.0 783 10.8
Newnan Peachtree City Rome Roswell Savannah
9,345 14,405 15,230 36,375 65,157
9,024 321 3.4 14,026 379 2.6 14,550 680 4.5 35,866 509 1.4 62,434 2,723 4.2
9,291 14,336 15,061 36,146 64,856
8,955 13,920 14,405 35,594 61,824
336 3.6 416 2.9 656 4.4 552 1.5 3,032 4.7
9,104 13,974 15,270 35,339 64,100
8,768 13,629 14,353 34,851 60,997
336 3.7 345 2.5 917 6.0 488 1.4 3,103 4.8
Smyrna Snellville Statesboro Thomasville Tifton
29,013 10,721
9,790 9,648 8,119
28,333 10,476
9,470 8,979 7,716
680 2.3 245 2.3 320 3.3 669 6.9 403 5.0
28,850 10,662
9,720 9,609 8,085
28,118 10,397
9,363 8,869 7,610
732 2.5 265 2.5 357 3.7 740 7.7 475 5.9
28,254 10,428
9,606 9,488 8,014
27,531 10,180
9,330 8,838 7,577
723 2.6 248 2.4 276 2.9 650 6.9 437 5.5
Valdosta Vidalia Warner Robins Waycross
22,820 5,914
25,915 6,856
21,484 1,336 5.9 5,430 484 8.2
24,965 950 3.7 6,348 508 7.4
22,712 5,980
25,706 6,826
SOURCE: Georgia Department of Labor, Workforce Information & Analysis
21,231 5,362
24,664 6,278
1,481 6.5 618 10.3
1,042 4.1 548 8.0
22,075 5,793
25,140 6,640
21,151 5,339
24,017 6,258
924 4.2 454 7.8 1,123 4.5 382 5.8
GEORGIA REGIONAL DEVELOPMENT CENTERS (RDCs)
Atlanta Regional Commission Central Savannah River Chattahoochee - Flint Coastal Georgia Coosa Valley Georgia Mountains Heart of Georgia - Altamaha Lower Chattahoochee McIntosh Trail Middle Flint Middle Georgia North Georgia Northeast Georgia South Georgia Southeast Georgia Southwest Georgia
LABOR FORCE OCT 2000
EMPLOYED UNEMPLOYED
OCT 2000
OCT 2000
OCT 2000
RATE SEP 2000 OCT 1999
1,951,629 1,893,940
57,689
3.0
3.2
3.1
204,091
193,116
10,975
5.4
5.8
6.6
137,713
132,920
4,793
3.5
3.8
4.1
243,706
234,831
8,875
3.6
4.0
3.8
254,549
245,356
9,193
3.6
3.4
3.7
232,333
227,009
5,324
2.3
2.4
2.7
114,783
107,382
7,401
6.4
7.3
8.0
115,178
109,330
5,848
5.1
5.2
5.4
67,496
63,640
3,856
5.7
5.8
5.4
45,547
43,025
2,522
5.5
6.2
5.7
207,865
198,880
8,985
4.3
4.7
5.0
95,674
91,063
4,611
4.8
4.1
2.8
210,258
203,994
6,264
3.0
3.1
3.2
111,261
105,261
6,000
5.4
6.0
4.8
66,384
62,186
4,198
6.3
6.5
5.1
162,888
152,493
10,395
6.4
7.1
6.7
AUGUSTA LABOR FORCE ESTIMATES BY PLACE OF RESIDENCE, PERSONS 16 YEARS OLD AND OVER
AREA Augusta-Aiken, GA-SC MSA
EMPLOYMENT STATUS
Civilian labor force Employed Unemployed Rate
Residing in Georgia
Civilian labor force Employed Unemployed Rate
Residing in South Carolina
Civilian labor force Employed
Unemployed Rate
PRELIMINARY OCT 2000
212,505 204,368
8,137 3.8
138,243 132,025
6,218 4.5
74,262 72,343
1,919 2.6
REVISED SEP 2000
212,753 203,097
9,656 4.5
137,681 130,895
6,786 4.9
75,072 72,202
2,870 3.8
REVISED OCT 1999
209,655 198,683
10,972 5.2
135,814 128,827
6,987 5.1
73,841 69,856
3,985 5.4
CHANGE FROM
REVISED SEP 2000
REVISED OCT 1999
-248 1,271 -1,519
--
2,850 5,685 -2,835
--
562 1,130 -568
--
2,429 3,198 -769
--
-810 141 -951
--
421 2,487 -2,066
--
NOTE: The Augusta Metropolitan Statistical Area includes Columbia, McDuffie, and Richmond counties, Georgia, and Aiken and Edgefield counties, South Carolina.
SOURCE: Georgia Department of Labor, Workforce Information & Analysis.
COLUMBUS LABOR FORCE ESTIMATES BY PLACE OF RESIDENCE, PERSONS 16 YEARS OLD AND OVER
AREA Columbus, GA-AL MSA
Residing in Georgia
Residing in Alabama
EMPLOYMENT STATUS
Civilian labor force Employed Unemployed Rate
Civilian labor force Employed
Unemployed Rate
Civilian labor force Employed Unemployed Rate
PRELIMINARY OCT 2000
130,868 124,488
6,380 4.9
103,837 98,862 4,975 4.8
27,031 25,626
1,405 5.2
REVISED SEP 2000
130,276 124,169
6,107 4.7
103,574 98,556 5,018 4.8
26,702 25,613
1,089 4.1
REVISED OCT 1999
127,592 121,001
6,591 5.2
101,406 96,151 5,255 5.2
26,186 24,850
1,336 5.1
CHANGE FROM
REVISED SEP 2000
REVISED OCT 1999
592
3,276
319
3,487
273
-211
--
--
263
2,431
306
2,711
-43
-280
--
--
329
845
13
776
316
69
--
--
NOTE: The Columbus Metropolitan Statistical Area includes Chattahoochee, Harris, and Muscogee counties, Georgia, and Russell county, Alabama.
SOURCE: Georgia Department of Labor, Workforce Information & Analysis.
Produced by the Georgia Department of Labor, Workforce Information & Analysis in cooperation with the U.S. Department of Labor, Bureau of Labor Statistics.
COUNTY LABOR FORCE ESTIMATES (NOT SEASONALLY ADJUSTED)
PLACE OF RESIDENCE PERSONS 16 YEARS OLD AND OVER
PRELIMINARY OCTOBER 2000
REVISED SEPTEMBER 2000
REVISED OCTOBER 1999
Georgia
LABOR
UNEMPLOYMENT
FORCE EMPLOYMENT NUMBER RATE
LABOR
UNEMPLOYMENT
FORCE EMPLOYMENT NUMBER RATE
LABOR
UNEMPLOYMENT
FORCE EMPLOYMENT NUMBER RATE
4,221,356 4,064,428 156,928 3.7 4,193,608 4,026,775 166,833 4.0 4,125,061 3,964,068 160,993 3.9
Appling Atkinson Bacon Baker Baldwin
8,172 3,640 4,349 1,583 17,893
7,668 3,197 4,002 1,514 16,900
504 6.2 443 12.2 347 8.0
69 4.4 993 5.5
8,205 3,457 4,297 1,552 17,787
7,570 3,145 3,946 1,477 16,729
635 7.7 312 9.0 351 8.2
75 4.8 1,058 5.9
8,223 3,370 4,164 1,571 17,877
7,539 3,128 3,931 1,459 16,672
684 8.3 242 7.2 233 5.6 112 7.1 1,205 6.7
Banks Barrow Bartow Ben Hill Berrien
6,275 22,103 41,710
9,457 7,094
6,099 21,268 39,770
8,825 6,734
176 2.8 835 3.8 1,940 4.7 632 6.7 360 5.1
6,191 21,760 41,032
9,352 7,072
6,017 21,107 39,468
8,705 6,626
174 2.8 653 3.0 1,564 3.8 647 6.9 446 6.3
6,254 21,250 40,098
9,316 7,102
5,994 20,666 38,644
8,670 6,584
260 4.2 584 2.7 1,454 3.6 646 6.9 518 7.3
Bibb Bleckley Brantley Brooks Bryan
76,278 5,673 5,837 7,873
11,070
72,826 5,489 5,499 7,376
10,754
3,452 4.5 184 3.2 338 5.8 497 6.3 316 2.9
75,648 5,637 5,816 7,902
10,966
71,948 5,421 5,436 7,289
10,649
3,700 4.9 216 3.8 380 6.5 613 7.8 317 2.9
73,683 5,714 5,809 7,541
10,933
70,062 5,399 5,415 7,262
10,507
3,621 4.9 315 5.5 394 6.8 279 3.7 426 3.9
Bulloch Burke Butts Calhoun Camden
27,379 8,390 8,665 2,308
17,108
26,628 7,809 8,117 2,113
16,450
751 2.7 581 6.9 548 6.3 195 8.4 658 3.8
27,165 8,365 8,645 2,321
16,942
26,326 7,706 8,031 2,069
16,276
839 3.1 659 7.9 614 7.1 252 10.9 666 3.9
26,881 8,373 8,348 2,365
16,810
26,233 7,668 8,003 2,053
16,220
648 2.4 705 8.4 345 4.1 312 13.2 590 3.5
Candler Carroll Catoosa Charlton Chatham
4,028 46,514 26,546
3,812 108,848
3,852 44,877 25,651
3,653 105,019
176 4.4 1,637 3.5
895 3.4 159 4.2 3,829 3.5
4,011 46,383 26,271
3,785 108,256
3,789 44,537 25,472
3,615 103,993
222 5.5 1,846 4.0
799 3.0 170 4.5 4,263 3.9
4,097 45,673 25,864
3,739 106,963
3,767 43,607 25,126
3,602 102,601
330 8.1 2,066 4.5
738 2.9 137 3.7 4,362 4.1
Chattahoochee Chattooga Cherokee Clarke Clay
2,479 11,892 82,793 48,940
1,561
2,326 11,567 81,219 47,769
1,434
153 6.2 325 2.7 1,574 1.9 1,171 2.4 127 8.1
2,517 11,813 82,301 47,957
1,522
2,319 11,448 80,602 46,758
1,408
198 7.9 365 3.1 1,699 2.1 1,199 2.5 114 7.5
2,431 11,800 80,574 47,159
1,537
2,262 11,406 78,920 45,968
1,398
169 7.0 394 3.3 1,654 2.1 1,191 2.5 139 9.0
Clayton Clinch Cobb Coffee Colquitt
130,452 3,876
370,426 21,163 20,247
125,631 3,507
361,424 19,980 18,522
4,821 3.7 369 9.5
9,002 2.4 1,183 5.6 1,725 8.5
130,058 3,857
368,380 20,928 19,415
124,678 3,459
358,681 19,706 18,244
5,380 4.1 398 10.3
9,699 2.6 1,222 5.8 1,171 6.0
126,484 3,613
360,765 20,662 19,556
122,075 3,443
351,192 19,618 18,157
4,409 3.5 170 4.7
9,573 2.7 1,044 5.1 1,399 7.2
Columbia Cook Coweta Crawford Crisp
45,358 8,028
46,973 5,581 9,824
44,137 7,516
45,701 5,350 9,285
1,221 2.7 512 6.4
1,272 2.7 231 4.1 539 5.5
45,051 7,945
46,687 5,541 9,731
43,760 7,409
45,354 5,283 9,147
1,291 2.9 536 6.7
1,333 2.9 258 4.7 584 6.0
44,477 7,841
45,739 5,482 9,663
43,068 7,372
44,407 5,258 9,108
1,409 3.2 469 6.0
1,332 2.9 224 4.1 555 5.7
Dade Dawson Decatur DeKalb Dodge
7,317 14,912 12,057 381,666
9,712
7,168
149 2.0
14,678
234 1.6
11,353
704 5.8
368,166 13,500 3.5
9,310
402 4.1
7,273 14,811 12,010 380,069
9,683
7,118 14,538 11,195 365,372
9,201
155 2.1 273 1.8 815 6.8 14,697 3.9 482 5.0
7,286 14,808 11,812 371,932
9,763
7,021
265 3.6
14,457
351 2.4
11,140
672 5.7
357,744 14,188 3.8
9,139
624 6.4
Dooly Dougherty Douglas Early Echols
4,578 45,294 54,867
4,656 1,199
4,329 42,262 53,396
4,345 1,160
249 5.4 3,032 6.7 1,471 2.7
311 6.7 39 3.3
4,576 45,747 54,517
4,635 1,203
4,265 41,744 52,991
4,267 1,147
311 6.8 4,003 8.8 1,526 2.8
368 7.9 56 4.7
4,475 45,654 53,373
4,680 1,183
4,246 42,248 51,885
4,238 1,142
229 5.1 3,406 7.5 1,488 2.8
442 9.4 41 3.5
COUNTY LABOR FORCE ESTIMATES (NOT SEASONALLY ADJUSTED)
PLACE OF RESIDENCE PERSONS 16 YEARS OLD AND OVER
PRELIMINARY OCTOBER 2000
Effingham Elbert Emanuel Evans Fannin
LABOR
UNEMPLOYMENT
FORCE EMPLOYMENT NUMBER RATE
18,066 8,988 8,701 4,940 8,816
17,536 8,218 7,876 4,747 8,544
530 2.9 770 8.6 825 9.5 193 3.9 272 3.1
Fayette Floyd Forsyth Franklin Fulton
52,073 44,628 52,036 10,371 427,862
51,051 1,022 2.0
43,115 1,513 3.4
51,332
704 1.4
9,958
413 4.0
412,007 15,855 3.7
Gilmer Glascock Glynn Gordon Grady
8,452 978
35,461 22,374
9,552
8,174 926
34,261 21,450
9,048
278 3.3 52 5.3
1,200 3.4 924 4.1 504 5.3
Greene Gwinnett Habersham Hall Hancock
5,807 347,886
16,389 71,969
3,957
5,554 339,780
15,899 70,379
3,544
253 4.4 8,106 2.3
490 3.0 1,590 2.2
413 10.4
Haralson Harris Hart Heard Henry
9,563 12,289
9,441 4,729 62,022
9,192 11,945
9,004 4,523 60,712
371 3.9 344 2.8 437 4.6 206 4.4 1,310 2.1
Houston Irwin Jackson Jasper Jeff Davis
53,351 4,913
22,957 4,840 5,318
51,538 4,607
22,341 4,661 5,059
1,813 3.4 306 6.2 616 2.7 179 3.7 259 4.9
Jefferson Jenkins Johnson Jones Lamar
7,465 4,378 3,627 12,455 6,976
6,648 4,224 3,300 11,989 6,588
817 10.9 154 3.5 327 9.0 466 3.7 388 5.6
Lanier Laurens Lee Liberty Lincoln
3,723 22,548 11,878 17,339
3,567
3,472 21,194 11,314 16,088
3,341
251 6.7 1,354 6.0
564 4.7 1,251 7.2
226 6.3
Long Lowndes Lumpkin McDuffie McIntosh
3,644 43,830 10,836
9,986 4,791
3,530 41,712 10,679
9,408 4,565
114 3.1 2,118 4.8
157 1.4 578 5.8 226 4.7
Macon Madison Marion Meriwether Miller
5,483 13,901
3,345 9,128 3,203
4,957 13,554
3,188 8,567 3,068
526 9.6 347 2.5 157 4.7 561 6.1 135 4.2
Mitchell Monroe Montgomery Morgan Murray
11,715 7,505 3,894 7,050
19,468
10,961 7,112 3,509 6,835
18,266
754 6.4 393 5.2 385 9.9 215 3.0 1,202 6.2
REVISED SEPTEMBER 2000
LABOR
UNEMPLOYMENT
FORCE EMPLOYMENT NUMBER RATE
17,946 8,851 8,571 4,904 8,698
17,365 8,114 7,771 4,682 8,446
581 3.2 737 8.3 800 9.3 222 4.5 252 2.9
51,786 44,143 51,775 10,179 426,071
50,664 1,122 2.2
42,684 1,459 3.3
50,943
832 1.6
9,834
345 3.4
408,880 17,191 4.0
8,371 967
35,380 22,053
9,515
8,077 913
33,921 21,208
8,886
294 3.5 54 5.6
1,459 4.1 845 3.8 629 6.6
5,775 345,957
16,162 71,361
3,984
5,484 337,202
15,701 69,665
3,502
291 5.0 8,755 2.5
461 2.9 1,696 2.4
482 12.1
9,498 12,294
9,307 4,702 61,714
9,088 11,908
8,894 4,477 60,251
410 4.3 386 3.1 413 4.4 225 4.8 1,463 2.4
52,905 4,844
22,742 4,820 5,278
50,917 4,544
22,074 4,604 4,990
1,988 3.8 300 6.2 668 2.9 216 4.5 288 5.5
7,244 4,333 3,544 12,324 6,918
6,558 4,165 3,259 11,845 6,517
686 9.5 168 3.9 285 8.0 479 3.9 401 5.8
3,732 22,225 11,768 17,149
3,563
3,431 20,952 11,175 15,923
3,302
301 8.1 1,273 5.7
593 5.0 1,226 7.1
261 7.3
3,613 43,570 10,755
9,939 4,751
3,494 41,221 10,566
9,327 4,511
119 3.3 2,349 5.4
189 1.8 612 6.2 240 5.1
5,460 13,632
3,316 9,008 3,170
4,873 13,267
3,145 8,478 3,014
587 10.8 365 2.7 171 5.2 530 5.9 156 4.9
11,584 7,452 3,827 7,008
19,235
10,790 7,039 3,464 6,735
18,091
794 6.9 413 5.5 363 9.5 273 3.9 1,144 5.9
REVISED OCTOBER 1999
LABOR
UNEMPLOYMENT
FORCE EMPLOYMENT NUMBER RATE
17,709 8,782 9,124 4,871 8,729
17,133 8,086 7,738 4,665 8,420
576 3.3 696 7.9 1,386 15.2 206 4.2 309 3.5
50,536 44,571 50,766 10,125 415,556
49,606
930 1.8
42,531 2,040 4.6
49,879
887 1.7
9,801
324 3.2
400,344 15,212 3.7
8,347 973
35,025 21,901
9,571
8,062 909
33,850 21,132
8,832
285 3.4 64 6.6
1,175 3.4 769 3.5 739 7.7
5,863 338,377
16,148 70,908
4,074
5,466 330,162
15,645 69,243
3,484
397 6.8 8,215 2.4
503 3.1 1,665 2.3
590 14.5
9,508 11,904
9,181 4,750 60,346
9,054 11,618
8,863 4,447 58,993
454 4.8 286 2.4 318 3.5 303 6.4 1,353 2.2
51,725 4,760
22,744 4,764 5,387
49,582 4,525
21,999 4,585 4,969
2,143 4.1 235 4.9 745 3.3 179 3.8 418 7.8
7,352 4,373 3,519 11,981 6,847
6,526 4,131 3,247 11,534 6,475
826 11.2 242 5.5 272 7.7 447 3.7 372 5.4
3,522 22,483 11,770 16,890
3,730
3,418 20,879 11,310 15,861
3,294
104 3.0 1,604 7.1
460 3.9 1,029 6.1
436 11.7
3,577 42,531 10,720
9,819 4,682
3,480 41,066 10,502
9,180 4,494
97 2.7 1,465 3.4
218 2.0 639 6.5 188 4.0
5,251 13,479
3,313 8,997 3,161
4,839 13,043
3,131 8,425 2,995
412 7.8 436 3.2 182 5.5 572 6.4 166 5.3
11,518 7,437 3,821 6,984
18,558
10,728 6,995 3,450 6,705
17,986
790 6.9 442 5.9 371 9.7 279 4.0 572 3.1
COUNTY LABOR FORCE ESTIMATES (NOT SEASONALLY ADJUSTED)
PLACE OF RESIDENCE PERSONS 16 YEARS OLD AND OVER
PRELIMINARY OCTOBER 2000
REVISED SEPTEMBER 2000
Muscogee Newton Oconee Oglethorpe Paulding
LABOR
UNEMPLOYMENT
FORCE EMPLOYMENT NUMBER RATE
89,069 30,820 13,856
6,120 42,350
84,591 29,947 13,676
5,977 41,372
4,478 5.0 873 2.8 180 1.3 143 2.3 978 2.3
LABOR
UNEMPLOYMENT
FORCE EMPLOYMENT NUMBER RATE
88,763 30,715 13,606
6,105 42,091
84,329 29,719 13,386
5,901 41,058
4,434 5.0 996 3.2 220 1.6 204 3.3
1,033 2.5
Peach Pickens Pierce Pike Polk
11,648 11,036
7,567 6,836 16,170
10,909 10,783
7,143 6,522 15,339
739 6.3 253 2.3 424 5.6 314 4.6 831 5.1
11,531 10,973
7,449 6,774 15,878
10,778 10,701
7,039 6,453 15,189
753 6.5 272 2.5 410 5.5 321 4.7 689 4.3
Pulaski Putnam Quitman Rabun Randolph
4,560 9,485 1,337 7,167 3,186
4,348 9,207 1,243 7,068 2,845
212 4.6 278 2.9
94 7.0 99 1.4 341 10.7
4,513 9,402 1,297 7,092 3,161
4,291 9,102 1,225 6,993 2,804
222 4.9 300 3.2
72 5.6 99 1.4 357 11.3
Richmond Rockdale Schley Screven Seminole
82,899 41,582
1,794 6,005 4,569
78,480 40,554
1,706 5,653 4,346
4,419 5.3 1,028 2.5
88 4.9 352 5.9 223 4.9
82,691 41,403
1,777 5,971 4,512
77,808 40,246
1,687 5,573 4,269
4,883 5.9 1,157 2.8
90 5.1 398 6.7 243 5.4
Spalding Stephens Stewart Sumter Talbot
31,535 12,090
2,315 15,496
2,942
29,892 11,699
2,183 14,786
2,763
1,643 5.2 391 3.2 132 5.7 710 4.6 179 6.1
31,361 11,994
2,295 15,414
2,949
29,665 11,575
2,154 14,602
2,733
1,696 5.4 419 3.5 141 6.1 812 5.3 216 7.3
Taliaferro Tattnall Taylor Telfair Terrell
718 7,438 3,972 5,347 3,929
666 6,981 3,741 4,830 3,566
52 7.2 457 6.1 231 5.8 517 9.7 363 9.2
710 7,447 3,886 5,488 3,951
656 6,851 3,688 4,763 3,508
54 7.6 596 8.0 198 5.1 725 13.2 443 11.2
Thomas Tift Toombs Towns Treutlen
22,395 20,821 12,831
3,742 2,964
21,237 19,949 11,619
3,629 2,657
1,158 5.2 872 4.2
1,212 9.4 113 3.0 307 10.4
22,257 20,702 13,018
3,721 2,976
20,975 19,674 11,472
3,589 2,623
1,282 5.8 1,028 5.0 1,546 11.9
132 3.5 353 11.9
Troup Turner Twiggs Union Upson
30,369 4,323 4,346 7,780
13,484
29,252 3,910 4,144 7,513
12,521
1,117 3.7 413 9.6 202 4.6 267 3.4 963 7.1
30,167 4,237 4,310 7,647
13,268
28,954 3,845 4,094 7,413
12,390
1,213 4.0 392 9.3 216 5.0 234 3.1 878 6.6
Walker Walton Ware Warren Washington
31,999 29,716 16,140
2,700 9,651
30,732 28,855 15,205
2,546 9,147
1,267 4.0 861 2.9 935 5.8 154 5.7 504 5.2
31,808 29,509 16,049
2,691 9,596
30,518 28,636 15,039
2,514 9,039
1,290 4.1 873 3.0
1,010 6.3 177 6.6 557 5.8
Wayne Webster Wheeler White Whitfield
11,809 1,055 2,183 9,325
47,902
10,937 1,033 1,996 9,072
45,296
872 7.4 22 2.1
187 8.6 253 2.7 2,606 5.4
11,620 1,051 2,176 9,287
46,753
10,814 1,015 1,969 8,966
44,833
806 6.9 36 3.4
207 9.5 321 3.5 1,920 4.1
Wilcox Wilkes Wilkinson Worth
3,366 5,711 4,483 9,502
3,186 5,411 4,244 8,844
180 5.3 300 5.3 239 5.3 658 6.9
3,350 5,652 4,458 9,392
SOURCE: Georgia Department of Labor, Workforce Information & Analysis
3,138 5,346 4,197 8,703
212 6.3 306 5.4 261 5.9 689 7.3
REVISED OCTOBER 1999
LABOR
UNEMPLOYMENT
FORCE EMPLOYMENT NUMBER RATE
87,070 30,009 13,349
6,083 41,191
82,271 29,099 13,160
5,874 40,201
4,799 5.5 910 3.0 189 1.4 209 3.4 990 2.4
11,234 10,716
7,333 6,738 16,007
10,495 10,478
7,003 6,411 15,102
739 6.6 238 2.2 330 4.5 327 4.9 905 5.7
4,484 9,444 1,264 7,180 3,018
4,260 9,041 1,219 6,992 2,794
224 5.0 403 4.3
45 3.6 188 2.6 224 7.4
81,518 40,373
1,754 6,041 4,440
76,579 39,406
1,675 5,551 4,243
4,939 6.1 967 2.4 79 4.5 490 8.1 197 4.4
30,361 11,998
2,281 15,347
2,966
29,046 11,535
2,145 14,548
2,715
1,315 4.3 463 3.9 136 6.0 799 5.2 251 8.5
701 7,132 3,939 5,977 3,804
653 6,802 3,673 4,742 3,489
48 6.8 330 4.6 266 6.8 1,235 20.7 315 8.3
22,029 20,533 12,559
3,739 3,069
20,903 19,588 11,424
3,588 2,612
1,126 5.1 945 4.6
1,135 9.0 151 4.0 457 14.9
30,204 4,354 4,333 7,728
13,581
28,869 3,830 3,987 7,401
12,355
1,335 4.4 524 12.0 346 8.0 327 4.2
1,226 9.0
31,236 28,848 15,694
2,719 9,728
30,102 28,038 14,992
2,501 8,998
1,134 3.6 810 2.8 702 4.5 218 8.0 730 7.5
11,437 1,053 2,272 9,406
45,876
10,783 1,011 1,960 8,949
44,671
654 5.7 42 4.0
312 13.7 457 4.9 1,205 2.6
3,343 5,600 4,572 9,294
3,125 5,312 4,178 8,649
218 6.5 288 5.1 394 8.6 645 6.9