- Collection:
- Georgia Government Publications
- Title:
- Georgia labor force estimates, place of residence - persons 16 years old and over, Nov. 2000
- Creator:
- Georgia. Labor Information Systems
- Contributor to Resource:
- Georgia. Labor Market Information
Georgia. Workforce Information and Analysis
United States. Bureau of Labor Statistics - Publisher:
- [Atlanta, Ga.?] : Published in cooperation with the U.S. Dept. of Labor, Bureau of Labor Statistics, by Georgia Dept. of Labor, Labor Information Systems, 2000-11
- Date of Original:
- 2000-11
- Subject:
- Labor supply--Georgia--Statistics
Labor supply--United States--Statistics - Location:
- United States, 39.76, -98.5
United States, Georgia, 32.75042, -83.50018 - Medium:
- state government records
- Type:
- Text
- Format:
- application/pdf
- External Identifiers:
- Call Number GA L200.E4 P1 C5 2000/11
- Metadata URL:
- https://dlg.galileo.usg.edu/id:dlg_ggpd_i-ga-bl200-pe4-bp1-bc5-b2000-s11-belec-p-btext
- Digital Object URL:
- https://dlg.galileo.usg.edu/do:dlg_ggpd_i-ga-bl200-pe4-bp1-bc5-b2000-s11-belec-p-btext
- Language:
- eng
- Holding Institution:
- University of Georgia. Map and Government Information Library
- Rights:
-

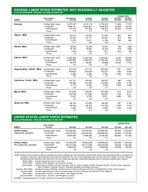
GEORGIA LABOR FORCE ESTIMATES (NOT SEASONALLY ADJUSTED)
PLACE OF RESIDENCE PERSONS 16 YEARS OLD AND OVER
AREA
EMPLOYMENT STATUS
PRELIMINARY NOV 2000
REVISED OCT 2000
REVISED NOV 1999
CHANGE FROM
REVISED OCT 2000
REVISED NOV 1999
Georgia
Civilian labor force Employed
Unemployed Rate
4,207,497 4,086,127
121,370 2.9
4,219,119 4,061,827
157,292 3.7
4,135,524 3,992,909
142,615 3.4
-11,622 24,300 -35,922
--
71,973 93,218 -21,245
--
Albany MSA
Civilian labor force Employed
Unemployed Rate
56,319 53,444
2,875 5.1
56,782 53,171
3,611 6.4
57,206 54,007
3,199 5.6
-463 273 -736
--
-887 -563 -324
--
Athens MSA
Civilian labor force Employed
Unemployed Rate
76,534 75,126
1,408 1.8
76,349 74,647
1,702 2.2
74,875 73,318
1,557 2.1
185 479 -294
--
1,659 1,808 -149
--
Atlanta MSA
Civilian labor force Employed
Unemployed Rate
2,298,028 2,244,653
53,375 2.3
2,306,736 2,238,079
68,657 3.0
2,249,644 2,188,756
60,888 2.7
-8,708 6,574 -15,282
--
48,384 55,897 -7,513
--
Augusta-Aiken, GA-SC MSA
Civilian labor force Employed
Unemployed Rate
212,319 205,863
6,456 3.0
213,170 204,925
8,245 3.9
209,082 199,319
9,763 4.7
-851 938 -1,789
--
3,237 6,544 -3,307
--
Columbus, GA-AL MSA
Civilian labor force Employed
Unemployed Rate
131,161 126,388
4,773 3.6
130,816 124,453
6,363 4.9
128,270 122,233
6,037 4.7
345 1,935 -1,590
--
2,891 4,155 -1,264
--
Macon MSA
Civilian labor force Employed
Unemployed Rate
157,835 152,798
5,037 3.2
158,350 151,645
6,705 4.2
152,598 146,587
6,011 3.9
-515 1,153 -1,668
--
5,237 6,211 -974
--
Savannah MSA
Civilian labor force Employed
Unemployed Rate
138,156 134,690
3,466 2.5
137,899 133,224
4,675 3.4
136,002 131,376
4,626 3.4
257 1,466 -1,209
--
2,154 3,314 -1,160
--
UNITED STATES LABOR FORCE ESTIMATES
PLACE OF RESIDENCE PERSONS 16 YEARS OLD AND OVER
AREA United States (Seasonally adjusted)
United States (Not seasonally adjusted)
EMPLOYMENT STATUS
Civilian labor force Employed Unemployed
Rate
Civilian labor force Employed Unemployed Rate
NOV 2000
141,052,000 135,373,000
5,679,000 4.0
141,025,000 135,731,000
5,295,000 3.8
OCT 2000
140,918,000 135,422,000
5,496,000 3.9
140,893,000 135,771,000
5,122,000 3.6
NOV 1999
139,834,000 134,098,000
5,736,000 4.1
139,895,000 134,515,000
5,380,000 3.8
CHANGE FROM
OCT 2000
NOV 1999
134,000 -49,000 183,000
--
1,218,000 1,275,000
-57,000 --
132,000 -40,000 173,000
--
1,130,000 1,216,000
-85,000 --
NOTE: Employment includes nonagricultural wage and salary employment, self-employed, unpaid family and private household workers, and agricultural workers. Persons in labor disputes are counted as employed. The use of unrounded data does not imply that the numbers are exact. Georgia and Metropolitan Statistical Area data have not been seasonally adjusted. Seasonally adjusted data for Georgia available upon request. Albany MSA: includes Dougherty and Lee counties. Athens MSA: includes Clarke, Madison, and Oconee counties. Atlanta MSA: includes Barrow, Bartow, Carroll, Cherokee, Clayton, Cobb, Coweta, DeKalb, Douglas, Fayette, Forsyth, Fulton, Gwinnett, Henry, Newton, Paulding, Pickens, Rockdale, Spalding, and Walton counties.
Augusta -Aiken MSA: includes Columbia, McDuffie, and Richmond counties in Georgia and Aiken and Edgefield counties, South Carolina. Columbus MSA: includes Chattahoochee, Harris, and Muscogee counties in Georgia and Russell County, Alabama.
Macon MSA: includes Bibb, Houston, Jones, Peach, and Twiggs counties.
Savannah MSA: includes Bryan, Chatham, and Effingham counties.
SOURCE: Georgia Department of Labor, Workforce Information & Analysis
CITIES LABOR FORCE ESTIMATES (NOT SEASONALLY ADJUSTED)
TOTAL POPULATION OF 10,000 OR MORE
Albany Alpharetta Americus Athens Atlanta
PRELIMINARY NOVEMBER 2000
REVISED OCTOBER 2000
REVISED NOVEMBER 1999
LABOR
UNEMPLOYMENT
FORCE EMPLOYMENT NUMBER RATE
35,358
33,240 2,118 6.0
9,991
9,884 107 1.1
7,908
7,554 354 4.5
48,803
47,850 953 2.0
234,490 225,228 9,262 3.9
LABOR FORCE EMPLOYMENT
35,699
33,071
9,994
9,855
7,937
7,483
48,716
47,545
236,540 224,568
UNEMPLOYMENT NUMBER RATE
2,628 7.4 139 1.4 454 5.7
1,171 2.4 11,972 5.1
LABOR FORCE EMPLOYMENT
36,020
33,591
9,755
9,638
7,946
7,448
47,650
46,699
229,859 219,619
UNEMPLOYMENT NUMBER RATE
2,429 6.7 117 1.2 498 6.3 951 2.0
10,240 4.5
Augusta Bainbridge Brunswick Carrollton Cartersville
82,774 4,723 8,002
10,105 8,605
79,367 3,407 4.1 4,453 270 5.7 7,505 497 6.2 9,708 397 3.9 8,342 263 3.1
83,133 4,745 8,011
10,181 8,686
78,732 4,417 7,417 9,679 8,318
4,401 5.3 328 6.9 594 7.4 502 4.9 368 4.2
81,264 4,644 7,892
10,042 8,403
76,911 4,395 7,386 9,466 8,134
4,353 5.4 249 5.4 506 6.4 576 5.7 269 3.2
College Park Columbus Cordele Covington Dalton
13,741 89,141
4,474 6,330 14,009
13,239 502 3.7 85,917 3,224 3.6
4,252 222 5.0 6,075 255 4.0 13,423 586 4.2
13,847 89,071
4,501 6,375 14,335
13,200 84,601
4,225 6,057 13,257
647 4.7 4,470 5.0
276 6.1 318 5.0 1,078 7.5
13,449 87,321
4,462 6,248 13,667
12,909 82,978
4,206 5,924 13,190
540 4.0 4,343 5.0
256 5.7 324 5.2 477 3.5
Decatur Douglas Douglasville Dublin East Point
11,106 6,569 8,315 8,176
22,131
10,796 6,258 8,088 7,686
21,324
310 2.8 311 4.7 227 2.7 490 6.0 807 3.6
11,164 6,752 8,347 8,276
22,306
10,765 6,207 8,064 7,603
21,262
399 3.6 545 8.1 283 3.4 673 8.1 1,044 4.7
10,901 6,571 8,133 8,306
21,675
10,527 6,178 7,886 7,566
20,793
374 3.4 393 6.0 247 3.0 740 8.9 882 4.1
Forest Park Gainesville Griffin Hinesville LaGrange
10,834 12,965 11,990
8,795 13,417
10,463 12,683 11,197
8,320 12,927
371 3.4 282 2.2 793 6.6 475 5.4 490 3.7
10,908 12,846 12,056
8,836 13,462
10,433 12,508 11,164
8,217 12,772
475 4.4 338 2.6 892 7.4 619 7.0 690 5.1
10,576 12,723 11,542
8,596 13,487
10,203 12,419 10,918
8,172 12,710
373 3.5 304 2.4 624 5.4 424 4.9 777 5.8
Lawrenceville Macon Marietta Milledgeville Moultrie
14,998 51,476 35,613
5,971 7,366
14,631 367 2.4 49,316 2,160 4.2 34,702 911 2.6
5,644 327 5.5 6,643 723 9.8
15,066 51,806 35,752
6,023 7,570
14,588 48,944 34,600
5,573 6,598
478 3.2 2,862 5.5 1,152 3.2
450 7.5 972 12.8
14,701 49,784 34,908
5,987 7,176
14,267 47,311 33,837
5,545 6,568
434 3.0 2,473 5.0 1,071 3.1
442 7.4 608 8.5
Newnan Peachtree City Rome Roswell Savannah
9,304 14,345 15,180 36,370 65,102
9,051 253 2.7 14,069 276 1.9 14,696 484 3.2 35,977 393 1.1 63,080 2,022 3.1
9,347 14,405 15,190 36,380 65,121
9,025 14,028 14,511 35,872 62,394
322 3.4 377 2.6 679 4.5 508 1.4 2,727 4.2
9,119 14,029 15,177 35,510 64,208
8,826 13,719 14,436 35,081 61,529
293 3.2 310 2.2 741 4.9 429 1.2 2,679 4.2
Smyrna Snellville Statesboro Thomasville Tifton
28,959 10,697
9,808 9,553 8,095
28,421 10,509
9,548 9,041 7,759
538 1.9 188 1.8 260 2.7 512 5.4 336 4.2
29,017 10,723
9,767 9,627 8,100
28,337 10,478
9,446 8,956 7,697
680 2.3 245 2.3 321 3.3 671 7.0 403 5.0
28,346 10,469
9,655 9,421 8,051
27,713 10,247
9,400 8,917 7,661
633 2.2 222 2.1 255 2.6 504 5.3 390 4.8
Valdosta Vidalia Warner Robins Waycross
22,691 5,877
25,897 7,086
21,652 1,039 4.6 5,468 409 7.0
25,194 703 2.7 6,401 685 9.7
22,760 5,911
25,956 6,845
SOURCE: Georgia Department of Labor, Workforce Information & Analysis
21,428 5,417
25,004 6,331
1,332 5.9 494 8.4 952 3.7 514 7.5
22,920 5,842
25,084 6,715
21,324 5,390
24,170 6,302
1,596 7.0 452 7.7 914 3.6 413 6.2
GEORGIA REGIONAL DEVELOPMENT CENTERS (RDCs)
Atlanta Regional Commission Central Savannah River Chattahoochee - Flint Coastal Georgia Coosa Valley Georgia Mountains Heart of Georgia - Altamaha Lower Chattahoochee McIntosh Trail Middle Flint Middle Georgia North Georgia Northeast Georgia South Georgia Southeast Georgia Southwest Georgia
LABOR FORCE NOV 2000
EMPLOYED UNEMPLOYED
RATE
NOV 2000
NOV 2000 NOV 2000 OCT 2000 NOV 1999
1,944,641 1,899,793
44,848
2.3
3.0
2.7
203,749
195,030
8,719
4.3
5.3
5.6
137,374
133,622
3,752
2.7
3.5
3.8
243,940
237,127
6,813
2.8
3.6
3.3
253,739
246,856
6,883
2.7
3.6
3.2
232,956
228,798
4,158
1.8
2.3
2.3
113,915
108,112
5,803
5.1
6.5
7.3
115,168
110,934
4,234
3.7
5.1
4.8
67,198
64,060
3,138
4.7
5.7
4.7
45,194
43,255
1,939
4.3
5.6
5.1
207,490
200,719
6,771
3.3
4.3
4.1
94,569
91,853
2,716
2.9
4.9
2.6
209,721
204,699
5,022
2.4
3.0
2.8
110,634
105,940
4,694
4.2
5.4
5.6
66,176
62,593
3,583
5.4
6.6
4.7
161,034
152,741
8,293
5.1
6.4
5.5
AUGUSTA LABOR FORCE ESTIMATES BY PLACE OF RESIDENCE, PERSONS 16 YEARS OLD AND OVER
AREA Augusta-Aiken, GA-SC MSA
EMPLOYMENT STATUS
Civilian labor force Employed Unemployed Rate
Residing in Georgia
Civilian labor force Employed Unemployed Rate
Residing in South Carolina
Civilian labor force Employed
Unemployed Rate
PRELIMINARY NOV 2000
212,319 205,863
6,456 3.0
138,264 133,518
4,746 3.4
74,055 72,345
1,710 2.3
REVISED OCT 2000
213,170 204,925
8,245 3.9
138,629 132,450
6,179 4.5
74,541 72,475
2,066 2.8
REVISED NOV 1999
209,082 199,319
9,763 4.7
135,466 129,387
6,079 4.5
73,616 69,932
3,684 5.0
CHANGE FROM
REVISED OCT 2000
REVISED NOV 1999
-851 938 -1,789
--
3,237 6,544 -3,307
--
-365 1,068 -1,433
--
2,798 4,131 -1,333
--
-486 -130 -356
--
439 2,413 -1,974
--
NOTE: The Augusta Metropolitan Statistical Area includes Columbia, McDuffie, and Richmond counties, Georgia, and Aiken and Edgefield counties, South Carolina.
SOURCE: Georgia Department of Labor, Workforce Information & Analysis.
COLUMBUS LABOR FORCE ESTIMATES BY PLACE OF RESIDENCE, PERSONS 16 YEARS OLD AND OVER
AREA Columbus, GA-AL MSA
Residing in Georgia
Residing in Alabama
EMPLOYMENT STATUS
Civilian labor force Employed Unemployed Rate
Civilian labor force Employed
Unemployed Rate
Civilian labor force Employed Unemployed Rate
PRELIMINARY NOV 2000
131,161 126,388
4,773 3.6
104,015 100,412
3,603 3.5
27,146 25,976
1,170 4.3
REVISED OCT 2000
130,816 124,453
6,363 4.9
103,839 98,874 4,965 4.8
26,977 25,579
1,398 5.2
REVISED NOV 1999
128,270 122,233
6,037 4.7
101,725 96,977 4,748 4.7
26,545 25,256
1,289 4.9
CHANGE FROM
REVISED OCT 2000
REVISED NOV 1999
345 1,935 -1,590
--
2,891 4,155 -1,264
--
176 1,538 -1,362
--
2,290 3,435 -1,145
--
169 397 -228
--
601 720 -119
--
NOTE: The Columbus Metropolitan Statistical Area includes Chattahoochee, Harris, and Muscogee counties, Georgia, and Russell county, Alabama.
SOURCE: Georgia Department of Labor, Workforce Information & Analysis.
Produced by the Georgia Department of Labor, Workforce Information & Analysis in cooperation with the U.S. Department of Labor, Bureau of Labor Statistics.
COUNTY LABOR FORCE ESTIMATES (NOT SEASONALLY ADJUSTED)
PLACE OF RESIDENCE PERSONS 16 YEARS OLD AND OVER
PRELIMINARY NOVEMBER 2000
REVISED OCTOBER 2000
REVISED NOVEMBER 1999
Georgia
LABOR
UNEMPLOYMENT
FORCE EMPLOYMENT NUMBER RATE
LABOR
UNEMPLOYMENT
FORCE EMPLOYMENT NUMBER RATE
LABOR
UNEMPLOYMENT
FORCE EMPLOYMENT NUMBER RATE
4,207,497 4,086,127 121,370 2.9 4,219,119 4,061,827 157,292 3.7 4,135,524 3,992,909 142,615 3.4
Appling Atkinson Bacon Baker Baldwin
8,332 3,431 4,282 1,572 17,789
7,719 3,206 4,022 1,510 17,068
613 7.4 225 6.6 260 6.1
62 3.9 721 4.1
8,162 3,649 4,345 1,581 17,847
7,650 3,189 3,992 1,512 16,855
512 6.3 460 12.6 353 8.1
69 4.4 992 5.6
8,196 3,379 4,250 1,595 17,744
7,612 3,176 3,974 1,498 16,768
584 7.1 203 6.0 276 6.5
97 6.1 976 5.5
Banks Barrow Bartow Ben Hill Berrien
6,241 21,821 41,272
9,402 7,054
6,133 21,334 39,893
8,874 6,761
108 1.7 487 2.2 1,379 3.3 528 5.6 293 4.2
6,262 22,105 41,709
9,433 7,078
6,084 21,271 39,776
8,803 6,719
178 2.8 834 3.8 1,933 4.6 630 6.7 359 5.1
6,254 21,295 40,314
9,574 7,115
6,059 20,803 38,899
8,764 6,682
195 3.1 492 2.3 1,415 3.5 810 8.5 433 6.1
Bibb Bleckley Brantley Brooks Bryan
76,119 5,679 5,837 7,853
11,097
73,495 5,531 5,544 7,434
10,866
2,624 3.4 148 2.6 293 5.0 419 5.3 231 2.1
76,417 5,658 5,817 7,850
11,061
72,940 5,474 5,483 7,357
10,747
3,477 4.6 184 3.3 334 5.7 493 6.3 314 2.8
73,512 5,748 5,751 7,673
10,963
70,508 5,448 5,456 7,321
10,598
3,004 4.1 300 5.2 295 5.1 352 4.6 365 3.3
Bulloch Burke Butts Calhoun Camden
27,457 8,352 8,625 2,261
17,087
26,846 7,862 8,193 2,109
16,603
611 2.2 490 5.9 432 5.0 152 6.7 484 2.8
27,313 8,365 8,641 2,306
17,061
26,559 7,790 8,096 2,109
16,406
754 2.8 575 6.9 545 6.3 197 8.5 655 3.8
27,029 8,330 8,358 2,349
16,840
26,431 7,749 8,055 2,098
16,324
598 2.2 581 7.0 303 3.6 251 10.7 516 3.1
Candler Carroll Catoosa Charlton Chatham
4,002 46,308 26,324
3,821 108,949
3,865 45,016 25,766
3,687 106,106
137 3.4 1,292 2.8
558 2.1 134 3.5 2,843 2.6
4,017 46,516 26,609
3,803 108,785
3,842 44,884 25,695
3,644 104,951
175 4.4 1,632 3.5
914 3.4 159 4.2 3,834 3.5
4,053 45,768 25,757
3,751 107,262
3,823 43,895 25,141
3,626 103,496
230 5.7 1,873 4.1
616 2.4 125 3.3 3,766 3.5
Chattahoochee Chattooga Cherokee Clarke Clay
2,490 12,043 82,714 48,803
1,510
2,362 11,677 81,470 47,850
1,433
128 5.1 366 3.0 1,244 1.5 953 2.0
77 5.1
2,478 11,860 82,815 48,716
1,553
2,326 11,537 81,231 47,545
1,430
152 6.1 323 2.7 1,584 1.9 1,171 2.4 123 7.9
2,441 11,835 80,904 47,650
1,556
2,282 11,478 79,441 46,699
1,424
159 6.5 357 3.0 1,463 1.8 951 2.0 132 8.5
Clayton Clinch Cobb Coffee Colquitt
129,797 3,803
369,670 20,847 19,894
126,019 3,529
362,541 20,095 18,601
3,778 2.9 274 7.2
7,129 1.9 752 3.6
1,293 6.5
130,486 3,872
370,489 21,248 20,213
125,650 3,499
361,479 19,930 18,476
4,836 3.7 373 9.6
9,010 2.4 1,318 6.2 1,737 8.6
126,684 3,604
361,892 20,785 19,479
122,881 3,482
353,512 19,836 18,392
3,803 3.0 122 3.4
8,380 2.3 949 4.6
1,087 5.6
Columbia Cook Coweta Crawford Crisp
45,571 7,909
46,844 5,552 9,760
44,637 7,558
45,842 5,389 9,323
934 2.0 351 4.4 1,002 2.1 163 2.9 437 4.5
45,485 8,008
46,985 5,564 9,807
44,279 7,496
45,708 5,334 9,262
1,206 2.7 512 6.4
1,277 2.7 230 4.1 545 5.6
44,487 7,854
45,861 5,527 9,726
43,255 7,457
44,700 5,305 9,221
1,232 2.8 397 5.1
1,161 2.5 222 4.0 505 5.2
Dade Dawson Decatur DeKalb Dodge
7,335 15,038 11,996 379,806
9,703
7,200
135 1.8
14,848
190 1.3
11,418
578 4.8
369,304 10,502 2.8
9,401
302 3.1
7,329 14,872 12,029 381,718
9,694
7,180 14,639 11,325 368,223
9,286
149 2.0 233 1.6 704 5.9 13,495 3.5 408 4.2
7,236 14,809 11,803 372,758
9,846
7,025
211 2.9
14,530
279 1.9
11,270
533 4.5
360,108 12,650 3.4
9,219
627 6.4
Dooly Dougherty Douglas Early Echols
4,531 44,611 54,743
4,619 1,209
4,347 42,158 53,561
4,350 1,169
184 4.1 2,453 5.5 1,182 2.2
269 5.8 40 3.3
4,566 44,987 54,875
4,644 1,200
4,318 41,943 53,405
4,334 1,157
248 5.4 3,044 6.8 1,470 2.7
310 6.7 43 3.6
4,461 45,415 53,514
4,655 1,238
4,300 42,602 52,228
4,314 1,152
161 3.6 2,813 6.2 1,286 2.4
341 7.3 86 6.9
COUNTY LABOR FORCE ESTIMATES (NOT SEASONALLY ADJUSTED)
PLACE OF RESIDENCE PERSONS 16 YEARS OLD AND OVER
PRELIMINARY NOVEMBER 2000
Effingham Elbert Emanuel Evans Fannin
LABOR
UNEMPLOYMENT
FORCE EMPLOYMENT NUMBER RATE
18,110 8,859 8,561 4,920 8,788
17,718 8,272 7,910 4,772 8,585
392 2.2 587 6.6 651 7.6 148 3.0 203 2.3
Fayette Floyd Forsyth Franklin Fulton
51,952 44,624 52,023 10,327 425,521
51,209
743 1.4
43,547 1,077 2.4
51,491
532 1.0
10,025
302 2.9
413,280 12,241 2.9
Gilmer Glascock Glynn Gordon Grady
8,422 972
35,585 22,405
9,479
8,228 932
34,575 21,631
9,038
194 2.3 40 4.1
1,010 2.8 774 3.5 441 4.7
Greene Gwinnett Habersham Hall Hancock
5,795 347,059
16,425 72,509
3,912
5,592 340,831
16,008 71,174
3,572
203 3.5 6,228 1.8
417 2.5 1,335 1.8
340 8.7
Haralson Harris Hart Heard Henry
9,549 12,384
9,361 4,751 61,915
9,253 12,133
9,068 4,572 60,899
296 3.1 251 2.0 293 3.1 179 3.8 1,016 1.6
Houston Irwin Jackson Jasper Jeff Davis
53,353 4,865
22,943 4,840 5,345
52,012 4,632
22,506 4,688 5,089
1,341 2.5 233 4.8 437 1.9 152 3.1 256 4.8
Jefferson Jenkins Johnson Jones Lamar
7,343 4,513 3,568 12,481 6,959
6,692 4,255 3,323 12,100 6,657
651 8.9 258 5.7 245 6.9 381 3.1 302 4.3
Lanier Laurens Lee Liberty Lincoln
3,673 22,354 11,708 17,205
3,544
3,499 21,368 11,286 16,247
3,367
174 4.7 986 4.4 422 3.6 958 5.6 177 5.0
Long Lowndes Lumpkin McDuffie McIntosh
3,688 43,688 10,908
9,919 4,762
3,565 42,040 10,795
9,514 4,601
123 3.3 1,648 3.8
113 1.0 405 4.1 161 3.4
Macon Madison Marion Meriwether Miller
5,338 13,904
3,342 9,145 3,197
4,972 13,577
3,207 8,662 3,076
366 6.9 327 2.4 135 4.0 483 5.3 121 3.8
Mitchell Monroe Montgomery Morgan Murray
11,587 7,485 3,780 7,240
19,135
11,005 7,192 3,533 6,867
18,484
582 5.0 293 3.9 247 6.5 373 5.2 651 3.4
REVISED OCTOBER 2000
LABOR
UNEMPLOYMENT
FORCE EMPLOYMENT NUMBER RATE
18,052 8,961 8,682 4,930 8,796
17,525 8,197 7,857 4,735 8,522
527 2.9 764 8.5 825 9.5 195 4.0 274 3.1
52,075 44,510 52,044 10,350 427,903
51,059 1,016 2.0
43,000 1,510 3.4
51,340
704 1.4
9,933
417 4.0
412,070 15,833 3.7
8,431 976
35,377 22,328
9,528
8,154 924
34,169 21,394
9,027
277 3.3 52 5.3
1,208 3.4 934 4.2 501 5.3
5,792 347,943
16,349 71,793
3,942
5,540 339,832
15,859 70,193
3,534
252 4.4 8,111 2.3
490 3.0 1,600 2.2
408 10.4
9,539 12,290
9,418 4,720 62,020
9,169 11,947
8,980 4,512 60,721
370 3.9 343 2.8 438 4.7 208 4.4 1,299 2.1
53,437 4,905
22,899 4,828 5,319
51,619 4,595
22,282 4,650 5,045
1,818 3.4 310 6.3 617 2.7 178 3.7 274 5.2
7,443 4,367 3,618 12,471 6,962
6,629 4,214 3,292 12,008 6,570
814 10.9 153 3.5 326 9.0 463 3.7 392 5.6
3,721 22,492 11,795 17,295
3,557
3,463 21,138 11,228 16,046
3,332
258 6.9 1,354 6.0
567 4.8 1,249 7.2
225 6.3
3,634 43,717 10,808 10,010
4,778
3,521 41,604 10,652
9,438 4,553
113 3.1 2,113 4.8
156 1.4 572 5.7 225 4.7
5,474 13,839
3,336 9,101 3,197
4,948 13,490
3,180 8,545 3,060
526 9.6 349 2.5 156 4.7 556 6.1 137 4.3
11,687 7,488 3,884 7,028
19,448
10,936 7,093 3,500 6,817
18,218
751 6.4 395 5.3 384 9.9 211 3.0 1,230 6.3
REVISED NOVEMBER 1999
LABOR
UNEMPLOYMENT
FORCE EMPLOYMENT NUMBER RATE
17,777 8,785 8,875 4,862 8,718
17,282 8,160 7,804 4,713 8,464
495 2.8 625 7.1 1,071 12.1 149 3.1 254 2.9
50,769 44,423 51,043 10,187 416,371
49,934
835 1.6
42,776 1,647 3.7
50,209
834 1.6
9,887
300 2.9
402,989 13,382 3.2
8,359 968
35,054 22,060
9,582
8,124 919
34,026 21,289
8,965
235 2.8 49 5.1
1,028 2.9 771 3.5 617 6.4
5,877 339,696
16,216 71,131
3,991
5,515 332,343
15,786 69,692
3,515
362 6.2 7,353 2.2
430 2.7 1,439 2.0
476 11.9
9,503 11,964
9,262 4,751 60,532
9,106 11,718
8,938 4,478 59,383
397 4.2 246 2.1 324 3.5 273 5.7 1,149 1.9
51,643 4,832
22,820 4,775 5,313
49,898 4,574
22,182 4,618 5,021
1,745 3.4 258 5.3 638 2.8 157 3.3 292 5.5
7,260 4,334 3,522 11,987 6,847
6,595 4,185 3,276 11,608 6,523
665 9.2 149 3.4 246 7.0 379 3.2 324 4.7
3,634 22,523 11,791 16,813
3,697
3,446 21,036 11,405 15,959
3,318
188 5.2 1,487 6.6
386 3.3 854 5.1 379 10.3
3,600 43,933 10,743
9,714 4,687
3,502 41,402 10,575
9,220 4,533
98 2.7 2,531 5.8
168 1.6 494 5.1 154 3.3
5,266 13,682
3,336 9,003 3,174
4,923 13,250
3,166 8,484 3,047
343 6.5 432 3.2 170 5.1 519 5.8 127 4.0
11,563 7,386 3,810 7,032
18,631
10,879 7,043 3,483 6,786
18,088
684 5.9 343 4.6 327 8.6 246 3.5 543 2.9
COUNTY LABOR FORCE ESTIMATES (NOT SEASONALLY ADJUSTED)
PLACE OF RESIDENCE PERSONS 16 YEARS OLD AND OVER
PRELIMINARY NOVEMBER 2000
REVISED OCTOBER 2000
Muscogee Newton Oconee Oglethorpe Paulding
LABOR
UNEMPLOYMENT
FORCE EMPLOYMENT NUMBER RATE
89,141 30,739 13,826
6,136 42,245
85,917 30,039 13,699
6,019 41,500
3,224 3.6 700 2.3 127 0.9 117 1.9 745 1.8
LABOR
UNEMPLOYMENT
FORCE EMPLOYMENT NUMBER RATE
89,071 30,823 13,795
6,105 42,352
84,601 29,951 13,612
5,960 41,379
4,470 5.0 872 2.8 183 1.3 145 2.4 973 2.3
Peach Pickens Pierce Pike Polk
11,537 11,033
7,556 6,825 16,068
11,009 10,817
7,177 6,591 15,519
528 4.6 216 2.0 379 5.0 234 3.4 549 3.4
11,661 11,037
7,546 6,817 16,134
10,926 10,785
7,124 6,505 15,298
735 6.3 252 2.3 422 5.6 312 4.6 836 5.2
Pulaski Putnam Quitman Rabun Randolph
4,511 9,521 1,327 7,192 3,026
4,385 9,298 1,245 7,121 2,856
126 2.8 223 2.3
82 6.2 71 1.0 170 5.6
4,550 9,460 1,333 7,148 3,184
4,339 9,183 1,237 7,049 2,839
211 4.6 277 2.9
96 7.2 99 1.4 345 10.8
Richmond Rockdale Schley Screven Seminole
82,774 41,464
1,793 5,991 4,570
79,367 40,679
1,722 5,680 4,354
3,407 4.1 785 1.9 71 4.0 311 5.2 216 4.7
83,133 41,586
1,789 5,990 4,560
78,732 40,560
1,701 5,639 4,335
4,401 5.3 1,026 2.5
88 4.9 351 5.9 225 4.9
Spalding Stephens Stewart Sumter Talbot
31,445 12,102
2,332 15,443
2,958
29,985 11,806
2,195 14,889
2,793
1,460 4.6 296 2.4 137 5.9 554 3.6 165 5.6
31,539 12,063
2,309 15,459
2,933
29,897 11,668
2,177 14,749
2,755
1,642 5.2 395 3.3 132 5.7 710 4.6 178 6.1
Taliaferro Tattnall Taylor Telfair Terrell
703 7,363 3,918 5,263 3,873
670 6,988 3,759 4,855 3,577
33 4.7 375 5.1 159 4.1 408 7.8 296 7.6
716 7,428 3,961 5,341 3,921
664 6,965 3,731 4,819 3,559
52 7.3 463 6.2 230 5.8 522 9.8 362 9.2
Thomas Tift Toombs Towns Treutlen
22,271 20,788 12,722
3,738 2,837
21,384 20,060 11,700
3,652 2,675
887 4.0 728 3.5 1,022 8.0
86 2.3 162 5.7
22,345 20,769 12,827
3,731 2,953
21,183 19,898 11,590
3,619 2,650
1,162 5.2 871 4.2
1,237 9.6 112 3.0 303 10.3
Troup Turner Twiggs Union Upson
30,326 4,193 4,346 7,751
13,344
29,530 3,913 4,182 7,546
12,634
796 2.6 280 6.7 164 3.8 205 2.6 710 5.3
30,296 4,334 4,363 7,761
13,453
29,175 3,901 4,151 7,495
12,488
1,121 3.7 433 10.0 212 4.9 266 3.4 965 7.2
Walker Walton Ware Warren Washington
31,874 29,655 16,599
2,702 9,630
30,870 28,944 15,333
2,565 9,222
1,004 3.1 711 2.4
1,266 7.6 137 5.1 408 4.2
32,057 29,716 16,110
2,696 9,625
30,785 28,859 15,165
2,540 9,124
1,272 4.0 857 2.9 945 5.9 156 5.8 501 5.2
Wayne Webster Wheeler White Whitfield
11,649 1,069 2,142 9,341
47,191
11,025 1,036 2,007 9,131
45,739
624 5.4 33 3.1
135 6.3 210 2.2 1,452 3.1
11,782 1,054 2,176 9,300
47,846
10,908 1,032 1,991 9,048
45,174
874 7.4 22 2.1
185 8.5 252 2.7 2,672 5.6
Wilcox Wilkes Wilkinson Worth
3,313 5,694 4,467 9,396
3,199 5,462 4,286 8,875
114 3.4 232 4.1 181 4.1 521 5.5
3,358 5,695 4,470 9,484
SOURCE: Georgia Department of Labor, Workforce Information & Analysis
3,178 5,396 4,232 8,824
180 5.4 299 5.3 238 5.3 660 7.0
REVISED NOVEMBER 1999
LABOR
UNEMPLOYMENT
FORCE EMPLOYMENT NUMBER RATE
87,321 30,178 13,543
6,090 41,337
82,978 29,291 13,369
5,930 40,467
4,343 5.0 887 2.9 174 1.3 160 2.6 870 2.1
11,178 10,769
7,410 6,734 15,896
10,562 10,547
7,091 6,458 15,190
616 5.5 222 2.1 319 4.3 276 4.1 706 4.4
4,662 9,450 1,275 7,205 3,032
4,308 9,117 1,232 7,029 2,829
354 7.6 333 3.5
43 3.4 176 2.4 203 6.7
81,264 40,589
1,760 5,977 4,479
76,911 39,666
1,690 5,615 4,317
4,353 5.4 923 2.3 70 4.0 362 6.1 162 3.6
30,386 11,995
2,279 15,459
2,908
29,238 11,611
2,168 14,680
2,735
1,148 3.8 384 3.2 111 4.9 779 5.0 173 5.9
707 7,231 3,929 5,967 3,858
661 6,928 3,715 4,795 3,542
46 6.5 303 4.2 214 5.4 1,172 19.6 316 8.2
21,962 20,649 12,664
3,742 3,066
21,089 19,805 11,533
3,610 2,637
873 4.0\ 844 4.1 1,131 8.9 132 3.5 429 14.0
30,298 4,242 4,279 7,793
13,455
29,035 3,888 4,012 7,471
12,430
1,263 4.2 354 8.3 267 6.2 322 4.1
1,025 7.6
31,095 28,986 15,857
2,736 9,703
30,121 28,223 15,097
2,525 9,076
974 3.1 763 2.6 760 4.8 211 7.7 627 6.5
11,418 1,077 2,249 9,412
46,125
10,858 1,026 1,982 9,017
44,943
560 4.9 51 4.7
267 11.9 395 4.2 1,182 2.6
3,377 5,596 4,538 9,360
3,164 5,358 4,208 8,781
213 6.3 238 4.3 330 7.3 579 6.2