- Collection:
- Georgia Government Publications
- Serial:
- News release (Georgia Department of Labor)
- Title:
- News release, Apr. 23, 1998D
- Creator:
- Georgia. Department of Labor
- Contributor to Resource:
- Georgia. Department of Labor.
- Publisher:
- Atlanta, Ga. : Georgia Dept. of Labor, 1998-04-23
- Date of Original:
- 1998-04-23
- Subject:
- Georgia. Department of Labor--Periodicals
Labor--Georgia--Periodicals - Location:
- United States, Georgia, 32.75042, -83.50018
- Medium:
- state government records
- Type:
- Text
- Format:
- application/pdf
- Description:
- Title from caption
Each issue also has a distinctive theme title - External Identifiers:
- Call Number GA L200 .P1 N45 1998/4-23D
- Metadata URL:
- https://dlg.galileo.usg.edu/id:dlg_ggpd_i-ga-bl200-b-pp1-bn45-b1998-s4-h23d-belec-p-btext
- Digital Object URL:
- https://dlg.galileo.usg.edu/do:dlg_ggpd_i-ga-bl200-b-pp1-bn45-b1998-s4-h23d-belec-p-btext
- Language:
- eng
- Holding Institution:
- University of Georgia. Map and Government Information Library
- Rights:
-

Georgia Department of Labor
Suite 642 148 International Boulevard N.E. Atlanta, Georgia 30303-1751 (404)656-3032
April 23, 1998
FOR IMMEDIATE RELEASE
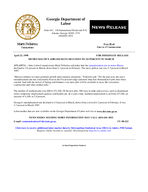
METRO MACON'S JOBLESS RATE DECLINES TO 5.0 PERCENT IN MARCH
ATLANTA -- State Labor Commissioner Marti Fullerton said today that the unemployment rate in metro Macon declined to 5.0 percent in March, down from 5.1 percent in February. The area's jobless rate was 5.3 percent in March 1997.
"Macon continues to enjoy good job growth and economic prosperity," Fullerton said. "For the past year, the area's unemployment rate has consistently been in the five percent range and more than four thousand new jobs have been created. And with the arrival of Spring and Summer even more jobs will be available in areas like recreation, construction and other outdoor jobs."
The number of nonfarm jobs rose 600 to 151,200. Of the new jobs, 500 were in trade and services, such as department stores, temporary employment agencies and health care. In a year's time, nonfarm employment is up from 147,100, an increase of 4,100, or 2.8 percent.
Georgia's unemployment rate declined to 4.0 percent in March, down from a revised 4.2 percent in February. It was 4.7 percent in March 1997.
Labor market data are now available on the Georgia Department of Labor web site at www.dol.state.ga.us
NEWS MEDIA NEEDING MORE INFORMATION MAY CALL (404) 656-3032 E-mail: communications@dol.state.ga.us.
FY-98-523
Click here to receive additional labor market data by Metropolitan Statistical Area (MSA) in Adobe .PDF format. Requires Adobe Acrobat to read file. Download from http://www.adobe.com.
An Equal Opportunity Employer
UNEMPLOYMENT
Macon Area Compared to Georgia
10%
Macon Area Georgia
9%
Macon Area: 5.0%
8%
Georgia: 4.0%
7%
6%
5%
4%
3%
2%
Mar Apr May Jun Jul Aug Sep Oct Nov Dec Jan Feb Mar 1%
1997
0%
1998
Note: Macon Area includes Bibb, Houston, Jones, Peach, and Twiggs counties. Source: Georgia Department of Labor - Marti Fullerton, Commissioner
GEORGIA LABOR FORCE ESTIMATES
PLACE OF RESIDENCE PERSONS 16 YEARS OLD AND OVER
AREA Georgia Albany MSA Athens MSA Atlanta MSA Augusta-Aiken, GA-SC MSA Columbus, GA-AL MSA Macon MSA Savannah MSA
EMPLOYMENT STATUS
Civilian labor force Employed
Unemployed Rate
Civilian labor force Employed
Unemployed Rate
Civilian labor force Employed
Unemployed Rate
Civilian labor force Employed
Unemployed Rate
Civilian labor force Employed
Unemployed Rate
Civilian labor force Employed
Unemployed Rate
Civilian labor force Employed
Unemployed Rate
Civilian labor force Employed
Unemployed Rate
PRELIMINARY MAR 1998
3,940,579 3,782,683
157,896 4.0
57,409 53,095
4,314 7.5
74,174 71,951
2,223 3.0
2,086,426 2,020,668
65,758 3.2
199,901 190,681
9,220 4.6
121,483 116,343
5,140 4.2
154,147 146,483
7,664 5.0
133,250 127,979
5,271 4.0
(NOT SEASONALLY ADJUSTED)
REVISED FEB 1998
3,926,651 3,763,603
163,048 4.2
57,173 53,398
3,775 6.6
74,537 72,332
2,205 3.0
2,075,549 2,009,149
66,400 3.2
201,790 190,650
11,140 5.5
121,690 116,512
5,178 4.3
153,982 146,141
7,841 5.1
133,289 127,917
5,372 4.0
REVISED MAR 1997
3,893,888 3,709,446
184,442 4.7
57,476 53,886
3,590 6.2
72,895 70,670
2,225 3.1
2,046,151 1,967,844
78,307 3.8
204,740 191,832
12,908 6.3
122,379 116,600
5,779 4.7
152,743 144,722
8,021 5.3
134,825 127,120
7,705 5.7
CHANGE FROM
REVISED FEB 1998
REVISED MAR 1997
13,928 19,080 -5,152
---
46,691 73,237 -26,546
---
236 -303 539
---
-363 -381
18 ---
-67 -791 724
---
1,279 1,281
-2 ---
10,877 11,519
-642 ---
40,275 52,824 -12,549
---
-1,889 31
-1,920 ---
-4,839 -1,151 -3,688
---
-207 -169
-38 ---
165 342 -177
---
-896 -257 -639
---
1,404 1,761 -357
---
-39 62 -101 ---
-1,575 859
-2,434 ---
UNITED STATES LABOR FORCE ESTIMATES
PLACE OF RESIDENCE PERSONS 16 YEARS OLD AND OVER
AREA United States (Seasonally adjusted)
United States (Not seasonally adjusted)
EMPLOYMENT STATUS
Civilian labor force Employed Unemployed
Rate
Civilian labor force Employed Unemployed Rate
MAR 1998
137,523,000 130,994,000
6,529,000 4.7
136,967,000 130,150,000
6,816,000 5.0
FEB 1998
137,557,000 131,163,000
6,393,000 4.6
136,286,000 129,482,000
6,804,000 5.0
MAR 1997
136,115,000 129,035,000
7,080,000 5.2
135,524,000 128,125,000
7,399,000 5.5
CHANGE FROM FEB 1998 MAR 1997
-34,000 -169,000 136,000
---
1,408,000 1,959,000
-551,000 ---
681,000 668,000
12,000 ---
1,443,000 2,025,000
-583,000 ---
NOTE: Employment includes nonagricultural wage and salary employment, self-employed, unpaid family and private household workers, and agricultural workers. Persons in labor disputes are counted as employed. The use of unrounded data does not imply that the numbers are exact. Georgia and Metropolitan Statistical Area data have not been seasonally adjusted. Seasonally adjusted data for Georgia available upon request. Albany MSA: includes Dougherty and Lee counties. Athens MSA: includes Clarke, Madison, and Oconee counties. Atlanta MSA: includes Barrow, Bartow, Carroll, Cherokee, Clayton, Cobb, Coweta, DeKalb, Douglas, Fayette, Forsyth, Fulton, Gwinnett, Henry, Newton, Paulding, Pickens, Rockdale, Spalding, and Walton counties.
Augusta -Aiken MSA: includes Columbia, McDuffie, and Richmond counties in Georgia and Aiken and Edgefield counties, South Carolina. Columbus MSA: includes Chattahoochee, Harris, and Muscogee counties in Georgia and Russell County, Alabama.
Macon MSA: includes Bibb, Houston, Jones, Peach, and Twiggs counties.
Savannah MSA: includes Bryan, Chatham, and Effingham counties.
SOURCE: Georgia Department of Labor, Labor Information Systems
CITIES LABOR FORCE ESTIMATES (NOT SEASONALLY ADJUSTED)
TOTAL POPULATION OF 10,000 OR MORE
Albany Alpharetta Americus Athens Atlanta
PRELIMINARY MARCH 1998
REVISED FEBRUARY 1998
REVISED MARCH 1997
LABOR
UNEMPLOYMENT
FORCE EMPLOYMENT NUMBER RATE
36,980
33,755 3,225 8.7
9,277
9,145 132 1.4
8,144
7,347 797 9.8
47,845
46,337 1,508 3.2
220,159 208,743 11,416 5.2
LABOR
UNEMPLOYMENT
FORCE EMPLOYMENT NUMBER RATE
36,759
33,947 2,812 7.6
9,224
9,093
131 1.4
8,107
7,303
804 9.9
48,039
46,583 1,456 3.0
218,902 207,553 11,349 5.2
LABOR
UNEMPLOYMENT
FORCE EMPLOYMENT NUMBER RATE
36,983
34,258 2,725 7.4
9,073
8,906
167 1.8
8,087
7,227
860 10.6
47,003
45,512 1,491 3.2
217,705 203,285 14,420 6.6
Augusta Bainbridge Brunswick Carrollton Cartersville
80,197 4,829 7,895 9,405 7,643
74,866 5,331 6.6 4,571 258 5.3 7,342 553 7.0 8,831 574 6.1 7,322 321 4.2
80,759 4,809 7,828 9,455 7,611
75,241 4,551 7,270 8,781 7,280
5,518 6.8 258 5.4 558 7.1 674 7.1 331 4.3
81,532 4,831 7,783 9,229 7,499
75,706 4,507 7,187 8,600 7,130
5,826 7.1 324 6.7 596 7.7 629 6.8 369 4.9
College Park Columbus Cordele Covington Dalton
12,853 82,847 4,564 5,722 13,961
12,244 609 4.7 78,940 3,907 4.7
4,221 343 7.5 5,271 451 7.9 13,313 648 4.6
12,778 82,947
4,495 5,719 13,845
12,174 79,139
4,211 5,241 13,180
604 4.7 3,808 4.6
284 6.3 478 8.4 665 4.8
12,688 83,511
4,503 5,612 13,718
11,924 79,217
4,179 5,133 13,007
764 6.0 4,294 5.1
324 7.2 479 8.5 711 5.2
Decatur Douglas Douglasville Dublin East Point
10,600 5,710 7,531 8,439
20,722
10,211 5,304 7,241 7,757
19,729
389 3.7 406 7.1 290 3.9 682 8.1 993 4.8
10,546 5,725 7,485 9,381
20,601
10,153 5,287 7,199 7,695
19,617
393 3.7 438 7.7 286 3.8 1,686 18.0 984 4.8
10,419 5,637 7,350 8,049
20,472
9,944 5,239 7,051 7,607 19,213
475 4.6 398 7.1 299 4.1 442 5.5 1,259 6.1
Forest Park Gainesville Griffin Hinesville LaGrange
10,074 12,281 11,410
8,958 12,888
9,651 11,843 10,679
8,382 12,066
423 4.2 438 3.6 731 6.4 576 6.4 822 6.4
10,015 12,125 11,410
8,861 12,796
9,596 11,691 10,618
8,298 11,949
419 4.2 434 3.6 792 6.9 563 6.4 847 6.6
9,900 12,071 11,195
8,855 12,809
9,399 11,588 10,400
8,186 11,799
501 5.1 483 4.0 795 7.1 669 7.6 1,010 7.9
Lawrenceville Macon Marietta Milledgeville Moultrie
13,183 51,838 32,531
5,906 6,982
12,756 427 3.2 48,159 3,679 7.1 31,449 1,082 3.3
5,574 332 5.6 6,509 473 6.8
13,105 51,655 32,369
6,296 6,949
12,684 48,046 31,269
5,517 6,495
421 3.2 3,609 7.0 1,100 3.4
779 12.4 454 6.5
12,900 51,178 31,968
5,797 7,079
12,423 47,580 30,627
5,443 6,443
477 3.7 3,598 7.0 1,341 4.2
354 6.1 636 9.0
Newnan Peachtree City Rome Roswell Savannah
8,058 12,770 15,986 33,769 64,153
7,734 324 4.0 12,382 388 3.0 15,030 956 6.0 33,286 483 1.4 60,949 3,204 5.0
7,999 12,679 15,738 33,576 64,182
7,690 12,312 14,875 33,097 60,919
309 3.9 367 2.9 863 5.5 479 1.4 3,263 5.1
7,879 12,444 15,674 33,029 65,036
7,532 12,059 14,676 32,416 60,540
347 4.4 385 3.1 998 6.4 613 1.9 4,496 6.9
Smyrna Snellville Statesboro Thomasville Tifton
26,395 9,381 9,524 9,081 8,086
25,756 9,162 9,107 8,630 7,547
639 2.4 219 2.3 417 4.4 451 5.0 539 6.7
26,260 9,326 9,422 9,038 8,042
25,610 9,110 9,035 8,577 7,516
650 2.5 216 2.3 387 4.1 461 5.1 526 6.5
25,875 9,168 9,278 9,026 8,283
25,083 8,923 8,931 8,491 7,446
792 3.1 245 2.7 347 3.7 535 5.9 837 10.1
Valdosta Vidalia Warner Robins Waycross
21,264 5,851
24,588 6,724
20,314 5,456
23,654 6,351
950 4.5 395 6.8 934 3.8 373 5.5
21,161 5,814
24,636 6,658
SOURCE: Georgia Department of Labor, Labor Information Systems
20,169 5,423
23,599 6,299
992 4.7 391 6.7 1,037 4.2 359 5.4
21,313 5,903
24,573 6,661
19,943 5,365
23,370 6,227
1,370 6.4 538 9.1
1,203 4.9 434 6.5
GEORGIA REGIONAL DEVELOPMENT CENTERS (RDCs)
Atlanta Regional Commission Central Savannah River Chattahoochee - Flint Coastal Georgia Coosa Valley Georgia Mountains Heart of Georgia - Altamaha Lower Chattahoochee McIntosh Trail Middle Flint Middle Georgia North Georgia Northeast Georgia South Georgia Southeast Georgia Southwest Georgia
LABOR FORCE MAR 1998
EMPLOYED UNEMPLOYED
RATE
MAR 1998
MAR 1998 MAR 1998 FEB 1998 MAR 1997
1,778,919 1,724,102
54,817
3.1
3.1
3.8
197,947
184,834
13,113
6.6
7.4
7.7
125,180
120,137
5,043
4.0
4.3
4.7
236,366
226,826
9,540
4.0
4.0
5.2
239,504
229,320
10,184
4.3
4.1
4.9
209,231
202,439
6,792
3.2
3.3
4.0
114,210
106,618
7,592
6.6
8.5
6.7
107,461
102,431
5,030
4.7
4.7
5.3
65,396
62,758
2,638
4.0
4.3
4.8
45,891
42,573
3,318
7.2
7.1
8.3
203,254
193,295
9,959
4.9
5.5
5.2
91,718
88,030
3,688
4.0
4.3
4.6
195,909
188,404
7,505
3.8
3.8
4.3
106,302
101,069
5,233
4.9
5.0
6.7
62,973
59,654
3,319
5.3
5.7
5.6
160,317
150,195
10,122
6.3
5.9
7.2
AUGUSTA LABOR FORCE ESTIMATES BY PLACE OF RESIDENCE, PERSONS 16 YEARS OLD AND OVER
AREA Augusta-Aiken, GA-SC MSA
Residing in Georgia
Residing in South Carolina
EMPLOYMENT STATUS
Civilian labor force Employed
Unemployed Rate
Civilian labor force Employed
Unemployed Rate
Civilian labor force Employed Unemployed
Rate
PRELIMINARY MAR 1998
199,901 190,681
9,220 4.6
130,235 122,922
7,313 5.6
69,666 67,759
1,907 2.7
REVISED FEB 1998
201,790 190,650
11,140 5.5
131,115 123,538
7,577 5.8
70,675 67,112
3,563 5.0
REVISED MAR 1997
204,740 191,832
12,908 6.3
132,993 124,302
8,691 6.5
71,747 67,530
4,217 5.9
CHANGE FROM
REVISED FEB 1998
REVISED MAR1997
-1,889 31
-1,920 ---
-4,839 -1,151 -3,688
---
-880 -616 -264
---
-2,758 -1,380 -1,378
---
-1,009 647
-1,656 ---
-2,081 229
-2,310 ---
NOTE: The Augusta Metropolitan Statistical Area includes Columbia, McDuffie, and Richmond counties, Georgia, and Aiken and Edgefield counties, South Carolina.
SOURCE: Georgia Department of Labor, Labor Information Systems.
COLUMBUS LABOR FORCE ESTIMATES BY PLACE OF RESIDENCE, PERSONS 16 YEARS OLD AND OVER
AREA Columbus, GA-AL MSA
Residing in Georgia
Residing in Alabama
EMPLOYMENT STATUS
Civilian labor force Employed Unemployed
Rate
Civilian labor force Employed Unemployed
Rate
Civilian labor force Employed Unemployed Rate
PRELIMINARY MAR 1998
121,483 116,343
5,140 4.2
95,942 91,639
4,303 4.5
25,541 24,704
837 3.3
REVISED FEB 1998
121,690 116,512
5,178 4.3
96,102 91,869
4,233 4.4
25,588 24,643
945 3.7
REVISED MAR 1997
122,379 116,600
5,779 4.7
96,723 91,960
4,763 4.9
25,656 24,640
1,016 4.0
CHANGE FROM
REVISED FEB 1998
REVISED MAR 1997
-207 -169
-38 ---
-896 -257 -639
---
-160 -230
70 ---
-781 -321 -460
---
-47 61 -108 ---
-115 64
-179 ---
NOTE: The Columbus Metropolitan Statistical Area includes Chattahoochee, Harris, and Muscogee counties, Georgia, and Russell County, Alabama.
SOURCE: Georgia Department of Labor, Labor Information Systems.
Produced by the Georgia Department of Labor, Labor Information Systems in cooperation with the U.S. Department of Labor, Bureau of Labor Statistics.
COUNTY LABOR FORCE ESTIMATES (NOT SEASONALLY ADJUSTED)
PLACE OF RESIDENCE PERSONS 16 YEARS OLD AND OVER
PRELIMINARY MARCH 1998
REVISED FEBRUARY 1998
REVISED MARCH 1997
Georgia
LABOR
UNEMPLOYMENT
FORCE EMPLOYMENT NUMBER RATE
LABOR
UNEMPLOYMENT
FORCE EMPLOYMENT NUMBER RATE
LABOR
UNEMPLOYMENT
FORCE EMPLOYMENT NUMBER RATE
3,940,579 3,782,683 157,896 4.0 3,926,651 3,763,603 163,048 4.2 3,893,888 3,709,446 184,442 4.7
Appling Atkinson Bacon Baker Baldwin
8,671 3,376 4,667 1,561 17,591
7,797 3,103 4,240 1,404 16,858
874 10.1 273 8.1 427 9.1 157 10.1 733 4.2
8,611 3,411 4,678 1,549 18,403
7,752 3,104 4,221 1,419 16,685
859 10.0 307 9.0 457 9.8 130 8.4 1,718 9.3
8,328 3,348 4,444 1,605 17,243
7,672 3,083 4,182 1,421 16,461
656 7.9 265 7.9 262 5.9 184 11.5 782 4.5
Banks Barrow Bartow Ben Hill Berrien
6,035 19,677 36,698
8,877 6,979
5,805 18,837 35,012
8,432 6,733
230 3.8 840 4.3 1,686 4.6 445 5.0 246 3.5
6,058 19,517 36,552
8,875 7,014
5,780 18,730 34,813
8,397 6,726
278 4.6 787 4.0 1,739 4.8 478 5.4 288 4.1
6,094 19,143 36,036
8,957 7,098
5,728 18,345 34,097
8,322 6,668
366 6.0 798 4.2 1,939 5.4 635 7.1 430 6.1
Bibb Bleckley Brantley Brooks Bryan
76,247 5,404 5,611 7,518
10,190
71,778 5,161 5,286 6,999 9,901
4,469 5.9 243 4.5 325 5.8 519 6.9 289 2.8
75,994 5,380 5,626 7,585
10,196
71,610 5,129 5,240 6,949 9,897
4,384 5.8 251 4.7 386 6.9 636 8.4 299 2.9
75,286 5,314 5,605 7,338
10,314
70,915 5,071 5,178 6,871 9,835
4,371 5.8 243 4.6 427 7.6 467 6.4 479 4.6
Bulloch Burke Butts Calhoun Camden
26,585 8,410 8,605 2,273
16,101
25,606 7,431 8,199 2,097
15,442
979 3.7 979 11.6 406 4.7 176 7.7 659 4.1
26,313 8,451 8,533 2,254
15,944
25,404 7,393 8,123 2,111
15,301
909 3.5 1,058 12.5
410 4.8 143 6.3 643 4.0
25,928 8,460 8,420 2,281
15,864
25,113 7,315 8,021 2,102
15,110
815 3.1 1,145 13.5
399 4.7 179 7.8 754 4.8
Candler Carroll Catoosa Charlton Chatham
4,184 42,818 24,840
3,882 107,025
3,965 40,951 23,849
3,743 102,520
219 5.2 1,867 4.4
991 4.0 139 3.6 4,505 4.2
4,181 42,908 24,634
3,895 107,058
3,962 40,717 23,638
3,708 102,470
219 5.2 2,191 5.1
996 4.0 187 4.8 4,588 4.3
4,097 41,927 24,916
3,860 108,153
3,927 39,880 23,928
3,662 101,832
170 4.1 2,047 4.9
988 4.0 198 5.1 6,321 5.8
Chattahoochee Chattooga Cherokee Clarke Clay
2,248 12,033 71,811 47,845
1,621
2,093 11,603 70,084 46,337
1,516
155 6.9 430 3.6 1,727 2.4 1,508 3.2 105 6.5
2,262 11,946 71,355 48,039
1,652
2,099 11,489 69,685 46,583
1,520
163 7.2 457 3.8 1,670 2.3 1,456 3.0 132 8.0
2,262 12,005 70,043 47,003
1,686
2,101 11,343 68,252 45,512
1,513
161 7.1 662 5.5 1,791 2.6 1,491 3.2 173 10.3
Clayton Clinch Cobb Coffee Colquitt
120,545 4,065
337,018 18,013 19,072
116,234 3,949
328,556 17,031 18,226
4,311 3.6 116 2.9
8,462 2.5 982 5.5 846 4.4
119,840 4,090
335,284 18,034 19,000
115,572 3,929
326,683 16,976 18,188
4,268 3.6 161 3.9
8,601 2.6 1,058 5.9
812 4.3
118,299 4,109
330,455 17,785 19,176
113,196 5,103 4.3
3,888
221 5.4
319,967 10,488 3.2
16,822
963 5.4
18,040 1,136 5.9
Columbia Cook Coweta Crawford Crisp
40,579 7,605
40,454 5,113 9,931
39,316 7,251
39,172 4,880 9,255
1,263 3.1 354 4.7
1,282 3.2 233 4.6 676 6.8
40,993 7,593
40,173 5,086 9,794
39,513 7,223
38,949 4,848 9,233
1,480 3.6 370 4.9
1,224 3.0 238 4.7 561 5.7
41,535 7,768
39,523 5,090 9,800
39,757 7,154
38,148 4,791 9,161
1,778 4.3 614 7.9
1,375 3.5 299 5.9 639 6.5
Dade Dawson Decatur DeKalb Dodge
6,980 10,886 12,273 362,430
9,386
6,677
303 4.3
10,648
238 2.2
11,719
554 4.5
349,285 13,145 3.6
8,786
600 6.4
6,910 10,741 12,221 360,603
9,373
6,617
293 4.2
10,495
246 2.3
11,668
553 4.5
347,294 13,309 3.7
8,694
679 7.2
7,025 10,735 12,250 356,206
9,243
6,699
326 4.6
10,461
274 2.6
11,555
695 5.7
340,154 16,052 4.5
8,632
611 6.6
Dooly Dougherty Douglas Early Echols
4,748 46,545 49,457
5,021 1,109
See note on page 14
4,343 42,810 47,952
4,653 1,078
405 8.5 3,735 8.0 1,505 3.0
368 7.3 31 2.8
4,649 46,311 49,168
4,984 1,094
4,333 43,054 47,679
4,659 1,070
316 6.8 3,257 7.0 1,489 3.0
325 6.5 24 2.2
4,723 46,604 48,254
5,050 1,115
4,299 43,448 46,699
4,628 1,058
424 9.0 3,156 6.8 1,555 3.2
422 8.4 57 5.1
COUNTY LABOR FORCE ESTIMATES (NOT SEASONALLY ADJUSTED)
PLACE OF RESIDENCE PERSONS 16 YEARS OLD AND OVER
PRELIMINARY MARCH 1998
LABOR
UNEMPLOYMENT
FORCE EMPLOYMENT NUMBER RATE
Effingham Elbert Emanuel Evans Fannin
16,035 9,126 8,607 4,901 8,565
15,558 8,436 7,980 4,695 8,108
477 3.0 690 7.6 627 7.3 206 4.2 457 5.3
Fayette Floyd Forsyth Franklin Fulton
46,114 46,663 40,049 10,099 397,427
45,069 1,045 2.3
44,537 2,126 4.6
39,355
694 1.7
9,737
362 3.6
382,370 15,057 3.8
Gilmer Glascock Glynn Gordon Grady
8,410 1,157 34,948 21,580 9,422
7,923 1,014 33,823 20,723 8,884
487 5.8 143 12.4 1,125 3.2 857 4.0 538 5.7
Greene Gwinnett Habersham Hall Hancock
5,736 304,398
15,067 68,527
3,789
5,382 297,159
14,564 66,458
3,473
354 6.2 7,239 2.4
503 3.3 2,069 3.0
316 8.3
Haralson Harris Hart Heard Henry
9,341 10,846
8,539 3,864 51,650
8,776 10,605
8,168 3,677 50,404
565 6.0 241 2.2 371 4.3 187 4.8 1,246 2.4
Houston Irwin Jackson Jasper Jeff Davis
50,614 4,624
21,751 4,984 5,754
48,832 4,390
20,848 4,816 5,373
1,782 3.5 234 5.1 903 4.2 168 3.4 381 6.6
Jefferson Jenkins Johnson Jones Lamar
7,741 4,695 3,989 11,990 7,547
7,046 4,457 3,513 11,501 7,263
695 9.0 238 5.1 476 11.9 489 4.1 284 3.8
Lanier Laurens Lee Liberty Lincoln
3,231 22,937 10,864 17,530
3,690
3,152 21,566 10,285 16,369
3,460
79 2.4 1,371 6.0
579 5.3 1,161 6.6
230 6.2
Long Lowndes Lumpkin McDuffie McIntosh
3,543 40,949
9,963 9,459 4,409
3,417 39,442
9,379 8,740 4,190
126 3.6 1,507 3.7
584 5.9 719 7.6 219 5.0
Macon Madison Marion Meriwether Miller
5,583 13,525
3,458 9,144 3,029
5,085 13,086
3,304 8,773 2,932
498 8.9 439 3.2 154 4.5 371 4.1
97 3.2
Mitchell
11,175
Monroe
7,921
Montgomery
3,928
Morgan
7,129
Murray
18,258
See note on page 14
10,231 7,377 3,556 6,888
17,439
944 8.4 544 6.9 372 9.5 241 3.4 819 4.5
REVISED FEBRUARY 1998
LABOR
UNEMPLOYMENT
FORCE EMPLOYMENT NUMBER RATE
16,036 9,158 8,636 4,848 8,489
15,550 8,386 7,920 4,674 8,024
486 3.0 772 8.4 716 8.3 174 3.6 465 5.5
45,802 45,997 39,917 10,054 395,124
44,812
990 2.2
44,078 1,919 4.2
39,131
786 2.0
9,681
373 3.7
380,190 14,934 3.8
8,428 1,160 34,627 21,384 9,430
7,873 1,007 33,493 20,554 8,877
555 6.6 153 13.2 1,134 3.3 830 3.9 553 5.9
5,680 302,608
14,994 67,663
4,233
5,350 295,465
14,481 65,609
3,448
330 5.8 7,143 2.4
513 3.4 2,054 3.0
785 18.5
9,302 10,894
8,459 3,833 51,558
8,686 10,632
8,118 3,632 50,117
616 6.6 262 2.4 341 4.0 201 5.2 1,441 2.8
50,698 4,592
21,503 4,937 5,777
48,718 4,372
20,710 4,773 5,346
1,980 3.9 220 4.8 793 3.7 164 3.3 431 7.5
8,193 4,639 4,148 12,146 7,460
7,006 4,425 3,490 11,474 7,174
1,187 14.5 214 4.6 658 15.9 672 5.5 286 3.8
3,230 24,783 10,862 17,341
3,635
3,129 21,394 10,344 16,205
3,434
101 3.1 3,389 13.7
518 4.8 1,136 6.6
201 5.5
3,499 40,732
9,557 9,363 4,347
3,382 39,159
9,261 8,784 4,159
117 3.3 1,573 3.9
296 3.1 579 6.2 188 4.3
5,657 13,662
3,455 9,036 3,053
5,089 13,155
3,288 8,666 2,937
568 10.0 507 3.7 167 4.8 370 4.1 116 3.8
11,125 7,860 3,858 7,139
18,114
10,221 7,284 3,535 6,867
17,207
904 8.1 576 7.3 323 8.4 272 3.8 907 5.0
REVISED MARCH 1997
LABOR
UNEMPLOYMENT
FORCE EMPLOYMENT NUMBER RATE
16,358 9,018 8,824 4,845 8,486
15,453 8,303 7,830 4,633 7,930
905 5.5 715 7.9 994 11.3 212 4.4 556 6.6
44,929 45,707 39,199 10,123 391,474
43,891 1,038 2.3
43,488 2,219 4.9
38,326
873 2.2
9,584
539 5.3
372,374 19,100 4.9
8,366 1,177 34,319 21,539 10,113
7,805 998
33,107 20,313
8,809
561 6.7 179 15.2 1,212 3.5 1,226 5.7 1,304 12.9
5,614 297,478
15,224 67,313
3,821
5,296 289,391
14,336 65,029
3,405
318 5.7 8,087 2.7
888 5.8 2,284 3.4
416 10.9
9,129 10,950
8,513 3,840 50,497
8,573 10,642
8,036 3,603 49,087
556 6.1 308 2.8 477 5.6 237 6.2 1,410 2.8
50,541 4,664
21,319 5,056 5,675
48,245 4,333
20,495 4,715 5,293
2,296 4.5 331 7.1 824 3.9 341 6.7 382 6.7
8,189 4,621 3,692 11,779 7,415
6,927 4,403 3,455 11,362 7,113
1,262 15.4 218 4.7 237 6.4 417 3.5 302 4.1
3,222 22,038 10,872 17,335
3,621
3,094 21,150 10,438 15,986
3,398
128 4.0 888 4.0 434 4.0 1,349 7.8 223 6.2
3,454 40,893
9,485 9,925 4,373
3,337 38,720
9,209 8,838 4,113
117 3.4 2,173 5.3
276 2.9 1,087 11.0
260 5.9
5,820 13,304
3,405 9,048 3,083
5,049 12,853
3,257 8,587 2,918
771 13.2 451 3.4 148 4.3 461 5.1 165 5.4
11,452 7,566 3,845 7,097
17,972
10,137 7,217 3,497 6,807
17,031
1,315 11.5 349 4.6 348 9.1 290 4.1 941 5.2
COUNTY LABOR FORCE ESTIMATES (NOT SEASONALLY ADJUSTED)
PLACE OF RESIDENCE PERSONS 16 YEARS OLD AND OVER
PRELIMINARY MARCH 1998
REVISED FEBRUARY 1998
Muscogee Newton Oconee Oglethorpe Paulding
LABOR
UNEMPLOYMENT
FORCE EMPLOYMENT NUMBER RATE
82,847 27,301 12,804
5,261 35,296
78,940 26,065 12,528
5,053 34,435
3,907 4.7 1,236 4.5
276 2.2 208 4.0 861 2.4
LABOR
UNEMPLOYMENT
FORCE EMPLOYMENT NUMBER RATE
82,947 27,227 12,836
5,247 35,017
79,139 25,916 12,594
5,025 34,239
3,808 4.6 1,311 4.8
242 1.9 222 4.2 778 2.2
Peach Pickens Pierce Pike Polk
11,059 9,516 7,458 6,289
15,711
10,377 9,197 7,085 6,040
14,859
682 6.2 319 3.4 373 5.0 249 4.0 852 5.4
10,887 9,458 7,454 6,196
15,446
10,352 9,145 7,063 5,966
14,658
535 4.9 313 3.3 391 5.2 230 3.7 788 5.1
Pulaski Putnam Quitman Rabun Randolph
4,510 8,888 1,296 7,074 3,462
4,242 8,555 1,234 6,801 3,137
268 5.9 333 3.7
62 4.8 273 3.9 325 9.4
4,418 8,809 1,281 7,017 3,530
4,206 8,465 1,223 6,747 3,128
212 4.8 344 3.9
58 4.5 270 3.8 402 11.4
Richmond Rockdale Schley Screven Seminole
80,197 38,069
1,800 6,149 4,585
74,866 36,989
1,719 5,684 4,415
5,331 6.6 1,080 2.8
81 4.5 465 7.6 170 3.7
80,759 37,919
1,790 6,209 4,627
75,241 36,778
1,700 5,664 4,423
5,518 6.8 1,141 3.0
90 5.0 545 8.8 204 4.4
Spalding Stephens Stewart Sumter Talbot
29,942 13,071
2,546 15,729
2,595
28,597 12,490
2,416 14,482
2,490
1,345 4.5 581 4.4 130 5.1
1,247 7.9 105 4.0
29,892 13,023
2,584 15,652
2,566
28,434 12,375
2,404 14,394
2,458
1,458 4.9 648 5.0 180 7.0
1,258 8.0 108 4.2
Taliaferro Tattnall Taylor Telfair Terrell
663 7,321 3,499 5,070 4,160
601 6,926 3,285 4,756 3,649
62 9.4 395 5.4 214 6.1 314 6.2 511 12.3
648 7,346 3,491 5,037 4,114
603 6,947 3,277 4,739 3,649
45 6.9 399 5.4 214 6.1 298 5.9 465 11.3
Thomas Tift Toombs Towns Treutlen
21,192 20,676 12,662
3,462 2,900
20,410 19,510 11,673
3,246 2,663
782 3.7 1,166 5.6
989 7.8 216 6.2 237 8.2
21,084 20,570 12,580
3,490 2,946
20,286 19,431 11,603
3,226 2,647
798 3.8 1,139 5.5
977 7.8 264 7.6 299 10.1
Troup Turner Twiggs Union Upson
28,900 4,734 4,238 7,045
13,013
27,564 4,082 3,996 6,696
12,659
1,336 4.6 652 13.8 242 5.7 349 5.0 354 2.7
28,672 4,536 4,256 7,001
12,936
27,295 4,087 3,986 6,676
12,542
1,377 4.8 449 9.9 270 6.3 325 4.6 394 3.0
Walker Walton Ware
Warren Washington
30,362 25,754 15,901
2,834 10,140
28,849 24,944 15,217
2,520 9,296
1,513 5.0 810 3.1 684 4.3
314 11.1 844 8.3
30,016 25,629 15,747
2,746 10,240
28,593 24,802 15,089
2,503 9,227
1,423 4.7 827 3.2 658 4.2
243 8.8 1,013 9.9
Wayne Webster Wheeler White Whitfield
11,064 1,143 2,128 9,414
46,969
10,320 1,100 1,971 9,092
45,363
744 6.7 43 3.8
157 7.4 322 3.4 1,606 3.4
11,079 1,152 2,188 9,385
46,562
10,238 1,102 1,965 9,033
44,912
841 7.6 50 4.3
223 10.2 352 3.8 1,650 3.5
Wilcox Wilkes Wilkinson Worth
3,390 5,848 4,609 9,145
3,168 5,437 4,325 8,480
222 6.5 411 7.0 284 6.2 665 7.3
3,394 5,741 4,645 9,090
SOURCE: Georgia Department of Labor, Labor Information Systems
3,161 5,376 4,283 8,477
233 6.9 365 6.4 362 7.8 613 6.7
REVISED MARCH 1997
LABOR
UNEMPLOYMENT
FORCE EMPLOYMENT NUMBER RATE
83,511 26,696 12,588
5,169 34,443
79,217 25,383 12,305
4,971 33,535
4,294 5.1 1,313 4.9
283 2.2 198 3.8 908 2.6
11,005 9,286 7,373 6,149
15,558
10,252 8,957 7,002 5,914
14,525
753 6.8 329 3.5 371 5.0 235 3.8 1,033 6.6
4,416 8,851 1,255 6,963 3,479
4,187 8,390 1,210 6,689 3,108
229 5.2 461 5.2
45 3.6 274 3.9 371 10.7
81,532 37,095
1,805 6,437 4,620
75,706 36,022
1,691 5,619 4,394
5,826 7.1 1,073 2.9
114 6.3 818 12.7 226 4.9
29,312 12,997
2,572 15,591
2,614
27,850 12,221
2,382 14,245
2,441
1,462 5.0 776 6.0 190 7.4
1,346 8.6 173 6.6
637 7,337 3,587 5,017 4,070
598 6,901 3,249 4,697 3,623
39 6.1 436 5.9 338 9.4 320 6.4 447 11.0
21,010 21,062 12,825
3,662 2,834
20,083 19,250 11,479
3,201 2,618
927 4.4 1,812 8.6 1,346 10.5
461 12.6 216 7.6
28,596 4,532 4,131 7,058
13,077
26,954 4,069 3,948 6,636
12,393
1,642 5.7 463 10.2 183 4.4 422 6.0 684 5.2
30,655 25,859 15,715
2,794 9,620
28,944 24,292 14,917
2,473 9,117
1,711 5.6 1,567 6.1
798 5.1
321 11.5 503 5.2
10,904 1,139 2,197 9,409
46,085
10,125 1,092 1,947 8,954
44,321
779 7.1 47 4.1
250 11.4 455 4.8 1,764 3.8
3,619 5,757 4,470 9,503
3,136 5,349 4,224 8,409
483 13.3 408 7.1 246 5.5 1,094 11.5